
Submitted:
31 May 2024
Posted:
03 June 2024
You are already at the latest version
Abstract
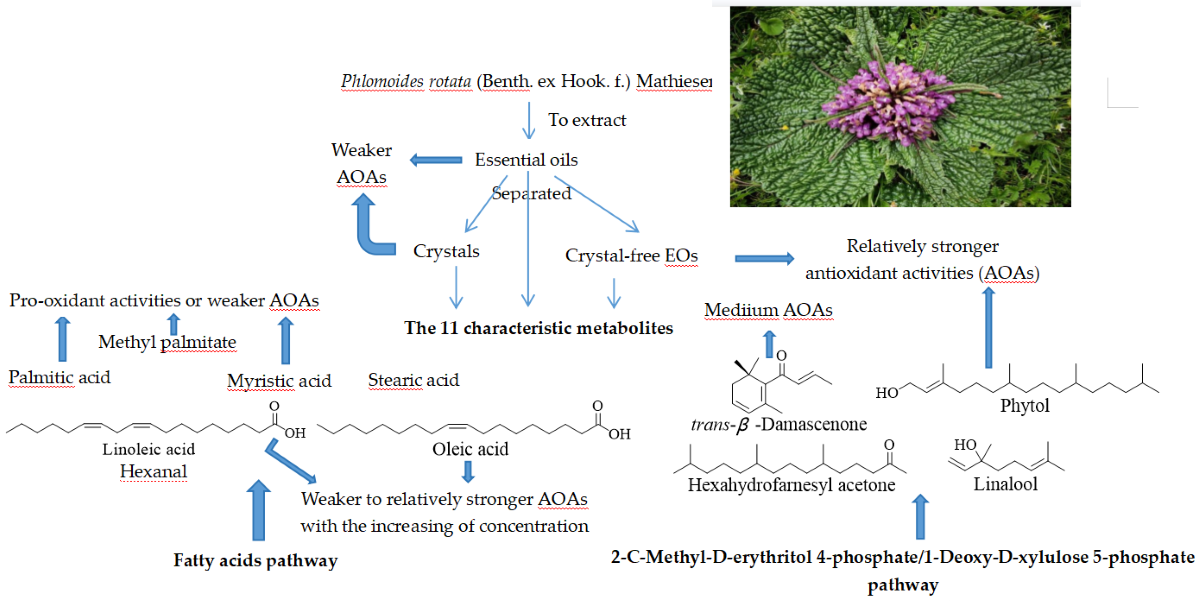
Limited research has been conducted on the metabolites present in the essential oils (EOs) of Phlomoides rotata (Benth. ex Hook. f.) Mathiesen (PR, syn. Lamiophlomis rotata (Benth.) Kudô), and their potential pharmacological activities, such as antioxidant properties, are often overlooked. We conducted a metabolomics-based screening to identify the characteristic metabolites (CMs) in the EOs extracted from PR. Meanwhile, we evaluated their in vitro antioxidant activities (AOAs). The EOs obtained through hydro-distillation are characterized by a light yellow color and a fresh, elegant fragrance. Cryoprecipitation was used to separate the crystals (Crs) from the EOs, resulting in the crystal-free EOs (CFs). A total of 121 components are identified and quantified in the EOs, Crs, and CFs. Among them, 84 were reported for the first time from such EOs. The major compounds include long-chain fatty acids (LCFAs) and their esters, such as palmitic acid (PA), myristic acid (MA), linoleic acid (LA), oleic acid (OA), stearic acid, and methyl palmitate (MP). Furthermore, 11 kinds of apocarotenoids (also called norisoprenoids) were first systematically investigated. Among them, eight C13-norisoprenoids, with trans-β-damascenone (DN) being particularly notable for its flavor, were identified. A sum of 11 CMs are screened , including PA, MA, LA, OA, MP, hexahydrofarnesyl acetone, phytol (PT), DN, stearic acid, linalool, and hexanal. These CMs are biosynthesized through FAs and 2-C-Methyl-D-erythritol 4-phosphate/1-Deoxy-D-xylulose 5-phosphate pathways. The in vitro AOAs of EOs, Crs, CFs, and seven selected CMs (PA, MA, LA, OA, MP, PT, and DN) were evaluated. Generally, PA and MA exhibited pro-oxidant activities (POAs) or weak AOAs. LA and OA demonstrated POAs or weak AOAs at lower concentrations, but at higher concentrations, they displayed medium to strong AOAs. Importantly, the CFs typically exhibited stronger AOAs compared to the corresponding EOs and Crs, potentially due to variations in their PA content. Overall, this study provides valuable insights into the potential utilization of EOs from PR.
Keywords:
Phlomoides rotata (Benth. ex Hook. f.) Mathiesen (Lamiophlomis rotata (Benth.) Kudô)
; essential oils
; characteristic metabolites
; metabolomics
; fatty acids
; apocarotenoids (norisoprenoids)
; biosynthesis
; antioxidant activities
; pro-oxidant activities.
1. Introduction
PR, also known as Lamiophlomis rotata (Benth.) Kudô, is a medicinal herb called "Duyiwei" (Lamiophlomis herba) in Chinese. It belongs to the Phlomoides Moench of Lamiaceae and is found in high altitudes in China [1,2,3,4]. Traditionally, the root, rhizome, or the entire herb were used for medicinal purposes [5,6]. However, nowadays, only the aerial parts are used [4], and the digging of the root is prohibited due to PR being listed as a first-class endangered Tibetan medicine [6,7]. The underground parts of PR are known for promoting blood circulation, eliminating stasis, reducing swelling, and providing analgesic effects. The above-ground parts are used for treating grasserie, fractures, injuries from falls, osteomyelitis, gunshot injuries, and edema pain [2,5,6,7]. Lamiophlomis herba is yellowish-brown or sallow, with a bitter and flat taste [4,5,7]. It was first documented in the classical masterpiece of Tibetan Medicine, Somaratsa [7], and has been used for more than 2000 years in traditional Tibetan medicine, known as "Daba" and "Dabuba," to treat traumatic injuries, rheumatic arthritis, and grasserie [4,5,6,7]. In clinical practice, PR is typically used directly without any prior processing, mainly for pain relief [6]. Additionally, PR is commonly used as a key ingredient in combination with other Chinese herbs such as Curcuma longa, Salvia miltiorrhiza, and Pyrrosia lingua [6,7]. PR is also utilized as an ingredient in various health products, including health drinks, soap, wine, mouth rinses, and biological toothpastes [6].
Due to the low content of volatile chemicals, the focus on PR has primarily been on its involatile compounds. So far, at least 223 chemical constituents have been isolated and identified from PR, including iridoids, flavonoids, phenylethanoid glycosides, polysaccharides, organic acids, volatile oils, and others [6,7]. The main compounds found are iridoid glycosides, which are responsible for the analgesic effect [6,7] and serve as CMs to assess the quality of Duyiwei [7]. However, apocarotenoids (also called norisoprenoids) [8] have been largely overlooked. Previously, only two compounds of C13-norisoprenoids, 5β, 6α-dihydroxy-3β-(β-D-glucopyranosyloxy)-7-megastigmen-9-one [6,7,9] and 3β-hydroxy-5α, 6α-epoxy-7-megastigmen-9-one [6,10], and one compound of C18-norisoprenoids, hexahydrofarnesyl acetone, were reported [11]. Additionally, sixteen organic acids, including PA, have been isolated and identified, seen in supplemental Table S1 [6,7,12,13,14]. As of now, only one study has reported the chemical composition in EOs extracted from PR using steam distillation, and another study has reported the lipophilic composition in the CH2Cl2 extracted part. Additional details and data can be found in supplemental Table S2 [11,15]. The main compounds found in terms of content are FAs, especially LCFAs such as PA, MA, OA, and LA. However, some identifications are still debatable, such as OA, LA ethyl ester, and cyclohexenylacetic acid, taking into consideration the values of LRIs and the mass spectra [11,15]. Only three compounds, MA, PA, and LA, were detected in both studies [11,15]. Furthermore, some bound volatiles such as α-terpineol-8-O-β-D-glucopyranoside and (2Z)-2, 6-dimethyl-6-hydroxyocta-2, 7-dienyl-O-β-D-glucopyranoside have been found [7]. The identification of CMs in the EOs of PR is of great importance as these CMs play a crucial role in distinguishing these EOs from others rapidly [16,17,18].
In recent years, there have been limited studies on the in-depth biological effects of volatile oils from PR [7]. However, the petroleum ether extracted part has been reported to possess anti-tumor activities, suggesting that the volatile compounds may also have such activities [19]. Currently, there have been no tests conducted on the AOAs of volatile chemicals extracted from PR. Oxidative stress has been associated with various diseases, including rheumatoid arthritis, cancer, and diabetes [20,21]. Additionally, supplemental FAs play an important role in maintaining the balance between oxidation and antioxidation in cells [22,23,24,25,26,27,28,29]. The effects of FAs on oxidant injury seem to be linked to the degree of unsaturation [23]. PA, a type of SFAs, can increase oxidative stress in cells in a concentration-dependent manner [28,29]. This is because it can induce overexpression of the pro-oxidant protein p66Shc [28] or react with cells to generate ROS, reduce the content of NO, and make cells more susceptible to oxidative stress [29]. On the other hand, stearic acid, another type of SFAs, has been reported to protect pulmonary artery endothelial cells from oxidant injury [23]. Generally, PUFAs can reduce oxidant injury [24,25,26,27], although contradictory results have also been reported [23].
To the best of our knowledge, no single extract or compound from PR has been clinically applied for disease treatment thus far. Therefore, it is necessary to conduct studies and develop potentially therapeutic extracts or compounds [7]. Building upon previous research [30], our focus in this study is on the volatile chemicals and their AOAs. We have selected three samples of PR from Tibet to evaluate the CMs present in the EOs and their AOAs. The process involves isolating Crs from the EOs using cryoprecipitation, which resulting in CFs. Subsequently, a comprehensive chemical profiling study was conducted on the EOs, Crs, and CFs using GC-MS and GC-FID techniques. Meanwhile, in vitro assays have been conducted to assess the AOAs of the EOs, Crs, CFs, and seven CMs, namely PA, MA, LA, OA, MP, PT, and DN. The findings of this study will establish a theoretical foundation for the utilization of EOs obtained from PR.
2. Results
2.1. Extraction and Separation
From PR with Voucher No. L8, L9, and L10, a total of 0.29 g, 0.26 g, and 0.19 g of light yellow EOs are obtained, corresponding to 418 μL, 405 μL, and 238 μL, respectively. The yields of EOs are calculated as 0.13%, 0.13%, and 0.08%, respectively, based on the ratio of the volume of the EOs (in mL) to the weight of the PR (in g) (mL/g). The densities of the EOs are measured as 0.69, 0.64, and 0.8, respectively. These EOs have a fresh and elegant smell. The Crs were separated from the EOs at temperatures of 4 °C or -4 °C, and the CFs were subsequently obtained by removing the Crs. Therefore, there are three sets of samples for L8, L9, and L10: EOs, Crs, and CFs. Specifically, there are nine samples: EO8, EO9, EO10, Cr8, Cr9, Cr10, CF8, CF9, and CF10.
2.2. Chemicals in the EOs of PR
A total of 121 compounds have been qualified and quantified. Among them, 31 have been reported previously [11,15], 4 should be introduced from outside sources, 2 are just identified as the two kinds of stereoisomer of p-Menth-1-en-9-al, and 84 chemicals are reported for the first time from the EOs of PR, which is indicated in supplemental Table S3 and Figure 1.
The 121 compounds belong to various classes, mainly including FAs, EFAs, apocarotenoids which include C8N, C13N, and C18N, AMs, ADs, Als, OOMs, AAs, and Introduced. The relative contents of these classesobtained by MF are listed in Figure 2.
Only eight compounds including hexanal, 1-octen-3-ol, limonene, linalool, α-terpineol, hexahydrofarnesyl acetone, MP, and PA were detected by MD. Among them, the contents of limonene, α-terpineol, and PA are relatively high.
The EOs, Crs, and CFs primarily consist of FAs, particularly LCFAs. PA stands out as the most prominent FAs, which aligns with the reported findings [11,15]. Additionally, MA, OA, and LA are also significant, as previously reported [11,15]. The content of PA is relatively higher in Crs but relatively lower in CFs compared to the corresponding EOs.
Regarding the EFAs, the major compounds are MP, methyl oleate, methyl linoleate, and methyl linolenate.
Apocarotenoids include one kind of C8N, eight types of C13N, and two kinds of C18N, in which, only hexahydrofarnesyl acetone was detected formerly [11]. As for content, this compound also stands out. The content of C13N is relatively less, and its content in the EOs is relatively higher compared to that in the corresponding Crs or CFs. Among the AMs, α-terpineol and linalool is relatively prominent. PT is a noteworthy ADs. Tricosane and pentacosane are two notable Als. In addition, compounds such as hexanal, 1-octen-3-ol, and β-caryophyllene should also be observed. The four compounds such as limonene, p-cymene, γ-terpinene, and isoterpinolene, are likely introduced from the EOs extracted from the peels of Nanfengmiju (Citrus kinokuni Hort. ex Tanaka), a variety of C. reticulata, which were studied simultaneously [16].
2.3. PCA and PLS-DA of the Samples and Metabolites
It is evident that within each group, the six samples are relatively closer to each other, while between the groups, they are relatively less close.
2.4. Analyses of Metabolic Pathways
As shown in Figure 5, the main metabolic pathways are related FAs.
2.5. The Screening of CMs
After considering the screened 27 compounds, the compounds represented in the loadings of the PCA, the eight compounds identified by MD, and the relative content of each chemical, a total of 11 chemicals have been identified as the CMs: PA, DN, hexahydrofarnesyl acetone, MA, PT, stearic acid, linalool, hexanal, LA, OA, and MP.
2.6. AOAs of EOs, Crs, CFs, and Seven CMs of PA, DN, MA, PT, LA, OA, and MP
In the DPPH and ABTS assays, the IC50 values of the samples were deduced from the results or undetected (Supplemental Table S4).
In the DPPH assay (Figure 6), among the nine samples of EOs, Crs, and CFs, CF10 exhibits the highest RSA as 29.81±0.78% in the concentration of 110 μg·mL-1. PA demonstrates POAs or weak AOAs at the concentrations as 100 μmol·L-1. The RSA values of OA and LA show a positive correlation with their concentrations. At 2000 mmol·L-1, the RSA value of LA is 63.18±0%, whereas that of OA is 28.79±5.79%
The ABTS assay (Figure 7) reveals that the RSA values of CFs are generally higher than those of the corresponding EOs or Crs, indicating that the Crs may contain compounds with POAs. The IC50 value of QE is lower in the ABTS assay compared to the DPPH method.
In the FRAP assay, the AOAs are measured based on the concentration of Fe2+ (mmol·L-1). It is noteworthy that the FRAP values of nine samples of EOs, Crs, and CFs are similar to that of QE at 2.5 or 10 μmol·L-1 (Figure 8).
3. Discussion
3.1. Extraction and Separation
The average yield of 0.11% is in close agreement with the previously reported yield of 0.1%, which was also extracted from the smashed powder [15]. In such condition, some volatiles with low boiling points will be vapored. In formerly studies on the EOs extracted from Citrus, the similar condition was encoutered [34]. Considering the relatively low content of EOs in PR, the effect is not so high compared with that of Citrus [34]. On the other hand, the chemcials with high boiling points such as PA, stearic acid, which content in the EOs will increase correspondingly with the long-time intense boiling extraction. The EOs extracted from PR exhibit certain similarities to the EOs extracted from Malva sylvestris L. [35], Cirsium japonicum var. ussurience Kitamura, Ixeris dentate, I. stolonifera [36,37], and sweet potatoes (Ipomoea batatas L. cv Ayamurasaki, I. batatas L. cv Beniazuma and I. batatas L. cv Simon 1) [38] also with low extraction rates. This similarity is attributed to the high content of PA, hexahydrofarnesyl acetone, etc., in these extracts [35,36,37,38].
3.2. Chemicals in the EOs of PR
Due to the excessive dilution of the samples and the relatively high splitting ratio, only several peaks were detected in the TICs obtained by MD. This, in turn, affects the accuracy of chemical identification and quantitation to some extent. The 9-hexadecenoic acid reported previously [15] is most likely corresponding to the 9E-hexadecenoic acid detected in this study, based on their LRIs values.
The EOs are primarily composed of LCFAs, which is consistent with previous reports [11,15]. The Crs and CFs also consist mainly of LCFAs. The Crs contain a relatively higher content of PA, while the CFs have a relatively lower content of PA compared to that of the EOs. In terms of the AMs, previous reports only mentioned the presence of linalool in the leaf of PR [11]. The relatively high content of linalool and α-terpineol, detected by FD and MD, may be attributed to some extent to the introduction of EOs extracted from the peels of Nanfengmiju (C. kinokuni). These EOs were studied simultaneously, and the content of linalool and α-terpineol was found to be 0.6% and 4.6%, respectively [16]. It is worth noting that 1-octene-3-ol is known for its distinctive mushroom flavor [39].
The mass spectra of compounds F15, F16, and F17 closely resemble those of LA, OA, and stearic acid, respectively. However, their LRIsd values of 2884, 2770, and 2700 are significantly different from the corresponding LRIsc values recorded in the NIST 17 database, which are 3164, 3173, and 3136, respectively. Considering the MS oven temperature program of FFAP, the maximum calculated LRIsd value is 2984. This suggests that chemicals with LRIsc values higher than 2984, such as LA, OA, and stearic acid, will not be eluted under the employed analytical conditions and will be eluted in the subsequent chromatogram, which can significantly alter their LRIsd values. The absence of these compounds in the first detected sample, such as EO8, supports this hypothesis. Consequently, the compounds F15, F16, and F17 are still identified as LA, OA, and stearic acid, respectively, which are consistent with previous reports [11,15].
Although limonene is detected in most samples and show relatively high content in the TICs obtained by MD or chromatograms obtained by FD, it is worth noting that previous studies [11,15] did not detect this compound. It is possible that this compound was introduced from the EOs extracted from the peels of Nanfengmiju (C. kinokuni) with a content of 70.6% [16]. Furthermore, it is likely that the compounds such as p-cymene, γ-terpinene, and isoterpinolene were also introduced from such EOs. These compounds are commonly found in the EOs of Citrus [16].
Regarding percentages, seven compounds are highlighted, namely PA, MA, LA, OA, MP, hexahydrofarnesyl acetone, and PT.
Although their content is less, the C13N play a significant role in the flavor of EOs [40]. Among these compounds, DN is recognized as one of the most important natural aroma compounds and is widely used in the international perfume industry [41]. It possesses a distinctively sweet, fruity, and warm flavor [42]. Additionally, DN has very low odor thresholds, with values of 0.002 μg·L-1 in water and 5 μg·L-1 in 25% alcohol [40,41,42]. This means that only trace amounts are needed to produce an odor [43]. Therefore, DN is likely to make a significant contribution to the unique aroma of EOs extracted from PR in this study.
DN is primarily formed through the degradation of precursors when heated under acidic conditions [40,44]. In this study, it is likely that DN was produced from the progenitors during the process of hydro-distillation [45]. Similar mechanisms have been observed for the generation of other volatile C13N [40,45]. The compound 5β, 6α-dihydroxy-3β-(β-D-glucopyranosyloxy)-7-megastigmen-9-one, previously isolated from PR [9], can act as a potential precursor for the synthesis of the eight types of C13N discovered in this study (Figure 9).
3.3. PCA and PLS-DA Results
The PCA and PLS-DA results demonstrate that the three Voucher samples L8, L9, and L10 of PR plants share a similar origin according to their chemicals in EOs, Crs, and CFs.
3.4. The Biosynthesis of CMs
In Figure 11, the biosynthesis of each CM has been depicted based on the deduced metabolite pathways.
The volatiles in plants are mainly biosynthesized by carbohydrates, FAs and amino acids. FAs can derive straight-chain alcohols, aldehydes, ketones, acids, esters, and lactones [8]. Biosynthesis of the varieties of different volatiles branches off from only a few primary metabolic pathways such as Shikimate pathway, MEP/DoXP pathway, MVA pathway, and lipoxygenase pathway. Based on their biosynthetic origin, all volatiles are divided into several classes, including terpenoids, phenylpropanoids/benzenoids, FA derivatives and amino acid derivatives in addition to a few species-/genus-specific compounds not represented in those major classes. Terpenoid volatiles are synthesized by the cytosolic MVA and the plastidial MEP/DoXP pathways, the former giving rise to sesquiterpenes, irregular terpenes and geranyllinalool, and the latter to monoterpenes, hemiterpenes, diterpenes and volatile carotenoid derivatives (apocarotenoids) [46].
3.5. AOAs of EOs, Crs, CFs, and Seven CMs of PA, MA, LA, OA, MP, PT, and DN
There are several methods available to assay the AOAs of chemicals, including DPPH, ABTS, and FRAP. While these methods share a similar principle, they have their own advantages and disadvantages [47]. Therefore, it is recommended to utilize at least two different methods to assess the AOAs of chemicals. It is important to note that even slight variations in experimental procedures can lead to significant differences in the obtained results. The outcomes of these assays are highly influenced by various factors [47].
In the DPPH and ABTS methods, the CFs generally exhibit higher AOAs compared to the corresponding EOs and Crs. These differences are likely attributed to the higher content of PA in the Crs. In some cases, the Crs may even display POAs. It is worth noting that PA, as a member of SFAs, can induce oxidative stress, inflammation, insulin resistance, and impair endothelial function in a concentration-dependent manner [24,25,26,27,28,29,48,49].For instance, at higher concentrations (400 μM), PA not only increases oxidative stress injury but also induces overexpression of the P66Shc protein. However, at lower concentrations (200 μM), PA only slightly increases the expression of P66Shc protein [28]. P66Shc protein plays a role in promoting oxidation and apoptosis by regulating ROS production [49]. Here, the RSA values of PA also demonstrate a concentration-dependent trend.
Regarding the AOAs of MA, previous studies have provided conflicting results. On one hand, MA can significantly stimulate human polymorphonuclear leukocytes, which play a crucial role in defending against microbial infections, to produce ROS. Excessive intake of MA can lead to detrimental consequences due to uncontrolled ROS production [50]. On the other hand, MA has been shown to protect the testes against oxidative stress caused by hyperglycemia [51]. In this study, MA exhibits weak AOAs or some POAs at concentrations of 100, 200, and 400 μmol·L-1. Further research is needed to determine the circumstances under which MA exhibits AOAs or POAs.
OA has been shown to prevent the production of ROS in the endoplasmic reticulum and to inhibit endoplasmic reticulum stress-induced inflammatory responses while also altering membrane lipid peroxidation [52,53]. Both OA and LA are capable of exerting AOAs by reducing pro-inflammatory signals [54]. Interestingly, in this study, LA exhibits better AOAs compared to OA in the higher concentration group, which may be attributed to the number and conjugation of double bonds present in LA and OA [55,56]. Generally, PUFAs with more double bonds and conjugations tend to exhibit better AOAs [24,25,26,27,55,56], as the ROS have a tendency to react with the loosely bound electrons of the carbon double bonds, which are abundant in the fatty acyl chains of cell membrane lipid bilayers [22]. However, it is important to note that an increased number of double bonds and conjugations also means that PUFAs are more susceptible to reaction with oxygen and the generation of ROS [57,58]. Therefore, LA can be utilized as a free radical product to evaluate the AOAs of compounds [57]. Furthermore, it has been observed that linolenic acid (l8:3, n-6) and eicosatrienoic acid (20:3, n-3) can enhance oxidant injury [23]. Excessive intake of MUFAs and PUFAs can also lead to oxidative stress and inflammation in in vivo models [59]. The relationship between the degree of unsaturation and susceptibility to oxidant injury remains unclear [22].
The in vitro study showed that SFAs caused significant cellular lipotoxic damage, while the combination of MUFAs/PUFAs with SFAs greatly improved the impaired cell viability [60]. However, in this study, we did not detect any synergistic AOAs of the four CMs such as PA, MA, LA, and OA. Additionally, the RSA values of CF10 are significantly higher than those of the other eight samples. This suggests that CF10 possesses unique biological activities that warrant further investigation.
4. Materials and Methods
4.1. Plant Materials, Reagents and Chemicals
The aboveground portion of PR was collected from three populations: L8, L9, and L10. These populations corresponded to the same sample numbers used in a previous research study [30]. The authenticity of the collected populations was confirmed by Professor Yi Zhang, from the Chengdu University of Traditional Chinese Medicine, Chengdu, China, and using ITS2 deoxyribonucleic acid barcodes, as described in the previous study [30]. Voucher samples of L8, L9, and L10 were deposited in the College of Ethnic Medicine at Chengdu University of Traditional Chinese Medicine, Chengdu, China, and the Chongqing Academy of Chinese Materia Medica, Chongqing, China. .
The following reagents and chemicals were used in this study: n-hexane (HPLC grade), linalool (98%+), p-cymene (99%+), α-terpineol (98%+), and nonane (98%), which were produced by Adamas Reagent Co., Ltd.; d-limonene (96%) produced by Acros Organics, the United States of America; γ-terpinene (97%) produced by Wako Pure Chemical Industries, Ltd., Japan; PA produced by CATO Research Chemicals Incorporated; n-Als standard solution of C10-C25 produced by Dr. Ehrenstorfer Incorporated, Germany; n-octacosane (99%) produced by Aldrich; DPPH, ABTS powder, potassium persulfate (K2S2O8), and Vc. All these reagents and chemicals were supplied by Shanghai Titan Scientific Co., Ltd., China. MeOH, used for preparative liquid phase, was sourced from Shanghai Lingfeng Chemical Reagent Co., Ltd. and supplied by Yonghua Chemical Co., Ltd.; MeOH (HPLC grade), produced by Adamas-beta, was supplied by Shanghai Titan Scientific Co., Ltd., China.
4.2. Extraction and Separation
Weighed powders of L8, L9, and L10 (315 g each) were placed in separate round-bottomed 5L flasks. Pure water (3150 mL, 10 Vs) was added to each flask. The mixtures were soaked for 0.5 hours at 40 °C. The EOs were extracted three times from each powder using hydrodistillation with a Clevenger-type apparatus. Each extraction lasted for 5 hours. n-Hexane was employed as the collecting solvent. The collected EOs, which appeared as light yellow, were treated with anhydrous Na2SO4 to eliminate any residual water.
To evaluate crystallization, the EOs of L8, L9, and L10 were stored at different temperatures: 4 °C, -4 °C, and -80 °C. Crs were obtained either at 4 °C or -4 °C. However, at -80 °C, the CFs of all three samples were in a solid state. Each sample was stored in separate screw-capped vials at 4 °C.
4.3. The Identification and Quantitation of Chemicals in the EOs, Crs, and CFs
4.3.1. Sample Preparation
The samples of EO8, EO9, EO10, Cr8, Cr9, Cr10, CF8, CF9, and CF10 were prepared for analyses according to the following procedure. For FD and MD, the samples were diluted in the ratio of Vsample: Vn-hexane (HPLC) 1:1000 (0.1%). For MF, the samples were diluted at a ratio of Vsample: Vn-hexane (HPLC) 1:250 (0.4%).
4.3.2. Chromatograms Obtained from GC Analyses
GC-FID analyses were conducted using a GC-2010 instrument from Shimadzu, Japan, equipped with a DB-5 column (30 m × 0.25 mm i.d., 0.25 μm film thickness). The following parameters were used: The oven temperature was programmed from 60 °C with a 3-minute hold, and then ramped up to 250 °C at a rate of 2.5 °C per minute. The final temperature was held for 2 minutes. Nitrogen was used as the carrier gas, with a constant flow rate of 1.7 mL per minute. Both the injector and the detector were maintained at 250 °C. The sample was split in a ratio of 5:1. Each sample was injected once with a V of 1 μL.
GC-MS analyses were performed using a GCMS-TQ8040 instrument from Shimadzu, Japan. Separately, either a DB-5 column or a FFAP column (30 m × 0.32 mm × 0.5 μm) was used. The following parameters were used.
For DB-5 column: The oven temperature was programmed from 60 °C with a 3-minute hold, and then ramped up to 280 °C at a rate of 2.5 °C per minute. The final temperature was held for 2 minutes. Helium was used as the carrier gas, with a constant flow rate of 1 mL per minute. The sample was split in a ratio of 100:1. A solvent delay of 3.0 minutes was implemented. The injector was maintained at 250 °C, while the ion-source and interface were maintained at 200 °C and 250 °C, respectively. Mass spectra were acquired at 70 eV with a scan rate of 3.9 scans per second, covering the mass range from m/z 25 to 450 amu. Each sample was injected once with a V of 1 μL.
For FFAP column: The oven temperature was programmed from 60 °C with a 3-minute hold, and then ramped up to 230 °C at a rate of 2.5 °C per minute. The final temperature was held for 2 minutes. The rest of the parameters (carrier gas, splitting ratio, solvent delay, injector, ion-source, interface temperature, mass spectra, injection times, and injection V) remained the same as for the DB-5 column.
4.3.3. Identification and Quantitation
The RT and area of each peak in the chromatograms were recorded. The mass spectrum of each peak was examined to identify and quantify the target compounds present in the TICs.
Identification
For compound identification, either a NIST 14 or a NIST 17 MS database was utilized. Initially, the peaks in the TICs were identified using probability-based matching. However, due to the presence of overlapped and embedded peaks in the TICs, the identification results may sometimes be inaccurate. In such cases, characteristic ion peaks were selected and compared with the NIST 14 or 17 database, as well as the mass spectra of known standards. By employing a combination of probability-based matching and comparing characteristic ion peaks, the compound identification process becomes more reliable, particularly when dealing with overlapping peaks. This approach enhances the overall accuracy and confidence in the identification results.
The LRIs values were calculated using the equation (1) proposed by Van Den Dool and Kratz [61]. In equation (1), “tn” and “tn+1” represent the RT of the n-Als (C10-C25, C28, and the detected C26-C27, C29) with the corresponding number (“n”) of carbons. "tx" represents the RT of the detected compound x (tx), where “tn ≤ tx ≤ tn+1”. Furthermore, the RT of n-Al C30 (t30) was deduced by analyzing the TICs obtained through MF.
The calculated LRIsb of FD and MD, and LRIsd of MF, were compared with the LRIa and LRIc values obtained by a semi-standard apolar column and a polar column from the NIST 17 library of the corresponding matched chemicals, respectively.
Quantification
For GC-MS detection, the overlapped peaks in the TICs were deconvoluted into individual peaks based on the characteristic ion peaks of the corresponding matching compound. In the case of GC-FID detection, the overlapped peaks were separated based on the peak shape and the corresponding results from GC-MS detection. The relative area percentage of each compound was calculated using peak area normalization.
4.4. PCA and PLS-DA
The data obtained from the TICs detected by MF and the chromatograms detected by FD were utilized to perform PCA and PLS-DA. The plots of VIP, PCA, and PLS-DA for the chemicals and nine samples detected by MF and FD were generated by R version 4.3.1. Chemicals with a VIP score ≥ 1.2 and a significance level of P ≤ 0.05 are considered significant.
4.5. Analyses of Metabolic Pathways
The metabolic pathways of the chemicals were analyzed by MetaboAnalyst 6.0, a web-based tool (https://www.metaboanalyst.ca/), as well as the KEGG system (https://www.kegg.jp/kegg/). Specifically, the results were visualized in "Figure 5", which was generated using MetaboAnalyst 6.0.
4.6. AOAs of EOs, Crs, CFs, and Seven CMs of PA, MA, OA, LA, MP, PT, and DN
The AOAs of nine samples, EO8, EO9, EO10, Cr8, Cr9, Cr10, CF8, CF9, and CF10, were tested by DPPH, ABTS, and FRAP assays, respectively.. Additionally, seven CMs including PA, MA, OA, LA, MP, PT, and DN, were included in the analyses. QE was used as a reference compound.
4.6.1. Sample Preparation
All the subjects were diluted in MeOH. Since there was a limited amount of volatile oils available, only three low concentrations, namely 50, 80, and 110 μg·mL-1, were set up for the nine samples. The two CMs including OA and LA were diluted to specific concentrations of 100, 200, 500, 1000, and 2000 mmol·L-1, respectively. The another two CMs including PT and DN were diluted to specific concentrations of 6.25, 12.5, 25, 50, and 100 mmol·L-1, respectively. The QE was diluted to 2.5, 5, 10, 20, and 50 μmol·L-1, respectively.
4.6.2. DPPH Assay
A slight modification was made to the experimental procedure [62]. The samples, each with a V of 100 μL, at various concentrations were added to individual well of a 96-well microplate. Subsequently, 100 μL of DPPH solution (100 μmol·L-1) also diluted with MeOH was added to each well. The microplate was then incubated in darkness at room temperature for 30 minutes. After the incubation period, the absorbance of the reaction mixture was measured at 517 nm using a microplate reader. Each sample was analyzed in triplicate, and MeOH was used as the blank control. The RSA was calculated using the following equation:
Where ABlank is the absorbance of the blank control (MeOH) and ASample is the absorbance of the reaction mixture. The RSA value indicates the percentage of DPPH radical scavenged by the sample, with higher values indicating stronger AOAs.
4.6.3. ABTS Assay
A slight modification was made to the method described in a previous study [63]. To prepare the ABTS radical cation (ABTS•+) solution, 5 mL of a 7 mM aqueous ABTS solution was reacted with 88 µL of a 140 mM K2S2O8 aqueous solution (resulting in a final concentration of 2.45 mM for K2S2O8). The reaction mixture was kept in darkness at room temperature for 16 hours. Subsequently, the radical cation solution was diluted with MeOH, typically around 30-50 times, until its absorbance reached a value of 0.7±0.02 at 734 nm. For each sample, 100 μL was added to 100 μL of the ABTS radical solution. The mixture was thoroughly mixed at room temperature for 6 minutes. Following the incubation period, the absorbance at 734 nm was measured using a microplate reader. The calculation method for RSA was consistent with that used in the DPPH assay.
4.6.4. FRAP Assay
A slight modification was made to the method described previously [60]. For each sample, 100 μL was added to 100 μL of the FRAP working solution. The FRAP working solution was composed of acetic acid buffer (0.3 mol·L-1), 2, 4, 6-Tris (2-pyridyl)-1, 3, 5-triazine solution (10 mM), and FeCl3 (20 mM) solution, with a V ratio of 10:1:1. The sample and the FRAP working solution were thoroughly mixed and then placed in darkness at 37 °C for a 30-minute incubation period. After incubation, the absorbance of the mixture at 593 nm was immediately measured using a microplate reader. The increase in absorbance at this wavelength indicates the reduction capacity of the samples and provides information on their antioxidant potential.
To establish a calibration curve, 0.1 mL of Fe(II) aqueous solutions with concentrations ranging from 0.01 to 0.2 mM were mixed with 0.1 mL of the FRAP reagent. In this measuring system, the total antioxidant capacity was determined in terms of Fe(II) equivalents. The concentration of FeSO4 (in mmol·L-1) was calculated based on the absorbance value obtained from the standard curve after the reaction, which was referred to as the FRAP value. A higher FRAP value indicates a stronger AOA.
5. Conclusions
A comprehensive analysis of the EOs of PR has revealed a total of 121 identified and quantified compounds. Among them, 84 have been reported for the first time from the EOs of PR. In summary, a total of 11 compounds, including PA, MA, LA, OA, MP, hexahydrofarnesyl acetone, PT, DN, stearic acid, linalool, and hexanal, have been selected as the CMs. These CMs are biosynthesized through FAs and MEP/DoXP pathways.
Generally, CFs demonstrate stronger AOAs compared to EOs and Crs. This disparity is likely influenced by the varying content of PA in these samples. Specifically, the percentage of PA, the most abundant compound, is found to be higher in Crs but lower in CFs compared to EOs.
In future, it is important to exercise caution when treating plants, diluting samples, and setting the splitting ratio. Furthermore, we should investigate the synergistic effects of SFAs and MUFAs/PUFAs and focuse on samples that exhibit stronger AOAs, particularly.
This study significantly contributes to our understanding of the chemcials in the EOs of PR, shedding light on the potential application and utilization of such volatile oils.
Supplementary Materials
The following supporting information can be downloaded at the website of this paper posted on Preprints.org.
| No. | Abbreviations | Full spelling |
| 1 | EOs | essential oils |
| 2 | PR | Phlomoides rotata (Benth. ex Hook. f.) Mathiesen |
| 3 | CMs | characteristic metabolites |
| 4 | AOAs | antioxidant activities |
| 5 | Crs | crystals |
| 6 | CFs | crystal-free essential oils |
| 7 | GC-MS | Gas Chromatography-Mass Spectrometer |
| 8 | GC-FID | Gas Chromatography-Flame Ionization Detector |
| 9 | LCFAs | long-chain fatty acids |
| 10 | PA | palmitic acid |
| 11 | MA | myristic acid |
| 12 | LA | linoleic acid |
| 13 | OA | oleic acid |
| 14 | KEGG | Kyoto Encyclopedia of Genes and Genomes |
| 15 | POAs | pro-oxidant activities |
| 16 | LRIs | Linear retention indices |
| 17 | RT | Retention time |
| 18 | FAs | Fatty acids |
| 19 | AMs | Alcohol monoterpenes |
| 20 | ADs | Alcohol diterpenes |
| 21 | Als | Alkanes |
| 22 | NIST | National Institute of Standards and Technology |
| 23 | tr | trace |
| 24 | nd | not detected |
| 25 | DPPH | 1,1-Diphenyl-2-picrylhydrazy1 radical |
| 26 | ABTS | (2, 2'-azino-bis-3-ethylbenzothiazoline-6-sulfonic acid) diammonium salt |
| 27 | FRAP | Ferric reducing/antioxidant power |
| 28 | RSA | radical scavenging activity |
| 29 | IC50 | Half maximal inhibitory concentration |
| 30 | MP | Methyl palmitate |
| 31 | PT | Phytol |
| 32 | DN | trans-β-Damascenone |
| 33 | QE | Quercetin |
| 34 | SFAs | Saturated fatty acids |
| 35 | ROS | Reactive oxygen species |
| 36 | PUFAs | Polyunsaturated fatty acids |
| 37 | EFAs | Esters of fatty acids |
| 38 | C8N | C8-norisoprenoids |
| 39 | C13N | C13-norisoprenoids |
| 40 | C18N | C18-norisoprenoids |
| 41 | OOMs | Other oxides of monoterpenes |
| 42 | HSs | Hydrocarbon sesquiterpenes |
| 43 | AAs | Aliphatic alcohols |
| 44 | ASs | Alcohol sesquiterpenes |
| 45 | HDs | Hydrocarbon diterpenes |
| 46 | EAAs | Ester of aromatic acids |
| 47 | HMs | Hydrocarbon monoterpenes |
| 48 | FD | Gas chromatography-flame ionization detector using a DB-5 column |
| 49 | MD | Gas chromatography-mass spectrometer using a DB-5 column |
| 50 | MF | Gas chromatography-mass spectrometer using a free fatty acid phase column |
| 51 | FFAP | Free fatty acid phase |
| 52 | PCA | Principal Component Analysis |
| 53 | PLS-DA | Partial Least Squares Discriminant Analysis |
| 54 | VIP | Variable Importance in Projection |
| 55 | Vc | Vitamin C |
| 56 | TICs | Total ion chromatograms |
| 57 | DoXP | 1-Deoxy-D-xylulose 5-phosphate |
| 58 | DMAPP | Dimethylallyl diphosphate |
| 59 | IPP | Isopentenyl diphosphate |
| 60 | GGPP | Geranylgeranyl diphosphate |
| 61 | acp | acyl-carrier protein |
| 62 | MEP | 2-C-Methyl-D-erythritol 4-phosphate |
| 63 | MVA | mevalonic acid |
| 64 | MUFAs | Monounsaturated fatty acids |
| 65 | ITS2 | Internal transcribed spacer 2 |
| 66 | HPLC | High-performance liquid chromatography |
| 67 | Ltd. | Limited |
| 68 | Co., Ltd. | Company limited |
| 69 | MeOH | Methanol |
| 70 | V | Volume |
Author Contributions
Conceptualization, Z.P. and J.W.; methodology, C.X. J.L., and J.W.; software, C.X., J.L., X.Y., and J.W.; validation, Z.P., C.X., J.L., X.Y., Y.S., and J.W.; investigation, C.X. and J.W.; resources, Z.P. and J.W.; data curation, C.X., J.L., X.Y. and J.W.; writing—original draft preparation, C.X., J.L., X.Y. and J.W.; writing—review and editing, Z.P., C.X., X.Y., Y.S., and J.W.; supervision, Z.P. and J.W.; project administration, Z.P. and J.W.; funding acquisition, Z.P. and J.W. All authors have read and agreed to the published version of the manuscript.
Funding
This research project received funding from several sources, including the National Natural Science Foundation of China (Grant No. 81973567), the Chongqing Science and Technology Bureau and Chongqing Education Commission (Grant No. CSTB2023NSCQ-LZX0046), the Chongqing Science and Technology Bureau (Grant No. cstc2020jcyj-msxmX0310), and the Chongqing Municipal Health Commission (Grant No. 2020ZY023793 and ZY201602104).
Acknowledgments
The authors thank the undergraduates, Hang Shi, Qin Duan, Meiying Luo, Shanshan Jiang, and Churui Xiao, for their contributions. We would like to express our gratitude to our colleagues Anwar Ul Haq and Shujaat Ahmad from the Department of Pharmacy, Shaheed Benazir Bhutto University, Sheringal, Pakistan, as well as Nasir Mehmood Khan from the Department of Agriculture, Shaheed Benazir Bhutto University, Sheringal, Pakistan, for their valuable suggestions for revising this paper.
Conflicts of Interest
The authors declare no conflict of interest.
Abbreviations and corresponding full spelling
References
- Mathiesen, C.; Scheen, A.C.; Lindqvist, C. Phylogeny and biogeography of the lamioid genus Phlomis (Lamiaceae). Kew Bull. 2011, 66, 83–99. [Google Scholar] [CrossRef]
- The editorial board of Flora of China of Chinese Academy of Sciences. Flora of China; (in Chinese, Volume 65 issue 2); Science press: Beijing, China, 1977; pp. 1, 480. [Google Scholar]
- Li, H.; Hedge, I.C. Flora of China (Lamiaceae); Science press: Beijing, China, 1994; Volume 17, pp. 50, 52, 156–157. [Google Scholar]
- Pharmacopoeia committee of the People’s Republic of China. Pharmacopoeia of the People’s Republic of China (Volume Ⅰ). China Medical Science and Technology Press; Beijing, China, 2020; p. 274. 2020.
- Nanjing University of Chinese medicine. The dictionary of Chinese materia medica, 2nd edition; Shanghai scientific and technical publishers: China, 2006; Volume 2, pp. 2390–2391. [Google Scholar]
- Cui, Z.H.; Qin, S.S.; Qin, E.H.; Qin, C.; Gao, L.; Li, Q.C.; Wang, Y.L.; Huang, X.Z.; Zhang, Z.Y.; Li, M.H. Traditional uses, phytochemistry, pharmacology and toxicology of Lamiophlomis rotata (Benth.) Kudo: a review. RSC Adv. 2020, 10, 11463. [Google Scholar] [CrossRef] [PubMed]
- Li, Y.; Li, F.; Zheng, T.T.; Shi, L.; Zhang, Z.G.; Niu, T.M.; Wang, Q.Y.; Zhao, D.S.; Li, W.; Zhao, P. Lamiophlomis herba: A comprehensive overview of its chemical constituents, pharmacology, clinical applications, and quality control. Biomed. Pharmacother. 2021, 144, 112299. [Google Scholar] [CrossRef] [PubMed]
- Schwab, W.; Davidovich-Rikanati, R.; Lewinsohn, E. Biosynthesis of plant-derived flavor compounds. Plant J. 2008, 54, 712–732. [Google Scholar] [CrossRef] [PubMed]
- Zhang, F.; Wu, Z.J.; Sun, L.; Wang, J.; Tao, X.; Chen, W.S. Iridoid glucosides and a C13-norisoprenoid from Lamiophlomis rotata and their effects on NF-kB activation. Bioorg. Med. Chem. Lett. 2012, 22, 4447–4452. [Google Scholar] [CrossRef] [PubMed]
- Yin, X.F. Studies on the chemical constituents of Lamiophlomis rotata (dissertation). South-central University for Nationalities, Wuhan, China, 2015.
- Liu, J.; Nan, P.; Wang, L.; Wang, Q.; Tsering, T.; Zhong, Y. Chemical variation in lipophilic composition of Lamiophlomis rotata from the Qinghai-Tibetan plateau. Chem. Nat. Compd. 2006, 42, 525–528. [Google Scholar] [CrossRef]
- Hao, Y.; Li, L.; Chen, C.; Sang, Y. Constituents and bioactivities of Lamiophlomis rotata. J. Chin. Med. Mater. 2011, 36, 465–467. [Google Scholar] [CrossRef]
- Zhang, Y. Studies on the active constituent in pedicle leaf of Lamiophlomis rotata (dissertation). Liaoning College of Traditional Chinese Medicine, China, 2007.
- Zhang, A.J. Studies on the chemical components and hematostatic activity of traditional Tibetan herb Lamiophlomis rotata (dissertation). Academy of Military Medical Sciences, Beijing, China, 2008.
- Liu, H.F.; Li, X.; Deng, Y.; Song, X.; Li, H. Study on the chemical constituents of the essential oil from Lamiophlomis rotata. Chin. J. Pharm. Anal. 2006, 26, 1794–1796. [Google Scholar]
- Wang, J. Alkanes and chemical markers identified in the essential oil from pericarp of Nanfengmiju (Citrus kinokuni Hort. ex Tanaka). J. Mex. Chem. Soc. 2023, 67, 82–93. [Google Scholar] [CrossRef]
- Ul Haq, A.; Wang, J. Identification of varieties and biomarkers analyses on essential oils from peels of Citrus L. collected in Pakistan. Pak. J. Bot. 2023, 55, 1407–1418. [Google Scholar]
- Ali, S.; Seema, H.; Khan, Z.; Din, A.; Hadi, F.; Wang, J. The nomenclature of three Citrus varieties collected in Pakistan and chemicals in essential oils from their peels. Pak. J. Bot. 2024, 56. [Google Scholar] [CrossRef] [PubMed]
- Jia, Z.P.; Li, M.X.; Zhang, R.X.; Wang, J.H.; Wang, M.; Guo, X.N.; Shen, T. Vitro screening of the effective antitumor components of Herba Lamiophlomis rotata. Med. J. Nation. Defend Force Northwest Chin. 2005, 26, 173–175. [Google Scholar]
- Zhou, Z.; Li, T.; Du, R.; Liu, C.; Huang, S.; Han, L.; Zhang, P.; Wang, Y.; Jiang, M. Lamiophlomis rotata attenuates rheumatoid arthritis by regulating sphingolipid and steroid hormone metabolism. Mol. Omics 2023, 19, 72–83. [Google Scholar] [CrossRef] [PubMed]
- Aebisher, D.; Cichonski, J.; Szpyrka, E.; Masjonis, S.; Chrzanowski, G. Essential oils of seven Lamiaceae plants and their antioxidant capacity. Molecules 2021, 26, 3793. [Google Scholar] [CrossRef] [PubMed]
- Hart, C.M.; Tolson, J.K.; Block, E.R. Fatty acid supplementation protects pulmonary artery endothelial cells from oxidant injury. Am. J. Respir. Cell Mol. BioI. 1990, 3, 479–489. [Google Scholar] [CrossRef] [PubMed]
- Hart, C.M.; Tolson, J.K.; Block, E.R. Supplemental fatty acids alter lipid peroxidation and oxidant injury in endothelial cells. Am. J. Physiol. 1991, 260, L481–L488. [Google Scholar] [CrossRef] [PubMed]
- Kehrer, J.P.; Autor, A.P. The effect of dietary fatty acids on the composition of adult rat lung lipids: relationship to oxygen toxicity. Toxicol. Appl. Pharmacol. 1978, 44, 423–430. [Google Scholar] [CrossRef]
- Kennedy, J.I.; Chandler, D.B.; Fulmer, J.D.; Wert, M.B.; Grizzle, W.E. Dietary fish oil inhibits bleomycin-induced pulmonary fibrosis in the rat. Exp.Lung Res. 1989, 15, 315–329. [Google Scholar] [CrossRef]
- Sosenko, I.R.S.; Innis, S.M.; Frank, L. Polyunsaturated fatty acids and protection of newborn rats from oxygen toxicity. J. Pediatr. 1988, 112, 630–637. [Google Scholar] [CrossRef] [PubMed]
- Sosenko, I.R.S.; Innis, S.M.; Frank, L. Menhaden fish oil, n-3 polyunsaturated fatty acids, and protection of newborn rats from oxygen toxicity. Pediatr. Res. 1989, 25, 399–404. [Google Scholar] [CrossRef]
- Favre, J.; Yıldırım, C.; Leyen, T.A.; Chen, W.J.Y.; Genugten, R.E.; Golen, L.W.; Garcia-Vallejo, J.J.; Musters, R.; Baggen, J.; Fontijn, R.; Pouw Kraan, T.; Serné, E.; Koolwijk, P.; Diamant, M.; Horrevoets, A.J.G. Palmitic acid increases pro-oxidant adaptor protein p66Shc expression and affects vascularization factors in angiogenic mononuclear cells: Action of resveratrol. Vasc. Pharmacol. 2015, 75, 7–18. [Google Scholar] [CrossRef]
- Ke, J.; Wei, R.; Liu, Y. Metformin combined with liraglutide has a synergistic protective effect on palmitic acid-induced oxidative damage of endothelial cells. Chin. J. Diabetes Mellitus 2014, 6, 312–316. [Google Scholar]
- Wang, J.; Gao, Y.L.; Chen, Y.L.; Chen, Y.W.; Zhang, Y.; Xiang, L.; Pan, Z. Lamiophlomis rotata identifification via ITS2 barcode and quality evaluation by UPLC-QTOF-MS couple with multivariate analyses. Molecules 2018, 23, 3289. [Google Scholar]
- Adams, R.P. Identification of essential oil components by gas chromatography/mass spectrometry, ed. 4.1; Allured publishing: Illinois, America, 2017; pp. 1–804. [Google Scholar]
- Flavornet by Terry Acree & Heinrich Arn. Available online: https://www.flavornet.org/info/3033-23-6.html (accessed on 30 May 2024).
- 27 Teow, C.C.; Truong, V.D.; Mcfeeters, R.F.; Thompson, R.L.; Pecota, K.V.; Yencho, G.C. Antioxidant activities, phenolic and β-carotene contents of sweet potato genotypes with varying flesh colours. Food Chem. 2007, 103, 829–838. [Google Scholar] [CrossRef]
- Han, T.L.; Ullah, I.; Wang, J. Chemical variation of essential oils from peels of Citrus kinokuni Tanaka, C. reticulata ‘Dahongpao’, and C. reticulata ‘Zhang Shuensis’. Acta Sci. Agric. 2020, 4, 4–26. [Google Scholar]
- Usami, A.; Kashima, Y.; Marumoto, S.; Miyazawa, M. Characterization of aroma-active compounds in dry flower of Malva sylvestris L. by GC-MS-O analysis and OAV calculations. J. Oleo Sci. 2013, 62, 563–570. [Google Scholar] [CrossRef]
- Choi, H.S. GC-MS analyses of the essential oils from Ixeris dentate (Thunb.) Nakai and I. stolonifera A. Gray. Korean J. Food Nutr. 2012, 25, 274–283. [Google Scholar] [CrossRef]
- Choi, H.S. Chemical composition of Cirsium japonicum var. ussurience Kitamura and the quantitative changes of major compounds by the harvesting season. Korean J. Food Nutr. 2016, 29, 327–334. [Google Scholar]
- Nakamura, A.; Ono, T.; Yagi, N.; Miyazawa, M. Volatile compounds with characteristic aroma of boiled sweet potato (Ipomoea batatas L. cv Ayamurasaki, I. batatas L. cv Beniazuma and I. batatas L. cv Simon 1). J. Essent. Oil Res. 2013, 25, 497–505. [Google Scholar]
- Zhao, Q.Y.; Yousaf, L.; Xue, Y.; Shen, Q. Changes in flavor of fragrant rice during storage under different conditions. J. Sci. Food Agric. 2020, 100, 3435–3444. [Google Scholar] [CrossRef]
- Carlin, S.; Mattivi, F.; Durantini, V.; Dalledonne, S.; Arapitsas, P. Flint glass bottles cause white wine aroma identity degradation. PNAS 2022, 119, e2121940119. [Google Scholar] [CrossRef] [PubMed]
- Pickenhagen, W. Flavor Chemistry-Thirty Years of Progress; Teranishi, R., Wick, E.L., Hornstein, I., Eds. Kluwer Academic/Plenum Publishers: New York, NY, USA, 1999; pp. 75–87. [Google Scholar]
- Kaneshima, T.; Nojima, S.; Mori, S.; Myoda, T.; Nakahara, K.; Matsuo, Y. Isolation and identification of progenitors, glycoconjugates of β-damascenone precursors, in sweet potato (Ipomoea batatas). Flavour Fragr. J. 2023, 38, 152–162. [Google Scholar] [CrossRef]
- Roberts, D.D.; Mordehai, A.P.; Acree, T.E. Detection and partial characterization of eight β-damascenone precursors in apples (Malus domestica Borkh. Cv empire). J. Agric. Food Chem. 1994, 42, 345–349. [Google Scholar] [CrossRef]
- Roberts, D.D.; Roberts, A.P.; Acree, T.E. Detection and partial characterization of eight β-Damascenone precursors in Apples (Malus domestica Borkh. Cv. Empire). J. Agric. Food Chem. 1994, 42, 345–349. [Google Scholar] [CrossRef]
- Suzuki, M.; Matsumoto, S.; Mizoguchi, M.; Hirata, S.; Takagi, K.; Hashimoto, I.; Yamano, Y.; Ito, M.; Fleischmann, P.; Winterhalter, P.; Morita, T.; Watanabe1, N. Identification of (3S, 9R)- and (3S, 9S)-Megastigma-6,7-dien-3,5,9-triol 9-O-β-D-glucopyranosides as Damascenone progenitors in the flowers of Rosa damascena Mill. Biosci. Biotechnol. Biochem. 2002, 66, 2692–2697. [Google Scholar] [CrossRef]
- Dudareva, N.; Klempien, A.; Muhlemann, J.K.; Kaplan, I. Biosynthesis, function and metabolic engineering of plant volatile organic compounds. New Phytol. 2013, 198, 16–32. [Google Scholar] [CrossRef] [PubMed]
- Munteanu, I.G.; Apetrei, C. Analytical methods used in determining antioxidant activity: A review. Int. J. Mol. Sci. 2021, 22, 3380. [Google Scholar] [CrossRef] [PubMed]
- Fratantonio, D.; Speciale, A.; Ferrari, D.; Cristani, M.; Saija, A.; Cimino, F. Palmitate-induced endothelial dysfunction is attenuated by cyanidin-3-o-glucoside through modulation of Nrf2/Bach1 and NF-κB pathways. Toxicol Lett 2015, 239, 152–160. [Google Scholar] [CrossRef] [PubMed]
- Giorgio, M.; Migliaccio, E.; Orsini, F.; Paolucci, D.; Moroni, M.; Contursi, C.; Pelliccia, G.; Luzi, L.; Minucci, S.; Marcaccio, M.; Pinton, P.; Rizzuto, R.; Bernardi, P.; Paolucci, F.; Pelicci, P.G. Electron transfer between cytochrome c and p66shc generates reactive oxygen species that trigger mitochondrial apoptosis. Cell 2005, 122, 221–233. [Google Scholar] [CrossRef]
- Tada, M.; Ichiishi, E.; Saito, R.; Emoto, N.; Niwano, Y.; Kohno, M. Myristic acid, a side chain of phorbol myristate acetate (PMA), can activate human polymorphonuclear leukocytes to produce oxygen radicals more potently than PMA. J. Clin. Biochem. Nutr. 2009, 45, 309–314. [Google Scholar] [CrossRef]
- Khalil, A.S.M.; Giribabu, N.; Yelumalai, S.; Shahzad, H.; Kilari, E.K.; Salleh, N. Myristic acid defends against testicular oxidative stress, inflammation, apoptosis: Restoration of spermatogenesis, steroidogenesis in diabetic rats. Life Sci. 2021, 278, 119605. [Google Scholar] [CrossRef] [PubMed]
- Sun, Y.; Wang, J.; Guo, X.; Zhu, N.; Niu, L.; Ding, X.; Xie, Z.; Chen, X.; Yang, F. Oleic acid and eicosapentaenoic acid reverse palmitic acid-induced insulin resistance in human Hepg2 cells via the reactive oxygen species/Jun pathway. Genom. Proteom. Bioinf. 2021, 19, 754–771. [Google Scholar] [CrossRef] [PubMed]
- Abenavoli, L.; Milanović, M.; Milić, N.; Luzza, F.; Giuffrè, A.M. Olive oil antioxidants and non-alcoholic fatty liver disease. Expert Rev. Gastroenterol. Hepatol. 2019, 13, 739–749. [Google Scholar] [CrossRef] [PubMed]
- Pauls, S.D.; Rodway, LA.; Winter, T.; Taylor, C.G.; Zahradka, P.; Aukema, H.M. Anti-inflammatory effects of α-linolenic acid in M1-like macrophages are associated with enhanced production of oxylipins from α-linolenic and linoleic acid. J. Nutr. Biochem. 2018, 57, 121–129. [Google Scholar] [CrossRef] [PubMed]
- Wu, S.H.; Sun, G.R.; Wang, Y.Y.; Tan, T.T.; Zhang, Y.; Deng, H.M.; Zhang, T.L.; Du, F.G. Chemical composition analysis and antioxidant activity of essential oil from Magnolia sieboldii Leaves. Mol. Plant Breed. 2023, 21, 1–12. [Google Scholar]
- Lee, S.H.; Min, D.B. Effects, quenching mechanisms, and kinetics of carotenoids in chlorophyll-sensitized photooxidation of soybean oil. J. Agri. Food Chem. 1990, 38, 1630–1634. [Google Scholar] [CrossRef]
- Sila, A.; Sayari, N.; Balti, R.; Martinez-Alvarez, O.; Nedjar-Arroume, N.; Moncef, N.; Bougatef, A. Biochemical and antioxidant properties of peptidic fraction of carotenoproteins generated from shrimp by-products by enzymatic hydrolysis. Food Chem. 2014, 148, 445–452. [Google Scholar] [CrossRef]
- Burton, G.W.; Ingold, K.U. β-Carotene: An unusual type of antioxidant. Science 1984, 224, 569–573. [Google Scholar] [CrossRef]
- Grujić-Milanović, J.D.; Miloradović, Z.Z.; Mihailović-Stanojević, N.D.; Banjac, V.V.; Vidosavljević, S.; Ivanov, M.S.; Karanović, D.J.; Vajić, U.-J.V.; Jovović, D.M. Excesive consumption of unsaturated fatty acids leads to oxidative and inflammatory instability in wistar rats. Biomed. Pharmaco. 2021, 139, 111691. [Google Scholar] [CrossRef] [PubMed]
- Liu, W.; Zhu, M.; Gong, M.; Zheng, W.; Zeng, X.; Zheng, Q.; Li, X.; Fu, F.; Chen, Y.; Cheng, J.; Rao, Z.; Lu, Y.; Chen, Y. ; Comparison of the effects of monounsaturated fatty acids and polyunsaturated fatty acids on liver lipid disorders in obese mice. Nutrients 2023, 15, 3200. [Google Scholar] [CrossRef]
- Van Den Dool, H.; Kratz, P.D. A generalization of the retention index system including linear temperature programmed gas-liquid partition chromatography. J. Chromatogr. 1963, 11, 463–471. [Google Scholar] [CrossRef] [PubMed]
- Zengin, G.; Sarikurkcu, C.; Uyar, P.; Aktumsek, A.; Uysal, S.; Kocak, M.S.; Ceylan, R. Crepis foetida L. subsp. rhoeadifolia (Bieb.) Celak. as a source of multifunctional agents: Cytotoxic and phytochemical evaluation. J. Funct. Foods 2015, 17, 698–708. [Google Scholar]
- Re, R.; Pellegrini, N.; Proteggente, A.; Pannala, A.; Yang, M.; Rice-Evans, C. Antioxidant activity applying an improved ABTS radical cation decolorization assay. Free Radical Bio. Med. 1999, 26, 1231–1237. [Google Scholar] [CrossRef]
Figure 1.
The chromatograms of EO10, the EO extracted from L10. Each denoted compound is assigned the corresponding code as listed in Supplementary Table S3.
Figure 1.
The chromatograms of EO10, the EO extracted from L10. Each denoted compound is assigned the corresponding code as listed in Supplementary Table S3.
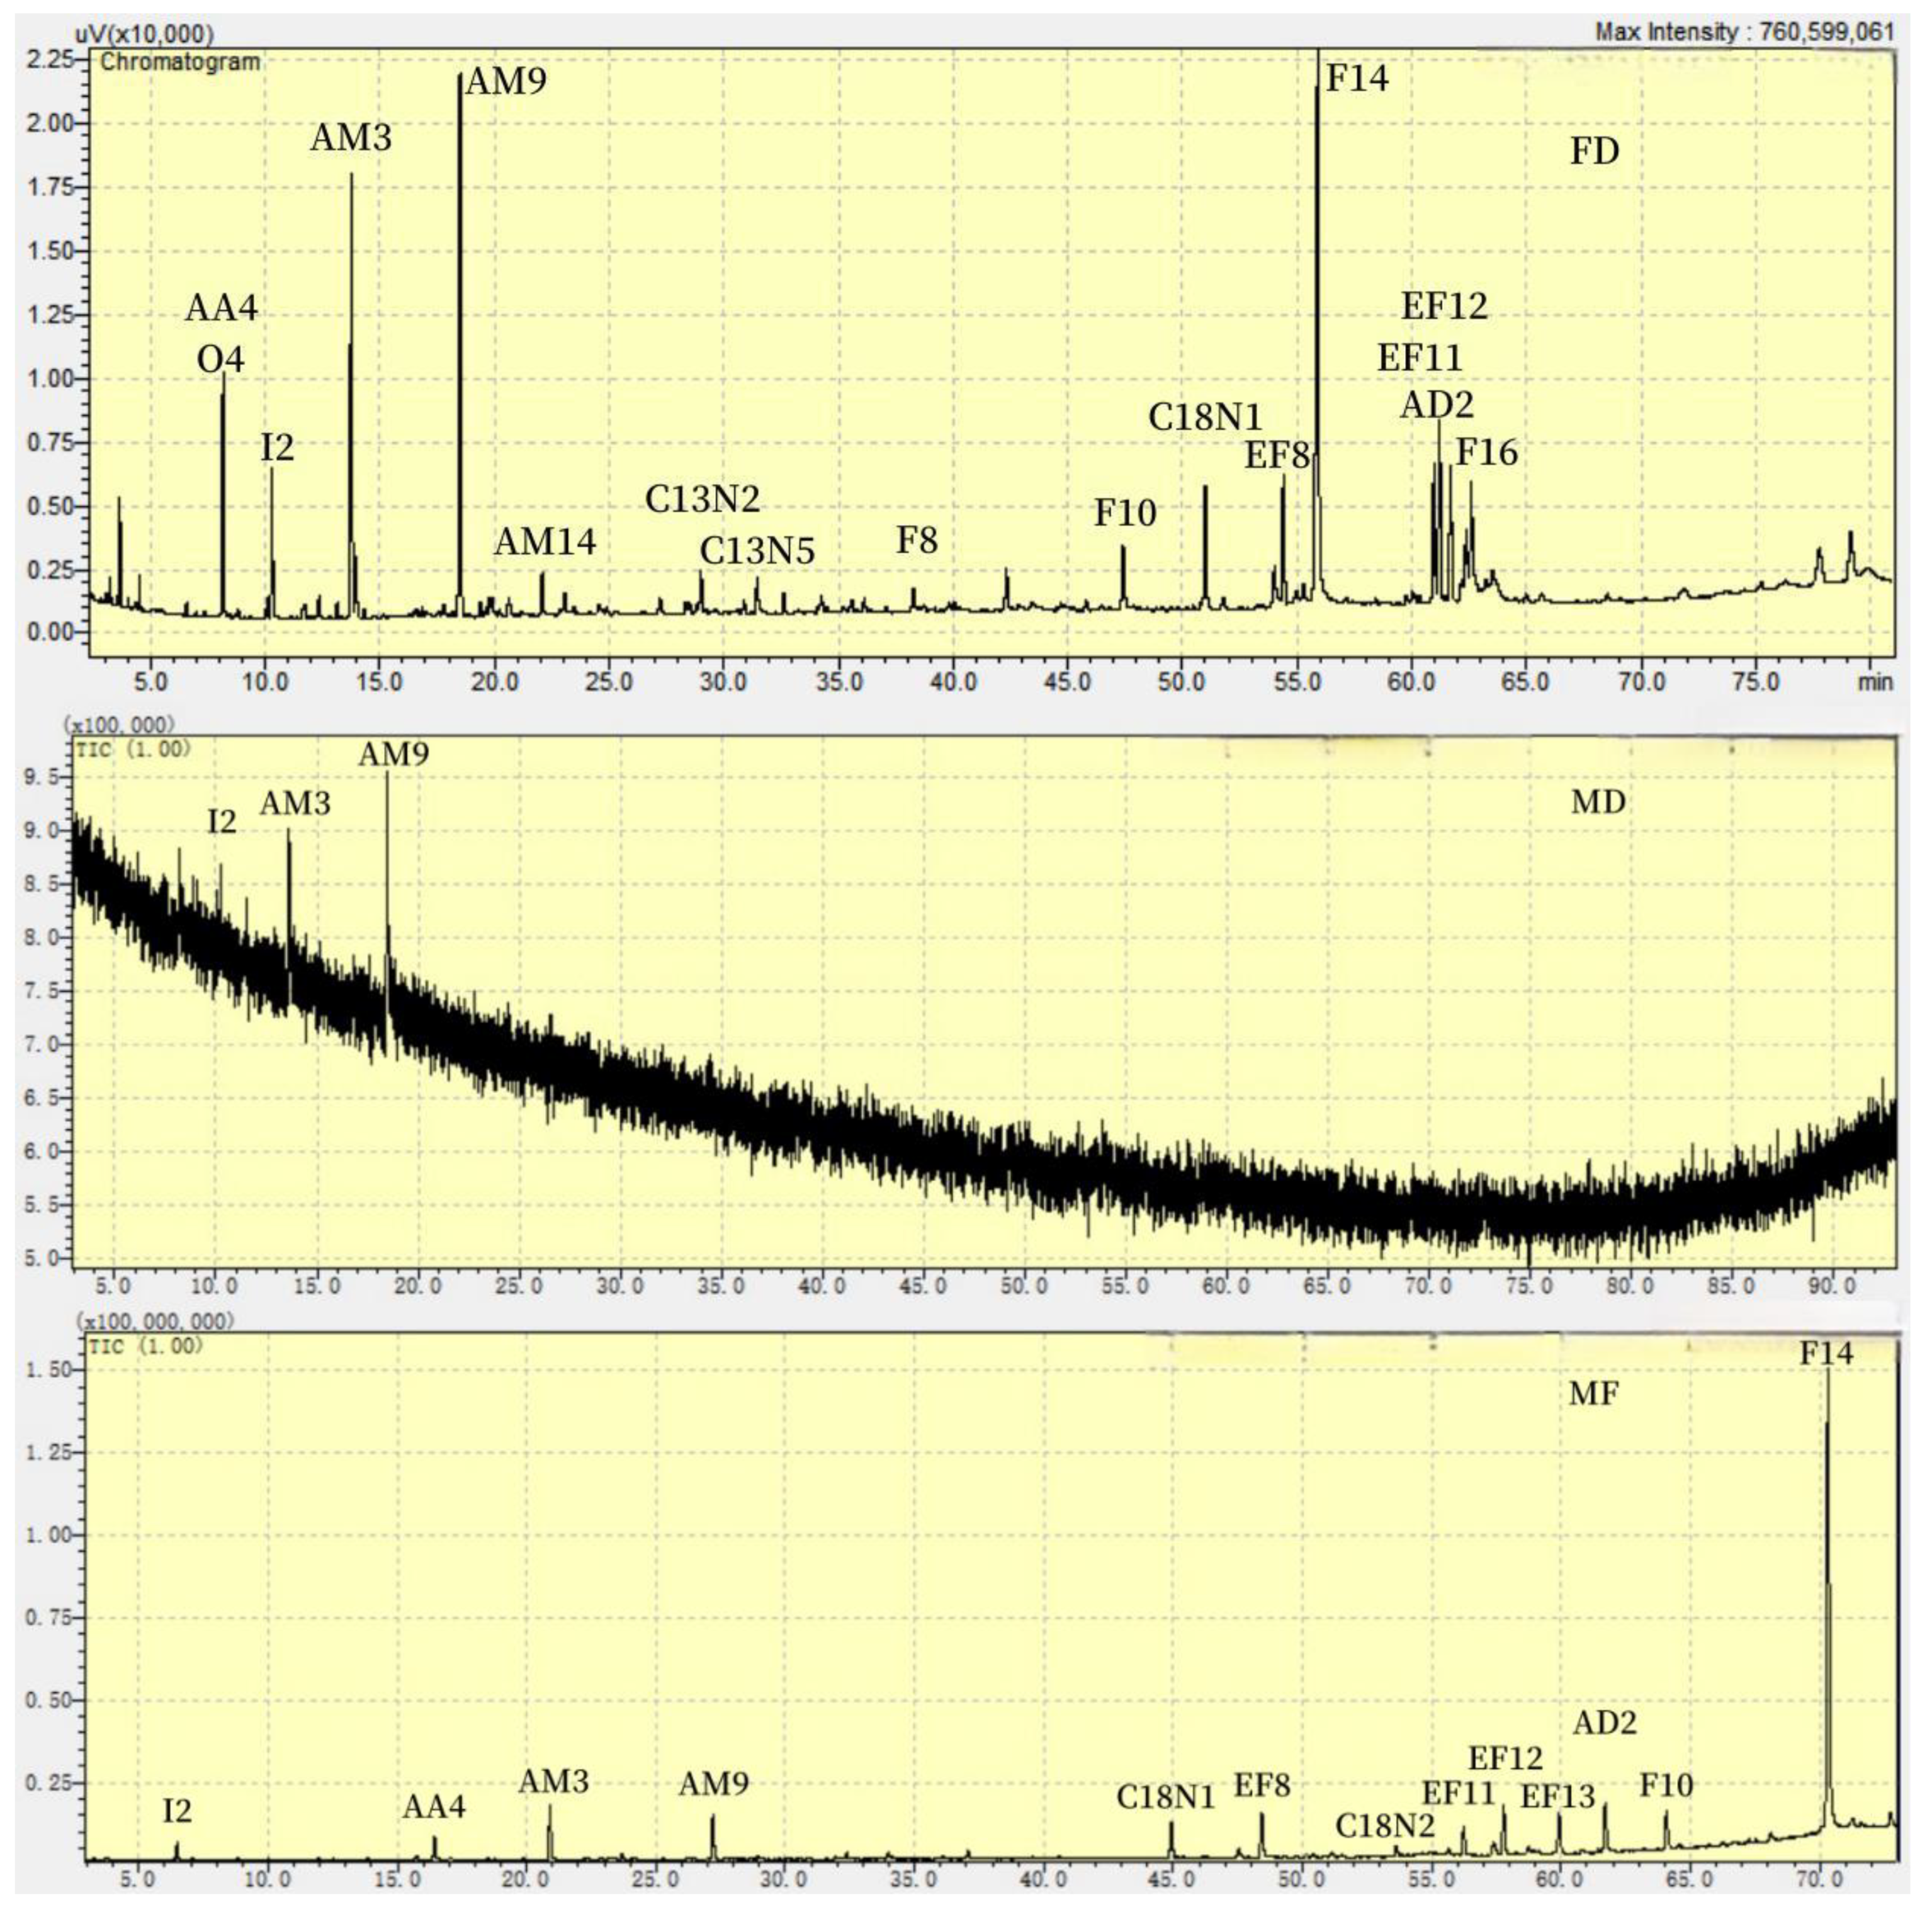
Figure 2.
The content of main categories obtained by MF.
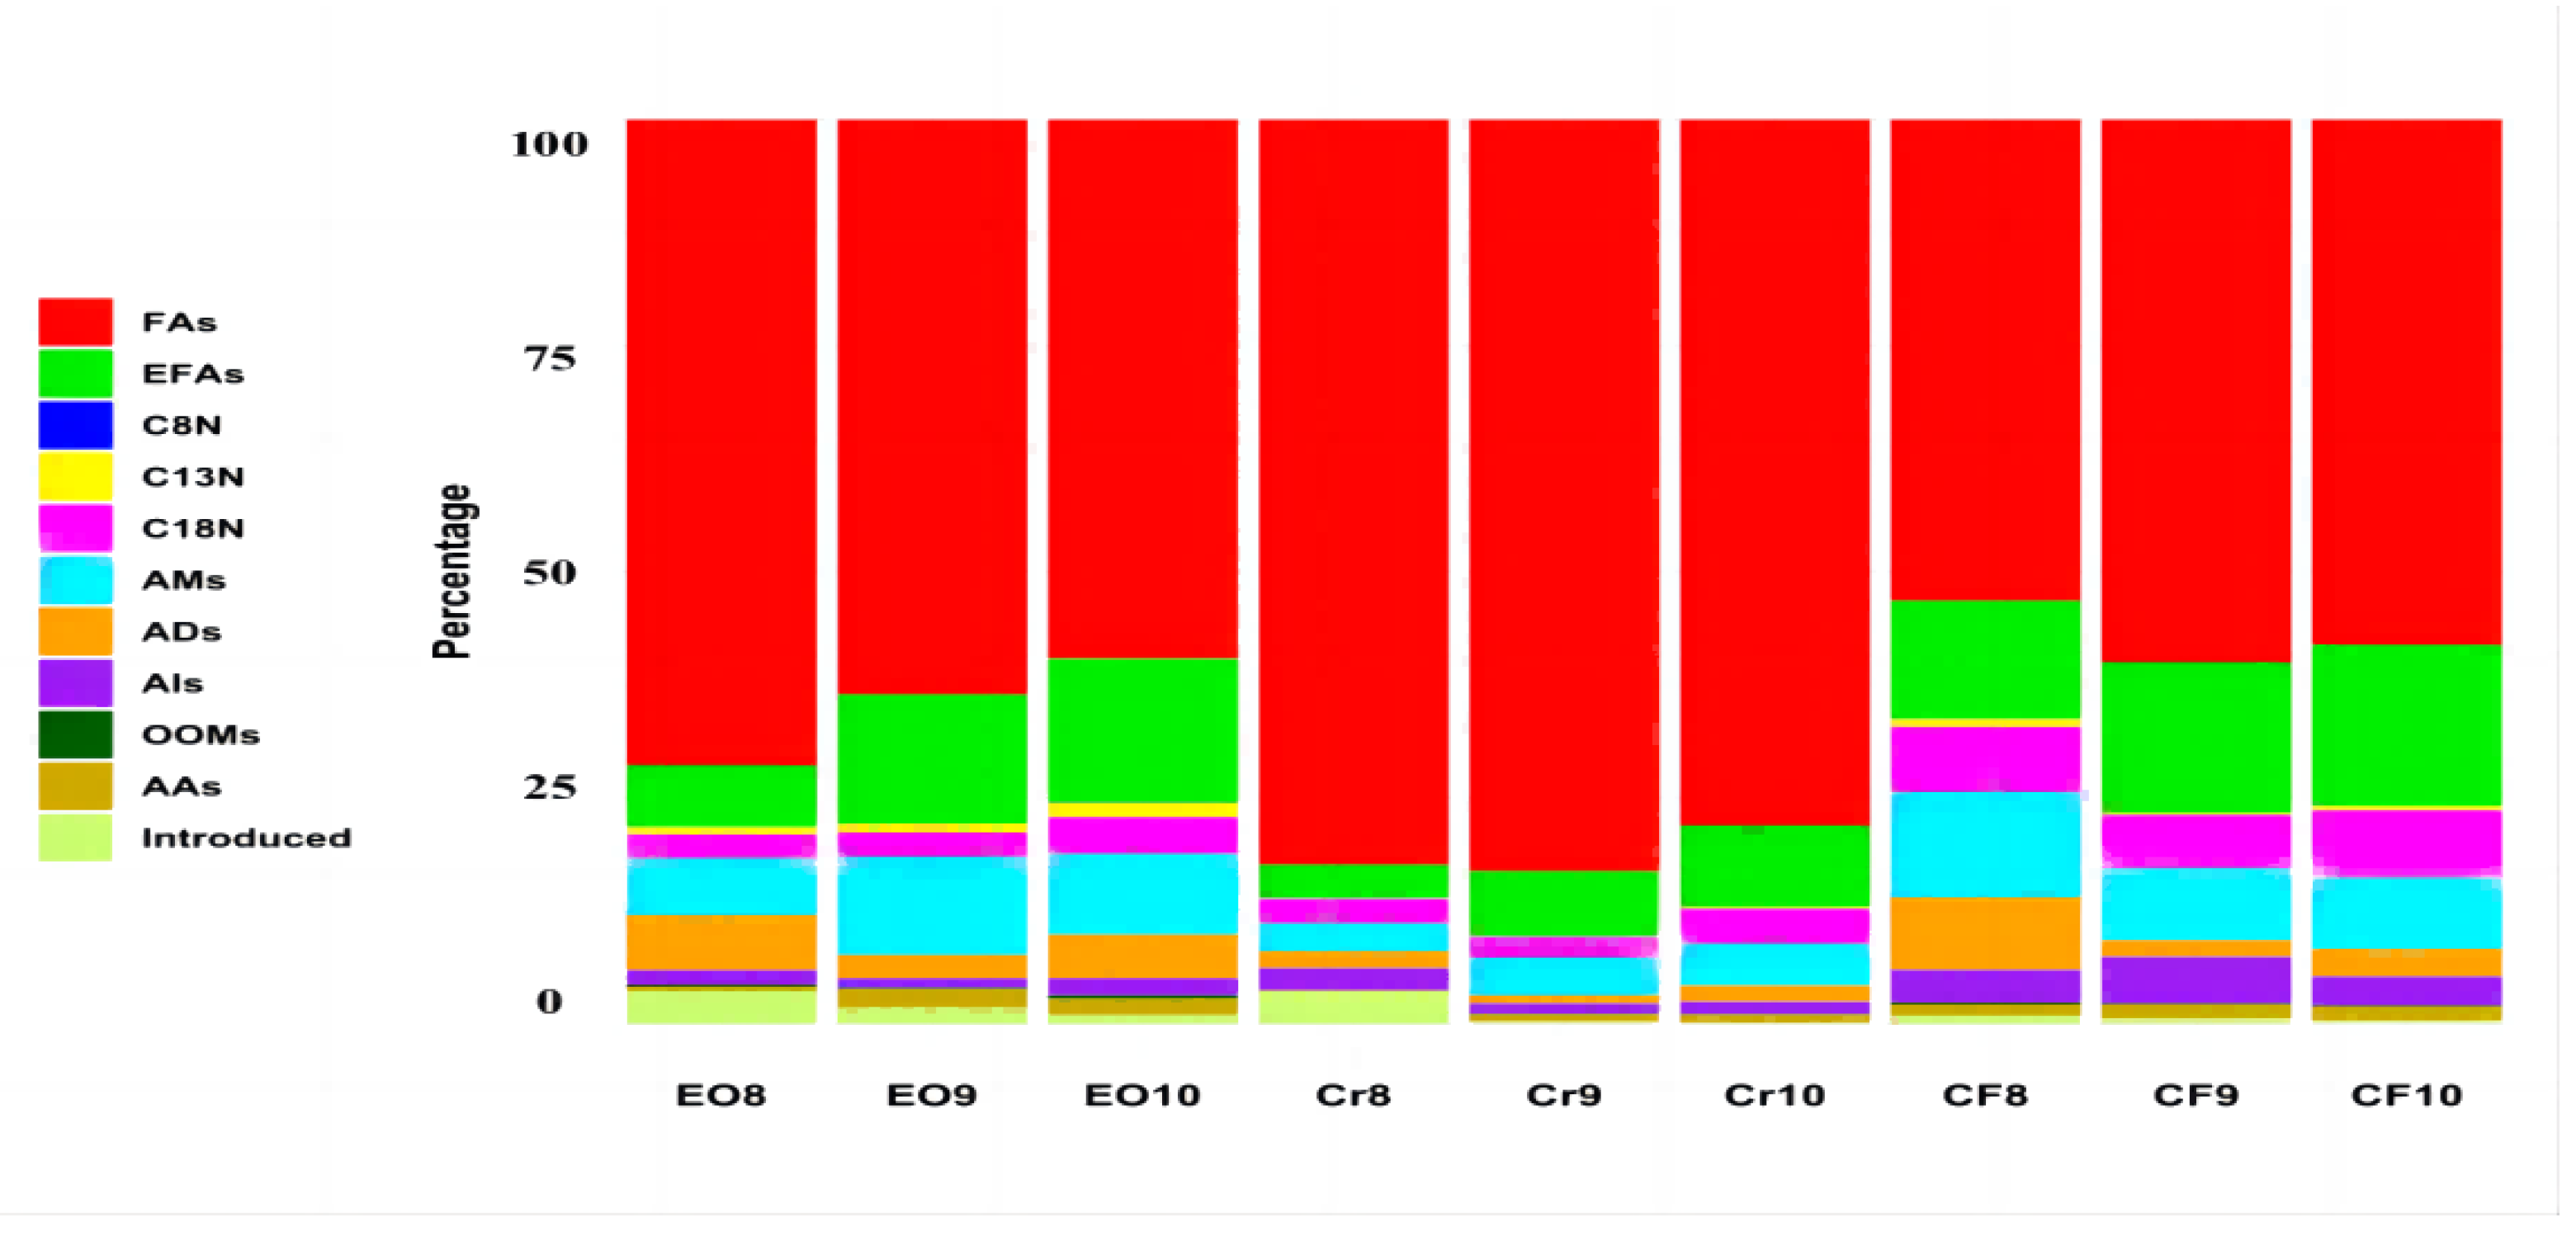
Figure 3.
A total of 27 compounds were screened based on a VIP value of not less than 1.2.
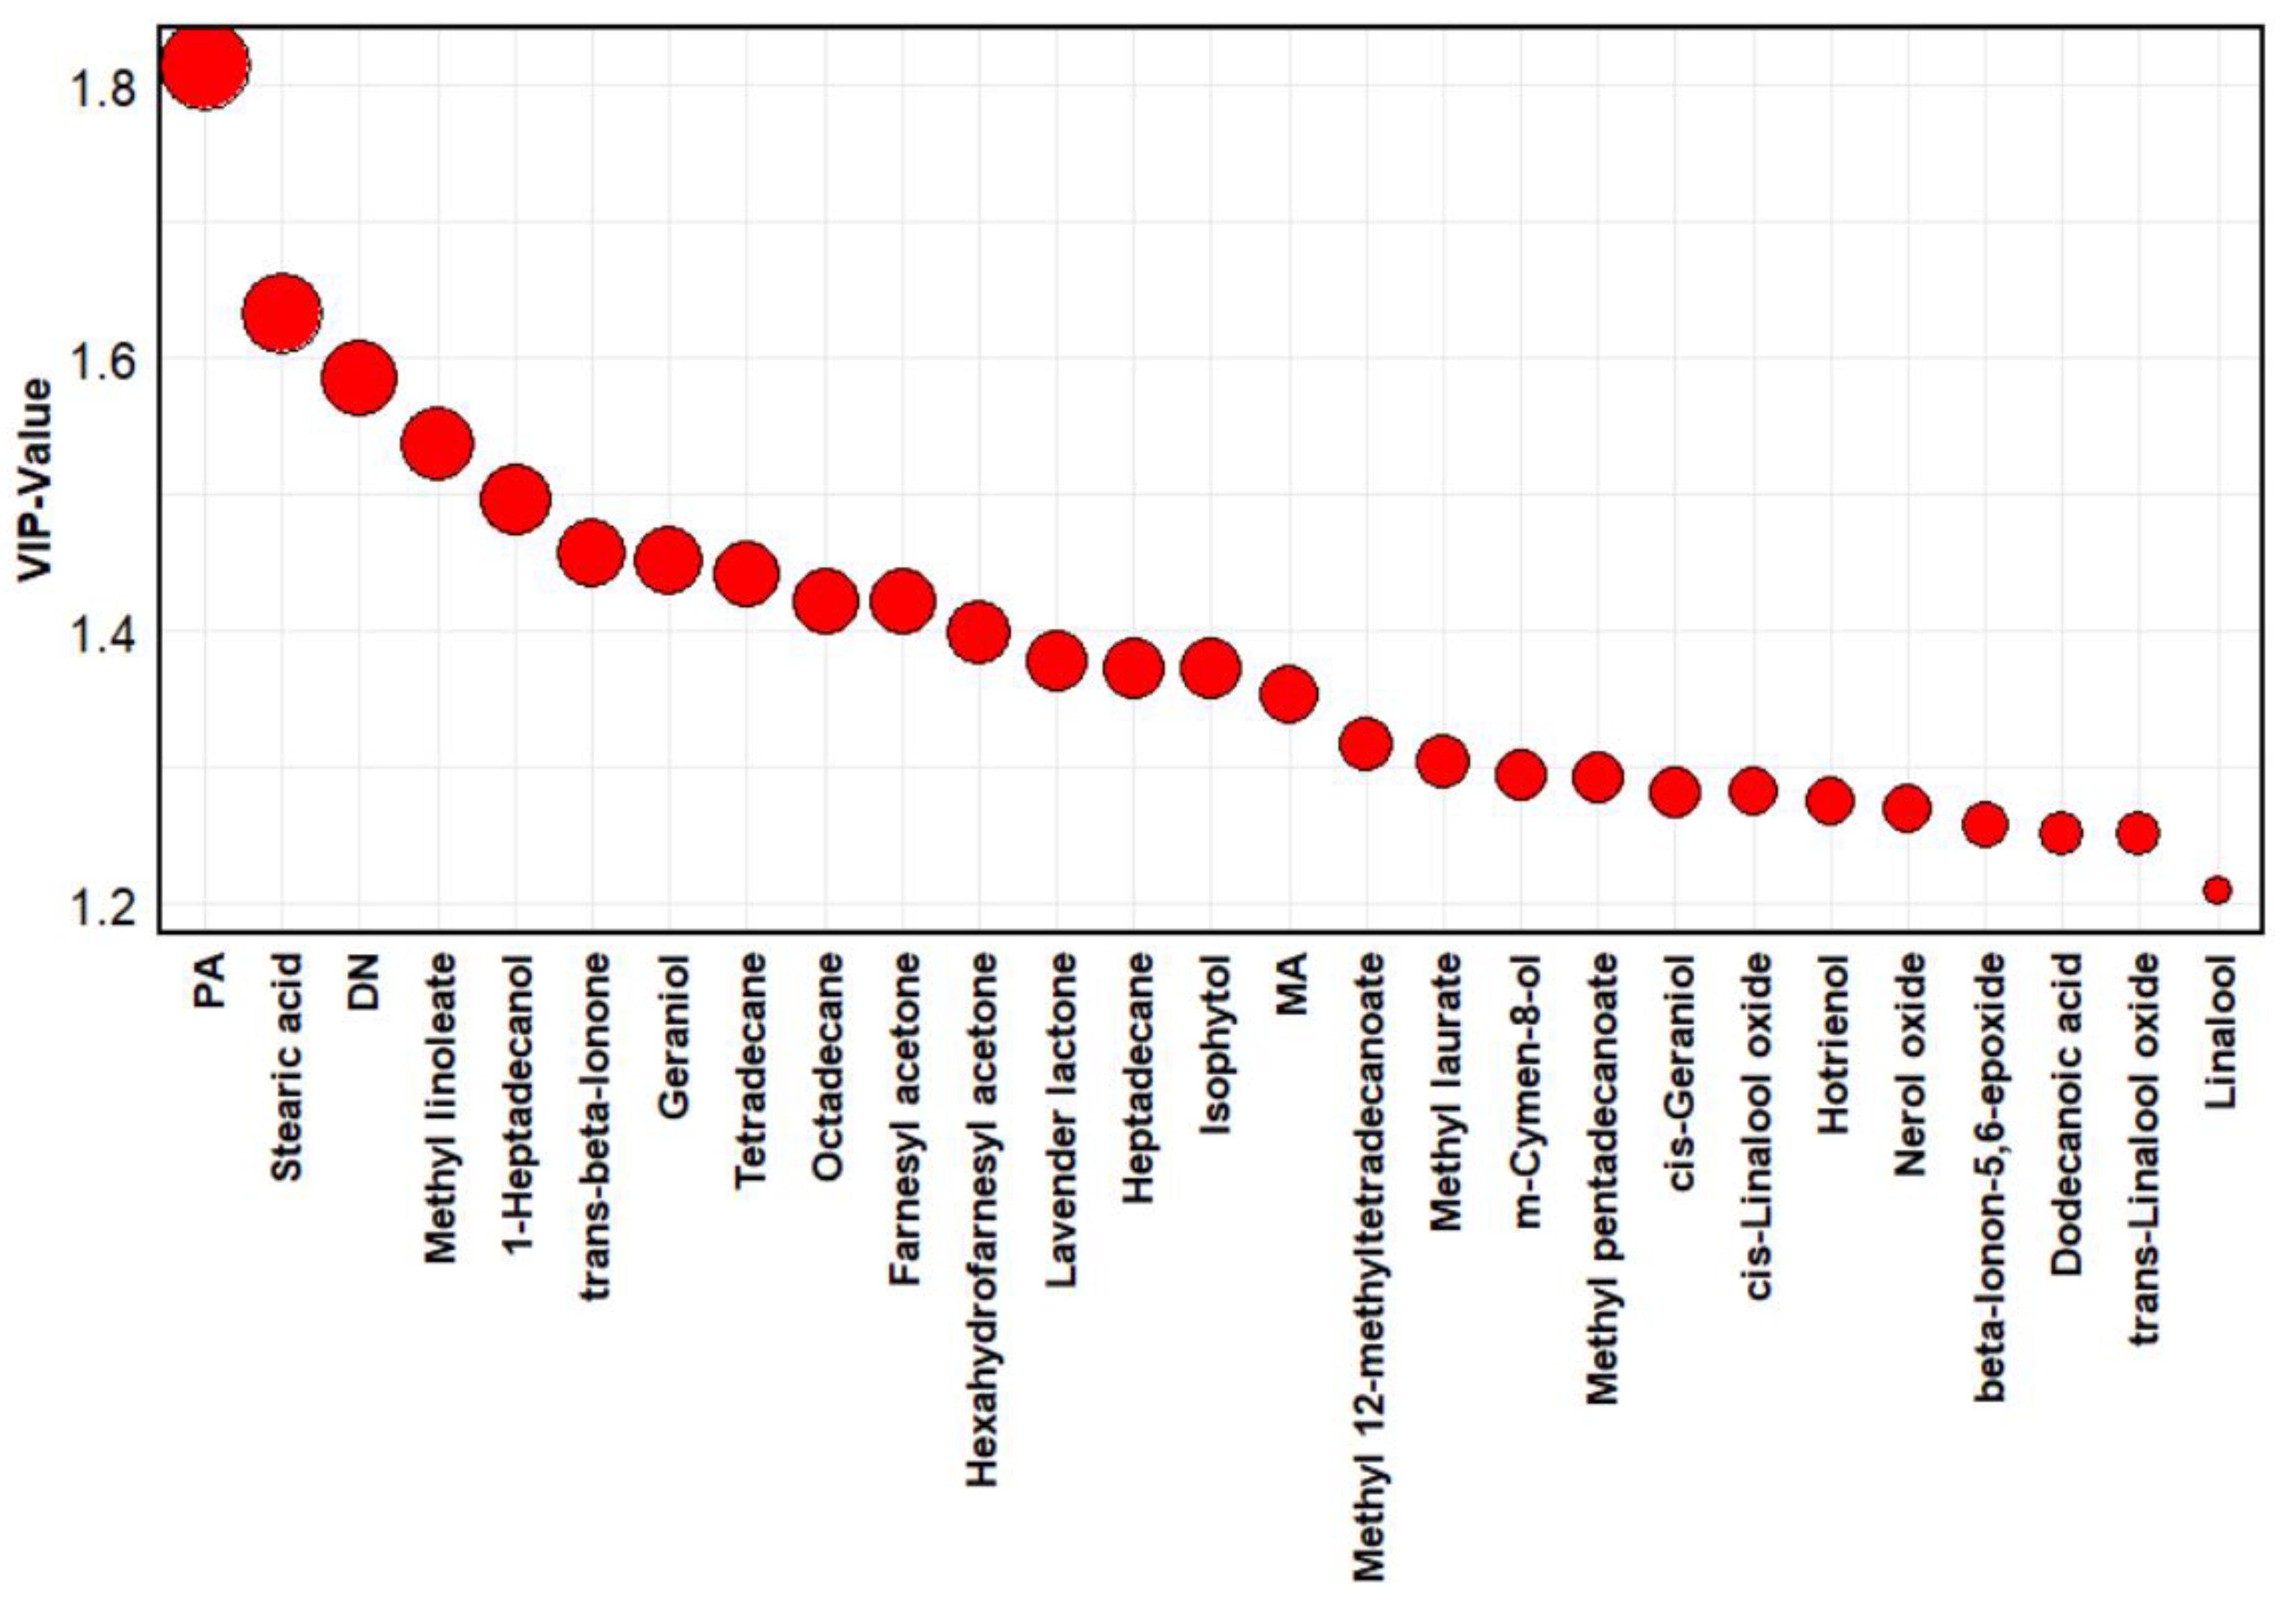
Figure 4.
The loadings of PCA (A) and PLS-DA plot of nine samples detected byFD and MF (B). The compounds represented in the loadings of PCA are as follows: AA2-Hexanol, AA3-Hexanol, C13N6-trans-Geranylacetone, EF1-Nonanoic acid, 9-oxo-, methyl ester, F9-PA, AM10-3,7-Octadiene-2,6-diol, 2,6-dimethyl-, O3-Hexanal, F5-Nonanoic acid, AS2-Cedrol, I2-Limonene, I1-p-Cymene, I3-γ-Terpinene. As for the sample name in the PLS-DA plot, the first character “E”, “F”, “C” refers to “EO”, “CF”, “Cr”, respectively; the middle number “8”, “9”, “10” refers to “L8”, “L9”, “L10”, respectively; the last character “D” and “F” refers to “FD” and “MF”, respectively.
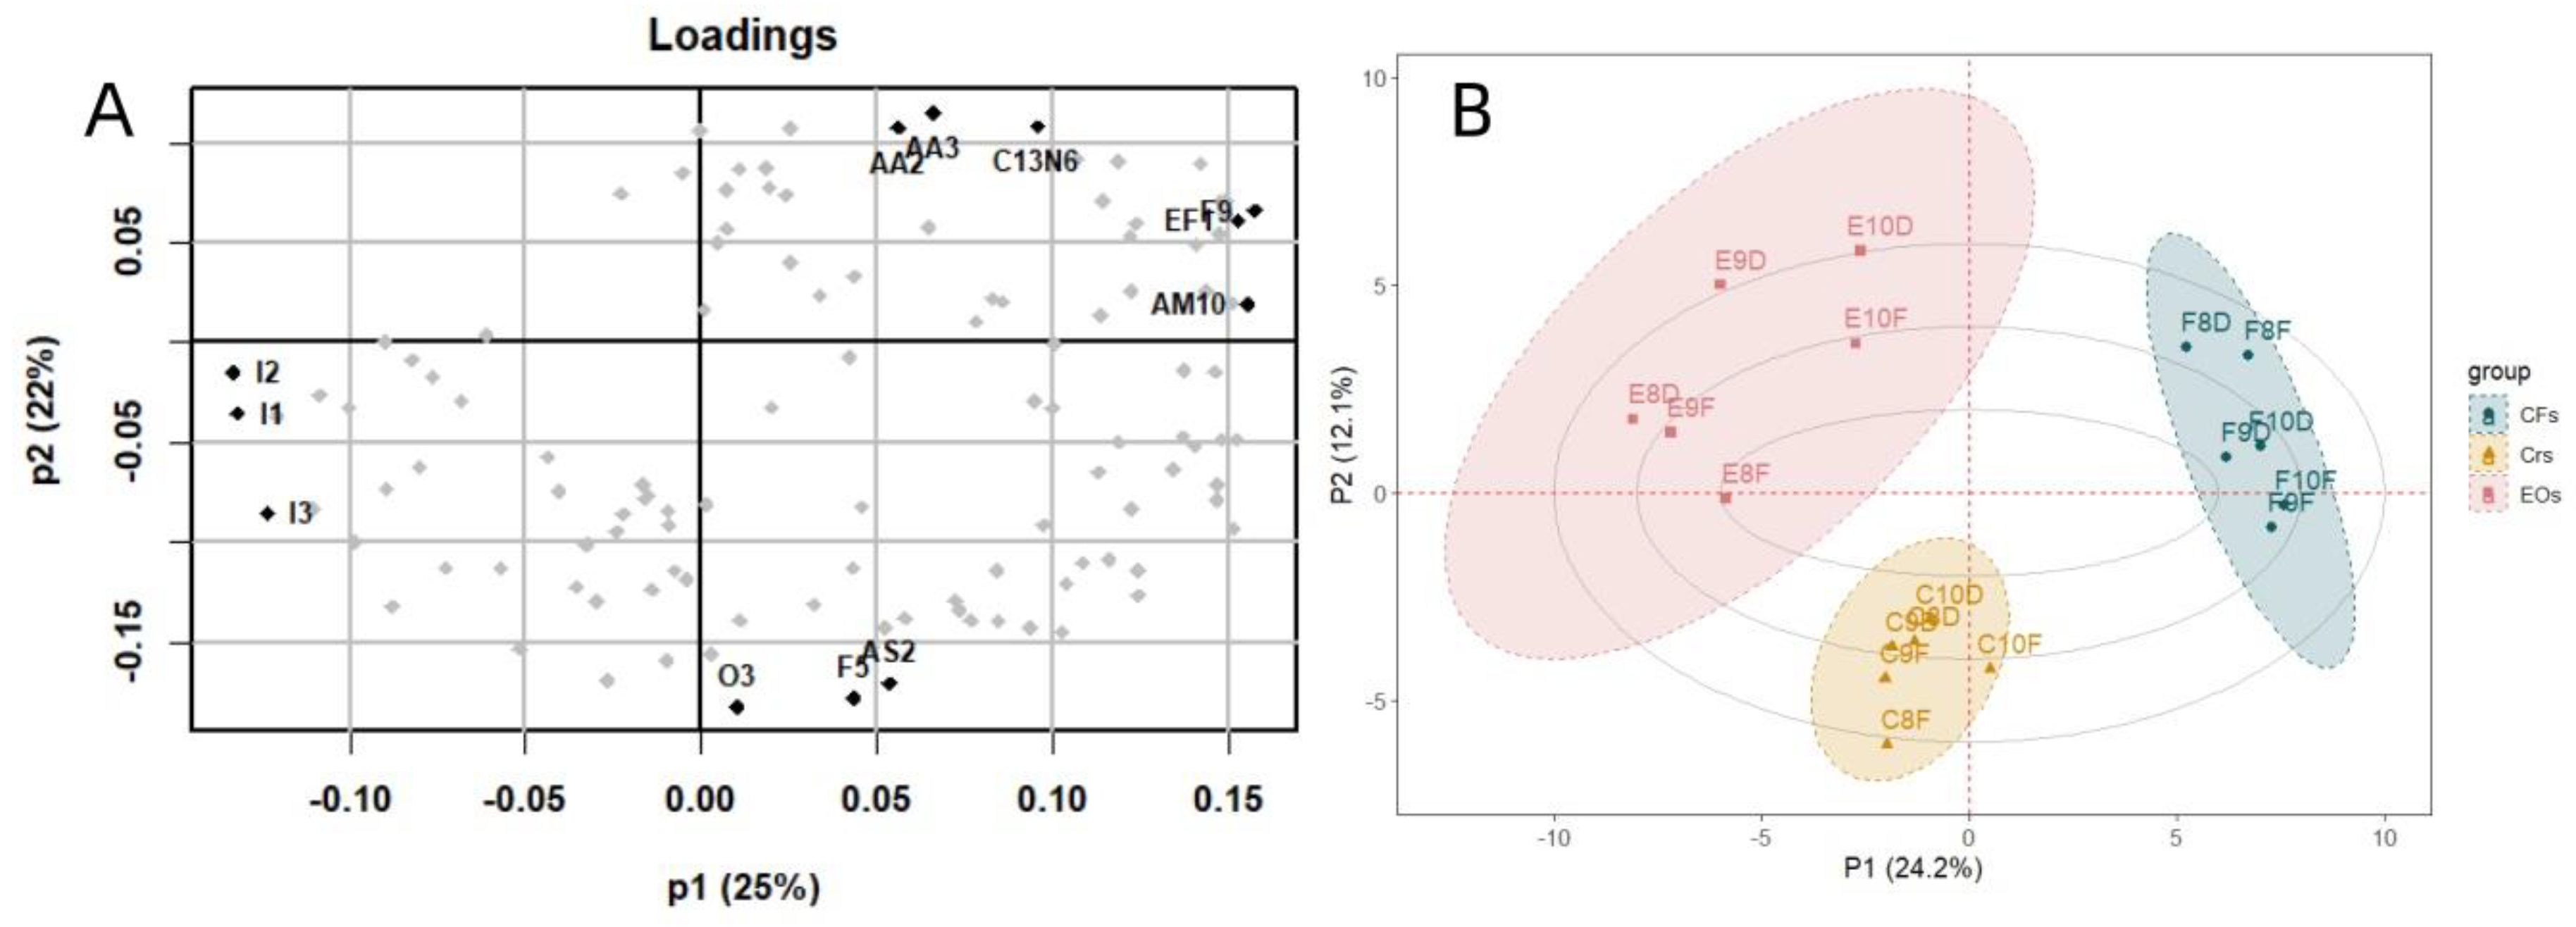
Figure 5.
The main metabolic pathways.
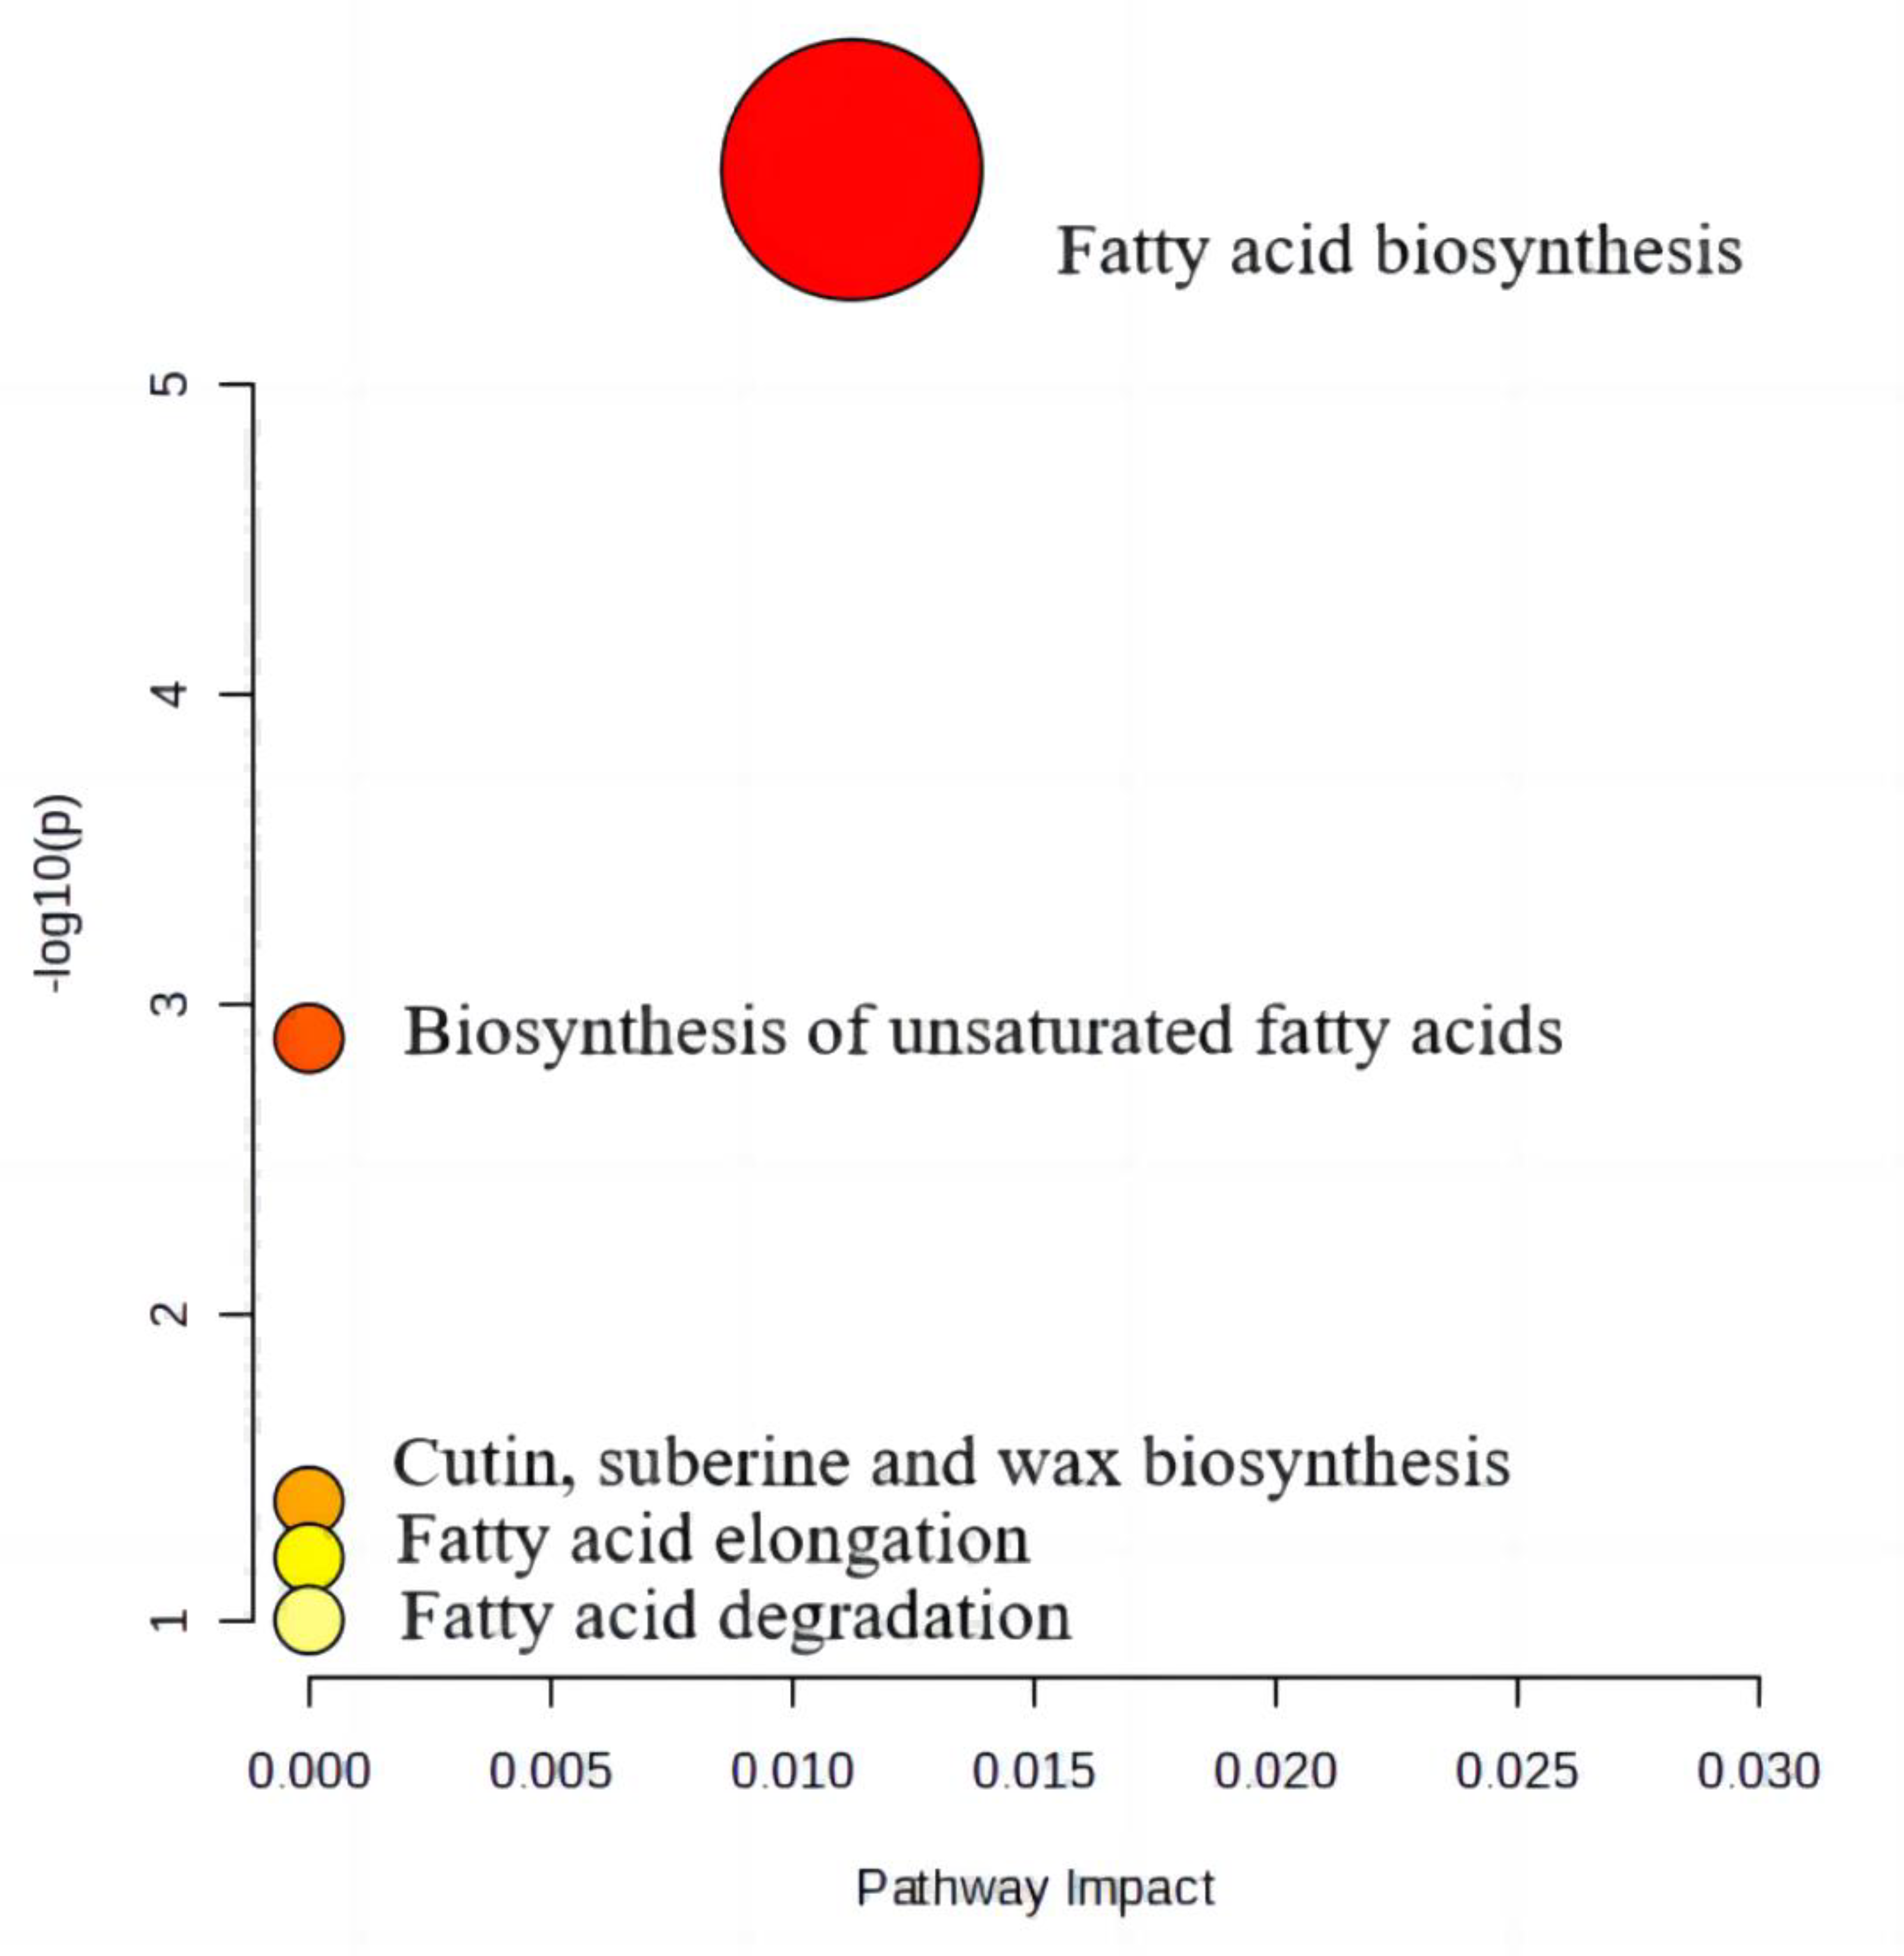
Figure 6.
The RSA values of nine samples of EOs, Crs, and CFs detected by DPPH.
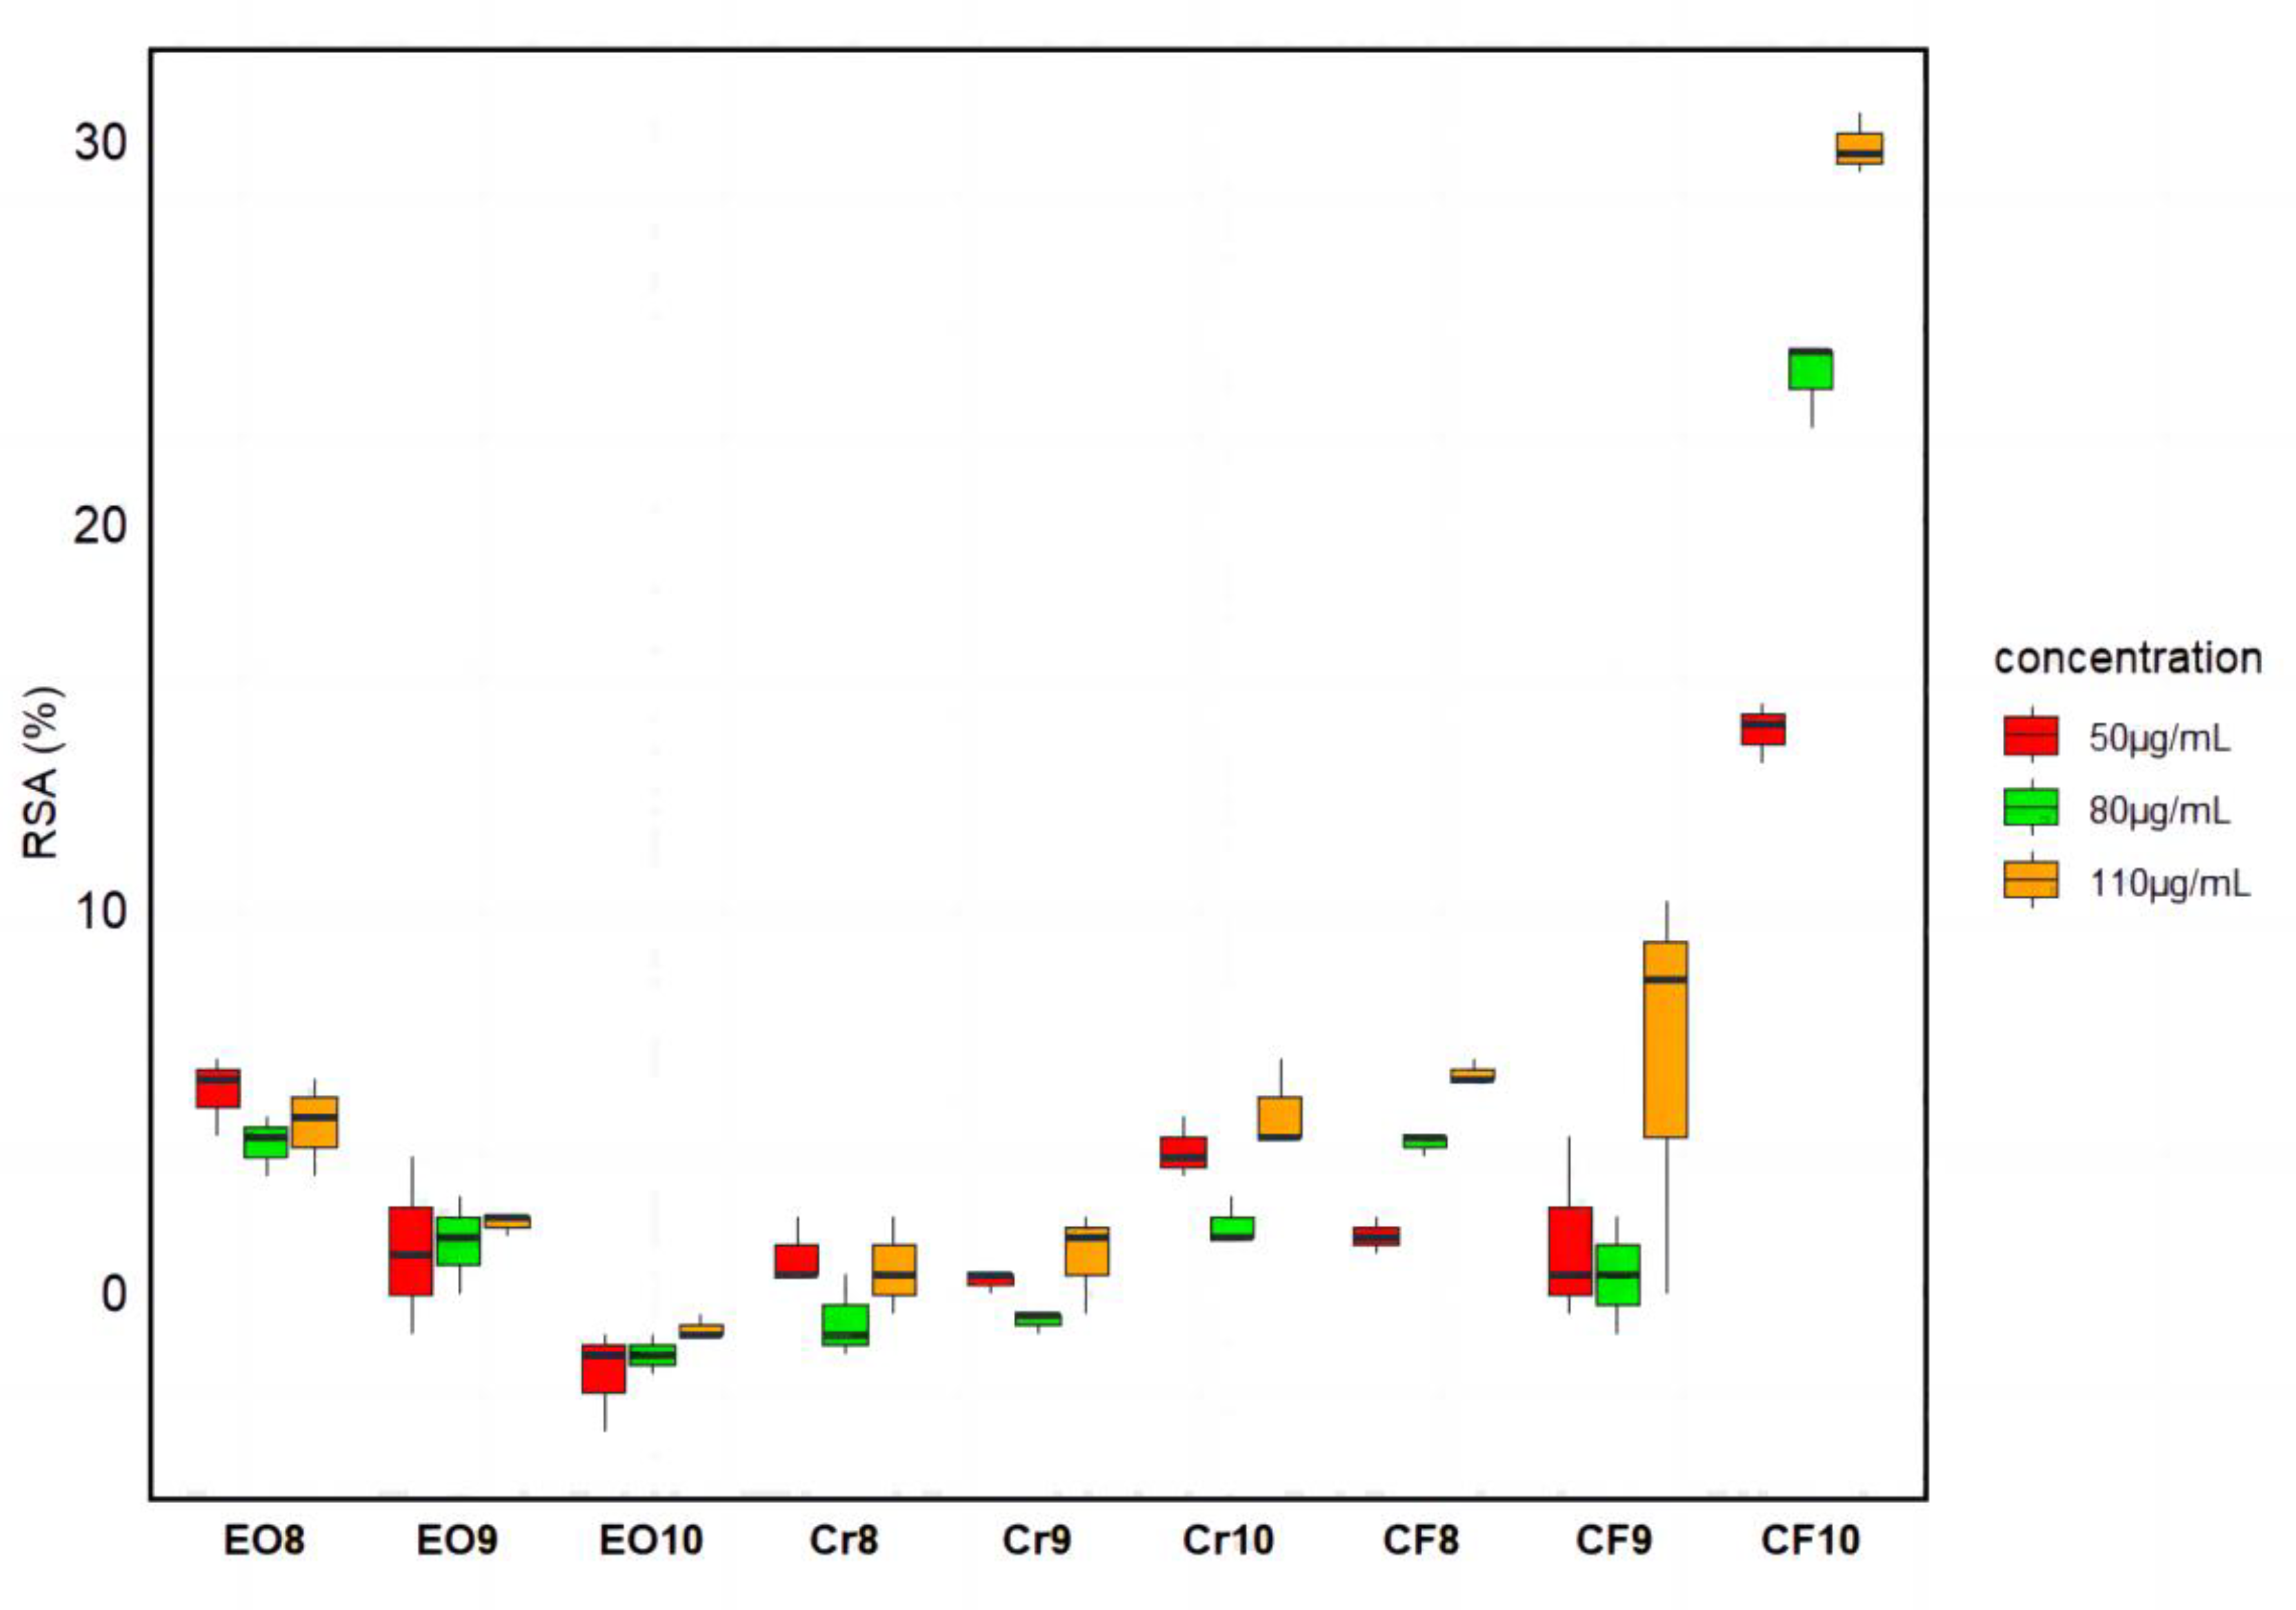
Figure 7.
The RSA values of nine samples of EOs, Crs, and CFs detected by ABTS assay.
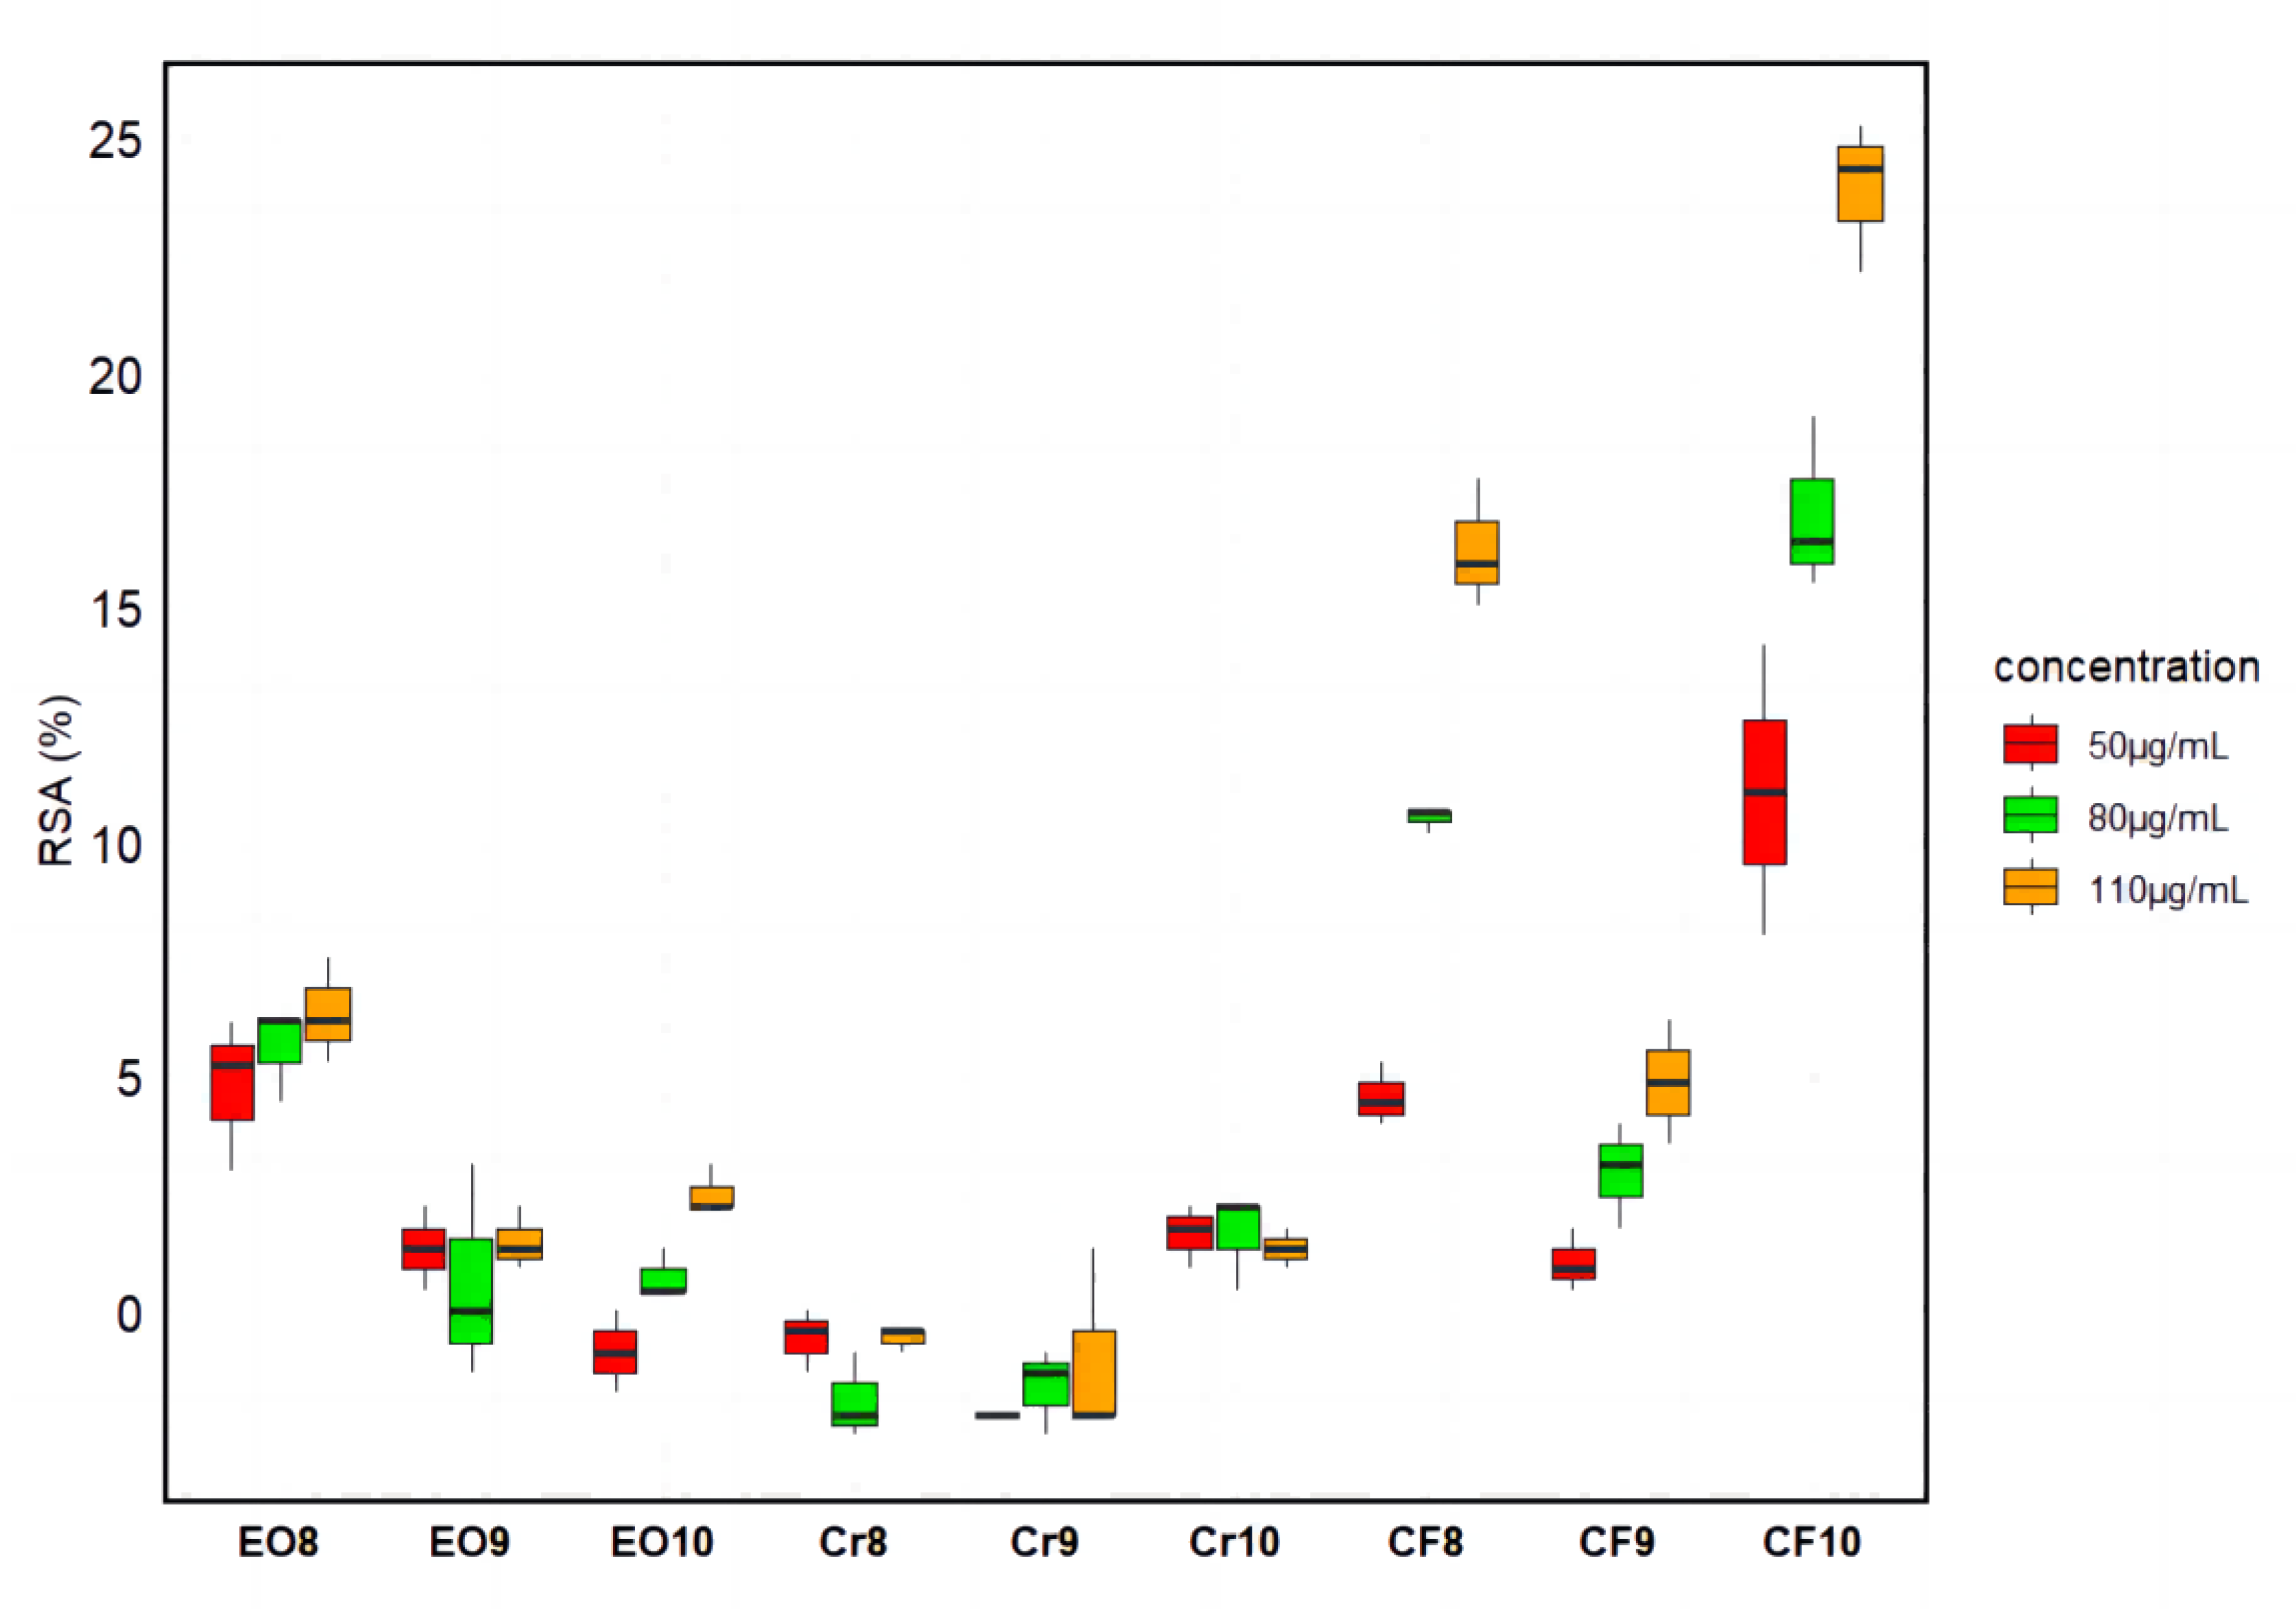
Figure 8.
The RSA values of nine samples of EOs, Crs, and CFs detected by FRAP assay.Overall, the AOAs of OA and LA are enhanced with the increase of concentration.
Figure 8.
The RSA values of nine samples of EOs, Crs, and CFs detected by FRAP assay.Overall, the AOAs of OA and LA are enhanced with the increase of concentration.
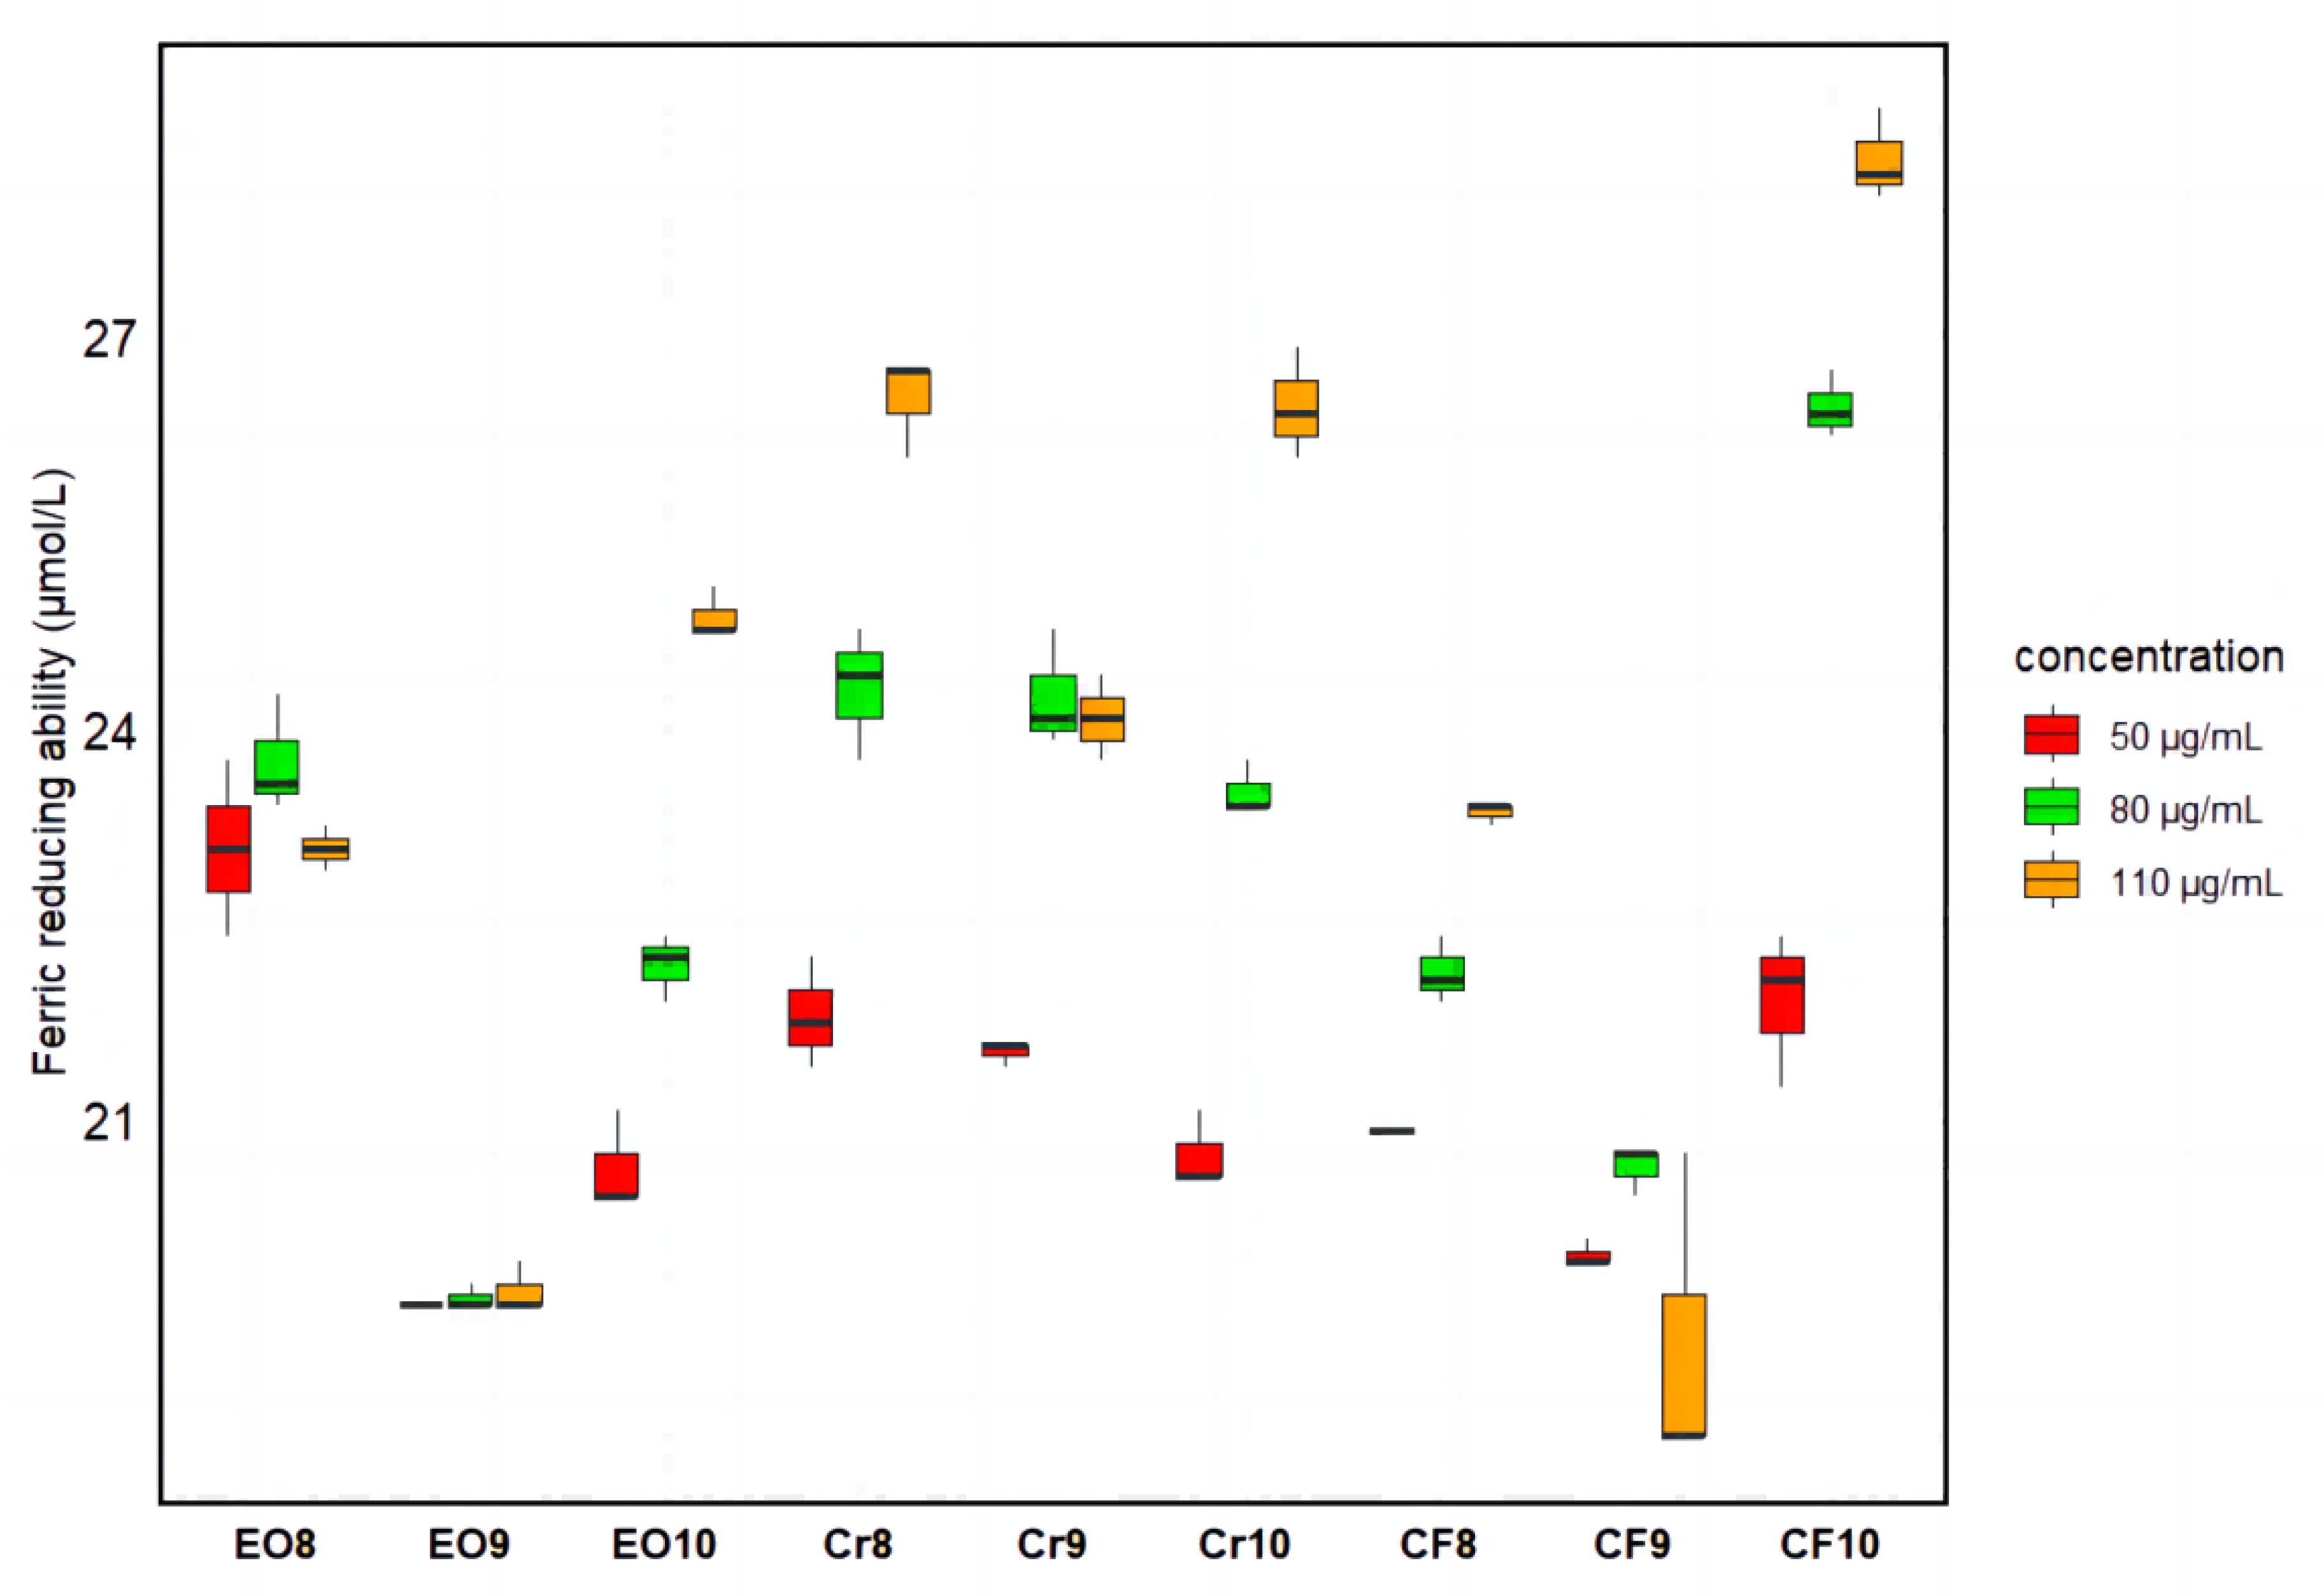
Figure 9.
The hypothetical transformation process from 5β, 6α-dihydroxy-3β-(β-D-glucopyranosyloxy)-7-megastigmen-9-one (1) to eight different types of C13N.
Figure 9.
The hypothetical transformation process from 5β, 6α-dihydroxy-3β-(β-D-glucopyranosyloxy)-7-megastigmen-9-one (1) to eight different types of C13N.
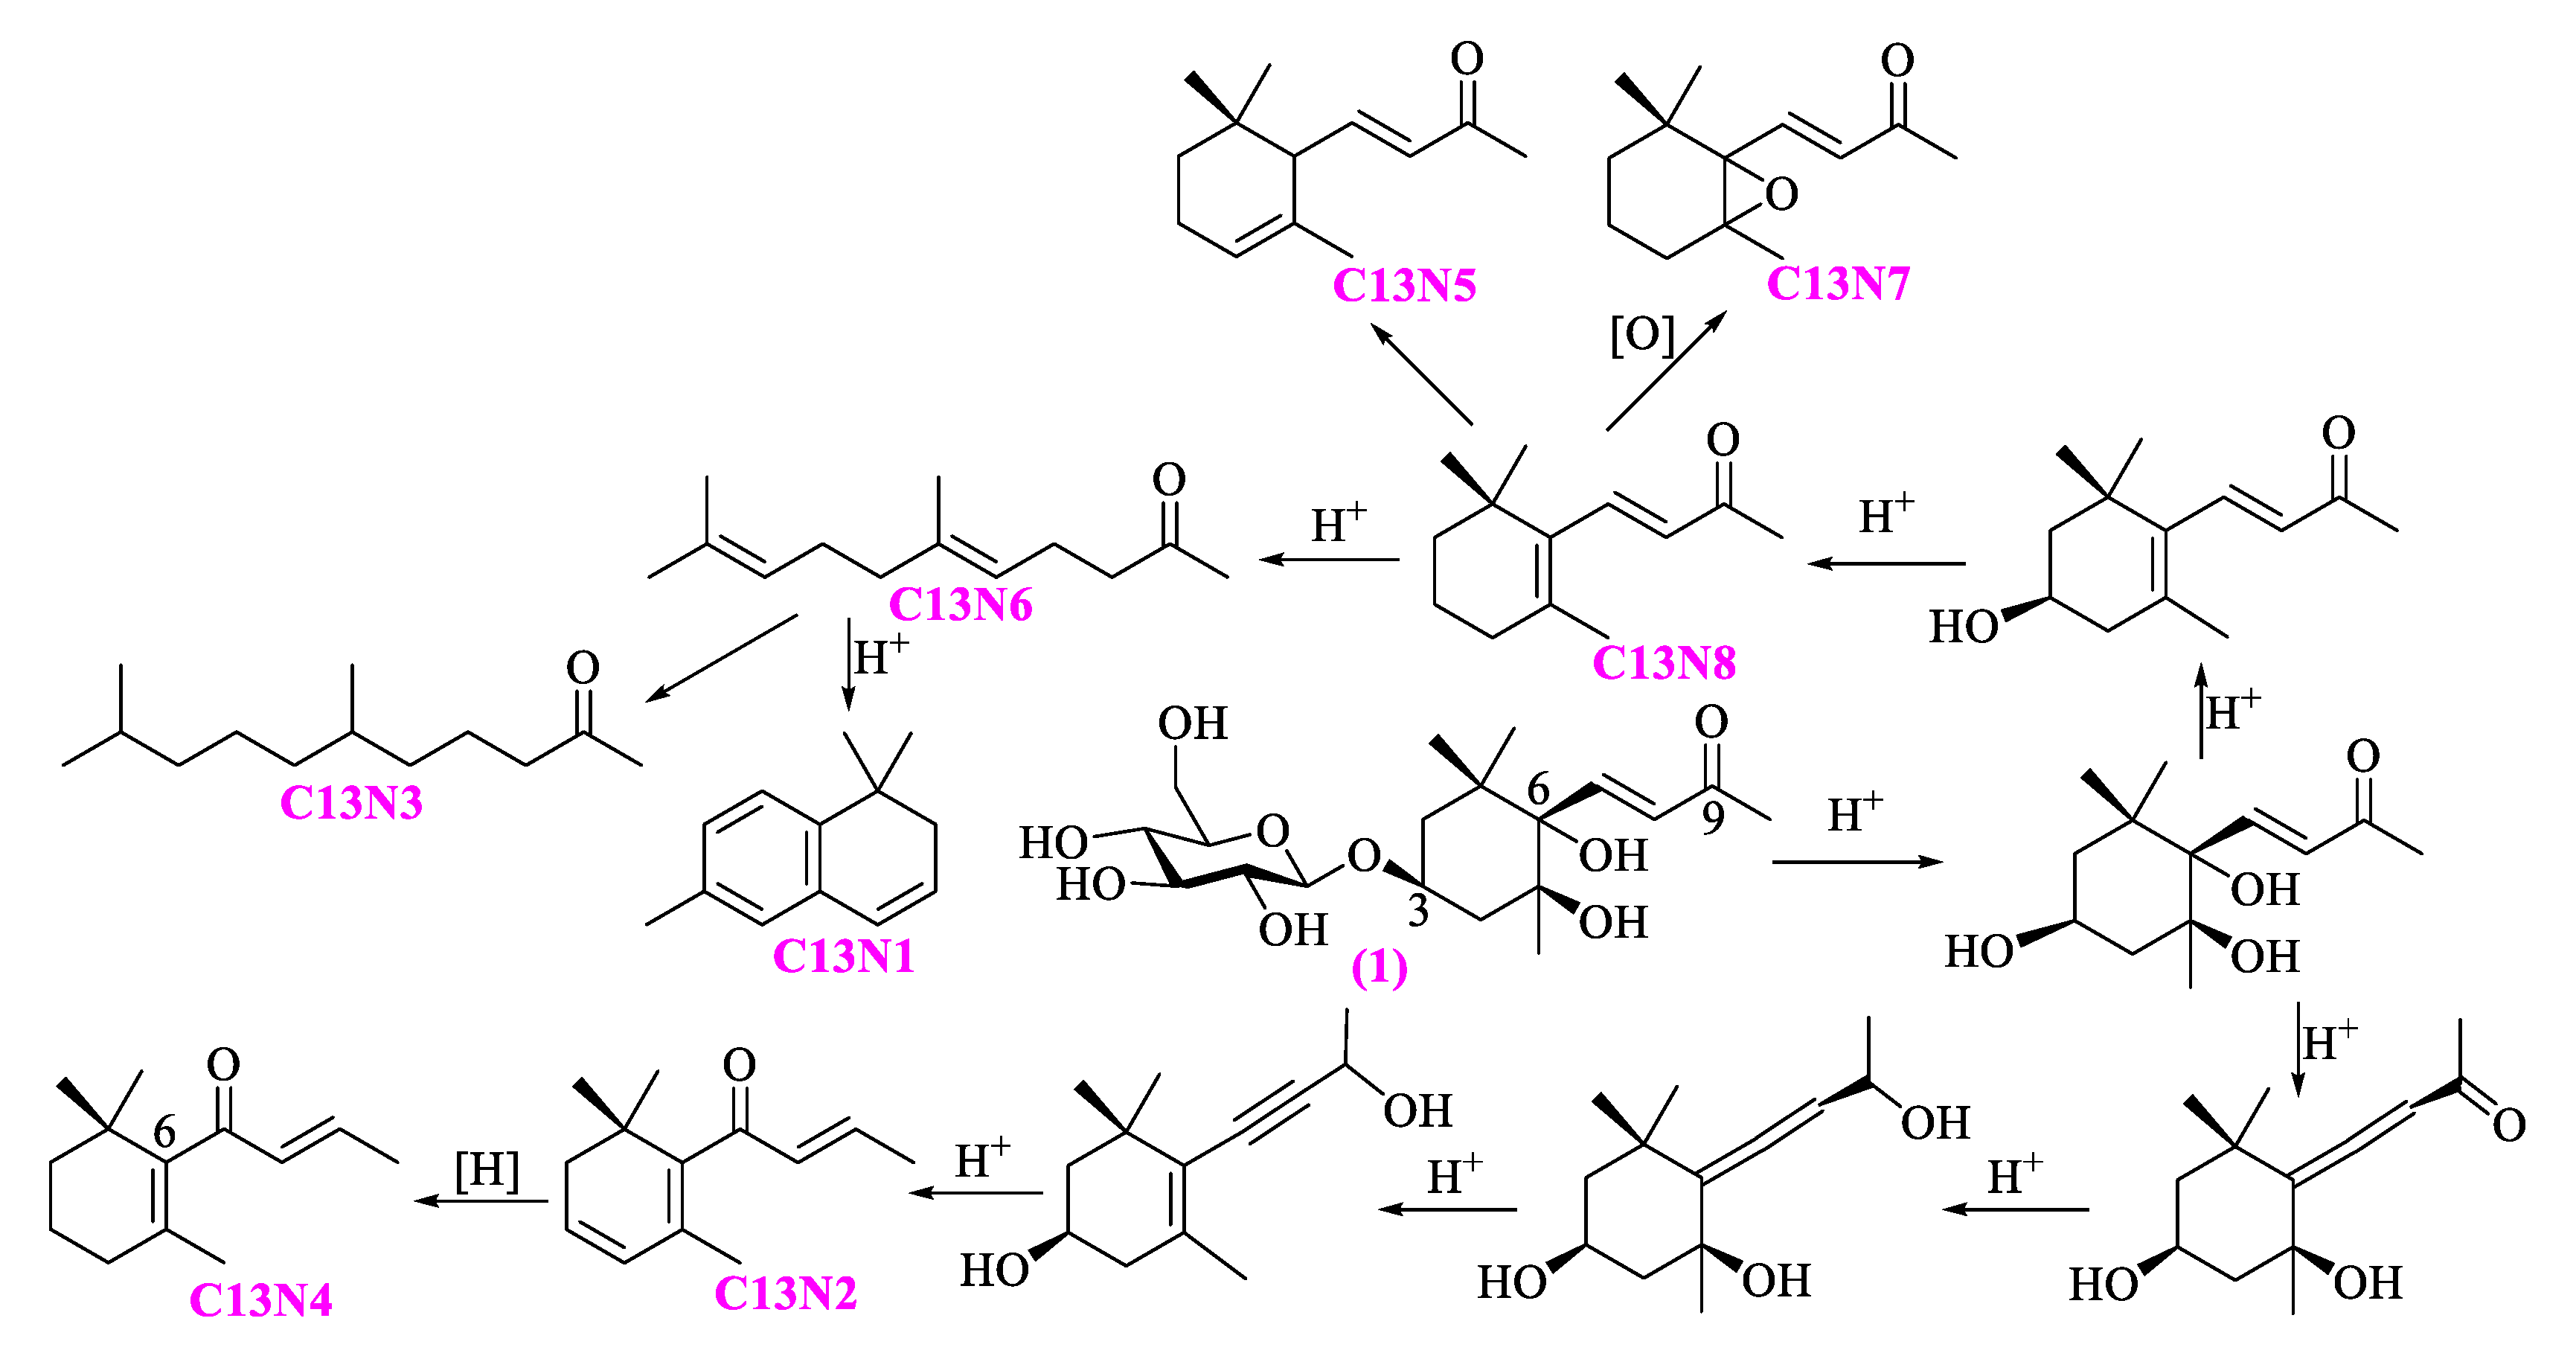
Figure 10.
The formation of apocarotenoids.
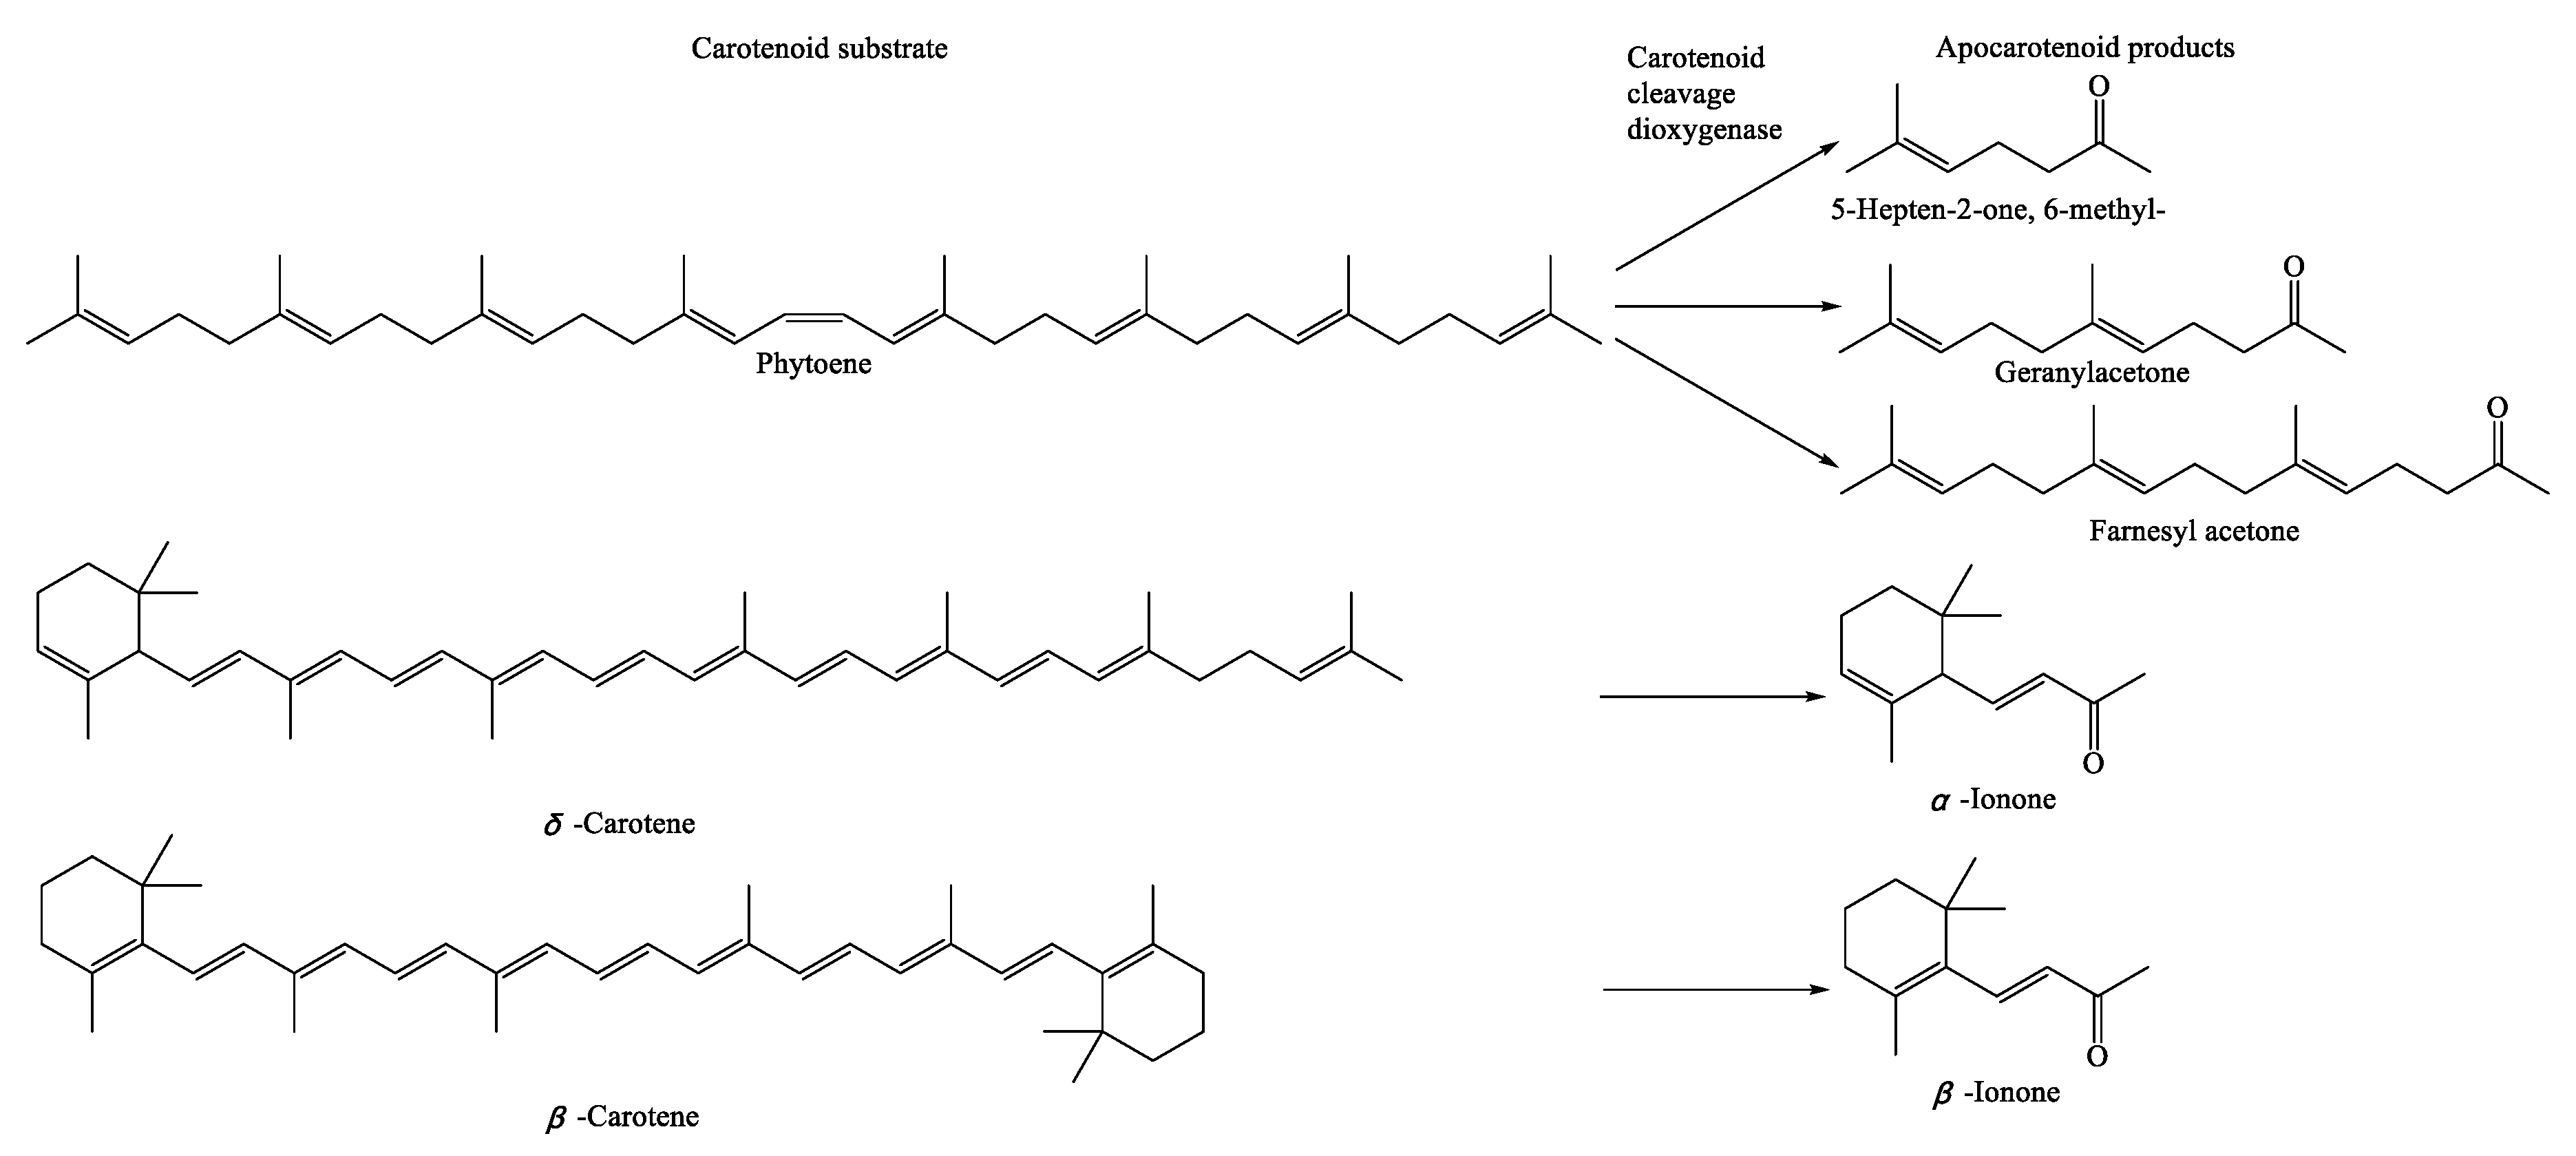
Figure 11.
The biosynthesis of CMs. Solid arrows represent established biosynthetic steps, whereas dashed line arrows indicate the transformation is hypothetical.
Figure 11.
The biosynthesis of CMs. Solid arrows represent established biosynthetic steps, whereas dashed line arrows indicate the transformation is hypothetical.
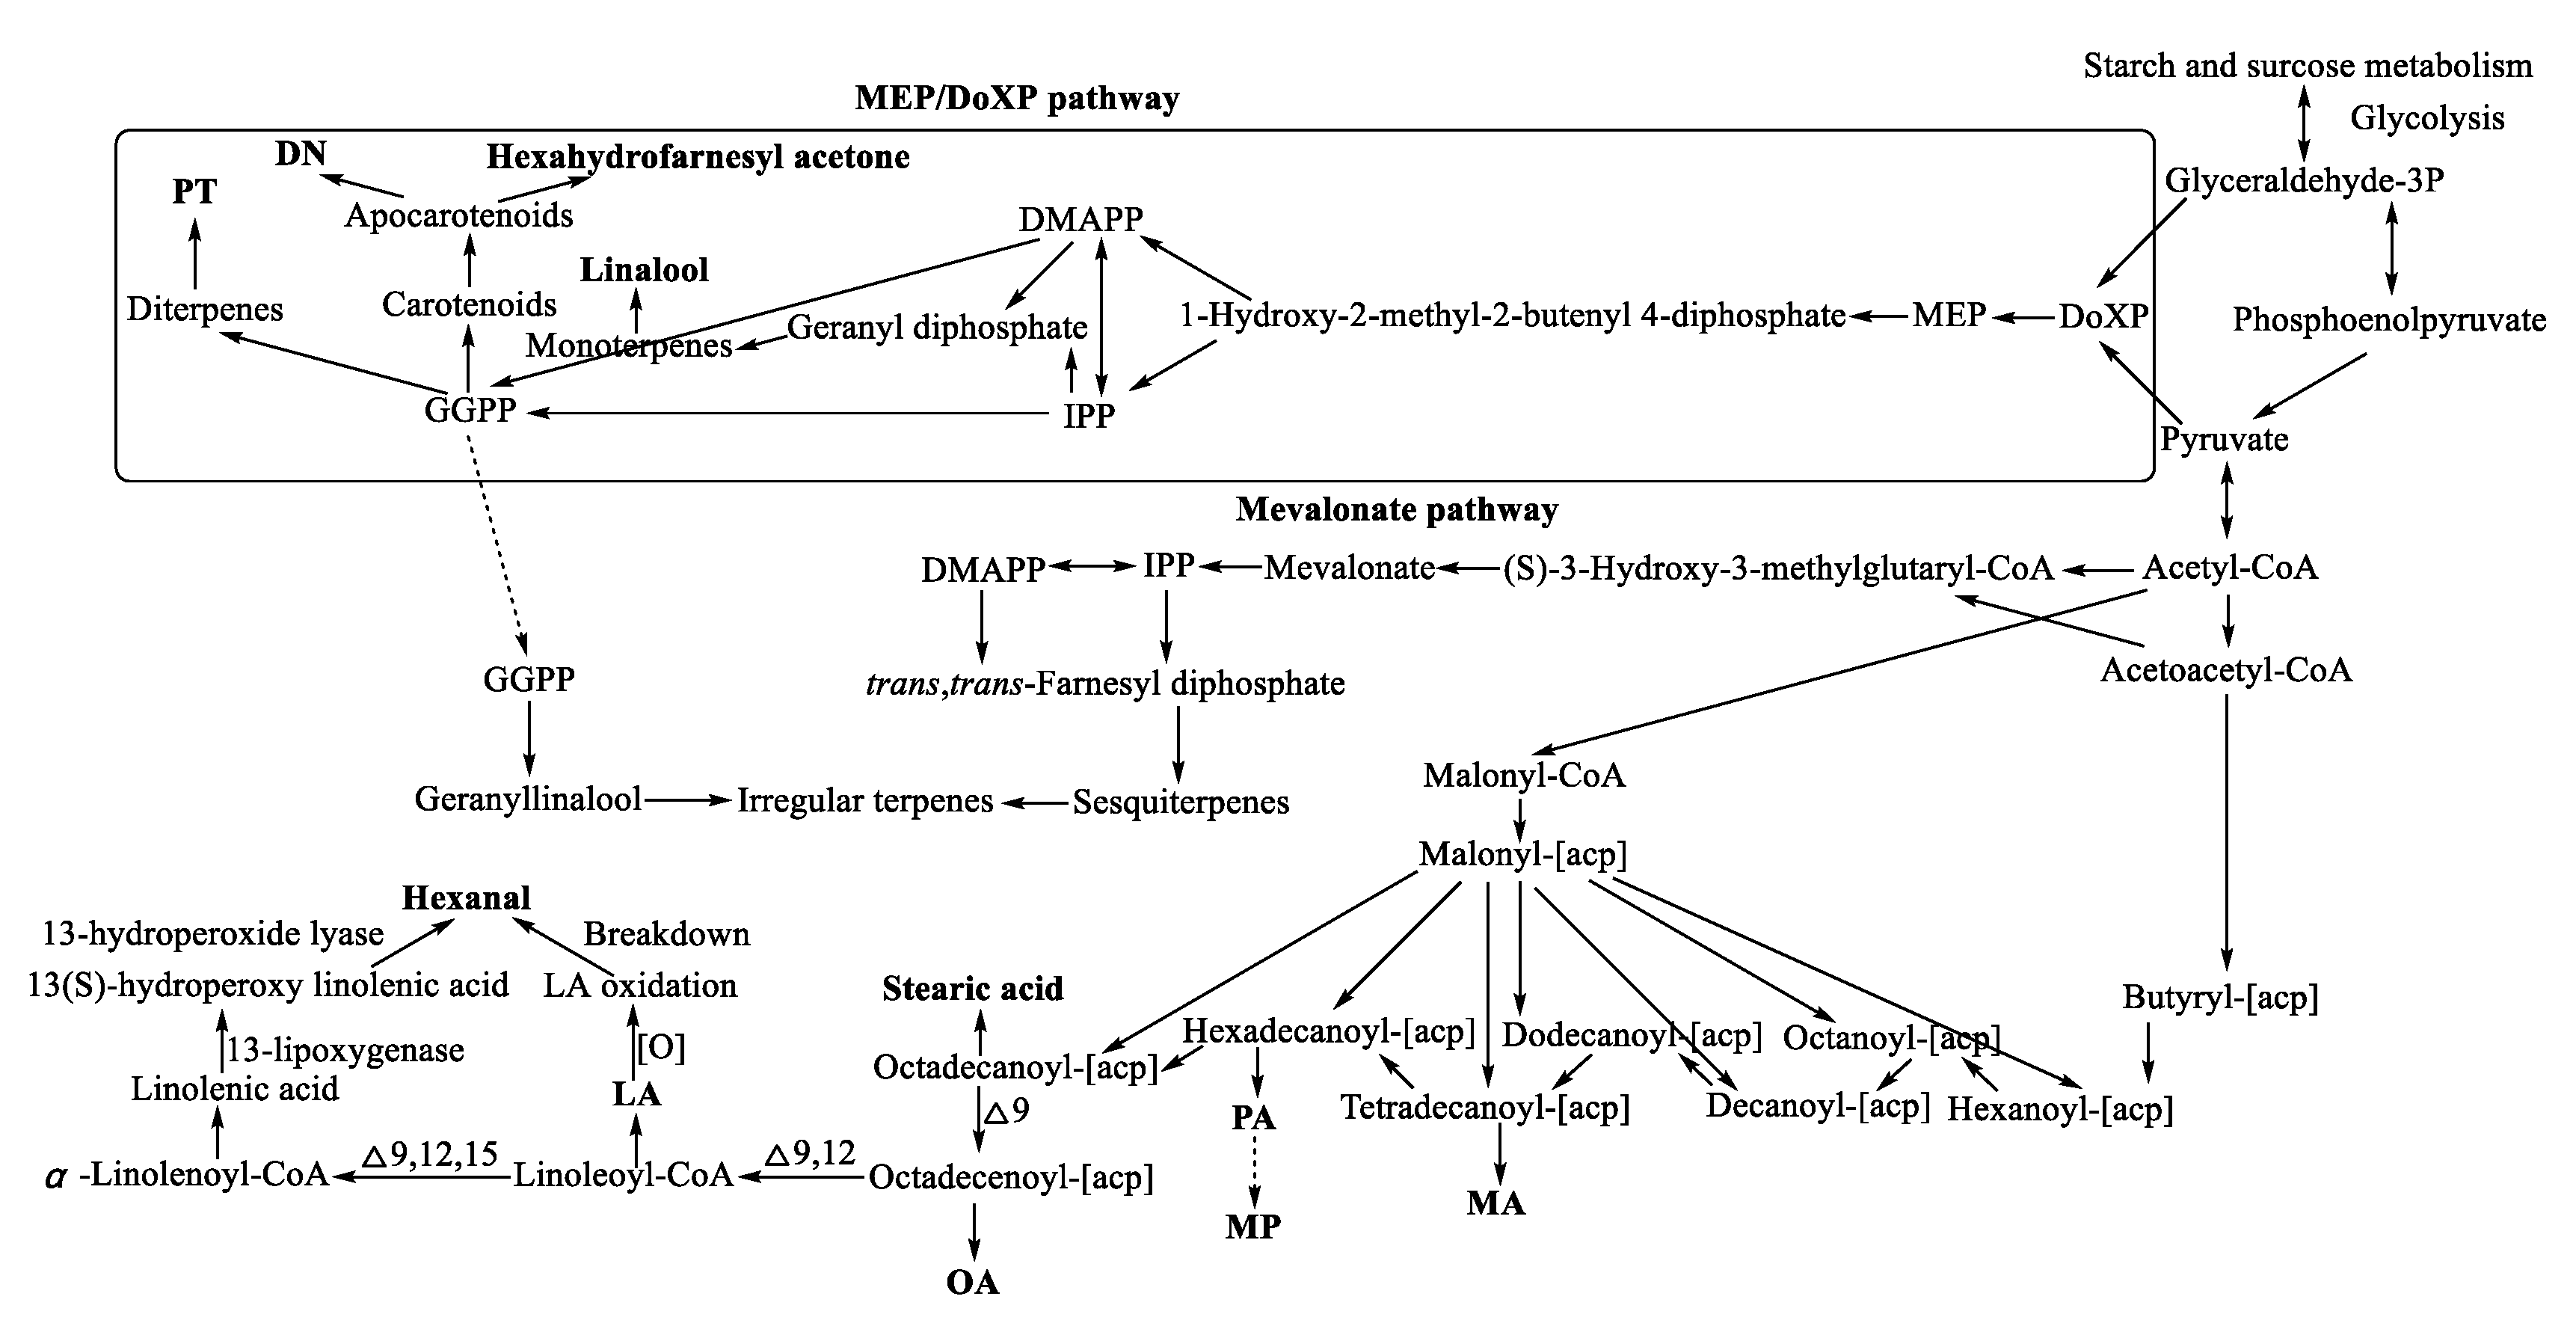

Table 1.
The origins of PR and the corresponding GenBank accession numbers of the ITS2 sequences, as mentioned in the previous study [30].
Table 1.
The origins of PR and the corresponding GenBank accession numbers of the ITS2 sequences, as mentioned in the previous study [30].
| Voucher No. | Sources | GPS Coordinates | GenBank Accession Number |
|---|---|---|---|
| L8 | BianBa, LeiWuQi and NaQu counties of Tibet | E: 93° W: 31° | KP699743/45-4750-51/54 |
| L9 | |||
| L10 |
Disclaimer/Publisher’s Note: The statements, opinions and data contained in all publications are solely those of the individual author(s) and contributor(s) and not of MDPI and/or the editor(s). MDPI and/or the editor(s) disclaim responsibility for any injury to people or property resulting from any ideas, methods, instructions or products referred to in the content. |
© 2024 by the authors. Licensee MDPI, Basel, Switzerland. This article is an open access article distributed under the terms and conditions of the Creative Commons Attribution (CC BY) license (http://creativecommons.org/licenses/by/4.0/).
Copyright: This open access article is published under a Creative Commons CC BY 4.0 license, which permit the free download, distribution, and reuse, provided that the author and preprint are cited in any reuse.


