Submitted:
07 February 2024
Posted:
07 February 2024
You are already at the latest version
Abstract
This study aimed to identify the most beneficial attitudes adopted by enterprise participants during their engagement in open-source software (OSS) activities. For this purpose, we selected repositories from GitHub, featuring the top 10 with the highest stars and forks, classified the participants according to their sentiment states, and compared their productivity. The results indicated that participants with positive sentiments were more productive than those with negative sentiments. Consequently, it can be inferred that encouraging organizations to express positive sentiments towards their developers publicly may stimulate OSS community activities and enhance productivity, thereby potentially leading to increased open innovation and sustainability.
Keywords:
open-source software
; collaboration
; sentiment analysis
1. Introduction
Open-source software (OSS) is defined as code made publicly accessible, allowing anyone to freely inspect, modify, and distribute it. Although some OSS projects are spearheaded by specific companies, most are community-based, with companies contributing to these projects by participating in the community [1]. Owing to the community-based nature of OSS, there is diversity in participants’ affiliations, and the development process is collaborative and involves collective intelligence. Linux is a prime example of OSS, whereas Windows exemplifies closed-source software, the antithesis of OSS [2,3]. Owing to the open nature of OSS, companies might be expected to shy away from it; however, in recent years, IT-based companies have been actively supporting it. This is because OSS plays a significant role in promoting open innovation in enterprises. OSS can be characterized as both inward-looking in terms of user innovation and collective intelligence, and outward-looking in terms of making internal projects public and encouraging external participation [4].
The UN Roadmap for Digital Cooperation partnered with GitHub, the world’s largest repository of OSS projects, to highlight and promote the importance of OSS in reducing the digital information divide and ensuring sustainability [5].
As part of these international efforts, the World Benchmarking Alliance (WBA), a coalition established to realize the UN Sustainable Development Goals (SDGs) and strengthen companies’ environmental, social, and governance (ESG) initiatives, has been conducting the Digital Inclusion Benchmark since 2020. This benchmark assesses how companies sustainably use digital technologies to support and engage with society. One of the evaluation criteria is the extent to which the organization is committed to OSS in innovation [6,7].
As OSS activities become increasingly important for open innovation and sustainability, organizations need to understand software projects and community-based collaboration better, and adopt appropriate strategies to increase productivity and efficiency. In general collaboration, building trust is important, and the attitudes of collaboration participants play an important role in building trust [8]. However, OSS collaboration differs from general collaboration in that the participants’ affiliations and locations vary, they have the freedom to join and leave, and they operate within a horizontal structure not bound by positions or titles.
However, the relationship between participant attitudes and productivity in collaboration in the software field has mainly been studied indirectly, e.g., by examining bug fixing time and email thread analysis [9,10,11], and studies that use metrics that can be directly related to productivity are scarce. In this study, we collected comments made by participants during their OSS contributions and categorized them into three groups: positive, neutral, and negative. We then conducted a productivity comparison study for each group to reveal the relationship between the OSS participants’ attitudes and productivity using direct indicators. Furthermore, we propose recommendations regarding the attitudes that corporate participants should adopt in OSS activities to maximize the benefits for their companies.
To achieve these objectives, this study addresses the following two questions.
- Is there a significant difference in the productivity of each sentiment group (positive, neutral, and negative)?
- Which groups are most conducive to community activation?
2. Theoretical Background and Review of Previous Studies
2.1. Collaboration Process in OSS
In OSS collaboration, a contributor typically copies the program source code from the main repository (repository) to their own repository (fork), adds/deletes/modifies the code, and subsequently requests that the altered source code be merged into the main repository upon the completion of their work (pull). This sequence of actions is referred to as the fork-and-pull model, as shown in Figure 1. In this process, the request for integration into the main repository is called a pull request (PR), which serves as the unit of work [12].
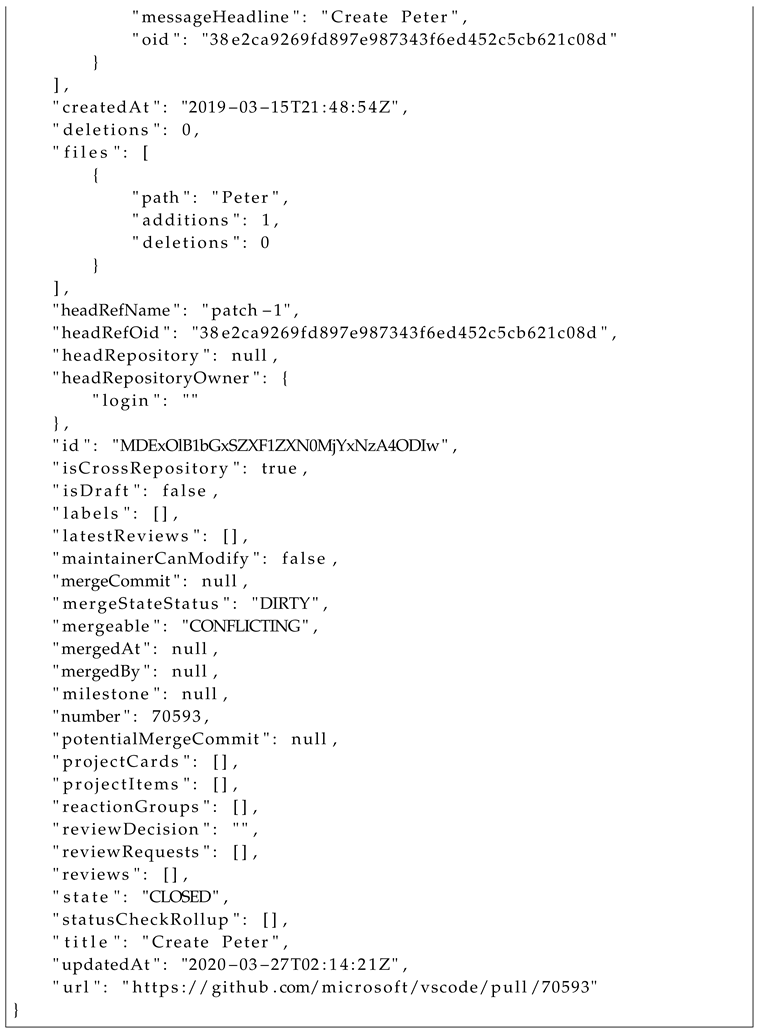
Upon submission of a PR to the main repository, the reviewers scrutinize the modified source code to verify that there are no issues and that the code complies with the rules governing the existing source code. If it passes the review, they will request the maintainer to decide whether to incorporate it into the main repository. The maintainer, at their discretion, may choose not to merge it into the main repository (closed) or may ask the contributor to undertake necessary modifications. If an administrator ultimately approves a merger, the contributor’s PR is integrated into the main repository (merged) [13,14]. Throughout this process, most communication between contributors, reviewers, and administrators takes place online, with dialogues recorded in GitHub PRs, as illustrated in Figure 2. If the repository becomes fully public, these records will become accessible to any Internet user.
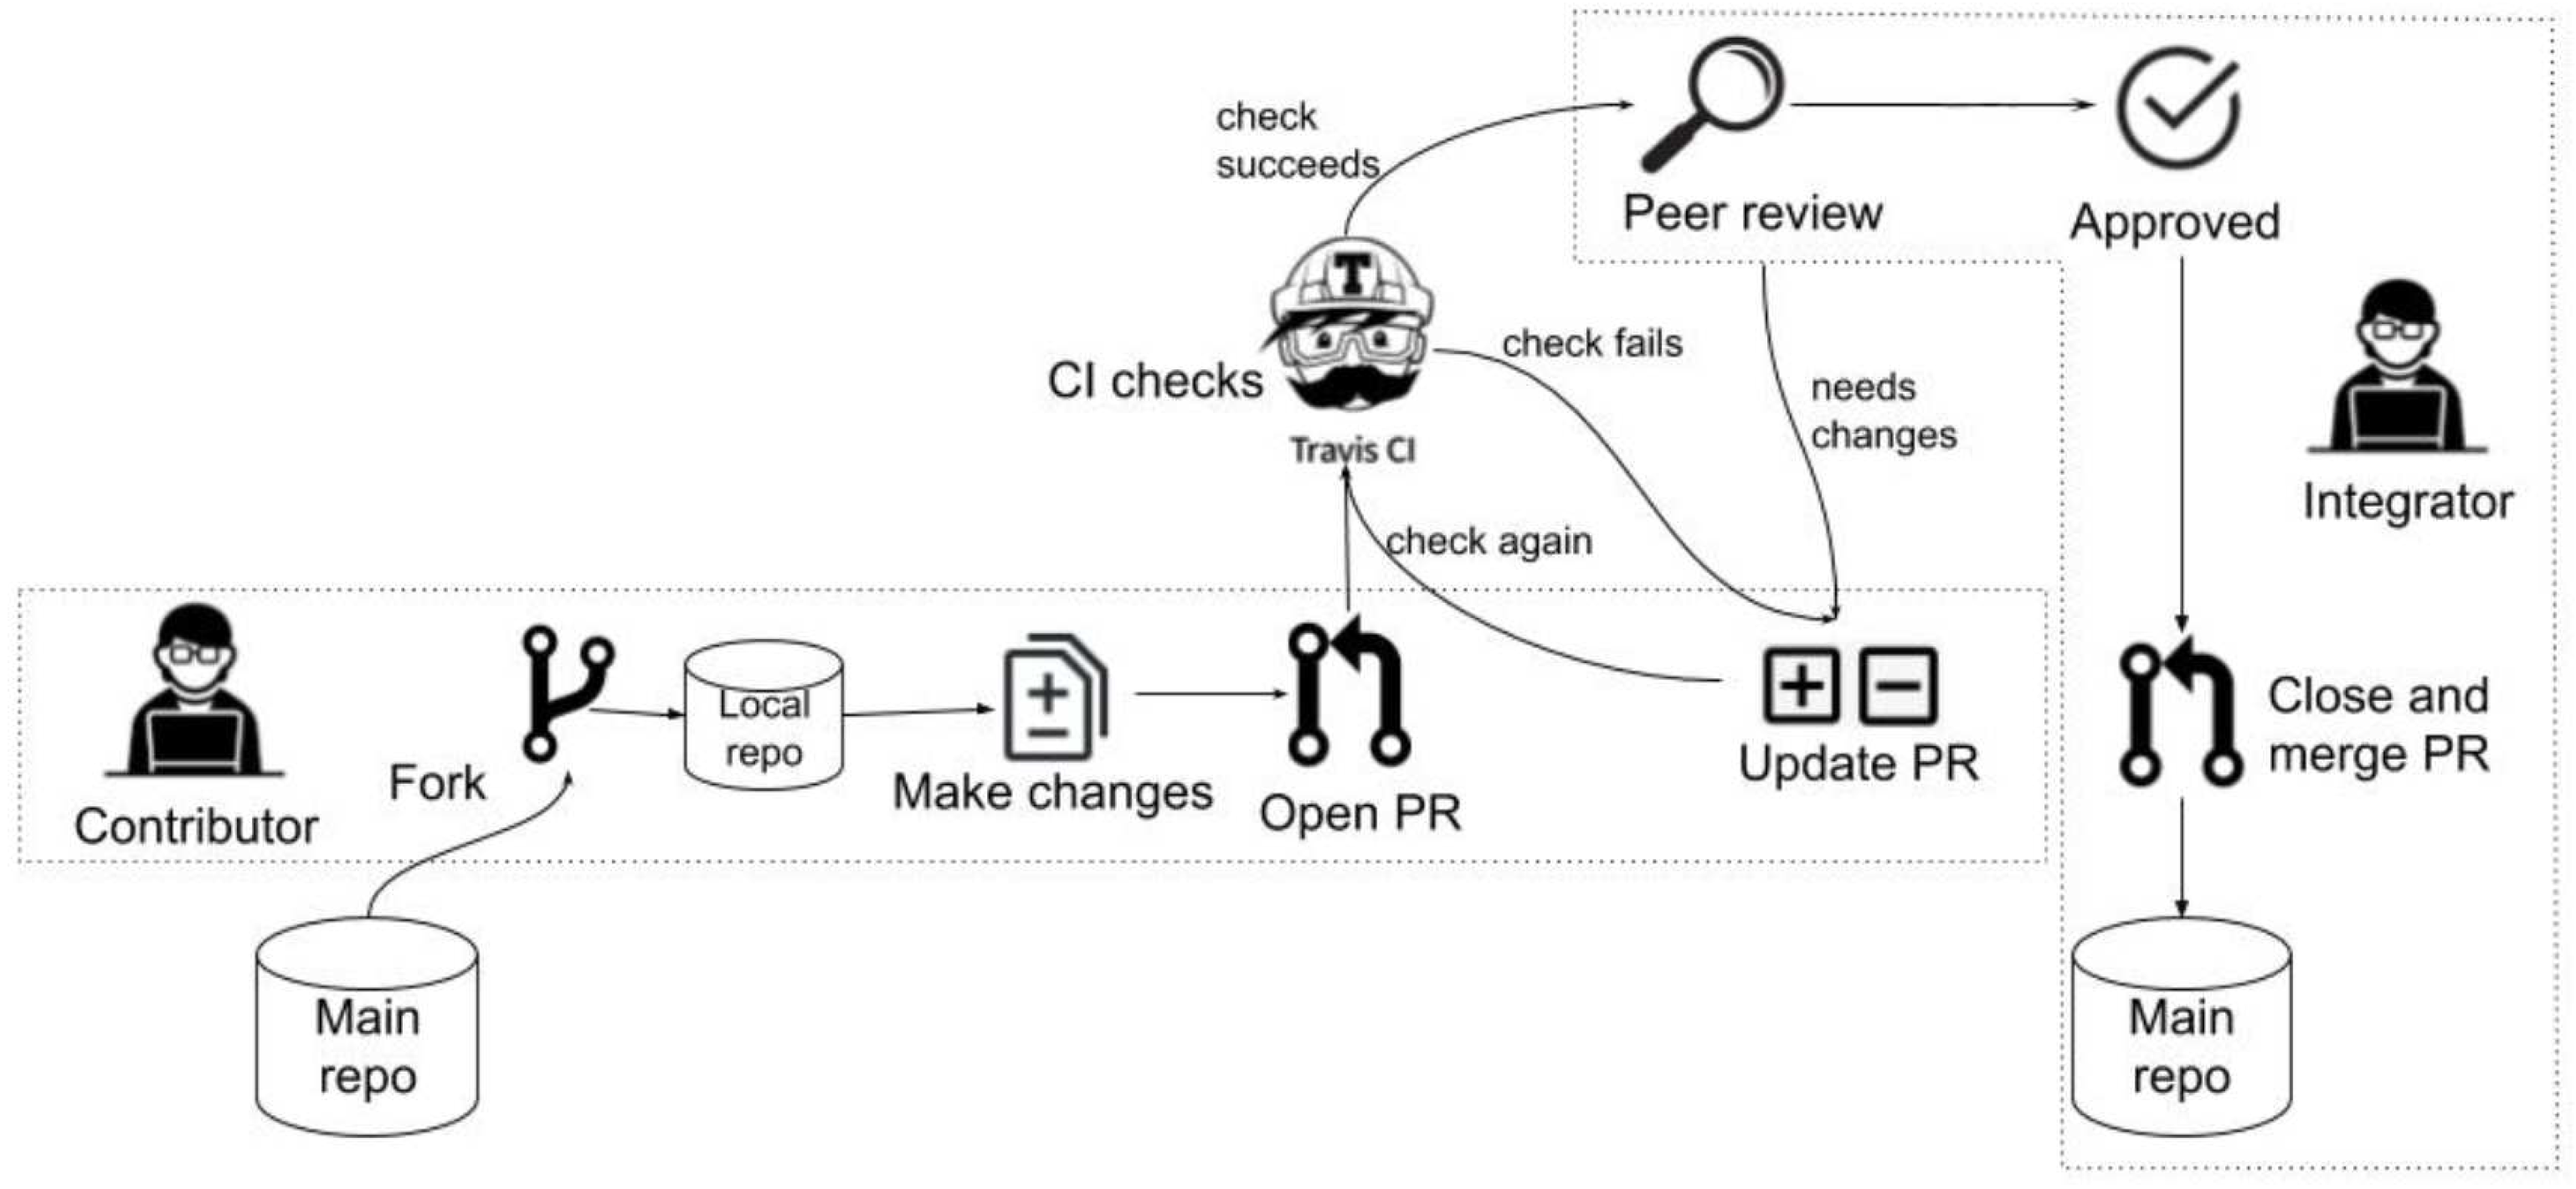
Figure 1.
Process flow until a PR is merged [15].
Figure 1.
Process flow until a PR is merged [15].
2.2. Productivity in Software
In software engineering, productivity is typically defined as either the number of tasks processed per unit time or the amount of code added, deleted, changed, or quantified as lines of code (LoCs) [17]. Zhou and Mockus [18] used the monthly work throughput as a metric to gauge productivity among new developers in software outsourcing, acknowledging the potential for individual variance in this process. Kieburtz et al. [19] proposed a productivity metric from the perspective of software reuse, defined as the volume of work completed within a given timeframe. Work throughput serves as an effective metric that is closely aligned with the number of PRs ultimately merged and offers distinct start and end dates. However, this approach can overshadow the significance of individual PRs, potentially underrepresenting the productivity of developers handling larger or more challenging PRs.
Regarding LoCs, Devanbu et al. [20] calculated productivity by dividing the total LoCs of the software by the time dedicated to development stages, including analysis, design, implementation, and testing, from a software reuse standpoint. Blackburn et al. [21] used a measure of LoCs divided by man-month to compare the productivity of the developers. This metric represents the quantity of code produced by a single developer within a month. Occasionally, productivity is quantified using alternative metrics to the LoCs, such as function points [22]. A function point serves as a metric for assessing the size of an information system and offers an indirect means of estimating productivity in system development and maintenance [23]. While LoCs can be readily measured by external researchers owing to the public accessibility of OSS, the function point method, which is predominantly internal, is seldom disclosed and rarely employed in OSS contexts, thus limiting its practical applicability. Another approach used the number of commits as a measure of productivity [24].
2.3. Collaborators’ Attitudes and Productivity
Guzman et al. [25] argued that software development is typically highly collaborative and that attitudes toward collaboration affect productivity, code quality, creativity, and job satisfaction. Supporting this claim, Ferreira et al. [11] analyzed conversations in the Linux community during a period when Linus Torvalds, the main developer of the Linux kernel known for his often negative tone, was on holiday. Their findings suggested that negative attitudes can detrimentally affect productivity. This indicates that the attitudes of developers who are heavily involved in OSS development can influence the overall productivity of OSS projects. Asri et al. [26] discovered that PRs take longer on average to close when a participant expresses a negative opinion during a review process. This indicates that, in OSS collaborations where unanimity or a majority is required for PR approval, additional time may be required to address or counteract negative opinions, potentially reducing productivity.
Previous studies on software bugs, which are indirectly related to productivity, demonstrated that bug fixes require less time when surrounded by positive sentiments. Furthermore, they showed that greater happiness-related sentiments in the developmental process correlate with higher quality and fewer bugs and vice versa [9,10]. This shows that a more positive participant attitude affects not only productivity but also the quality of the software and that reducing bugs can ultimately lead to an indirect increase in productivity by saving resources for bug fixes. Additionally, studies have indicated that code with bugs tend to attract more negative than neutral comments, on average [27]. This indicates that officials with negative attitudes may be more prone to introducing bugs, which may indirectly affect software productivity. Regarding community and collaboration, studies have shown that positive sentiments enhance willingness to collaborate and strengthen community cohesion [28], whereas rude responses create social barriers for new OSS contributors [29].
By contrast, some studies have suggested that teams exhibit varying attitudes when performing different tasks. These studies observed that sentimental attitudes are strongly linked to bug fixing but not necessarily to overall performance [30], indicating that the relationship between sentimental attitudes and productivity in software development remains unclear [31]. A study employing cluster analysis to categorize developers [32] concluded that different clusters are influenced by distinct factors that affect productivity. Another study [33] revealed that developers did not rank attitudes and sentiments among the top factors associated with productivity, in contrast to general knowledge workers who placed a higher emphasis on sentiment-related factors. In a study involving university students engaged in pair programming [34], it was concluded that attitude-related factors did not correlate with performance-related metrics, such as assignment and test scores or implementation time.
3. Research Methodology
Participants in OSS activities exhibit significant diversity in terms of residence, affiliation, and other factors, making Internet-based collaboration essential for such diverse groups. Consequently, the use of publicly available online repositories is crucial. Among various services such as GitHub, GitLab, and BitBucket, GitHub is recognized as the largest and most active repository service globally [35].
GitHub offers extensive information through its application programming interface (API), enabling the collection of a vast amount of data on PRs. The objective of data collection is to import the PR information gathered via the API into a database and subsequently transform it into a format suitable for statistical analysis using a structured query language. The methodology used in this study is illustrated in Figure 3.
The indicators to be analyzed are as follows:
- The Number of PRs merged out of all the PRs created by an individual;
- The total LoCs created by an individual, counting only those from merged PRs;
- LoCs per 1 merged PR (LoCs/PR);
- The number of comments made by individuals regarding PR. To gauge the community’s activity level, we collected data on the number of comments for the PRs of all statuses, not limited to those that were merged.
3.1. Selection of Target Repositories
While there are numerous repositories on GitHub, a significant number of them are inactive [36]. To identify repositories with a substantial number of contributors and to minimize the inclusion of inactive projects for more meaningful results, we utilized the GitHub API to query and compile a list of the top 100 repositories based on their stars and fork counts. A star serves as an indicator of interest [37] or satisfaction with a project [38], whereas a fork can be interpreted as a proactive intention to contribute to OSS within the fork-and-pull model [39]. From this list, we selected the top 10 repositories from both the star and fork categories. The selection was guided by the following rules:
- Exclude things that are not apparently software projects;
- Classify repositories that rank high in both stars and forks counts as high-ranking. For instance, if “react” is ranked 10th in star and 22nd in fork, it is categorized as star;
- Exclude repositories that are marked as “archived;”
- Exclude repositories that did not adhere to the fork-and-pull model [12].
Based on the above rules, 10 projects of each star/fork were selected, as shown in Table 1.
3.2. Collection of PR Number List
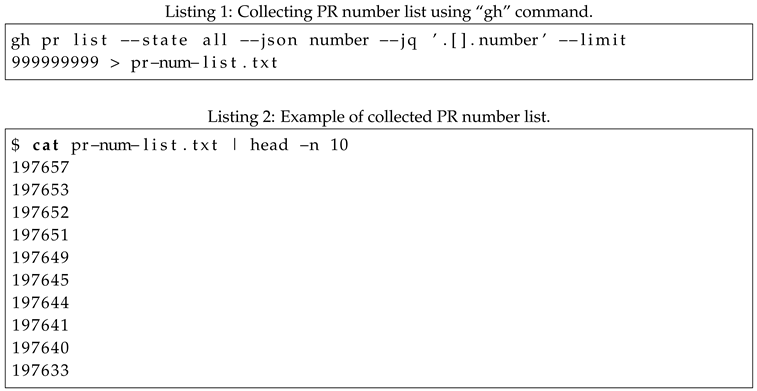
We collected a list of PR numbers using the GitHub API. The following command demonstrates how to call the GitHub API directly with “gh” to gather the PR number list of the repository.
The command in Listing 1 is executed to collect the number list and save it in the “pr-num-list.txt” file, as illustrated in Listing 2.
3.3. Collection of PR Detailed Information
Detailed information based on the PR numbers is acquired from Listings and 1 and 2.
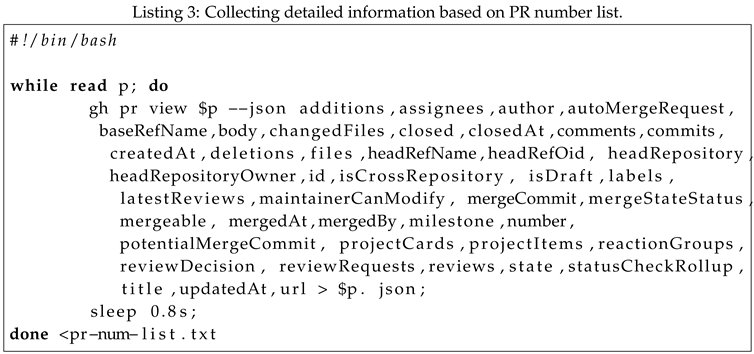
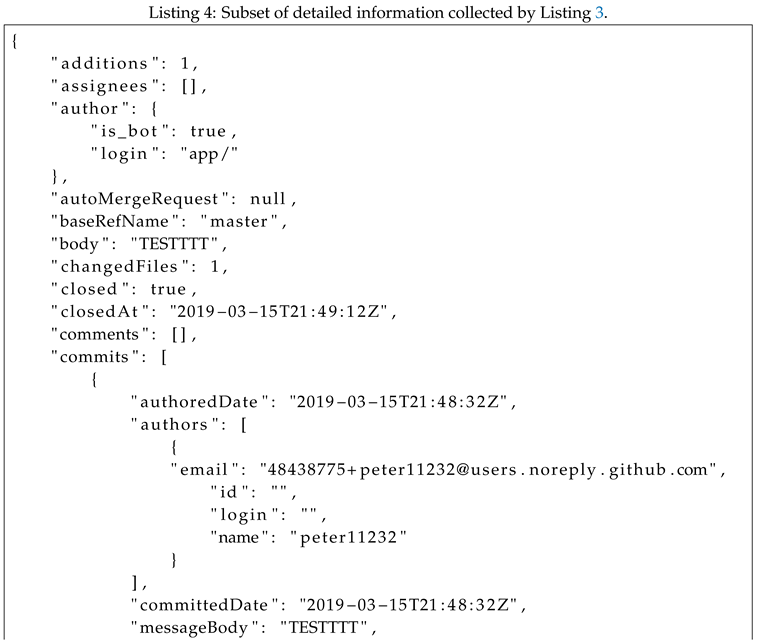
Using the commands in the Listing 3 processes, the PR number list is sequentially collected from Listing 2 from the beginning. This involves gathering detailed information for each PR number and outputting it as a JSON file, similar to that shown in Listing 4.
3.4. Database Loading
Following the analysis of the collected PR detail files, they were loaded into a database to process the research data. The analysis software was developed in Kotlin [40]. Given the numerous one-to-many relationships between PRs, comments, commits, and authors, these entities were separated into distinct tables with data interconnected using keys.
3.5. Sentiment Analysis Execution
We extracted comment data from the database and used sentiment analysis software to score the sentiment state of the comments. SentiStrength-SE [41] was used as the sentiment analysis software. This software builds on state-of-the-art SentiStrength [42]. It enhances accuracy by incorporating data specific to the software engineering domain and achieves rapid analysis through dictionary-based operations. SentiStrength is primarily used to analyze general SNS, and SentiStrength-SE is used in the software domain [43].
The sentiment score, the output value of SentiStrength-SE, ranges from -4 to 4. In this study, the sentiment scores of all the comments were averaged and classified into three groups based on the average number: positive if the average number was greater than 0, neutral if it was 0, and negative if it was less than 0.
3.6. Data Processing
The data were processed to perform a statistical analysis on the collected data until the sentiment state score was obtained.
First, the average number of comments and sentiment scores for each individual were collected from a comment-related table. Second, the numbers of PRs, total LoCs, and LoCs per PR were collected from the PR-related table. At this time, only merged PRs were targeted because they were finally reflected in the results. Third, the two datasets were merged based on individual identifiers. During this process, we deleted data that included only PRs without comments or only comments without PRs. Fourth, the data of the number of PRs, total LoCs, LoCs per PR, average comment sentiment score, and the number of comments were obtained for each individual.
3.7. Conducting Statistical Analysis
Statistical analyses were preformed based on the data generated in the above steps. As most of the data were not normally distributed, a nonparametric statistical analysis was applied. We divided sentiments into three groups: positive, neutral, and negative, and performed the following statistical analyses on the number of PRs, total LoCs, LoCs per PR, and the number of comments for each group. Two correlation methods were used to examine the tendency of correlation analysis under nonparametric statistical methods.
4. Results
The results of all 20 projects combined and the median and mean values of each indicator for each of the 10 star/fork projects are presented in Table 2, Table 3, and Table 4.
Overall, in both star and fork top 10 repositories, the positive group outperformed the other groups on all metrics. Across all 20 cases, the median number of PRs in the positive group was 2.0 and the mean was 17.37, indicating that they were the most active of the three groups. The median total LoCs was 86.0 and the mean was 9865.64, indicating a relatively high number of code contributions. The median LoCs/PR was 39.12 and the mean was 332.31, indicating that individual PRs contributed significantly to the code. The median number of comments was 6.0 and the mean was 91.65, indicating that the positive group participated in the community relatively frequently. For the neutral group, the median number of PRs was 1.0 and the mean was 3.22, indicating the least activity among the three groups. The median total LoCs was 17.0 and the mean was 620.69, indicating that they contributed the least amount of codes. The median LoCs/PR was 12.0 and the mean was 135.34, indicating that individual PRs contributed less code than the positive and negative groups. The median number of comments was 2.0 and the mean was 6.45, indicating relatively low engagement. For the negative group, the median number of PRs was 2.0 and the mean was 10.04, which was higher than that of the neutral group but lower than that of the positive group. The median total LoCs was 51.0 and the mean was 7661.10, indicating relatively high code contributions. The median LoCs/PR was 28.0 and the mean was 262.59, indicating that individual PRs contributed more code than the neutral group, but less than the positive group. The median number of comments was 5.0 and the mean was 46.23, which was also higher than that of the neutral group, but lower than that of the positive group.
For the top 10 star repositories, the positive group had the same median number of PRs as the overall group but a slightly lower average (median 1.0, average 16.65). The median (62.5) and mean (5832.69) of the total LoCs were also lower than the overall LoCs for the 20 repositories, and the median (34.4) and mean (201.42) of the LoCs/PR were also lower. This suggests that the number of individual PRs in the positive group in the star top 10 repositories was relatively small compared with the total of the 20 repositories. The median (4.0) and mean (55.96) comments were lower than the total number of comments. The neutral group also had lower mean and median values for all the metrics compared with the entire repository. The same was observed for the negative group.
For the top 10 fork repositories, the positive group showed a relatively high level of activity. The median number of PRs was 2.0, and the mean was 17.75, similar to all the repositories; however, the median total LoCs was 104.0 with a mean of 11991.10, indicating higher code contributions compared to those of the entire repository. The median LoCs/PR was 43.05 and the mean was 401.29, indicating a higher code contribution per individual PR compared with the entire repository. The median number of comments was 7.0 and the mean was 110.47, indicating high engagement compared with the entire repository. For the neutral group, the median number of PRs was 1.0 and the mean was 2.21, indicating a lower level of activity among the three groups. The median total LoCs was 17.0, with a the mean of 769.74, indicating that code contributions were relatively low among the three groups. The median LoCs/PR was 12.0 and the mean was 163.62, indicating low code contributions per individual PR. The median number of comments was 2.0 and the mean was 5.58, indicating relatively low engagement. The negative group had a median number of PRs of 2.0 and a mean of 9.22. The median total LoCs was 58.0 and the mean was 9589.11, indicating higher code contributions than the neutral group, but lower than the positive group. The LoCs/PR has a median of 29.0 and a mean of 312.71, which follows the same pattern as the total LoCs. The median number of comments was 6.0 and the mean was 53.45, indicating higher engagement than the neutral group but lower engagement than the positive group.
The ranking order by sentiment group was consistently positive, negative, and neutral in all cases.
In terms of median values, the top 10 fork repositories demonstrated superiority over the top 10 star repositories in all the metrics, except for the number of PRs, LoCs/PR, and total LoCs in the neutral group. On average, the top 10 fork repositories ranked higher across most metrics, with the exception of the number of PRs and comments in the neutral group and the number of PRs in the negative group. Notably, in the positive group, the difference was almost twofold in all the metrics except the number of PRs. In the neutral group, the total LoCs and LoCs/PR showed a difference of more than three-fold, similar to the total LoCs in the negative group.
To confirm the aforementioned results, both the Kruskal–Wallis H test and Mann–Whitney U test were conducted. In the Mann–Whitney U test, the p-value was set to 0.017 (derived by dividing the standard 0.05 by 3, the number of comparison groups, approximating 0.016), in line with the Bonferroni correction [51,52].

Table 5.
Test results for all 20 repositories.
| Category | Kruskal–Wallis H Test | Mann–Whitney U Test | ||||||
| Positive-Neutral | Neutral-Negative | Positive-Negative | ||||||
| Statistic | p-value | Statistic | p-value | Statistic | p-value | Statistic | p-value | |
| No. of PRs | 1586.55 | <0.001 | 60981076.0 | <0.001 | 13562406.0 | <0.001 | 26904913.0 | <0.001 |
| Total LoCs | 1790.90 | <0.001 | 63403497.0 | <0.001 | 13324718.0 | <0.001 | 25763927.5 | <0.001 |
| LoCs/PR | 1172.00 | <0.001 | 60285774.5 | <0.001 | 14415289.5 | <0.001 | 26014063.0 | <0.001 |
| Comments | 3971.18 | <0.001 | 70109454.5 | <0.001 | 9059851.5 | <0.001 | 27658384.5 | <0.001 |
Table 6.
Test results for top 10 star repositories.
| Category | Kruskal–Wallis H Test | Mann–Whitney U Test | ||||||
| Positive-Neutral | Neutral-Negative | Positive-Negative | ||||||
| Statistic | p-value | Statistic | p-value | Statistic | p-value | Statistic | p-value | |
| No. of PRs | 394.82 | <0.001 | 6973654.0 | <0.001 | 1548296.5 | <0.001 | 2894748.0 | <0.01 |
| Total LoCs | 460.53 | <0.001 | 7270662.5 | <0.001 | 1501109.0 | <0.001 | 2789273.5 | <0.001 |
| LoCs/PR | 304.90 | <0.001 | 6954815.0 | <0.001 | 1596388.0 | <0.001 | 2811140.5 | <0.001 |
| Comments | 1300.30 | <0.001 | 8260316.5 | <0.001 | 995769.0 | <0.001 | 2969978.5 | 0.035 * |
* Not significant because it was less than the usual p-value criterion of 0.05 but more than the criterion based on the Bonferroni correction.
Table 7.
Test results for top 10 fork repositories.
| Category | Kruskal–Wallis H Test | Mann–Whitney U Test | ||||||
| Positive-Neutral | Neutral-Negative | Positive-Negative | ||||||
| Statistic | p-value | Statistic | p-value | Statistic | p-value | Statistic | p-value | |
| No. of PRs | 1211.81 | <0.001 | 26721644.0 | <0.001 | 5952711.0 | <0.001 | 12032923.5 | <0.001 |
| Total LoCs | 1345.71 | <0.001 | 27723557.0 | <0.001 | 5891048.0 | <0.001 | 11501190.5 | <0.001 |
| LoCs/PR | 873.12 | <0.001 | 26267469.5 | <0.001 | 6420072.5 | <0.001 | 11654302.5 | <0.001 |
| Comments | 2713.92 | <0.001 | 30344676.5 | <0.001 | 4051938.5 | <0.001 | 12328809.5 | <0.001 |
The Kruskal–Wallis H test was conducted to examine the differences among the three groups (positive, neutral, and negative) for each metric across all 20 repositories. The test yielded a p-value of <0.001 for all metrics, indicating a statistically significant difference among the three groups for all the characteristics. The Mann–Whitney U test was employed to validate the differences between each pair of groups further, revealing a p-value of <0.001 for all the comparisons. This indicates that there was a statistically significant difference between the two groups in all the cases. For the top 10 fork repositories, the results were similar to those of the overall analyses. However, for the top 10 star repositories, the Mann–Whitney U test comparing the positive and negative groups for the comment count indicator yielded a p-value of 0.035. Although this result is typically deemed statistically significant, it was not considered in this context because it exceeded the p-value threshold of 0.017 set by the Bonferroni correction method.
The correlation between each indicator was analyzed using two methods to ensure accuracy: Spearman correlation and Kendall’s tau correlation. However, because of the strong correlation between the total LoCs and LoCs/PR, this relationship was excluded from the analysis, focusing instead on comparisons involving the total LoCs when relevant.
Table 8.
Correlation analysis results for all 20 repositories.
| Category | Spearman | Kendall’s Tau | |||
| Correlation Coefficient | p-value | Correlation Coefficient | p-value | ||
| ]3*Positive | No. of PRs vs. Total LoCs |
0.6944 | <0.001 | 0.5549 | <0.001 |
| No. of PRs vs. Comments |
0.6793 | <0.001 | 0.5541 | <0.001 | |
| Total LoCs vs. Comments |
0.6025 | <0.001 | 0.4465 | <0.001 | |
| Neutral | No. of PRs vs. Total LoCs |
0.4585 | <0.001 | 0.3722 | <0.001 |
| No. of PRs vs. Comments |
0.3626 | <0.001 | 0.3156 | <0.001 | |
| Total LoCs vs. Comments |
0.3427 | <0.001 | 0.2614 | <0.001 | |
| Negative | No. of PRs vs. Total LoCs |
0.6471 | <0.001 | 0.5157 | <0.001 |
| No. of PRs vs. Comments |
0.5908 | <0.001 | 0.4779 | <0.001 | |
| Total LoCs vs. Comments |
0.5294 | <0.001 | 0.3875 | <0.001 | |
Table 9.
Correlation analysis results for top 10 star repositories.
| Category | Spearman | Kendall’s Tau | |||
| Correlation Coefficient | p-value | Correlation Coefficient | p-value | ||
| Positive | No. of PRs vs. Total LoCs |
0.6610 | <0.001 | 0.5335 | <0.001 |
| No. of PRs vs. Comments |
0.6076 | <0.001 | 0.4992 | <0.001 | |
| Total LoCs vs. Comments |
0.5687 | <0.001 | 0.4247 | <0.001 | |
| Neutral | No. of PRs vs. Total LoCs |
0.4259 | <0.001 | 0.3458 | <0.001 |
| No. of PRs vs. Comments |
0.3176 | <0.001 | 0.2808 | <0.001 | |
| Total LoCs vs. Comments |
0.3066 | <0.001 | 0.2360 | <0.001 | |
| Negative | No. of PRs vs. Total LoCs |
0.6187 | <0.001 | 0.4999 | <0.001 |
| No. of PRs vs. Comments |
0.5344 | <0.001 | 0.4388 | <0.001 | |
| Total LoCs vs. Comments |
0.5190 | <0.001 | 0.3841 | <0.001 | |
Table 10.
Correlation analysis results for top 10 fork repositories.
| Category | Spearman | Kendall’s Tau | |||
| Correlation Coefficient | p-value | Correlation Coefficient | p-value | ||
| Positive | No. of PRs vs. Total LoCs |
0.7077 | <0.001 | 0.5623 | <0.001 |
| No. of PRs vs. Comments |
0.7113 | <0.001 | 0.5799 | <0.001 | |
| Total LoCs vs. Comments |
0.6159 | <0.001 | 0.4550 | <0.001 | |
| Neutral | No. of PRs vs. Total LoCs |
0.4740 | <0.001 | 0.3847 | <0.001 |
| No. of PRs vs. Comments |
0.3840 | <0.001 | 0.3319 | <0.001 | |
| Total LoCs vs. Comments |
0.3617 | <0.001 | 0.2752 | <0.001 | |
| Negative | No. of PRs vs. Total LoCs |
0.6552 | <0.001 | 0.5192 | <0.001 |
| No. of PRs vs. Comments |
0.6097 | <0.001 | 0.4912 | <0.001 | |
| Total LoCs vs. Comments |
0.5292 | <0.001 | 0.3864 | <0.001 | |
In all the cases, the positive groups were moderately or strongly correlated [53]. Similar to the behavior of the median and mean values, the correlation coefficients were in the order: positive > negative > neutral. Both the positive and negative groups exhibited at least a moderate correlation according to Spearman’s correlation and a minimum correlation coefficient of 0.38 according to Kendall’s tau correlation. However, the correlation coefficients for the neutral group varied from 0.4 to 0.3, decreasing to a low value of 0.23 as per Kendall’s tau correlation.
5. Discussion
In both the 20 repositories and the top 10 star/fork repositories, the positive group exhibited higher values across all the metrics than the other groups, indicating that they were more productive and actively engaged in the community. For all 20 repositories, the positive group was dominant across all the metrics. The neutral group had the lowest values for all the metrics, whereas the negative group was in the middle. The behavior of the top 10 star and top 10 fork repositories across most metrics was similar to that of the entire 20 repositories. The statistical tests showed that the number of PRs, total LoCs, LoCs/PR, and comments were all statistically significantly different between the sentiment groups in the entire 20 repositories and the star/fork top 10 repositories. The correlation analysis showed positive correlations in all the cases. This suggests that these metrics are interrelated. The results were consistently positive, negative, and neutral, which indicates that those who projected some form of sentiment onto the project, whether positive or negative, contributed more than those who did not.
Based on the above results, a positive attitude can play an important role in collaboration and participation in OSS projects. These results also indicate that it is important for organizations to create a positive environment for developers working on OSS projects.
The existing literature predominantly focuses on indirect methods, including the sentiment analysis of email threads [11], examining the relationship between a PR’s sentimental state and its approval time and status [26], and the correlation between sentiments and the time and frequency of bug fixes [9,10]. This is because software development is difficult to quantify because it relies on human intellectual activity, and not all indicators, such as sentiment score and production volume, are easy to analyze statistically. However, this study demonstrates that nonparametric statistics based on direct indicators, such as appraisal score and LoCs, can effectively illustrate the superiority and correlations between groups through direct methods by establishing comparison groups. This provides insight into how similar methods can be applied in future studies.
Furthermore, actively engaging in OSS activities can eventually lead to open innovation [4], which can also be beneficial in terms of sustainability [6,7]. Appropriate open-source technologies based on OSS can make a significant contribution to global sustainability, not just at the level of a single organization [54]. According to a UNDP report [55], OSS has the potential to lower barriers to ICT adoption in developing countries worldwide, ultimately contributing to sustainable human development.
Rethinking the productivity and community-enabling aspects of OSS projects can be beneficial from a global perspective, as well as fostering open innovation and sustainability that enterprises seek.
6. Conclusion
In this study, we demonstrated that it is possible to use direct indicators by analyzing direct productivity indicators (LoCs) and sentiment scores through nonparametric statistical techniques to overcome uncertainties in productivity measurement methods using existing indirect indicators and other uncertainties. In addition, companies can contribute to sustainability at the national and global levels by promoting OSS activities, not only for open innovation, but also for sustainability at the company level.
There are several repositories in GitHub; however, owing to physical limitations, it is not possible to conduct the above analysis for all repositories. It is also challenging to provide an evident explanation of the consistently low performance of the neutral group across all metrics. It is speculated that most contributors make one-off contributions rather than consistent contributions; hence, they do not have to show much sentiment and, therefore, are not particularly productive or engaged in the community; however, this needs to be studied more closely. Quantifying human sentiment inevitably introduces distortion.
It would be interesting to collect data on the duration of each individual’s activity and use them to determine whether the neutral group is indeed significantly shorter (i.e., only making one-time contributions). As an individual may contribute to multiple projects, it may be worthwhile to study whether the sentiment expressed by this individual varies from project to project, and if so, whether the individual’s productivity varies between projects, or whether the individual consistently expresses the same sentiment across all projects.
Author Contributions
Conceptualization, J.L.; methodology, J.L.; software, J.L.; validation, J.L.; formal analysis, J.L.; writing—original draft preparation, J.L.; writing—review and editing, J.L. and K.C.; supervision, K.C. All authors have read and agreed to the published version of the manuscript.
Funding
This research received no external funding.
Institutional Review Board Statement
Not applicable.
Informed Consent Statement
Not applicable.
Data Availability Statement
Publicly available datasets were analyzed in this study. This data can be found here: https://www.github.com.
Conflicts of Interest
The authors declare no conflicts of interest.
References
- Fuggetta, A. Open Source Software––an Evaluation. Journal of Systems and Software 2003, 66, 77–90. [Google Scholar] [CrossRef]
- Paulson, J.; Succi, G.; Eberlein, A. An Empirical Study of Open-Source and Closed-Source Software Products. IEEE Transactions on Software Engineering 2004, 30, 246–256. [Google Scholar] [CrossRef]
- Dalle, J.M.; Jullien, N. Windows vs. Linux: Some Explorations into the Economics of Free Software. Advances in Complex Systems 2000, 03, 399–416. [Google Scholar] [CrossRef]
- West, J.; Gallagher, S. Challenges of Open Innovation: The Paradox of Firm Investment in Open-Source Software. R&D Management 2006, 36, 319–331. [Google Scholar] [CrossRef]
- Guterres, A. Roadmap for Digital Cooperation; United Nations, 2020.
- World Benchmarking Alliance. Digital Inclusion Benchmark 2023 Insights Report; World Benchmarking Alliance, 2023.
- World Benchmarking Alliance. Digital Inclusion Benchmark 2021 Scoring guidelines; World Benchmarking Alliance, 2021.
- Jones, G.R.; George, J.M. The Experience and Evolution of Trust: Implications for Cooperation and Teamwork. The Academy of Management Review 1998, 23, 531–259293. [Google Scholar] [CrossRef]
- Ortu, M.; Adams, B.; Destefanis, G.; Tourani, P.; Marchesi, M.; Tonelli, R. Are Bullies More Productive? Empirical Study of Affectiveness vs. Issue Fixing Time. 2015 IEEE/ACM 12th Working Conference on Mining Software Repositories. IEEE, 2015, pp. 303–313. [CrossRef]
- Carige Junior, R.; Carneiro, G. Impact of Developers Sentiments on Practices and Artifacts in Open Source Software Projects: A Systematic Literature Review:. Proceedings of the 22nd International Conference on Enterprise Information Systems. SCITEPRESS - Science and Technology Publications, 2020, pp. 31–42. [CrossRef]
- Ferreira, I.; Stewart, K.; German, D.; Adams, B. A Longitudinal Study on the Maintainers’ Sentiment of a Large Scale Open Source Ecosystem. 2019 IEEE/ACM 4th International Workshop on Emotion Awareness in Software Engineering (SEmotion). IEEE, 2019, pp. 17–22. [CrossRef]
- Padhye, R.; Mani, S.; Sinha, V.S. A Study of External Community Contribution to Open-Source Projects on GitHub. Proceedings of the 11th Working Conference on Mining Software Repositories. ACM, 2014, pp. 332–335. [CrossRef]
- Soares, D.M.; De Lima Júnior, M.L.; Murta, L.; Plastino, A. Acceptance Factors of Pull Requests in Open-Source Projects. Proceedings of the 30th Annual ACM Symposium on Applied Computing. ACM, 2015, pp. 1541–1546. [CrossRef]
- Gousios, G.; Pinzger, M.; Deursen, A.V. An Exploratory Study of the Pull-Based Software Development Model. Proceedings of the 36th International Conference on Software Engineering. ACM, 2014, pp. 345–355. [CrossRef]
- Guo, Y.; Leitner, P. Studying the Impact of CI on Pull Request Delivery Time in Open Source Projects—a Conceptual Replication. PeerJ Computer Science 2019, 5, e245. [Google Scholar] [CrossRef] [PubMed]
- LINE. Enable to receive compressed request from client by joonhaeng · Pull Request #3087 · line/armeria. https://github.com/line/armeria/pull/3087, accessed on 2024-01-21.
- Meyer, A.N.; Fritz, T.; Murphy, G.C.; Zimmermann, T. Software Developers’ Perceptions of Productivity. Proceedings of the 22nd ACM SIGSOFT International Symposium on Foundations of Software Engineering. ACM, 2014, pp. 19–29. [CrossRef]
- Zhou, M.; Mockus, A. Developer Fluency: Achieving True Mastery in Software Projects. Proceedings of the Eighteenth ACM SIGSOFT International Symposium on Foundations of Software Engineering. ACM, 2010, pp. 137–146. [CrossRef]
- Kieburtz, R.; McKinney, L.; Bell, J.; Hook, J.; Kotov, A.; Lewis, J.; Oliva, D.; Sheard, T.; Smith, I.; Walton, L. A Software Engineering Experiment in Software Component Generation. Proceedings of IEEE 18th International Conference on Software Engineering, 1996, pp. 542–552. [CrossRef]
- Devanbu, P.; Karstu, S.; Melo, W.; Thomas, W. Analytical and Empirical Evaluation of Software Reuse Metrics. Proceedings of IEEE 18th International Conference on Software Engineering. IEEE Comput. Soc. Press, 1996, pp. 189–199. [CrossRef]
- Blackburn, J.; Scudder, G.; Van Wassenhove, L. Improving Speed and Productivity of Software Development: A Global Survey of Software Developers. IEEE Transactions on Software Engineering 1996, 22, 875–885. [Google Scholar] [CrossRef]
- Delorey, D.P.; Knutson, C.D.; Chun, S. Do Programming Languages Affect Productivity? A Case Study Using Data from Open Source Projects. First International Workshop on Emerging Trends in FLOSS Research and Development (FLOSS’07: ICSE Workshops 2007). IEEE, 2007, pp. 8–8. [CrossRef]
- Symons, C. Function Point Analysis: Difficulties and Improvements. IEEE Transactions on Software Engineering 1988, 14, 2–11. [Google Scholar] [CrossRef]
- Jiang, Q.; Lee, Y.C.; Davis, J.G.; Zomaya, A.Y. Diversity, Productivity, and Growth of Open Source Developer Communities. 2018, arXiv:cs.SE/1809.03725. [Google Scholar]
- Guzman, E.; Azócar, D.; Li, Y. Sentiment Analysis of Commit Comments in GitHub: An Empirical Study. Proceedings of the 11th Working Conference on Mining Software Repositories. ACM, 2014, pp. 352–355. [CrossRef]
- Asri, I.E.; Kerzazi, N.; Uddin, G.; Khomh, F.; Janati Idrissi, M. An Empirical Study of Sentiments in Code Reviews. Information and Software Technology 2019, 114, 37–54. [Google Scholar] [CrossRef]
- Huq, S.F.; Sadiq, A.Z.; Sakib, K. Is Developer Sentiment Related to Software Bugs: An Exploratory Study on GitHub Commits. 2020 IEEE 27th International Conference on Software Analysis, Evolution and Reengineering (SANER). IEEE, 2020, pp. 527–531. [CrossRef]
- Li, L.; Cao, J.; Lo, D. Sentiment Analysis over Collaborative Relationships in Open Source Software Projects. Proceedings of the International Conference on Software Engineering and Knowledge Engineering, 2020.
- Steinmacher, I.; Conte, T.; Gerosa, M.A.; Redmiles, D. Social Barriers Faced by Newcomers Placing Their First Contribution in Open Source Software Projects. Proceedings of the 18th ACM Conference on Computer Supported Cooperative Work & Social Computing. ACM, 2015, pp. 1379–1392. [CrossRef]
- Licorish, S.A.; MacDonell, S.G. Exploring the Links between Software Development Task Type, Team Attitudes and Task Completion Performance: Insights from the Jazz Repository. Information and Software Technology 2018, 97, 10–25. [Google Scholar] [CrossRef]
- Wagner, S.; Ruhe, M. A Systematic Review of Productivity Factors in Software Development. 2nd International Workshop on Software Productivity Analysis and Cost Estimation (SPACE 2008), 2018, [1801.06475].
- Meyer, A.N.; Zimmermann, T.; Fritz, T. Characterizing Software Developers by Perceptions of Productivity. 2017 ACM/IEEE International Symposium on Empirical Software Engineering and Measurement (ESEM), 2017, pp. 105–110. [CrossRef]
- Murphy-Hill, E.; Jaspan, C.; Sadowski, C.; Shepherd, D.; Phillips, M.; Winter, C.; Knight, A.; Smith, E.; Jorde, M. What Predicts Software Developers’ Productivity? IEEE Transactions on Software Engineering 2021, 47, 582–594. [Google Scholar] [CrossRef]
- Satratzemi, M.; Xinogalos, S.; Tsompanoudi, D.; Karamitopoulos, L. Examining Student Performance and Attitudes on Distributed Pair Programming. Scientific Programming, 2018, 1–8. [CrossRef]
- Kalliamvakou, E.; Gousios, G.; Blincoe, K.; Singer, L.; German, D.M.; Damian, D. The Promises and Perils of Mining GitHub. Proceedings of the 11th Working Conference on Mining Software Repositories. ACM, 2014, pp. 92–101. [CrossRef]
- Kalliamvakou, E.; Gousios, G.; Blincoe, K.; Singer, L.; German, D.M.; Damian, D. An In-Depth Study of the Promises and Perils of Mining GitHub. Empirical Software Engineering 2016, 21, 2035–2071. [Google Scholar] [CrossRef]
- Du, K.; Yang, H.; Zhang, Y.; Duan, H.; Wang, H.; Hao, S.; Li, Z.; Yang, M. Understanding Promotion-as-a-Service on GitHub. Annual Computer Security Applications Conference. ACM, 2020, pp. 597–610. [CrossRef]
- Borges, H.; Hora, A.; Valente, M.T. Understanding the Factors That Impact the Popularity of GitHub Repositories. 2016 IEEE International Conference on Software Maintenance and Evolution (ICSME), 2016, pp. 334–344, [1606.04984]. [CrossRef]
- Jiang, J.; Lo, D.; He, J.; Xia, X.; Kochhar, P.S.; Zhang, L. Why and How Developers Fork What from Whom in GitHub. Empirical Software Engineering 2017, 22, 547–578. [Google Scholar] [CrossRef]
- Jemerov, D.; Isakova, S. Kotlin in action; Simon and Schuster, 2017.
- Islam, M.R.; Zibran, M.F. SentiStrength-SE: Exploiting Domain Specificity for Improved Sentiment Analysis in Software Engineering Text. Journal of Systems and Software 2018, 145, 125–146. [Google Scholar] [CrossRef]
- Thelwall, M.; Buckley, K.; Paltoglou, G. Sentiment Strength Detection for the Social Web. Journal of the American Society for Information Science and Technology 2012, 63, 163–173. [Google Scholar] [CrossRef]
- Obaidi, M.; Nagel, L.; Specht, A.; Klünder, J. Sentiment Analysis Tools in Software Engineering: A Systematic Mapping Study. Information and Software Technology 2022, 151, 107018. [Google Scholar] [CrossRef]
- Kruskal, W.H.; Wallis, W.A. Use of ranks in one-criterion variance analysis. Journal of the American statistical Association 1952, 47, 583–621. [Google Scholar] [CrossRef]
- Mann, H.B.; Whitney, D.R. On a test of whether one of two random variables is stochastically larger than the other. The annals of mathematical statistics 1947, pp. 50–60.
- Myers, J.; Well, A.; Lorch, R. Research Design and Statistical Analysis: Third Edition; Taylor & Francis, 2013.
- Kendall, M.G. A New Measure of Rank Correlation. Biometrika 1938, 30, 81–93. [Google Scholar] [CrossRef]
- Python Software Foundation. Python 3.11.7 documentation. https://docs.python.org/3.11/, accessed on 2024-01-21.
- Wes McKinney. Data Structures for Statistical Computing in Python. Proceedings of the 9th Python in Science Conference; Stéfan van der Walt.; Jarrod Millman., Eds., 2010, pp. 56 – 61. [CrossRef]
- Virtanen, P.; Gommers, R.; Oliphant, T.E.; Haberland, M.; Reddy, T.; Cournapeau, D.; Burovski, E.; Peterson, P.; Weckesser, W.; Bright, J.; van der Walt, S.J.; Brett, M.; Wilson, J.; Millman, K.J.; Mayorov, N.; Nelson, A.R.J.; Jones, E.; Kern, R.; Larson, E.; Carey, C.J.; Polat, İ.; Feng, Y.; Moore, E.W.; VanderPlas, J.; Laxalde, D.; Perktold, J.; Cimrman, R.; Henriksen, I.; Quintero, E.A.; Harris, C.R.; Archibald, A.M.; Ribeiro, A.H.; Pedregosa, F.; van Mulbregt, P.; SciPy 1.0 Contributors. SciPy 1.0: Fundamental Algorithms for Scientific Computing in Python. Nature Methods 2020, 17, 261–272. [Google Scholar] [CrossRef]
- Dunn, O.J. Multiple Comparisons Among Means. Journal of the American Statistical Association 1961, 56, 52–64. [Google Scholar] [CrossRef]
- Dunnett, C.W. A Multiple Comparison Procedure for Comparing Several Treatments with a Control. Journal of the American Statistical Association 1955, 50, 1096–1121. [Google Scholar] [CrossRef]
- Rovai, A.; Baker, J.; Ponton, M. Social Science Research Design and Statistics: A Practitioner’s Guide to Research Methods and IBM SPSS; Watertree Press, 2013; p. 375.
- Pearce, J.M. The Case for Open Source Appropriate Technology. Environment, Development and Sustainability 2012, 14, 425–431. [Google Scholar] [CrossRef]
- Hoe, N.S. Breaking Barriers: The Potential of Free and Open Source Software for Sustainable Human Development; United Nations Development Programme, 2007.
Figure 2.
Example of conversation records in a PR [16].
Figure 2.
Example of conversation records in a PR [16].
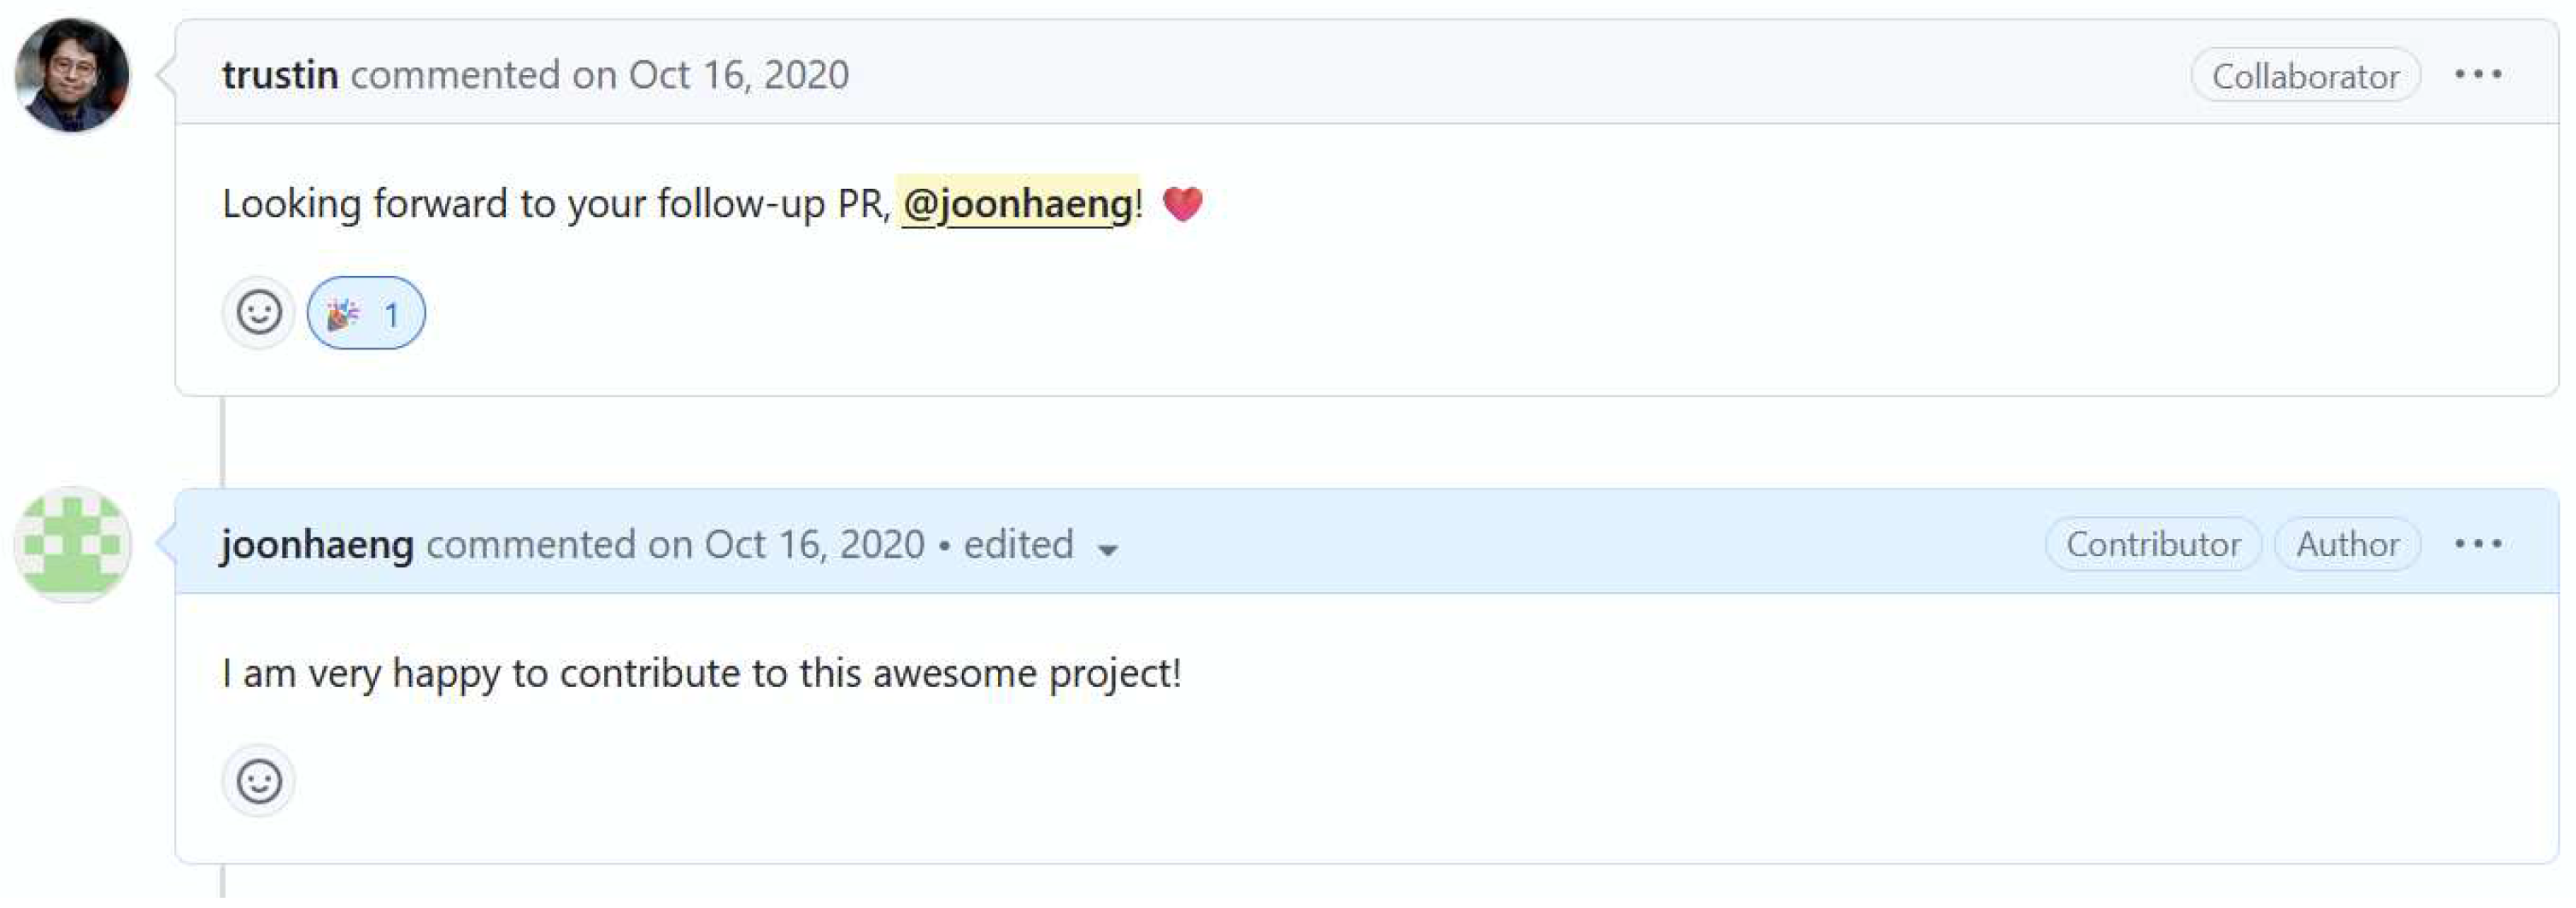
Figure 3.
Research procedure.

Table 1.
List of Top 10 star and fork repositories.
| Star Top 10 | Fork Top 10 | ||
|---|---|---|---|
| Repository Name | Data Collection Date | Repository Name | Data Collection Date |
| react | 2023-11-05 | tensorflow | 2023-10-31 |
| ohmyzsh | 2023-11-05 | bootstrap | 2023-10-25 |
| flutter | 2023-11-04 | opencv | 2023-10-30 |
| vscode | 2023-11-08 | kubernetes | 2023-10-29 |
| AutoGPT | 2023-11-02 | bitcoin | 2023-10-24 |
| transformers | 2023-11-07 | three.js | 2023-11-01 |
| next.js | 2023-11-04 | qmk_firmware | 2023-10-30 |
| react-native | 2023-11-06 | material-ui | 2023-10-29 |
| electron | 2023-11-02 | django | 2023-10-27 |
| stable-diffusion-webui | 2023-11-07 | cpython | 2023-10-26 |
Table 2.
Median and mean values for each sentiment group across all 20 repositories.
| Category | Sample Size | Median | Mean | |
|---|---|---|---|---|
| total | 24607 | - | - | |
| Positive | No. of PRs | 12262 | 2.0 | 17.37 |
| Total LoCs | 86.0 | 9865.64 | ||
| LoCs/PR | 39.12 | 332.31 | ||
| Comments | 6.0 | 91.65 | ||
| Neutral | No. of PRs | 7647 | 1.0 | 3.22 |
| Total LoCs | 17.0 | 620.69 | ||
| LoCs/PR | 12.0 | 135.34 | ||
| Comments | 2.0 | 6.45 | ||
| Negative | No. of PRs | 4698 | 2.0 | 10.04 |
| Total LoCs | 51.0 | 7661.10 | ||
| LoCs/PR | 28.0 | 262.59 | ||
| Comments | 5.0 | 46.23 | ||
Table 3.
Median and mean values for each sentiment group in the top 10 star repositories.
| Category | Sample Size | Median | Mean | |
|---|---|---|---|---|
| total | 8321 | - | - | |
| Positive | No. of PRs | 4232 | 1.0 | 16.65 |
| Total LoCs | 62.5 | 5832.69 | ||
| LoCs/PR | 34.4 | 201.42 | ||
| Comments | 4.0 | 55.96 | ||
| Neutral | No. of PRs | 2632 | 1.0 | 5.14 |
| Total LoCs | 17.0 | 336.69 | ||
| LoCs/PR | 13.0 | 81.47 | ||
| Comments | 1.0 | 8.13 | ||
| Negative | No. of PRs | 1457 | 1.0 | 11.85 |
| Total LoCs | 42.0 | 3372.37 | ||
| LoCs/PR | 25.0 | 151.09 | ||
| Comments | 4.0 | 30.18 | ||
Table 4.
Median and mean values for each sentiment group in the top 10 fork repositories.
| Category | Sample Size | Median | Mean | |
|---|---|---|---|---|
| total | 16286 | - | - | |
| Positive | No. of PRs | 8030 | 2.0 | 17.75 |
| Total LoCs | 104.0 | 11991.10 | ||
| LoCs/PR | 43.05 | 401.29 | ||
| Comments | 7.0 | 110.47 | ||
| Neutral | No. of PRs | 5015 | 1.0 | 2.21 |
| Total LoCs | 17.0 | 769.74 | ||
| LoCs/PR | 12.0 | 163.62 | ||
| Comments | 2.0 | 5.58 | ||
| Negative | No. of PRs | 3241 | 2.0 | 9.22 |
| Total LoCs | 58.0 | 9589.11 | ||
| LoCs/PR | 29.0 | 312.71 | ||
| Comments | 6.0 | 53.45 | ||
Disclaimer/Publisher’s Note: The statements, opinions and data contained in all publications are solely those of the individual author(s) and contributor(s) and not of MDPI and/or the editor(s). MDPI and/or the editor(s) disclaim responsibility for any injury to people or property resulting from any ideas, methods, instructions or products referred to in the content. |
© 2024 by the authors. Licensee MDPI, Basel, Switzerland. This article is an open access article distributed under the terms and conditions of the Creative Commons Attribution (CC BY) license (http://creativecommons.org/licenses/by/4.0/).
Copyright: This open access article is published under a Creative Commons CC BY 4.0 license, which permit the free download, distribution, and reuse, provided that the author and preprint are cited in any reuse.


