Submitted:
02 February 2024
Posted:
02 February 2024
You are already at the latest version
Abstract
It is commonly recognized that a ship’s ability to maintain stability is dependent upon the way its loads are distributed. This means making sure the center of gravity is sufficiently low and evenly distributed. Yet when a ship encounters turbulent water with extremely large wave amplitudes, load distribution is a critical factor in determining how stressed the ship becomes. In particular, this article examines several methods for increasing the ship's longitudinal strength to prevent ship structural damage during hogging and sagging. This research presents a number of proposed techniques to enhance the longitudinal strength of cargo ships in order to guarantee minimal stress and deformation during sagging and hogging. The first method is the stern-to-bow use of curved support structures to increase the longitudinal strength of a cargo ship. And another way to stiffen the lateral plate is the proposed use of different designs of the side plate, such as wavy curves, stars, etc. To further boost the strength, the lateral plate upper part is suggested to curve upward. A numerical simulation using ANSYS of the stiffened plate when subjected to uniform load distribution and fixed support on either end shows that there is a decrease in deformation of the plate when we use wavy curved plates compared with those of the other plate stiffening methods used, and furthermore, curving the plate on top increases its strength during sagging as well as hogging. Finally, the use of a curved support structure further enhanced the overall longitudinal strength of the vessel.
Keywords:
Plate Stiffening
; Finite Element Analysis
; Structural Analysis
; Sagging
; Hogging
; Cargo Ship
1. Introduction
1.1. Background
Water transport, especially cargo ships [1], can be put in danger due to the huge waves and unpredictable nature of the ocean [2,3]. It is well known that the distribution of a ship’s loads determines how stable the vessel may remain [4,5]. This relates to ensuring that the center of gravity is dispersed equally and at a low enough level. However, load distribution plays a crucial role in deciding how stressed out a ship gets when it confronts stormy water with extraordinarily large wave amplitudes. in rough waters with extremely large wave amplitudes and different ship load distributions. See Figure 1 below, which shows different sample cargo ships broken as a result of ship encounters with chaotic wave water.
From Figure 1 below, it can be seen that most ship structural failures are due to encounters with water wave crests at the extreme end, i.e., sagging where the ship is supported at the stern and bow resting on two crests, and in the middle is a trough that has lower pressure exerting on the middle of the ship, hence stressing the ship, and hogging where the mid-section of the ship rests on the crest of the water wave.
Sagging, by definition, refers to the stress experienced by a ship’s hull or keel, causing the center or keel to have positive bending [6,7,8]. It occurs when a ship is supported at the bow and stern by wave crests, leading to upward bending in the middle. This occurs in wavy water of high amplitude and long wavelength, as shown in equation (1.1). Another cause of sagging in clam water can be due to overload concentrated in the middle of the ship, which causes the center of the ship to experience more downward force at the extreme end, i.e., the stern and bow, causing the ship’s center to bend due to excess load.
When a section acts in an anticlockwise (ACW) direction to the right, its bending moment is described as a positive (sagging) moment; conversely, when it acts in a clockwise (CW) direction, it is characterized as a negative (hogging) moment.
Hogging can have an effect; that is to say, overdoing it can weaken the ship’s hull and cause structural damage.
By definition, hogging in cargo ships is the reverse of sagging, which occurs when a ship experiences negative bending, or bending in the bow and stern, when it is supported in the middle by a wave crest.
Factors that produce sagging: When a ship is in the trough of two waves and the wave is the same length as the ship, stress is applied to the ship’s hull. Sagging’s consequences can deform and strain the ship’s structure, affecting its seaworthiness.
Hogging doesn’t always have a negative outcome because most cargo ships try to concentrate their loads in the middle of the ship, making the stern and bow of the ship lighter. Therefore, there is less possibility of the ship breaking in the middle when the water wave crest hits it because the heaviest section of the ship is hoisted higher and the lighter extreme end doesn’t put as much stress on the ship.
Sagging is more dangerous, though, because most ships tend to concentrate their load in the middle of the vessel. This causes the ship to become stressed downward toward the middle when the bow and aft of the ship rest on the two wave crests, and when the ship’s midsection rests on the water wave trough. However, if there is too much weight concentrated in the middle, the result could be a disastrous ship breaking in the middle, as seen in Figure 2 below. moving through the water and whose wave velocity, V, is shown by the following equation.
Where is the depth of the water, is the acceleration due to gravity and is the wave length.
Impact on Ship Stability
Distribution of Ship Stress: [10,11] Maintaining stability requires an understanding of the forces and weight distribution acting on the ship’s hull [12]. Hogging and sagging can create deformation that compromises a ship’s structural integrity and jeopardizes its seaworthiness.
The ship’s stability and safety depend on the importance of load distribution [13,14], which is crucial in reducing the impacts of hogging and sagging.
SWOT Analysis of Hull Deformation
Being aware of drooping and hogging allows for preventative actions to be taken to preserve ship integrity. Moreover, poor load distribution and structural flaws can make sagging and hogging worse.
Furthermore, hull deformation can be detected earlier by the use of sophisticated monitoring systems. This is because cargo ships’ operational efficiency and safety are seriously jeopardized by extreme hogging and sagging.
Reducing Hull Stress
In order to reduce hull stress, which can cause hull deformation and catastrophic accidents, structural reinforcement is highly helpful. We’ll talk about a variety of structural reinforcement approaches in the next subsection.
In certain cases, reinforcing the ship’s structure and using cutting-edge materials to reinforce the hull against hogging and sagging strains can reduce the likelihood of deformation and increase the ship’s resilience to stress. furthermore, investigating cutting-edge technical methods to lessen the effects of hogging and sagging on cargo ships.
Strategies for Load Management: By putting into practice efficient load management techniques, it is possible to optimize cargo distribution [15,16,17], guarantee uniform weight distribution, and reduce the likelihood of hogging and drooping. By utilizing technology integration, this is possible by using technology to monitor cargo weight in real-time [18,19] and hull stress in order to minimize excessive deformation. establishing industry standards for the distribution and loading of goods in order to lessen the effects of sagging and hogging.
Crew Awareness and Training: Creating customized training curricula to enable crew members to identify and react to drooping and hogging symptoms. supplying crew members with the information and procedures they need to handle hull deformation situations professionally. promoting a culture of alertness and awareness among crew members about the dangers of sagging and hogging.
Regulatory Compliance: Following global marine laws and guidelines concerning hull deformation and stress. putting strict compliance systems in place to guarantee that cargo ships adhere to safety and structural integrity regulations. collaborating with regulatory organizations to improve rules and policies for minimizing sagging and hogging.
In Summary the Best Practices can be describe as below:
Using a thorough load distribution plan greatly decreased the frequency of hogging and sagging in a cargo ship fleet. Ship performance and safety can be improved by taking proactive steps to optimize cargo distribution and reduce the dangers related to hull deformation.
By integrating cutting-edge hull stress monitoring devices, structural damage from hogging and sagging could be avoided early on and with prompt action (see reference [20]).
Technology-based solutions are essential for protecting cargo ships from the damaging impacts of hull deformation.
To spot and fix early indications of hogging and sagging, regular hull inspections and maintenance schedules are crucial. Maintaining the structural integrity of cargo ships and reducing the possibility of deformation depend heavily on following strict maintenance procedures.
Comprehensive safety recommendations for mitigating hogging and sagging have been developed as a result of cooperative initiatives between industry players and regulatory organizations. Strong safety norms and procedures are established in the maritime industry through cooperative efforts and knowledge exchange.
Future Innovations and Risk Mitigation
Novel approaches to reduce the effects of hogging and sagging are being developed as a result of ongoing research and development in the shipbuilding and engineering fields. The potential for technological improvements to transform hull stress reduction measures could improve the safety and durability of cargo ships.
Analytics Based Prediction for Hull Stress. Proactively identifying possible hogging and sagging concerns is made possible by the integration of machine learning algorithms and predictive analytics. By enabling ship operators to take preventative action, predictive analytics lowers the possibility of hull deformation events.
Environmental Factors and Hull Stress: Developing focused risk mitigation techniques requires an understanding of how environmental factors, such as wave dynamics and sea conditions, affect hogging and sagging. Environmental factors are a major factor in developing efficient hull stress management strategies for cargo ships.
Sustainable Ship Design: By adopting sustainable ship design concepts, hull structures that are naturally resistant to hogging and sagging strains can be developed. Shipbuilding procedures that incorporate sustainability can reduce the likelihood of hull deformation and improve the environmental impact of cargo ships in the long run.
1.2. Literature Review
Using large-scale nonlinear finite element analysis (FEA), the work described in article [21] sought to determine the dynamic strength of the global hull girder of cargo ships. Large-scale finite element (FE) models of an 8000-TEU container ship with a hogging moment applied to the midship section were used to conduct a series of time domain nonlinear FE simulations. Five different kinds of finite element models were used: one transverse model, three full models, and a half hold model. They use the strain rate effect-adding elastoplastic material model in their models. By altering the load time length, the hogging moment which is represented by a sinusoidal impulse was applied to these models, and the collapse mechanism and dynamic hull girder ultimate strength were also examined. In-depth studies were also conducted on the impacts of strain rate, mass inertia, load time duration, and analysis models. Their investigation discovered a substantial relationship between the load time duration of the hogging moment and ultimate strength as well as collapse mode.
From the study in paper [22] part 1, the first of two companion studies about the ultimate hull girder strength of container ships subjected to coupled hogging moment and bottom local loads, was extended in this article [23].
They noted that upward bottom local loads in the midship region of container ships are typically greater than downward ones, which eventually causes the outer bottom plating to experience increased biaxial compression and a decrease in the final hull girder strength while the ship is in the hogging state.
The nonlinear finite element approach was used in this Part 1 [22] to study the collapse tendency and ultimate strength of cargo ships under coupled hogging moment and bottom local loads. Investigated in detail is the buckling failure behavior of bottom strengthened panels during the gradual collapse of a hull girder. They discovered that, on the tension side of the double bottom’s local bending, the two main causes of the reduction in ultimate hogging strength caused by bottom local loads are (1) an increase in the outer bottom’s longitudinal compression and (2) a decrease in the inner bottom’s effectiveness.
In Part 2 of the article [23], a simplified technique of gradual collapse evaluation of container ships under coupled hogging moments and bottom local loads was developed using the acquired data.
Akira et al. [23] addressed hogging in their article and proposed a method of reducing ship stress caused by hogging by employing a twin bottom hull girder (please refer to Figure 3). This is a result of container ships’ ultimate hull girder strength under coupled hogging moments and bottom local loads.
The ultimate hogging strength of container ships is greatly reduced by local bending deformation of a double bottom caused by bottom lateral stresses, as demonstrated by the nonlinear finite element study that was conducted.
The use of double bottom can be seen in the design in Figure 4 below of the ship hull
The challenges with the arrangement in the figure above are that, the longitudinal frame is place horizontally making it easy to bend at the shear strake,
The impact of hydro-elastic high-energy vibration on the severe hogging wave bending moment is the main topic of an article [25] that details its entirety observations regarding the waves-induced upward bending moment in the middle a 9400 TEU cargo carrier. The link between readings of accelerations and stresses and simple beam theory is used to evaluate one extreme event, in which the amidships hogging bending moment caused by vertical waves is slightly higher than the design value.
In the extreme scenario, the high-frequency vibrations brought on by impulsive loads are seen to be of the same size as the rigid-body wave-induced response, which doubles the overall vertical moment of bending amidships. In this case, their measurements were confirmed to be reliable. It was also discovered that just the 2-node upward shaking mode appears to be aroused, despite the ship being sailed in bow quartering seas.
A period of three hours of strain measurement are used to establish a Gumbel distribution for the most extreme value prediction after the extreme event analysis and verification. It was then discovered that there is a considerable chance of surpassing the rule design wave moment of bending by 50% in the specified sea state. Lastly, a good agreement with the actual measurements is discovered when the hydro-elastic behavior within the hull structure was evaluated using straightforward estimates based on the observed statistical characteristics and closed-form formulas. A similar study by Arianto and others [26] provided the same analysis of stress due to wave load on corvette warship.
The dynamic toughness of the complete hull superstructure section under sagging bending moments related to tidal loads and whipping reactions was examined in a study published in article [27]. To determine the dynamic load factors, which might be used as an approximation of the dynamic collapse effect, they calculated the dynamic maximum strength and contrasted it with the quasi-static maximum strength.
An analysis of the maximum collapse strength in ship structure sagging with side impact damage was conducted by Lee et al. [28].
They stated that ships are more likely to experience unintentional loads like collisions and groundings when the weather is poor. Her ultimate might will decrease after she sustains hull damage. Their paper uses an array of crash tests to examine how damage affects the ultimate strength of the ship construction.
Five box-girder prototypes with stiffeners, each measuring 900mm in length and 720mm in section, were used for the experiment. Out of the five, one has no damage, and the other four have elliptical-shaped damage, which mimics the form of a crashing ship’s bulbous bow. Each model has a varied damage size. Three of the damaged models had their damage caused by cutting the plate, and one had damage caused by pressing, which indicated collision damage.
They conducted the trials with a pure bending load, recording the ultimate bending moment as well as the load-deflection curves. Additionally, the maximum strength was computed with LS-DYNA and compared to the outcomes of the experiment. As predicted, the ultimate strength decreases with increasing injury size. The largest damage one has a 19% reduction in ultimate strength and an adverse effect size of 30% of depth. The ultimate strength of the pressed one is higher than the chopped one. This might be because, in contrast to the cut one, which lacks a plate to contribute, the plate surrounding the pressed damage region increases the ultimate strength.
The work described in article [29] used a numerical analysis for predicting the maximum durability of the cargo area of double-hull oil tankers. Two Double Hull Oil Tankers were selected for their study’s subject. The shell component was applied to the entire model, and the cargo container was taken into consideration for analysis. On one side, they linked the moment of bending to the Multi-Point Constraint (MPC), while the other side was subject to constraints. The chosen oil tanker’s ultimate strength was subsequently tested in hogging and sagging scenarios.
According to research conducted by Salazar-Domínguez [30], collapses of structures in the midship parts of barges can result in operating delays, sinking, cargo loss, and damage to the environment. The weight of the barge and the cargo, as well as the wave load impacts on the midships sections, may be the cause of these breakdowns. The architectural layout of the midship parts of the barge must take these types of loads into account. They reported the structural analysis of a barge midship section whose deck thickness has been reduced by corrosion to a maximum of 36.4%. The wave load implications and the weights of the barge and freight were included in the FEM (finite element method) simulations used to conduct the analysis.
Three cargo tanks in the midship section were presented in an article [30] written by Salazar-Domínguez et El, which housed the primary longitudinal and transverse structural elements, were taken into consideration by the FEM models. Furthermore, the Lloyd’s Register regulations were utilized to compute the barge’s necessary deck thickness and the modulus of the hull girder section. These guidelines were used to predict the allowable bending stresses at the bottom and deck plates in the event of hogging and sagging, and the results were in good agreement with the FEM models. The FEM models indicated that the hull girder structure’s optimum compressive normal stress and von Mises stress were 175.54 MPa and 215.53 MPa, respectively. The barge material’s yield strength (250 MPa) was not exceeded by these stress values, enabling the barge to behave structurally safely.
1.3. Theoretical Formulation Using Beam
Sagging
From Figure 2, sagging occurs when the bow and stern of a cargo ship are lifted high by a water wave crest, leaving the middle if the ship is resting on the water trough, and hence making it experience downward bending of the curve.
We can represent sagging as a beam held from both ends by fixed supports. Either a uniform load is distributed on top of the load (see Figure 5) or a load has an inequivalent distribution (see Figure 6).
Uniform Weight Distribution
General beam equation can be express (1.2)
Where is the moment and is displacement.
Deflection
Here is the deflection due to the uniform load distribution on top of the beam. And by using double integration to find the deflection.
And the maximum deflection occurs at see equation below.
Slope
Using Slope approach, the curvature is shown below.
And to find curve at and , we substitute the values into the above equations (1.4). Then get the one below (1.6):
Shear
In addition, we show also the shear of this type And for shear at and see below
Moment
For the maximum moment is at
Non-Uniform Weight Distribution
The free-body diagram can be used to determine the bending moment in AB, producing moment as shown in (1.9)
Taking the integral and solving the above double differential equation (1.2) on both sides, we get the below one (2.0).
Now the elastic curve of the half of the beam segment can be express as below by substituting the value of both the constant got from the double integral. The midspan is where the biggest displacement happens by symmetry.
Evaluating the equation at at
Therefore, the values
The downward deflection is indicated by the negative sign. The biggest change in position i.e., displacement of deformation how the node move is given as below (2.2).
Hogging
In hogging conditions, the cargo ship or vessel is held up and rests on a water crest in the middle of the vessel, and either the vessel’s end, i.e., the stern and bow, hangs or it’s raised up. See the figure below for a demonstration of the problem using beams.
From the above figure, we cut into half such that a beam with one end fixed support is provided, as seen in Figure 8 below, and then analyze the region of maximum displacement.
Similarly for the Figure 8, maximum displacement occurs when . So, by substituting the value of into the above equation, we get
2. Proposed Design Solution Methods
In order to improve the strength of the ship structure, a number of ideas were brought forward, such as lateral plate stiffening, creating a curved vessel top longitudinal side from the top, and additional support curved structure, which we will later investigate to show which curvation produces the minimum stress and deformation result, i.e., structural deformation.
These solution approaches are majorly to increase the strength of the middle section of the beam (vessel) so that even if it is supported on both ends with fixed support (sagging), the center of the beam won’t have much displacement. even if the weights are concentrated in the middle of the beam (vessel) or when there is a uniform load distribution on the beam (vessel), see the Figure 9, Figure 11 and Figure 12 below for the designs. Similarly, for the hogging situation, these designs will add the strength needed to support the Vessel.
2.1. Lateral Plate Stiffening
To guarantee optimum strength and minimal stress under load, a shipside frame must be patterned. By doing this, a ship’s longitudinal strength can be increased and its structural integrity can be trusted in choppy seas during hogging and sagging. Below are some of the proposed pattern designs for stiffening the lateral plate of a ship.
2.1.1. Wavy Lateral Stiffening
For this, we proposed the use of multiple wavy curves to improve the strength of the side of the ship, just like a sheer strake. See the equation (2.1) and (2.2) below for generating waves. And also Figure 9.
The equation below (2.1) shows a generalized condition for generating the curve.
A sample equation in (2.2) where we use sin(x) and cos(x) to generate different wave curved is shown here below, a modification from the above, where is the height of the ship side frame and is the wave length of the wave, which should be less than or equal to at least the ship’s length, and is another term used to shift the position of the wave.
Below in Figure 10 shows four waves’ curves generated by the above equation, in the equation term is not included i.e., .
2.1.2. Curved Lateral Frame Support
Furthermore, to improve the strength of the wave lateral plate stiffening, a proposed idea is to create a curve on top of the frame, as shown in Figure 11 below. This enables the frame to have extra strength to resist deformation during sagging and hogging.
2.1.3. Other Lateral Frame Stiffening
Other forms of design are also presented here in Figure 12, where even the conventional approach of using longitudinal and transverse frames is used for stiffening, i.e., Figure 12 (c). Also, others like the star, curve, and Zigzag approaches are presented, and their deformation results are compared with each other’s to find out which design is better off at minimizing deformation. See the simulation result section for more details on the results.
2.2. Longitudinal Strengthening
To further increase the longitudinal strength of a cargo ship, curve support structures are proposed, like those used in bridges. This type of curved support helps reduce the stress of bending due to sagging and hogging when the vessel is lifted up and its bow and stern are resting on two water wave crests, i.e., sagging as well as hogging. See Figure 13 (a) below for curved upward support. This helps only in sagging; however, for hogging, we need to add another curve downward, as shown in Figure 13 (b), which helps in hogging.
The more curved, the better; see Figure 13 below for detailed visual images.
In Figure 13 (c), we can add more string to reinforce the strength of the curve holding tight onto the bed of the vessel, thereby increasing its strength.
2.2.1. Justification of Curved Structure Support
Historically, curved structures were and often still in use as support in bridges to increase the strength of the bridge [31,32,33,34]; see Figure 3 below for a curved bridge (image downloaded from the internet). These motivated me to the extent that if a vessel could have such a shape, it would definitely increase its strengths and resist sagging and hogging.
The application of curved support in heavy truck vehicles can be seen in the Figure 14 below.
Similarly, the application of curved structure support is seen in bridge support, where either the entire bridge is curved upward (see figure below (b) to give extra strength to the weight of the vehicle running over it) or the bridge is straight, although the support is curved with string attached as shown below (a) to provide extra support to the straight bridge.
2.3. General Vessel Design
By combining the ideas proposed and shown above about lateral plate stiffening and the use of curved top vessels, we can make a sample design of a vessel with a flatbed, as shown in Figure 16 and Figure 17 below. This approach allows for enhanced structural strength and integrity during sagging and hogging, ensuring increased strength of the vessel.
3. Simulation and Results
The simulation was performed using ANSYS Statics structural analysis to examine the deformation and stress encountered by a box boat when it rests on two supports at the extreme end and has a load placed in the center, as well as when the boat rests on the middle support with a load at the extreme end of the box. Where a beam is cut into a curved shape representing the vessel longitudinal shape and supported on either the middle or both ends, representing the vessel in either a sagging or hogging situation.
The following conditions were set for the test simulation, including the software and hardware used for the test simulation.
Software used for simulation: ANSYS Student Version 2024 R1.
The computer configuration used for this simulation was as follows: CPU, Intel(R) Quad Core (TM) i7-4790 @ 3.60 GHz; RAM, 8 GB; OS, Windows 10.
3.1. Modeling
- (a)
- Lateral Plate Stiffen Modelling
In the lateral plate modelling, a square with the following measurement is set
Length , height and width , thickness of the frame see Figure 18.
Meshing size is and a uniform force of applied from the bottom facing downward.
For this and other models of lateral frames, fixed supports are applied at the side end, as shown in the figure below.
It should be noted that although the frame measurement is uniform for all the different models, the inside design of the crossing is a bit different, such as their measurement; however, care has been taken to ensure that at least seven parts of the crossing are touching the bounding square both up and down (see sample lateral plate stiffened in Figure 19).
- (b) Box Modelling Design
The following are the specification measurement of the beam used for analysis
Height =2m, width=5m and length=15m
Thickness of base and side Sheet= 0.1m
Curved Thickness 0.4m
Mesh Size 0.5m
Partitioning of the Box is for internal space (8x9.8) m, (13.8x9.8) m and (8x9.8) m while the thickness of wall is 0.1m
Force of 1e+7N. (Applied Uniformly pointing downward on either end of the partitioning 5x5 m for central support or in the center of Partitioning of 5x10 m) for edge supports.
Please note that fix support is provided in the middle or at the edge of the box boat representing sagging and hogging.
Material Used in this figure is Structural Steel with Material property as follows: Poisson ratio: 0.3, Young Modulus: 2e+11 Pa, and density .
It should be noted that in each of these boxes (see Figure 20 below), the sides are not stiffened at the bottom, and this causes more deformation at the center of the bottom; only the side (lateral) parts are stiffened. Assumption is made that the bed (bottom of the box) can be stiffened using a well-known approach, like a double layer with longitudinal and traverse frames at each crossing.
The meshing of the models is done as shown in Figure 21 below, where a sample of the box has a mesh size of 0.5 m, and for the lateral frame, the mesh size is 1 mm.
3.2. Results
- (a)
- Lateral PlateStiffened Result.
For the lateral plate stiffening, each of the model designs was assigned equal weight as well as the same point of fixed support, as shown in Figure 19.
Figure 22 below shows the deformation of each model design, with the area of high deformation having a red color and the area of no deformation having a blue color.
For the data collected, see Table 1 below.
- (b) Box Side Stiffening
The simulation was performed using static structural analysis in ANSYS, and the results are shown in Table 2 below, where the major focus was on the deformation, especially to find out which areas experienced a higher number of deformations.
4. Conclusion
Here, conclusive observations are made based on a box with varying lateral stiffness forms, non-uniform load distribution at the edge or center load, and support on one or both edges. This is an example of the hogging and sagging that occurs in choppy waters for cargo ships.
Another observation was on different plate stiffening using different design criteria, but as hogging was shown to be less severe than sagging in box structural analysis, a uniform load was supplied from the base with support at either end, i.e., sagging alone, for lateral plate stiffening.
4.1. Lateral Plate Stiffening
From the data gathered using ANSYS simulation, the conventional approach of lateral stiffening using longitudinal and transverse frame crossing does have great strength, but because the longitudinal frames are aligned horizontally, not vertically, it is easier to bend, hence such designs have high deformation, as shown in the simulation results data.
The wavy approach to lateral stiffening has the best performance compared to other designs because the curved wave provides springiness to the support, making it easily flexible and dissipating deformation energy. The design also has a smaller region of maximum deformation, as shown in the data and figure results.
Further curving the entire lateral plate from the top gives it extra strength, as shown in the simulation, reducing the deformation by almost 50% compared to the same design without a curved top. For further details, please refer to Table 1 in the result section.
4.2. Reinforce Box
In this simulation, a box was used as a representation of a boat, where it was divided into three partitions, i.e., the central, left, and right partitions. Fixed support was also provided from the middle, representing hogging, and at both ends, representing sagging. However, to amplify the condition, during sagging, weights were placed in the middle partition, and the box was supported at each end. The total maximum deformation was recoded as shown in the section result. Similarly, during hogging, the box was supported in the middle using a fixed support, and two load forces of equal magnitude were then applied at each left and right partition.
In conclusion, the general results showed that sagging is more severe than hogging, and a box with wavy lateral stiffening produces less total maximum deformation compared with crossing lateral stiffening.
The use of curved structures such as those used in bridges can further enhance the ship’s longitudinal strength, as shown in Figure 17. Also, curving the lateral plate at the top showed further improvement, which reduced the structural deformation when faced with sagging and hogging.
4.3. Future Innovations and Risk Mitigation
Novel approaches to reduce the effects of hogging and sagging are being developed as a result of ongoing research and development in the shipbuilding and engineering fields. The potential for technological improvements to transform hull stress reduction measures could improve the safety and durability of cargo ships.
Analytics Based Prediction for Hull Stress. Proactively identifying possible hogging and sagging concerns is made possible by the integration of machine learning algorithms and predictive analytics. By enabling ship operators to take preventative action, predictive analytics lowers the possibility of hull deformation events.
Environmental Factors and Hull Stress: Developing focused risk mitigation techniques requires an understanding of how environmental factors, such as wave dynamics and sea conditions, affect hogging and sagging. Environmental factors are as well a major factor in developing efficient hull stress management strategies for cargo ships.
Sustainable Ship Design: By adopting sustainable ship design concepts, hull structures that are naturally resistant to hogging and sagging strains can be developed. Shipbuilding procedures that incorporate sustainability can reduce the likelihood of hull deformation and improve the environmental impact of cargo ships in the long run.
Institutional Review Board Statement
Not applicable.
Informed Consent Statement
Not applicable.
Data Availability Statement
The data that support the findings of this study are available at figshare citation [35]. Or can be requested from the corresponding author.
Conflicts of Interest
The authors declare no conflict of interest.
References
- Bell, R., & Kirtman, B. (2021). Extreme environmental forcing on the container ship SS El Faro. Journal of Operational Oceanography, 14(2), 98-113.
- Khramushin, V. N. (2015). Target ship design and features of navigation for motion stabilization and high propulsion in strong storms and icing. In Proc. of the 12th Intl Conf. on the Stability of Ship and Ocean Vehicles, Glasgow, UK (pp. 1017-1025).
- Temarel, P., Bai, W., Bruns, A., Derbanne, Q., Dessi, D., Dhavalikar, S., ... & Wang, S. (2016). Prediction of wave-induced loads on ships: Progress and challenges. Ocean Engineering, 119, 274-308.
- Wang, Y., Shi, G., & Sun, X. (2018, September). Effect of Loading and Unloading Heavy Cargo on a Heavy-lift Ship Stability. In 2018 3rd IEEE International Conference on Intelligent Transportation Engineering (ICITE) (pp. 174-179). IEEE.
- Biran, A., & López-Pulido, R. (2013). Ship hydrostatics and stability. Butterworth-Heinemann.
- Matusiak, J., Karola, A., Niemelä, A., Mikkola, T., & Hirdaris, S. (2023, August). Asymmetry in sagging and hogging responses of a ship hull. In IOP Conference Series: Materials Science and Engineering (Vol. 1288, No. 1, p. 012022). IOP Publishing.
- Coates, J. F. (1985). Hogging or ‘Breaking’of Frame-Built Wooden Ships: A Field for Investigation?. The Mariner’s Mirror, 71(4), 437-442.
- Mao, W., Ringsberg, J. W., Li, Z., & Rychlik, I. (2011, January). Assessment of full-scale measurements with regard to extreme hogging and sagging condition of container ships. In International Conference on Offshore Mechanics and Arctic Engineering (Vol. 44342, pp. 325-333).
- Maritime South Africa. Available online: https://maritimesa.org/nautical-science-grade-12/2020/09/23/hull-stresses/#:~:text=If%20a%20ship%20is%20supported,stress%20is%20known%20as%20sagging (accessed on 29 December 2023).
- Kenno, S. Y., Das, S., Kennedy, J. B., Rogge, R. B., & Gharghouri, M. (2010). Residual stress distributions in ship hull specimens. Marine structures, 23(3), 263-273.
- Yang, B., Pei, Z., & Wu, W. (2022). Stress-distribution characteristics of cruise ship based on multiple-beam method. Ocean Engineering, 266, 112646.
- Eckerlid, J., & Ulfvarson, A. (1995). Redistribution of initial residual stresses in ship structural details and its effect on fatigue. Marine Structures, 8(4), 385-406.
- Kim, J. H., & Kim, Y. (2018). Prediction of extreme loads on ultra-large containerships with structural hydroelasticity. Journal of Marine Science and Technology, 23, 253-266.
- Lewis, E. V., Hoffman, D., Maclean, W. M., van Hooff, R., & Zubaly, R. B. (1973, May). Load criteria for ship structural design. SSC.
- Le Carrer, N., Ferson, S., & Green, P. L. (2020). Optimising cargo loading and ship scheduling in tidal areas. European Journal of Operational Research, 280(3), 1082-1094.
- Dahmani, N., & Krichen, S. (2016). Solving a load balancing problem with a multi-objective particle swarm optimisation approach: application to aircraft cargo transportation. International Journal of Operational Research, 27(1-2), 62-84.
- Kanellopoulou, A., Kytariolou, A., Papanikolaou, A., Shigunov, V., & Zaraphonitis, G. (2019). Parametric ship design and optimisation of cargo vessels for efficiency and safe operation in adverse weather conditions. Journal of Marine Science and Technology, 24, 1223-1240.
- Ancona, M. A., Baldi, F., Bianchi, M., Branchini, L., Melino, F., Peretto, A., & Rosati, J. (2018). Efficiency improvement on a cruise ship: Load allocation optimization. Energy Conversion and Management, 164, 42-58.
- Mårdén, O., & Eriksson, V. (2016). Design modularisation and weight optimization on cargo equipment.
- Gaidai, O., Storhaug, G., Wang, F., Yan, P., Naess, A., Wu, Y., ... & Sun, J. (2022, June). On-board trend analysis for cargo vessel hull monitoring systems. In ISOPE International Ocean and Polar Engineering Conference (pp. ISOPE-I). ISOPE.
- Yamada, Y. (2019). Dynamic collapse mechanism of global hull girder of container ships subjected to hogging moment. Journal of Offshore Mechanics and Arctic Engineering, 141(5), 051605.
- Tatsumi, A., & Fujikubo, M. (2020). Ultimate strength of container ships subjected to combined hogging moment and bottom local loads part 1: Nonlinear finite element analysis. Marine Structures, 69, 102683.
- Tatsumi, A., Ko, H. H. H., & Fujikubo, M. (2020). Ultimate strength of container ships subjected to combined hogging moment and bottom local loads, Part 2: An extension of Smith’s method. Marine Structures, 71, 102738.
- INAMEQ (2024). “Hull design and deck design ship construction”. Available online: https://inameq.com/types-of-ship/hull-design-construction/.
- Andersen, I. M. V., & Jensen, J. J. (2014). Measurements in a container ship of wave-induced hull girder stresses in excess of design values. Marine Structures, 37, 54-85.
- Arianto, P. Y., Sulisetyono, A., & Putranto, T. (2017). Analysis of Stress Due to Wave Load on the Corvette Warship. Surabaya: SENTA the International Conference on Marine Technology 2017.
- Jagite, G., le Sourne, H., Cartraud, P., Bigot, F., Derbanne, Q., & Malenica, Š. (2020, August). Dynamic ultimate strength of a container ship under sagging condition. In International Conference on Offshore Mechanics and Arctic Engineering (Vol. 84331, p. V02BT02A025). American Society of Mechanical Engineers.
- Lee, T. K., Rim, C. W., Kim, B. H., Han, D. S., Lee, J. M., & Kim, K. S. (2008, July). A study of ultimate collapse strength in sagging of ship structures with side collision damage. In ISOPE International Ocean and Polar Engineering Conference (pp. ISOPE-I). ISOPE.
- Alie, M. M., Fathurahkman, M., & Prasetyo, F. A. (2021). Numerical estimation of ultimate strength on double hull oil tanker cargo area. In Developments in the Analysis and Design of Marine Structures (pp. 121-126). CRC Press.
- Salazar-Domínguez, C. M., Hernández-Hernández, J., Rosas-Huerta, E. D., Iturbe-Rosas, G. E., & Herrera-May, A. L. (2021). Structural analysis of a barge midship section considering the still water and wave load effects. Journal of Marine Science and Engineering, 9(1), 99.
- Penadés-Plà, V., García-Segura, T., Martí, J. V., & Yepes, V. (2016). A review of multi-criteria decision-making methods applied to the sustainable bridge design. Sustainability, 8(12), 1295.
- Buonopane, S. G., & Billington, D. P. (1993). Theory and history of suspension bridge design from 1823 to 1940. Journal of Structural Engineering, 119(3), 954-977.
- Bennett, D. (1997). The architecture of bridge design. Thomas Telford.
- Jagadeesh, T. R., & Jayaram, M. A. (2020). Design of bridge structures. PHI Learning Pvt. Ltd.
- Okello, Moses Oyaro (2024). Lateral Stiffening Design Simulation Data. figshare. Dataset. [CrossRef]
Figure 1.
Shows Ship broken from the middle due to encounter with high wave: Credit Internet Photo.
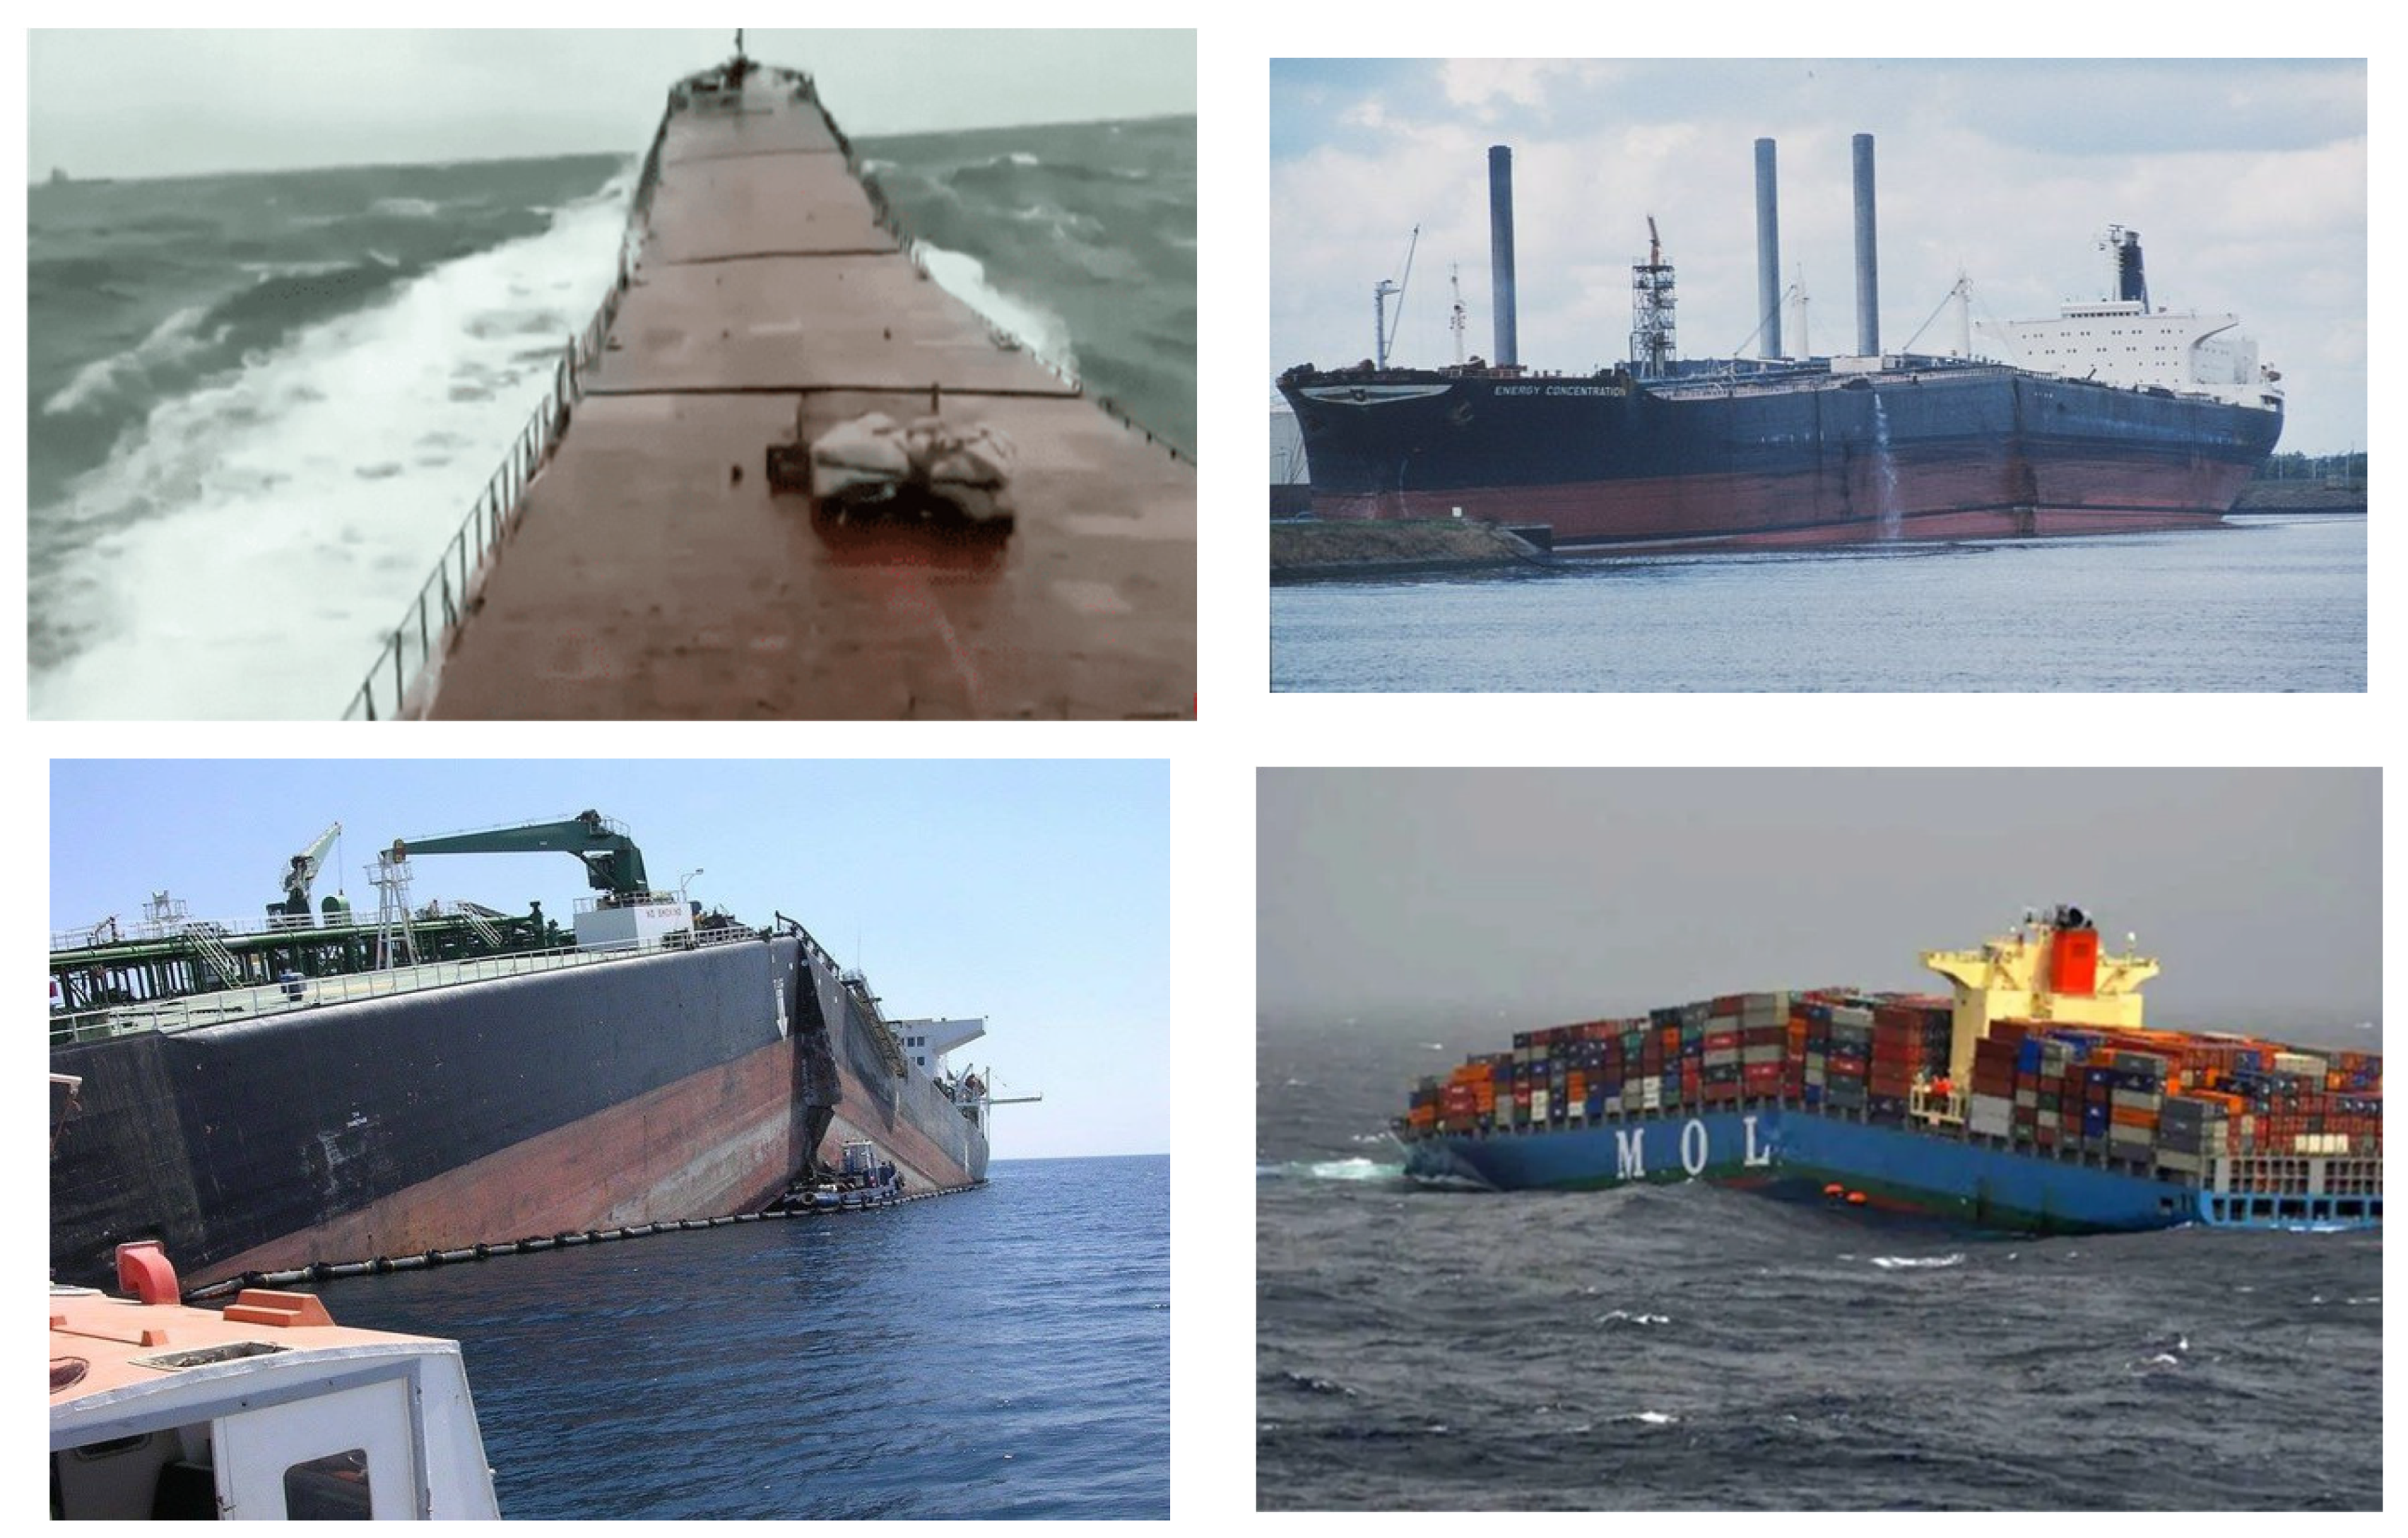
Figure 2.
Shows cargo in sagging and hogging image extracted from article [9].
Figure 2.
Shows cargo in sagging and hogging image extracted from article [9].
Figure 3.
Shows double bottom girder design.
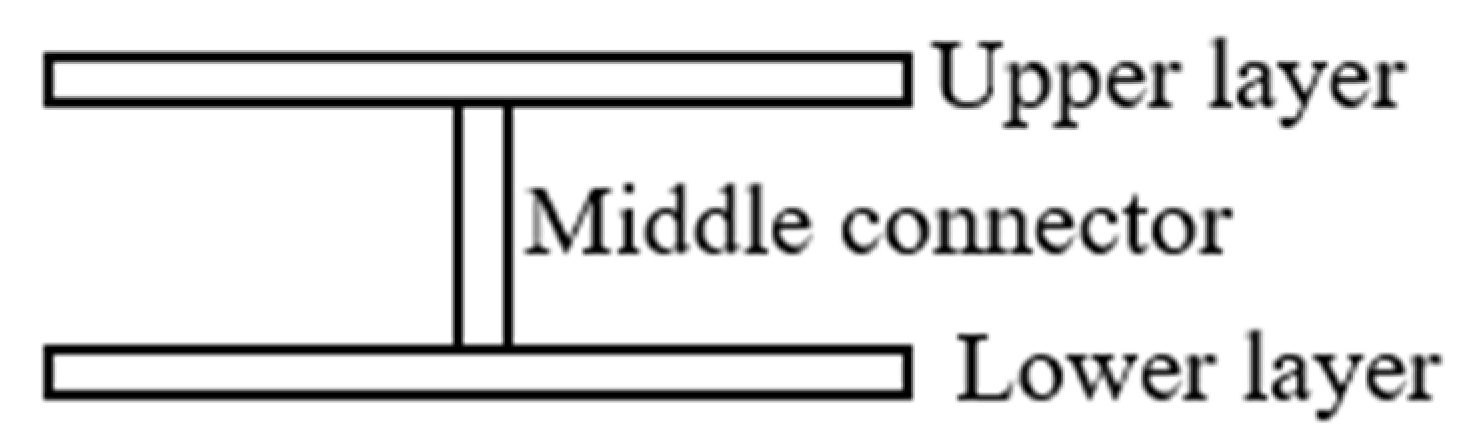
Figure 4.
Shows Ship strength reinforcement Image extracted from article [24].
Figure 4.
Shows Ship strength reinforcement Image extracted from article [24].
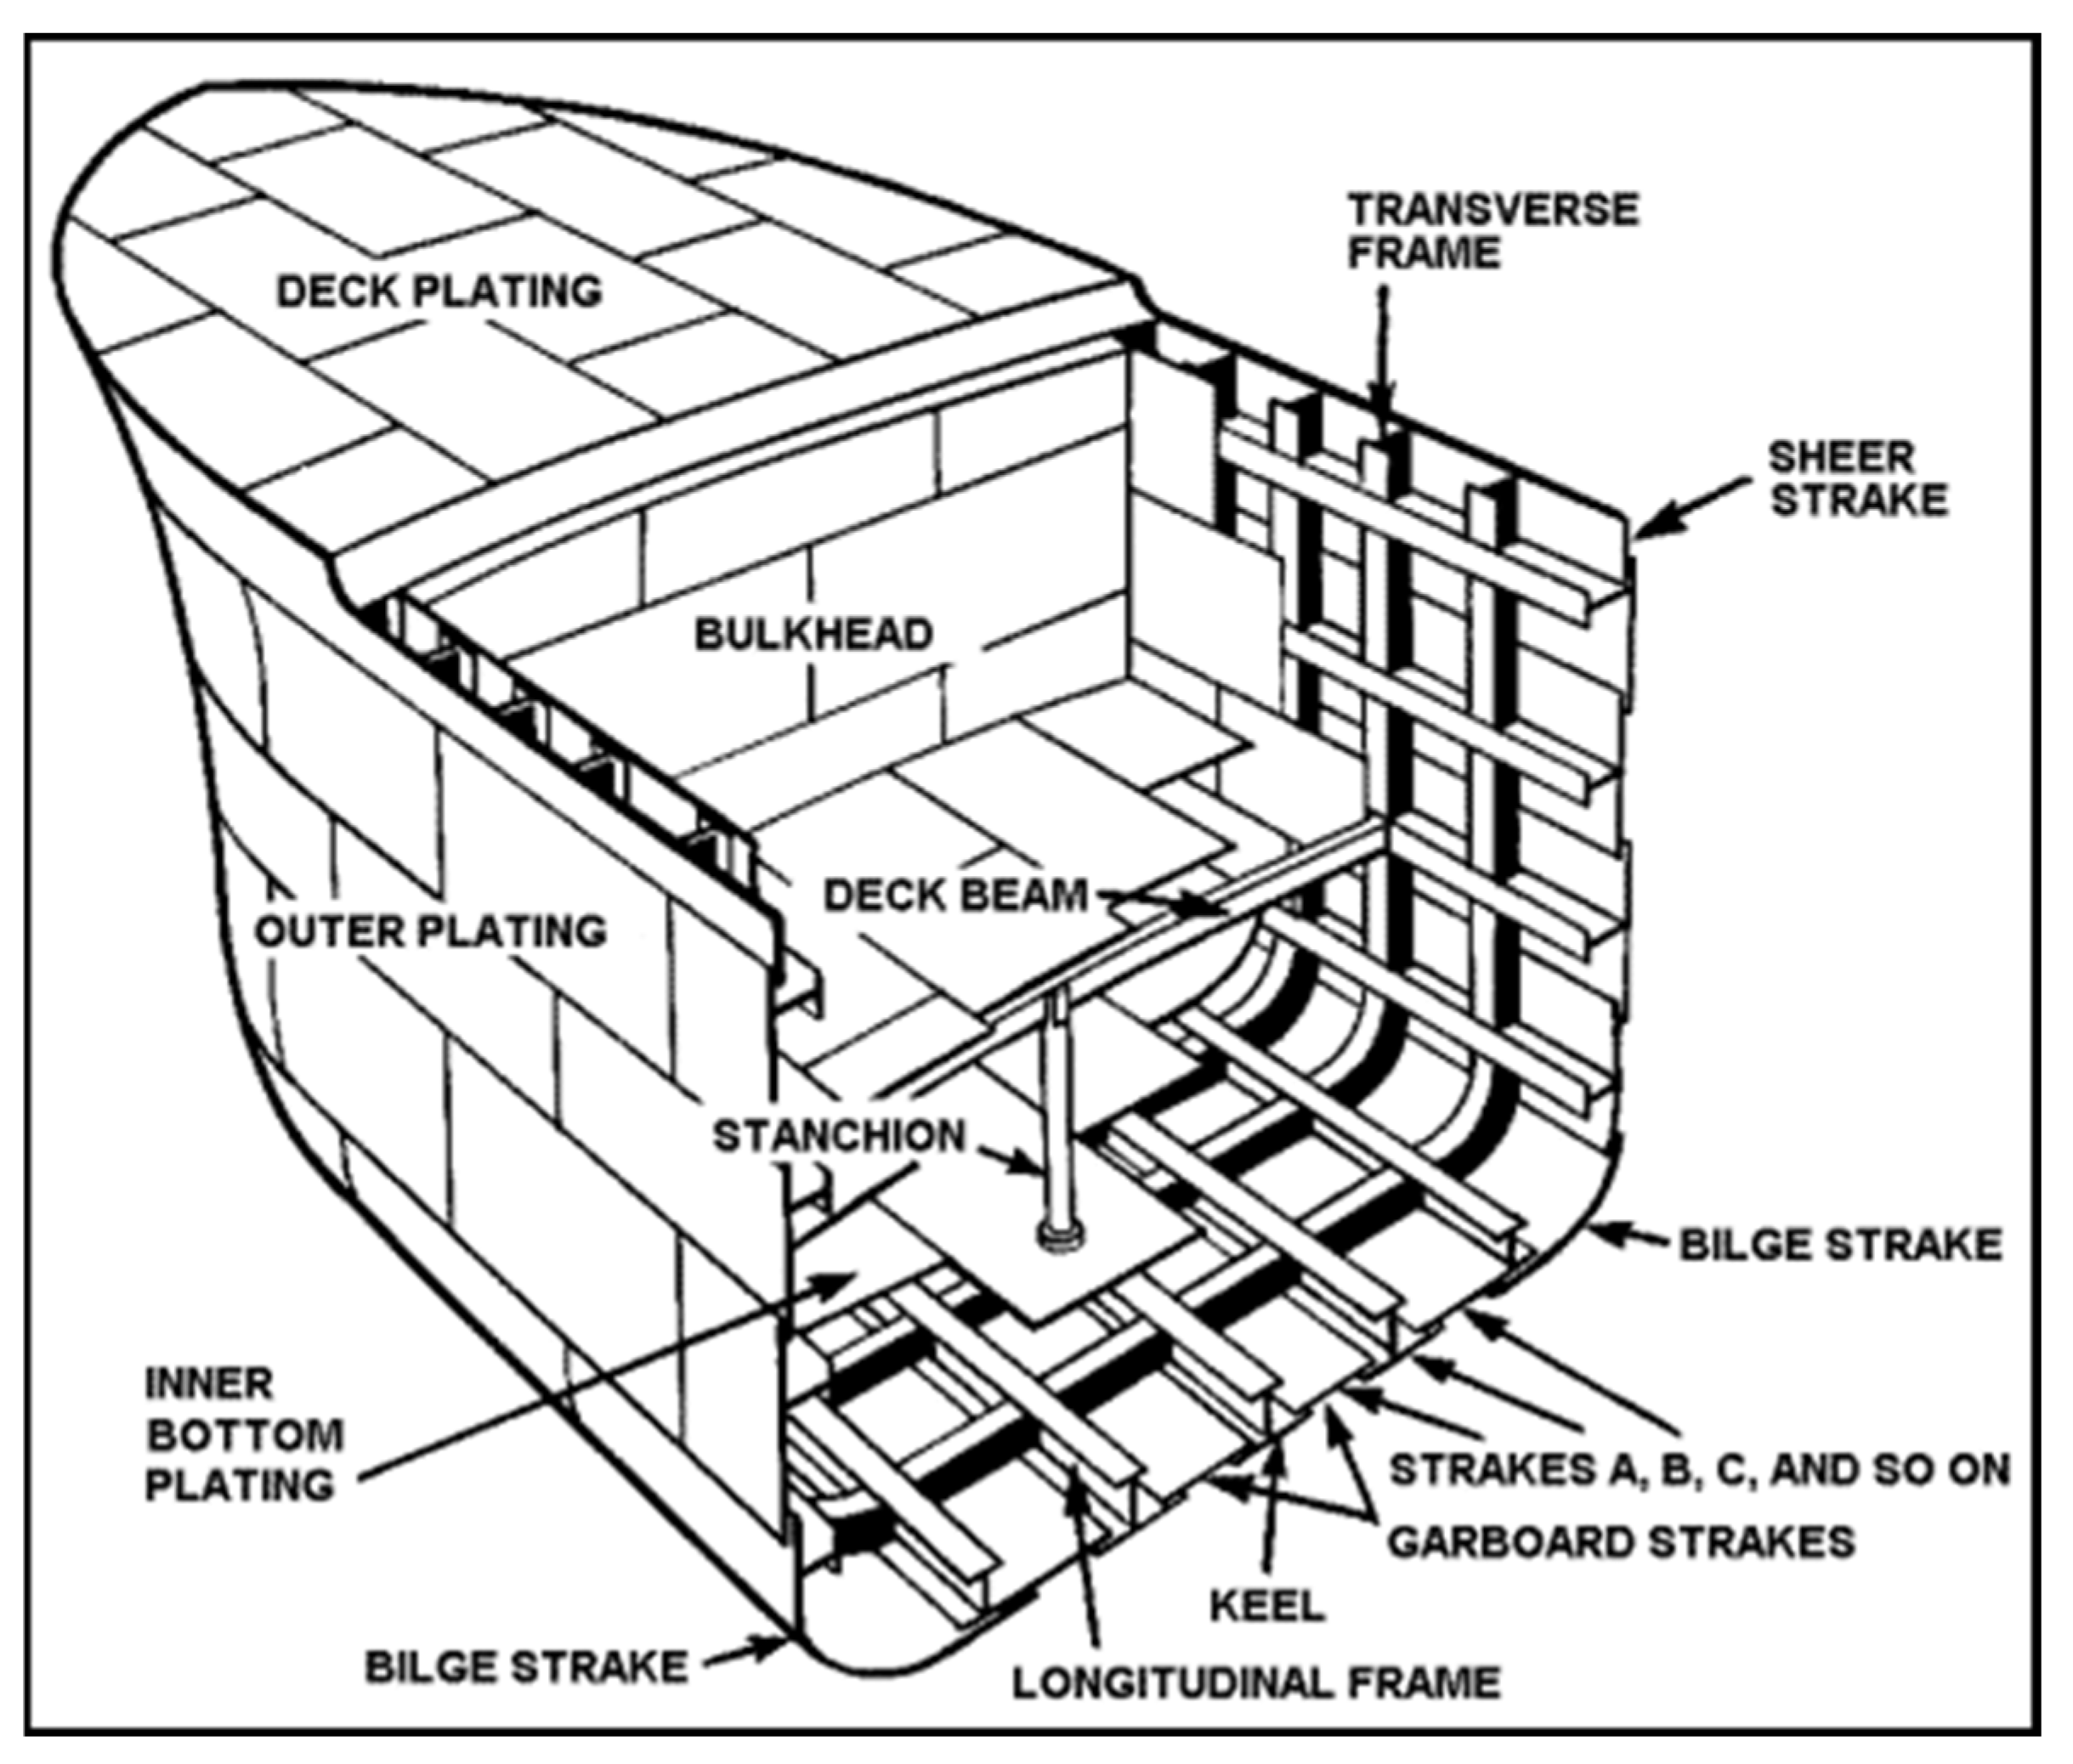
Figure 5.
Shows Uniform distributed weight on the beam.
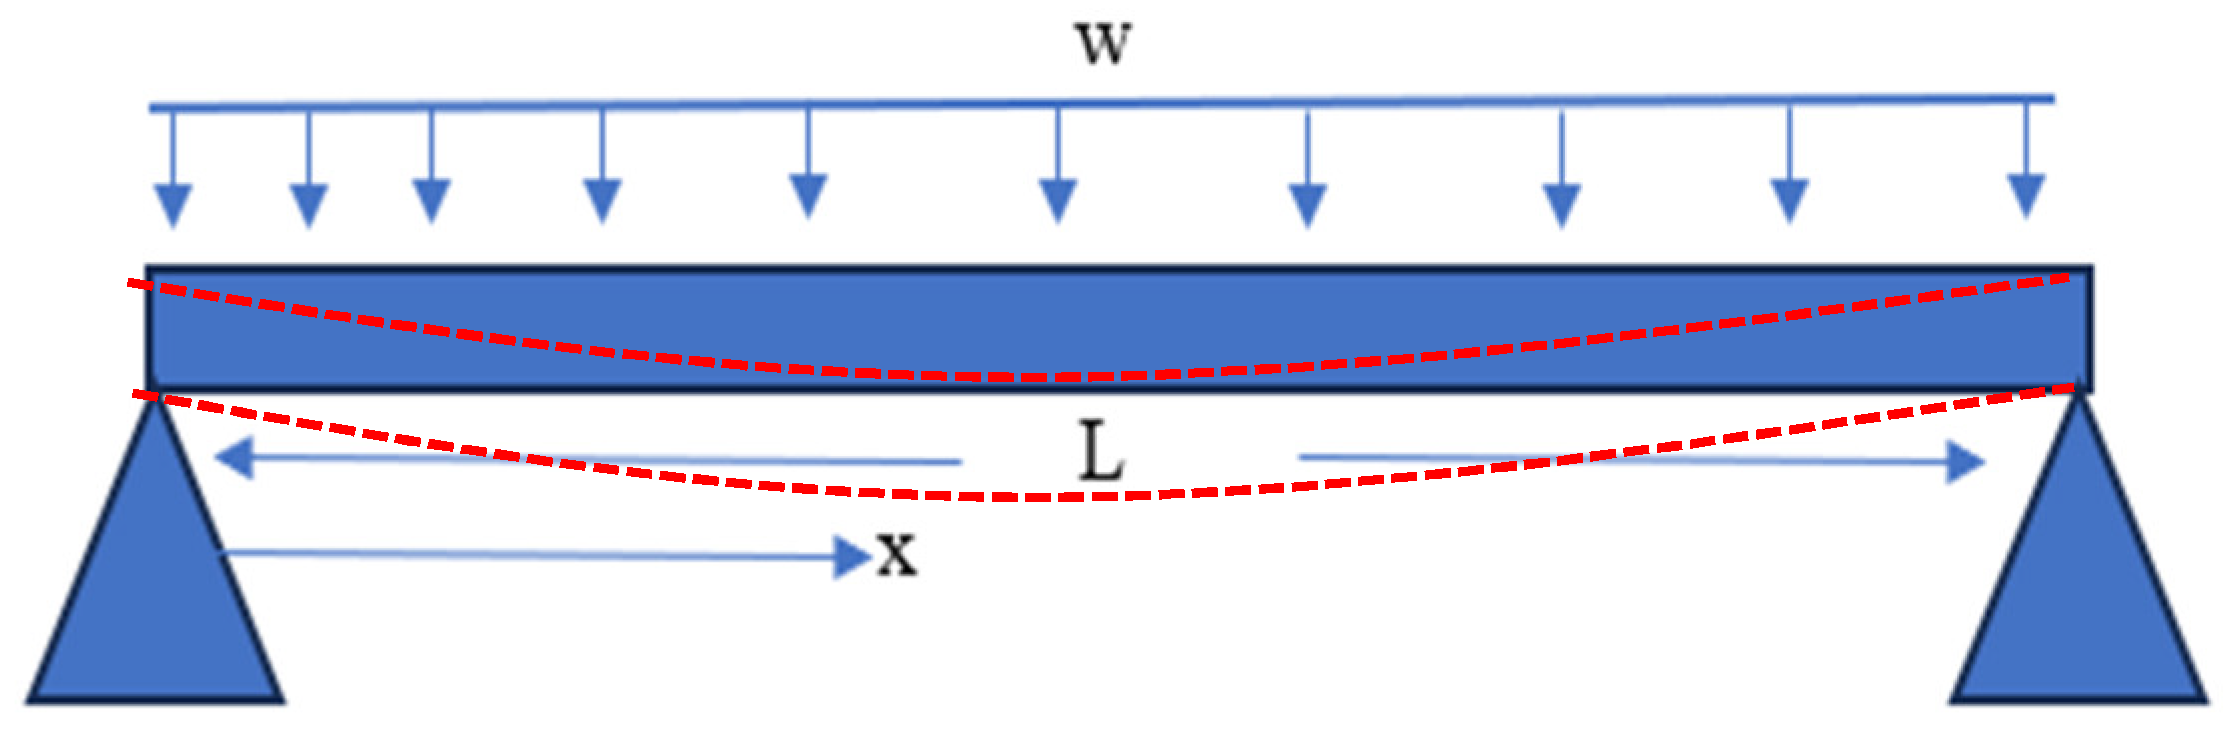
Figure 6.
Shows a beam with fixed support at the end with load concentration in the mid-section.
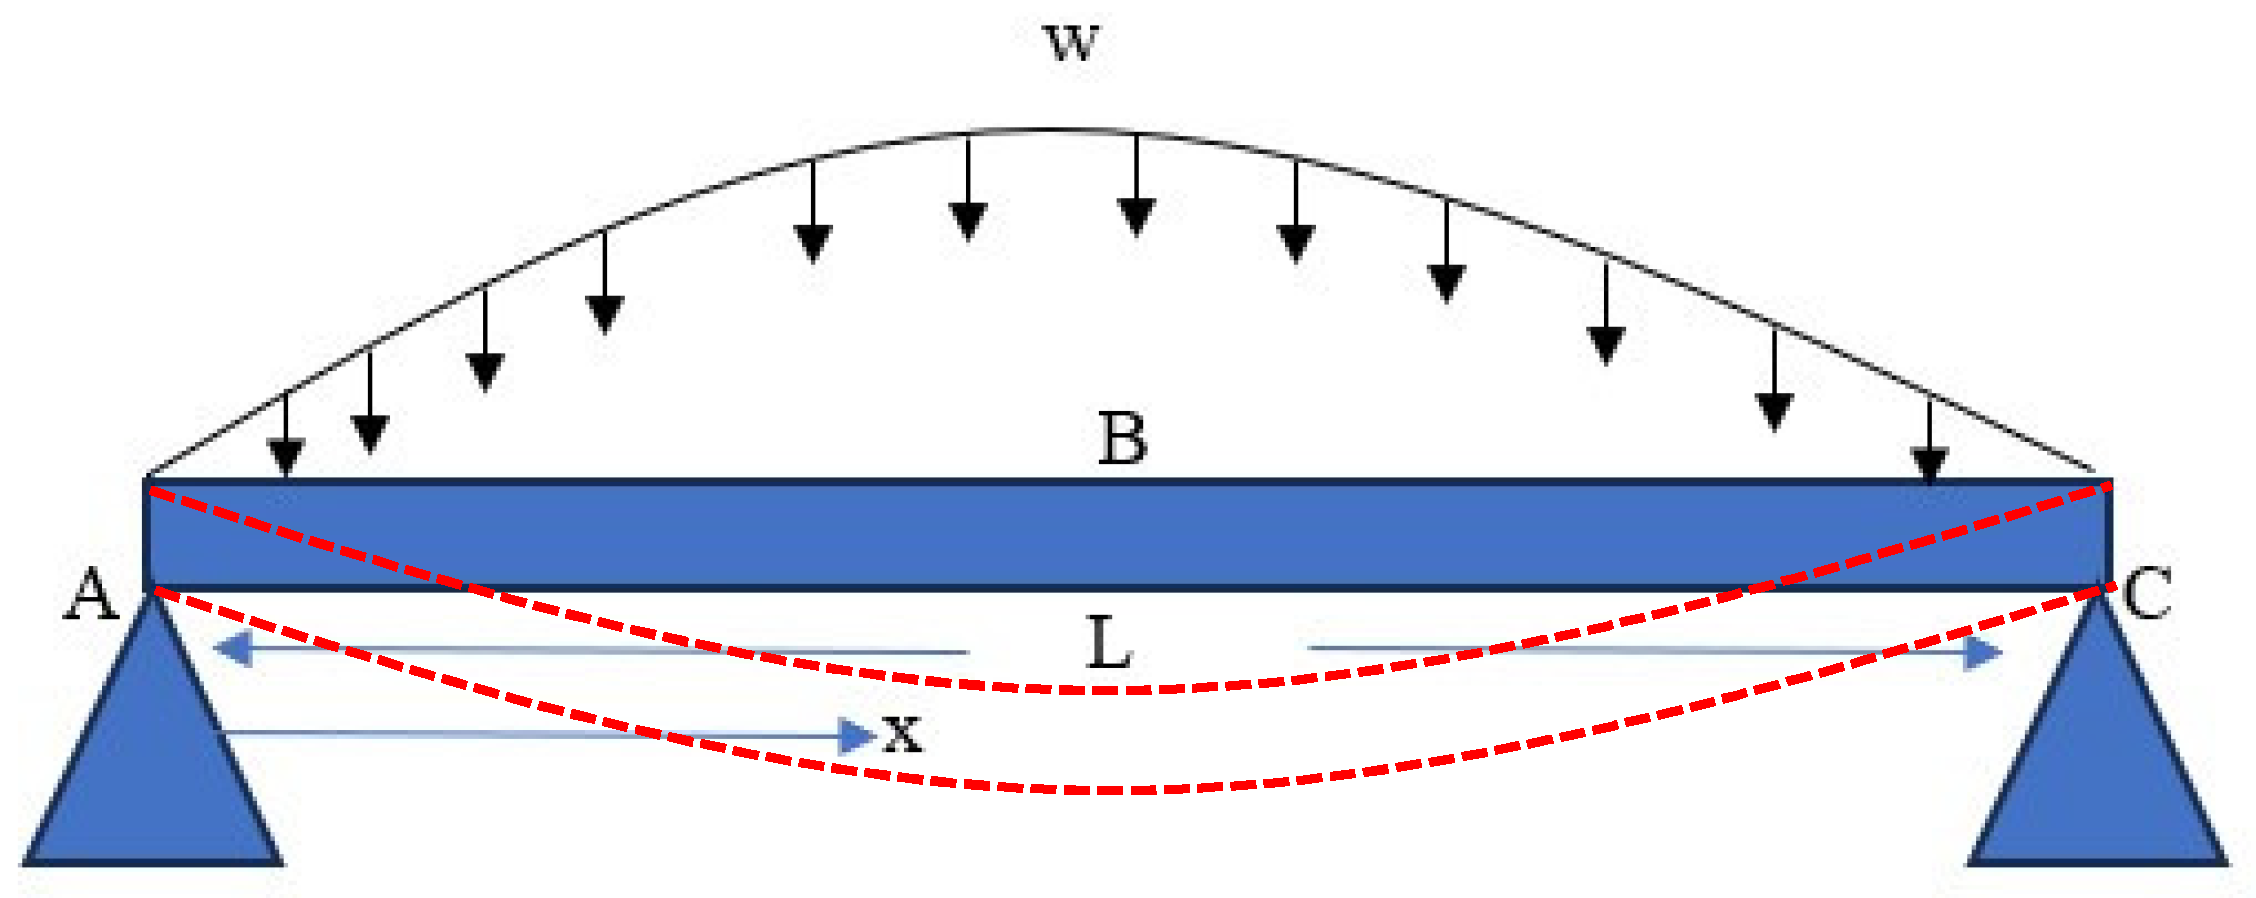
Figure 7.
Shows a Beam supported in the middle with Uniform load curved upward.
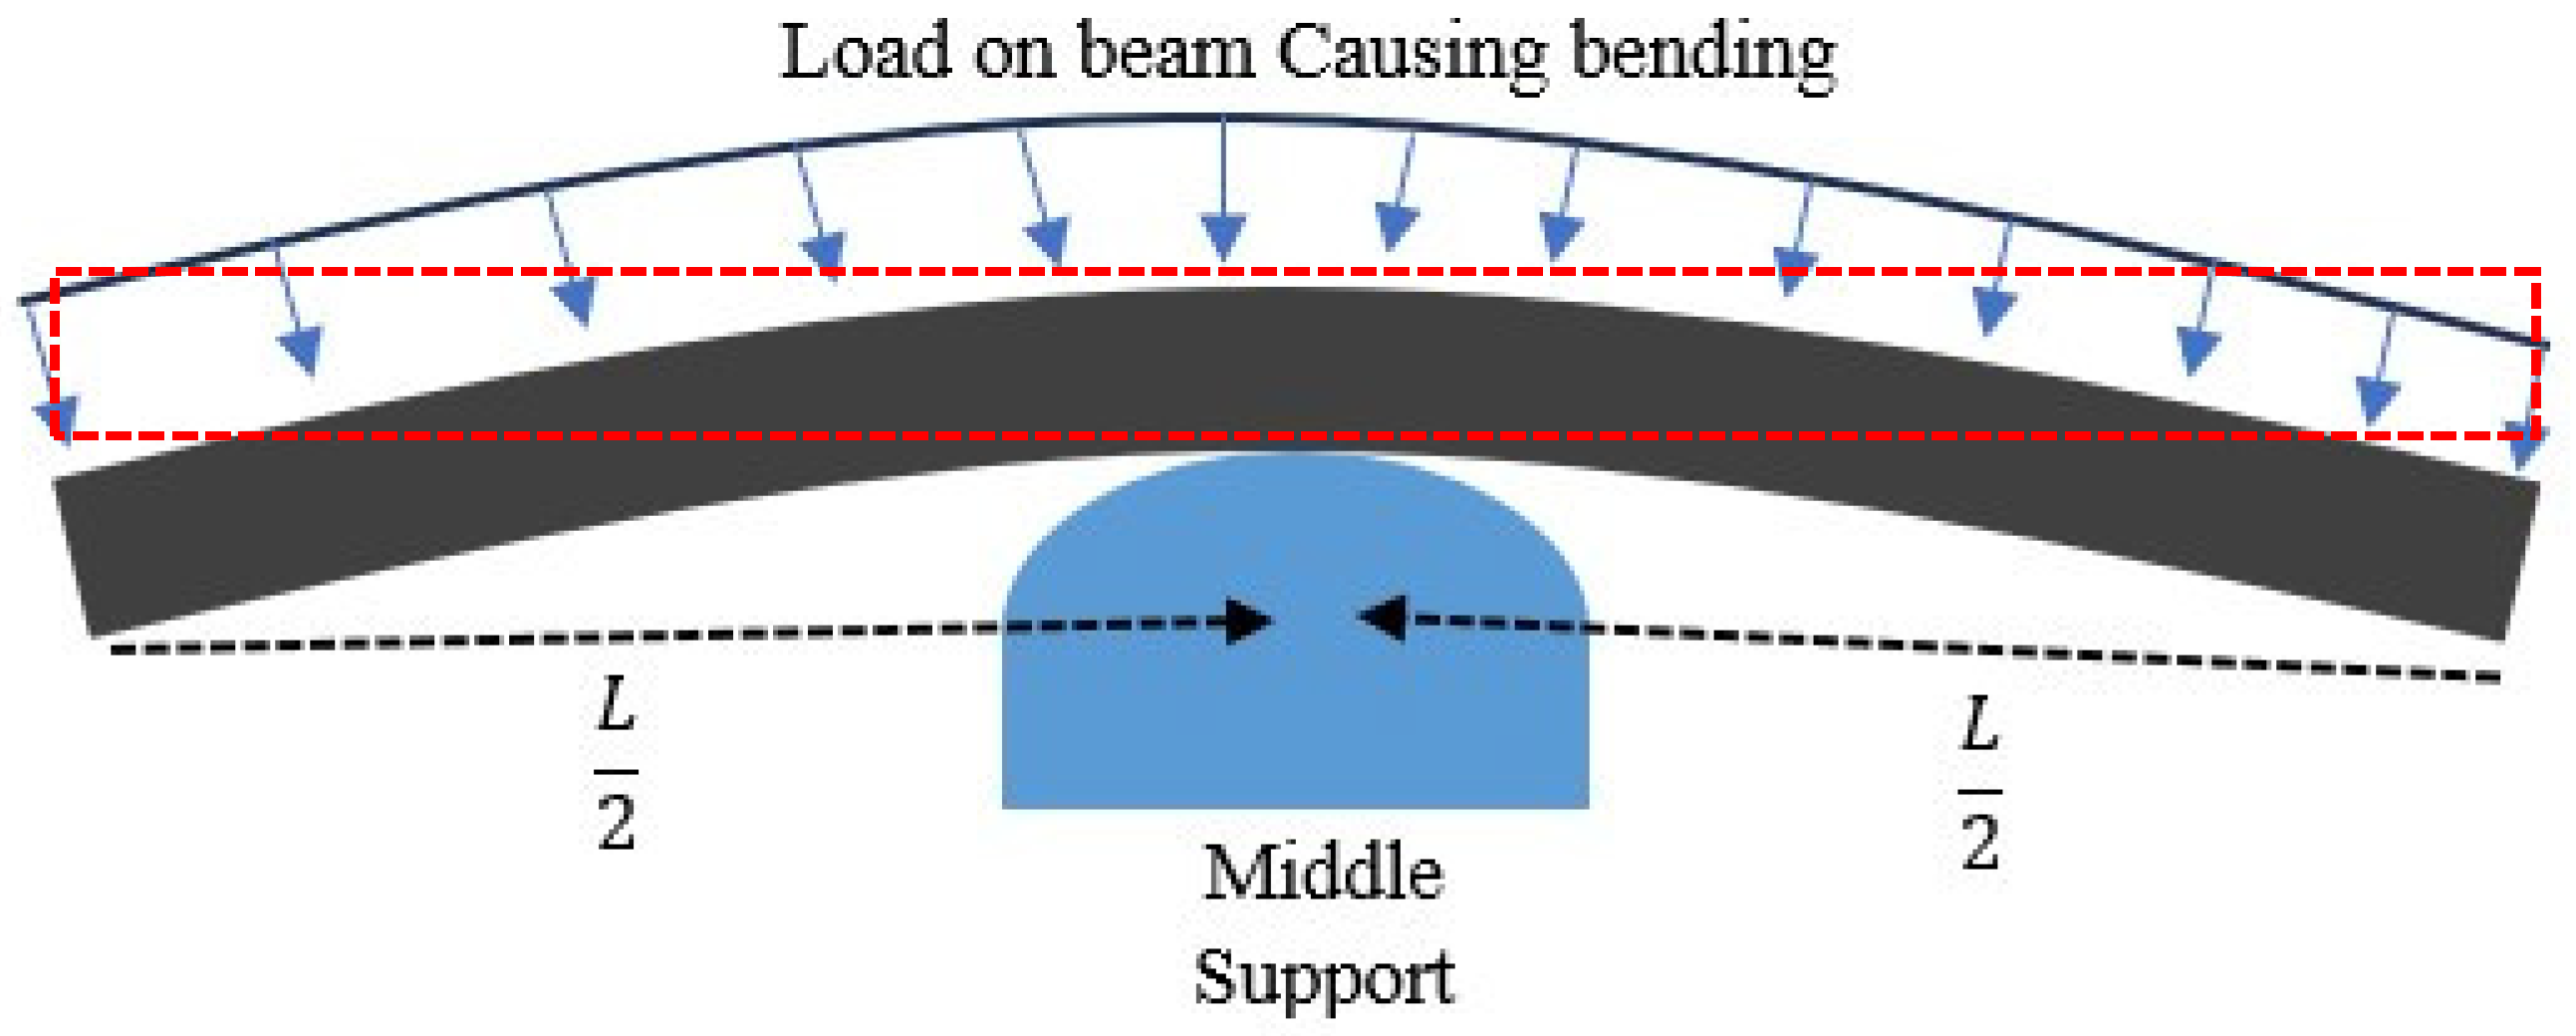
Figure 8.
Shows Support on one end with Uniform load distribution.
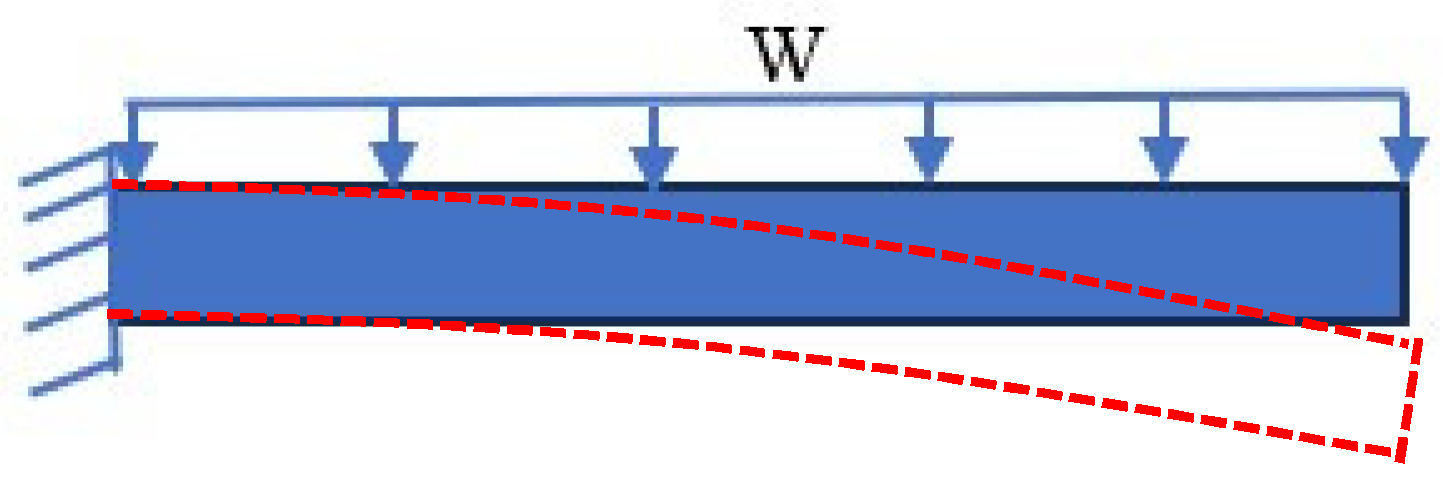
Figure 9.
Shows (a) double wave and (b) four wavy curve each interconnected.
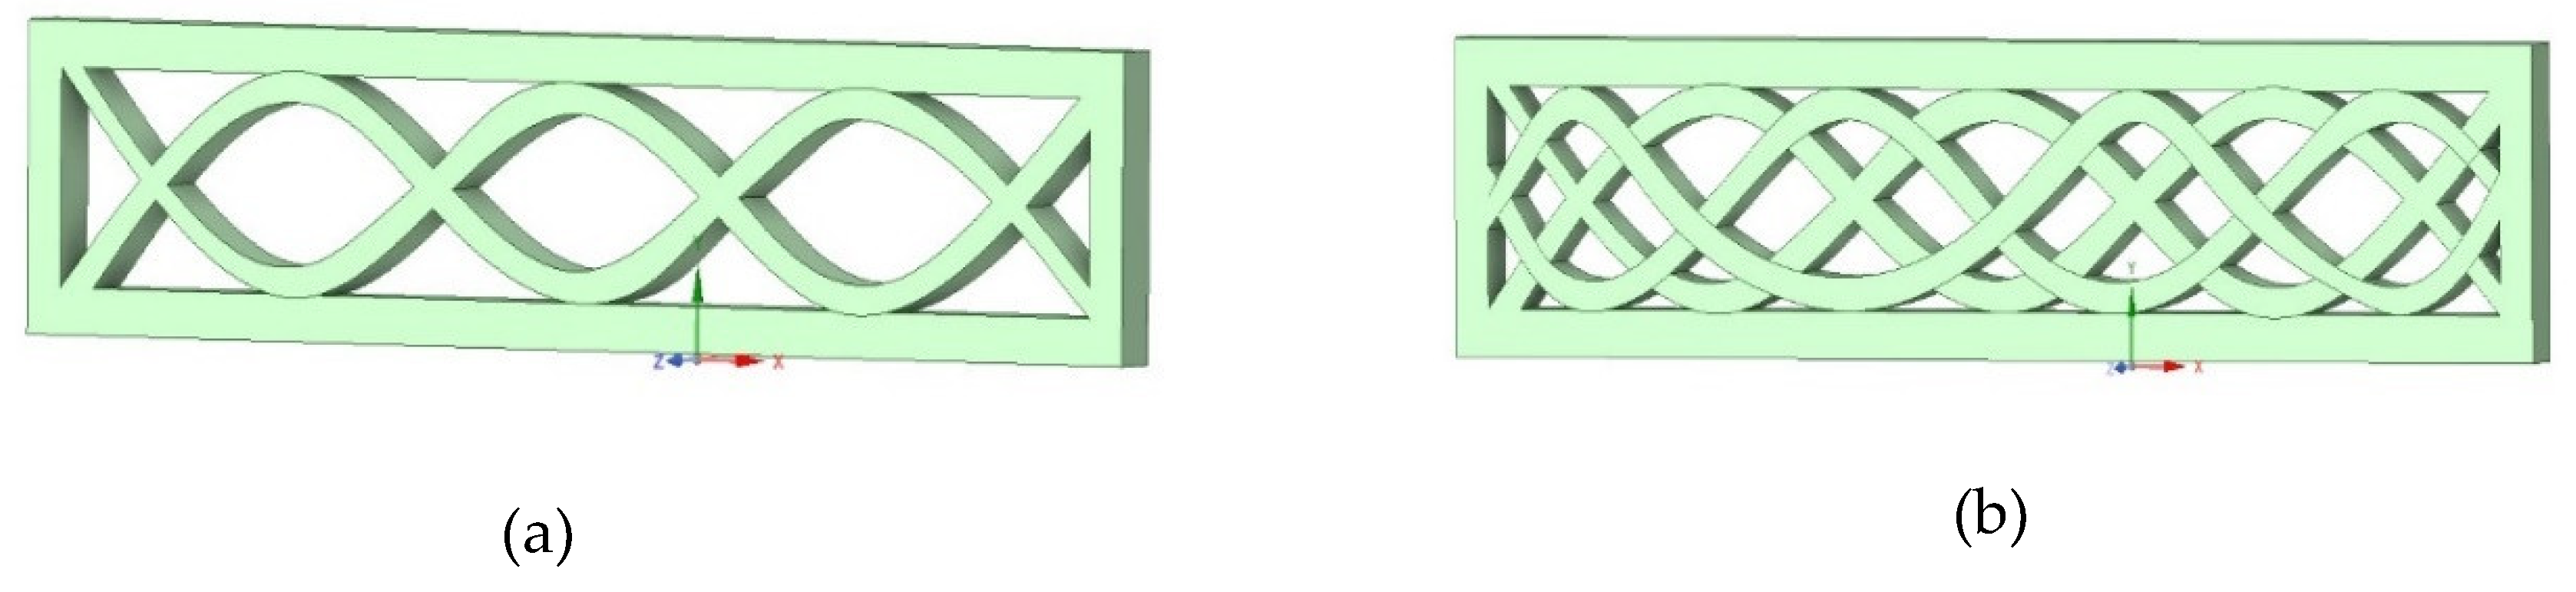
Figure 10.
Shows generating four curves for the Ship side strength improve in figure above.
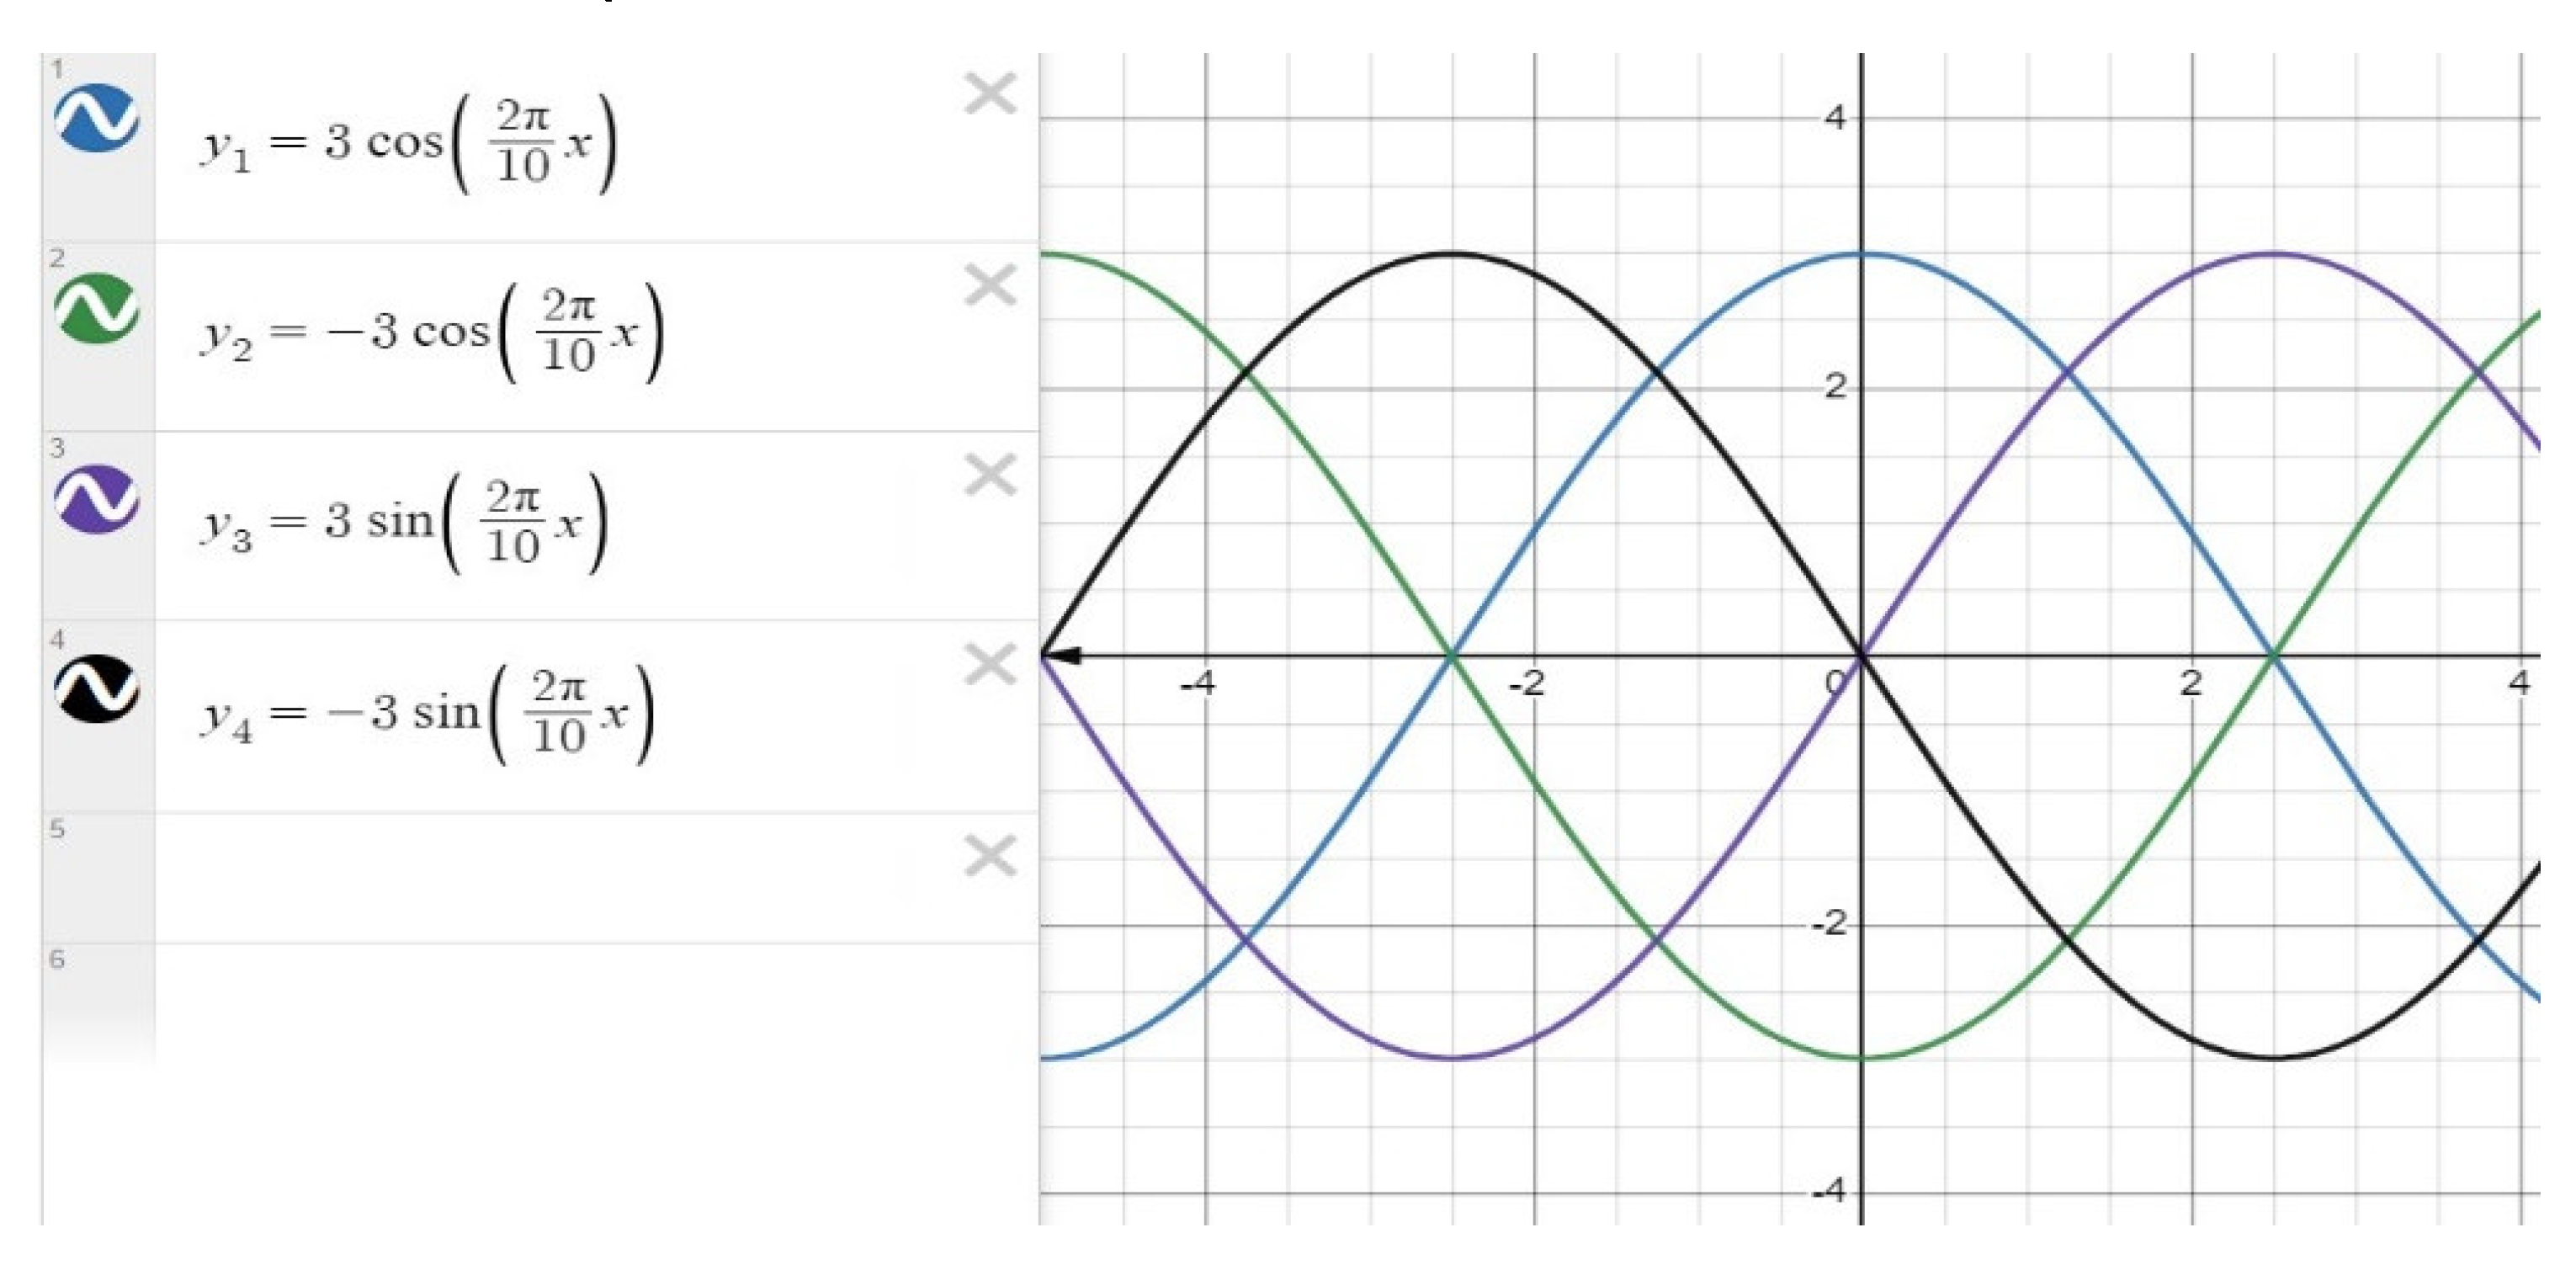
Figure 11.
Shows Wave lateral Frame stiffening with curved top have curved support.
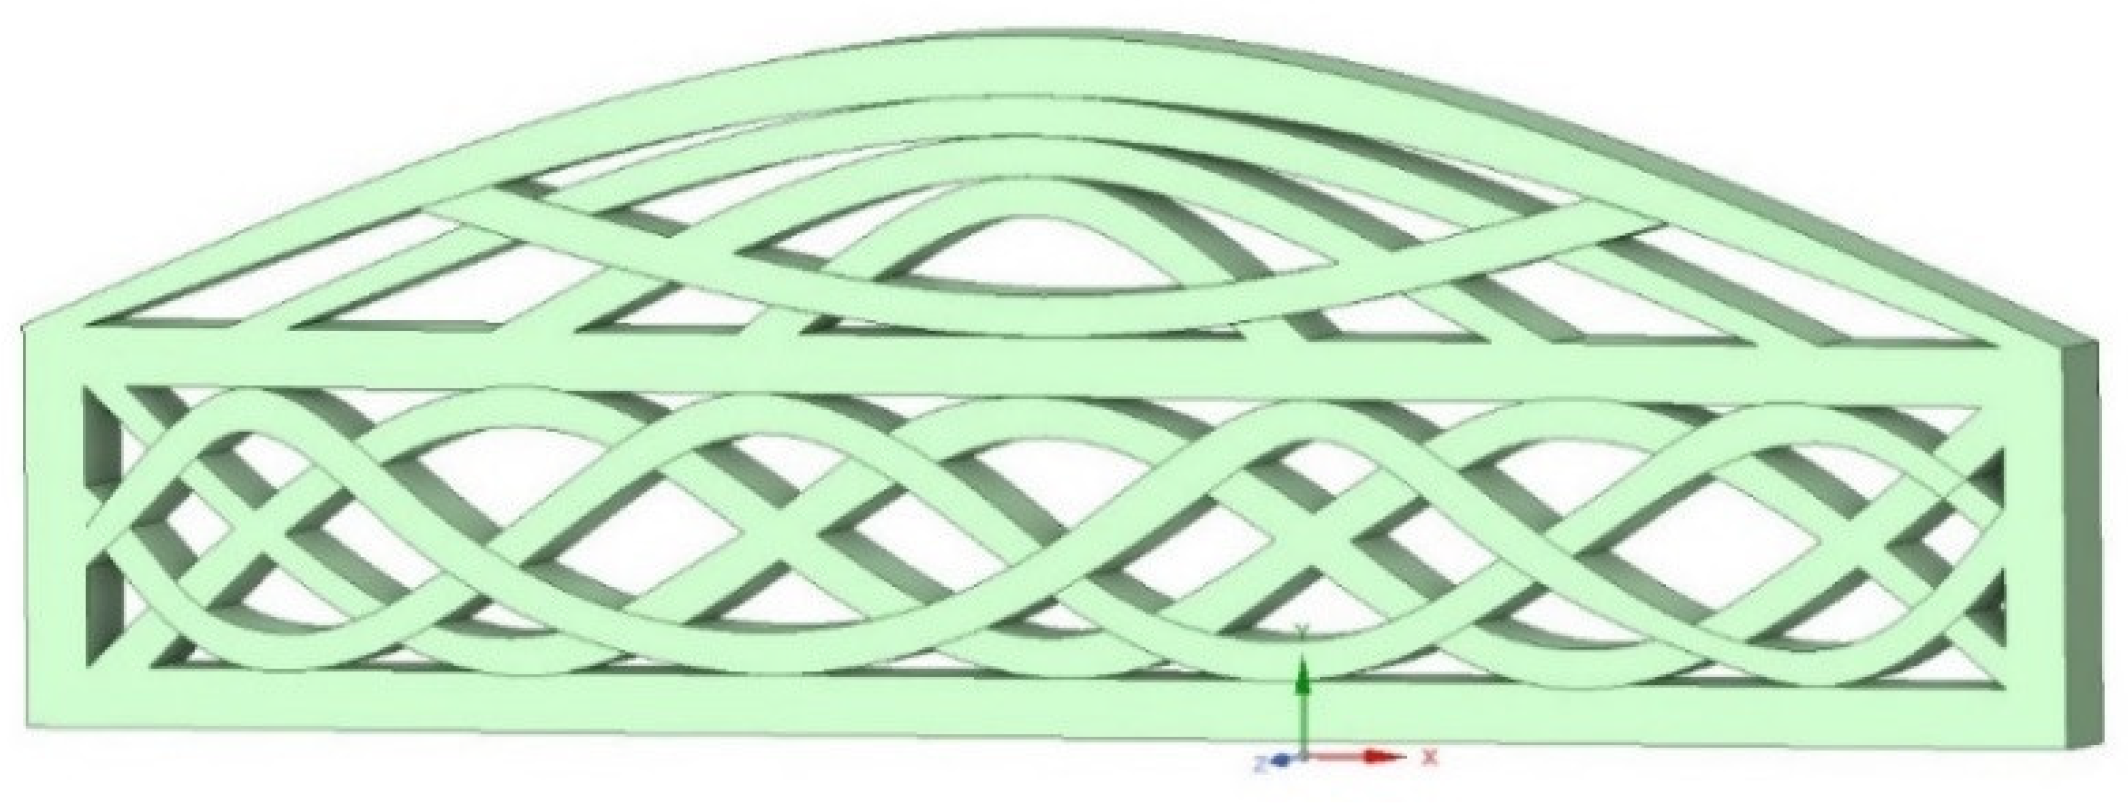
Figure 12.
Shows (a) frame with curved stiffening, (b) frame with star stiffening, (c) conventional frame with longitudinal and traverse line and (d) Frame with zigzag stiffening.
Figure 12.
Shows (a) frame with curved stiffening, (b) frame with star stiffening, (c) conventional frame with longitudinal and traverse line and (d) Frame with zigzag stiffening.
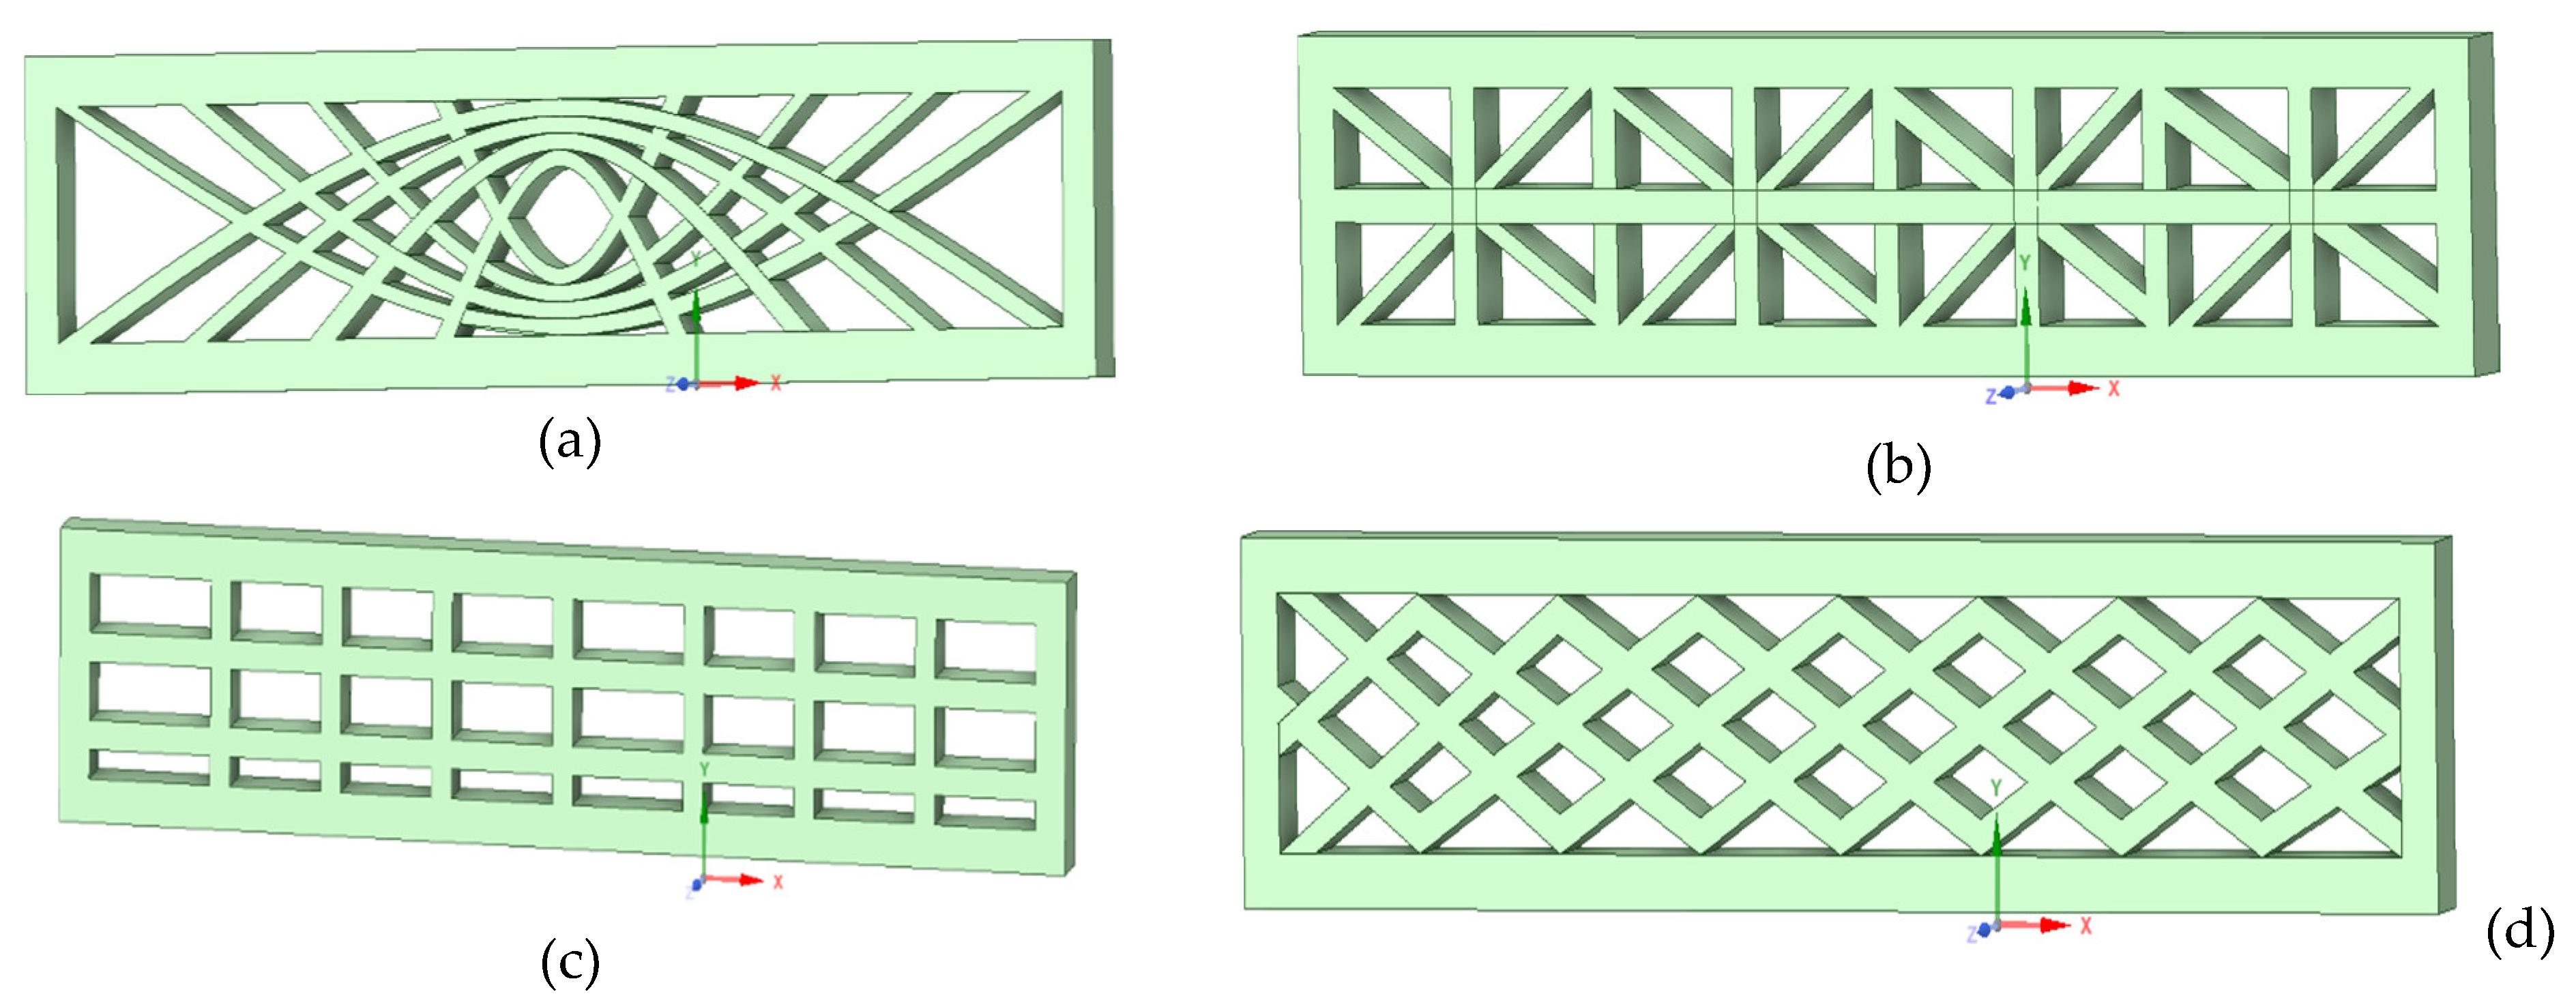
Figure 13.
(a) shows 3 curved upward and (b) combination of 3 curved upward and two curved downward support upward and (c) further reinforcement of the curved support and wavy lateral plate stiffening.
Figure 13.
(a) shows 3 curved upward and (b) combination of 3 curved upward and two curved downward support upward and (c) further reinforcement of the curved support and wavy lateral plate stiffening.

Figure 14.
Shows (a) curve Suspension Support in (b) Heavy Vehicle Suspension Spring: Credit Image got from Internet.
Figure 14.
Shows (a) curve Suspension Support in (b) Heavy Vehicle Suspension Spring: Credit Image got from Internet.
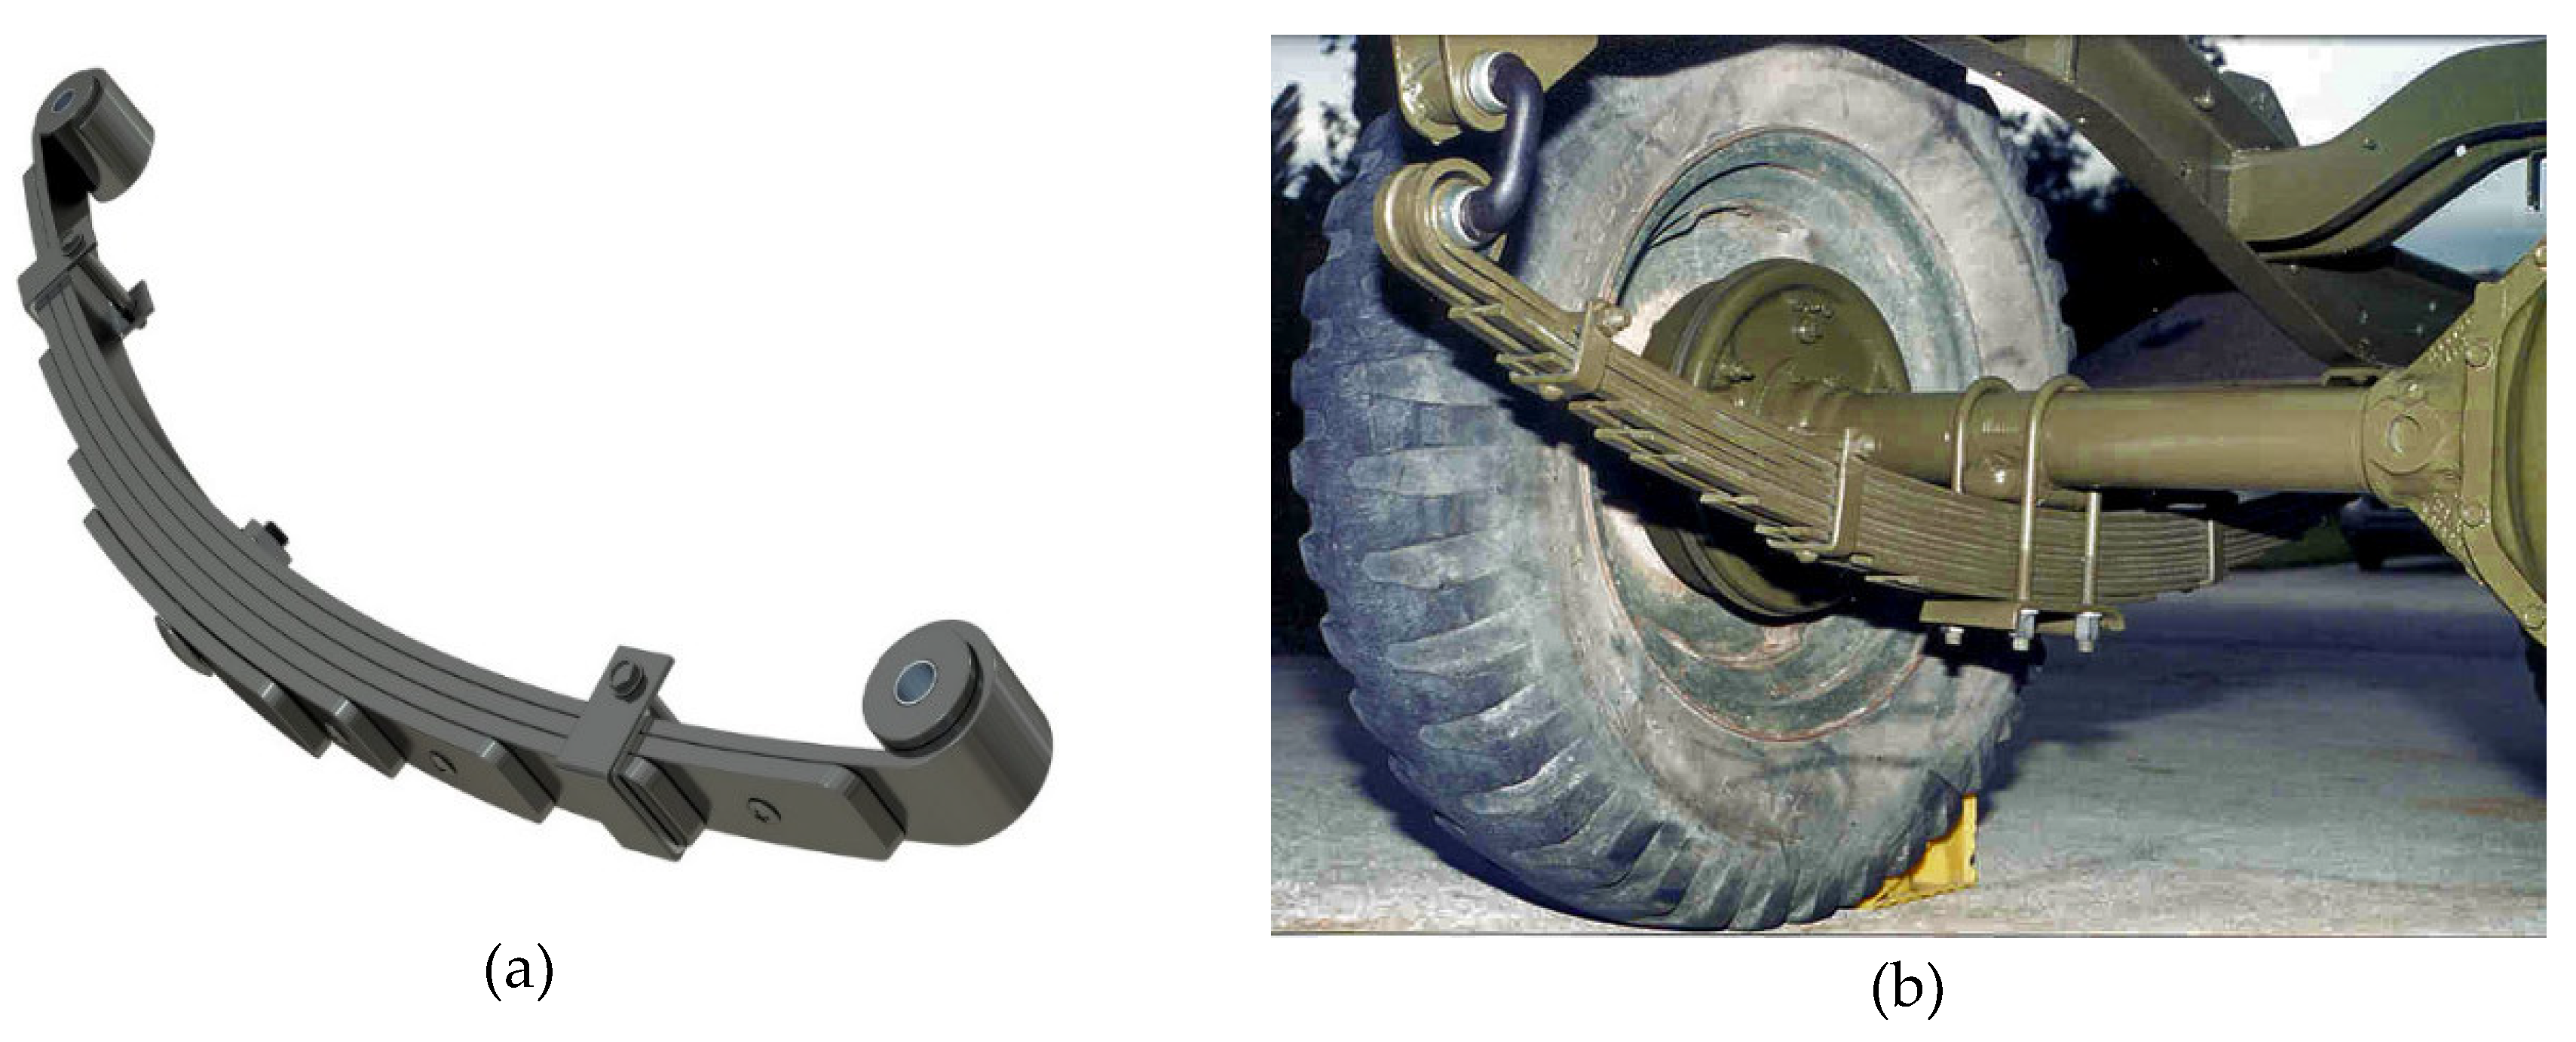
Figure 15.
Shows (a-b) curved Bridge Structure for increasing structural strength.
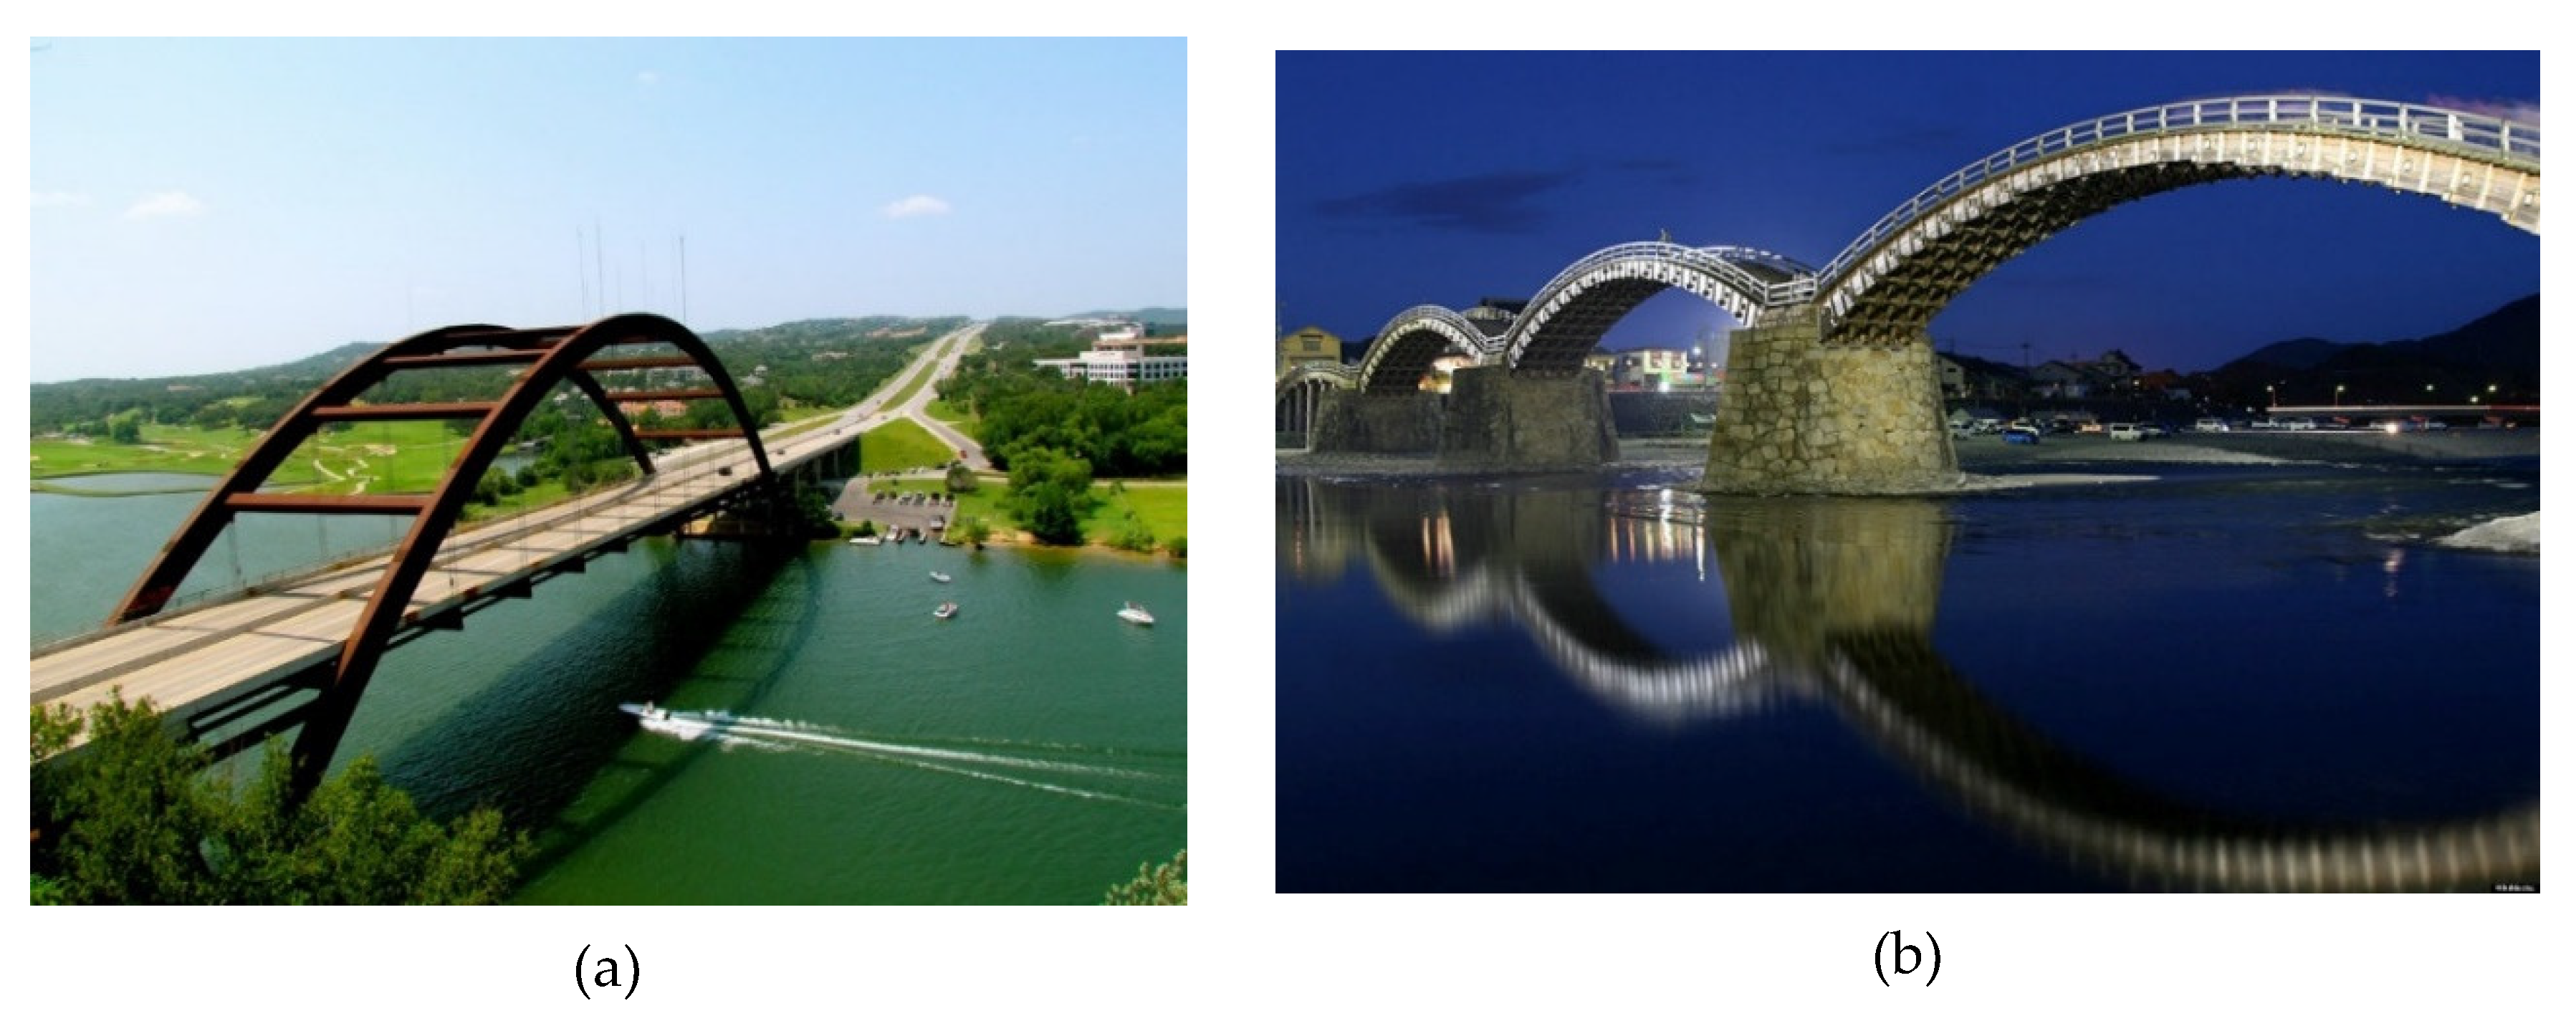
Figure 16.
Shows a sample flatbed Vessel with Curved Support and laterally stiffened side from bow to stern.
Figure 16.
Shows a sample flatbed Vessel with Curved Support and laterally stiffened side from bow to stern.
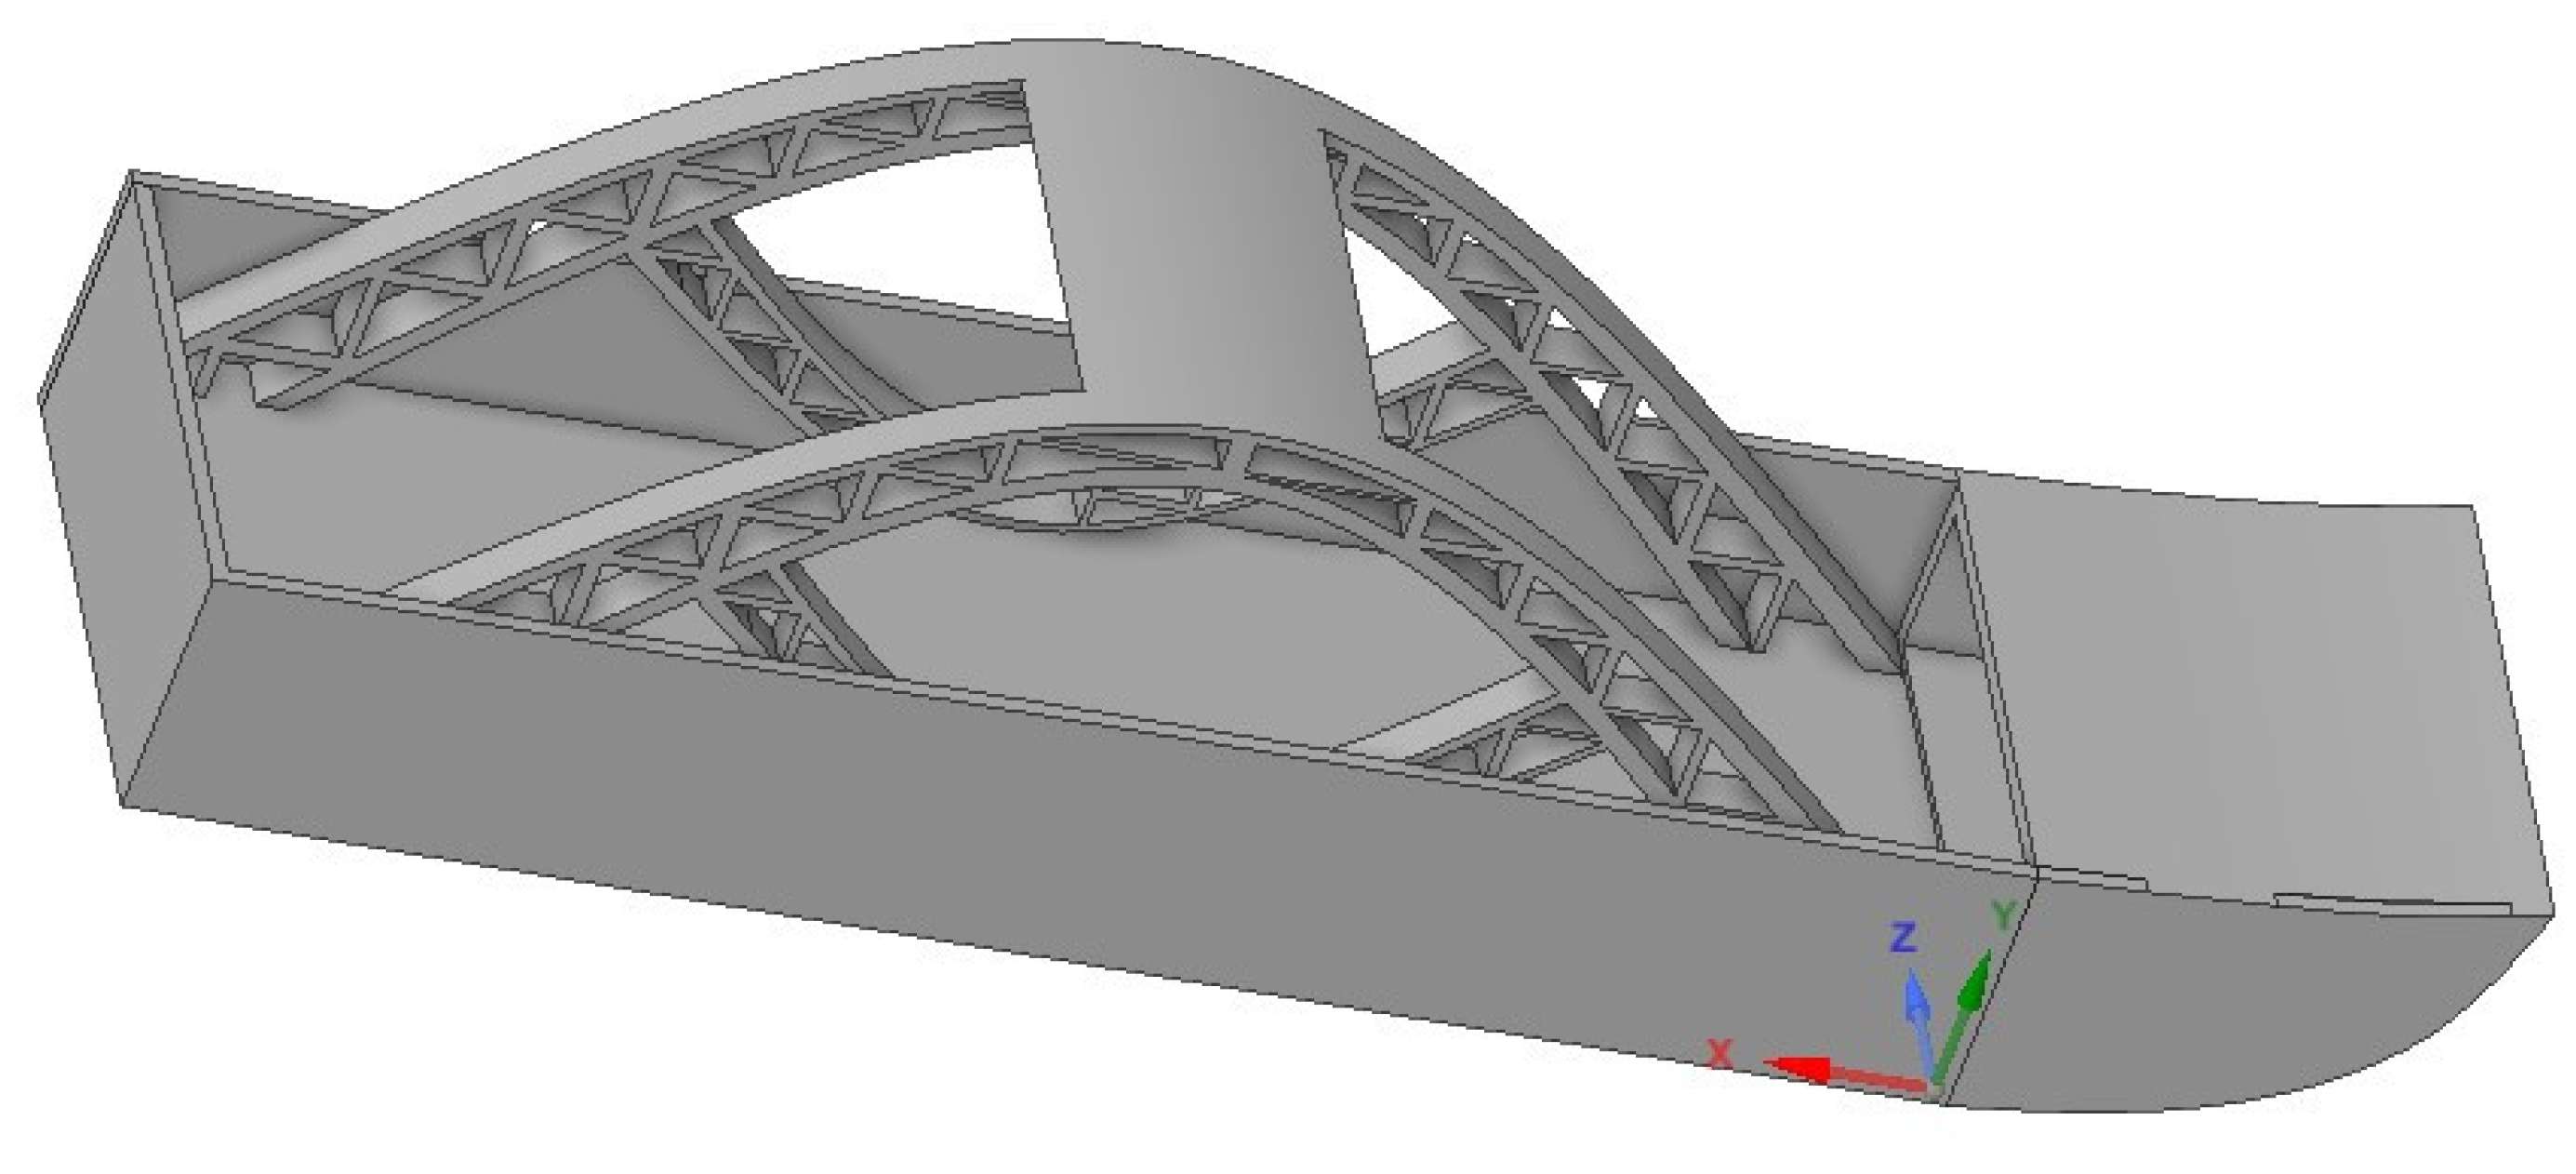
Figure 17.
Shows a sample further Reinforcement of Figure 16 with many strings-like support attached to the bed of the Vessel and the curve.
Figure 17.
Shows a sample further Reinforcement of Figure 16 with many strings-like support attached to the bed of the Vessel and the curve.
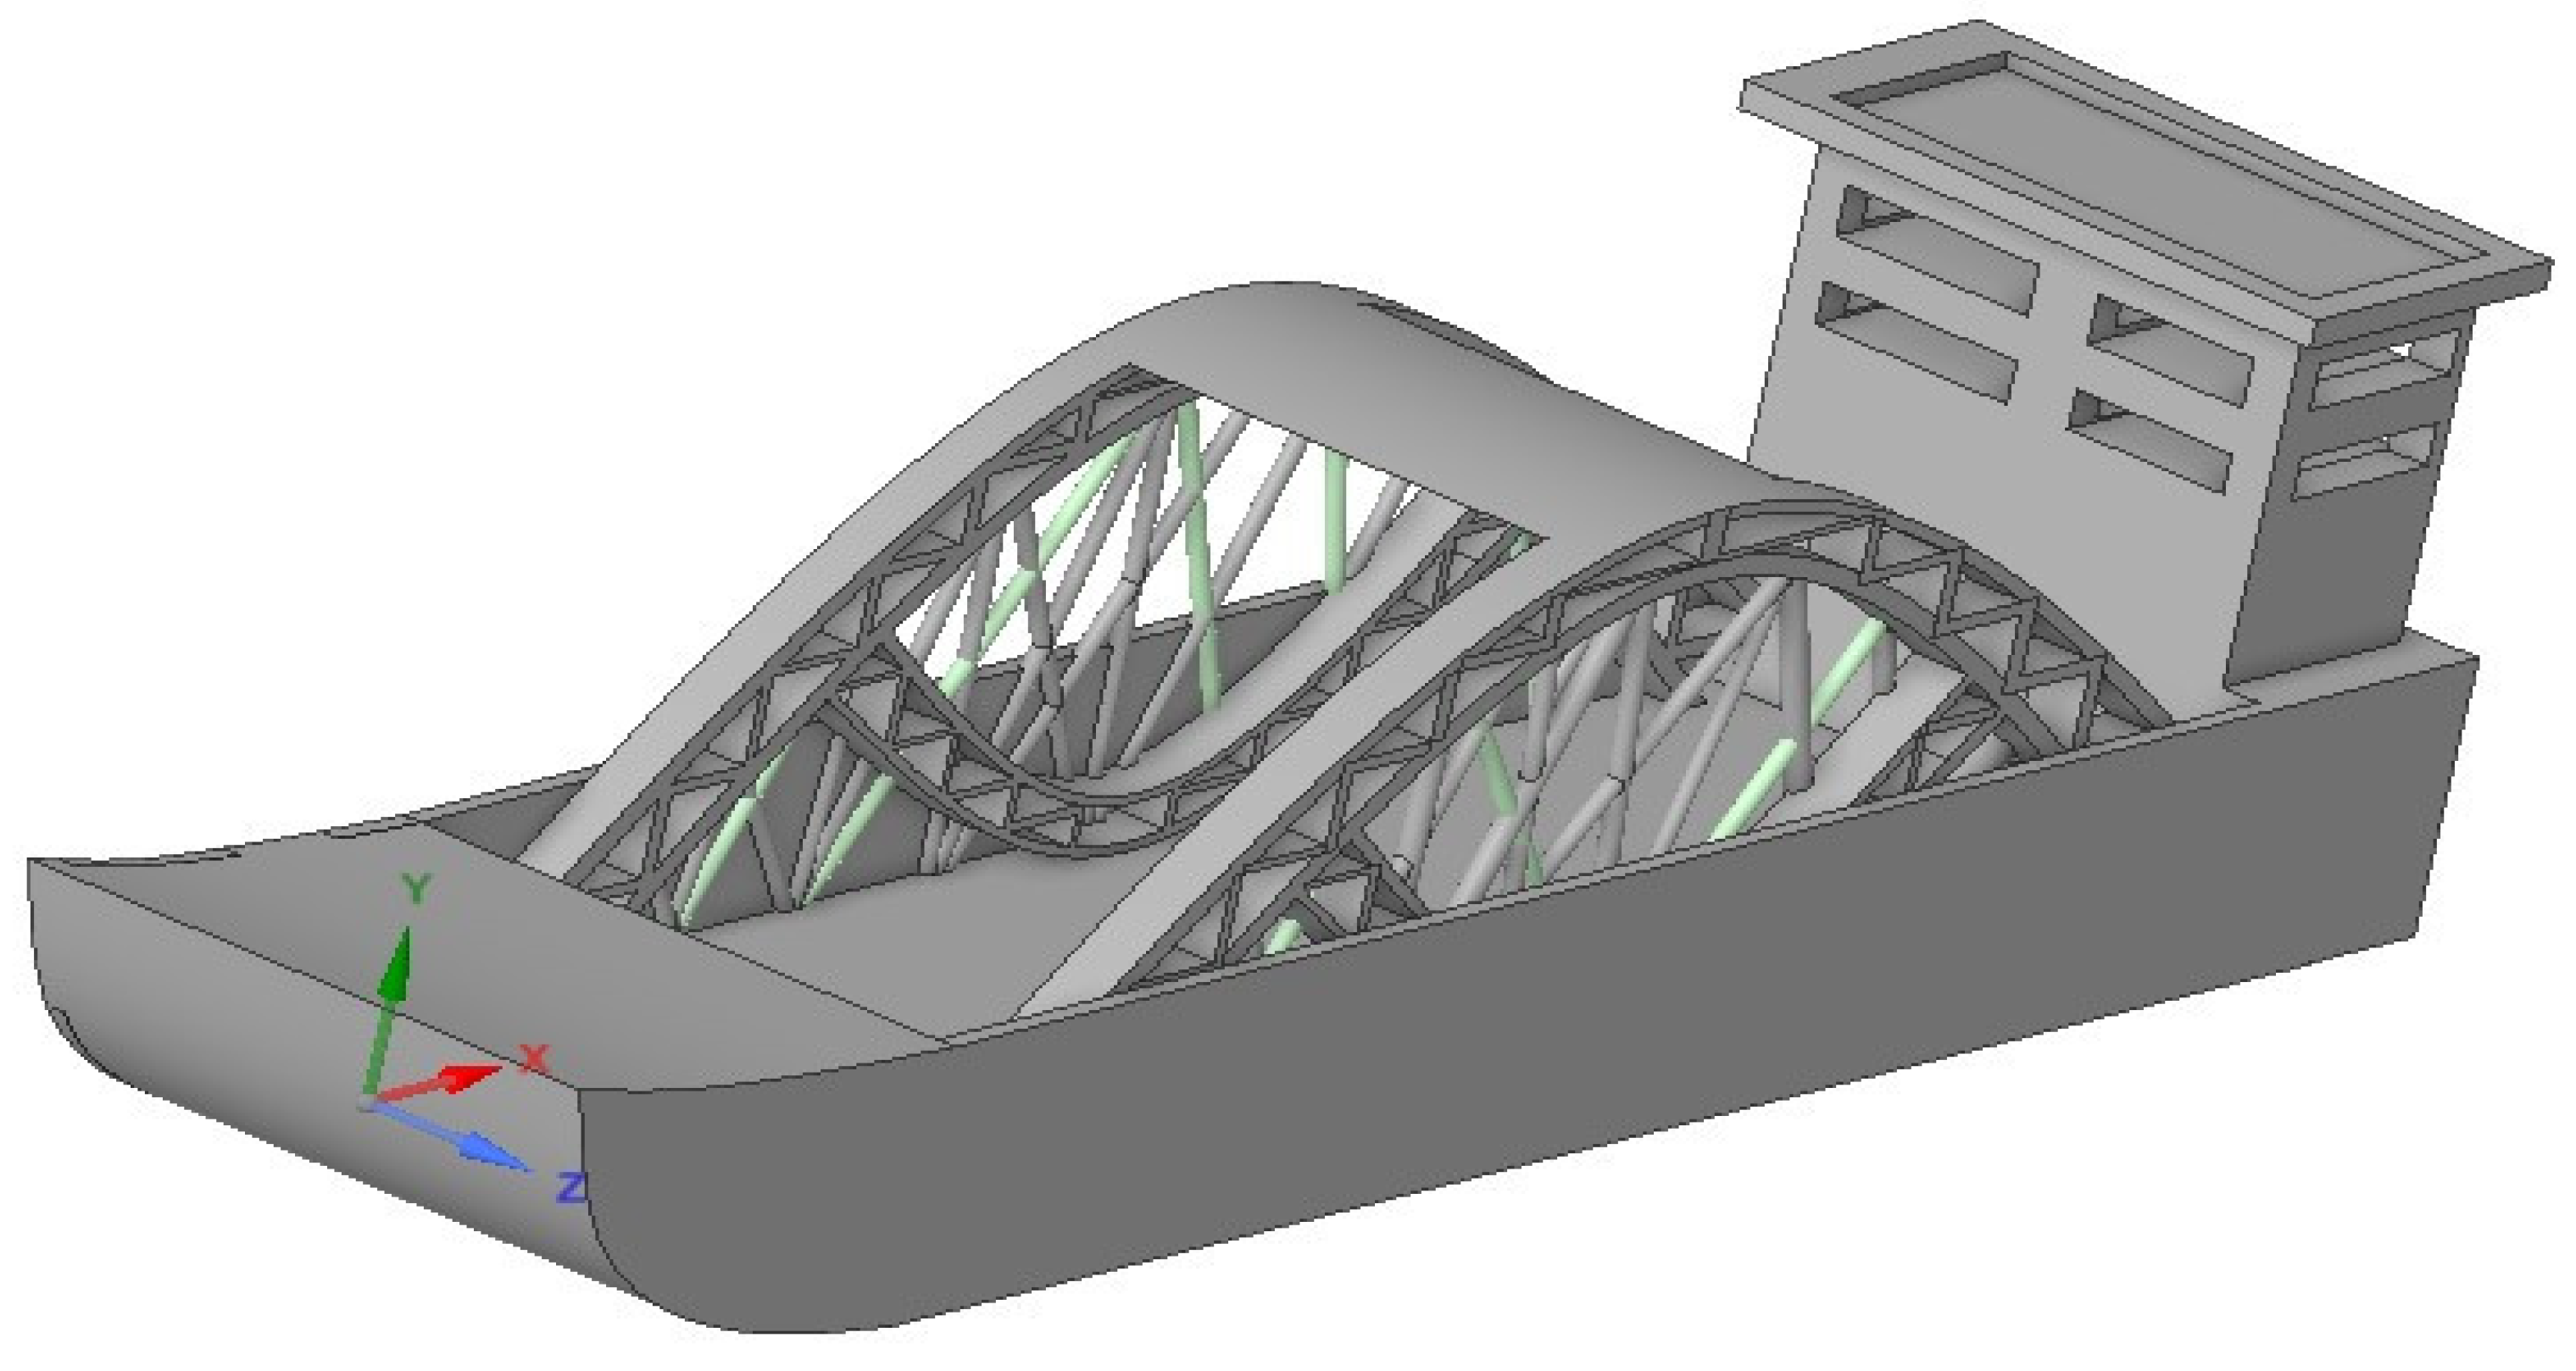
Figure 18.
Shows Frame used as boundary for creating the pattern.
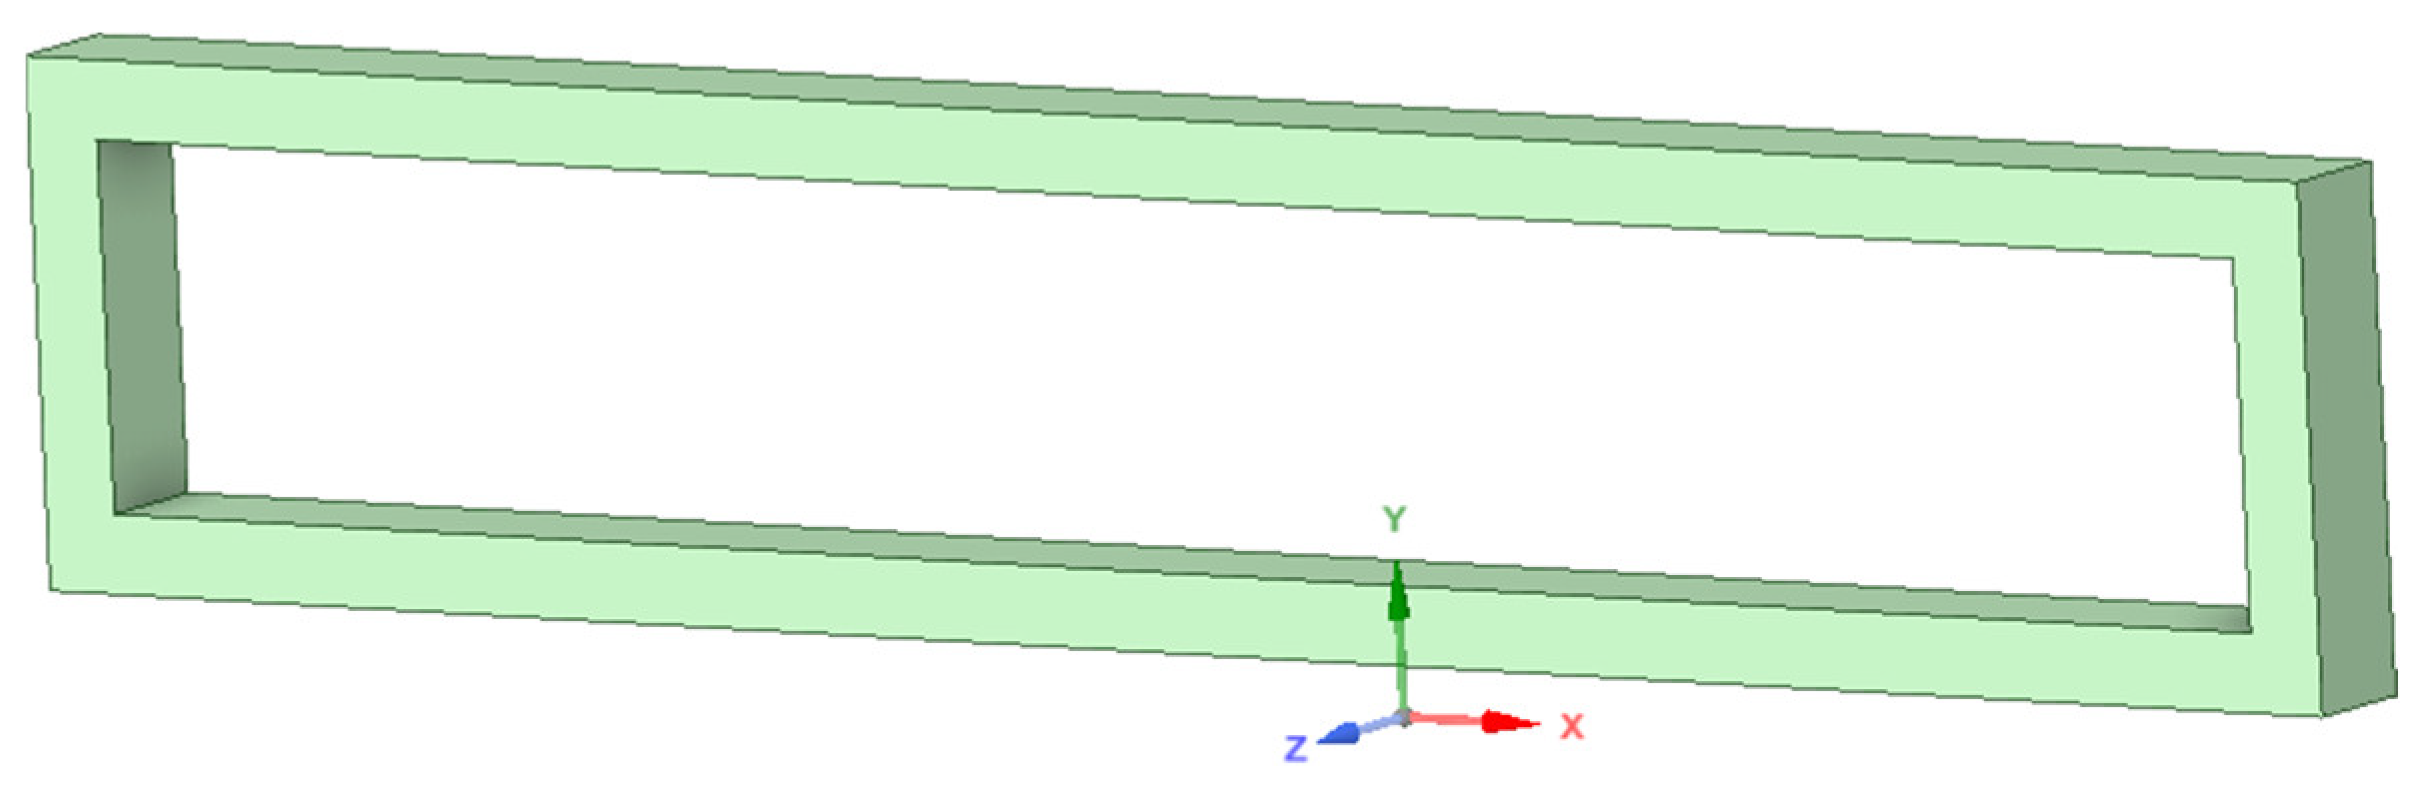
Figure 19.
Shows Sample Load and Fixed Support on the Wavy Plate lateral Stiffening.
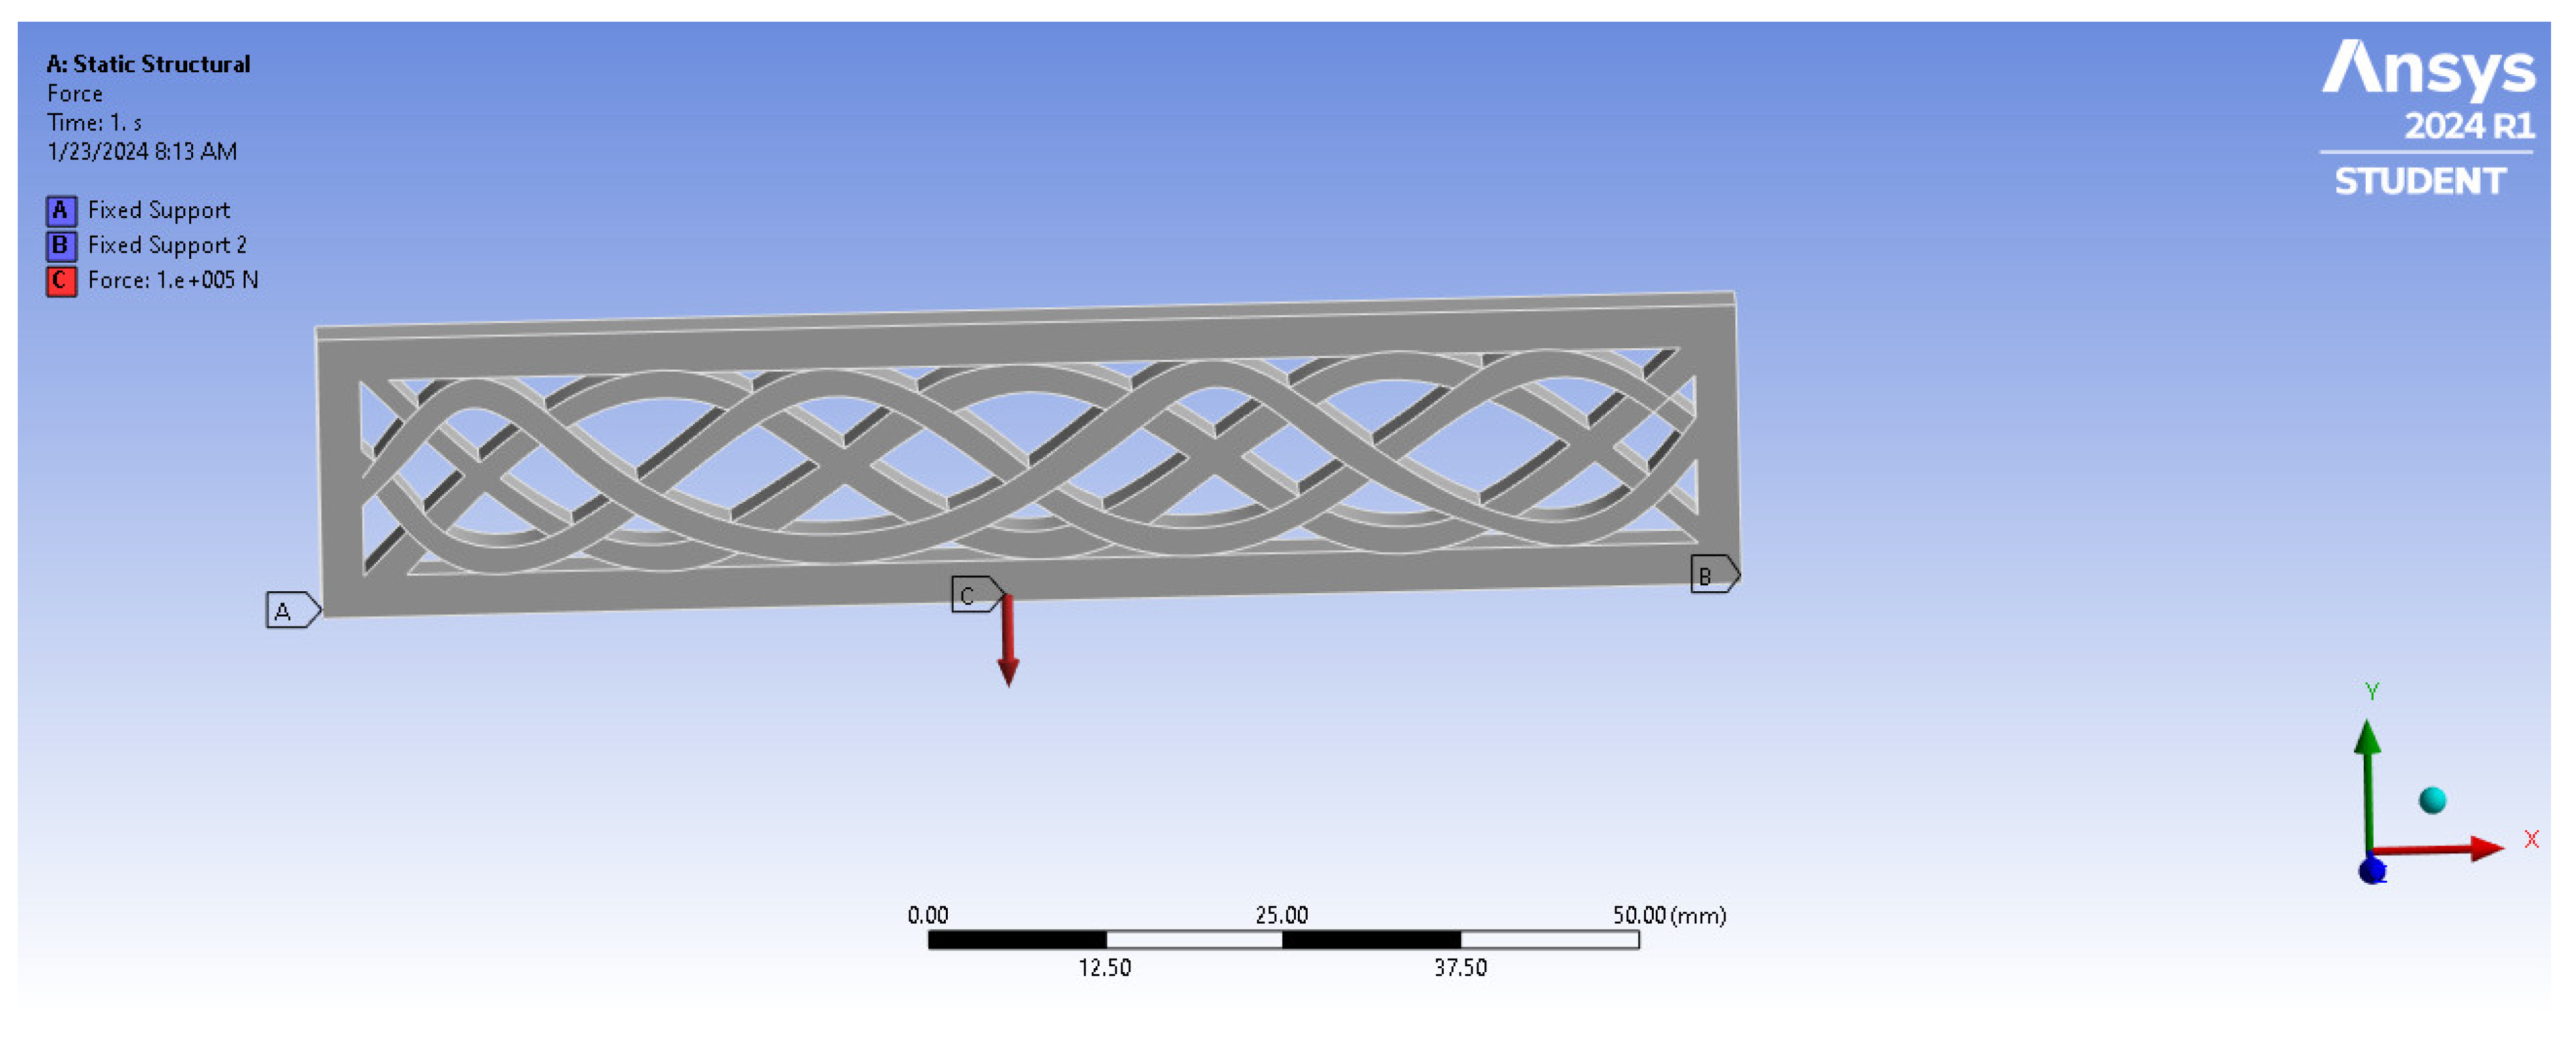
Figure 20.
Shows (a, b) Box not stiffened, (c, d) Box with Wavy stiffened, (e, f) Box with lateral cross stiffening and each pair having force either placed at end or middle of 10,000KN applied on the surface.
Figure 20.
Shows (a, b) Box not stiffened, (c, d) Box with Wavy stiffened, (e, f) Box with lateral cross stiffening and each pair having force either placed at end or middle of 10,000KN applied on the surface.
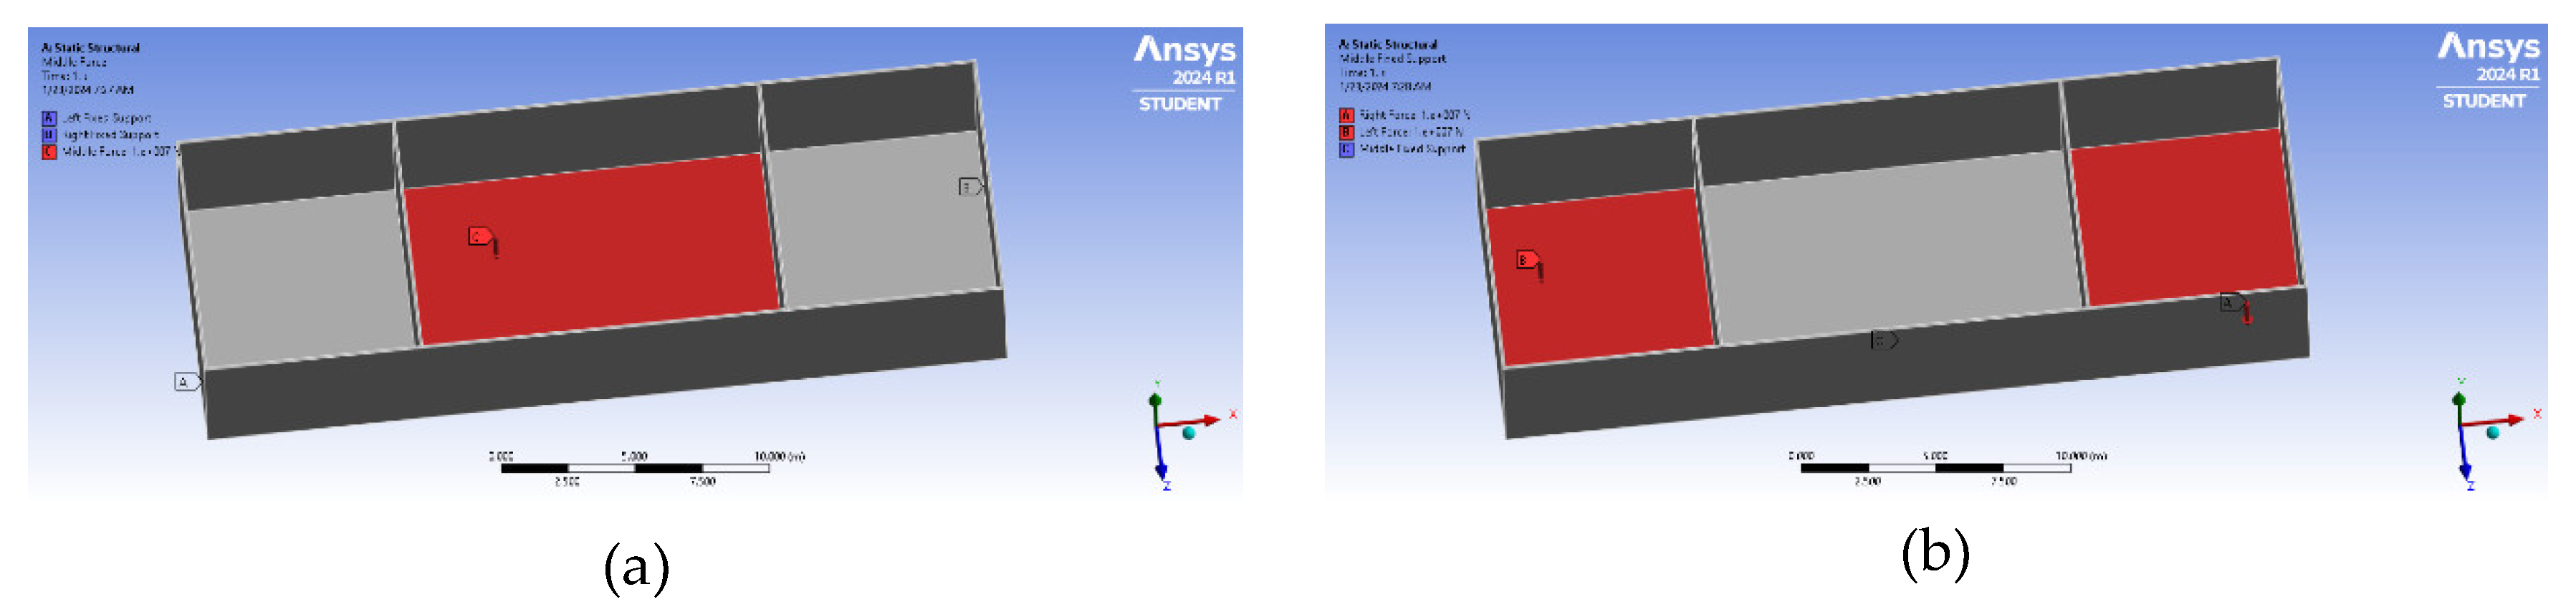
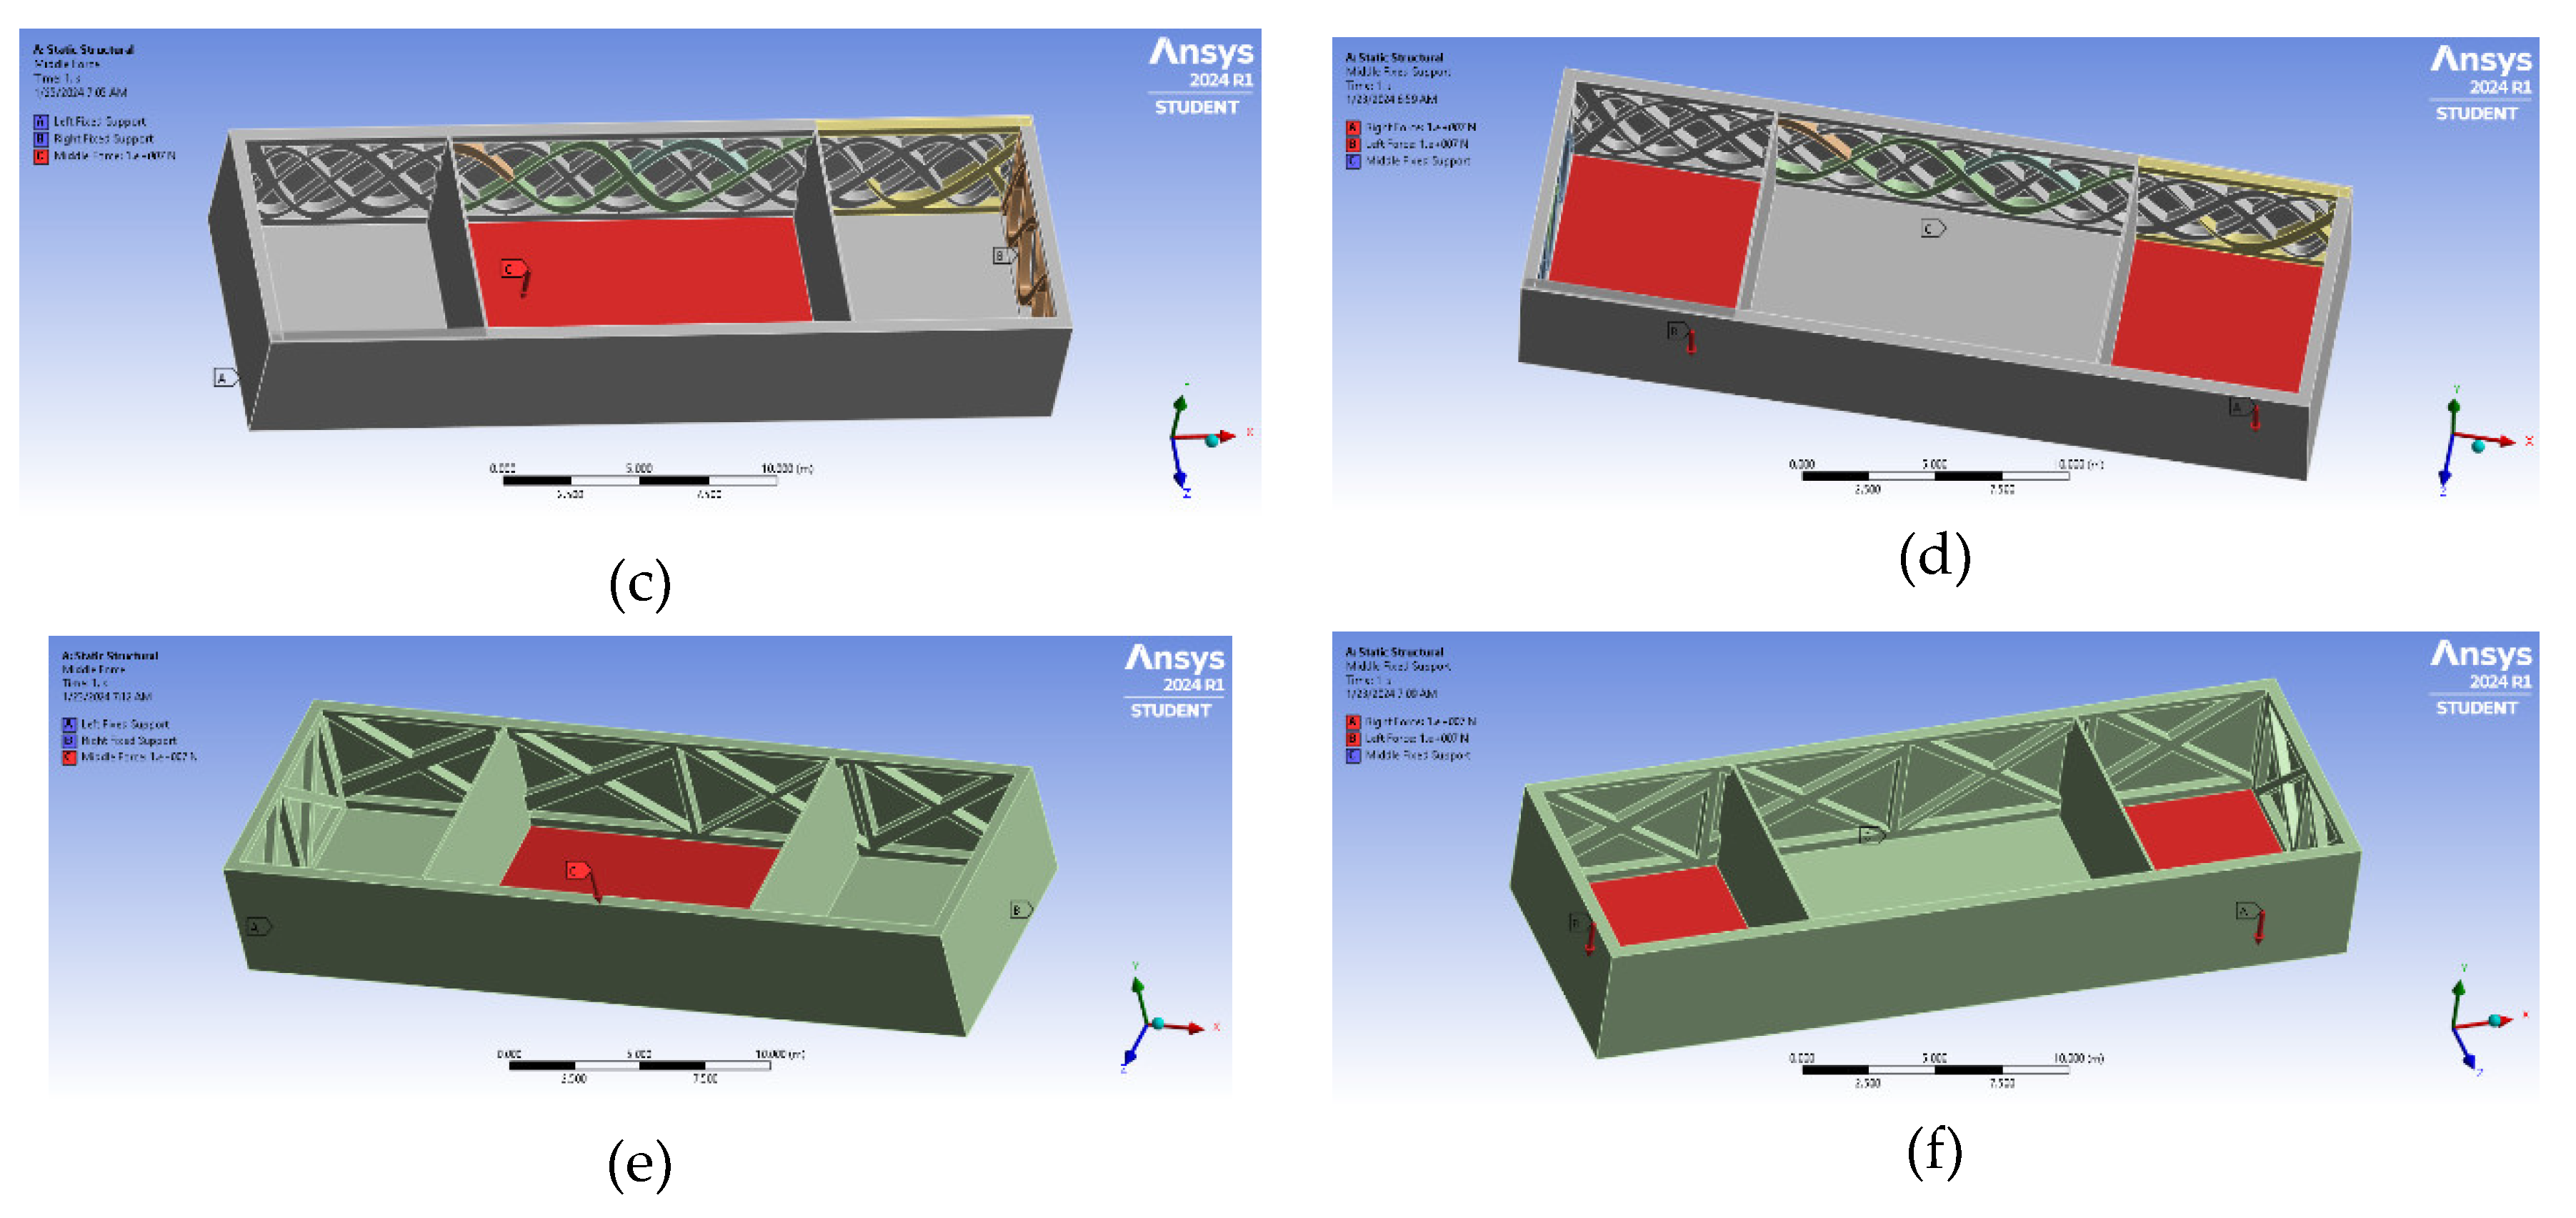
Figure 21.
Shows sample Meshing of lateral plate stiffened mesh size of 0.001m and meshing of box with Mesh size 0.5m.
Figure 21.
Shows sample Meshing of lateral plate stiffened mesh size of 0.001m and meshing of box with Mesh size 0.5m.
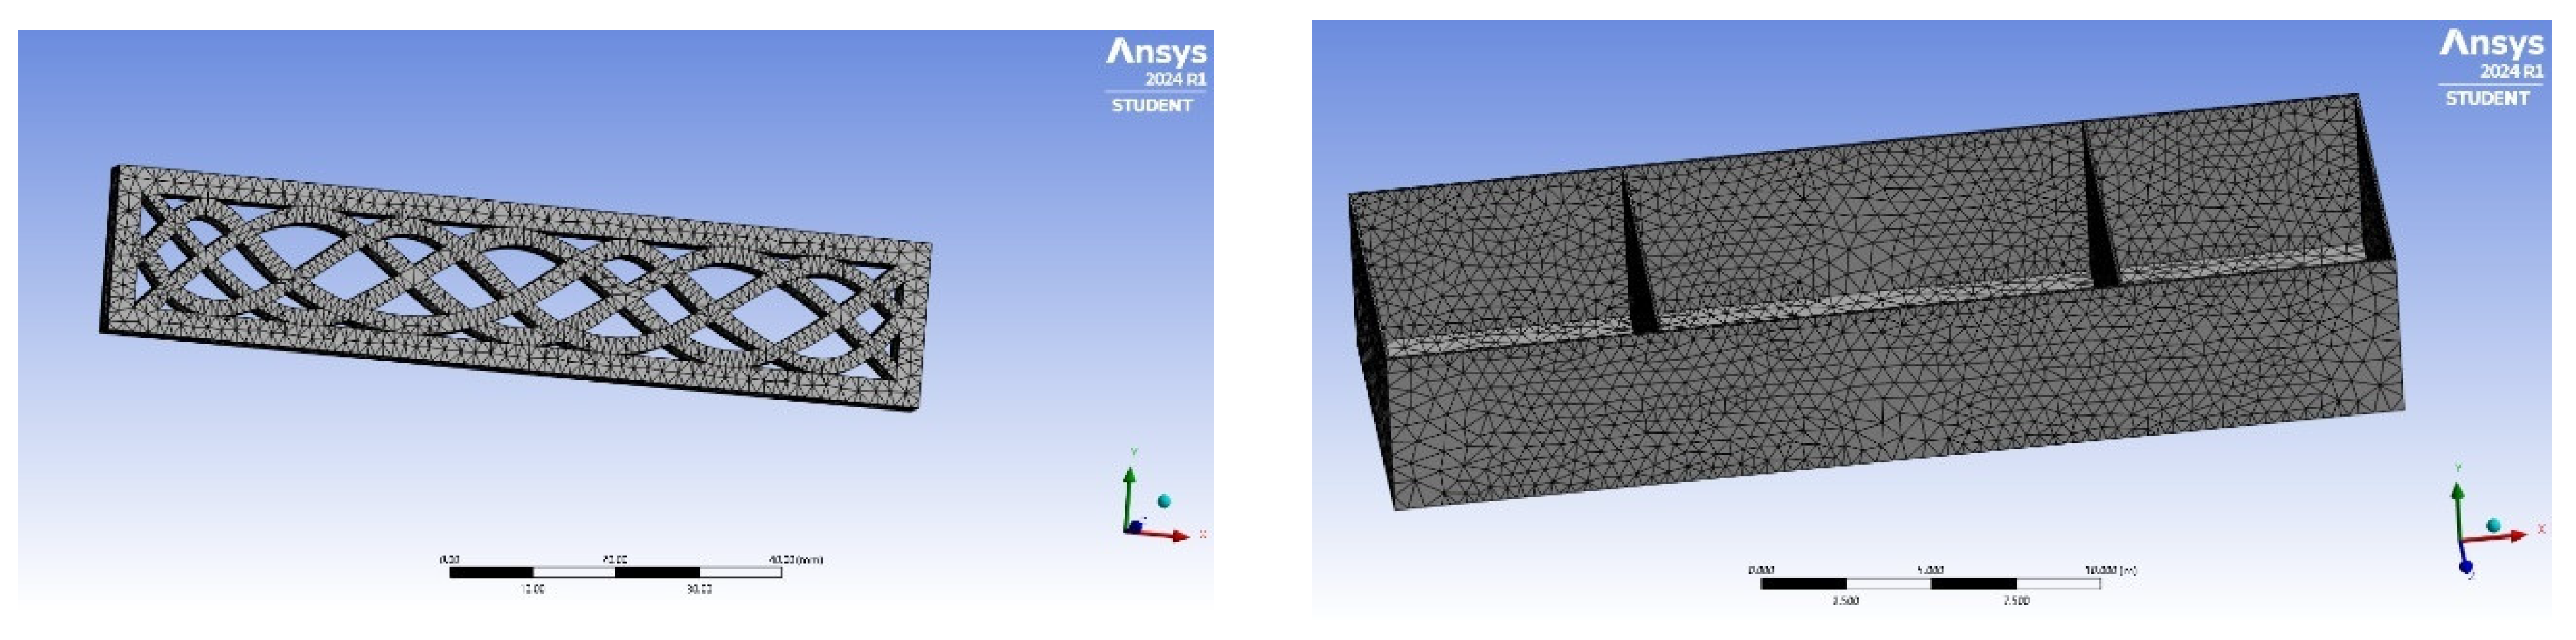
Figure 22.
Shows deformation of (a) curved Up and down stiffened Plate, (b) Star Crossing, (c) Rectangular Crossing, (d) Wavy, (e) Wavy Plus Curved Top and (f) Zigzag Plate Stiffening.
Figure 22.
Shows deformation of (a) curved Up and down stiffened Plate, (b) Star Crossing, (c) Rectangular Crossing, (d) Wavy, (e) Wavy Plus Curved Top and (f) Zigzag Plate Stiffening.
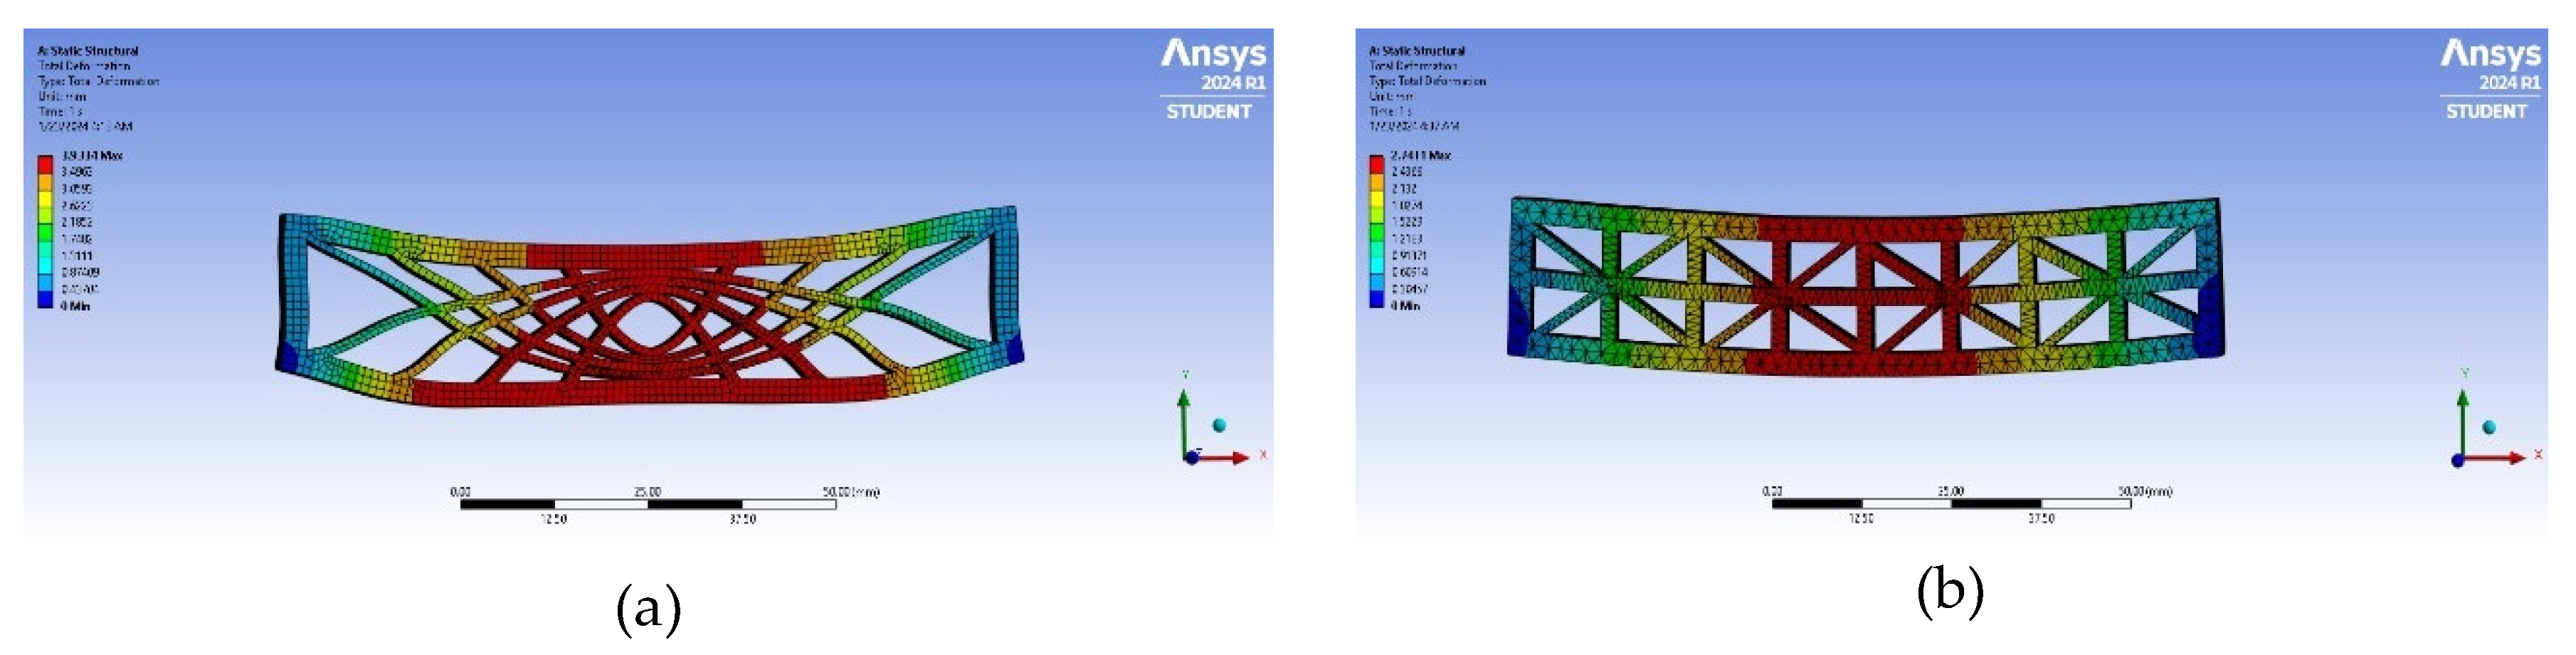
Figure 23.
Shows (a-b) box without stiffening, (c-d) Box with wavy and (e-f) box with crossing stiffening each pair with load and fixed support in center and extreme end respectively.
Figure 23.
Shows (a-b) box without stiffening, (c-d) Box with wavy and (e-f) box with crossing stiffening each pair with load and fixed support in center and extreme end respectively.
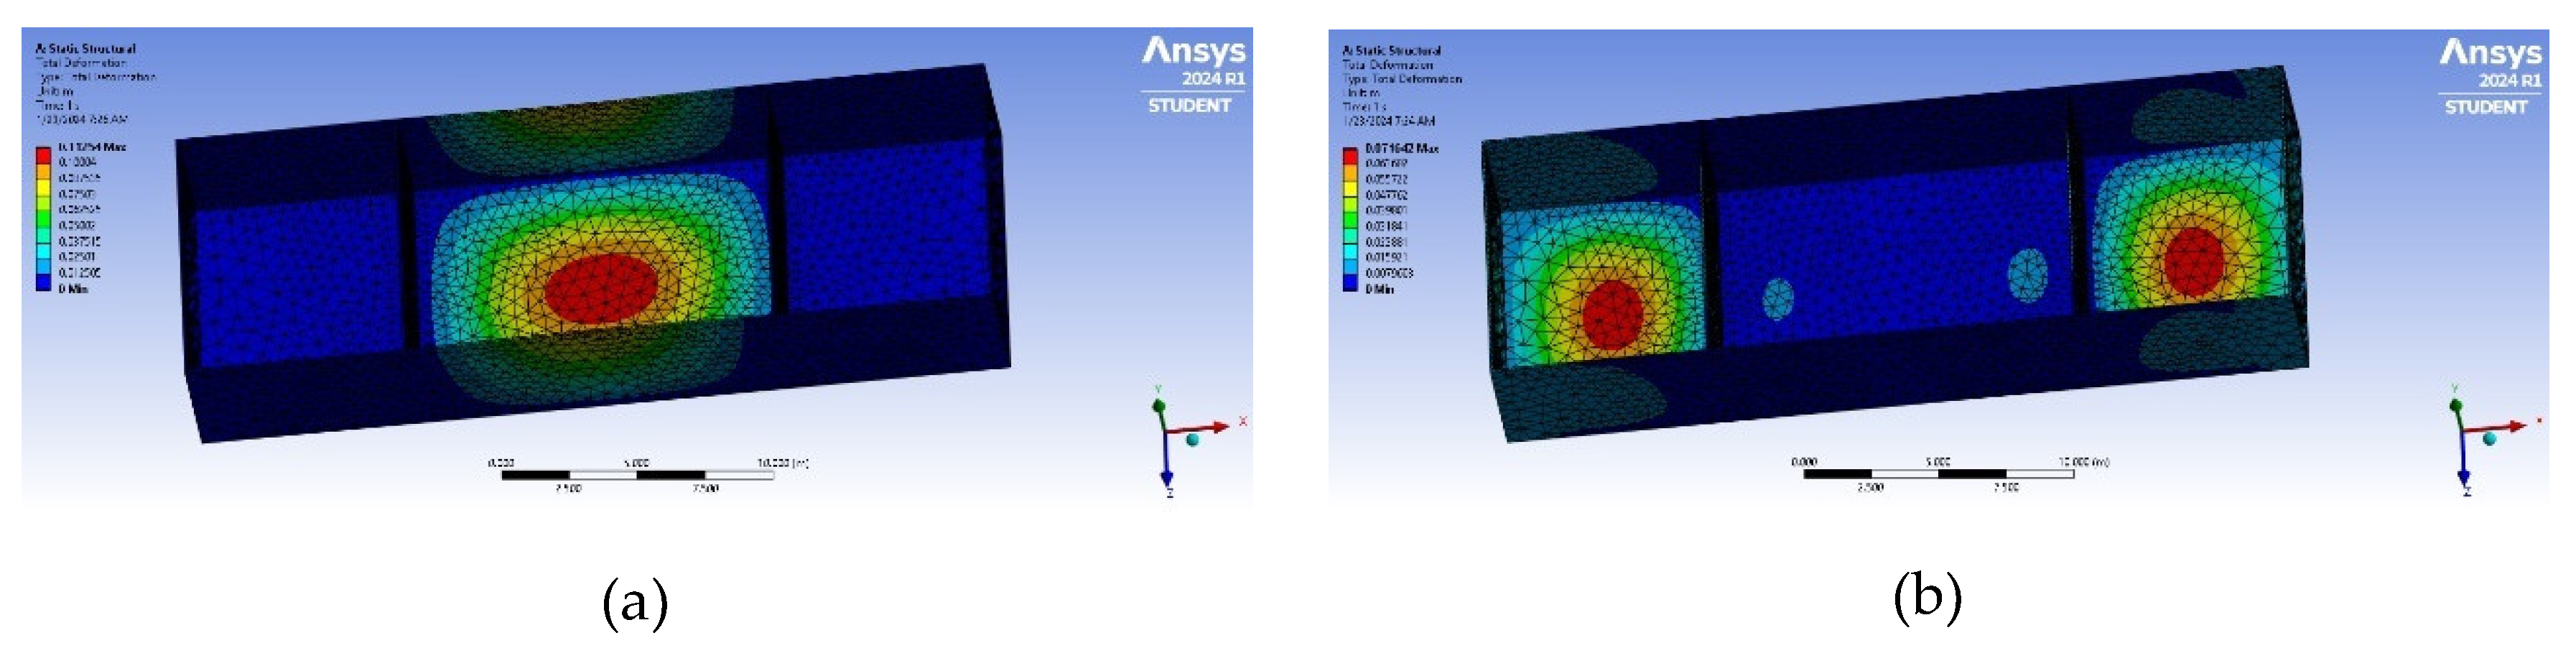
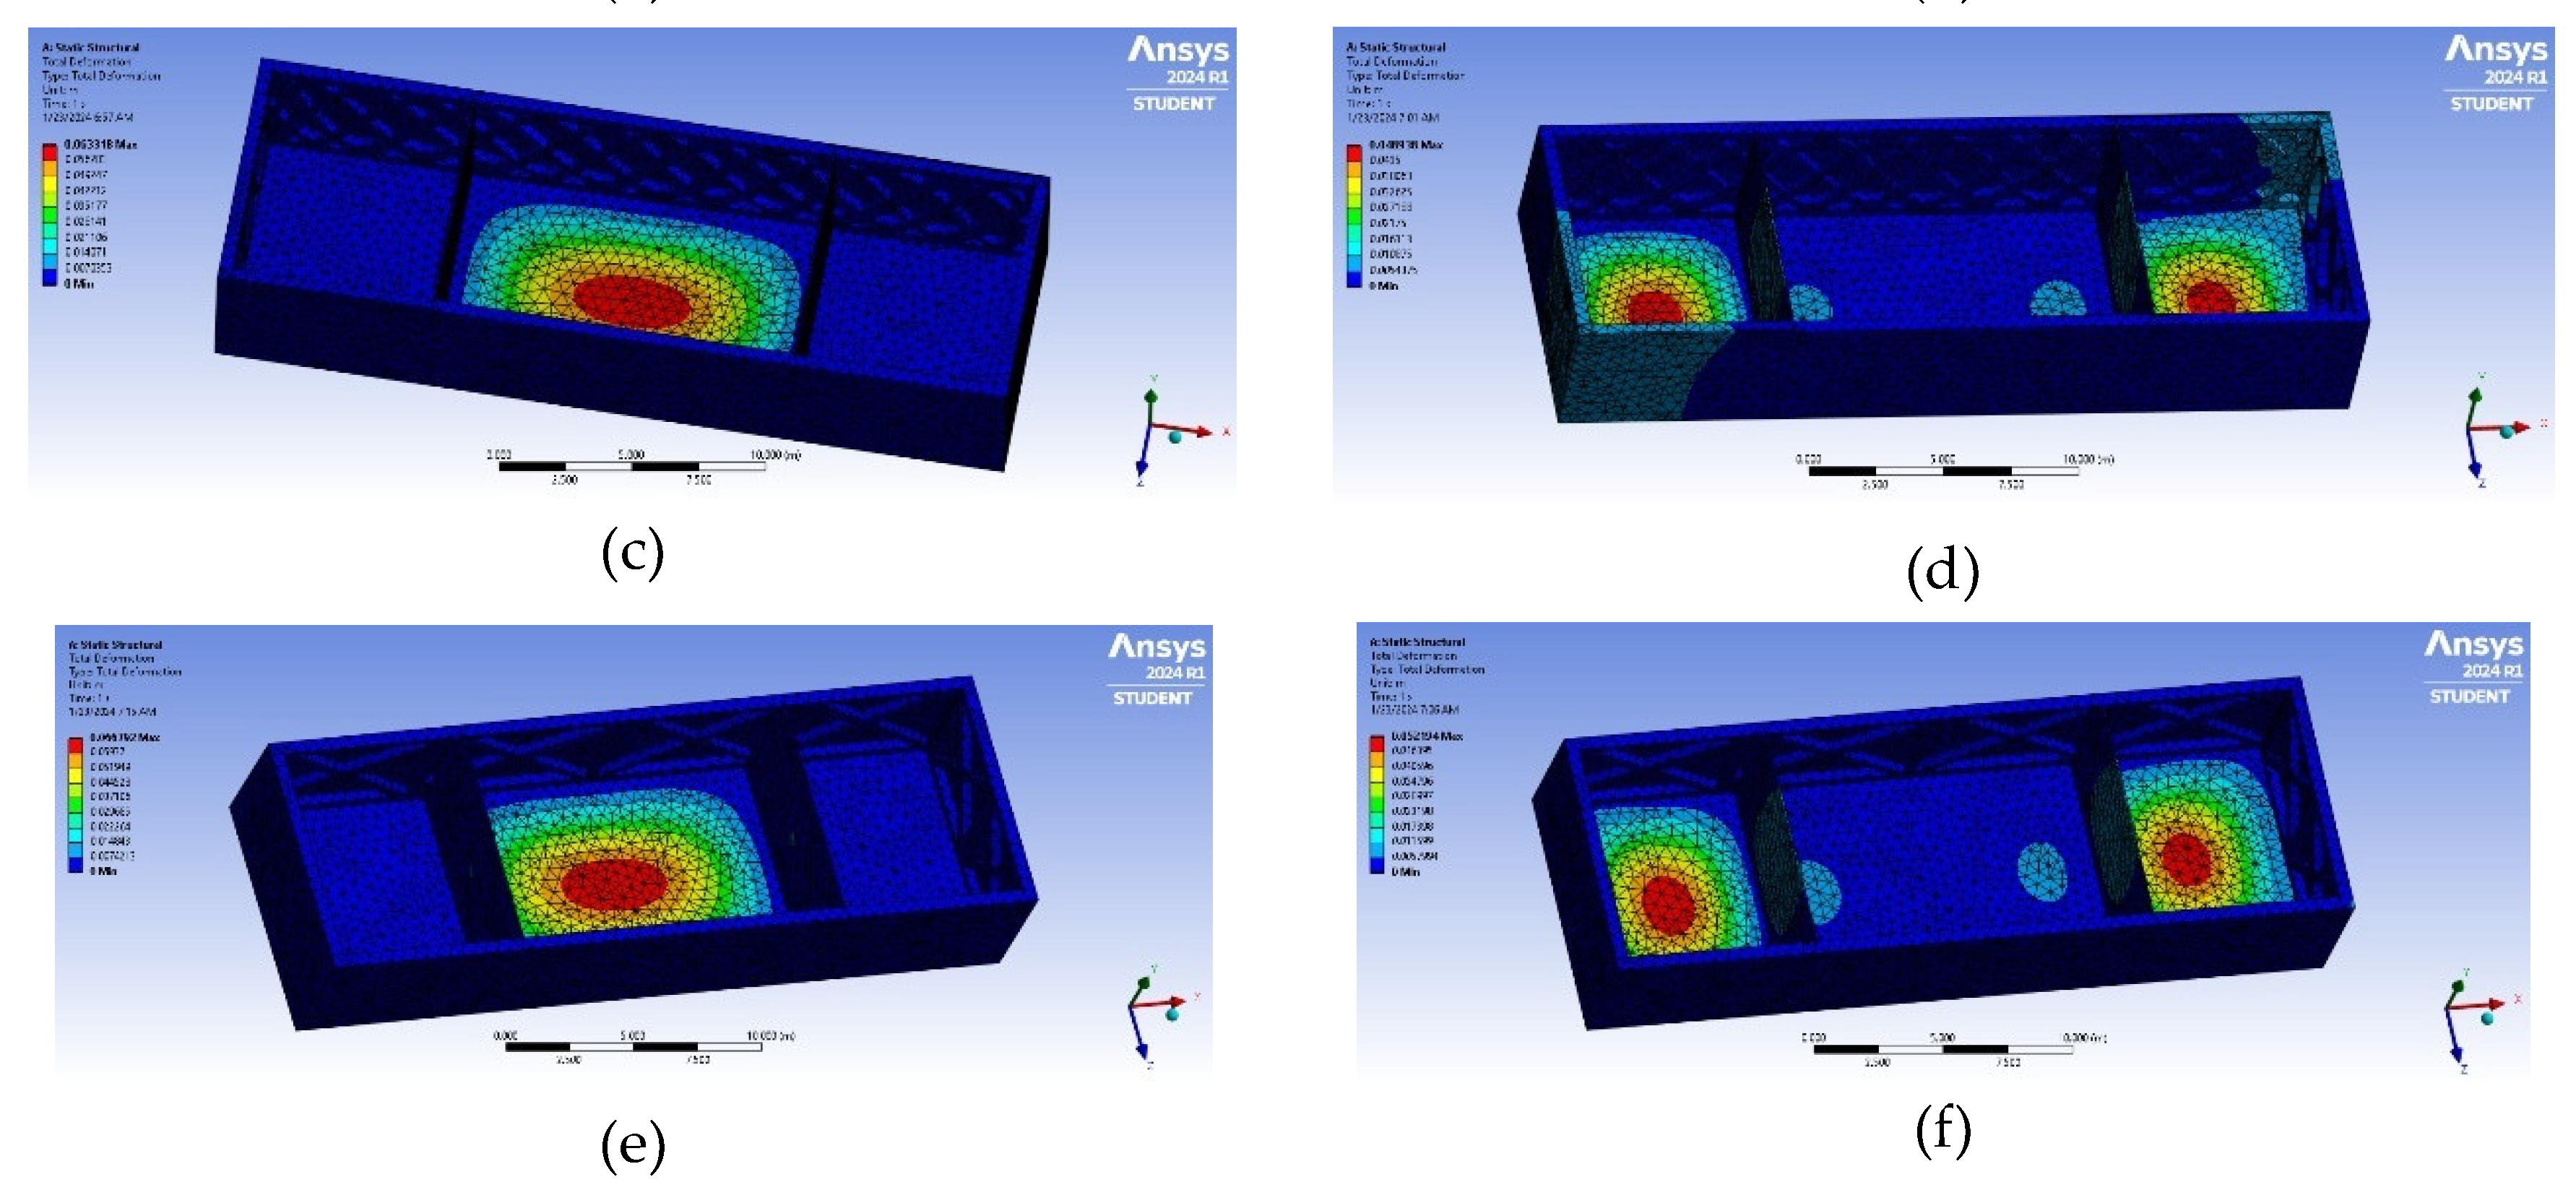

Table 1.
Shows the total maximum deformation in meter of each design model of stiffened plate shown in Figure 22.
Table 1.
Shows the total maximum deformation in meter of each design model of stiffened plate shown in Figure 22.
| Curved Plate(mm) | Star Crossing (b) | Rectangular Crossing (c) | Wavy (d) | Zigzag (f) | Wavy plus Curved Top (e) | Curved Up and Down (a) |
|---|---|---|---|---|---|---|
| 3.9334 | 2.7411 | 6.3381 | 2.2993 | 2.8155 | 1.3361 | 3.9334 |
Table 2.
Shows total deformation(m), of a Box with and without stiffened lateral plate having Different load Distribution.
Table 2.
Shows total deformation(m), of a Box with and without stiffened lateral plate having Different load Distribution.
| Beam Design | Without Support | Cross Stiffened | Curved Stiffened |
|---|---|---|---|
| Central Load with both Edge Supports | 0.11254 | 0.066792 | 0.063318 |
| Both Edge Load with Central Support | 0.071642 | 0.052194 | 0.048938 |
Disclaimer/Publisher’s Note: The statements, opinions and data contained in all publications are solely those of the individual author(s) and contributor(s) and not of MDPI and/or the editor(s). MDPI and/or the editor(s) disclaim responsibility for any injury to people or property resulting from any ideas, methods, instructions or products referred to in the content. |
© 2024 by the authors. Licensee MDPI, Basel, Switzerland. This article is an open access article distributed under the terms and conditions of the Creative Commons Attribution (CC BY) license (http://creativecommons.org/licenses/by/4.0/).
Copyright: This open access article is published under a Creative Commons CC BY 4.0 license, which permit the free download, distribution, and reuse, provided that the author and preprint are cited in any reuse.


