Submitted:
29 January 2024
Posted:
30 January 2024
You are already at the latest version
Abstract
The aim of this study was to describe the trend of traffic accident mortality and social inequalities in Ecuador for the period 2011-2020, distributed by year, gender, age group, geographic location, and type of accident, alongside social disparities. An ecological approach was used to evaluate traffic accident mortality data. The average traffic accident mortality rate in the country during this period was 19.1 per 100,000 inhabitants, with rates being significantly higher in males (31.3) than in females (7.2). The highest mortality rate was recorded in 2011, predominantly impacting the 60 and older age group, the Santo Domingo de los Tsáchilas province, and the Amazon region. The study also noted a declining trend in these rates over the years, with an Annual Percentage Variation of -1.2%. A notable finding was the decrease in traffic accident mortality inequality based on per capita income in 2019, compared to 2011, which rose by 247.7%, whereas the inequality based on illiteracy rates decreased by 18.9% from 2014 to 2019. These findings highlight the significant decrease in traffic accident mortality rates across Ecuador, though marked disparities remain evident across different genders, age groups, and provinces.
Keywords:
traffic accidents
; mortality
; trends
; Ecuador
1. Introduction
A traffic accident is any type of incident involving means of transport designated for the conveyance of people or objects between different locations. These incidents are categorized in Chapter XX of the 10th revision of the International Statistical Classification of Diseases and Related Health Problems (ICD-10), which facilitates the generation of global statistics through specific codes [1]. Traffic accidents are coded and summarized as V01-V99 (transport accidents), with subdivisions based on the type of injury incurred, the type of vehicle involved, the nature of the accident, and other unspecified aspects [1].
The Sustainable Development Goals (SDGs), specifically Goal Three, focus on Health and Well-being. One of the targets for 2030 is to halve the global number of deaths and injuries caused by traffic accidents [2]. Additionally, the World Health Organization (WHO) has emphasized the effectiveness of measures implemented in many countries to improve road safety [3].
Globally, according to WHO statistics, there were 1,282,150 deaths due to traffic accidents in 2019, with higher mortality rates observed among men and in low-income countries. Furthermore, based on the World Bank's income groups, traffic accident mortality rates have been distributed as follows: low income (28.3/100,000 population), lower-middle income (17.3/100,000 population), upper-middle income (16.8/100,000 population), and high income (8.4/100,000 population) [4].
Traffic accidents lead to considerable economic losses, accounting for about 3% of the Gross Domestic Product (GDP) in most countries [5]. Trend analyses indicate that traffic accidents will become the fifth leading cause of death by 2030 [6], representing a public health issue that has been globally recognized since 2004 [7].
In 2012, traffic accidents were the leading cause of death among individuals aged 5-14 in the Americas and the second leading cause among those aged 15-44, accounting for 149,252 fatalities. In South America, particularly in the Andean Region, the traffic accident mortality rate was 22.1/100,000 population [6].
In 2019, in low-income countries, traffic accident mortality ranked seventh, while in lower-middle and upper-middle income countries, it ranked tenth [8].
In Ecuador, a study on traffic accidents using data from 2000 to 2015 found an average mortality rate of 11.4/100,000 population [9], which is lower than the average rate in the Americas (15.8/100,000 population) [6].
Additionally, in 2020, Ecuador recorded 16,972 traffic accidents, resulting in 2,600 deaths (15.3%). This figure indicates a 31% reduction compared to 2019, with a mortality rate of 14.8 per 100,000 population. Of the total fatalities, 64% died at the accident site, while the remaining 36% died in a hospital or care center [10].
Therefore, the aim of this study was to describe the trend in traffic accident mortality and social inequalities in Ecuador for the period 2011-2020, distributed by year, gender, age group, geographical location, and type of accident, as well as social inequalities.
2. Materials and Methods
2.1. Design
This is a descriptive ecological study based on aggregated national traffic accident data.
2.2. Subjects
Deceased due to Traffic Accidents (AT) in Ecuador between 2011 and 2020, obtained from the databases of the National Institute of Statistics and Census (INEC), of the Republic of Ecuador [11]. The general data on the population and live births were obtained from the same database, based on the national population projection distributed by age groups and by provinces, as well as data on the number of vehicles registered at the national level and by province [12].
2.3. Study Variables
The variables were year (2011 to 2020); geographic region (Coastal regions: El Oro, Esmeraldas, Guayas, Los Ríos, Manabí, Santo Domingo, Santa Elena; Highlands: Azuay, Bolivar, Cañar, Carchi, Cotopaxi, Chimborazo, Imbabura, Loja, Pichincha, Tungurahua; Amazonia: Morona Santiago, Napo, Pastaza, Zamora Chinchipe, Sucumbíos, Orellana; Insular: Galápagos; and Unspecified zones); gender (male and female); age group (<16 years; 17–24 years; 25–40 years; 41–59 years; >60 years); and accident type coded according to ICD-10 [1].
2.4. Data Analysis and Interpretation
Exploratory analyses were conducted using descriptive statistics for percentages, central tendency, and variability. Mortality rates were calculated with the number of deaths as the numerator and population as the denominator, per 100,000 inhabitants. Absolute risks (AR) and rate ratios (RR) were determined by geographic distribution, sex, age group, and accident type. Annual percentage variation (APV) in rates was analyzed using linear regression models with 95% confidence intervals and p-values [13]. Additionally, traffic accident mortality rates (TAMR) per 10,000 vehicles were calculated.
Further analyses included examining inequalities in traffic accident mortality as a sole health indicator, alongside annual per capita income (PCI) and literacy rates as socioeconomic stratifiers, and live births per province as the demographic variable. Simple measures of absolute gaps (AG) and relative gaps (RG), as well as complex measures like the Slope Inequality Index (SII), were calculated using simple linear regression models [14].
The analyses were performed using IBM® SPSS® Statistics version 27, Microsoft® Excel for Mac version 16.57, and the EquiGap® macro developed by the EWEC-LAC metrics and monitoring working group.
2.5. Ethics
Not applicable, as the study used official statistics and publicly accessible unnamed data from the Republic of Ecuador.
2.6. Conflict of Interest
None.
3. Results
3.1. General Mortality
During the study period, 31,325 individuals died due to traffic accidents in Ecuador, of whom 25,354 (80.9%) were men. The TAMR in this period was 19.2 per 100,000 inhabitants (Table 1).
The TAMR between 2011 and 2020 exhibited a decreasing APV of -1.2% (95% CI= -1.84; -0.62; p<0.001) (Table 1).
The years with the highest TAMR were 2011 (22.0 per 100,000 inhabitants) and 2014 (20.7 per 100,000 inhabitants); whereas, the years with the lowest TAMR were 2020 (14.9 per 100,000 inhabitants) and 2016 (18.0 per 100,000 inhabitants) (Table 2).
3.2. Mortality by Geographic Region
According to geographic region, the highest rates in the period were in the Amazon and coastal regions with 24.0 per 100,000 inhabitants and 19.6 per 100,000 inhabitants, respectively (Table 1 and Figure 1).
Regarding provinces, the highest TAMR was in Santo Domingo (30.5 per 100,000 inhabitants) and Sucumbíos (29.1 per 100,000 inhabitants); while the lowest TAMR was for the undelimited area (1.9 per 100,000 inhabitants) and Galápagos (7.9 per 100,000 inhabitants) (Table 1).
The analysis of the trend among geographic regions revealed that the undelimited area and the insular region had the highest APV (-6.3%; 95% CI: -12.43 to 0.08; p=0.09; and -6.2%; 95% CI: -14.53 to 2.74; p=0.20, respectively) (Table 1).
There was a 1.2 times higher risk of mortality due to traffic accident in the Amazon compared to the coast; with a decreasing APV of -1.5% (95% CI: -2.37 to -0.68; p=0.01). It was evident that the greatest difference in rates between the provinces of Santo Domingo de los Tsáchilas and Galapagos (AR=3) represented an APV with an annual increase of 6.2% in the rates (95% CI: 2.89 to 9.62; p=0.01) (Table 3).
3.3. Mortality by Gender
Regarding gender, it was identified that men have a higher TAMR than women every year, with the highest TAMR for men in 2011 being 36.3 per 100,000 inhabitants, while for women, it was in 2012 (8.4 per 100,000 inhabitants). The lowest TAMR in both men and women was in 2020 with 24.9 per 100,000 inhabitants and 4.9 per 100,000 inhabitants, respectively (Table 2 and Figure 2).
Additionally, in 2020, the TAMR was 5.0 times higher in men than in women, while in 2012, it was 3.9 times higher in men than in women. The average male-to-female RR for the 10 years of the study was 4.3 (Table 3).
3.4. Mortality by Age Group
Analyzing the TAMR according to age groups, the highest mortality was observed in the ≥60 years group (32.7 per 100,000 inhabitants) and the 17 to 24 years group (27.3 per 100,000 inhabitants); while the lowest rate was in the 0 to 16 years group (5.1 per 100,000 inhabitants). This trend remained consistent throughout the study period except for 2020, when the ≥60 years group exhibited the lowest rate (19.9 per 100,000 inhabitants) (Table 1).
The overall average age of fatalities due to traffic accident was 37.9 years (Standard Deviation (SD)=20.5). For men, it was 37.4 (SD 19.4) and for women, 40.1 (SD=24.2). The year with the lowest average age was 2012 (37.0 years, SD = 20.3), and the highest was 2017 (38.7 years). The differences for each year remained constant (APV=0.1%; p=0.103; 95% CI: -0.01 to 0.31) (Table 4).
Regarding the rate ratio in the ≥60 years group, a value of 6.4 times higher TAMR compared to the 0 to 16 years group was identified, with an annual increase of 1.3% (95% CI: 0.82; 1.89; p<0.001) (Table 3).
3.5. Mortality by Type of Accident
Regarding the TAMR, it was reported that between 2011 and 2020, there were 6,131 (19.5%) fatalities due to "pedestrian injured in transport accidents (ICD-10 V01-V09)" and 17,212 (54.9%) fatalities due to "other unspecified transport accidents (ICD-10 V089)" (Table 5).
These causes remained constant as the most frequent throughout each year; from 2016 onwards, there was an increase in fatalities among "Motorcyclists or occupants of motorized 3-wheeled vehicles (ICD-10 V20-V39)" as follows: 2016 (16.3%), 2017 (18.6%), 2018 (14.9%), 2019 (15.3%), 2020 (13.1%), and a decrease in fatalities among "pedestrians injured in transport accidents (ICD-10 V01-V09)" as follows: 2016 (14.4%), 2017 (14.9%), 2018 (14.6%), 2019 (13.6%), 2020 (11.1%).
Conducting an analysis of the types of annual traffic accident deaths between 2011 and 2020, mortality among "pedestrians" showed the greatest variation with a tendency to decrease (APV= -5.8%; 95% CI: -6.97 to -4.76; p<0.001) (Table 5).
Regarding the differences in mortality risk by type of traffic accident, it was evident that "Other unspecified transport" had 3.2 times more TAMR than that occurring in "pedestrians", with an APV of 6.1 (95% CI: 5.21 to 7.05; p<0.001); while the highest risk of mortality from traffic accident was among "pedestrians", 44.4 times more than "bus occupants", with an annual decrease of -9.2% (95% CI: -15.73 to -2.27; p=0.03).
Additionally, the mortality rate per 10,000 vehicles from 2011 to 2020 was calculated, resulting in 16.3 per 10,000 vehicles. It was also observed that the year with the highest mortality was 2011 (22.6 per 10,000 vehicles); and the lowest rate was in 2020 (11.0 per 10,000 vehicles). The APV of traffic accident mortality per 10,000 registered vehicles for the entire period was a decreasing -3.0% (95% CI: -3.58 to -2.41; p<0.001).
3.6. Inequality Analysis
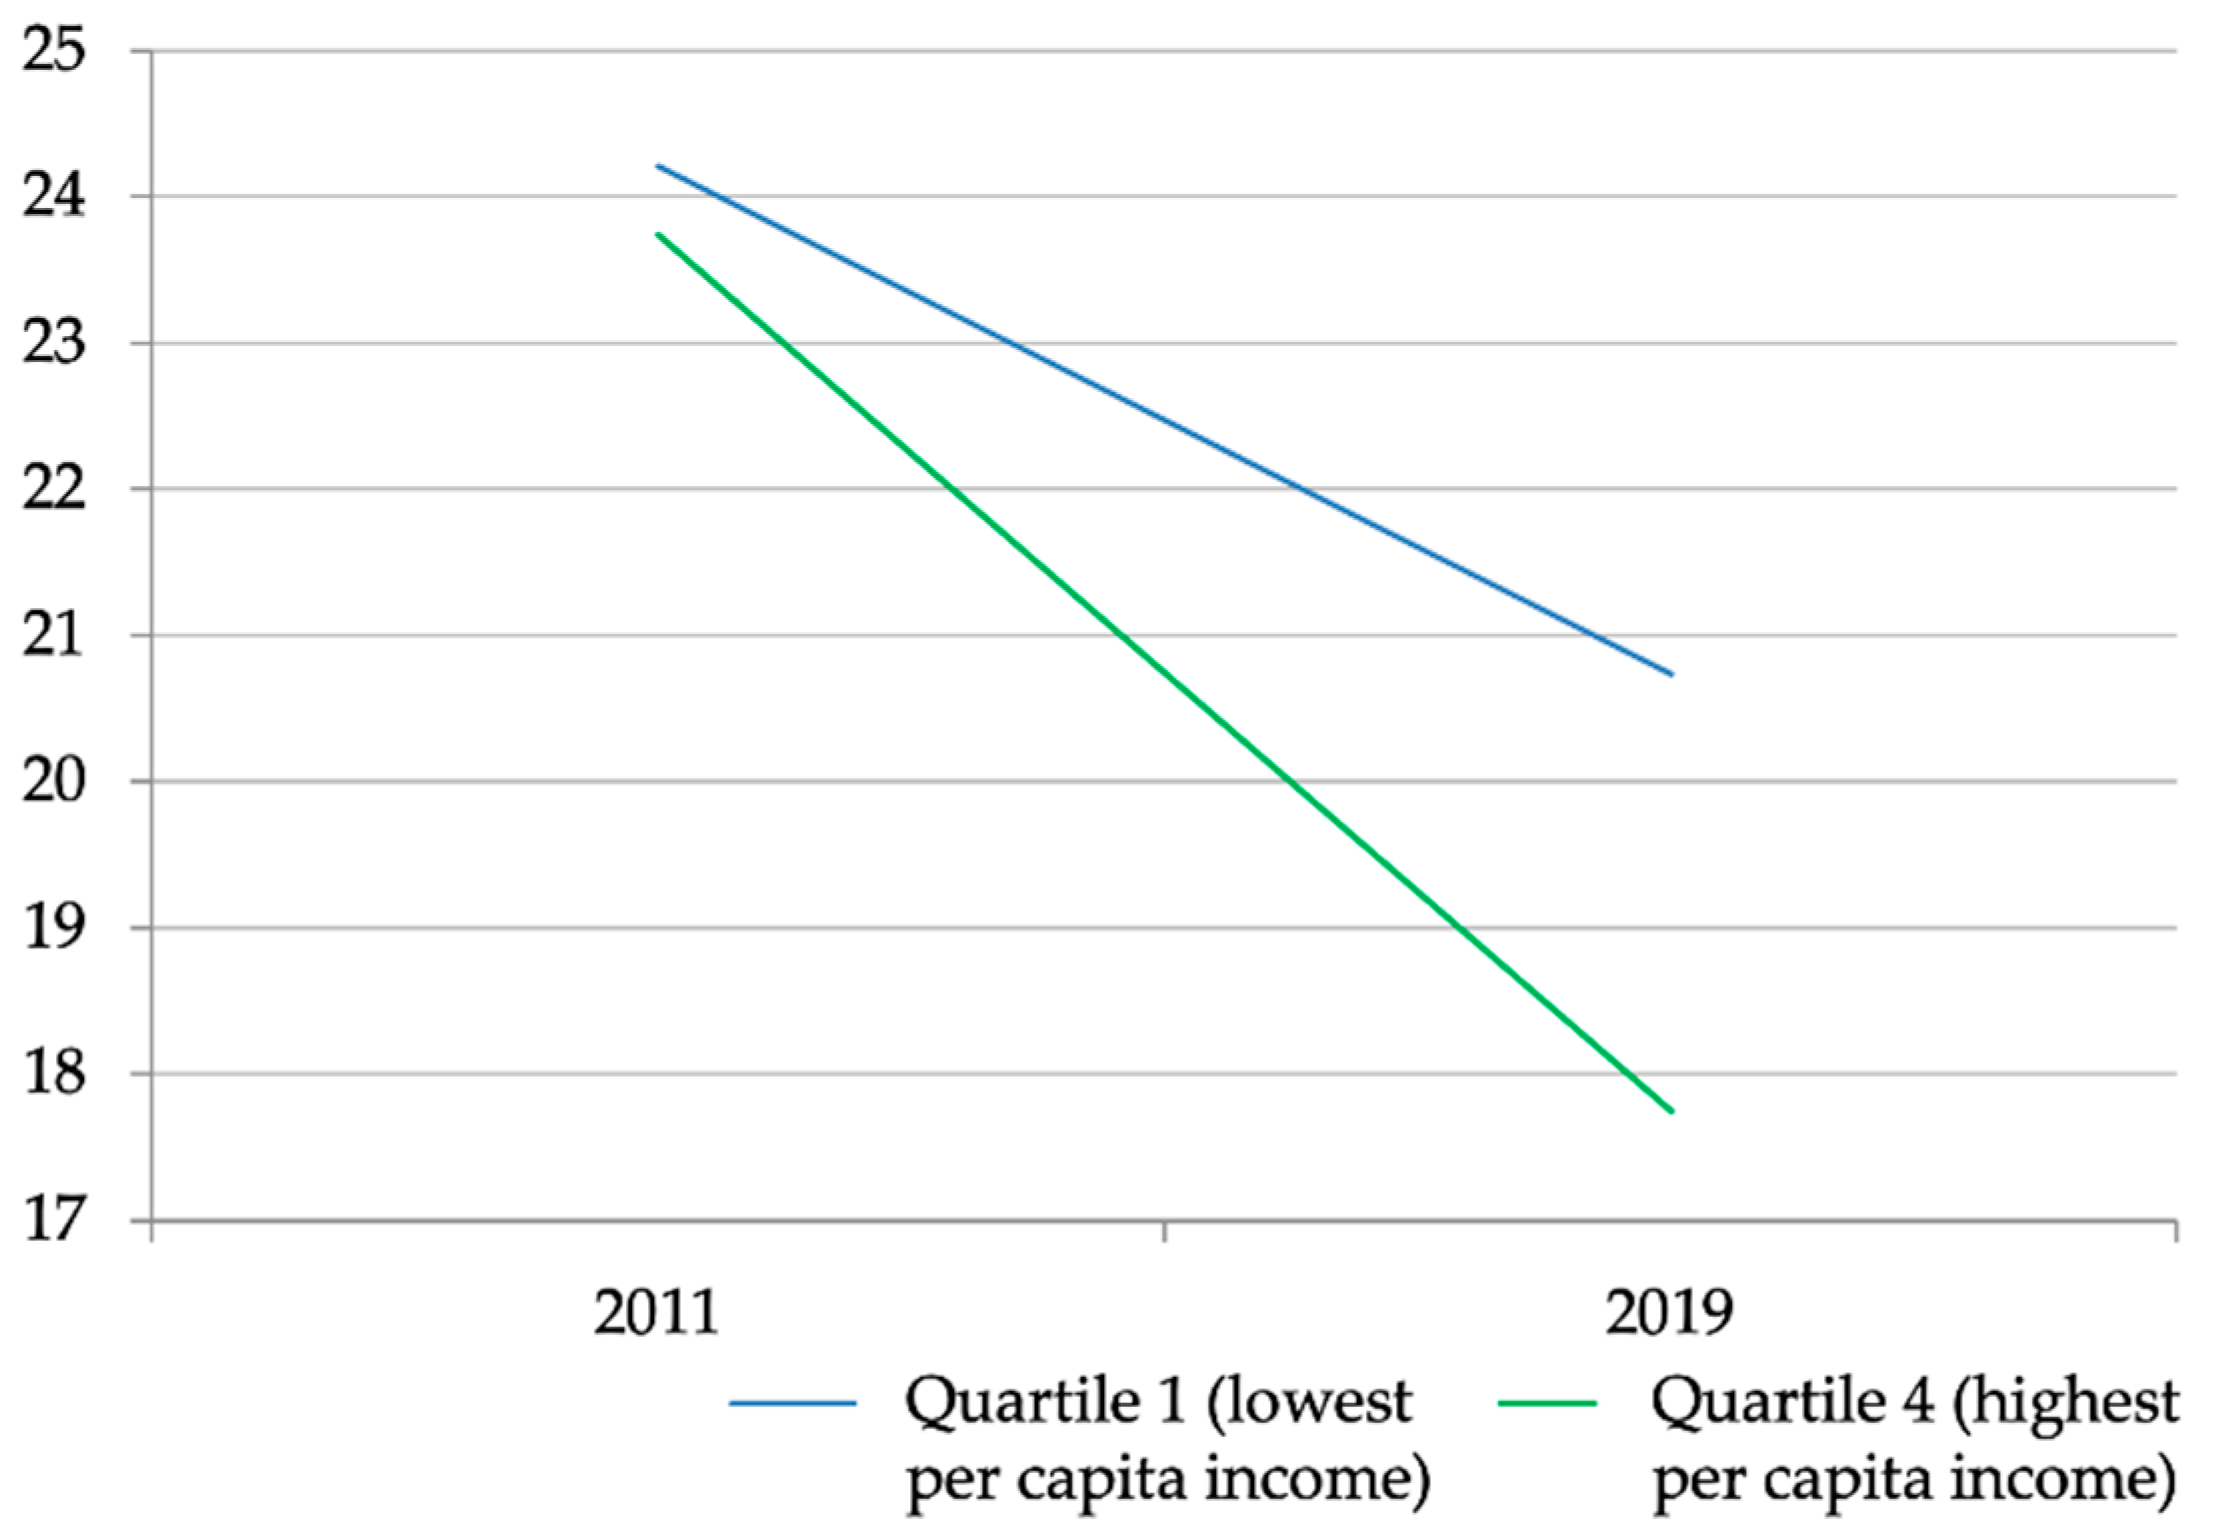
It was identified that in 2011, there were 0.4 more deaths (AG) per 100,000 live births due to traffic accidents in the group of provinces with the lowest PCI compared to the group of provinces with the highest PCI; whereas, in 2019, there were 2.9 more deaths (AG) per 100,000 live births due to traffic accidents in the provinces with the lowest PCI compared to those with the highest PCI, representing a 500% increase in the AG between 2011 and 2019 (Figure 3).
The risk of mortality due to traffic accidents in 2011 for the group of provinces with the lowest PCI was 1.0 times higher (RG) than for the group of provinces with the highest PCI; while in 2019, the risk of mortality due to AT in the group of provinces with the lowest PCI was 1.1 times higher (RG) than in the group of provinces with the highest PCI, indicating a 14.5 percentage point increase in the RR between 2011 and 2019 (Figure 3).
Upon calculating the SII in traffic accidents mortality in provinces stratified by PCI, it was found that inequality increased by 247.7% between 2011 and 2019.
The analysis of the TAMR per 100,000 live births (mortality rates) in the years 2011 and 2019, when compared with the equity stratifier (PCI) and categorized by quintiles (Q1 to Q4, ranging from least advantageous condition to most advantageous condition), reveals that the highest mortality rate is predominantly observed in Q1, and the lowest in Q4 for both years. Concerning simple metrics, it is noted that the equity stratifier (PCI) registered a value of 0.48 (95% CI: -17.01 to 17.96) in BA in 2011, and 2.98 (95% CI: -14.57 to 20.53) in 2019; along with a value of 1.02 (95% CI: 0.49 to 2.12) in BR in 2011 and 1.17 (95% CI: 0.47 to 2.92) in 2019. These figures indicate the most significant departure from the condition of equity, reflecting the greatest degree of inequality concentrated among populations with the most and least social advantage, respectively (Figure 3).
Figure 3.
Change in the absolute gap in Traffic Accident Mortality between 2011 and 2019.
In 2014, there were 3.0 more deaths (AG) per 100,000 live births due to traffic accidents in the group of provinces with lower literacy levels compared to the group with higher literacy levels; whereas, in 2019, there were 2.7 more deaths (AG) per 100,000 live births due to traffic accidents in the group of provinces with lower literacy levels compared to those with higher literacy levels, signifying a 10.5% decrease in the AG between 2014 and 2019 (Figure 4).
The risk of mortality due to traffic accidents in 2014 in the group of provinces with lower literacy levels was 1.1 times higher (RG) than in the group of provinces with higher literacy levels; a value very similar to 2019 (1.1 times higher (RG)), representing a 0.5% decrease in the RG (Figure 4).
The analysis of the TAMR per 100,000 live births (mortality rates) in the years 2014 and 2019, when compared with the equity stratifier (illiteracy rate percentage) and categorized by quintiles (Q1 to Q4, ranging from least advantageous condition to most advantageous condition), indicates that the highest mortality rate is concentrated in Q1, while the lowest is in Q4 for both years. In terms of simple metrics, the equity stratifier (illiteracy rate percentage) demonstrated a value of -3.08 (95% CI: -18.3 to 12.14) in BA in 2014, and -2.76 (95% CI: -17.47 to 11.95) in 2019; coupled with a value of 0.861 (95% CI: 0.4 to 1.84) in BR in 2014 and 0.86 (95% CI: 0.39 to 1.91) in 2019. These values represent the most significant deviation from the condition of equity, reflecting the highest degree of inequality concentrated among populations with the most and least social advantage, respectively (Figure 4).
Figure 4.
Change in the Absolute Gap in Traffic Accident Mortality between 2014 and 2019.
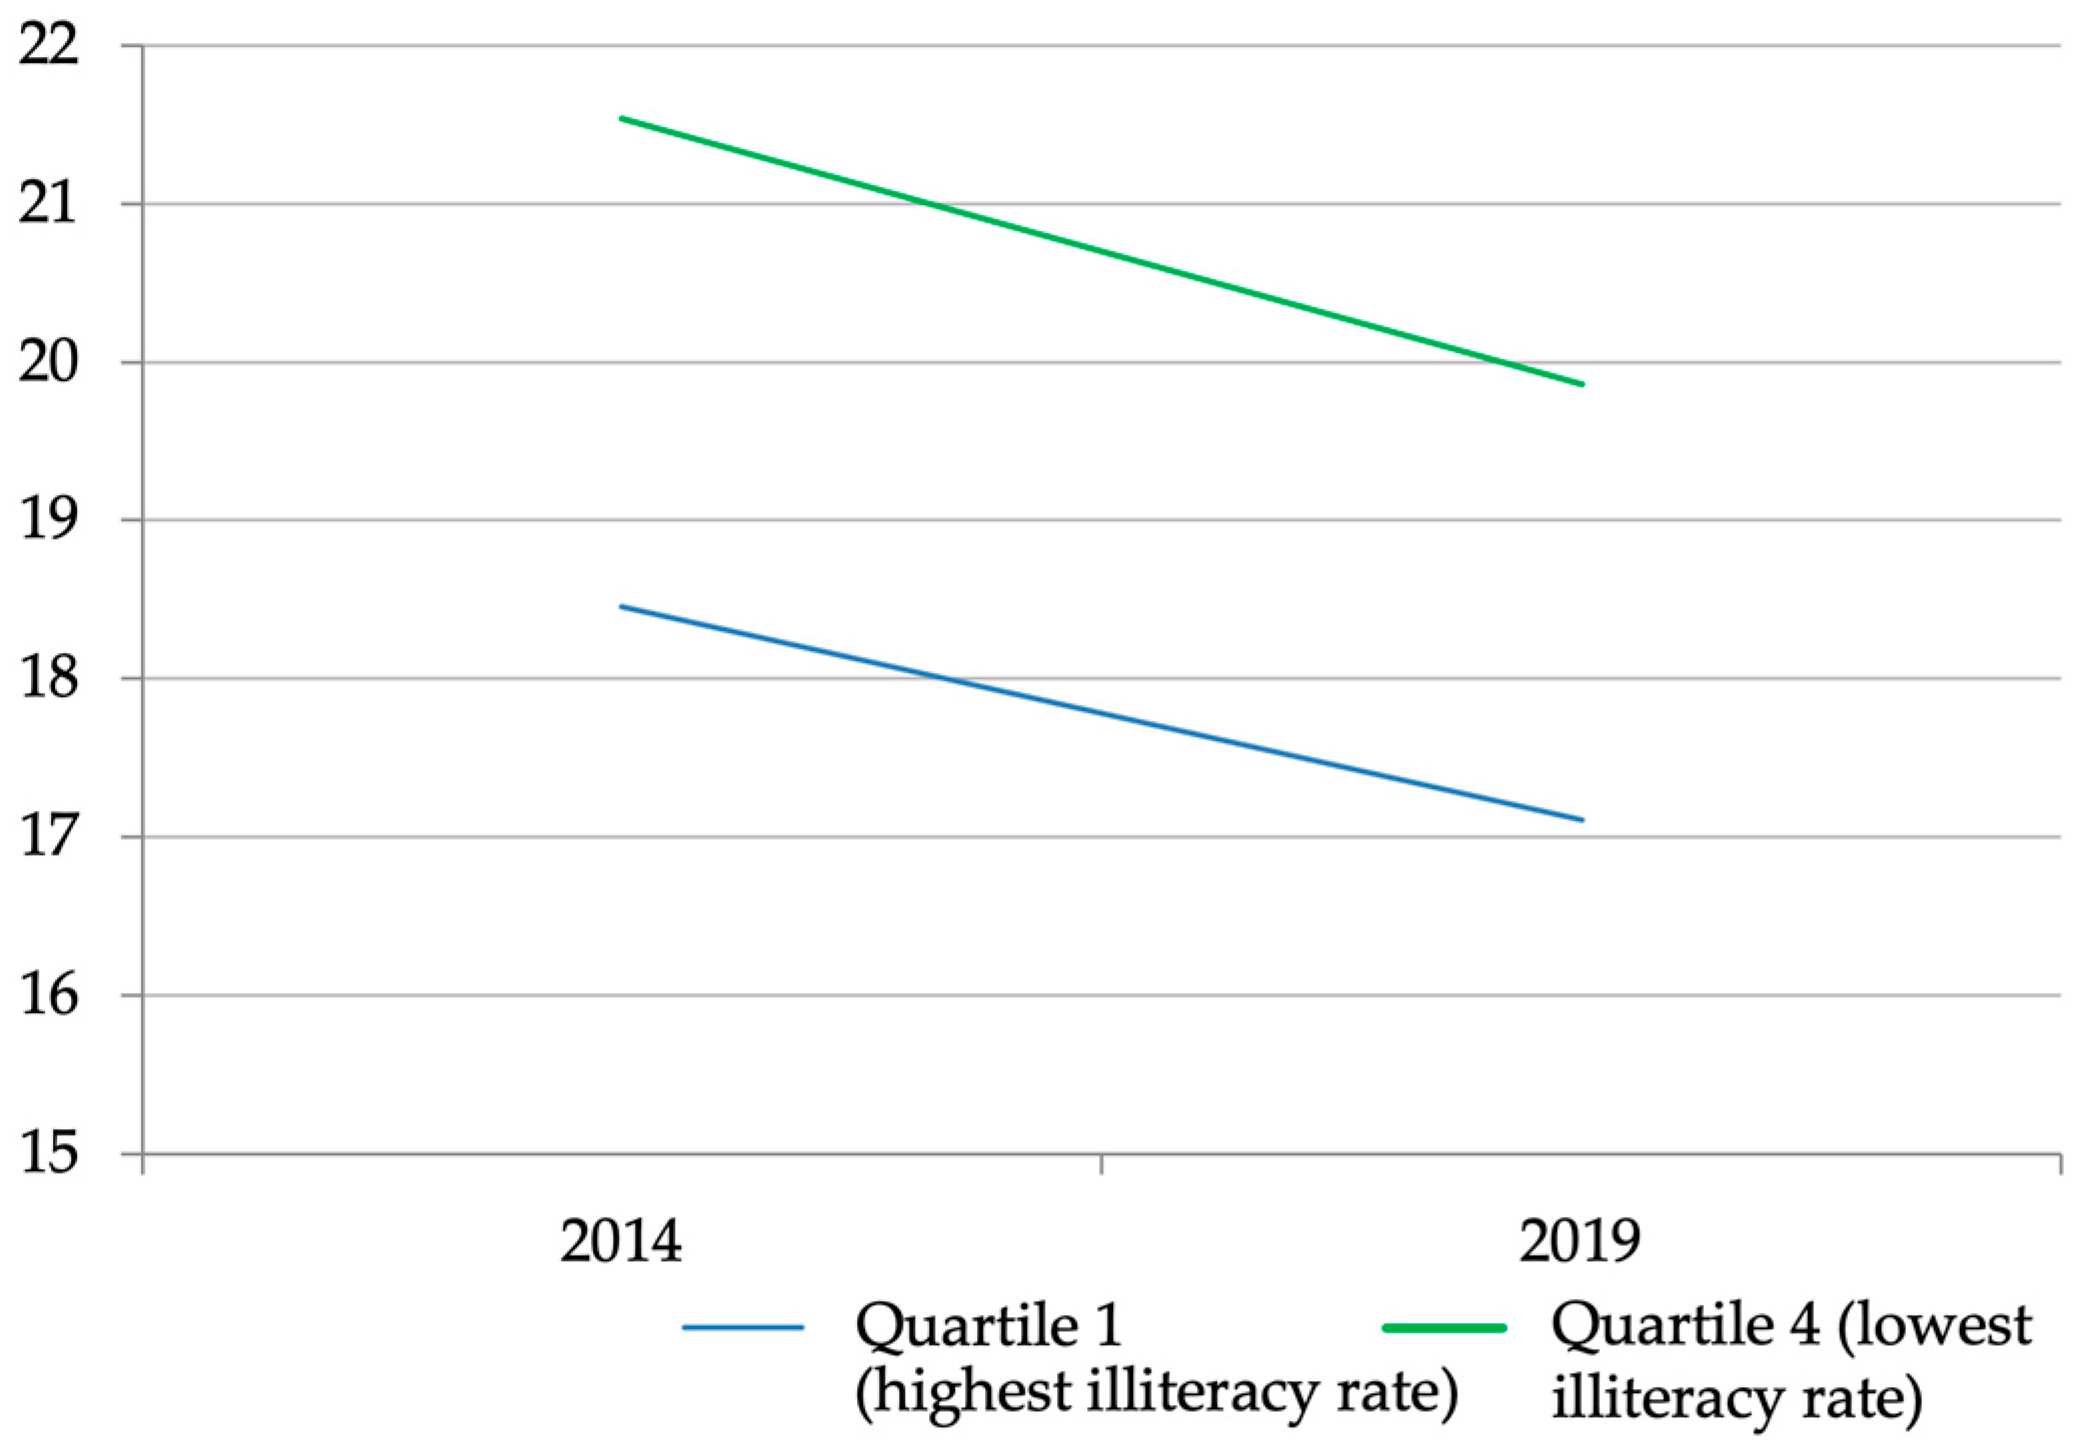
When considering the SII in traffic accident mortality in provinces stratified by the illiteracy rate percentage, it was found that inequality decreased by 18.0%.
Regarding complex metrics, it is observed that the IPC stratifiers with values of 247.7 in IDP and illiteracy rate with values of 18.0 in IDP, describe the values furthest from the conditions of equity. The condition of inequality is focused among populations with the most and least social advantage, respectively, over the years.
4. Discussion
Regarding the differences in traffic accident mortality rates between men and women, men exhibit higher rates (4 to 6 times more), as found in studies across Latin America and globally [15,16,17], as well as in our study. The most impacted age group was those over 60 years, paralleling findings in Colombia where patients in this age range faced double the mortality risk from traffic accident compared to younger patients [18]. A systematic review encompassing primary studies from the United States, Iran, Brazil, Egypt, China, Canada, and others highlighted increased mortality risk in the over 60 age group [OR=2.57, CI 95% 1.2-5.4] [19].
The 17 to 24-year age group ranked second in mortality rates, mirroring patterns in Argentina, Brazil, Chile in Latin America, and Poland in Europe, where this age group is most affected, attributed to riskier behaviors like speeding and helmet non-use [16,20,21,22,23]. Our findings indicate a general mortality rate reduction in traffic accident of 1.23%, notably in the sierra, coast, and Amazon regions, in contrast to Brazil, Paraguay, Pakistan, Mongolia, and North Korea, where trends are stable or increasing [24,25]. This underscores the need to sustain or enhance public policies for road safety as a public health priority, as mandated by Ecuador's law on terrestrial transport, transit, and road safety [26].
Significant issues with underreporting and misclassification of traffic accident types leading to mortality complicate the understanding of the problem's magnitude and limit regional data comparison. In our study, 54.9% were classified as "(V89) Accident in another type of unspecified transport," impacting data analysis precision [27]. Despite initiatives by PAHO and the Latin American and Caribbean Network for Strengthening Health Systems (RELACSIS) to train health personnel in proper death certificate completion as per WHO standards [27].
In the analysis of inequalities, it was evidenced that the level of illiteracy and per capita income pose greater risks in provinces with lower literacy and income rates compared to the quartile with better social conditions, echoing findings from a study in Quito where the highest mortality rate was prevalent in populous areas [28]. A study in Canada revealed a higher incidence of pedestrians, cyclists, and vehicle occupants injured in poorer areas compared to wealthier ones [29]. This mirrors results from a study in Norway, which showed increased mortality from traffic accidents (AT) in the 16 to 20-year age group in correlation with rising levels of social disadvantage and declining parental education levels [30]. Similarly, in the United States, it was indicated that there is a strong socioeconomic pattern associated with traffic accident mortality, where groups with higher education levels exhibited a greater decrease in mortality over time [31].
The year 2020, marking the onset of the COVID-19 pandemic, brought changes in global traffic accident mortality trends. Our study identified a significant decrease in traffic accident mortality rates compared to 2019 (a variation of 4.1 points), a trend consistent across all provinces and age groups. Notably, in the over 60 age group, there was a major reduction in traffic accident mortality rates from 30.8 per 100,000 inhabitants in 2019 to 19.9 per 100,000 inhabitants in 2020 (a variation of 10.99 points) [32]. An traffic accident analysis in Ecuador during the pandemic's early stages showed a 67.4% reduction in fatalities due to confinement and mobility restrictions [32]. Research in Peru reported that traffic accident mortality experienced the greatest decline among external causes of death, particularly during the first 40 days of confinement, before returning to its previous trend towards the end of 2020 [33].
Lastly, factors associated with road safety in Ecuador are mandatory, including speed reduction, use of seat belts, child seats, helmets for motorcyclists, and refraining from driving under the influence of alcohol and drugs [6,26]. However, not all of the population adheres to these measures; these factors were not evaluated in our study, a significant limitation. Driving under the influence of alcohol is a common risk behavior, as observed in a study across several Latin American countries, where 1 in 6 injured patients admitted to the Emergency Department had consumed alcohol up to 6 hours before the accident. The probability of having a traffic accident after drinking was 5 times higher than in those who did not drink (with each alcoholic drink, the risk increased by 13%) [34]. Therefore, future research should analyze these variables and their influence on traffic accident mortality in the Ecuadorian population.
5. Conclusions
This study is one of the few conducted in Ecuador aimed at describing and analyzing the trends in mortality due to transportation accidents. It has found an annual decrease in mortality rates during the study period, with a more significant decline among men, in the Amazon and coastal regions, and in the age group of 60 years and older. There is evidence of substantial underreporting in the causes of death. After excluding the main cause ((V89) Accident in another type of unspecified transport), the pedestrian group is the most affected. However, there has been a decrease in recent years, where motorcyclists exhibit higher mortality despite reforms to traffic laws made over these 10 years.
Furthermore, this is the first study on inequalities in traffic accidents in Ecuador, in which we have conducted an analysis combining descriptive, associative, and inequality measures. We hope to provide the necessary information for decision-makers to prioritize this public health issue.
A particularly interesting finding relates to vulnerable road users over 60 years of age, who show the highest mortality rates. Although the overall rate in this group tends to decrease over the entire 10-year period, their vulnerability deserves special attention.
There are socioeconomic inequalities in mortality rates, but it is necessary to study them more deeply to achieve the desired impact on reducing mortality due to traffic accidents. From these data, public policies could be generated.
Author Contributions
Conceptualization, J.P.H-C. and T.O.; methodology, J.P.H-C. and T.O.; software, J.P.H-C. and T.O.; validation, J.P.H-C. and T.O.; formal analysis, J.P.H-C. and T.O.; investigation, J.P.H-C. and T.O.; resources, J.P.H-C. and T.O.; data curation, J.P.H-C. and T.O.; writing—original draft preparation, J.P.H-C. and T.O.; writing—review and editing, J.P.H-C., T.O., A.S., A.C., C.M., G.M., F.G-A., and F.S-C.; supervision, T.O.; project administration J.P.H-C. and T.O.. All authors have read and agreed to the published version of the manuscript.
Funding
This research received no external funding.
Informed Consent Statement
Does not apply.
Data Availability Statement
The data that are presented in this study are available on request from the corresponding author. The data are not publicly available due to maintaining privacy data of the participants such as e-mail addresses.
Acknowledgments
ANID—MILENIO—NCS2021_013.
Conflicts of Interest
The authors declare no conflict of interest.
References
- World Health Organization. World Health Organization. 2019 [cited 2022 Feb 12]. ICD-10 Version:2019. Available from: https://icd.who.int/browse10/2019/en.
- World Health Organization. World Health Organization. 2022 [cited 2022 Feb 12]. Road traffic mortality. Available from: https://www.who.int/data/gho/data/themes/topics/sdg-target-3_6-road-traffic-injuries.
- World Health Organization. Global status report on road safety 2018 summary [Internet]. 2018 [cited 2022 Mar 4]. Available from: http://apps.who.int/bookorders.
- World Health Organization. World Health Organization. World Health Organization; 2022 [cited 2022 Feb 12]. GHO | By category | Road traffic deaths - Data by WHO region. Available from: https://apps.who.int/gho/data/view.main.RoadTrafficDeathREG?lang=en.
- World Health Organization. World Health Organization. 2021 [cited 2022 Feb 12]. Traumatismos causados por el tránsito. Available from: https://www.who.int/es/news-room/fact-sheets/detail/road-traffic-injuries.
- Organización Panamericana de la Salud. Datos sobre la seguridad vial en la Región de las Américas. [Internet]. Organización Panamericana de la Salud. 2016 [cited 2022 Aug 23]. Available from: https://iris.paho.org/bitstream/handle/10665.2/28565/9789275319123-spa.pdf?sequence=6.
- Thomas P, Muhlrad N, Hill J, Yannis G, Dupont E, Martensen H, et al. Road Safety Data, Collection, Transfer and Analysis DaCota - Final Project Report [Internet]. 2013. Available from: http://www.dacota-project.eu/Deliverables/DaCoTA_Final_Report.pdf.
- World Health Organization. World Health Organization. 2020 [cited 2022 Feb 12]. The top 10 causes of death. Available from: https://www.who.int/news-room/fact-sheets/detail/the-top-10-causes-of-death.
- Algora-Buenafé AF, Russo-Puga M, Suasnavas-Bermúdez PR, Merino-Salazar P, Gómez-García AR. Tendencias de los accidentes de tránsito en Ecuador: 2000-2015. Revista Gerencia y Politicas de Salud. 2017;16(33):52–8. [CrossRef]
- Instituto Nacional de Estadística y Censos. Anuario de Estadísticas de Transporte 2020 [Internet]. 2021. Available from: https://www.ecuadorencifras.gob.ec/documentos/web-inec/Estadisticas_Economicas/Estadistica de Transporte/2020/2020_ANET_PPT.pdf.
- Instituto Nacional de Estadística y Censos. INEC. 2022 [cited 2022 Feb 28]. Transporte |. Available from: https://www.ecuadorencifras.gob.ec/transporte/.
- Instituto Nacional de Estadística y Censos. INEC. 2022 [cited 2022 Feb 28]. Defunciones Generales |. Available from: https://www.ecuadorencifras.gob.ec/defunciones-generales/.
- Sanhueza A, Otzen T, Manterola C, Araneda N, Sanhueza A; Statistical Approaches for Analyzing a Continuous Outcome in Experimental Studies Métodos Estadísticos para Análizar un Resultado Continuo en Estudios Experimentales. Int J Morphol. 2014;32(1):339–50.
- Every Woman Every Child Latin America and Caribbean (EWEC LAC). Guía paso a paso para el cálculo de métricas de desigualdad en salud [Internet]. 2015. Available from: https://www.everywomaneverychild-lac.org/wp-content/uploads/2017/06/Guia-paso-a-paso-versión-final.pdf.
- Ladeira RM, Malta DC, De Morais Neto OL, De Mesquita Silva Montenegro M, Filho AMS, Vasconcelos CH, et al. Acidentes de transporte terrestre: Estudo Carga Global de Doenças, Brasil e unidades federadas, 1990 e 2015. Revista Brasileira de Epidemiologia. 2017;20:157–70.
- Genowska A, Jamiołkowski J, Szafraniec K, Fryc J, Pajak A. Health care resources and 24,910 deaths due to traffic accidents: An ecological mortality study in Poland. Int J Environ Res Public Health. 2021;18(11). [CrossRef]
- Bahadorimonfared A, Soori H, Mehrabi Y, Delpisheh A, Esmaili A, Salehi M, et al. Trends of Fatal Road Traffic Injuries in Iran (2004-2011). PLoS One. 2013;8(5):1–5. [CrossRef]
- Segura Cardona ÁM, Cardona Arango D, Berbesí Fernández DY, Agudelo Martínez A. Mortalidad por accidente de tránsito en el adulto mayor en Colombia. Rev Saude Publica. 2017;51:1–8.
- Azami-Aghdash S, Aghaei MH, Sadeghi-Bazarghani H. Epidemiology of Road Traffic Injuries among Elderly People; A Systematic Review and Meta-Analysis. Bull Emerg Trauma. 2018 Oct 1;6(4):279–91. [CrossRef]
- Escanés G. Evolución de la mortalidad por atropellos y colisiones de tránsito en Argentina entre 2001 y 2010. Rev Bras Estud Popul. 2015;32(1):49–71. [CrossRef]
- De Oliveira Moura Abreu DR, De Souza Menezes E, De Freitas Mathias TA. Impact of the brazilian traffic code and the law against drinking and driving on mortality from motor vehicle accidents. Cad Saude Publica. 2018;34(8).
- Otzen T, Sanhueza A, Manterola C, Hetz M, Melnik T. Transport accident mortality in Chile: Trends from 2000 to 2012. Ciencia e Saude Coletiva. 2016 Dec 1;21(12):3711–8. [CrossRef]
- Simán V, Rubio M, Talavera I, González K, Tinjacá N. Informe de juventud y siniestralidad vial. La relevancia de las juventudes para el logro de la meta del ODS 3.6, en materia de reducción de siniestralidad vial. 2021 Sep.
- Moreira MR, Ribeiro JM, Motta CT, Motta JIJ. Mortality by road traffic accidents in adolescents and young people, Brazil, 1996-2015: Will we achieve SDG 3.6? Ciencia e Saude Coletiva. 2018 Sep 1;23(9):2785–96.
- James SL, Lucchesi LR, Bisignano C, Castle CD, Dingels Z V., Fox JT, et al. Morbidity and mortality from road injuries: Results from the Global Burden of Disease Study 2017. Injury Prevention. 2019; [CrossRef]
- Asamblea Nacional. “Ley Orgánica Reformatoria De La Ley Orgánica De Transporte Terrestre, Tránsito Y Seguridad Vial” [Internet]. Quinto Suplemento No 512-Registro Oficial Ecuador; 2021 p. 149. Available from: https://www.comisiontransito.gob.ec/wp-content/uploads/downloads/2021/08/LEY-ORGANICA-REFORMATORIA-DE-LA-LEY-ORGANICA-DE-TRANSPORTE-TERRESTRE-TRANSITO-Y-SEGURIDAD-VIAL.pdf.
- PAHO. Curso virtual sobre el correcto llenado del Certificado de Defunción - RELACSIS [Internet]. [cited 2022 Mar 9]. Available from: https://www3.paho.org/relacsis/index.php/es/webinars-relacsis/411-gt4-de-la-red-curso-virtual-sobre-el-correcto-llenado-del-certificado-de-defuncion.
- Montero-Moretta GE. Determinación social de la mortalidad por accidentes de tránsito en el distrito metropolitano de Quito, año 2013. Revista Facultad Nacional de Salud Pública. 2018;36(3):31–42.
- Morency P, Gauvin L, Plante C, Fournier M, Morency C. Neighborhood Social Inequalities in Road Traffic Injuries: The Influence of Traffic Volume and Road Design. [CrossRef]
- Kristensen P, Kristiansen T, Rehn M, Gravseth HM, Bjerkedal T. Social inequalities in road traffic deaths at age 16-20 years among all 611 654 Norwegians born between 1967 and 1976: a multilevel analysis. Injury Prevention [Internet]. 2011 [cited 2022 Mar 4];18. Available from: http://www.ssb.no/english/. [CrossRef]
- Harper S, Charters TJ, Strumpf EC. Trends in socioeconomic inequalities in motor vehicle accident deaths in the United States, 1995-2010. Am J Epidemiol. 2015;182(7):606–14. [CrossRef]
- Gómez-García A, Escobar-Segovia K, Cajías-Vasco P. Impacto del COVID-19 en la mortalidad por accidentes de tránsito en provincias de la República de Ecuador. CienciAmérica. 2021;10(1):24. [CrossRef]
- Calderon-Anyosa RJC, Bilal U, Kaufman JS. Variation in non-external and external causes of death in Peru in relation to the COVID-19 lockdown. Yale Journal of Biology and Medicine. 2021;94(1):23–40.
- Borges G, Monteiro M, Cherpitel CJ, Orozco R, Ye Y, Poznyak V, et al. Alcohol and Road Traffic Injuries in Latin America and the Caribbean: A Case-Crossover Study. Alcohol Clin Exp Res. 2017;41(10):1731–7. [CrossRef]
Figure 1.
Traffic Accident Mortality Rate per 100,000 inhabitants by region.
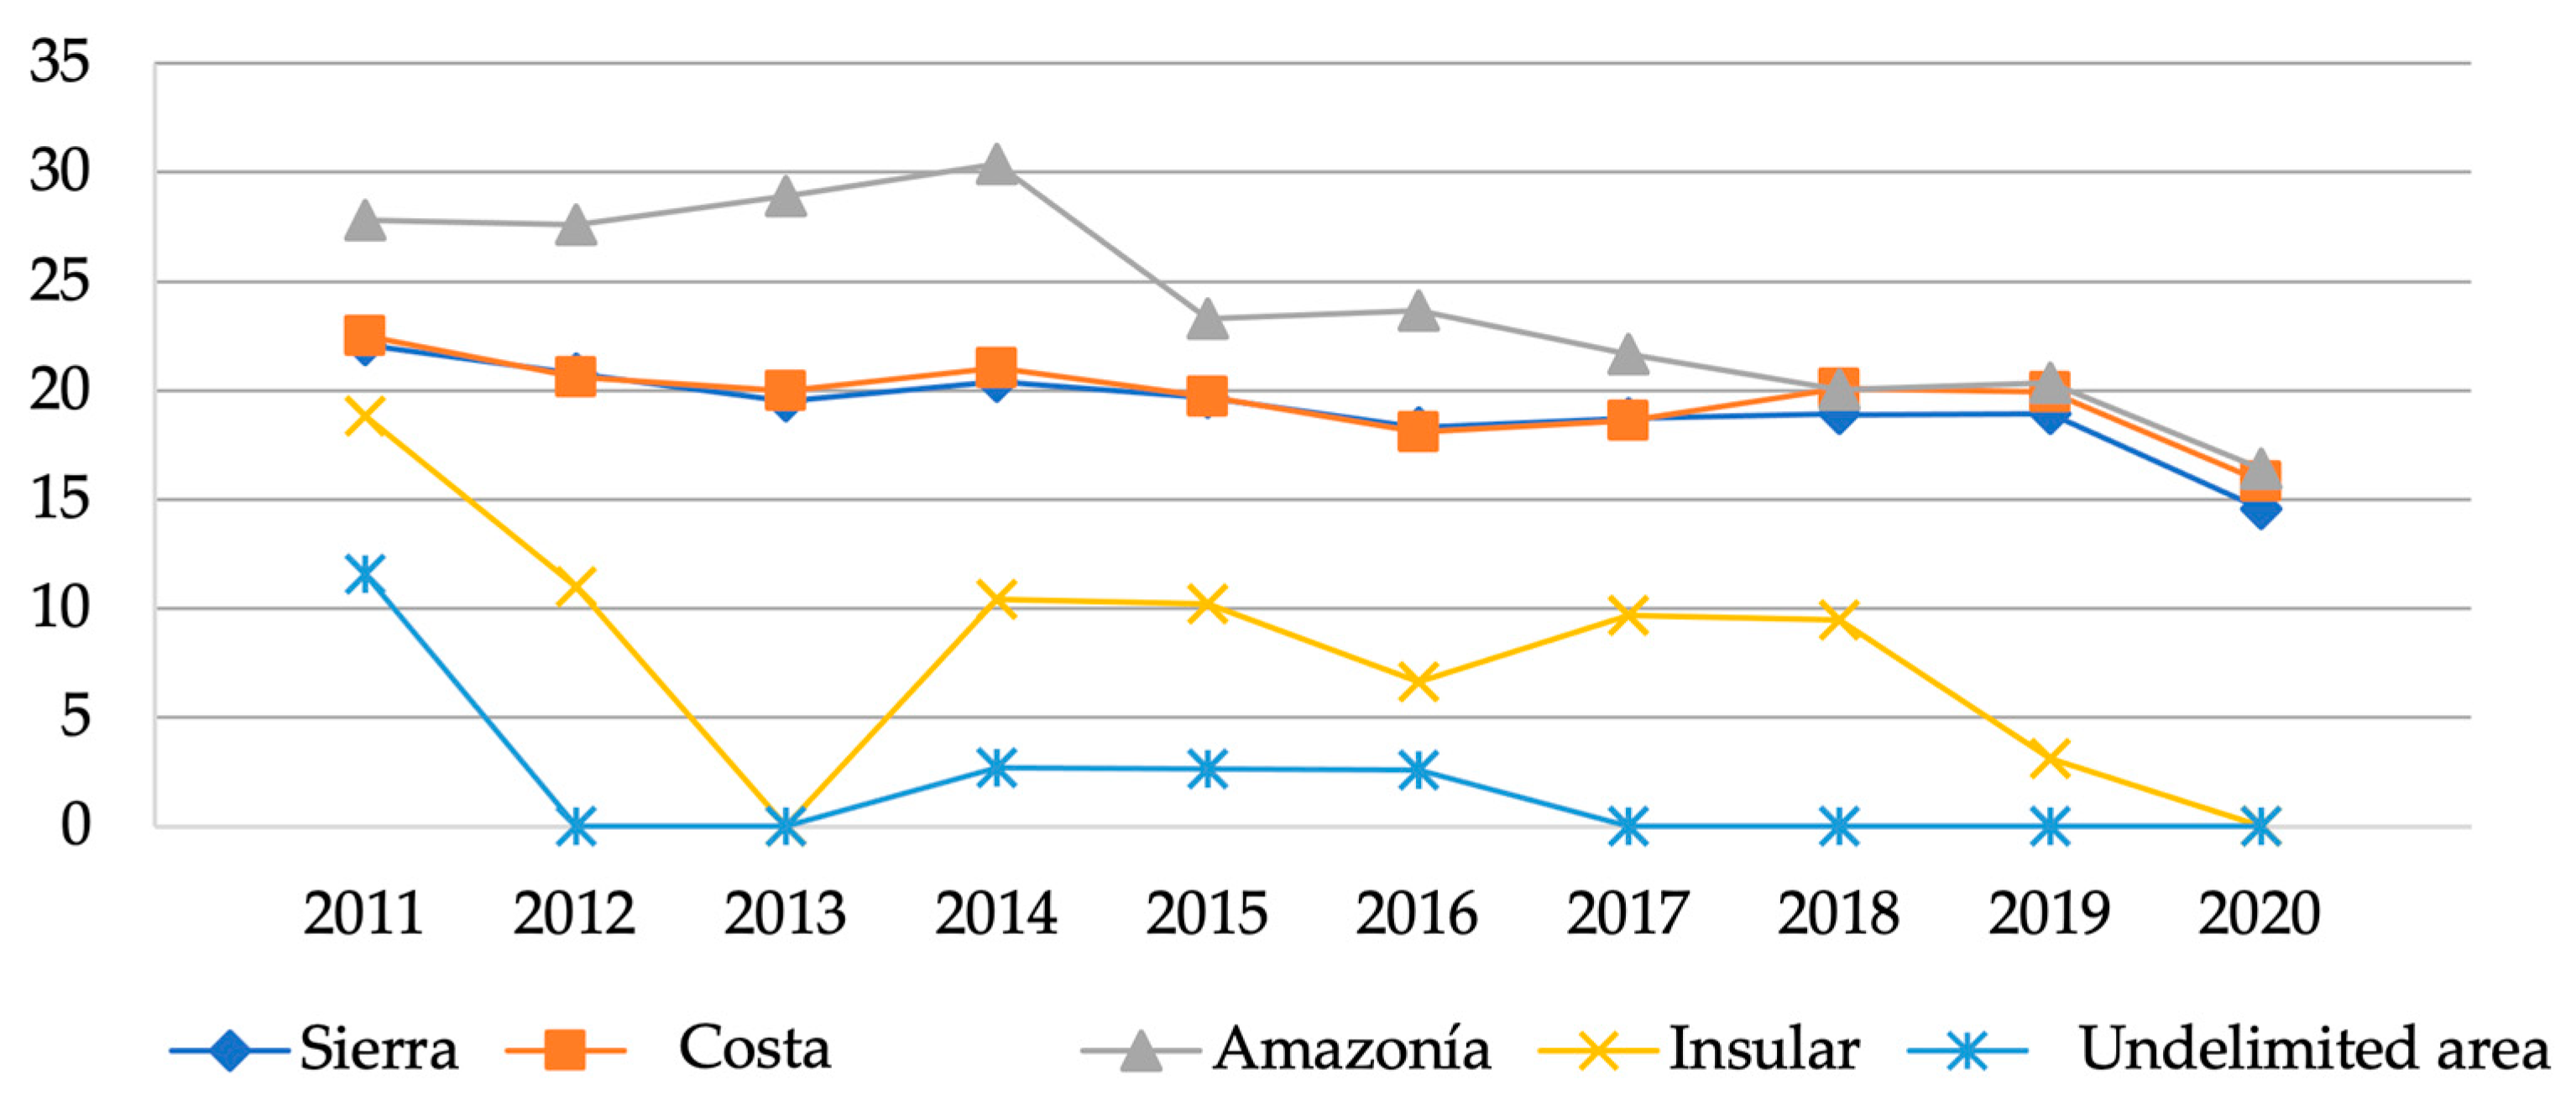
Figure 2.
Traffic Accident Mortality Rate per 100,000 inhabitants, by gender.
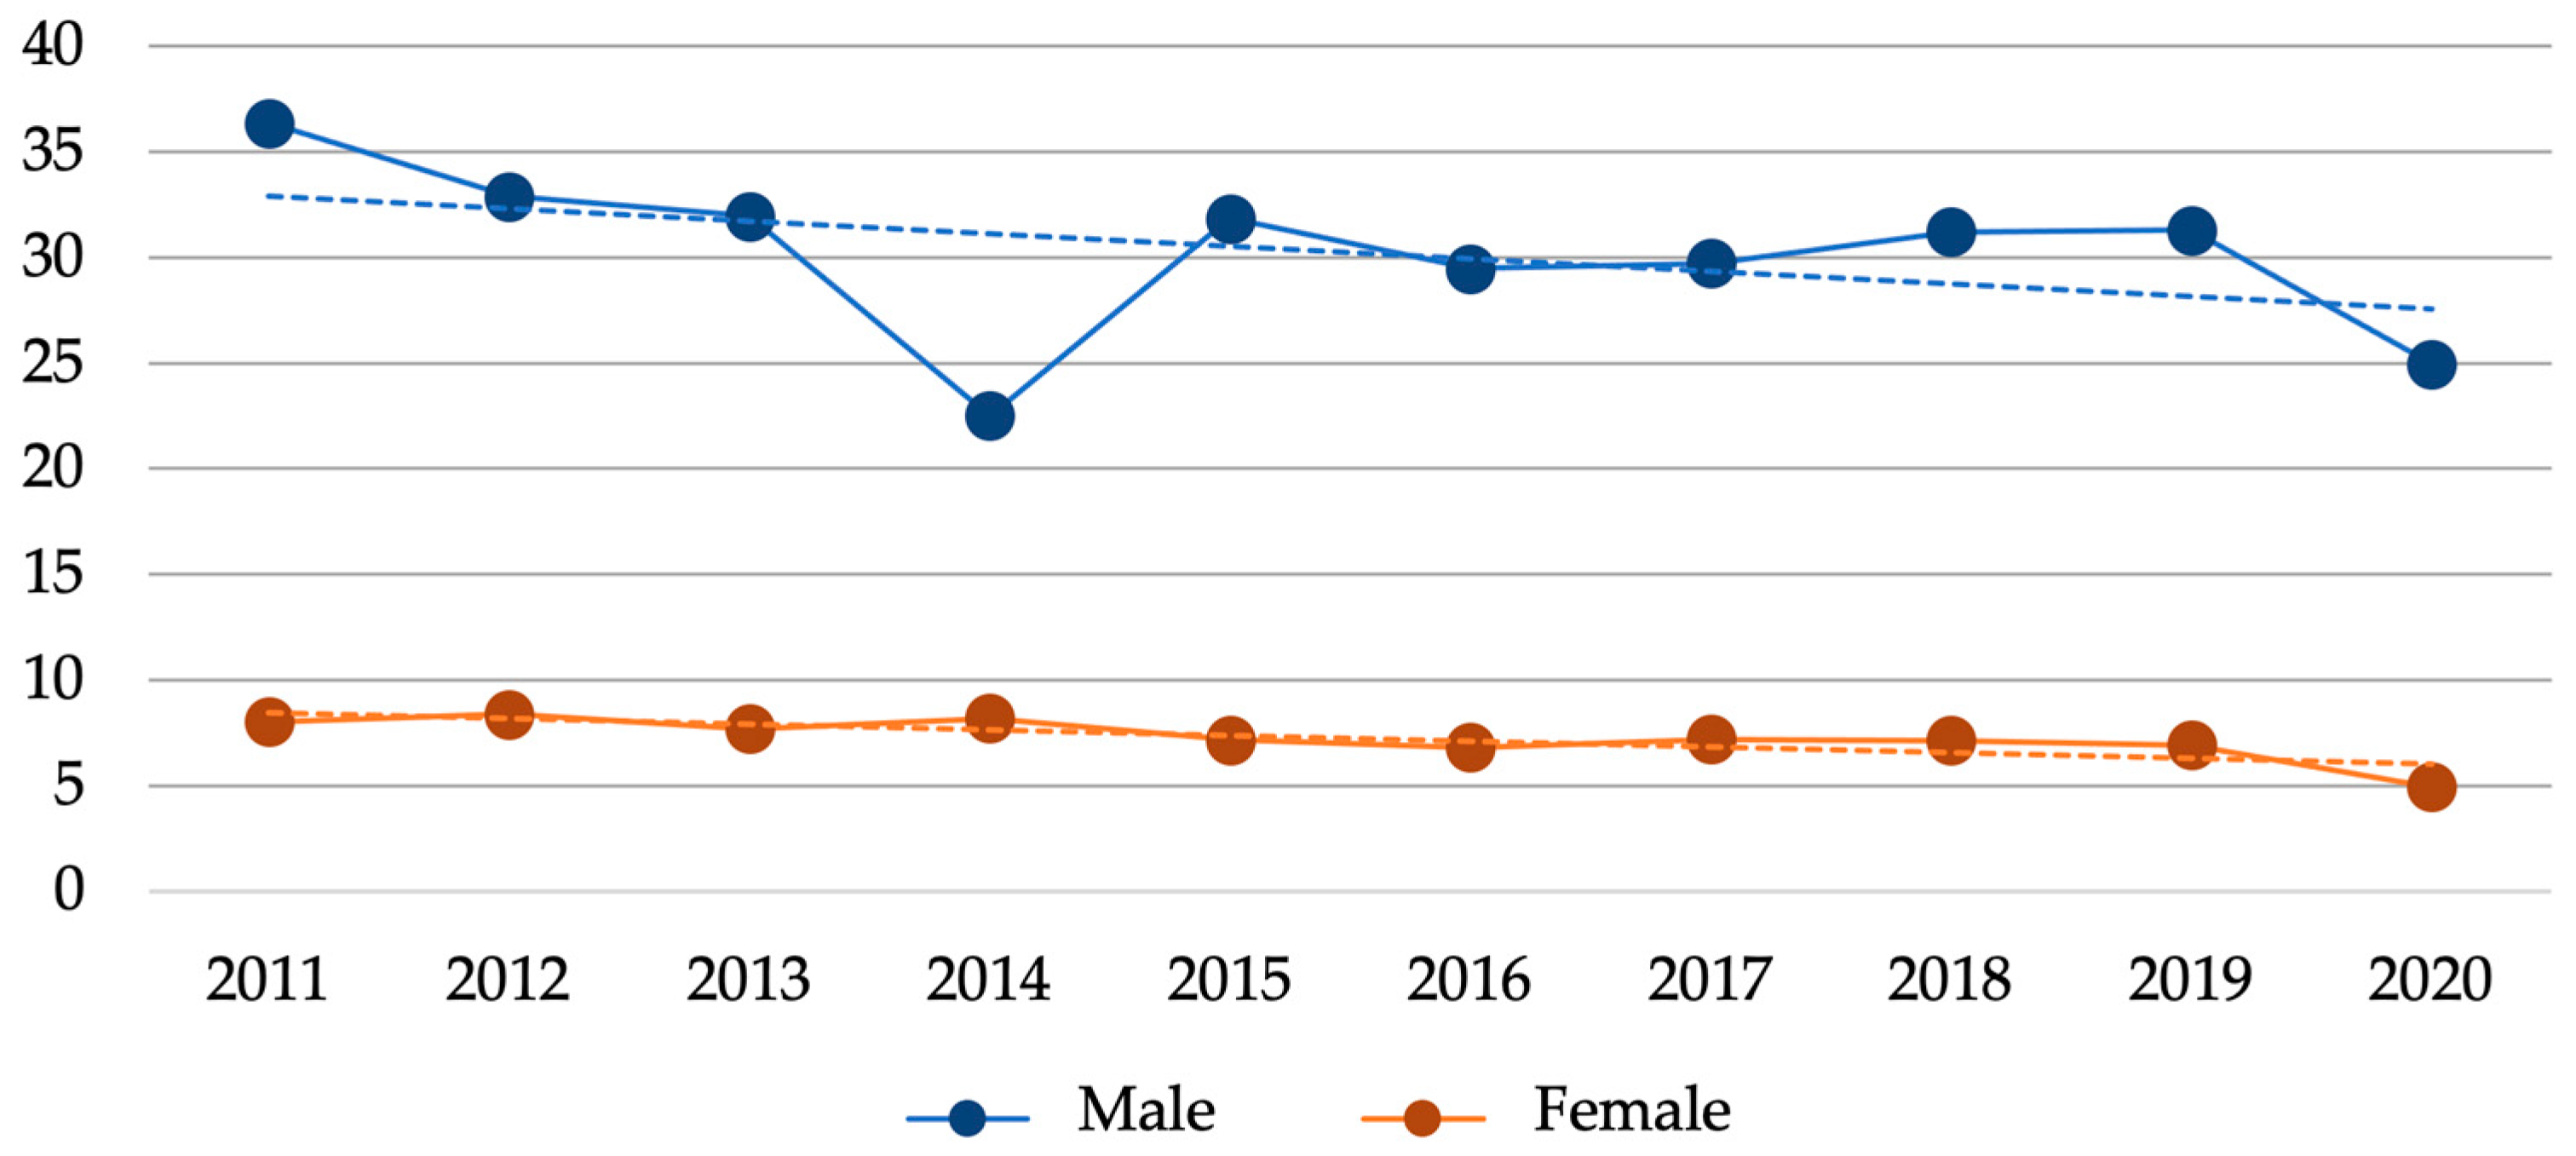

Table 1.
Traffic Accident Mortality Rate per 100,000 inhabitants by gender, region, provinces, age range, and male vs female rate ratio with respective 95% CI and p-value.
Table 1.
Traffic Accident Mortality Rate per 100,000 inhabitants by gender, region, provinces, age range, and male vs female rate ratio with respective 95% CI and p-value.
| TAMR | APV | 95% CI | p | |||
| General rate | 19.17 | -1.23 | -1.84 | -0.62 | <0.001 | |
| Gender | Male | 31.32 | -1.12 | -1.71 | -0.53 | 0.01 |
| Female | 7.25 | -1.70 | -2.58 | -0.81 | 0.01 | |
| Region | Sierra | 19.19 | -1.27 | -1.91 | -0.63 | <0.001 |
| Costa | 19.64 | -1.00 | -1.65 | -0.36 | 0.02 | |
| Amazonía | 24.01 | -2.52 | -3.30 | -1.73 | <0.001 | |
| Insular | 7.94 | -6.29 | -14.53 | 2.74 | 0.20 | |
| Undelimited area | 1.95 | -6.38 | -12.43 | 0.08 | 0.09 | |
| Provinces | Azuay | 13.55 | -0.03 | -2.35 | 2.34 | 0.98 |
| Bolívar | 19.19 | -0.57 | -2.27 | 1.15 | 0.53 | |
| Cañar | 22.11 | -0.34 | -1.78 | 1.11 | 0.65 | |
| Carchi | 19.49 | -0.94 | -2.30 | 0.44 | 0.22 | |
| Cotopaxi | 27.34 | -2.20 | -3.61 | -0.77 | 0.02 | |
| Chimborazo | 24.46 | -1.20 | -2.39 | 0.00 | 0.09 | |
| El Oro | 21.82 | -1.50 | -2.72 | -0.26 | 0.05 | |
| Esmeraldas | 14.74 | -1.87 | -3.52 | -0.19 | 0.06 | |
| Guayas | 18.97 | -1.45 | -2.05 | -0.84 | <0.001 | |
| Imbabura | 18.87 | -2.99 | -4.83 | -1.12 | 0.01 | |
| Loja | 12.65 | -1.34 | -3.49 | 0.86 | 0.27 | |
| Los Ríos | 26.30 | -0.21 | -1.24 | 0.83 | 0.70 | |
| Manabí | 15.54 | 0.01 | -1.09 | 1.11 | 0.99 | |
| Morona Santiago | 21.96 | -0.55 | -2.86 | 1.82 | 0.66 | |
| Napo | 24.42 | -2.94 | -4.97 | -0.87 | 0.02 | |
| Pastaza | 17.88 | -0.54 | -4.40 | 3.47 | 0.79 | |
| Pichincha | 17.87 | -1.39 | -1.98 | -0.79 | <0.001 | |
| Tungurahua | 18.94 | -1.29 | -2.70 | 0.13 | 0.11 | |
| Zamora Chinchipe | 17.10 | -2.80 | -4.88 | -0.66 | 0.03 | |
| Galápagos | 7.94 | -6.04 | -9.70 | -2.24 | 0.02 | |
| Sucumbios | 29.11 | -4.11 | -5.42 | -2.79 | <0.001 | |
| Orellana | 28.18 | -2.31 | -4.19 | -0.39 | 0.05 | |
| Santo Domingo | 30.56 | -0.38 | -1.26 | 0.51 | 0.42 | |
| Santa Elena | 12.80 | 0.34 | -1.64 | 2.36 | 0.75 | |
| Age Range | 0 to 16 years | 5.16 | -3.31 | -4.34 | -2.28 | <0.001 |
| 17 to 24 years | 27.39 | -1.14 | -1.75 | -0.53 | 0.01 | |
| 25 to 40 years | 27.02 | -0.70 | -1.24 | -0.15 | 0.04 | |
| 41 to 59 years | 21.77 | -1.66 | -2.42 | -0.90 | <0.001 | |
| 60 or more years | 32.76 | -2.00 | -3.15 | -0.84 | 0.01 | |
| 1TAMR: Traffic Accident Mortality Rate; 2APV: Annual Percentage Variation; 3CI: Confidence Interval; 4p: p-value | ||||||
Table 2.
Traffic Accident Mortality Rate per 100,000 inhabitants by year, gender and male vs female rate ratio.
Table 2.
Traffic Accident Mortality Rate per 100,000 inhabitants by year, gender and male vs female rate ratio.
| Year | n | TAMR | Male | Female | M/F RR |
| 2011 | 3368 | 22.06 | 36.35 | 8.01 | 4.54 |
| 2012 | 3186 | 20.53 | 32.88 | 8.39 | 3.92 |
| 2013 | 3109 | 19.71 | 31.95 | 7.69 | 4.15 |
| 2014 | 3323 | 20.73 | 33.50 | 8.20 | 4.09 |
| 2015 | 3157 | 19.39 | 31.85 | 7.17 | 4.44 |
| 2016 | 2980 | 18.03 | 29.46 | 6.82 | 4.32 |
| 2017 | 3079 | 18.35 | 29.72 | 7.20 | 4.13 |
| 2018 | 3244 | 19.06 | 31.22 | 7.13 | 4.38 |
| 2019 | 3279 | 18.99 | 31.30 | 6.93 | 4.52 |
| 2020 | 2600 | 14.85 | 24.96 | 4.94 | 5.05 |
| 2011-2020 | 31325 | 19.17 | 31.32 | 7.25 | 4.35 |
| 1n: number of death; 2TAMR: Traffic Accident Mortality Rate; 3M/F: Male/Female; 4RR: Rate ratio | |||||
Table 3.
Absolute risk and annual percentage variation of absolute risk with 95% CI.
| AR | APV | 95% CI | p | ||
| Male/Female | 4.35 | 0.59 | 0.01 | 1.17 | 0.08 |
| Costa/Sierra | 1.03 | 0.27 | 0.01 | 0.52 | 0.07 |
| Amazonía/Costa | 1.22 | -1.53 | -2.37 | -0.68 | 0.01 |
| Santo Domingo/Galápagos | 3.07 | 6.20 | 2.89 | 9.62 | 0.01 |
| Pedestrian/Bus | 40.44 | -9.25 | -15.73 | -2.27 | 0.03 |
| Unspecified Transport/Pedestrian | 3.25 | 6.12 | 5.21 | 7.05 | <0.001 |
| 60 and over/0 to 16 years | 6.48 | 1.35 | 0.82 | 1.89 | <0.001 |
| 1AR: Absolute risk; 2APV: Annual percentage variation; 3CI: Confidence interval; 4p: p-value | |||||
Table 4.
Averages of ages of fatalities due to Traffic Accidents.
| Year | General | Male | Female | ||||||||||
| x | SD | Min | Max | x | SD | Min | Max | x | SD | Min | Max | Diff | |
| 2011 | 37.11 | 20.86 | 1 | 99 | 36.94 | 19.86 | 1 | 99 | 37.86 | 24.82 | 1 | 99 | 0.9 |
| 2012 | 37.03 | 20.58 | 1 | 99 | 36.73 | 19.59 | 1 | 99 | 38.17 | 24.00 | 1 | 99 | 1.4 |
| 2013 | 37.33 | 20.63 | 1 | 103 | 36.63 | 19.43 | 1 | 99 | 40.19 | 24.72 | 1 | 103 | 3.6 |
| 2014 | 37.91 | 20.58 | 1 | 100 | 37.5 | 19.54 | 1 | 100 | 39.55 | 24.28 | 1 | 99 | 2.1 |
| 2015 | 37.75 | 20.79 | 1 | 101 | 36.76 | 19.30 | 1 | 101 | 42.08 | 25.91 | 1 | 93 | 5.3 |
| 2016 | 38.83 | 20.80 | 1 | 98 | 38.37 | 19.61 | 1 | 95 | 40.79 | 25.14 | 1 | 98 | 2.4 |
| 2017 | 38.74 | 20.89 | 1 | 102 | 38.23 | 19.55 | 1 | 98 | 40.81 | 25.51 | 1 | 102 | 2.6 |
| 2018 | 38.65 | 20.70 | 1 | 101 | 37.98 | 19.73 | 1 | 100 | 41.56 | 24.22 | 1 | 101 | 3.6 |
| 2019 | 38.68 | 20.44 | 1 | 102 | 38.06 | 19.54 | 1 | 99 | 41.43 | 23.85 | 1 | 102 | 3.4 |
| 2020 | 37.16 | 18.69 | 1 | 109 | 36.85 | 17.92 | 1 | 109 | 38.71 | 22.09 | 1 | 99 | 1.9 |
| 2011-2020 | 37.92 | 20.50 | 1 | 101.4 | 37.40 | 19.41 | 1 | 99.9 | 40.11 | 24.45 | 1 | 99.5 | 2.72 |
| 1x: Average age; 2SD: Standard Deviation; 2Min: Minimum age; 3Max: Maximun age; 4Diff: Average age difference | |||||||||||||
Table 5.
Types of traffic accidents with their respective percentages and annual percentage rates variation with 95% CI.
Table 5.
Types of traffic accidents with their respective percentages and annual percentage rates variation with 95% CI.
| Types of traffic accidents | n | % | APV | CI 95% | p | |
| Pedestrian | 6131 | 19.57 | -5.87 | -6.97 | -4.76 | <0.001 |
| Cyclist | 359 | 1.15 | 2.75 | -0.39 | 5.99 | 0.13 |
| Motorcyclist | 4379 | 13.98 | 2.37 | -0.98 | 5.85 | 0.21 |
| Vehicle Occupant | 928 | 2.96 | -3.03 | -6.45 | 0.52 | 0.13 |
| Van Occupant | 421 | 1.34 | 4.98 | -1.25 | 11.61 | 0.16 |
| Heavy Vehicle Occupant | 232 | 0.74 | 4.06 | -2.04 | 10.54 | 0.23 |
| Bus Occupant | 321 | 1.02 | 3.79 | -3.92 | 12.13 | 0.37 |
| Other Transport | 960 | 3.06 | -2.63 | -11.41 | 7.03 | 0.60 |
| Unspecified | 17212 | 54.95 | -0.10 | -0.63 | 0.43 | 0.71 |
| Maritime, Aerial, Space | 382 | 1.22 | -1.80 | -9.72 | 6.82 | 0.68 |
| 1n: number of death; 2%: Percentage of fatalities; 2APV: Annual Percentage Variation; 3CI: Confidence Interval; 4p: p-value | ||||||
Disclaimer/Publisher’s Note: The statements, opinions and data contained in all publications are solely those of the individual author(s) and contributor(s) and not of MDPI and/or the editor(s). MDPI and/or the editor(s) disclaim responsibility for any injury to people or property resulting from any ideas, methods, instructions or products referred to in the content. |
© 2024 by the authors. Licensee MDPI, Basel, Switzerland. This article is an open access article distributed under the terms and conditions of the Creative Commons Attribution (CC BY) license (http://creativecommons.org/licenses/by/4.0/).
Copyright: This open access article is published under a Creative Commons CC BY 4.0 license, which permit the free download, distribution, and reuse, provided that the author and preprint are cited in any reuse.


