1. Introduction
The use of VR to enhance training in practical activities is not new, however the measurement and impact for such interventions in specific scenarios is a highly active area of academic research. The technology is rapidly advancing, introducing new ways of interacting with virtual environments, suggesting that prior works may become outdated. Prior published works that focus on the ability to use VR to improve aim and target acquisition exists, however is limited to specific training scenarios, such as musicians, athletes, and generalised testing of aiming accuracy and reaction times as independent measures.
This research study investigates the combination of accuracy and reaction times by comparing the use of motion controllers in VR with mouse input on a standard LCD display, drawing on the prior body of research using a systematic approach. The aim of the literature review was to identify research gaps and investigating task performance in VR.
The work of [
1] and [
2] further demonstrates the need for research within the area of measuring accuracy in VR and the associated distinct research gap. The evident gap in knowledge regarding the assessment of RT and accuracy within a virtual environment illustrated the importance of carrying out further research in this highly active area as justified in the literature review.
2. Literature Review
The main purpose of VR is to emulate specific scenarios while maintaining an experience that is comparable to the real world and relies upon the use of hardware and software to create an illusion of being immersed within a fully digital environment [
3]. It is essential that the three pillars of VR [
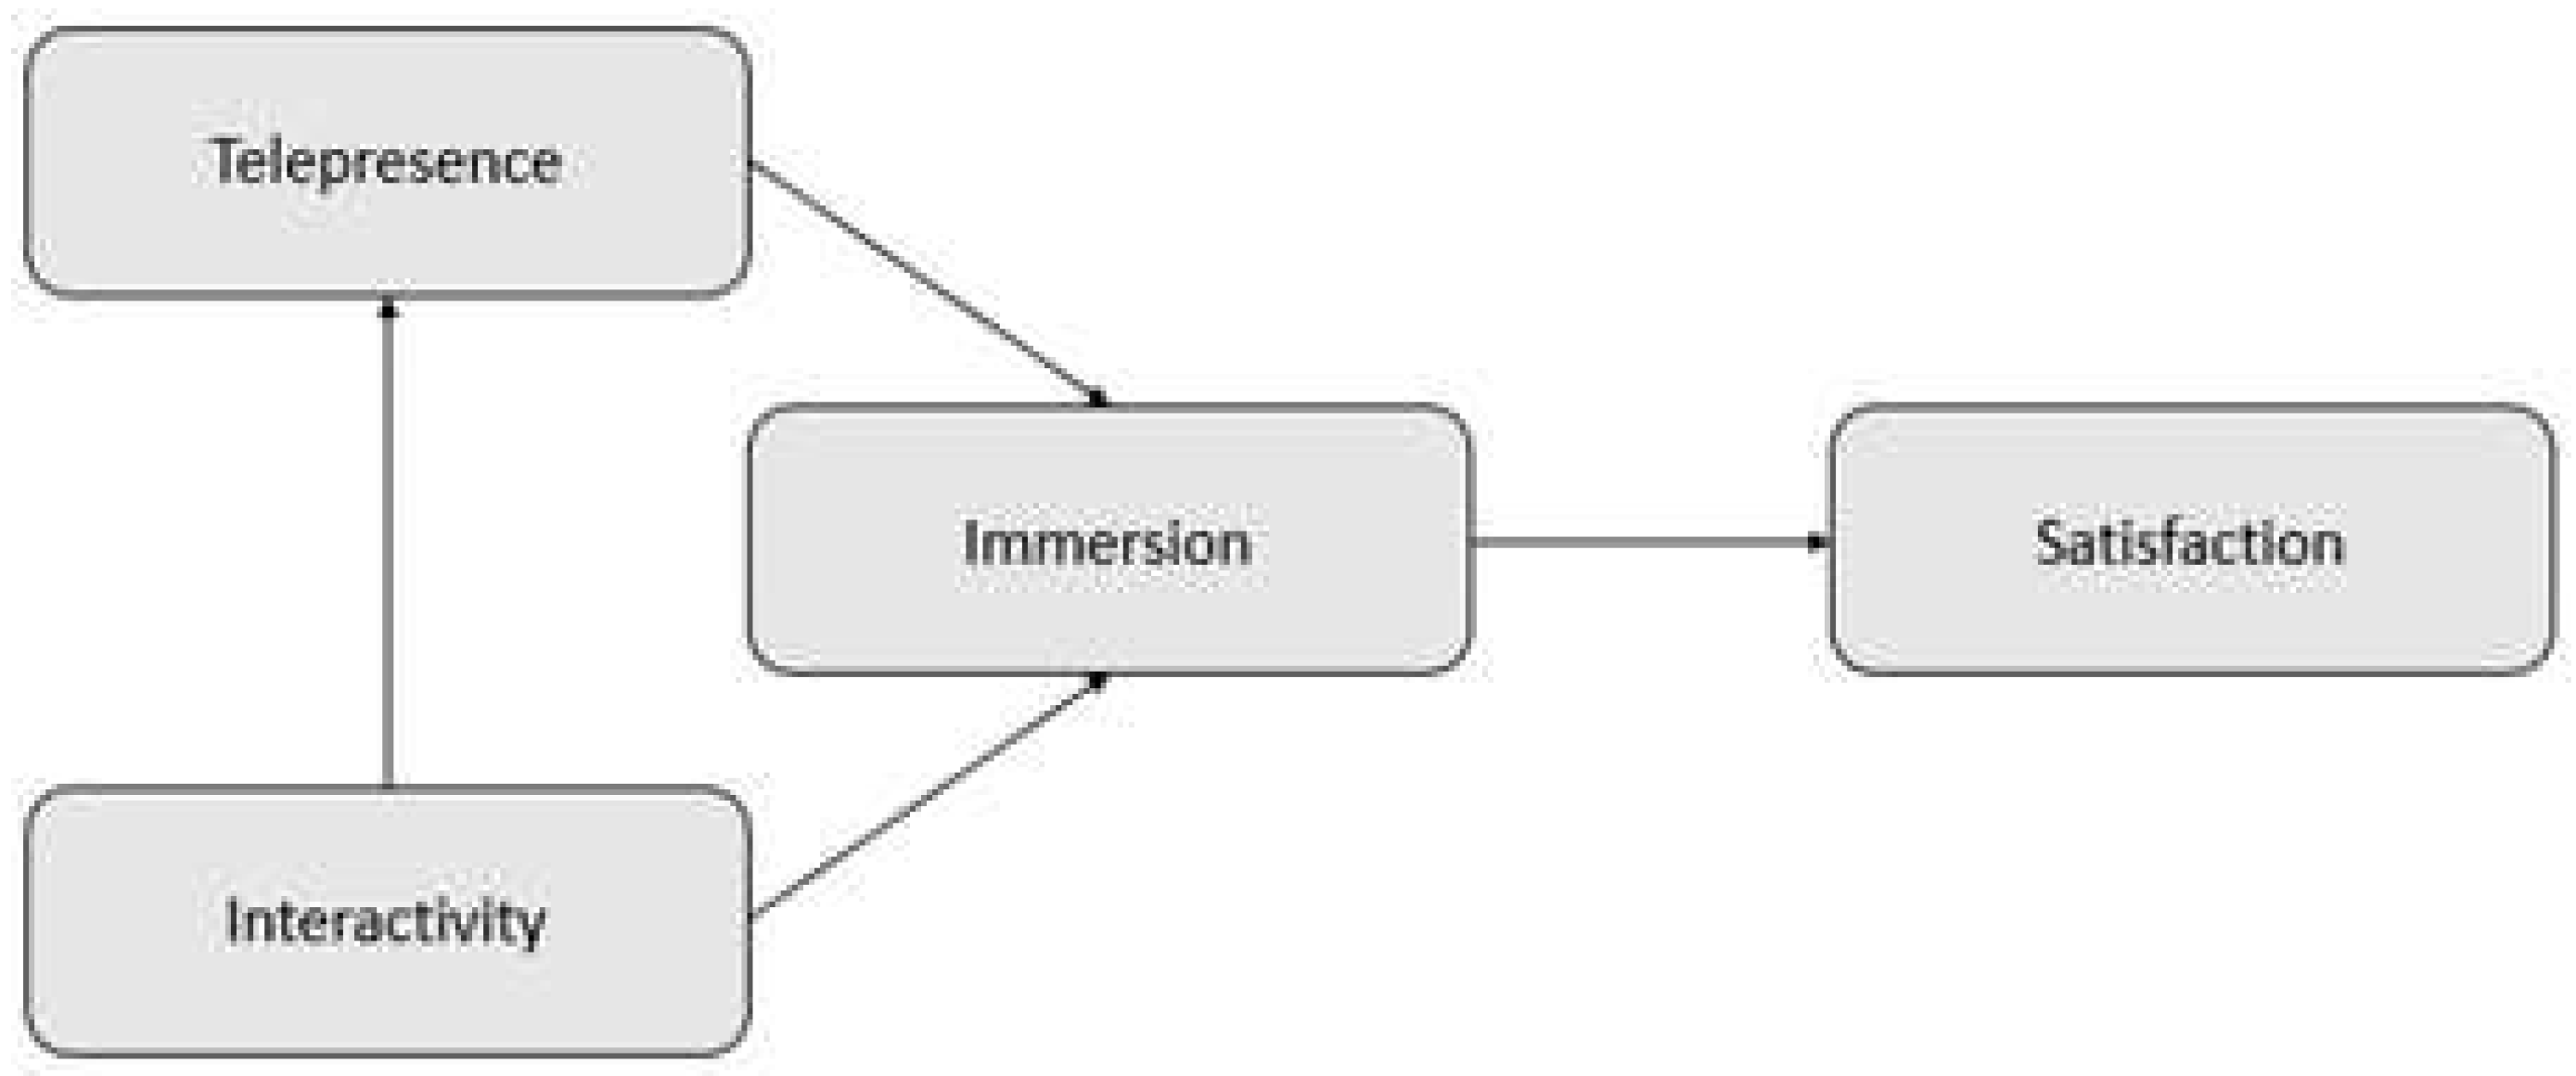
4] are in place to ensure that any given VR simulation is accepted by the user. Immersion, telepresence and interactivity contribute to the realisation of a satisfactory virtual experience as illustrated in
Figure 1.
The dependent variable, satisfaction, can be measured in several ways. One of which is the state of flow that a user is in when using VR, described by [
4] as “a state of optimal experience where one is completely absorbed and immersed in an activity“. This is a particularly important aspect to consider, as if a user is not in a state of flow, “concentration on the task at hand and the autotelic experience“ [
5] is not as optimal. The three pillars therefore must be considered when conducting the research as it is integral that content created is appealing [
4] for users to participate in.
VR motion controllers, keyboards and/or the use of a mouse fall within the definition of user devices, defined as “any device that transfers data, programs or signals into a processor system“ [
6].
Performance is defined as “the act of performing a task“ [
7]. In relation to this study, users will be performing VR tasks during an intervention. The standard in which tasks are performed can vary and therefore require metrics to measure levels of performance.
Due to the research area looking specifically at VR, it is important to focus the metrics for performance firmly against the completion of tasks that are digitally mediated. The two main metrics found in the literature used to record task performance for such activities were reaction time [
8] and Accuracy [
9].
Reaction time (RT) is defined as “the time interval between the presentation of a stimulus and initiation of a voluntary response“ [
8]. To further elaborate, RT can be directly influenced by a plethora of factors. Looking into the findings of [
10], “age, gender, distractions, personality or drugs“ are all variables that can affect RT. Additionally, [
11] further claim that “exhaustion, physical fitness, experience and motivation“ also influence results when carrying out RT research.
There are many different definitions of accuracy, however for the purposes of this research is defined as “the ability to complete a task without making mistakes“ [
12]. This definition has been chosen as accuracy has a direct impact on performance; if a participant makes several mistakes in a given activity, their performance will be poor. The opposite will clearly apply for high accuracy rates. As stated by [
13] accuracy can be affected by an individual’s age, if they are a higher performer, or if they are fatigued. All of these factors need to be considered when conducting this research.
Reaction time and accuracy have been reported as being linked together such that as reaction time increases, accuracy of task completion decreases and vis-à-vis [
14], therefore these metrics will be used to form the basis of the initial research.
2.1. Reaction Time
[
15], proved their hypothesis that VR has “the potential to improve reaction time in young musicians“. This demonstrates how VR can further catalyse RT improvement. This “experimental“ [
16] study included fourteen participants aged between fourteen and nineteen (“8 female and 6 males“) [
15] with a mean age of 17.6 years. To remove outside uncontrolled variables and to standardise findings, volunteers with “diagnosed neurological diseases, fear of restricted vision, diagnosed musculoskeletal diseases or injuries to the locomotive system“ [
15], were uneligible to participate.
[
15] used the “HTC Vive Pro“ headset with it’s default motion controllers to train RT and chose to couple the hardware with the software ”BeatSaber” [
17]. Beatsaber requires to slice through coloured blocks in sync with audio and is considered the main locale within the study.
[
15] observed that the increase of reaction time could be due to an increase of neuroplasticity which trains the ability to make adaptive changes in the brain in time with the beat of the music [
15]. This suggested that the inclusion of music as an additional stimuli may further catalyse improvement in RT and therefore introduce outside factors impacting on the credibility of the results.
[
11] completed a study that involved the “examination of whether a visual stimuli program during soccer training can affect RT“ [
11], over a six-month period. The study’s participants were “38 athletes with a mean age of 12.24 years“ [
11]. Furthermore, the mean soccer experience was 3.32 years between all 38 athletes. Soccer training data was collected over a six-month period, to assess whether there was any improvement between participants. The research found that there was no statistically significant impact on RT when using VR which illustrates that RT in VR parallels real-world interventions making the argument that VR is a viable alternative in some circumstances to real-world activities.
The “Oculus GO“ and “Oculus Quest 2“ [
11], headsets alongside their proprietary motion controllers were used to carry out the research. Furthermore, the software utilised was an “individual training program“ which would change “according to player position“ [
11],. Participants were tasked to complete “technical exercises and exercises that strengthen reflexes” [
11], in fifteen-minute intervals. These exercises included:
Shooting,
Skipping,
Ball diving,
Reception,
Reflexes,
All of these activities were completed using “light sensors“ in conjunction with user movement. The VR training application can be considered the main locale within this experiment.
The demographic selected for this study is worthy of scrutiny. “Soccer players have better peripheral vision, depth perception and tracking of a moving object in comparison to non-athletes“ [
11], which could create a bias in results and presents a further justification for VR-RT related confirmatory research.
Additionally, as stated by [
11], “RT is negatively associated with age“, which can create bias when comparing studies. Expanding on this, the older a participant is the higher likelihood of a reduced RT. [
11], included participants with a mean age of 12.24 years (+1.76), and [
15] 17.6 years (+1.1). This provides validity to the statement as the study with older participants saw better results. This highlights a need for age to be considered within this study.
The data collection methods between studies differed. [
15] used a plate tapping test followed by a “ruler-drop test (Ditrich’s test)“ to measure the reaction time. However, [
11] collected “soccer training data“ over a six-month period. Given the difference in time scale and method of data collection, this could create a shift in results. This will need to be considered when conducting research, as data comparisons should be completed in identical conditions.
As established by [
18], “reaction to sound is faster than reaction to light“, which can also affect results. Both studies stimulate different senses. BeatSaber uses “immersive music“ mechanics, and the football training uses “visual stimuli“. As [
15] received significantly positive results, in comparison to [
11], the sense being stimulated significantly influences results. In order to create a fair experiment, both visual and auditory illusion must be managed effectively to minimise changes between what takes place in a VR and non-VR test environment.
The headsets used in both studies differ and therefore may produce differing results. [
15] used an HTC Vive Pro 2 and [
11] used the Meta Quest 2.
When comparing these two HMDs, the HTC Vive Pro 2 uses SteamVR base stations [
19] to track movement as they provide excellent “positional and rotational accuracy“ [
9], while the Quest 2 uses inside out motion tracking which makes for a “more manageable“ [
20] experience as there is no additional hardware required. It is evident that the HTC Vive Pro 2 provides more accurate tracking, at the expense of portability.
To conclude, there are several variables discussed that illustrate the necessity of further research. [
15]’s et al. (2021) discusses how VR has a positive impact on RT post intervention and that several factors could be responsible for this result with age being most prominent. This was further enforced by the work of [
11], whose findings suggest that the use or VR for visual RT is compariable with non-VR interventions. Given the ages of sample groups, data collection methods, the senses being stimulated and differing outcomes reported amongst the literature, these variables have a significant influence on RT. This outlines the necessity to carry out further research that considers age and mode of stimuli (audio or visual).
2.2. Accuracy
[
1] claims that “accuracy increased“ when conducting their research. The aim of the research was to improve user deictic gestures, while observing accuracy in a VR environment. 28 participants consisting of 19 males and 9 females with a mean age of 24.5 years participated within this study. An exclusion criteria was included so that only participants who were “right-handed, wore no glasses or lenses and had no locomotor issues“ [
1] were able to participate. These conditions are important as all participants will be on a similar level of ability. This will therefore arguably negate ability affecting the study.
The intervention required two participants, one being an observer and another being a pointer [
1]. The pointer would see a target and have to point towards it, so that the observer could interact with the target. The pointer is required to keep their position, and if they went off target, they would need to re-position. Accuracy was measured through the pointers and observers’ relation to the target. An “apple picking“ [
1] condition was also conducted, requiring the pointer to point at specific apples so the observer can pick them as fast as possible.
The HTC Vive headset alongside the proprietary motion controllers were used to carry out the experiment, however the SteamVR tracking base stations were replace with the use of a high-end OptiTrack sensor for greater motion capture data accuracy [
21].
The results demonstrated an increase in accuracy for all conditions [
1]. Additionally, when the pointer’s pose got corrected, “the observer’s accuracy was increased by 22.9%“ [
1]. Accuracy, therefore, was further increased with external assistance, which is worthy of scrutiny. Therefore when conducting this study it is important to let the participant complete their task alone without any external assistance.
[
2] disproved their hypothesis as their experiment indicated “low target accuracy“. The purpose of the study was to investigate the feasibility of using VR to simulate occupational tasks. This study involved 14 participants, 7 males and 7 females. Age was not mentioned within the study; however, they were all selected within university grounds [
2]. The lack of a specific age group can be criticised as this affects the ability to apply the research to the wider population. An exclusion criteria was highlighted, allowing only “right hand dominant and having no upper limb injuries“.
The Oculus Rift alongside its proprietary ID were the selected apparatus for this experiment. In addition to this, in order to complete the VR tasks, a “vertical pointing surface“ containing several buttons was provided. An “engagement questionnaire“ [
2] was the selected software. This entails a user having to point to a stimulus as fast as possible [
22]. Users were put into three scenarios, one in the real world, one in only VR and the last incorporated mixed aspects.
The results concluded that there was “low target accuracy and slower movement“ [
2] with full VR and mixed aspects. The reasoning provided was that “participants were working at higher cognitive levels to adapt to the virtual environment“ [
2]. Reflecting on the three pillars of VR, this could be an issue with telepresence. If the user is struggling to be in a state of “being in an environment“ [
23], they are more likely to reject the overall experience.
[
1] and [
2] both used different input devices which must be considered when comparing studies. [
2] used the Oculus Quest HMD in conjunction with a “vertical pointing surface“. In contrast, [
1] used the HTC Vive alongside the OptiTrack. The difference in input method is notable as one uses software specific apparatus, and the other uses a commercial motion controller alongside a specialist motion tracker. Some may argue that [
2] provided more accurate results as the input device was tailored to that specific task. However, [
1] provided additional accuracy due to the non-commercial motion capture device.
The contrast in results could have been down to fatigue [
13]. [
2] mentioned that “joint fatigue“ may have played a part and affected the results. [
1] took fatigue into account when conducting their research as when fatigue was apparent, participants received “a break to relax“. This therefore resulted in “negligible“ fatigue being experienced alongside an increase of accuracy.
In conclusion it is evident that there is a clear gap in current knowledge when assessing accuracy and VR. [
1] illustrates how accuracy “was increased“ with the application of VR. This is contradicted by the work of [
2], who concluded with “low target accuracy“ from participants. Due to the apparent difference in test conditions and task at hand, both results may have been affected by outside uncontrolled variables. From this, joint fatigue, adapting to the virtual environment and the selected HMD [
2] will be considered when conducting research.
2.3. Literature Review Summary
Several poignant sources have highlighted the need to conduct research on the effect that VR training has on aim performance.
There is a gap in relevant RT based resources, which highlights the necessity to conduct research around this area. VR “has the potential to improve RT“ [
15]. However, VR has also shown to have no “statistically significant impact on RT“ [
11]. Both of these studies examined different stimuli and without further research remain contradictory. Conversely, reaction to sound is faster than reaction to light [
18]. This may explain why there is a conflict in results.
Accuracy has seen to have a “significant increase“ [
1] with the application of VR. However, VR has also provided “low target accuracy“ [
2]. It could be suggested that the difference in test conditions have affected the outcome of both of these results. Telepresence appears to be a factor that appears to have affected this result, as participants struggle to adapt to the virtual environment.
In summary, several poignant sources have highlighted the necessity to conduct research on the effect that VR aim training has on task performance. Having critically analysed the current literature, two hypotheses have been identified:
H1: Considering [
11] had used a specialised input device during their study and produced differing results to the works of [
15], who used default Oculus Quest 2 input devices, it is hypothesised that input device has a significant impact on task performance.
H2: Furthering on H1, it is hypothesised that VR has a significant impact on task performance. This is evidenced through the results provided by both [
15] in conjunction with [
1]. This is due to how VR intervention increased accuracy and RT respectively. With this in mind, age, data collection methods, timescales and the stimuli will all need to be considered when reflecting this hypothesis.
3. Methodology
The main objective of this study was to investigate how VR aim training influences task performance. In contrast to the work of [
15], a control group will be included. This means that the study incorporated two groups of participants in order to compare results using a controlled study design.
The experiment entailed two groups of participants an aim training application to assess and compare task performance assessed using the metrics, ‘accuracy’, and ‘RT’ as per the literature review outcomes.
When looking for software to support the research, it was apparent that there was a lack of software that supported both the Meta Quest 2 and standard Windows desktop in a single application. The applications [
24] and [
25] were used as they both provide metrics for ‘shots hit’, ‘overall shots’ and ‘overall time’ in their results screens, which are representations of accuracy and RT.
Additionally, as stated by [
18], “reaction to sound is faster than visual stimulus“. Therefore in order to create a fair experiment both visual and auditory stimuli are required. AimVR and Aiming.pro provide these in the same manner, by displaying spheres that can be interacted with. Upon interaction, a sound is played to confirm a ’hit’ has been successful and then to signal the change of the sphere’s location.
The selected aim training software and settings used in this study enabled the variables to be controlled as the settings or conditions for participants within Group A or Group B were fixed allowing for a fair and controlled experiment.
Fatigue can influence accuracy and therefore needs to be accounted for [
13]. The selected software anchored users to a fixed location a blank room with the task of popping as many spheres as possible within a 55 second period. This time frame ensured the experiment was brief, preventing user fatigue while still capturing enough data for analysis.
Each participant was granted three attempts at the intervention to enable an average score to be calculated. This ensured the data could be triangulated and present a more accurate final dataset for analysis. In addition, three attempts per participant enabled the data to be observed in other ways; for example whether participant scores increased across each of the three attempts.
[
11] suggested that a three-minute intervention was recommended. Given that no fatigue was mentioned within their experimentation, the same amount of time was adopted for this research enabling future comparison of results.
Both applications were configured to display a single sphere at a time as the “interval between the presentation of one stimulus and initiation of a voluntary response“ [
8] was the focus of the test, removing additional associated with having to take into account multiple stimuli (i.e. spheres) simultaneously. The spheres were placed in the digital environment at the same distance away from the user to mitigate the need to focus based on depth perception. Furthermore, all spheres used the same colour to remove any impact that differences in visual appearance could have on target acquisition and aiming accuracy.
Once this intervention was completed, users noted their score for shots hit and overall shots on a digital worksheet. The scores were further verified by a moderator. Participants were given the option to leave an email address enabling them to be contacted if they presented anomalous results.
Before any data collection, participants were made aware of:
The purpose of the study,
They have a right to withdraw at any stage,
If they are eligible to participate,
All personal data will be kept confidential,
What the activity involves (Cryer, 2006).
This information was delivered through a poster that was mandatory to read prior to any intervention In addition to this, participants signed a physical consent form to confirm they had read the information sheet and were eligible to participate.
The data collection process was undertaken in accordance with the University’s research governance and ethics guidance. The data received was be kept on a password protected excel sheet, on an external storage device. Physical consent forms were kept until fully necessary and appropriately shredded and disposed of when no longer required.
The data analysis attempted to answer the research question by addressing the following points of interest:
Whether there was a statistically significant gap in performance between methods.
If users improved upon iteration of the task.
Whether any specific gender was better at the task.
If any specific age bracket was better at the task.
If those who played video games more often showed a statistical improvement.
If those who are already familiar with VR show an improvement.
Through answering these questions further research can be identified in the specific category.
The one-way and two-way ANOVA approaches were used to test for data validity alongside the ‘tukey’ function in R-studio that provided clarity on the accuracy of the findings. Quantile-quantile (QQ) plot and histograms illustrated the majority of outliers visually and identified anomalous data findings. The confidence threshold for this experiment was 95%, therefore any statistic with a 0.05% difference is considered statistically significant.
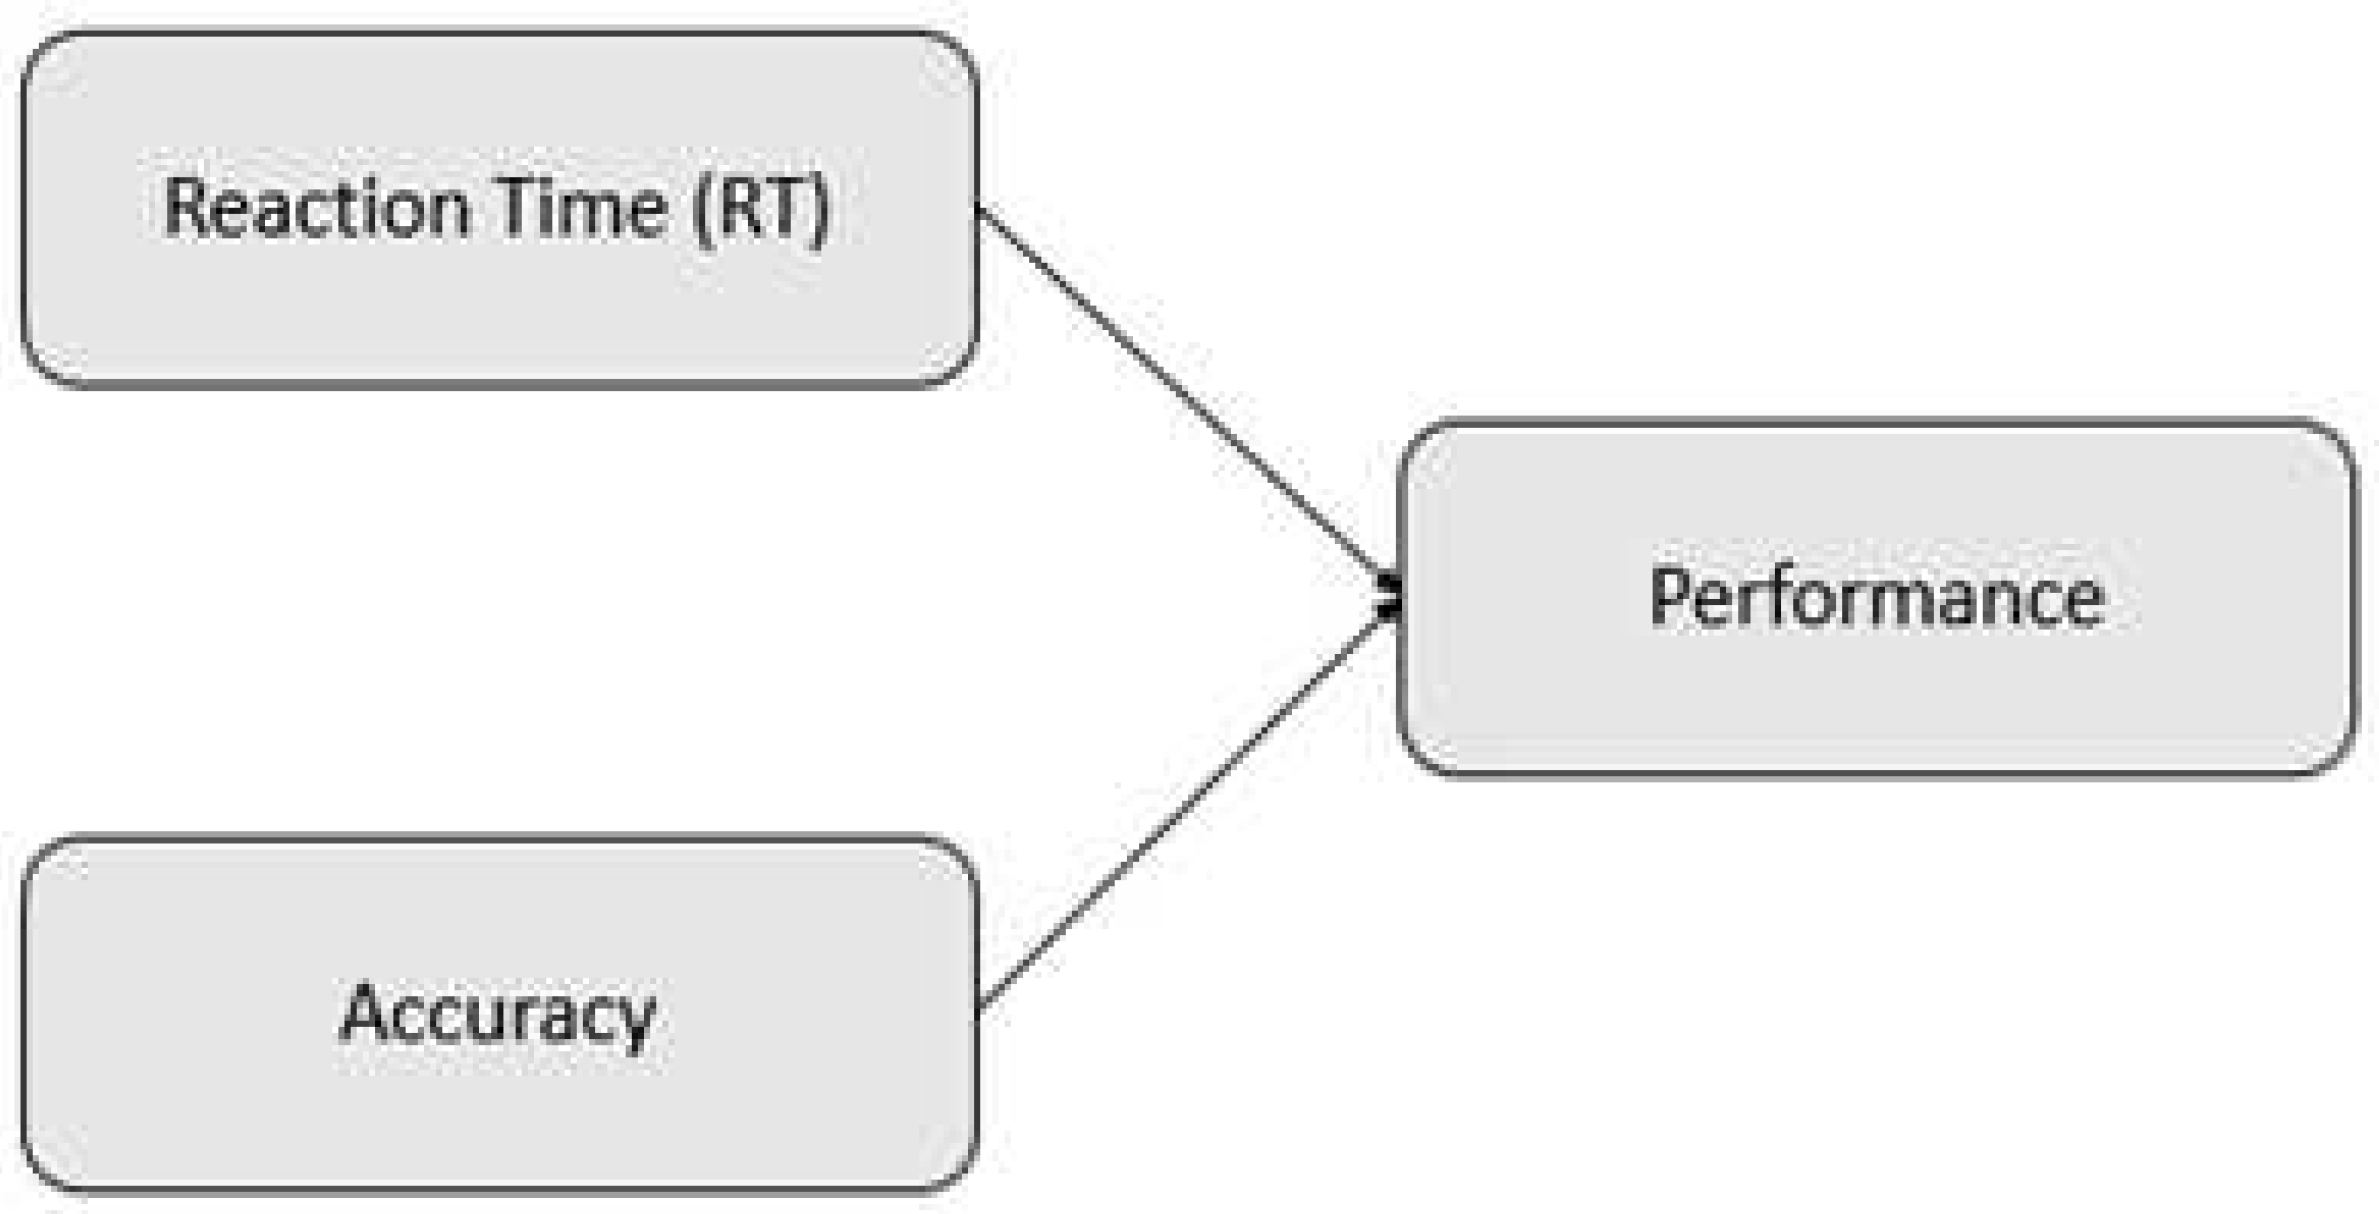
The independent variables were the participants RT and accuracy (
Figure 2) as both of these metrics were only influenced by the participant and no other variables and were tested to confirm their affect on the dependent variable, Performance.
As this research is controlled, Group A and B will require two input methods. The VR HMD and input device that will be used is the Meta Quest 2. Given that the Meta Quest 2 supports wireless play, it will provide the user with the least movement-based restrictions.
Despite the HTC Vive Pro 2 Steam VR base stations providing "laser accurate" tracking, this added extra complexity when setting up the research task, therefore the Meta Quest 2 was used as it had the ability to be deployed in a wider range of locations.
Group B will be using an orthodox desktop setup, consisting of a keyboard, mouse, monitor and speakers. The desktop specifications consist of:
A regular desktop setup was selected because Aiming.pro provides an equivocal simulation to AimVR. A regular desktop setup also best represents physical reality, in comparison to VR.
25 participants per group was the bare minimum required because this is the number in which distribution begins to conform to a normal curve [
26]. In an ideal situation, 30 participants per group is desirable however slightly lower numbers are able to give statistical significant findings.
Therefore 50 participants were required overall who were split into two groups (Group A and Group B). 25 participants per group were required to ensure a clear bell curve could be identified to assess performance and rank all participants [
27].
A convenience sample was used to increase the chances of recruiting the desired sample size while applying an exclusion criteria to protect participants from experiencing any undue distress. The exclusion criteria was as follows:
Age was not a barrier for participants to ensure the findings were as representative of the general population as possible. Those that wear glasses were also included within the study as the Meta Quest 2 accommodates glasses.
A limitation of the works of [
1] and [
2] was that only right hand dominant participants in their studies. The Meta Quest 2 provides ambidextrous controls, therefore, allowing for both left and right handed play which was supported in this study to ensure a higher participant turnout while being able to generalise the findings to a wider population in society.
The research was conducted in a single room that was able to accommodate several participants at once which facilitated the acquisition of a higher volume of results in the available time frame while enabling the facilitator to manage the environment appropriately.
4. Data Analysis
The data collected is illustrated using histogram, QQ plots and two-way ANOVA and analysed on a case-by-case basis.
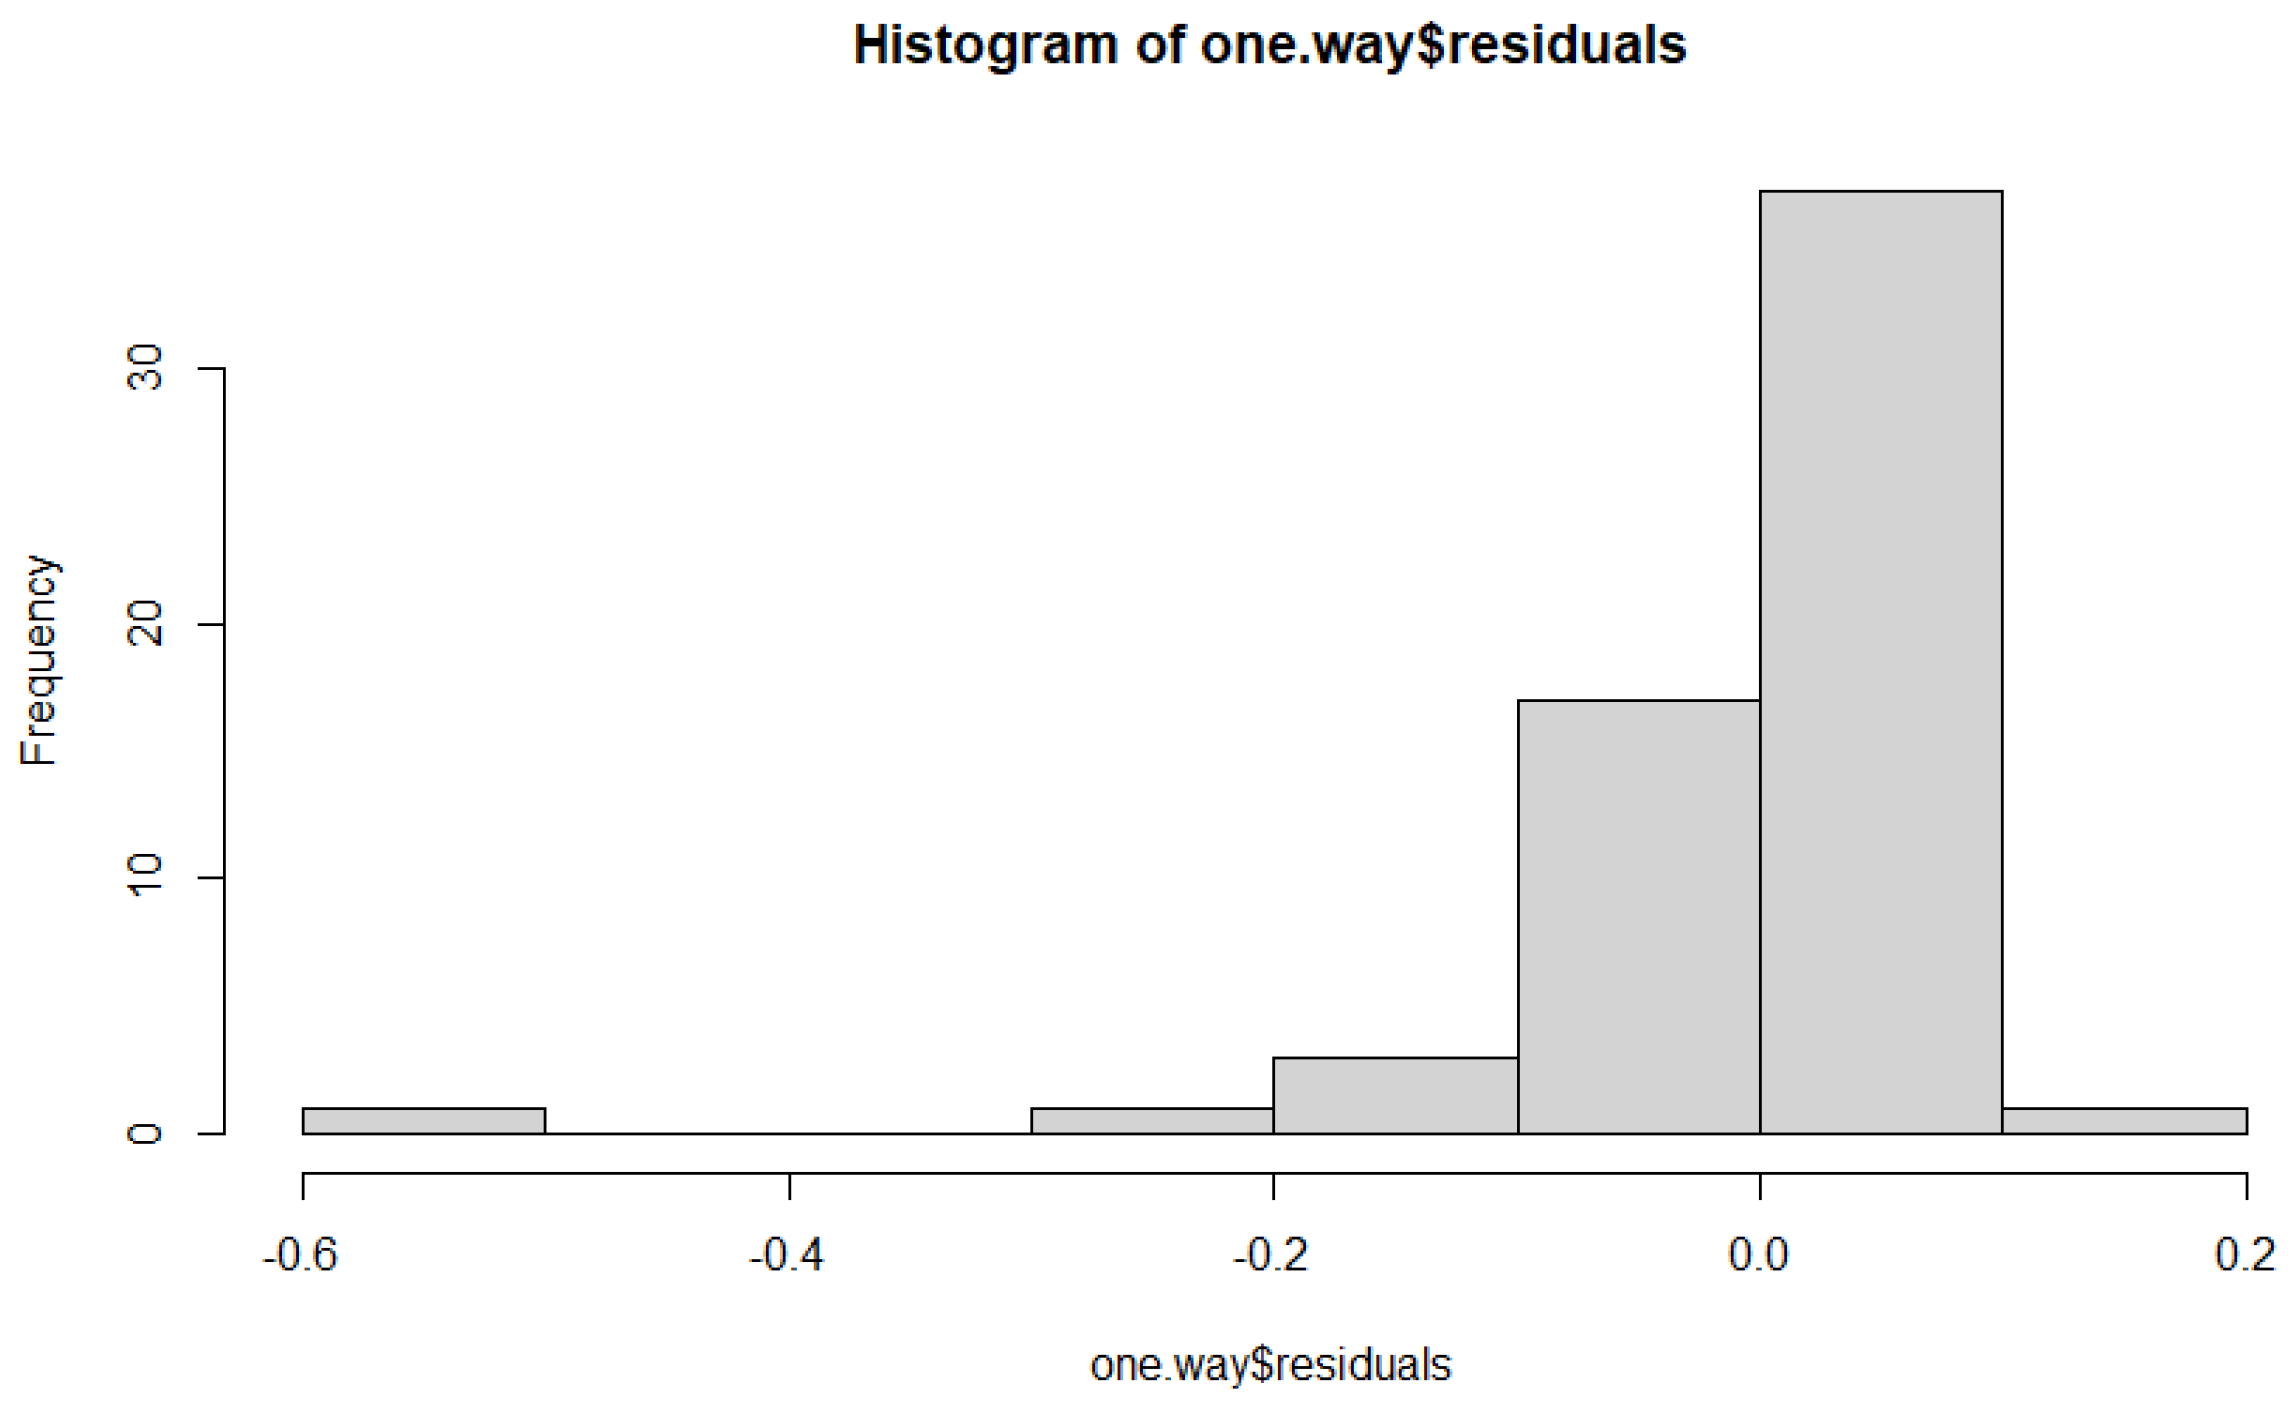
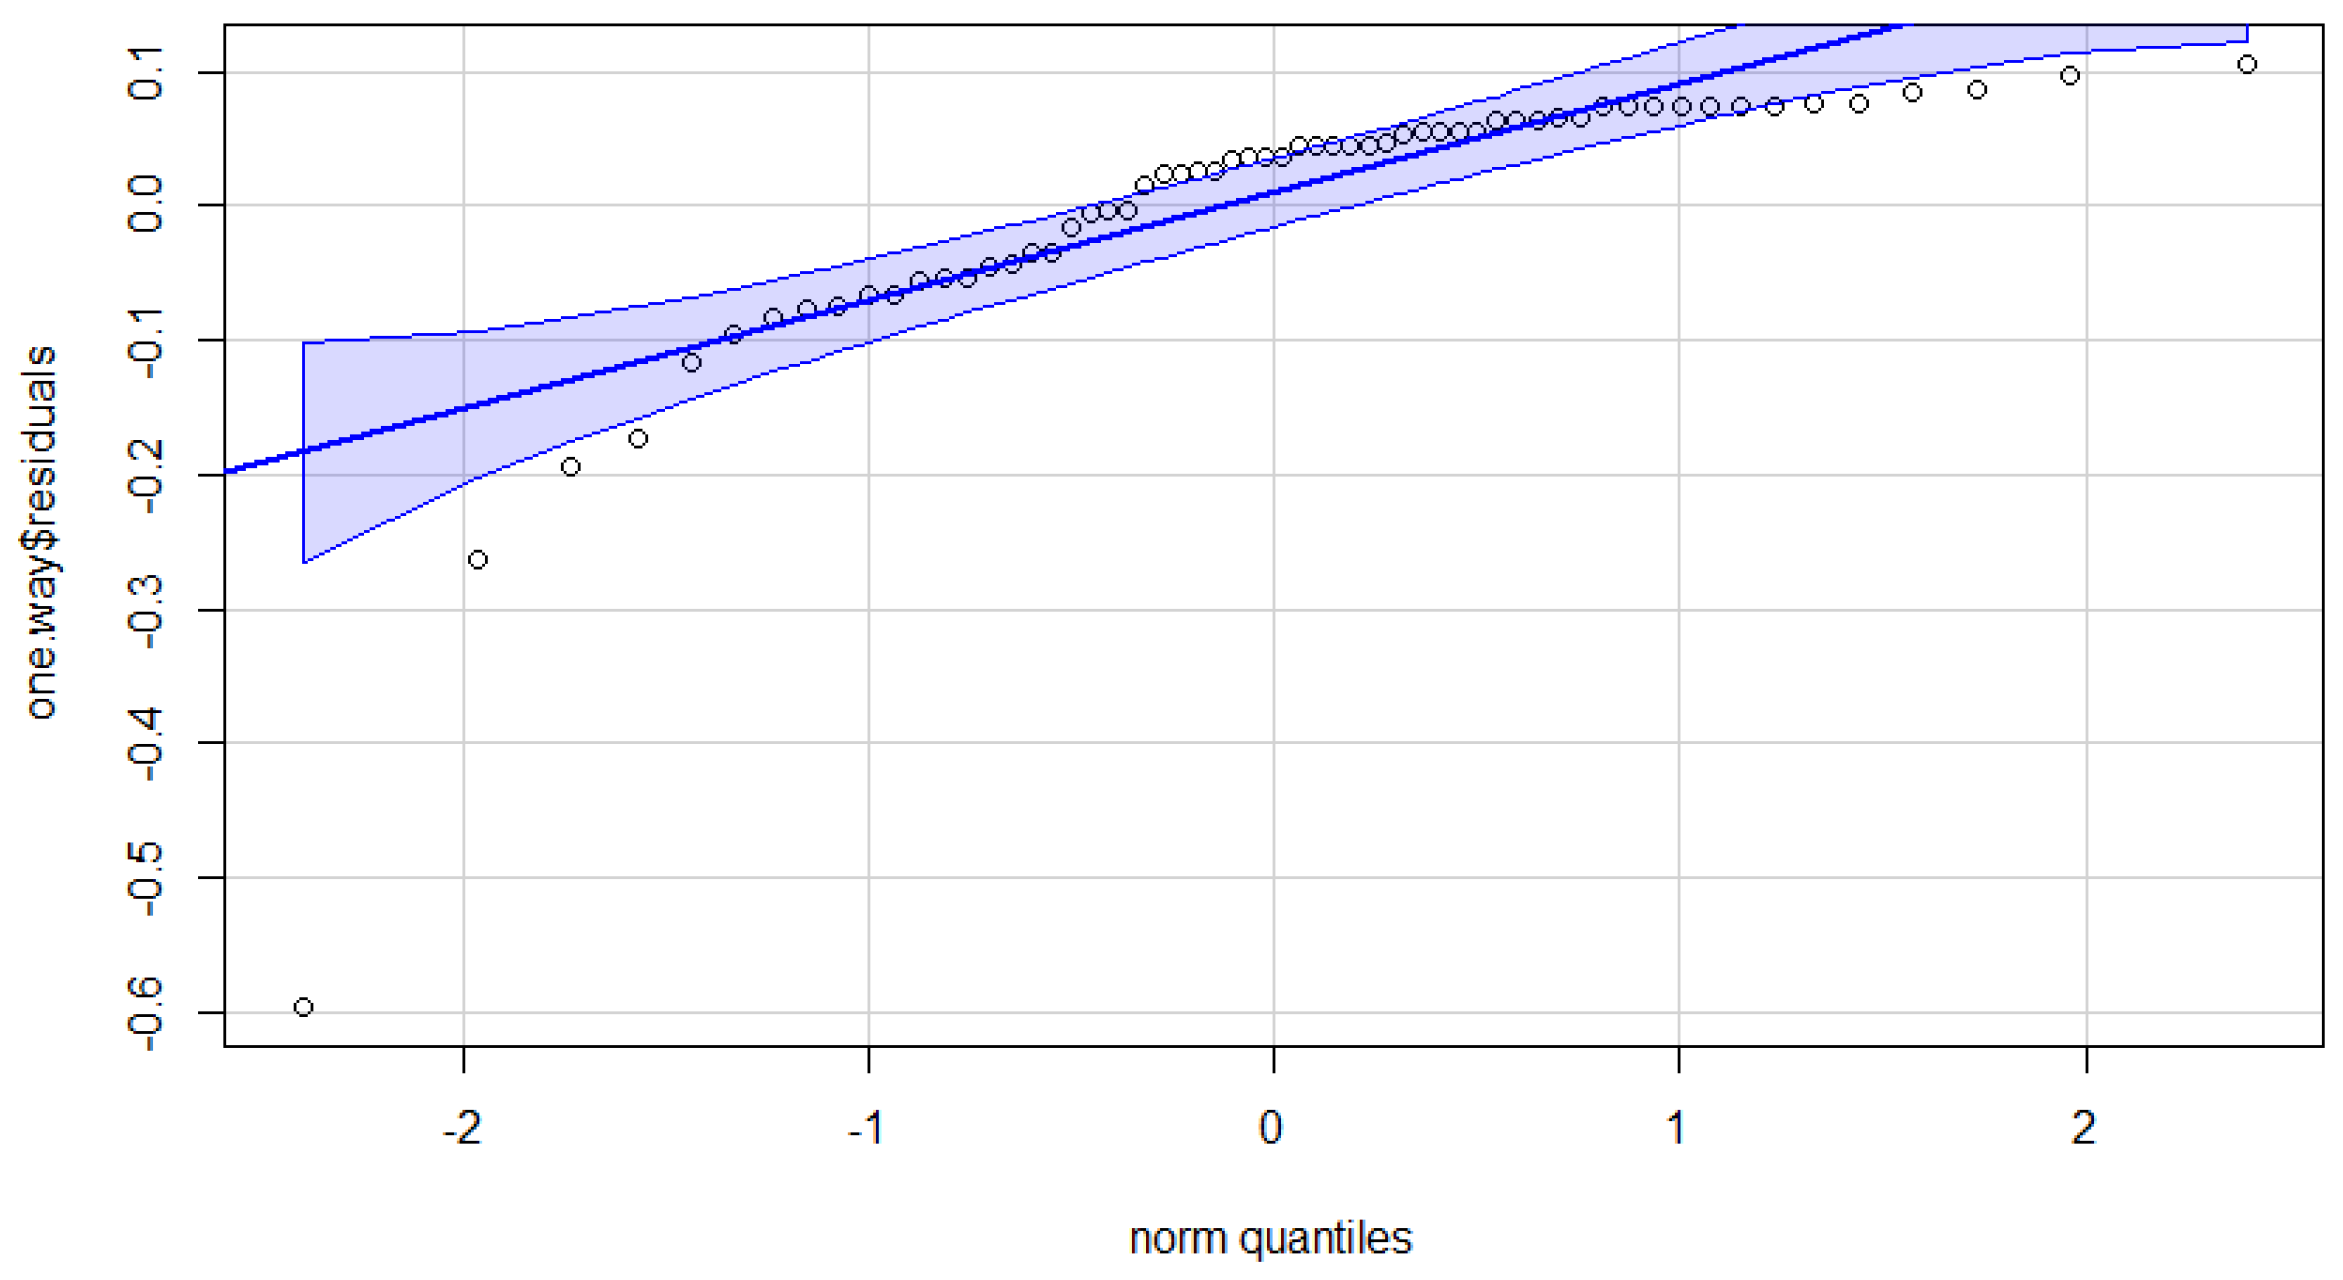
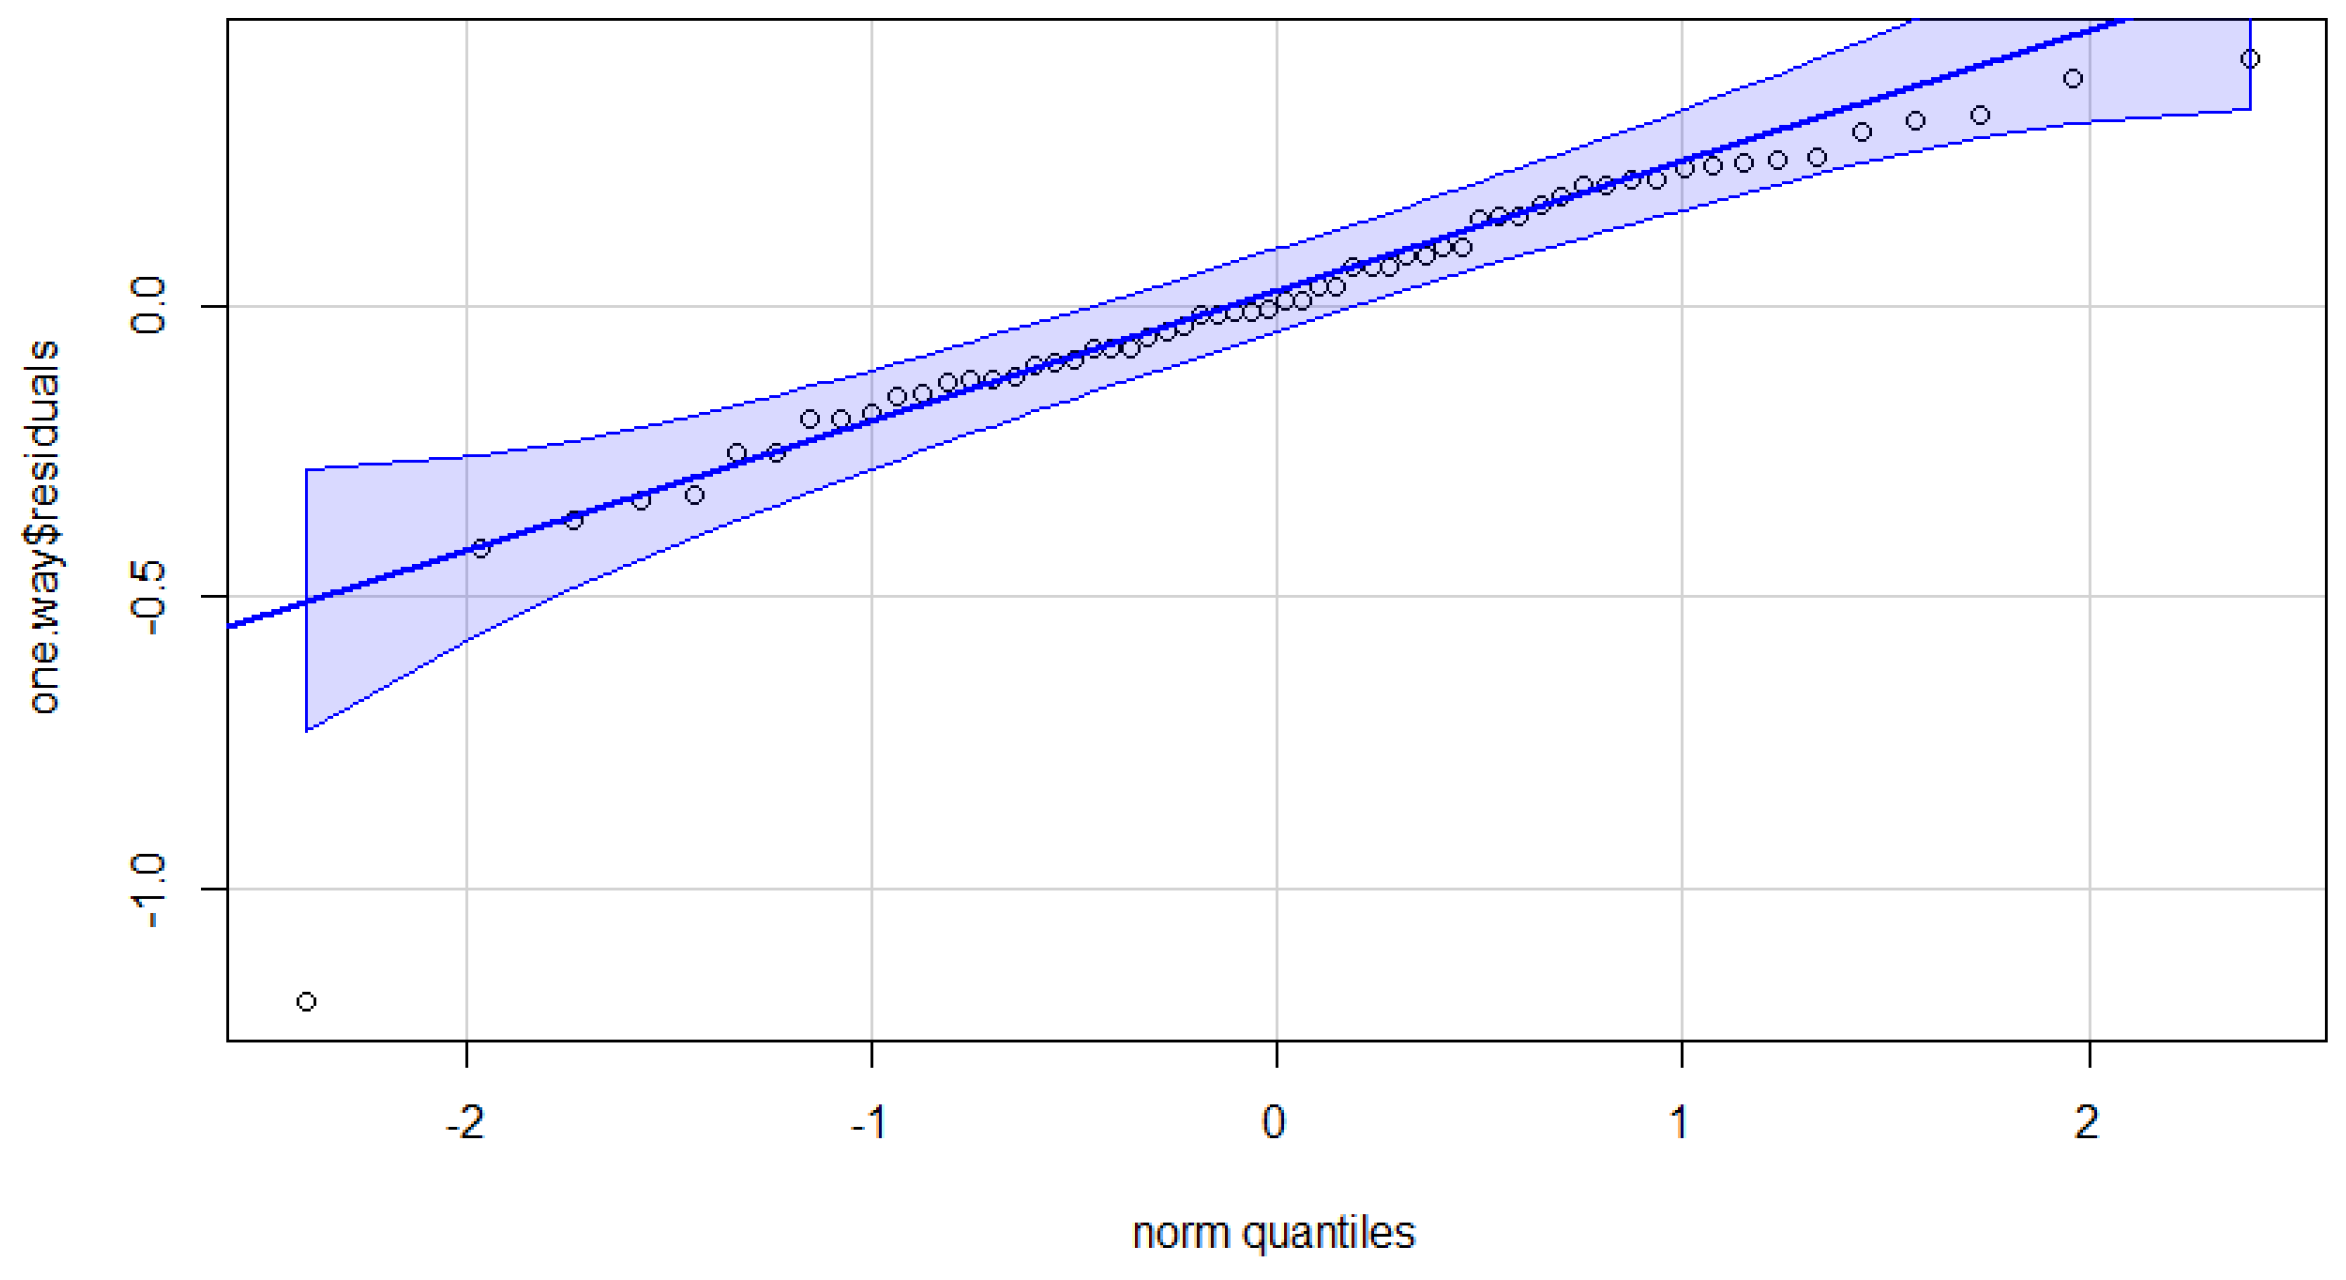
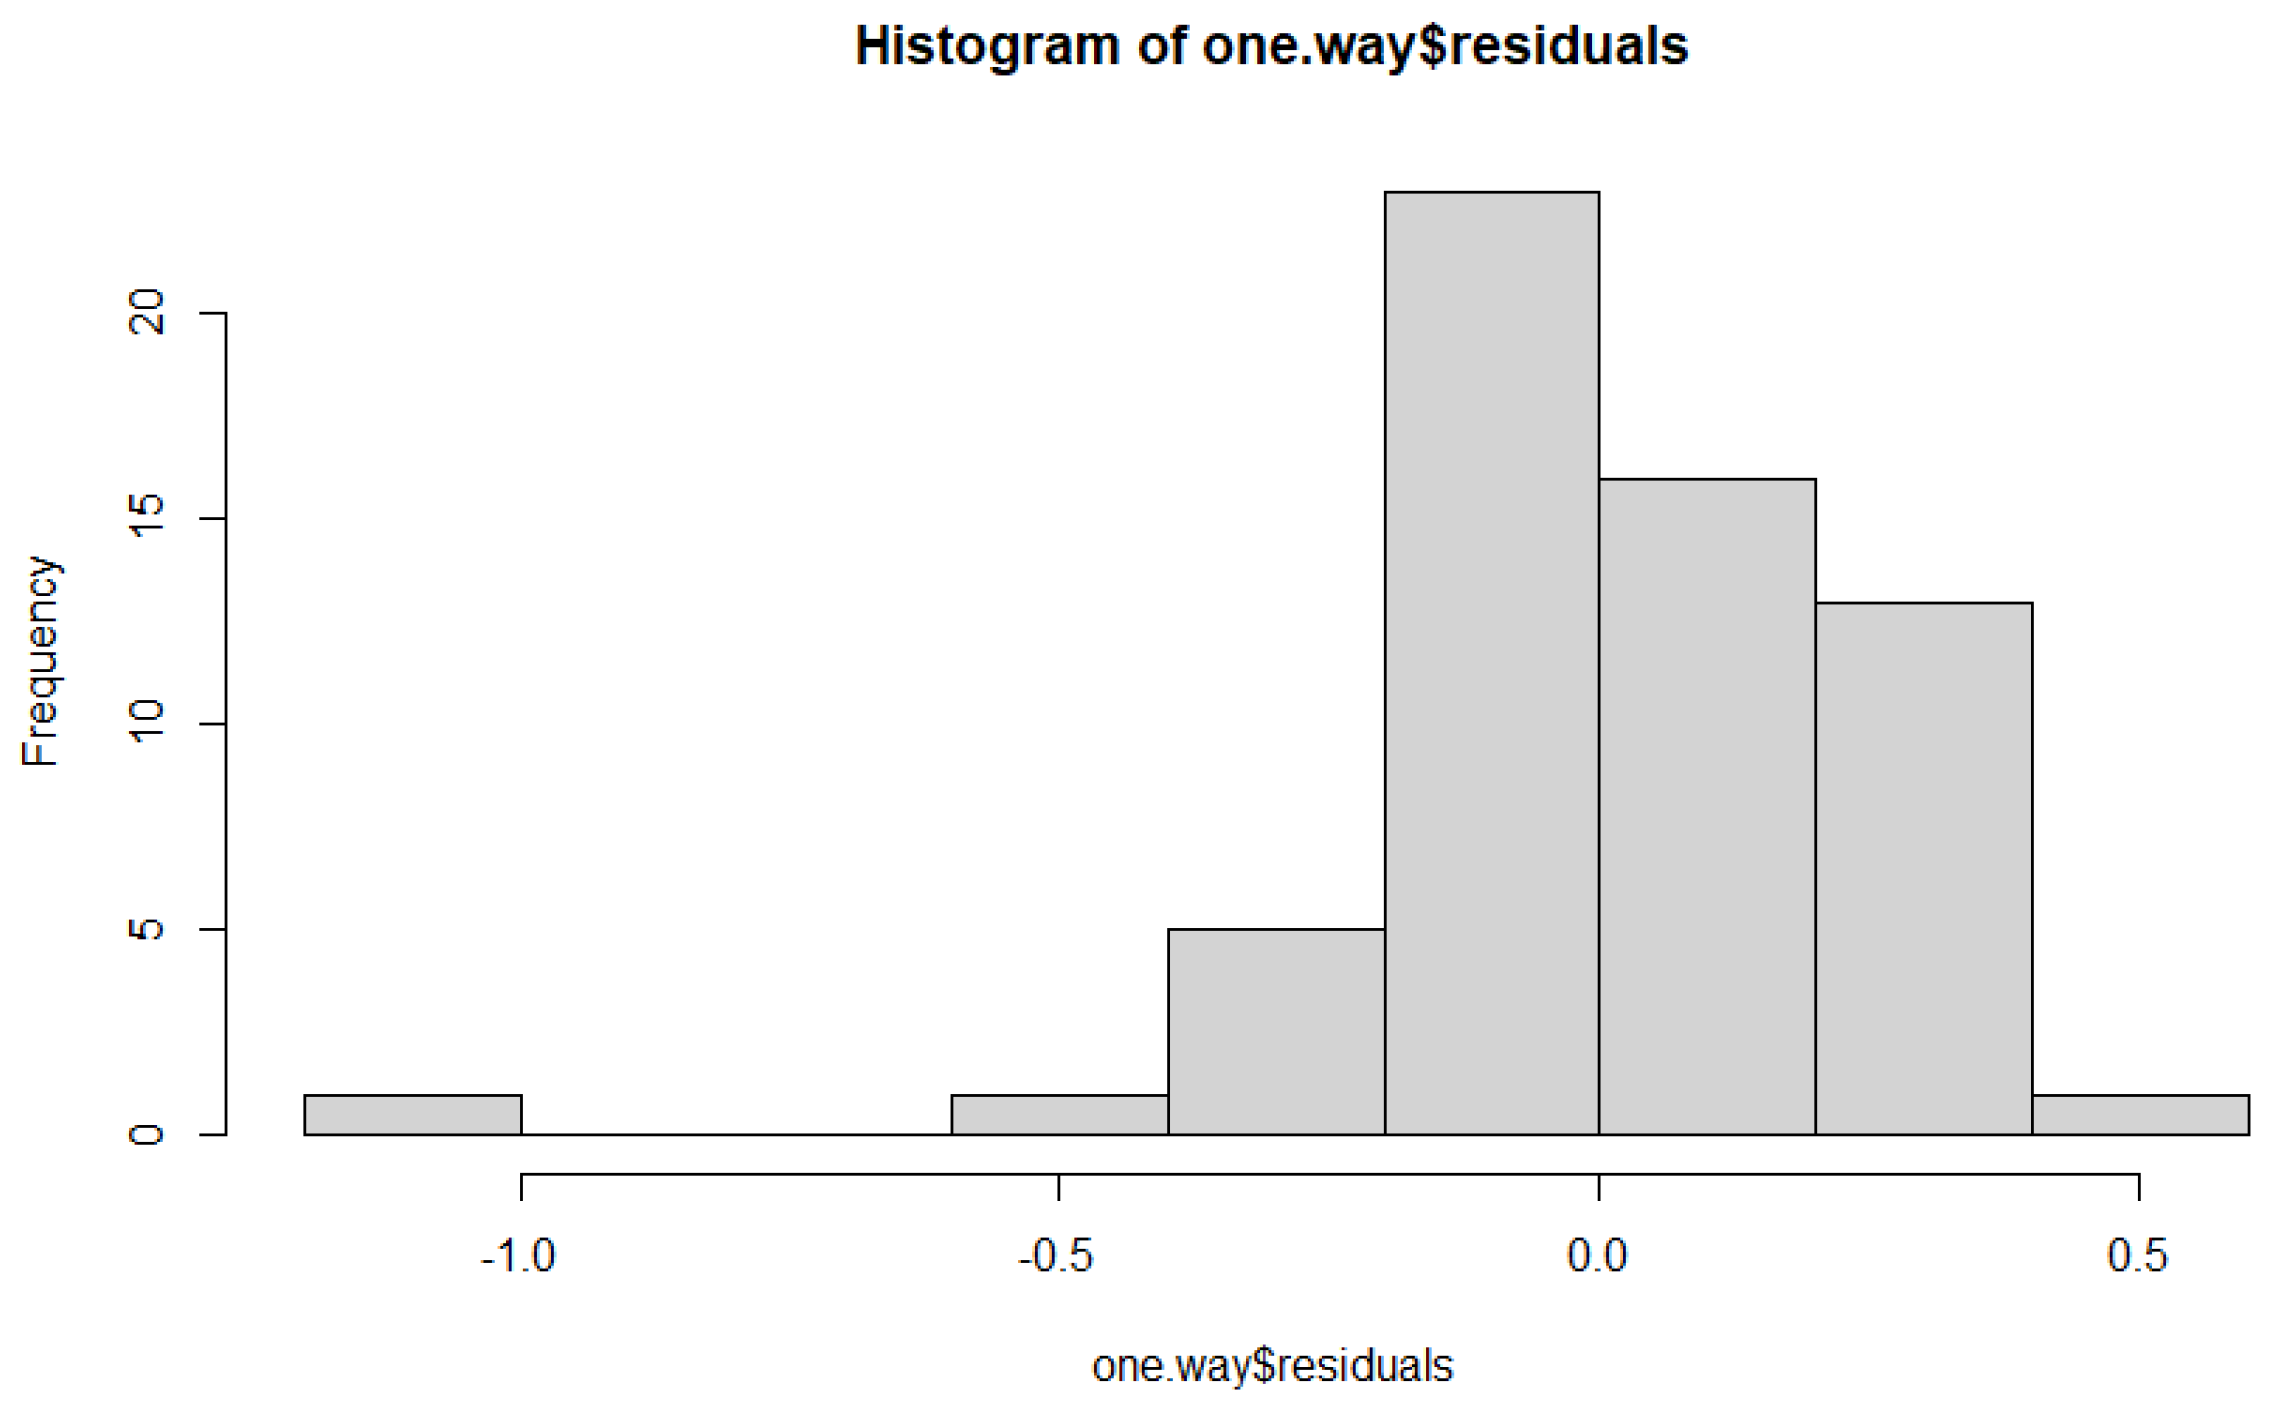
The difference in test scores for both devices and accuracy is 0.062. Furthermore, the 95% confidence interval illustrates a difference of between 0.119 and 0.005. The P-value is 0.031, therefore illustrating a statistically significant difference when correlating the device while measuring accuracy. From this, the null hypothesis is rejected as the input devices have no statistical significance in relation to accuracy. When looking at the histogram (
Figure 3), the normal distribution is skewed to the left. Referring to the QQ plot (
Figure 4), the data provides a fat-tailed distribution. This is evidenced through both ends of the plot deviating from the cantered line. From both illustrations, it is apparent that outliers are more likely to be below the mode.
There is a statistically significant difference between devices and RT. The p-value is 9.343e-14 supports rejection of the null hypothesis as there is a statistically significant impact on RT. Furthermore, the difference in test scores between the devices is 0.627. Using a 95% confidence level, the confidence difference between both devices is between 0.498 and 0.756. The histogram (
Figure 5 provided shows a distribution skewed to the right. In contrast, the QQ plot (
Figure 6 provided illustrates a thin-tailed distribution. This is evidenced through the plots not deviating from the cantered line. From these illustrations, it is apparent that any outliers from the mean will most likely have a longer reaction time.
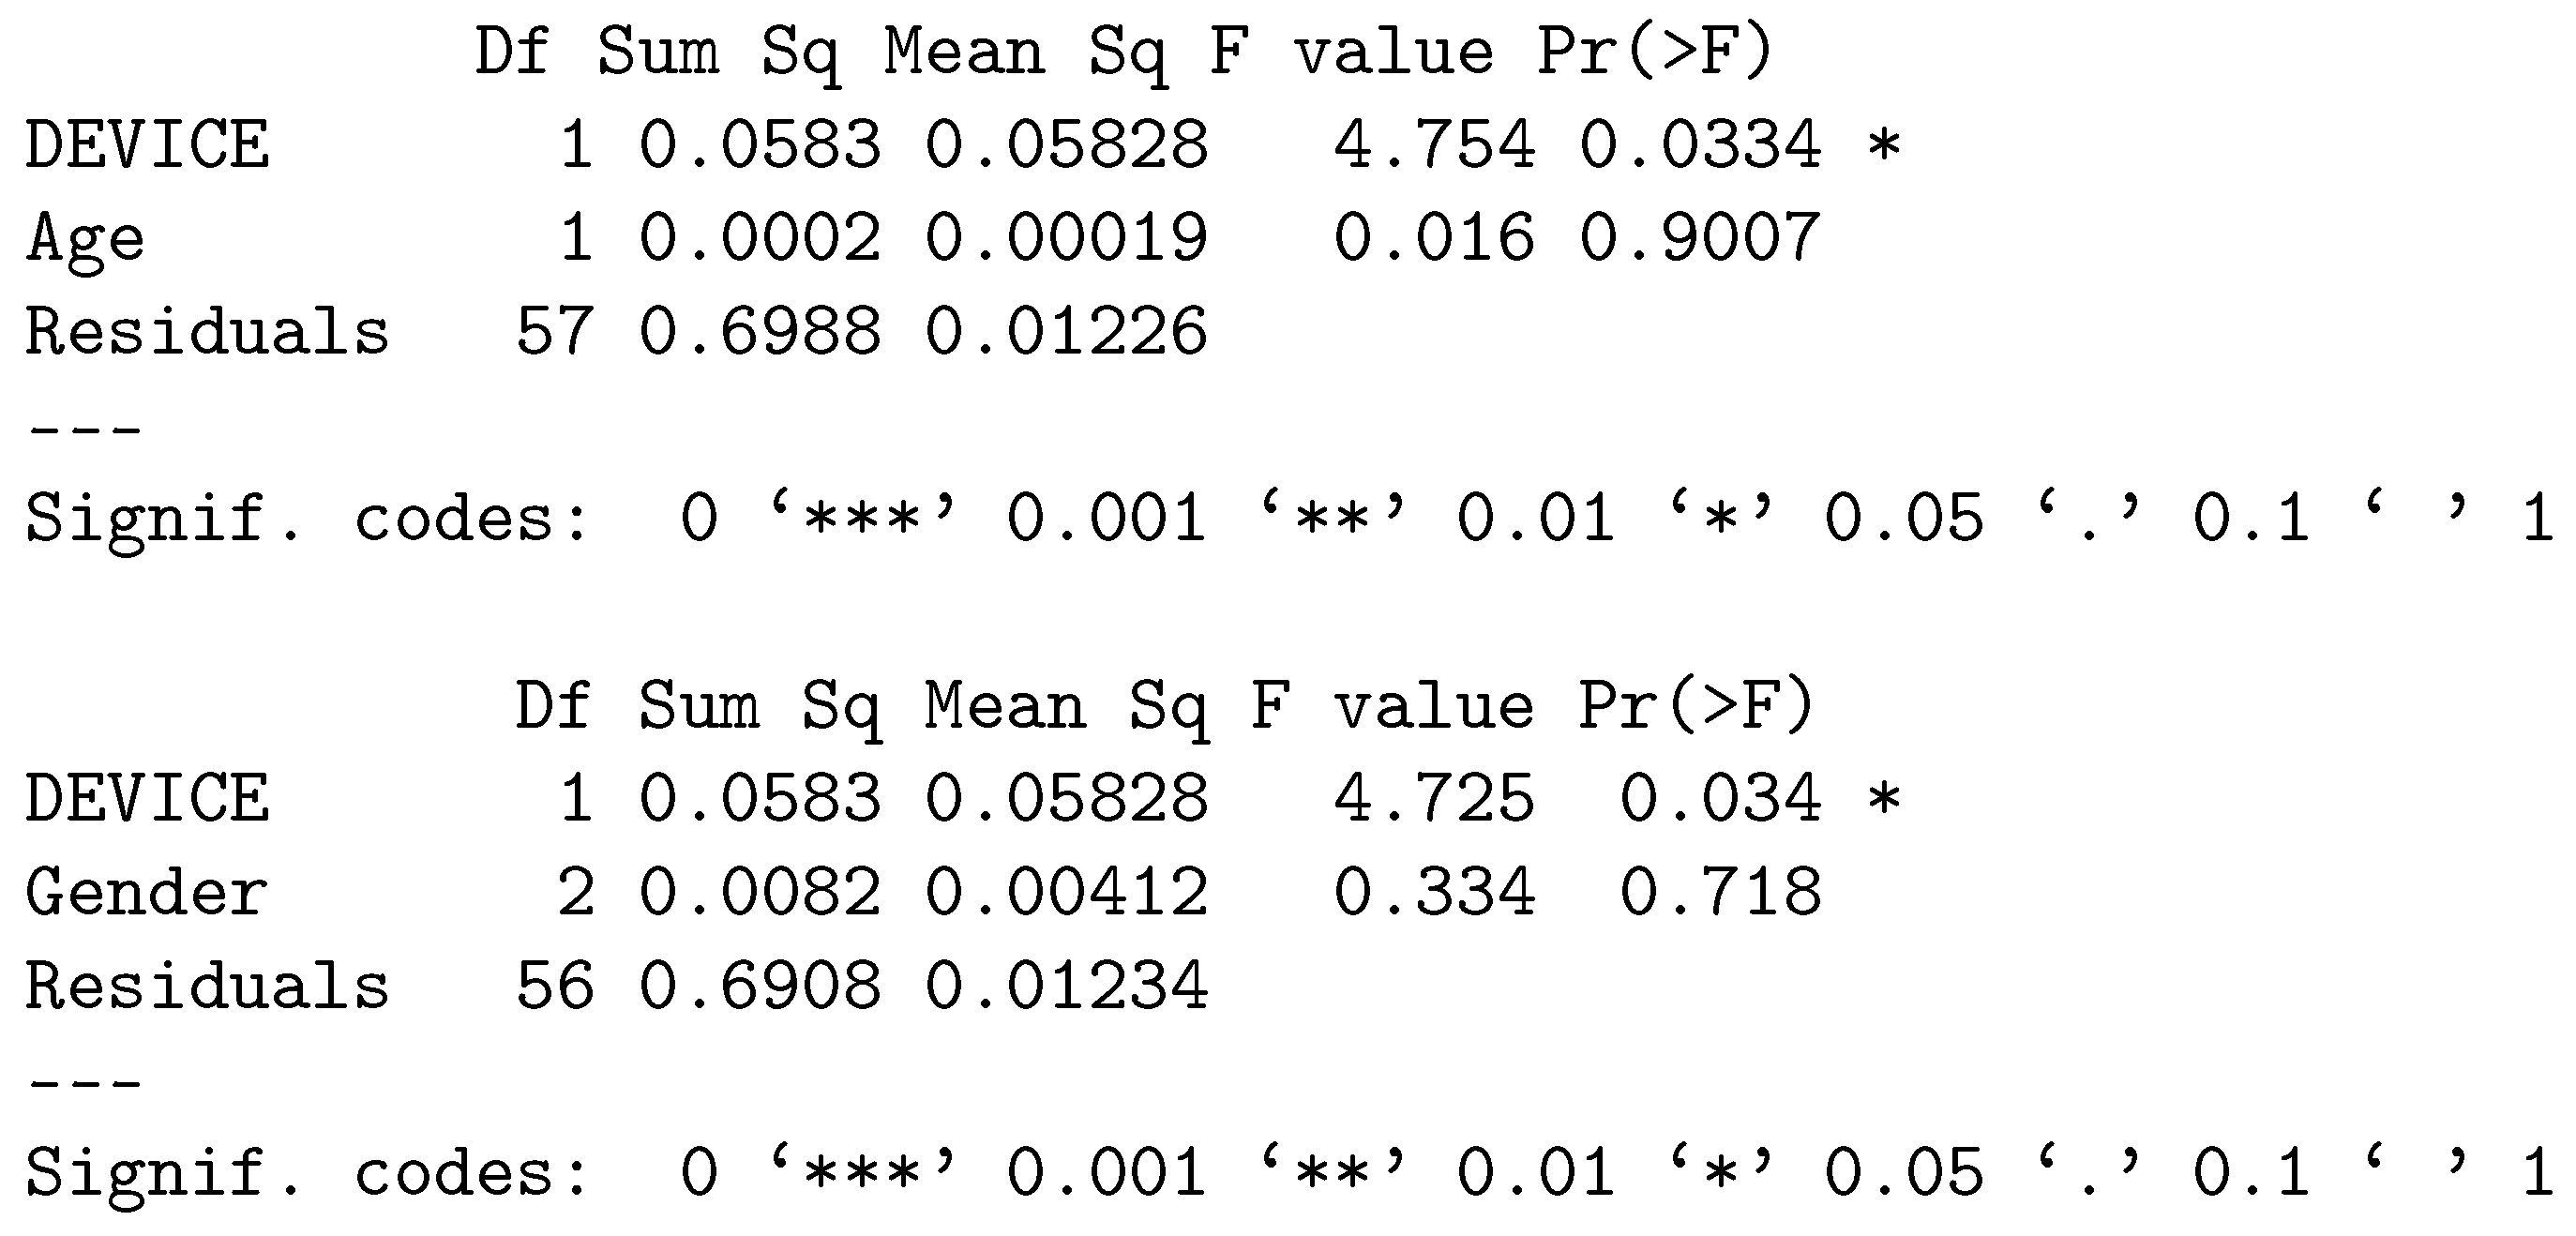
Age has a significant impact on accuracy (
Figure 7). The p-value is 0.9007 and therefore disproves the null hypothesis that age has no impact on accuracy (0.9007<1). Furthermore, gender exerts the same results when looking into accuracy. The P-value for gender is 0.718, which disproves the null hypothesis, when referring to the significance codes (0.718<1).
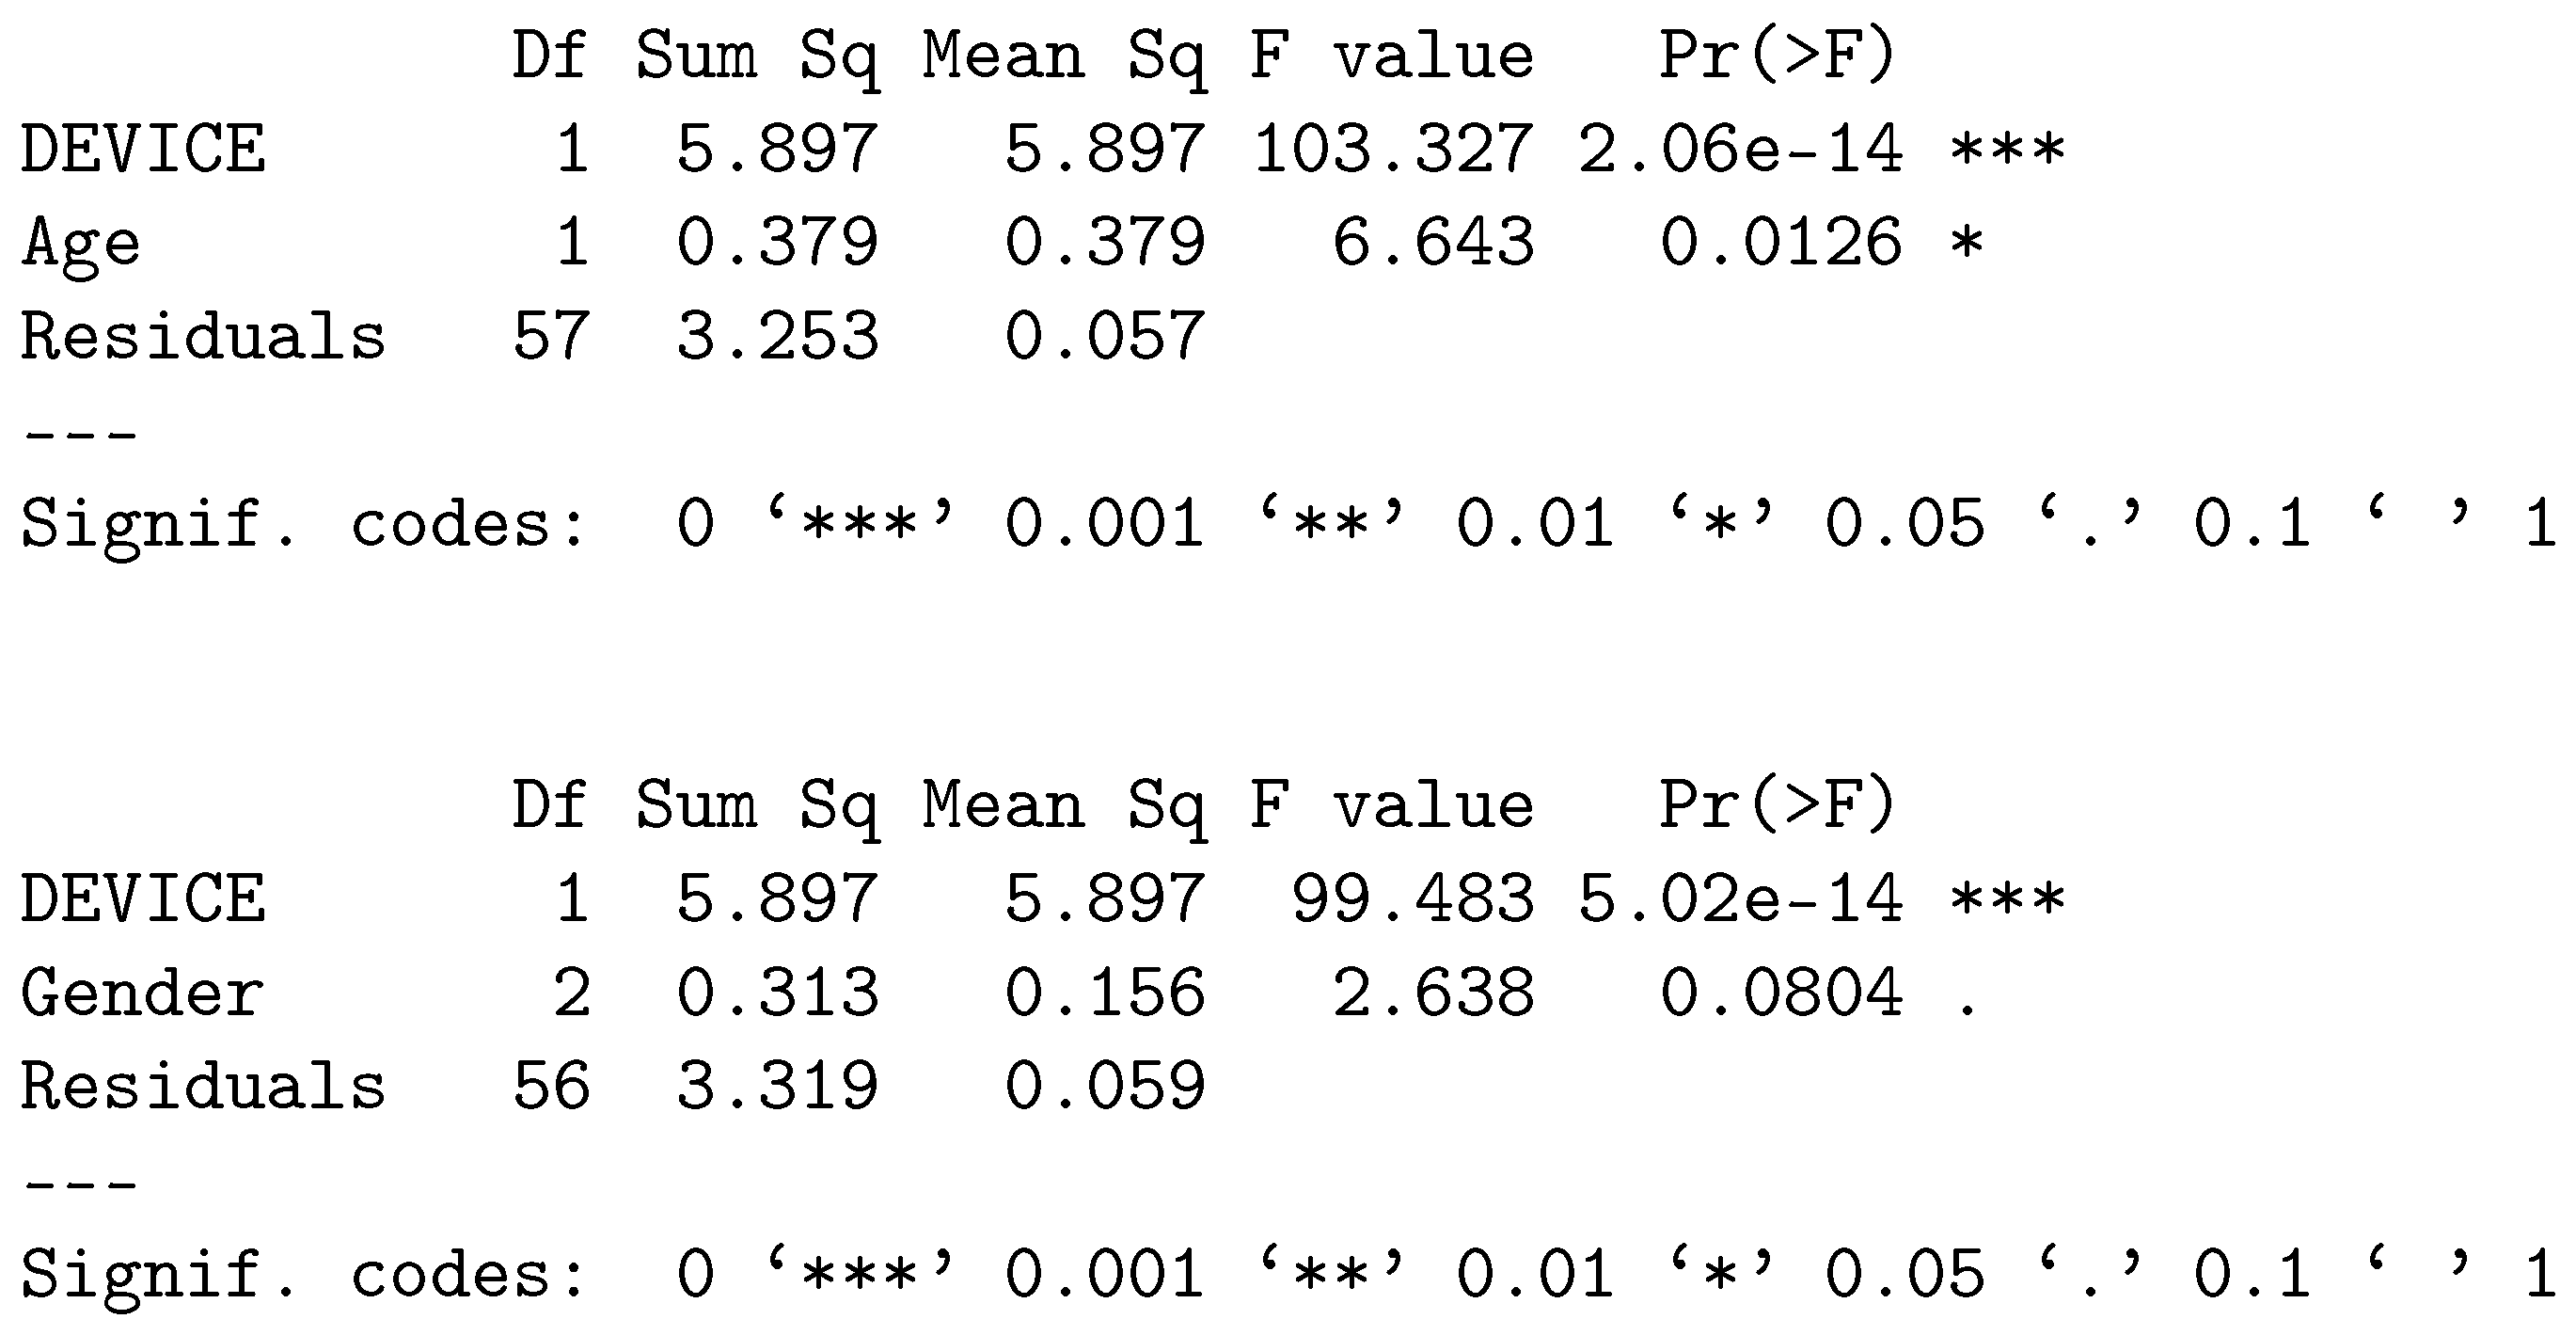
From
Figure 8, it is evident that both age and gender have no significant impact on RT. Looking into age, the P-value is 0.0126, which is slightly over the significance level (0.0126>0.01). This therefore proves the null hypothesis that age has no significant impact on RT. A vast majority of participants were aged between 18 and 27. This could skew the data given that there were only a handful of participants over this age bracket. The data includes participants of all ages instead of a specific age bracket, therefore it is expected to have a handful of anomalous data entries.
When referring to gender, the same applies. The P-value provided is 0.0804, which is larger than the significance level (0.0804>0.05). This therefore proves the null hypothesis that gender has no significant impact on RT.
Additionally, a vast majority of those that partook in the VR intervention had already used VR (70%). This is relevant as those that had used VR scored an average RT of 1.67 and an accuracy of 87%. Conversely, those first experiencing VR scored an average RT of 1.56 and an accuracy of 82%. This illustrates a correlation between previous experience and performance. With this in mind, the participant distribution of the two groups is significant.
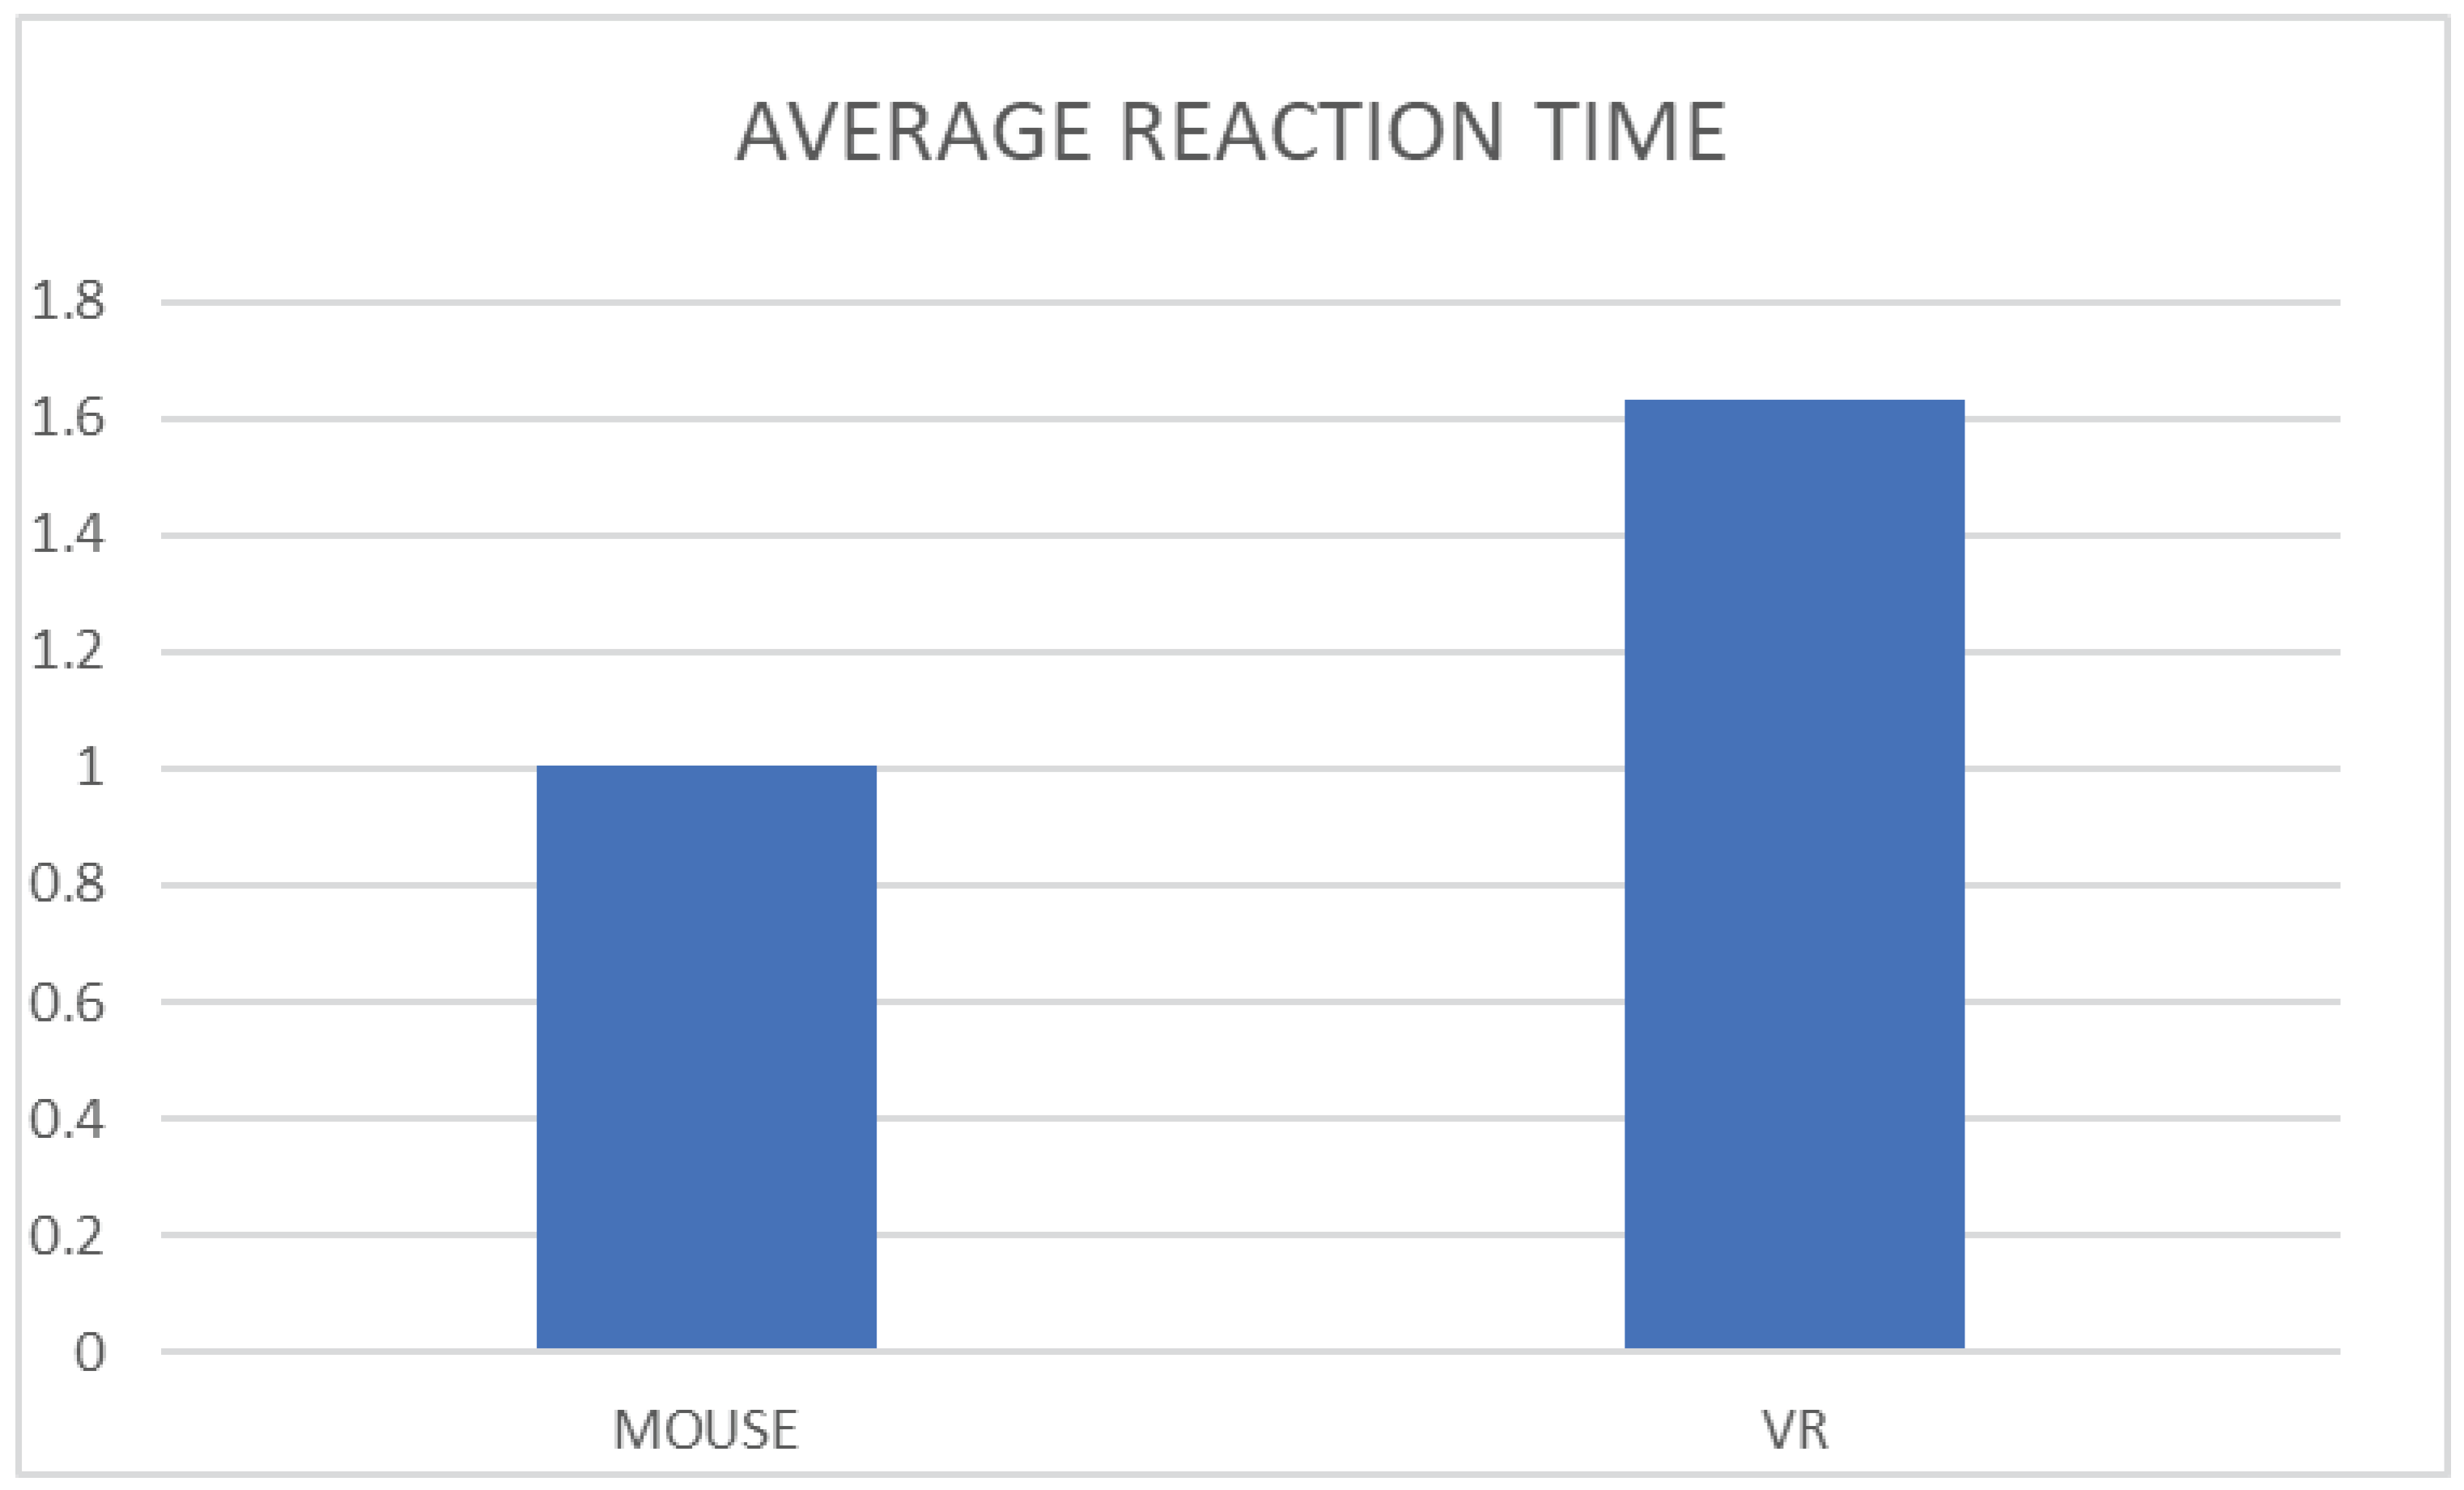
The average RT and accuracy for mouse and VR input devices (
Figure 9) evidences that on average, VR users presented a faster RT. The VR users on average hit 1.63 targets per second, as opposed to the mouse users, which on average hit 1.006 targets per second (1.63 1.006).
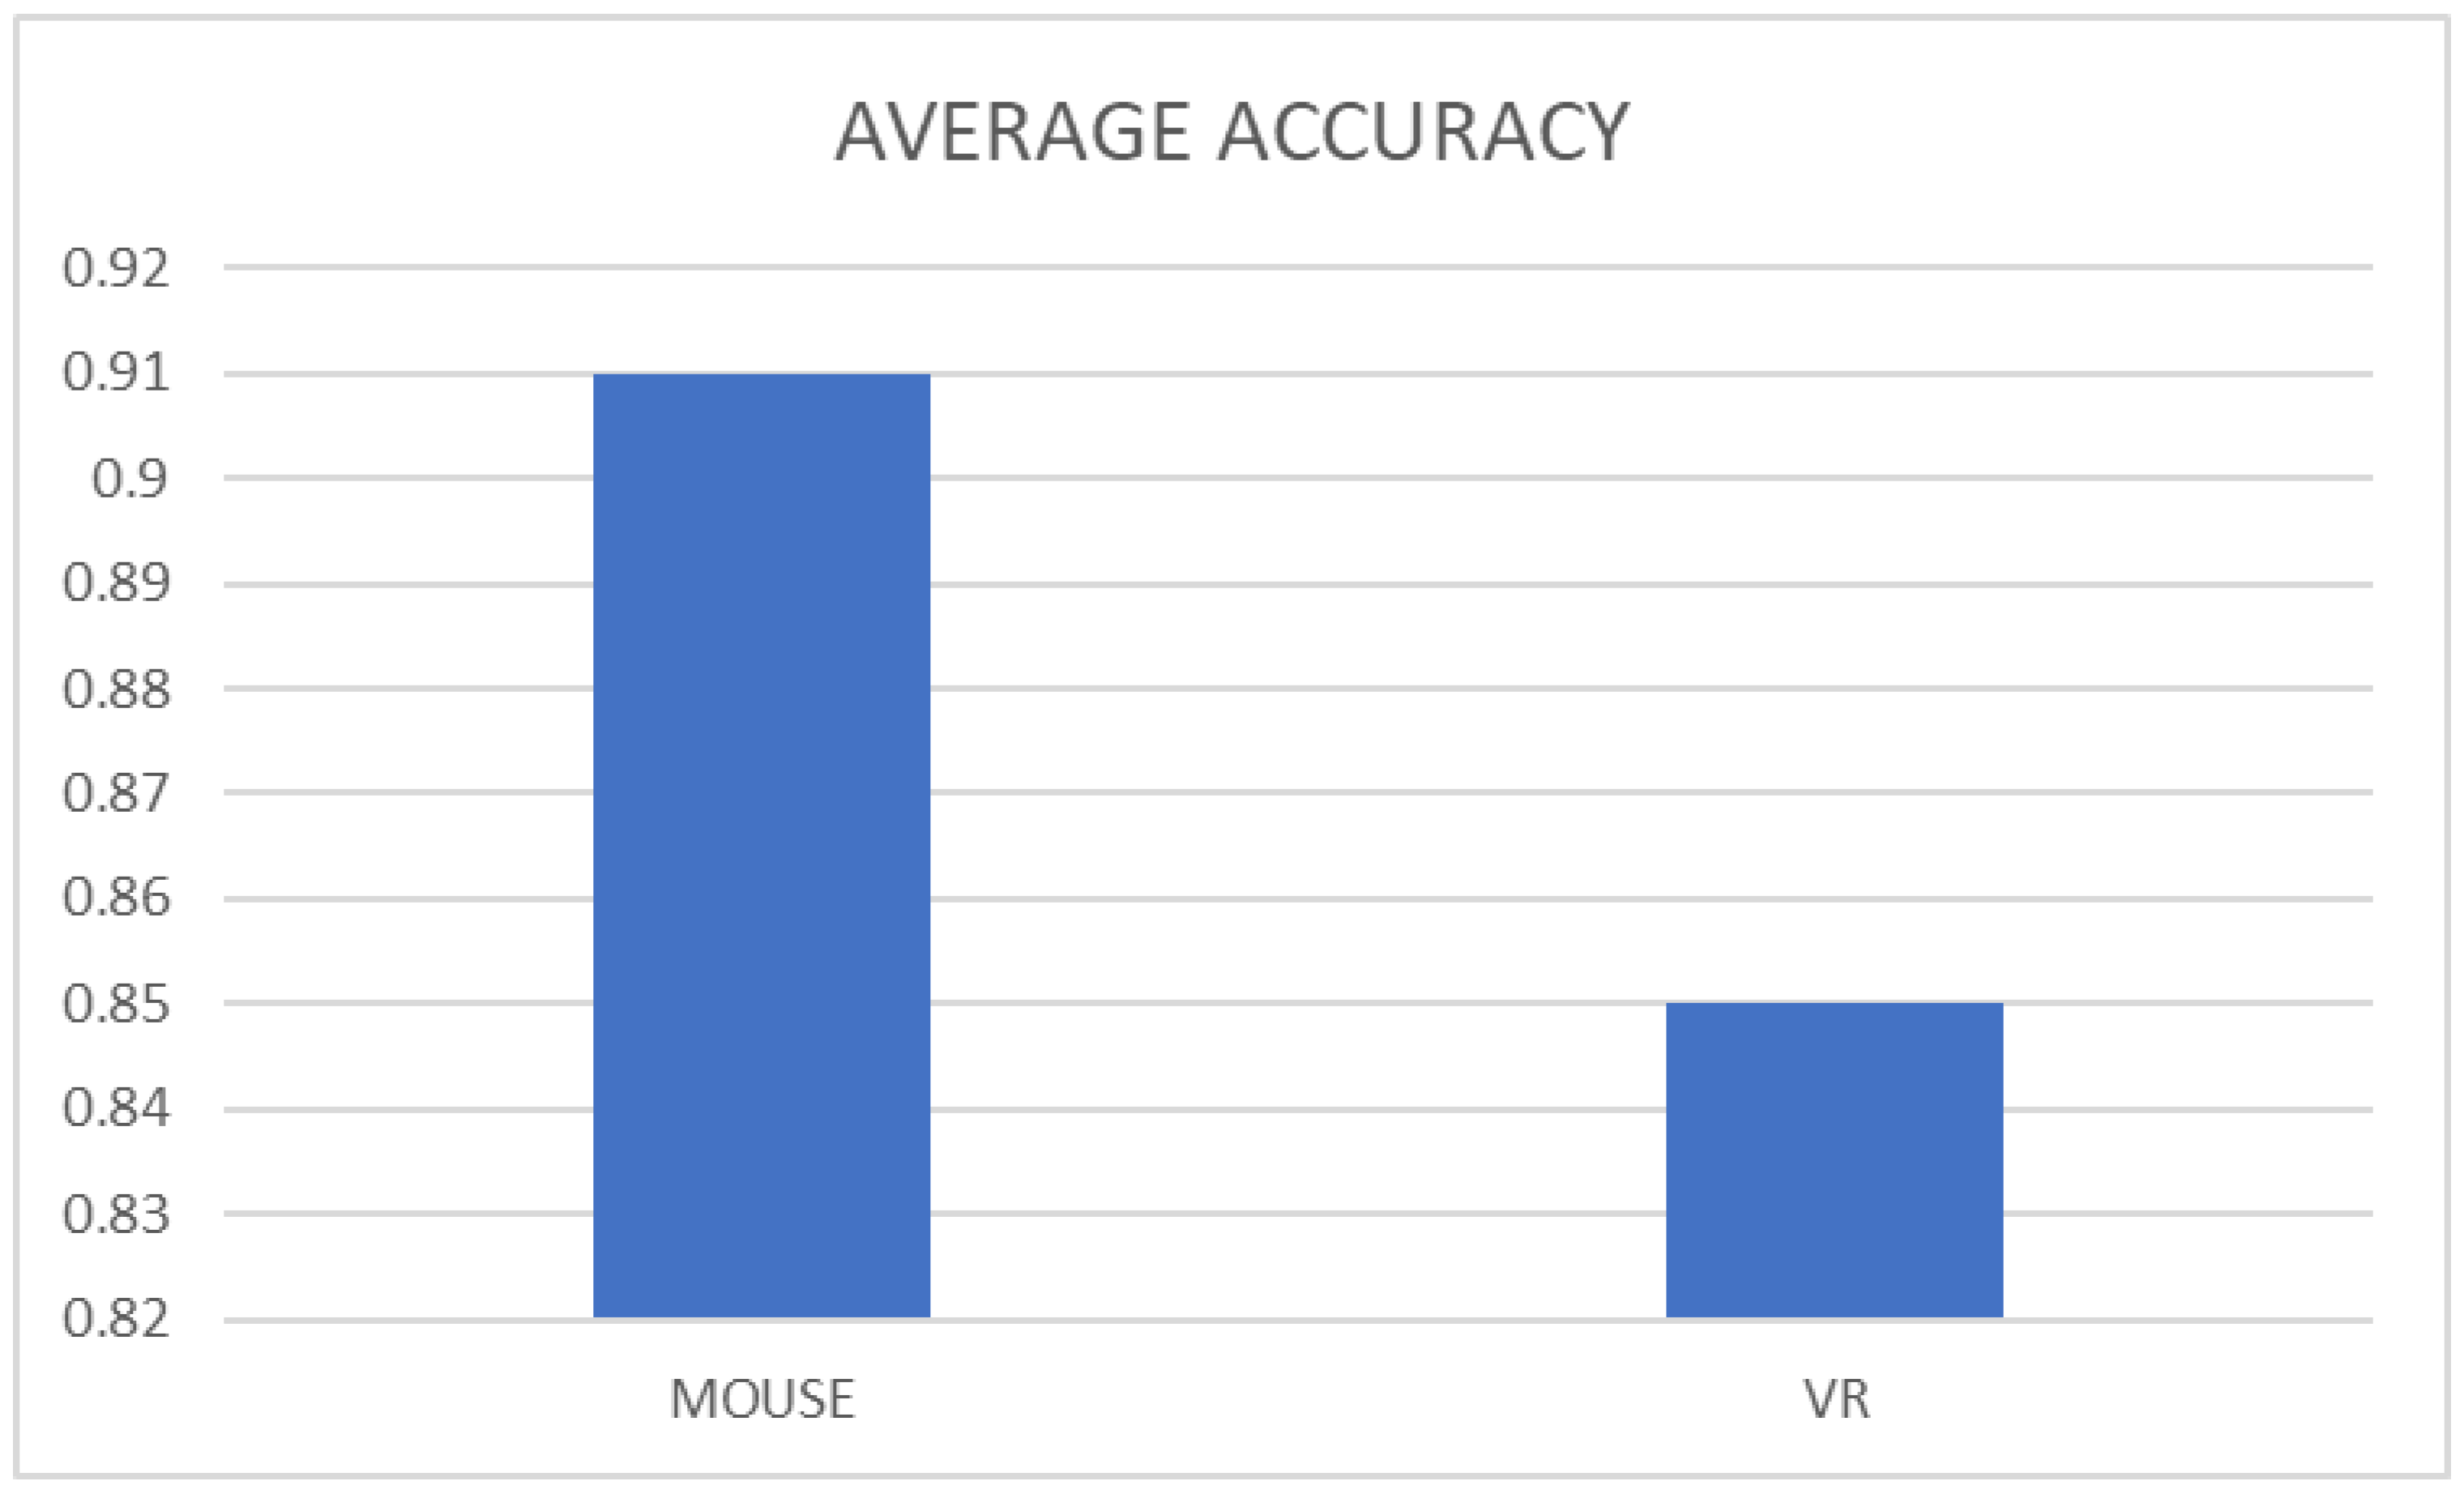
Conversely, as seen in
Figure 10, the average accuracy was higher for the mouse users, presenting an average of 91% while the average VR user which would hit their shots only 85% of the time (91>85). Given that the average VR user would hit more targets overall this suggests that RT comes at a trade-off of accuracy.
5. Discussion
The first major finding of the research is that input device has a significant impact on accuracy (
Figure 3 as evidenced by P-value 0.031<0.05. The data suggests that the mouse provided the higher recorded accuracy. Out of the range of existing factors that affect accuracy, this study examined: age and how often they partook in video games. 84% of all participants that used the mouse setup had interacted with video games at least monthly (
Figure 9). The same can be said for the VR population, as the exact same percentage (84%) of participants had interacted with video games. This mitigates video game familiarity as an influential factor that affects accuracy. This sounds like a coincidental statistic, however the data presented illustrates that this is indeed the case.
| Frequency |
VR |
Mouse |
| Daily: |
50% |
33% |
| Weekly: |
23% |
30% |
| Monthly: |
10% |
20% |
| Not at all: |
16% |
16% |
The data presents an apparent trade-off effect where, despite the accuracy being higher for the mouse setup, there was a lower RT when compared with VR. Building off the work of [
11], “motivation“ appeared to play a factor when assessing RT during the experiment. Anecdotally participants exerted higher interest in the VR headsets than the mouse setup. One explanation for this is that the unorthodox setup of the Quest 2 was more compelling than the orthodox mouse setup. Referring to how this affects RT; if a participant was less motivated to partake in the mouse experiment, their RT may have been slower, suggesting a future research avenue.
Furthering on this, [
10] discuss how distractions also affect RT. As both research activities took place in the same room at the same time, the VR users may have distracted mouse users, which would have directly affected their RT. Moving forward, further research should isolate participants, to mitigate any distraction. Through removing external sound, interaction and points of interest, a user will have less distractions to disrupt the task at hand. From this, future data collection will be more accurate.
Linking back to
Figure 3, the significance of the input device could be derived from the sense of immersion presented by the VR headset. Given that the physical headset could not be used for both the motion controllers and mouse, this is another variable that could create a disturbance in results, as one group of participants weren’t in a state of “flow“ [
4]. The Meta Quest 2 incorporates an HMD, which the mouse setup did not. Furthermore, the ID utilised for both setups incorporated different forms of interaction. Linking this to the Three pillars of VR [
4], the VR headsets and input device provides optimal “telepresence, interactivity and immersion“. From this, the VR setup would have allowed participants to have better “concentration on the task at hand“ [
5].
The virtual environment may have played a part in how participants interacted with the task at hand. As discussed by [
2], “participants work at high cognitive levels to adapt to the virtual environment“, and therefore this could affect accuracy. Referring to the results acquired, given that participants who partook in VR had a lower accuracy, there is a chance that they were still trying to adjust to the change in environment. With this in mind, the fully random sample should mitigate this as a concern within the acquired data. This is still an area that should be explored in further studies.
Given that 9 out of the 30 participants had never interacted with any form of VR headset prior to the screening, this is a viable consideration. This is due to the experiment incorporating a completely random sample. To mitigate this issue, both groups should incorporate the VR headset, but differing input devices. This would mean that both groups would be adapting to the change in environment, therefore eliminating this as a factor. Conversely, both groups could also not wear the headsets, however this would take away from the intended immersive experience.
Discussing the results found in
Figure 4, it is illustrated that the input device has a statistically significant impact on RT. This is illustrated in the P-value provided (0.05 > 9.343e-). Considering that VR users provided a higher RT, there are several factors that could have affected this. The three pillars of VR [
4] states that immersion plays a key role in the overall satisfaction of the VR experience. That state of immersion could have helped users reduce their ‘distraction’ and therefore bolster their overall RT. Given that the users who participated using VR had a headset, this would have further immersed them in the task. This is opposed to the orthodox desktop setup, which allowed for further external disturbances.
This immersion is also evidenced in how auditory stimuli is presented. Those that used the Quest 2 headsets were supplied with built-in headphones, to receive audio. This is opposed to the built-in speakers that accompanied the PC setups. From this, those that used the mouse setup would receive more unwanted environmental sound, which could distract them from the task at hand. To mitigate this in further studies, the isolation of participants is paramount, to remove external audio. As mentioned previously, incorporating the Quest 2 headset for the mouse users would mitigate audio as an issue, because all users would be receiving audio the same way.
Like the mouse setup, there was a trade-off effect for VR users. This is evident in the fact that participants who used VR setup had a lower accuracy rate (91>85). This trade-off implies that if one participant excels in one metric, they will most likely be an outlier in the other metric. This claim is evidenced in the opposite effect happening for the mouse setup, which scored a lower RT on average (1.63>1.006).
As presented in the raw data, it is evident that there was a progression improvement in RT and accuracy, the more attempts’ participants took. This correlates with the work of [
15] who identified that by incorporating auditory stimuli, there was a gradual increase in neuroplasticity. This is because the participants’ “ability to make adaptive changes“ [
15] increased. Given that the results for both RT and accuracy were averaged out between all three games, this presented another way to interpret the results, as a vast majority of participants received higher results when iterating the activity. The average increase from game one to game three for accuracy was 2% and the average increase for RT was an increase of 0.14 shots per second.
6. Conclusion
In conclusion, this study aimed to investigate the effect that VR aim training has on task performance. This was a controlled study using two groups; Group A utilised a mouse setup with Aim.pro, and Group B used the Meta Quest 2 HMD with motion controllers and AimVR in order to measure how they performed. The metrics to assess whether they improved were RT and accuracy.
H1 has been proven correct, as input device does have a direct impact on task performance. This is illustrated through the statistics provided within the data analysis. Input device was seen to be statistically significant when measuring accuracy, as seen in the p-value provided (0.031). The input device is also seen to have a statistically significant impact on RT. This is evidenced through the P-value provided (9.343e-). RT seems to be abnormally significant, however the results provided indicate this. All of this contributes to overall performance, which means that H1 has been proven true.
Additionally, H2 has been proven true to an extent. This is because participants that used VR exerted excellent RT, however their accuracy was below average. This is evident through the average RT for a VR participant being 1.63 targets per second, compared to the mouse setup, being 1.006 per second on average. Conversely, the average accuracy was below average for VR users. This is seen in the average of 85%, against the average 91% for mouse users. This, therefore, illustrates a form of performance trade-off.
6.1. Limitations of the Research
There are limitations to the data collated, which are necessary to discuss. The selected demographic for the data collection consisted of a convenience sample, and as such, there was no age requirement for the study. As a result, the statistics could have been stronger, as “RT is negatively associated with age“ [
11]. Further research should consider this, to maintain a fair and controlled study. One way of doing this is through adopting a stratified approach to sampling. This can be achieved through having several groups of different age brackets. This would therefore mitigate age as an influencing factor.
As stated in the discussion, the location of the study held limitations for the results acquired. Given that all participants were all in the same room, distractions were a poignant issue. It was observed that the accuracy of select participants could have been better. One way to mitigate this issue in further research would be to have an appointment system, only allowing one participant in at a time. This could be done in two rooms, one for mouse users and another for VR users but will have an impact on the time frames required to complete data collection.
Considering distractions, the difference in display is a limitation of the study. This is due to two factors. One being that the Meta Quest 2 has select compatibility with input devices. This, therefore, rules the mouse setup and Quest 2 headset out. As stated in the method, there is an apparent lack of task performance software that supports both motion controller and mouse. As a result, two different software applications were needed to be incorporated. Future research should incorporate HMDs for all participants and use only one software. Despite this being mitigated within the method, there is still room for improvement. This would, therefore, reduce two variables that could disrupt task performance.
6.2. Future Research Recommendations
Further research should investigate whether there is a difference in results between those that have and haven’t used VR previously. This can be undertaken through completing a VR task performance intervention with two groups of participants split into those that have and haven’t had any experience using VR. A vast majority of the research population had used VR, therefore further validation is required.
Additionally, further research could focus on whether external distractions and noise effects task performance in both VR and mouse setups. This can be completed through having two sets of two groups: those completing a similar experiment with external and unwanted audio, and another group with no external noise. This can determine whether external noise has an influence on task performance.
Finally, further research could focus on whether previous VR experience has a significant effect on outcomes. Despite the findings provided illustrate previous experience had an effect on performance, further iterations should incorporate an equal number of participants, and not a 30%/70% divide. In addition, a broader range of metrics would provide deeper understandings on how VR Aim Training could impact on task performance.
Summary
Having completed thorough research on the impact that VR aim training applications has on task performance, it is apparent that there is a significant effect. This is seen in participant improvement of RT in VR. However, accuracy was not (on average) better than other input devices. This study has opened up opportunity for further exploratory and confirmatory work in a highly under-researched area.
Author Contributions
Conceptualization, Jack.Hawes. and Gareth.Ward.; methodology, Jack.Hawes.; software, Jack.Hawes.; validation, Jack.Hawes.; formal analysis, Jack.Hawes.; investigation, Jack.Hawes.; resources, Jack.Hawes.; data curation, Jack.Hawes.; writing—original draft preparation, Jack.Hawes.; writing—review and editing, Gareth.Ward.; visualization, Jack.Hawes. and Gareth.Ward.; supervision, Gareth.Ward.; project administration, Jack.Hawes. All authors have read and agreed to the published version of the manuscript.
Funding
This research received no external funding.
Institutional Review Board Statement
The study was conducted in accordance with the Declaration of Helsinki, and approved by the Institutional Review Board (or Ethics Committee) of CANTERBURY CHRIST CHURCH UNIVERSITY (26 February 2023).
Informed Consent Statement
Informed consent was obtained from all subjects involved in the study.
Conflicts of Interest
The authors declare no conflicts of interest.
Abbreviations
The following abbreviations are used in this manuscript:
| ACC |
Accuracy |
| ANOVA |
Analysis of Variance |
| DOAJ |
Directory of open access journals |
| HMD |
Head Mounted Display |
| MDPI |
Multidisciplinary Digital Publishing Institute |
| PC |
Personal Computer |
| QQ |
Quantile-Quantile |
| RT |
Reaction Time |
| VR |
Virtual Reality |
References
- Mayer, S.; Reinhardt, J.; Schweigert, R.; Jelke, B.; Schwind, V.; Wolf, K.; Henze, N. Improving Humans’ Ability to Interpret Deictic Gestures in Virtual Reality. In Proceedings of the 2020 CHI Conference on Human Factors in Computing Systems; ACM; pp. 1–14. [CrossRef]
- Rizzuto, M.A.; Sonne, M.W.; Vignais, N.; Keir, P.J. Evaluation of a Virtual Reality Head Mounted Display as a Tool for Posture Assessment in Digital Human Modelling Software. 79, 1–8. [CrossRef]
- Anthes, C.; Garcia-Hernandez, R.J.; Wiedemann, M.; Kranzlmuller, D. State of the Art of Virtual Reality Technology. In Proceedings of the 2016 IEEE Aerospace Conference; IEEE; pp. 1–19. [CrossRef]
- Mütterlein, J. The Three Pillars of Virtual Reality? Investigating the Roles of Immersion, Presence, and Interactivity. [CrossRef]
- Obeid, S.; Demirkan, H. The Influence of Virtual Reality on Design Process Creativity in Basic Design Studios. 31, 1841–1859. [CrossRef]
- Input Device, 2023.
- Performance Noun - Definition, Pictures, Pronunciation and Usage Notes | Oxford Advanced American Dictionary at OxfordLearnersDictionaries.Com.
- Ersin, A.; Tezeren, H.C.; Ozunlu Pekyavas, N.; Asal, B.; Atabey, A.; Diri, A.; Gonen, I. The Relationship between Reaction Time and Gaming Time in E-Sports Players. 54, 36–42. [CrossRef]
- Groves, L.A.; Carnahan, P.; Allen, D.R.; Adam, R.; Peters, T.M.; Chen, E.C.S. Accuracy Assessment for the Co-Registration between Optical and VIVE Head-Mounted Display Tracking. 14, 1207–1215. [CrossRef]
- Gautam, Y.; Bade, M. Effect of Auditory Interference on Visual Simple Reaction Time 2017. 15, 329–331, [30580351].
- Theofilou, G.; Ladakis, I.; Mavroidi, C.; Kilintzis, V.; Mirachtsis, T.; Chouvarda, I.; Kouidi, E. The Effects of a Visual Stimuli Training Program on Reaction Time, Cognitive Function, and Fitness in Young Soccer Players 2022. 22, 6680. [CrossRef]
- Accuracy Noun, 2023.
- Welsh, T.N.; Wong, L.; Chandrasekharan, S. Factors That Affect Action Possibility Judgments: The Assumed Abilities of Other People. 143, 235–244. [CrossRef]
- Kangas, J.; Kumar, S.K.; Mehtonen, H.; Järnstedt, J.; Raisamo, R. Trade-Off between Task Accuracy, Task Completion Time and Naturalness for Direct Object Manipulation in Virtual Reality. 6, 6. [CrossRef]
- Rutkowski, S.; Adamczyk, M.; Pastuła, A.; Gos, E.; Luque-Moreno, C.; Rutkowska, A. Training Using a Commercial Immersive Virtual Reality System on Hand-Eye Coordination and Reaction Time in Young Musicians: A Pilot Study 2021. 18, 1297. [CrossRef]
- Fink, A. Conducting Research Literature Reviews: From the Internet to Paper, 3rd ed ed.; SAGE.
- Albert, I.; Burkard, N.; Queck, D.; Herrlich, M. The Effect of Auditory-Motor Synchronization in Exergames on the Example of the VR Rhythm Game BeatSaber. 6, 1–26. [CrossRef]
- Kosinski, R.J. A Literature Review on Reaction Time.
- Dempsey, P. The Teardown: HTC Vive Virtual Reality Headset. 11, 80–81. [CrossRef]
- Campo-Prieto, P.; Cancela-Carral, J.M.; Rodríguez-Fuentes, G. Wearable Immersive Virtual Reality Device for Promoting Physical Activity in Parkinson’s Disease Patients. 22, 3302. [CrossRef]
- Nagymáté, G.; M. Kiss, R. Application of OptiTrack Motion Capture Systems in Human Movement Analysis. 5. [CrossRef]
- Brockmyer, J.H.; Fox, C.M.; Curtiss, K.A.; McBroom, E.; Burkhart, K.M.; Pidruzny, J.N. The Development of the Game Engagement Questionnaire: A Measure of Engagement in Video Game-Playing. 45, 624–634. [CrossRef]
- Steuer, J. Defining Virtual Reality: Dimensions Determining Telepresence. 42, 73–93. [CrossRef]
- AimVR.
- Aiming.Pro.
- Krithikadatta, J. Normal Distribution. 17, 96. [CrossRef]
- Parshuram, H.; Hegde, S. Bell Curve Appraisal: A Critical View. 3, 184–186.
|
Disclaimer/Publisher’s Note: The statements, opinions and data contained in all publications are solely those of the individual author(s) and contributor(s) and not of MDPI and/or the editor(s). MDPI and/or the editor(s) disclaim responsibility for any injury to people or property resulting from any ideas, methods, instructions or products referred to in the content. |
© 2024 by the authors. Licensee MDPI, Basel, Switzerland. This article is an open access article distributed under the terms and conditions of the Creative Commons Attribution (CC BY) license (http://creativecommons.org/licenses/by/4.0/).
