Submitted:
24 January 2024
Posted:
25 January 2024
You are already at the latest version
Abstract
This study deals with the preparation of adsorbents from a commercial xerogel by chemically modifying its surface with concentrated mineral acids and alkali metal chlorides, their physicochemical characterization, and their use as adsorbents for gallic acid in aqueous solution. The prepared adsorbents have a high specific surface area (347-563 m2 g-1), better pore development for samples treated with alkali metal chlorides than with mineral acids and are more acidic than the initial xerogel (p.z.c range 2.49-6.87 vs. 7.20). The adsorption properties of the commercial xerogel improved over a wide range of pH and temperature. The experimental results indicate that the adsorption process is thermodynamically favored.
Keywords:
carbon xerogel
; water remediation
; adsorption
; gallic acid.
1. Introduction
Gallic acid (3,4,5-trihydroxybenzoic acid, GA) is a molecule of interest in the pharmaceutical industry as a component of various therapeutic agents (antioxidants, anticancer, antiviral, and more) and as a preservative in food technology [1]. Moreover, GA is one of the main phytic substances present in the environment and can be considered a component of natural organic matter, which originates from the decomposition of plant biomass [2]. This pollutant is slightly toxic at low concentrations, and its accumulation in the environment should be avoided [3], especially in waters with very low biodegradability [4]. Various technologies have been used for water purification. These treatment technologies include biological methods, coagulation, nanofiltration, and adsorption. Among these techniques, adsorption is the most widely used method to remove contaminants from water with high efficiency and simple operating conditions [1,2,5,6,7].
Activated carbons [8,9] and carbon blacks [10,11] are carbon materials traditionally used in adsorption and catalysis. One of the drawbacks of activated carbons is that they are essentially microporous materials, advantageous for adsorption, which occurs mainly in the micropores. In contrast, mesoporous materials would benefit catalysis by minimizing diffusion limitations and catalyst deactivation [12,13]. In recent decades, a new carbonaceous material has been developed with exciting properties for catalytic applications and can also be used as an adsorbent.
Carbon gels (CG) are synthetic porous carbon materials that have received attention recently due to their great potential and versatility. CGs are obtained after carbonizing organic gels prepared by polycondensation of resorcinol and formaldehyde using acid or basic catalysts [14]. Depending on the drying method of the organic gels: supercritical drying, freeze-drying, and evaporative drying, the carbon gels are given different names: aerogels, cryogels, and xerogels, respectively. Evaporative drying is the most straightforward, fastest, and economical method [15,16]. The main advantage of these materials is the possibility of adapting their surface chemistry and textural characteristics and the various forms they can take (monoliths, films, microspheres, and more) for specific applications, depending highly on the synthesis and preparation conditions [14,15,16,17]. These applications include catalysis [17,18], adsorption [19,20], adsorption-photodegradation [21], and energy storage [22]. The ability to control pore size in CG is undoubtedly an advantage compared to classic activated carbons, whose textural parameters are mainly given by the raw material used in their preparation [13]. Among the most essential and valuable properties are high porosity, surface area (400-1200 m2 g-1), and size pore distribution [23]. Job et al., 2004 and 2006, indicate that the porosity formed during synthesis hardly alters during pyrolysis, but the pH of the precursor solutions regulates these textural properties [13,24]. A chemical or physical activation process can further develop the microporosity of carbon gels [25,26]. Physical activation is carried out with a gas flow (CO2, N2, steam, or air) at high temperatures depending on the reactivity of the gas. Chemical activation involves the use of an activating agent, of which there is a greater variety. Some of the most used are alkalis such as KOH [27] or acids such as H3PO4 [28] but they can also be salts such as ZnCl2 [29]. In general, a higher porous development is usually obtained with chemical activation, but also a higher ash content. It is also possible to use both methods as the existing atmosphere can change the reactivity of the activating agent [30].
In this work, carbon xerogels were prepared by modifying a mesoporous carbon surface chemically with concentrated mineral acids and adsorption of alkali metal chlorides. These treatments have been carried out in our laboratory to obtain acid catalysts [31] or basic catalysts [32,33] on activated carbons. But we have hardly tested them on xerogels, and when we have done so, we have used them as catalysts [34]. Therefore, we have considered using them as adsorbents and studying the changes in their porous texture and surface chemistry and the influence of these changes on their adsorption capacity. As an application, its behavior as an adsorbent of gallic acid from water is studied. The gallic acid adsorption process is examined from the kinetic and equilibrium point of view.
2. Materials and Methods
2.1. Raw Material
The present study used commercial granular carbon CX-5 (hereinafter C-X) supplied by Xerolutions S.L. This material is a mesoporous-activated carbon obtained by carbonization of a polymer xerogel. The carbon was sieved using an IKA A10 basic mill, and a particle size between 1 and 2 mm was selected.
2.2. Synthesis of Modified Carbons
C-X carbon was used to obtain the catalysts and adsorbents. The acid catalysts and adsorbents [31] were prepared by suspending 5 g of C-X in 100 mL of H2SO4 (98%, Labkem) or HNO3 (65%, Fisher Scientific). The mixtures were stirred for 90 min at room temperature. The resulting carbons were filtered and washed with distilled water for one week, changing the wash water twice daily. Yields: 96 % and 102 % respectively.
The basic catalysts and adsorbents have been prepared by ion exchange of the activated carbon with 1M NaCl (> 99.5%, Fisher Scientific) or 1M KCl (> 99.5%, Fisher Scientific) solution [32]. For this purpose, 5 g of activated carbon were suspended in 50 mL of salt solution (solution to carbon ratio 10:1). The samples were shaken for 48 h at 80 °C. The resulting carbons were filtered and washed to obtain a chloride-free material. Yields: 94 % and 96 % respectively.
2.3. Adsorbent Characterization
An elemental analysis (C, H, N, and S) was carried out using the LECO CHNS-932 equipment, and the difference was assigned to oxygen content.
The FT-IR spectra for the samples were recorded on a Nicolet FT-IR spectrometer (Thermo Scientific) using a KBr disc. The discs were prepared using 10 mg of the sample and 400 mg of KBr. One pure KBr disc of the same mass as the sample disc was also prepared and its spectrum was used as background. FTIR spectrums were recorded between 4000 and 400 cm-1 using 50 scans and a resolution of 0.4 cm-1.
X-ray photoelectron spectroscopy (XPS) of the samples was performed on a Thermo Scientific K-Alpha equipment equipped with a monochromatic Kα radiation source of Al at 1486.68 eV, voltage of 12 KV and irradiation perpendicular to the sample of 90º. A Flood Gun charge compensation device was activated, and a spot dust analysis was performed.
Wavelength dispersive X-ray fluorescence (WDXRF) was performed on a Bruker S8 Tiger, with the samples prepared as powder deposit on film, excitation with Rh X-ray source at 4kW, maximum voltage 60 kV, and maximum intensity 170mA.
The point of zero charge (p.z.c.) values were determined under batch conditions using the method proposed by Nabais and Carrott [35].
The amount of acid and basic groups in the different samples was determined in duplicate by acid–base titration. To determine the acid groups, 0.15 g of the sample was mixed with 30 mL of 0.01 M NaOH for 24 h at 25 ºC in a thermostatic bath with continuous agitation, and 20 mL of the filtrate was titrated with 0.01 M HNO3. Conversely, for the determination of the basic groups, 0.15 g of the sample was mixed with 30 mL of 0.01 M HNO3 for 24 h at 25 ºC, and 20 mL of the filtrate was titrated with 0.01 M NaOH. Phenolphthalein was used as an indicator in the acid-base titration. From the volumes obtained in the titrations, the amount (meq g-1) of acidic and basic sites was calculated.
The textural characterization of the samples was carried out by studying the N2 adsorption isotherm realized at -196 ºC in a Quantachorme Autosorb-1 apparatus, previously degassing the sample at 110 ºC for 24 h, and using mercury porosimetry realized in a PoreMaster 60 porosimeter, both from Quantachrome Company.
With a scanning electron microscope model Quanta 3D FEG (FEI Company) operating in the high vacuum mode (6·10-4 Pa) at an accelerating voltage of 10 kV and using a secondary electron detector for high vacuum SEM images and EDX spectra were obtained.
2.4. Adsorption of Gallic Acid
In the study of the adsorption process, gallic acid monohydrate (99%, Panreac) was used. Adsorption kinetics and equilibrium studies were performed using the batch procedure at 30 °C under constant stirring. For kinetics, 200 mg of adsorbent and 200 mL of a 50 mg L-1 aqueous solution of gallic acid (pH ≈ 4) was used. These experiments were performed in duplicate until the adsorption equilibrium is reached. The criterion for defining the equilibrium time was that the adsorption rate should be less than 1% of the initial rate. The adsorption isotherms were measured using 40 mg of adsorbent and 40 mL of adsorbate in aqueous solution of different concentrations (from 0 to 100 mg L-1). All gallic acid measurements were realised by UV-Vis spectrophotometry in a Shimadzu UV-1800 spectrophotometer. The wavelength corresponding to the maximum absorbance was obtained at 268 nm. The adsorption capacity of gallic acid was quantified using the mass balance equation (1):
where Qe is the amount of gallic acid adsorbed per gram of adsorbent (mg g-1), C0 and CF are the initial and final gallic acid concentrations (mg L-1) in the aqueous solutions, respectively, W is the adsorbent mass (g), and V is the volume of gallic acid solution (L). All adsorbents were performed in the subsequent studies of the adsorption capacity of gallic acid at different pH values (acidic, 2.2; neutral, near 7.0; alkaline, near 10.5) to investigate the influence of pH and temperatures (ranging from 35 ºC to 65 ºC) to investigate the influence of temperature and calculate the thermodynamic parameters of the adsorption of using 40 mg of adsorbent and 40 mL of a 50 mg L-1 aqueous solution of gallic acid.
2.5. Reuse Experiments
Two reuse experiments of the C-X-Na adsorbent with gallic acid extraction were carried out. In experiment A, 100 mg of the xerogel and 100 mL of a solution of 100 ppm concentration at pH=4.0 were used and stirred for 24 hours at room temperature. The GA extraction was carried out with 100 mL of distilled water at pH=11, obtaining the pH with the addition of NaOH and also for 24 hours at the same temperature. The charcoal obtained, dried but not washed, was reused on two more occasions. In experiment B, adsorption was performed in the same way, but the extraction was carried out with distilled water at 95 ºC. The process was repeated in the same way on two more occasions.
2.6. Computational Study
The computational study of the electronic density of acetamiprid was performed using the Gaussian16 package at the M06-2x/ 6-311G++(d,p) level of theory. The calculations were carried out in water (SMD model).
3. Results and Discussion
3.1. Chemical Characterization of Adsorbents
3.1.1. Composition
The data obtained from elemental analysis (Table 2) indicate that, in general, the prepared materials have a high carbon content, followed by a high oxygen content. The oxygen content is observed to be similar when the samples are prepared with NaCl and KCl salts and increases notably for the samples prepared with acids. This increase was expected, considering the oxidizing capacity of the acids, especially nitric acid. On the other hand, the null content of N and S in the xerogels is worth noting, except for samples C-X-N and C-X-S, where the nitrogen and sulfur content increased, respectively. This fact was to be expected according to the sample preparation process. In addition, the formation of nitrogen and sulfur functional groups in C-X-N and C-X-S can be assumed. This behavior has also been observed in the microporous Norit RX3 Extra and Merck carbons, which have undergone the same treatment as nitric and sulfuric acid [31,41]. To obtain the amount of Na and K that could be present in the C-X-Na and C-X-K xerogels, WDXRF spectra were also carried out. About 1% chlorine and trace amounts of Fe and Cu were found.
The composition was measured by EDX (Table S2), and the results are similar to Table 2. The materials are rich in carbon, only sulfur is present in C-X-S, and the most oxidized is the C-X-N adsorbent. Neither sodium nor potassium was detected by this technique. After gallic acid adsorption, small variations in composition are observed. It has to be taken into account that this method has to be considered semi-quantitative and, therefore, does not have the same precision as the results shown in Table 2.
The FTIR spectra recorded for the xerogels studied are plotted in Figure 1. The spectra display different absorption bands whose spectral features are tentatively assigned according to the literature [42,43], as shown in Table S1.
The band at 3400 cm-1 is more intense in C-X-N than in other samples, probably due to the oxidation produced by nitric acid. For C-X-S, the band is less intense due to the possible elimination of functional groups with sulfuric acid and the lower oxidizing power of the latter, which means that not as many oxygenated functional groups originate as in the case of nitric acid. For the C-X-Na sample, the lower intensity of this band is because the Na+ cation will preferentially bind to the more electronegative atoms, i.e., oxygen, thus eliminating O-H bonds and transforming them into O-metal bonds. The ν(C=O) stress band between 1770-1650 is only significant in C-X-N since it is the most oxidized material. The ν(C=C) band at 1700-1500 cm-1 appears instead in all spectra and is somewhat more intense in C-X-N because the bonds' symmetric vibrations do not give rise to photon absorption or emission in the infrared. However, adding heteroatoms to a carbon (oxygen in this case) breaks this symmetry and increases the number of bonds whose vibration gives rise to photon absorption. The next region of the spectrum, up to 1330 cm-1, corresponds to hydrogen bond bending vibrations. This zone is similar for all samples, and only the band at 1384 cm-1 stands out, which can be assigned to O-H bonds of carboxyl or hydroxyl groups and C-H bonds of olefins and methyl groups. Between 1300-1000 cm-1, another intense band appears, corresponding to C-O bonds of both ethers and hydroxyl groups. The maximum of this band can be shifted at different wave numbers, which is related to the different ratios between oxygen atoms bonded to substituted (higher wave number) or unsubstituted (lower wave number) carbon atoms. In the C-X-N sample, there are two bands at 1550 and 1350 cm-1, both as shoulders of other bands and not observed in the other samples. These bands can be assigned to the presence of nitro groups (-NO2) resulting from the treatment with nitric acid. However, there are still different opinions about forming these functional groups with this reaction [31]. The C-X-S sample has a series of bands of small intensity at ≈1000, 700, and 600 cm-1 corresponding to the sulfonic groups.
The spectrum of one of the adsorbents after gallic acid adsorption has also been performed. The comparative spectra are shown in Figure 2.
In that figure, it is observed that after GA adsorption, there is an increase in the intensity of the bands. Some of the most representative of the GA are the centred at 3420 cm-1, 1617 cm-1, and 1380 cm-1. According to the literature [44,45,46], the broad and strong bands located between 3650-3200 cm-1 and at 1617 cm-1 that also appear in the FTIR spectrum of pure gallic acid are attributable to the stretching vibrations of the OH groups and the C-C bonds of the aromatic rings of GA. The band at 1380 cm-1 can be assigned to O-H bonds of carboxyl or hydroxyl groups and C-H bonds of methyl groups.
Table 3 shows the elemental analysis results (mass composition) measured by the XPS technique. In general, the variations in composition are similar to those shown in Table 2. The oxygen and sulfur content increases for sample C-X-S, and for sample C-X-N, the oxygen and nitrogen content increases. In addition, a slight decrease in oxygen content is observed for xerogels treated with alkali metal chlorides. In general, no significant changes are observed, so it can be assumed that the modification caused by the chemical treatment is not limited to the xerogel surface. Comparing the results of the global elemental analysis (Table 2) with the XPS results (Table 4), which study a shallower area, a C enrichment, and a decrease in the O content at the surface are observed.
The XPS spectra of C 1s and O 1s are plotted in Supplementary Material (Figures S1, S2), and the deconvolution results for the C1s, O1s, N1s, and S1s peaks are shown in Table 4, Table 5, Table 6 and Table 7.
The C1s orbital has peaks with a maximum near 284.8 eV. The components of these peaks originate in the more or less oxidized forms of the element carbon. The assignment of these components to the different chemical structures has been carried out according to what has been described in the literature [31,47,48,49,50,51,52,53,54]. The peak around 284.8 eV corresponds to the C-C bonds, aromatic bonds of the carbon basal planes and aliphatic hydrocarbons, and C-H bonds. The second peak around 286.0 eV corresponds to C partially oxidized, as hydroxyl or carbonyl groups. The peaks near 289.0 eV correspond to esters, acids, anhydrides, or amides, functional groups in which the carbon element is bonded to two more electronegative atoms. According to Table 4, the main component is graphitic carbon. The treatment with nitric acid (C-X-N) increases the amount of highly oxygenated functional groups since it increases the intensity in peak at 289 eV. The intensity of the peak at 286 eV decreases with all treatments, which can be explained by the fact that aldehydes and ketones are usually more reactive functional groups than others, such as alcohols or esters. Treatment with KCl results in a considerable reduction in the surface area of the xerogel as an increase of the 284.8 eV component and a decrease of the other two components is observed.
The interpretation of O 1s XPS spectra in complex materials such as carbon xerogels or other carbonized materials is complex as one functional group can give more than one peak and very different functional groups can give very close signals. Therefore, we have preferred not to make any interpretation. However, it should be noted that no signal is observed near 530-531 eV, which indicates that there are no oxygen compounds with alkali metals in the C-X-Na and C-X-K samples.
As with nitrogen, sulfur was only detected in one carbon, the C-X-S sample. The observed doublet is due to the presence of sulfur in a high oxidation state (SO3H, -O-SO3H), which would agree with the sulfonation of carbon [31,48,52]. The S 2p spectrum is shown in Figure 3.
As for the analysis of the N1s orbital, only nitrogen has been found, as expected, in the C-X-N sample. The first component presents an energy value of near 401.0 eV due to nitrogen in reduced form, i.e., as pyrolytic or pyridinic nitrogen [50,52] or amine [51] because of HNO3 reduction. Other peak component has been detected at higher value (405.9 eV), indicating that nitrogen is bound to oxygen [50,52]. These results may be due to traces of adsorbed HNO3, by-products of HNO3 partial reduction or nitration. The N 1s spectrum is shown in Figure 4.
3.1.2. Acidic and basic properties
The p.z.c. values and the amount of acidic and basic groups (Table 8) highly depend on the xerogel treatment.
In general, activated carbons with high oxygen contents have low p.z.c. values and vice versa. This is related to the oxidation process of the carbons, which usually gives rise to acidic functional groups. Oxidation of the xerogels produces a noticeable change in acid/base character for C-X-S and C-X-N relative to C-X, which is the starting material. These p.z.c. values are consistent with the oxygen content of the samples; C-X has a content of 12.0% (Table 2), and C-X-S and C-X-N 15.5% and 21.8%, respectively; as expected, C-X has a higher pHpzc value, i.e., it is more basic than C-X-S and C-X-N. These changes indicate that most oxygenated functional groups produced after C-X oxidation are acidic. Also, the formation of sulfonic groups on C-X-S, which are more acidic than the carboxylic acid functional groups, should be noted. On the other hand, no significant changes are observed in the p.z.c. of carbon treated with alkali metal salts. This treatment has been described to increase the basicity of other carbons, mainly if a potassium salt is used [33].
As for the acidic and basic groups, treatment with H2SO4 and HNO3 does not modify the number of basic groups but significantly increases the number of acidic groups. Treatment with NaCl and KCl increases both groups, although not in significant proportion. The relationship between p.z.c. and the number of acidic and basic groups is not direct; as shown in Table 9, treatment with HNO3 results in more acidic functional groups than treatment with sulfuric acid but not in a more acidic p.z.c. This is because, in addition to the number of acidic or basic groups, the strength of acids or bases of the functional groups must be considered. These results agree with the existence of strongly acidic sulfonic groups in C-X-S.
3.2. Structural Characterization
3.2.1. N2 Adsorption
The N2 adsorption isotherms at -196 ºC obtained for the adsorbents studied are shown in Figure 5. These isotherms present a hysteresis cycle wider in C-X-N than in the rest of the samples, which allows them to be classified as type IV isotherms of the classification system proposed by BDDT [55] and the most recent IUPAC technical report [56], indicating that they are mesoporous adsorbents. The hysteresis cycle is of type H4, as the adsorption branch is intermediate between isotherm types I and II. In addition, the fact that the cycle closes at a relative pressure close to unity indicates that the pores are slot-shaped.
The isotherms and textural data (Table 9) show that the modifications made to the activated carbons cause a moderate change in the specific surface area (SBET). Treatment with mineral acids (C-X-S and C-X-N) resulted in carbons with a lower SBET. In contrast, treatment with alkali metal salts (C-X-Na and C-X-K) slightly increased BET surface area. Regarding the volume of micropores (Dubinin-Astakhov, DA; and Dubinin-Radushkevish, DR), the data show a decrease in the volume of micropores in C-X-S and C-X-N, being more pronounced in the latter, and an increase in C-X-Na and C-X-K. These results are consistent with those obtained for SBET since The specific surface area depends mainly on the number of micropores. As for the mean pore diameter (measured by the DR method) of the samples, it varies from larger to smaller according to C-X-N > C-X-S > C-X-Na > C-X > C-X-K. This value would also be due to the fact that in the samples prepared with salts, there are more narrow pores and, therefore, more specific surface area, and in the acid-treated samples, the opposite effect occurs.
3.2.2. Mercury Porosimetry
Figure 6 shows the cumulative pore volume obtained for the carbons. Treating C-X with mineral acids and alkali metal salts causes significant variations in the wide porosity (Table 10). C-X treatment with mineral acids shows a slight decrease in mesopore volume and a more pronounced decrease in macropore volume, which is very similar for C-X-S and C-X-N. In treating C-X with alkali metal salts, there is a significant increase in the volume of meso- and macropores for the C-X-Na and C-X-K samples, being much higher for C-X-Na. On the other hand, C-X shows a monomodal porosity distribution, with a pore diameter between 0.01 and 0.10 µm, which is maintained in the acid treatment (samples C-X-S and C-X-N). Samples C-X-Na and C-X-K show a bimodal distribution since new pores with a pore diameter between 1 and 10 µm appear with the treatment with alkali metal salts (Figure 7).
3.2.3. Scanning Electron Microscopy
Some representative images of the carbons obtained by SEM are shown in Figures S3 and S4. The micrographs show that C-X-S and C-X-N (Figure S3) have a similar structural appearance to commercial carbon xerogel. However, the C-X-Na and C-X-K samples have a different appearance, with smaller particle size and higher surface roughness. This cannot be explained by the mechanical stirring time as the acid-treated samples were kept for one week in stirring for the cleaning process. Those treated with salts were only agitated for 90 minutes. Temperature is not likely to play a role, as carbonaceous materials are usually very temperature stable in the absence of oxidizing agents in the medium. Therefore, it must be assumed that the sodium and potassium salts affect and modify the structure somehow, and we should consider in the future whether there is any catalytic effect.
3.3. Gallic Acid Adsorption
3.3.1. Adsorption Kinetics
The data of C (mg L-1) as a function of t (h) obtained for the adsorption systems formed by the GA in aqueous solution and the adsorbents are plotted in Figure 8. From Figure 8, it can be inferred that a good part of the GA in the solution is adsorbed at contact times of ≤16 h by the adsorbents. It should be noted that the amount of GA adsorbed concerning the initial concentration was similar for all adsorbents except for C-X-N. This result agrees with the development of porosity in the samples. Table 10 shows that VDR is higher for samples treated with alkali metal salts than those treated with mineral acids. On the other hand, the slight variations obtained in the adsorption of GA by the adsorbents could be due to the surface heterogeneity of the samples.
The fit of the kinetic data to the pseudo-first and pseudo-second-order models is shown in Table 11. According to the R2 values, the kinetic data best fit the pseudo-second-order model. Moreover, the calculated value of qe in the pseudo-second-order model is closer to the experimentally observed one, which supports its validity. The highest value of qe corresponds to C-X, while the kinetic constant k2 is higher for C-X-S.
3.3.2. Adsorption Isotherms
The adsorption isotherms obtained for the samples and GA in aqueous solution are represented in Figure 9. The isotherms have a concave shape concerning the abscissa axis, which is characteristic of group L isotherms according to the Giles classification [57]. This indicates no strong solvent competition for the active adsorption centers. The results show that the oxidation of the carbons because of the acid treatment does not significantly modify the shape of the isotherms. The shape of the isotherms does change to a greater extent for carbons treated with alkali metal salts, although they still belong to the L group. Likewise, the isotherms belong to subgroups 2 or 3, typical of systems in which adsorption occurs by filling consecutive layers. Given Figure 9, treatment with mineral acids and alkali metal salts improves the adsorption capacity, especially for the C-X-Na adsorbent.
Table 12 shows the values from fitting the experimental data to the different isotherm models applied. As for the adsorption capacity of the carbons, according to the Langmuir model, C-X-S is the highest, followed by C-X-Na and, finally, with the lower adsorption capacity, C-X carbon. For the Freundlich isotherm model, the KF parameter indicates the adsorption capacity, with the samples prepared with alkali metal salts showing the highest adsorption capacity, followed by the sample prepared with nitric acid, and finally C-X and C-X-S. The latter data are more similar to the data obtained experimentally. And the R2-value is higher in the Freundlich model for almost all adsorbents. This can be explained in two ways. One is that there is a good adsorption capacity in the monolayer but accompanied by adsorption in successive layers. This effect would be particularly important for C-X-S and not as important for C-X. The other possible explanation is that there is heterogeneity at the surface and the active sites have a wide range of adsorption energies, which is more in agreement with the Freundlich model than with the Langmuir model. And in the case of carbonaceous materials, with a complex structure, this is to be expected. In addition, it can be added that the chemical modification of the C-X carbon xerogel changes this aspect of its properties, as the starting material is the only one that fits the Langmuir model better. The parameter n indicates that the adsorption process is dominated by physisorption. The better adsorption of the C-X-Na and C-X-K samples can be explained by the presence of Na+ and K+ cations on the surface. These can cause electrostatic attraction on the gallic acid since, under the conditions under which it was made, the gallic acid must be in the form of anion gallate. Other types of interaction that may be present in the other carbon xerogels (pi-pi interactions, dipolar interactions with oxygenated groups, etc.) also exist in C-X-Na and C-X-K.
Table 13 shows some published results on the adsorption of gallic acid on different adsorbents.
The results obtained in our laboratory are superior to most published results. It is difficult to compare these data as the conditions under which they were obtained may be different. For example, the best adsorption result shown in Table 13 (the first in the Table) is obtained using a 20 times higher concentration of gallic acid. In general, the use of activated carbons and polymers usually gives good results.
3.3.3. Influence of pH
The amount of GA removed as a function of pH is shown in Figure 10. This figure shows that the medium's pH strongly influences the adsorption capacity of GA in aqueous solution. According to previous works [68,69], GA is a molecule easily ionized due to the deprotonation of the carboxylic group. Consequently, gallic acid can exist in neutral or anionic form, depending on the pH of the medium. Increasing the pH leads to deprotonation of the carboxylic group in the GA structure. Moreover, an increase in pH above 7 marks the formation of the dianion. Adsorption increases at low pH. This is explained by the fact that under these conditions, gallic acid is as such, in its neutral form, and not as gallate. Figure 11 shows the calculated electron density in gallic acid molecules, and gallate anions. It can be seen that gallic acid is practically neutral with some positive charge near the protons (dark blue), but in gallates, there are no areas of positive charge, and negative charge predominates. The adsorbents are protonated, so this positive charge attracts the gallic acid molecule, which has several dipoles and, therefore, negatively charged areas in its molecule. In the case of the C-X-Na and C-X-K samples, there is the added effect of alkali cations. In the case of the C-X-N sample, the greater number of oxygenated functional groups it possesses and, therefore, the greater possibilities of bonding by Van der Waals forces.
At pH closer to neutral, adsorbents may have a surface charge close to zero or negative in the more acidic xerogels. This repels the gallate anion, although the attraction of Na+ and K+ cations must still be considered. At basic pH, both the adsorbate and the adsorbents are negatively charged, which explains the almost zero adsorption capacity. Again, under these conditions, the adsorption shown by the C-X-Na and C-X-K xerogels can be explained by the presence of the metal cations. A graphical representation of the described mechanism is shown in Figure 12.
3.3.4. Influence of Temperature
Figure 13 shows the amount of GA non-adsorbed (C0 = 50 mg L-1) as a function of temperature for the adsorbent samples. From the figure, it can be seen that the amount of adsorbed GA increases slightly with temperature. From the adsorption equilibrium data measured at different temperatures, the entropy, enthalpy, and Gibbs free energy for GA on the different carbons have been calculated (Table 13).
The enthalpy increase is positive in all cases, indicating that the process is endothermic. The entropy is positive, which is to be expected if adsorption increases with temperature. The calculation of the Gibbs free energy at 298 K yields negative values in all cases except for C-X-N, indicating that adsorption is a spontaneous process for all samples except for C-X-N, where a non-spontaneous process takes place.
3.3.5. Reuse Experiment
Experiments were carried out to study the possible extraction of GA as well as the reuse of adsorbents. The C-X-Na xerogel was chosen as it had adsorbed the highest amount according to the adsorption isotherm. The adsorption of GA was carried out at room temperature and pH=4.0 as these conditions were high adsorption conditions according to the data shown above. As for desorption, two parameters were studied independently. On the one hand, a basic pH was used since the worst adsorption performance was achieved under these conditions (Experiment A). On the other hand, desorption was carried out at a high temperature (95 ºC) since the amount adsorbed decreases with increasing temperature (Experiment B). The results obtained are shown in Table 14 and Table 15.
The adsorption capacity decreases after the first cycle, as the removal of GA is not complete. There are no major differences between the results of the second and third cycle, so it can be assumed that the surface has stabilized and the xerogel can still be used although with a somewhat lower performance than in the first cycle. The amount extracted is lower in the first cycle, both in quantity and as a percentage of the amount adsorbed in that cycle. This can be explained by the fact that in the first cycle, the gallic acid occupies the positions where the binding is strongest, resulting in a partly irreversible process. In the subsequent cycles, these positions are mostly occupied by the active sites with lower binding energy, so that the process is reversible.
As in the previous experiment, the adsorption capacity decreases after the first cycle. Again, there are no major differences between the results of the second and third cycle, so it can be assumed that the surface has stabilized and the xerogel can be used repeatedly, although with somewhat lower performance than in the first cycle. The extraction method gives a lower yield than the previous one.
4. Conclusions
Chemical modification of an activated carbon changes this material's physical structure. Treatment with mineral acids and alkali metal salts on the starting xerogel modifies its adsorptive properties. Treatment with NaCl and KCl salts results in more porous development than treatment with H2SO4 and HNO3. In terms of chemical structure, using oxidizing acids increases the oxygen content and nitrogen and sulfur content when nitric or sulfuric acid are used, respectively. As a consequence of these changes, the p.z.c. of the adsorbents thus treated is significantly lower than that of the starting material. The treatment with mineral acids increases the number of acid groups and maintains the number of basic groups. On the other hand, treatment with alkali metal salts maintains or increases the number of acid groups and increases markedly the number of basic groups.
The best adsorbents for gallic acid for each treatment are C-X-N for the acid treatment and C-X-Na for the basic treatment. As for the kinetics of the adsorption systems studied, the experimental data best fit the pseudo-second-order model. No theoretical mathematical model has been found that adequately describes all the adsorption isotherm experiments performed. The adsorption capacity increases with decreasing pH value and temperature of the solution. The calculated entropy, enthalpy, and Gibbs free energy values in the gallic acid adsorption experiments indicate that this process is thermodynamically favored.
Author Contributions
Conceptualization, C.J. Durán-Valle; methodology, C.J. Durán-Valle and M. Adame Pereira; validation, R.C. Carvalho and M. Adame Pereira; formal analysis, R.C. Carvalho, C.J. Durán-Valle and M. Adame Pereira; investigation, R.C. Carvalho and M. Adame Pereira; resources, C.J. Durán-Valle; data curation, R.C. Carvalho, C.J. Durán-Valle and M. Adame Pereira; writing—original draft preparation, R.C. Carvalho, C.J. Durán-Valle and M. Adame Pereira; writing—review and editing, C.J. Durán-Valle and M. Adame Pereira; visualization, R.C. Carvalho, C.J. Durán-Valle and M. Adame Pereira; supervision, C.J. Durán-Valle; project administration, C.J. Durán-Valle; funding acquisition, C.J. Durán-Valle. All authors have read and agreed to the published version of the manuscript.
Funding
This research was funded by the European Regional Development Fund and the Junta de Extremadura (grant IB20026).
Conflicts of Interest
The authors declare no conflict of interest. The funders had no role in the design of the study, in the collection, analyses, or interpretation of data, in the writing of the manuscript, or in the decision to publish the results.
References
- Chedri Mammar, A.; Mouni, L.; Bollinger, J.-C.; Belkhiri, L.; Bouzaza, A.; Assadi, A.A.; Belkacemi, H. Modeling and Optimization of Process Parameters in Elucidating the Adsorption Mechanism of Gallic Acid on Activated Carbon Prepared from Date Stones. Sep Sci Technol 2020, 55, 3113–3125. [Google Scholar] [CrossRef]
- Wang, J.; Li, A.; Xu, L.; Zhou, Y. Adsorption of Tannic and Gallic Acids on a New Polymeric Adsorbent and the Effect of Cu(II) on Their Removal. J Hazard Mater 2009, 169, 794–800. [Google Scholar] [CrossRef]
- Lin, C.C.; Liu, Y.T.; Chang, P.H.; Hsieh, Y.C.; Tzou, Y.M. Inhibition of Continuous Cropping Obstacle of Celery by Chemically Modified Biochar: An Efficient Approach to Decrease Bioavailability of Phenolic Allelochemicals. J Environ Manage 2023, 348, 119316. [Google Scholar] [CrossRef] [PubMed]
- Boye, B.; Brillas, E.; Buso, A.; Farnia, G.; Flox, C.; Giomo, M.; Sandonà, G. Electrochemical Removal of Gallic Acid from Aqueous Solutions. Electrochim Acta 2006, 52, 256–262. [Google Scholar] [CrossRef]
- Taoufik, N.; Elmchaouri, A.; Anouar, F.; Korili, S.; Gil, A. Improvement of the Adsorption Properties of an Activated Carbon Coated by Titanium Dioxide for the Removal of Emerging Contaminants. Journal of Water Process Engineering 2019, 31, 100876. [Google Scholar] [CrossRef]
- Annab, H.; Fiol, N.; Villaescusa, I.; Essamri, A. A Proposal for the Sustainable Treatment and Valorisation of Olive Mill Wastes. J Environ Chem Eng 2019, 7, 102803. [Google Scholar] [CrossRef]
- Fu, Y.; Gong, H.; Su, S.; Lei, T.; Zhong, S. Fabrication of O-Enriched Macroporous Polymer for the Efficient Adsorption Organic Acid from Aqueous Solution. Journal of Polymer Research 2023, 30, 1–10. [Google Scholar] [CrossRef]
- Gómez-Serrano, V.; Adame-Pereira, M.; Alexandre-Franco, M.; Fernández-González, C. Adsorption of Bisphenol A by Activated Carbon Developed from PET Waste by KOH Activation. Environmental Science and Pollution Research 2021, 28, 24342–24354. [Google Scholar] [CrossRef]
- Mendoza-Carrasco, R.; Cuerda-Correa, E.M.; Alexandre-Franco, M.F.; Fernández-González, C.; Gómez-Serrano, V. Preparation of High-Quality Activated Carbon from Polyethyleneterephthalate (PET) Bottle Waste. Its Use in the Removal of Pollutants in Aqueous Solution. J Environ Manage 2016, 181, 522–535. [Google Scholar] [CrossRef]
- Cheng, G.; Sun, M.; Ge, X.; Ou, Y.; Xu, X.; Lin, Q.; Lou, L. Adsorption-Desorption Characteristics of Nonylphenol on Two Different Origins of Black Carbon. Water Air Soil Pollut 2017, 228. [Google Scholar] [CrossRef]
- Domínguez-Vargas, J.R.; Navarro-Rodríguez, J.A.; de Heredia, J.B.; Cuerda-Correa, E.M. Removal of Chlorophenols in Aqueous Solution by Carbon Black Low-Cost Adsorbents. Equilibrium Study and Influence of Operation Conditions. J Hazard Mater 2009, 169, 302–308. [Google Scholar] [CrossRef] [PubMed]
- Figueiredo, J.L. Carbon Xerogels for Catalytic Applications. Boletín del Grupo Español del Carbón 2012, 26, 12–17. [Google Scholar]
- Job, N.; Heinrichs, B.; Lambert, S.; Pirard, J.; Colomer, J.; Vertruyen, B.; Marien, J. Carbon Xerogels as Catalyst Supports: Study of Mass Transfer. AIChE journal 2006, 52, 2663–2676. [Google Scholar] [CrossRef]
- Men’shchikov, I.E.; Shkolin, A. V.; Khozina, E. V.; Grinchenko, A.E.; Fomkin, A.A. Mesoporous Carbon Xerogel as a Promising Adsorbent for Capture and Storage of Liquified Natural Gas Vapors. Adsorption 2023, 29, 255–273. [Google Scholar] [CrossRef]
- Calvo, E.G.; Ania, C.O.; Zubizarreta, L.; Menéndez, J.A.; Arenillas, A. Exploring New Routes in the Synthesis of Carbon Xerogels for Their Application in Electric Double-Layer Capacitors. Energy & fuels 2010, 24, 3334–3339. [Google Scholar] [CrossRef]
- Zubizarreta, L.; Arenillas, A.; Pirard, J.-P.; Pis, J.J.; Job, N. Tailoring the Textural Properties of Activated Carbon Xerogels by Chemical Activation with KOH. Microporous and mesoporous materials. 2008, 115, 480–490. [Google Scholar] [CrossRef]
- Eblagon, K.M.; Arenillas, A.; Malaika, A.; Fernando, M.; Figueiredo, J.L. The Influence of the Surface Chemistry of Phosphorylated Carbon Xerogel Catalysts on the Production of HMF from Fructose in Water. Fuel 2023, 334, 126610. [Google Scholar] [CrossRef]
- Moreno-Castilla, C. Carbon Gels in Catalysis. In Carbon Materials for Catalysis; Serp, P., Figueiredo, J.L., Eds.; John Wiley & Sons: New York, 2008; pp. 373–400. [Google Scholar]
- Fairén-Jiménez, D.; Carrasco-Marín, F.; Moreno-Castilla, C. Adsorption of Benzene, Toluene, and Xylenes on Monolithic Carbon Aerogels from Dry Air Flows. 2007. 2007. [CrossRef]
- Carrales-Alvarado, D.H.; Leyva-Ramos, R.; Bailón-García, E.; Carrasco-Marín, F.; Villela-Martinez, D.E. Synthesis, Characterization, and Application of Pristine and Clay-Templated Carbon Xerogel Microspheres for Removing Diclofenac and Heavy Metals from Water Solution. Environmental Science and Pollution Research 2023, 30, 34684–34697. [Google Scholar] [CrossRef]
- Safri, A.; Fletcher, A.J.; Safri, A.; Fletcher, A.J. Concentration Dependence of TiO2 Nanoparticles in Carbon Xerogels on Adsorption–Photodegradation Applications. Gels 2023, Vol. 9, Page 468 2023, 9, 468. [Google Scholar] [CrossRef]
- Calvo, E.; Ferrera-Lorenzo, N.; Menéndez, J.; Arenillas, A. Microwave Synthesis of Micro-Mesoporous Activated Carbon Xerogels for High Performance Supercapacitors. Microporous and mesoporous materials. 2013, 168, 206–212. [Google Scholar] [CrossRef]
- Al-Muhtaseb, S.A.; Ritter, J.A. Preparation and Properties of Resorcinol-Formaldehyde Organic and Carbon Gels. Advanced Materials 2003, 15, 101–114. [Google Scholar] [CrossRef]
- Job, N.; Pirard, R.; Marien, J.; Pirard, J.-P. Porous Carbon Xerogels with Texture Tailored by PH Control during Sol-Gel Process. Carbon N Y 2004, 42, 619–628. [Google Scholar] [CrossRef]
- Canal-Rodríguez, M.; Menéndez, J.A.; Arenillas, A. Carbon Xerogels: The Bespoke Nanoporous Carbons. In Porosity - Process, Technologies and Applications; Taher, G., Ed.; InTech: London, 2017. [Google Scholar]
- Zapata-Benabithe, Z.; Carrasco-Marín, F.; de Vicente, J.; Moreno-Castilla, C. Carbon Xerogel Microspheres and Monoliths from Resorcinol–Formaldehyde Mixtures with Varying Dilution Ratios: Preparation, Surface Characteristics, and Electrochemical Double-Layer Capacitances. LANGMUIR : ACS journal of surfaces and colloids 2013, 29, 6166–6173. [Google Scholar] [CrossRef] [PubMed]
- Contreras, M.S.; Páez, C.A.; Zubizarreta, L.; Léonard, A.; Blacher, S.; Olivera-Fuentes, C.G.; Arenillas, A.; Pirard, J.-P.; Job, N. A Comparison of Physical Activation of Carbon Xerogels with Carbon Dioxide with Chemical Activation Using Hydroxides. Carbon N Y 2010, 48, 3157–3168. [Google Scholar] [CrossRef]
- Neme, I.; Gonfa, G.; Masi, C. Activated Carbon from Biomass Precursors Using Phosphoric Acid: A Review. Heliyon 2022, 8. [Google Scholar] [CrossRef] [PubMed]
- Joseph, C.G.; Hoon, G.G.; Sharain-Liew, Y.L.; Krishnaiah, D.; Massuanna, M. Preparation and Characterization of Activated Carbon Derived from Waste Rubber Tire via Chemical Activation with ZnCl2: Surface Area and Morphological Studies. Developments in Sustainable Chemical and Bioprocess Technology 2013, 371–380. [Google Scholar] [CrossRef]
- Wong, S.; Ngadi, N.; Inuwa, I.M.; Hassan, O. Recent Advances in Applications of Activated Carbon from Biowaste for Wastewater Treatment: A Short Review. J Clean Prod 2018, 175, 361–375. [Google Scholar] [CrossRef]
- Durán-Valle, C.; Madrigal-Martínez, M.; Martínez-Gallego, M.; Fonseca, I.; Matos, I.; Botelho do Rego, A. Activated Carbon as a Catalyst for the Synthesis of N-Alkylimidazoles and Imidazolium Ionic Liquids. Catal Today 2012, 187, 108–114. [Google Scholar] [CrossRef]
- Perozo-Rondón, E.; Calvino-Casilda, V.; Martín-Aranda, R.M.; Casal, B.; Durán-Valle, C.J.; Rojas-Cervantes, M.L. Catalysis by Basic Carbons: Preparation of Dihydropyridines. Appl Surf Sci 2006, 252, 6080–6083. [Google Scholar] [CrossRef]
- Ferrera-Escudero, S.; Perozo-Rondón, E.; Calvino-Casilda, V.; Casal, B.; Martín-Aranda, R.; López-Peinado, A.; Durán-Valle, C. The Effect of Ultrasound on the N-Alkylation of Imidazole over Alkaline Carbons: Kinetic Aspects. Appl Catal 2010, 378, 26–32. [Google Scholar] [CrossRef]
- Godino-Ojer, M.; Matos, I.; Bernardo, M.; Carvalho, R.; Olívia, O.S.; Durán-Valle, C.; Fonseca, I.M.; Mayoral, E.P. Acidic Porous Carbons Involved in the Green and Selective Synthesis of Benzodiazepines. Catal Today 2020, 357, 64–73. [Google Scholar] [CrossRef]
- Valente Nabais, J.M.; Carrott, P.J.M. Chemical Characterization of Activated Carbon Fibers and Activated Carbons. J Chem Educ 2006, 83, 436–438. [Google Scholar] [CrossRef]
- Lagergren, S.; Svenska, B.K. Zurtheorie Der Sogenannten Adsorption Geloesterstoffe. Vetenskapsakad. Handl. 1898, 24, 1–39. [Google Scholar]
- Ho, Y.S.; McKay, G. Pseudo-Second Order Model for Sorption Processes. Process Biochemistry 1999, 34, 451–465. [Google Scholar] [CrossRef]
- Weber, W.J.; Morris, J.C. Kinetics of Adsorption on Carbon from Solutions. Journal of the Sanitary Engineering Division, American Society of Civil Engineers 1963, 89, 31–60. [Google Scholar] [CrossRef]
- Langmuir, I. The Adsorption of Gases on Plane Surfaces of Glass, Mica and Platinum. J Am Chem Soc 1918, 40, 1361–1403. [Google Scholar] [CrossRef]
- Freundlich, H. Über Die Adsorption in Lösungen. Zeitschrift für Physikalische Chemie 1906, 57, 471. [Google Scholar] [CrossRef]
- Lõpez-Sanz, J.; Pérez-Mayoral, E.; Soriano, E.; Omenat-Morán, D.; Durán, C.J.; Martín-Aranda, R.M.; Matos, I.; Fonseca, I. Acid-Activated Carbon Materials: Cheaper Alternative Catalysts for the Synthesis of Substituted Quinolines. ChemCatChem 2013, 5, 3736–3742. [Google Scholar] [CrossRef]
- Coates, J. Interpretation of Infrared Spectra, A Practical Approach. In Encyclopedia of Analytical Chemistry; Meyers, R.A., Ed.; 2000; pp. 10815–10837. [Google Scholar]
- Pretsch, E.; Bühlmann, P.; Badertscher, M. Structure Determination of Organic Compounds. Tables of Spectral Data; Springer: Berlin/Heidelberg, Germany, 2009. [Google Scholar]
- Khaskheli, A.R.; Naz, S.; Ozul, F.; Aljabour, A.; Mahesar, S.A.; Patir, I.H.; Ersoz, M. Urchin-like Cobalt Nanostructures For Catalytic Degradation Of Nitro Anilines. Adv Mater Lett 2016, 7, 748–753. [Google Scholar] [CrossRef]
- Wang, W.; Chen, Q.; Jiang, C.; Yang, D.; Liu, X.; Xu, S. One-Step Synthesis of Biocompatible Gold Nanoparticles Using Gallic Acid in the Presence of Poly-(N-Vinyl-2-Pyrrolidone). Colloids Surf A Physicochem Eng Asp 2007, 301, 73–79. [Google Scholar] [CrossRef]
- Hirun, N.; Dokmaisrijan, S.; Tantishaiyakul, V. Experimental FTIR and Theoretical Studies of Gallic Acid–Acetonitrile Clusters. Spectrochim Acta A Mol Biomol Spectrosc 2012, 86, 93–100. [Google Scholar] [CrossRef] [PubMed]
- Calvino-Casilda, V.; López-Peinado, A.; Fierro, J.; Martίn-Aranda, R. Microwave Assisted N-Propargylation of Imidazole Using Alkaline Promoted Carbons. Appl Catal 2003, 240, 287–293. [Google Scholar] [CrossRef]
- Kim, Y.; Lee, H.; Lee, S.; Cho, B.; Park, C. Effects of Sulfuric Acid Treatment on the Microstructure and Electrochemical Performance of a Polyacrylonitrile (PAN)-Based Carbon Anode. Carbon N Y 2005, 43, 163–169. [Google Scholar] [CrossRef]
- Oh, H.-J.; Lee, J.-H.; Ahn, H.-J.; Jeong, Y.; Kim, Y.-J.; Chi, C.-S. Nanoporous Activated Carbon Cloth for Capacitive Deionization of Aqueous Solution. Thin Solid Films 2006, 515, 220–225. [Google Scholar] [CrossRef]
- László, K.; Tombácz, E.; Josepovits, K. Effect of Activation on the Surface Chemistry of Carbons from Polymer Precursors. Carbon N Y 2001, 39, 1217–1228. [Google Scholar] [CrossRef]
- Biniak, S.; Szymański, G.; Siedlewski, J.; Świątkowski, A. The Characterization of Activated Carbons with Oxygen and Nitrogen Surface Groups. Carbon N Y 1997, 35, 1799–1810. [Google Scholar] [CrossRef]
- Terzyk, A.P. The Influence of Activated Carbon Surface Chemical Composition on the Adsorption of Acetaminophen (Paracetamol) in Vitro. Colloids and surfaces. 2001, 177, 23–45. [Google Scholar] [CrossRef]
- Gabriel, G.; Sauthier, G.; Fraxedas, J.; Moreno-Mañas, M.; Martínez, M.; Miravitlles, C.; Casabó, J. Preparation and Characterisation of Single-Walled Carbon Nanotubes Functionalised with Amines. Carbon N Y 2006, 44, 1891–1897. [Google Scholar] [CrossRef]
- Subrahmanyam, C.; Bulushev, D.A.; Kiwi-Minsker, L. Dynamic Behaviour of Activated Carbon Catalysts during Ozone Decomposition at Room Temperature. Appl Catal 2005, 61, 98–106. [Google Scholar] [CrossRef]
- Brunauer, S.; Deming, L.S.; Deming, W.E.; Teller, E. On a Theory of the van Der Waals Adsorption of Gases. J Am Chem Soc 1940, 62, 1723–1732. [Google Scholar] [CrossRef]
- Thommes, M.; Kaneko, K.; Neimark, A. V.; Olivier, J.P.; Rodriguez-Reinoso, F.; Rouquerol, J.; Sing, K.S. Physisorption of Gases, with Special Reference to the Evaluation of Surface Area and Pore Size Distribution (IUPAC Technical Report). Pure and applied chemistry. 2015, 87, 1051–1069. [Google Scholar] [CrossRef]
- Giles, C.H.; MacEwan, T.H.; Nakhwa, S.N.; Smith, D. 786. Studies in Adsorption. Part XI. A System of Classification of Solution Adsorption Isotherms, and Its Use in Diagnosis of Adsorption Mechanisms and in Measurement of Specific Surface Areas of Solids. Journal of the Chemical Society (Resumed) 1960, 3973–3993. [Google Scholar] [CrossRef]
- Cagnon, B.; Chedeville, O.; Cherrier, J.F.; Caqueret, V.; Porte, C. Evolution of Adsorption Kinetics and Isotherms of Gallic Acid on an Activated Carbon Oxidized by Ozone: Comparison to the Raw Material. J Taiwan Inst Chem Eng 2011, 42, 996–1003. [Google Scholar] [CrossRef]
- Krasnova, T.A.; Gora, N. V.; Golubeva, N.S. Influence of Physical-Chemical Properties of Active Carbons on Gallic Acid Adsorption. Foods and Raw Materials 2015, 3, 120–125. [Google Scholar] [CrossRef] [PubMed]
- Liu, F.F.; Wang, S.G.; Fan, J.L.; Ma, G.H. Adsorption of Natural Organic Matter Surrogates from Aqueous Solution by Multiwalled Carbon Nanotubes. Journal of Physical Chemistry C 2012, 116, 25783–25789. [Google Scholar] [CrossRef]
- Han, F.; Xu, C.; Sun, W.Z.; Yu, S.T.; Xian, M. Effective Removal of Salicylic and Gallic Acids from Single Component and Impurity-Containing Systems Using an Isatin-Modified Adsorption Resin. RSC Adv 2017, 7, 23164–23175. [Google Scholar] [CrossRef]
- Ahmat, A.M.; Thiebault, T.; Guégan, R. Phenolic Acids Interactions with Clay Minerals: A Spotlight on the Adsorption Mechanisms of Gallic Acid onto Montmorillonite. Appl Clay Sci 2019, 180, 105188. [Google Scholar] [CrossRef]
- Levy, L.; Gurov, A.; Radian, A. The Effect of Gallic Acid Interactions with Iron-Coated Clay on Surface Redox Reactivity. Water Res 2020, 184, 116190. [Google Scholar] [CrossRef]
- Celestino, G.G.; Henriques, R.R.; Shiguihara, A.L.; Constantino, V.R.L.; De, R.; Melo, S.; Júnior, J.A. Adsorption of Gallic Acid on Nanoclay Modified with Poly(Diallyldimethylammonium Chloride). [CrossRef]
- Fan, S.; Huang, Z.; Zhang, Y.; Hu, H.; Liang, X.; Gong, S.; Zhou, J.; Tu, R. Magnetic Chitosan-Hydroxyapatite Composite Microspheres: Preparation, Characterization, and Application for the Adsorption of Phenolic Substances. Bioresour Technol 2019, 274, 48–55. [Google Scholar] [CrossRef]
- Song, X.; Chai, Z.; Zhu, Y.; Li, C.; Liang, X. Preparation and Characterization of Magnetic Chitosan-Modified Diatomite for the Removal of Gallic Acid and Caffeic Acid from Sugar Solution. Carbohydr Polym 2019, 219, 316–327. [Google Scholar] [CrossRef]
- Chai, Z.; Li, C.; Zhu, Y.; Song, X.; Chen, M.; Yang, Y.L.; Chen, D.; Liang, X.; Wu, J. Arginine-Modified Magnetic Chitosan: Preparation, Characterization and Adsorption of Gallic Acid in Sugar Solution. Int J Biol Macromol 2020, 165, 506–516. [Google Scholar] [CrossRef] [PubMed]
- Badhani, B.; Kakkar, R. DFT Study of Structural and Electronic Properties of Gallic Acid and Its Anions in Gas Phase and in Aqueous Solution. [CrossRef]
- Radalla, A.M. Potentiometric Studies on Ternary Complexes Involving Some Divalent Transition Metal Ions, Gallic Acid and Biologically Abundant Aliphatic Dicarboxylic Acids in Aqueous Solutions. Beni Suef Univ J Basic Appl Sci 2015, 4, 174–182. [Google Scholar] [CrossRef]
Scheme 1.
Preparation of adsorbents.
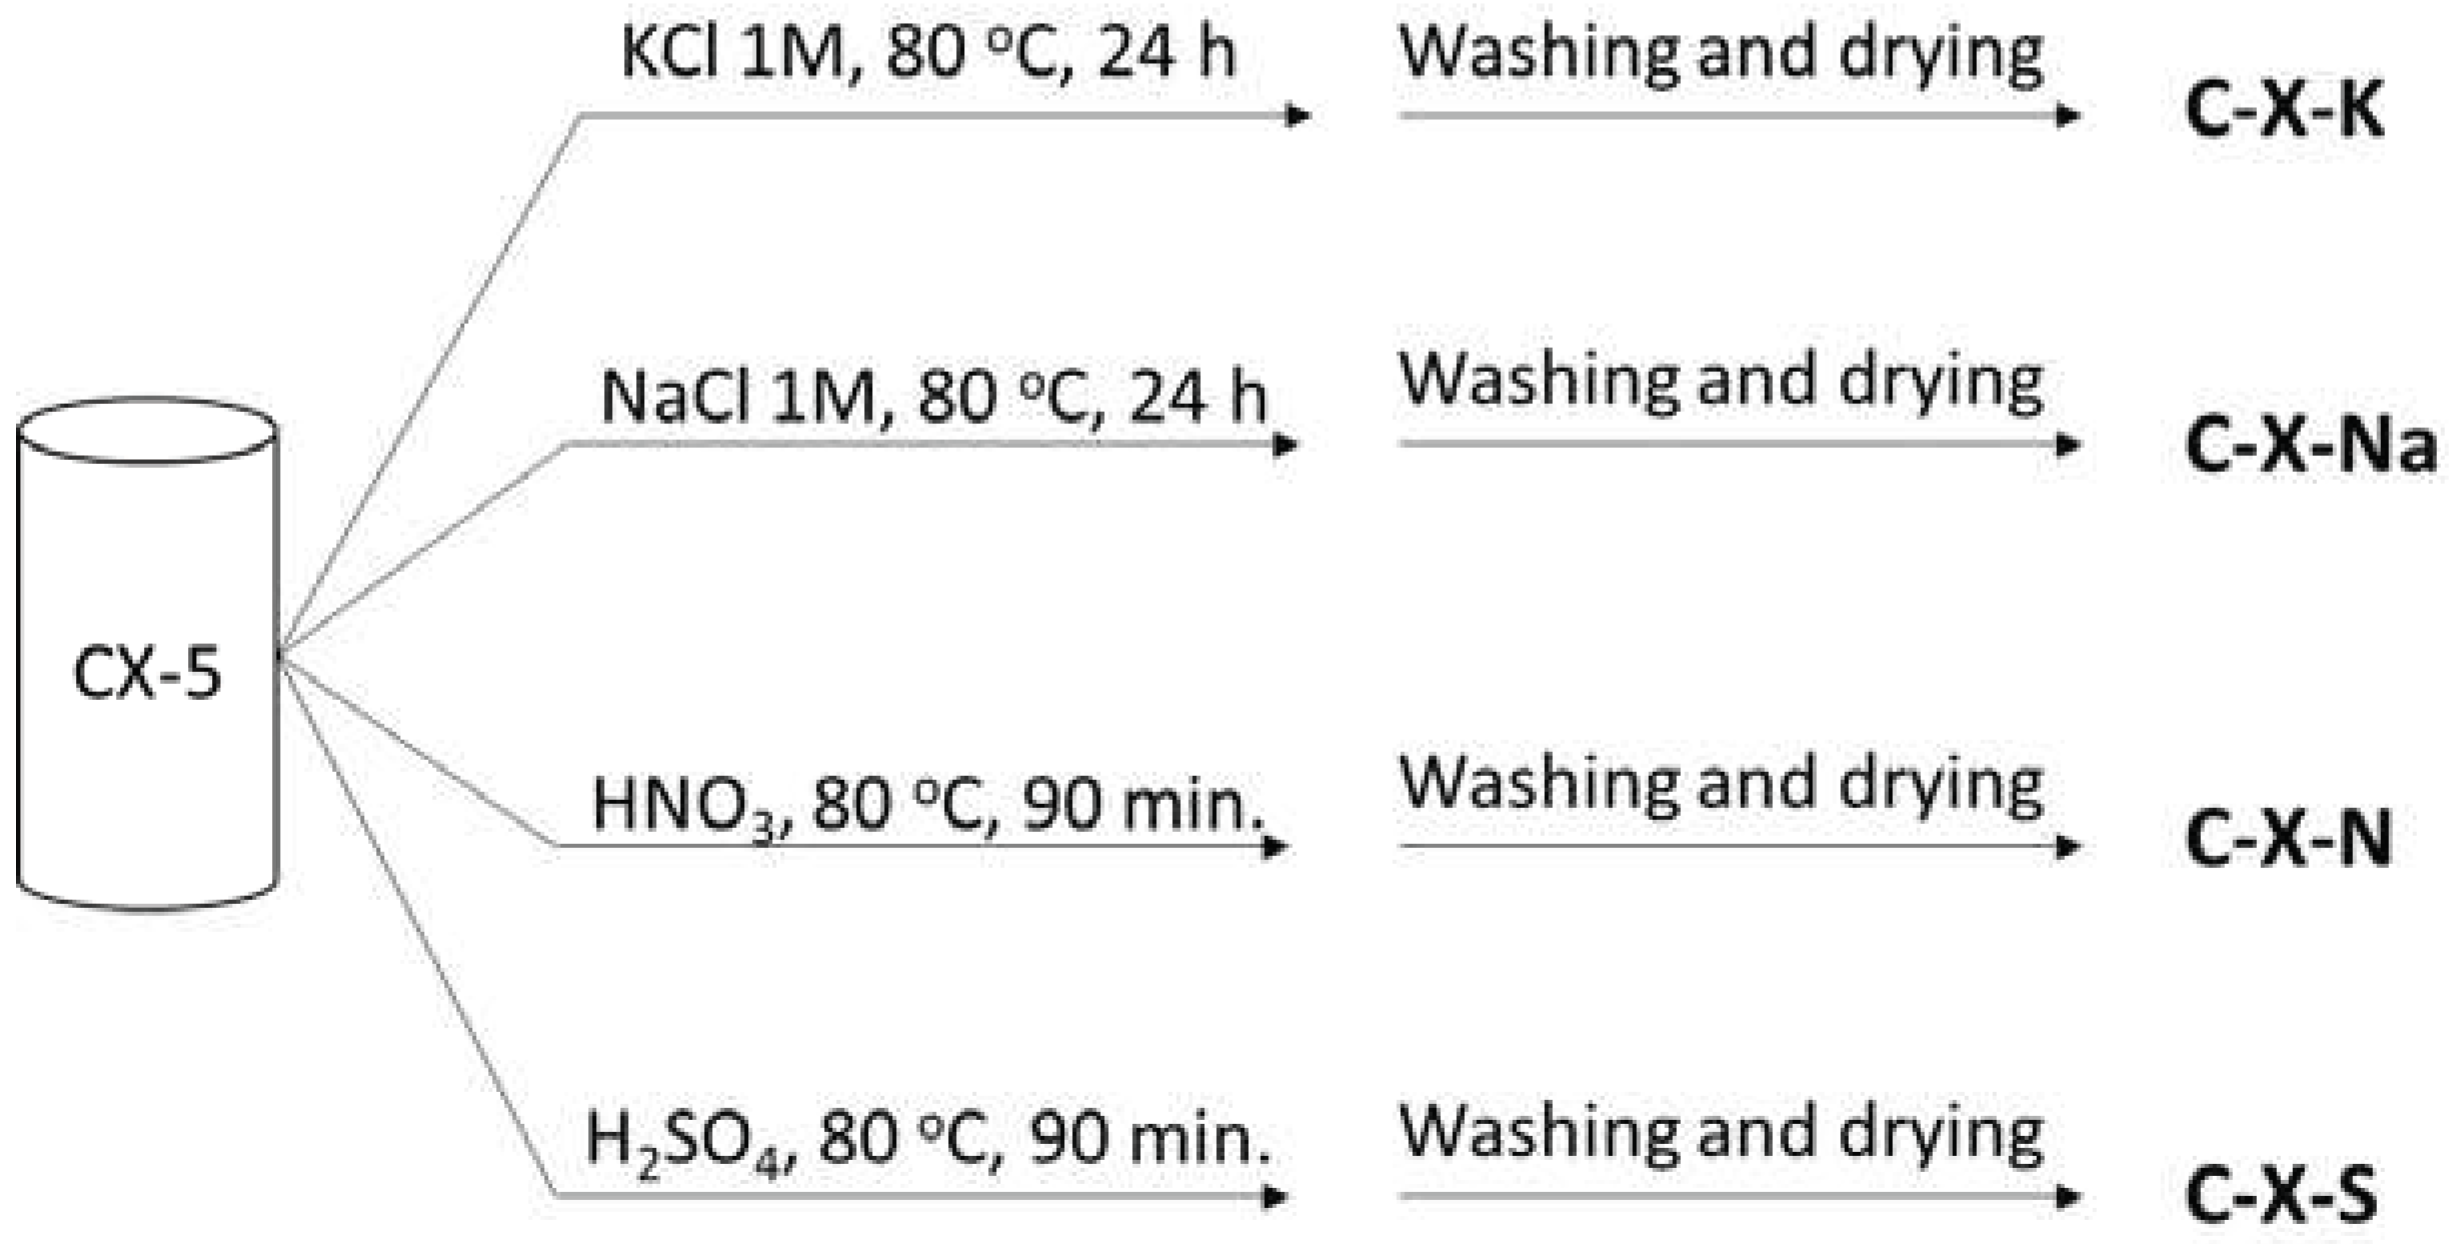
Figure 1.
FT-IR spectra.
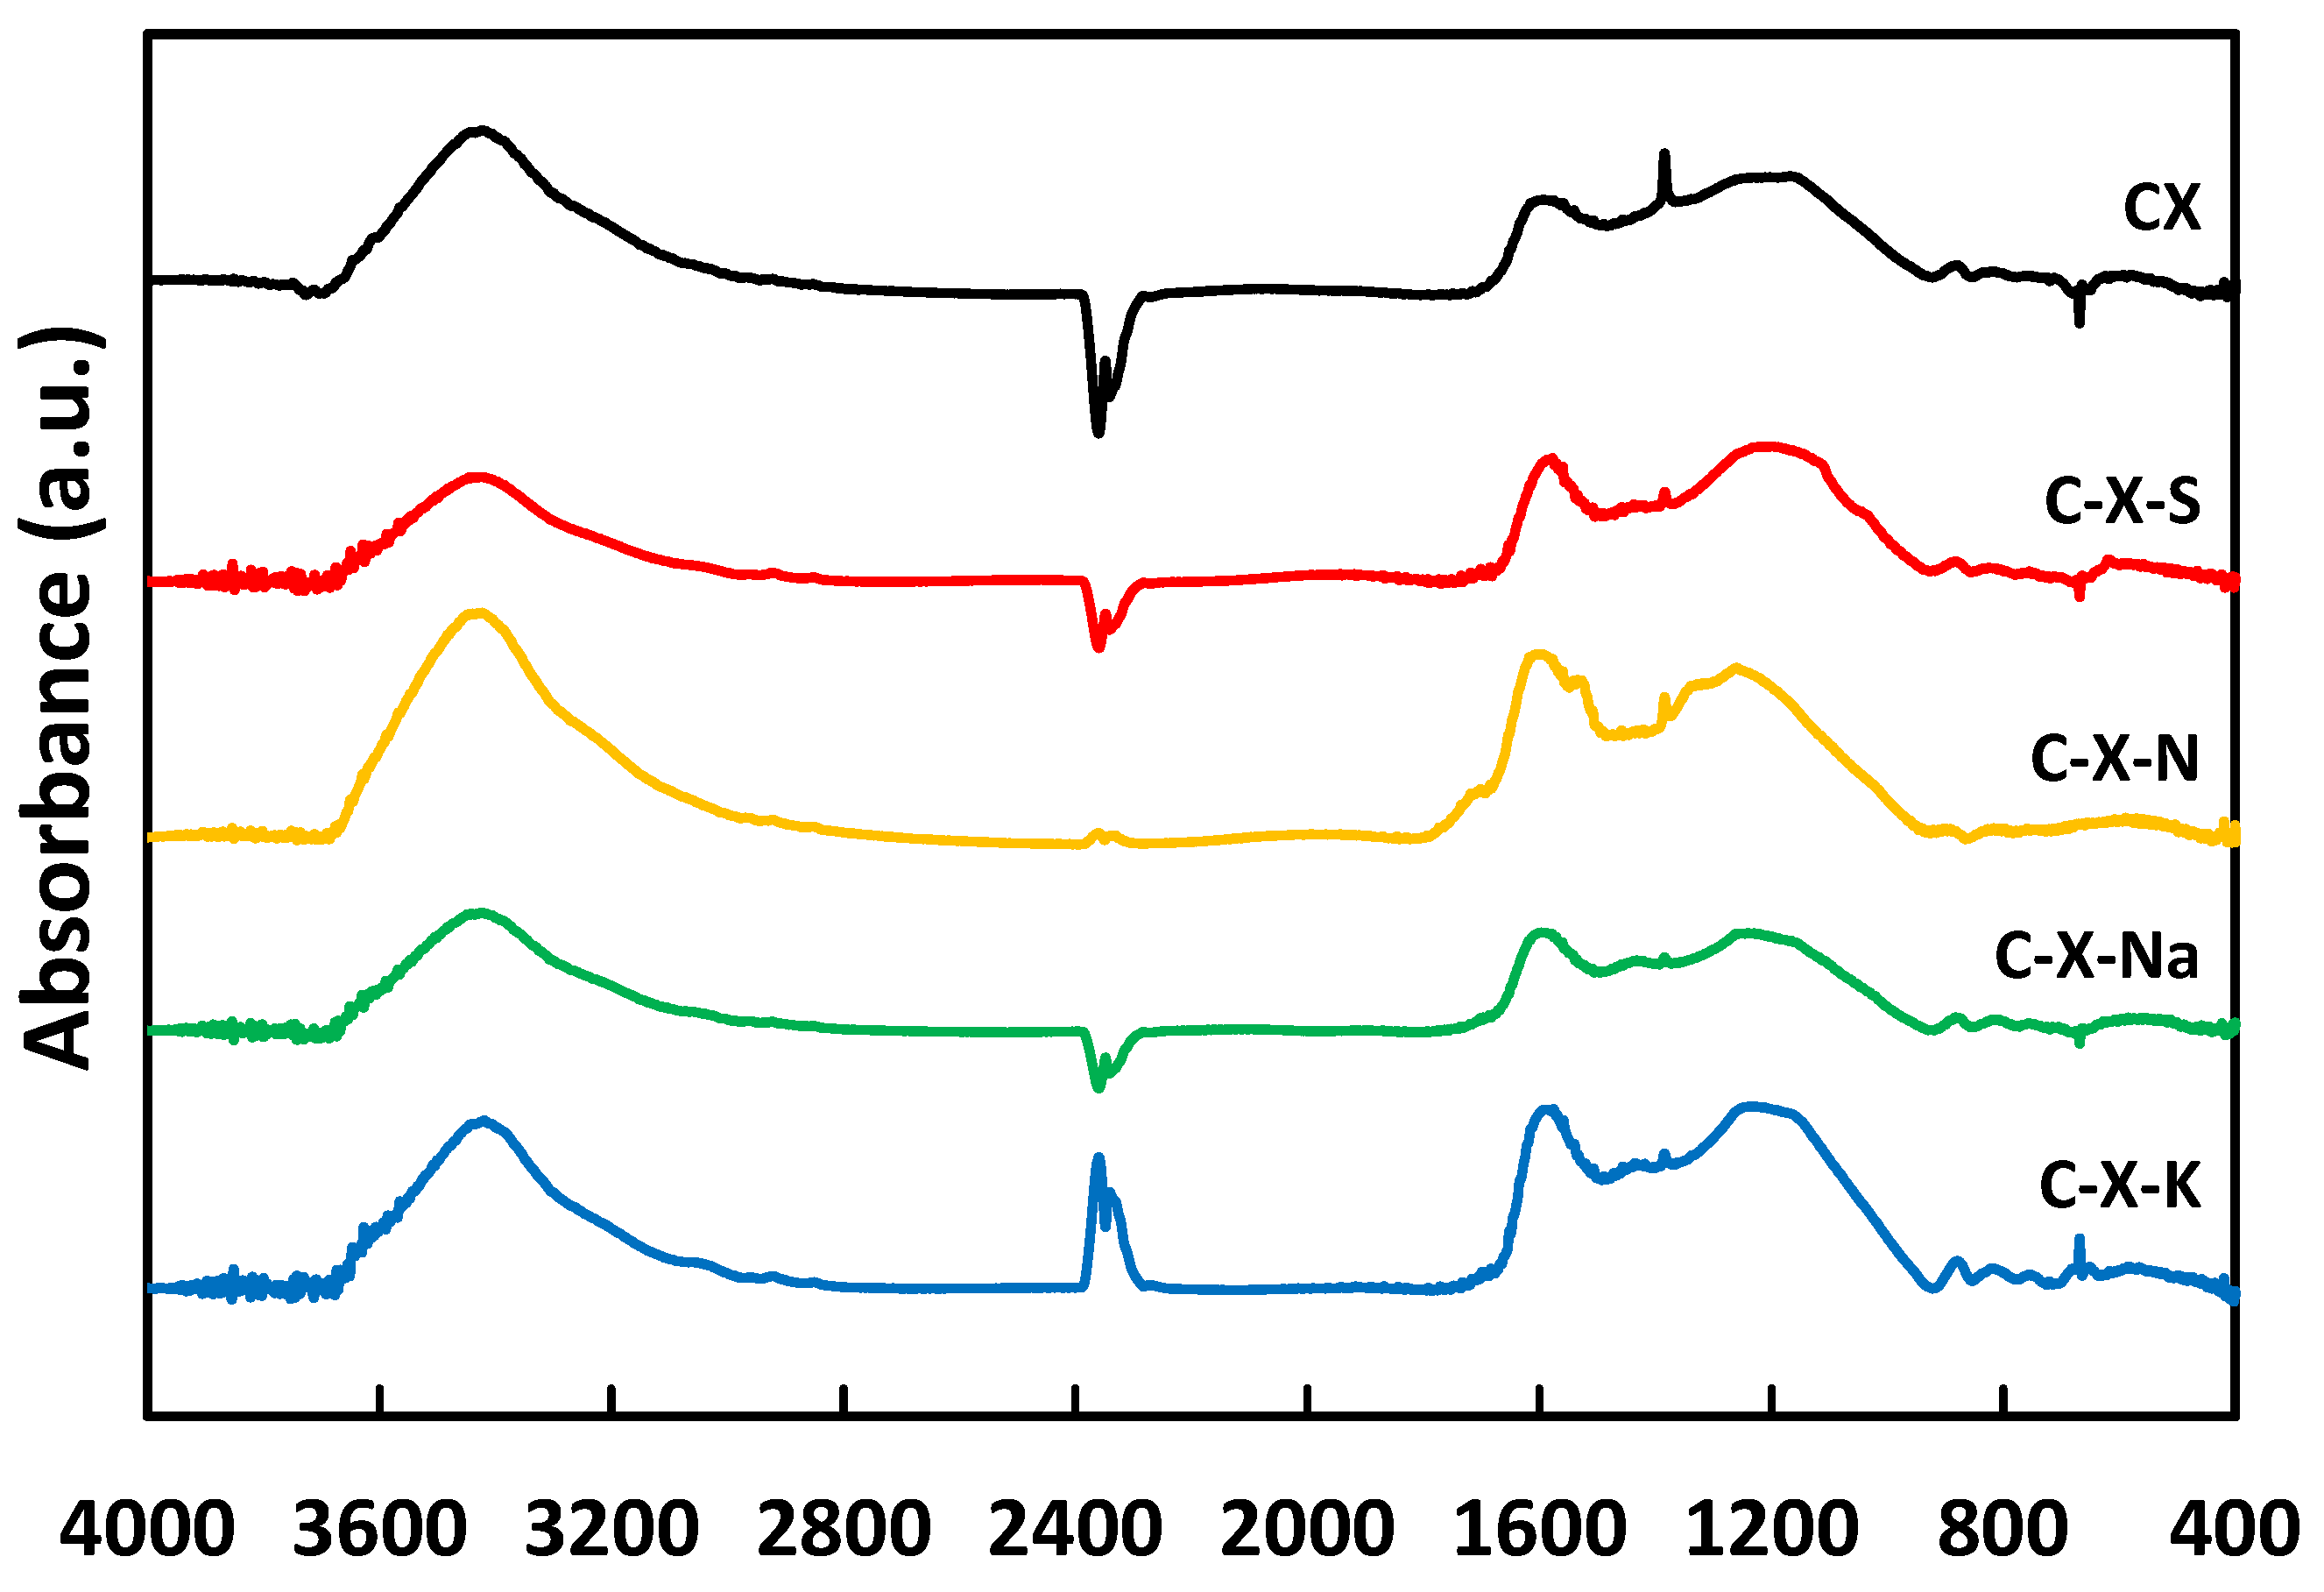
Figure 2.
FT-IR spectra of C-X-Na and before and after adsorption of gallic acid.
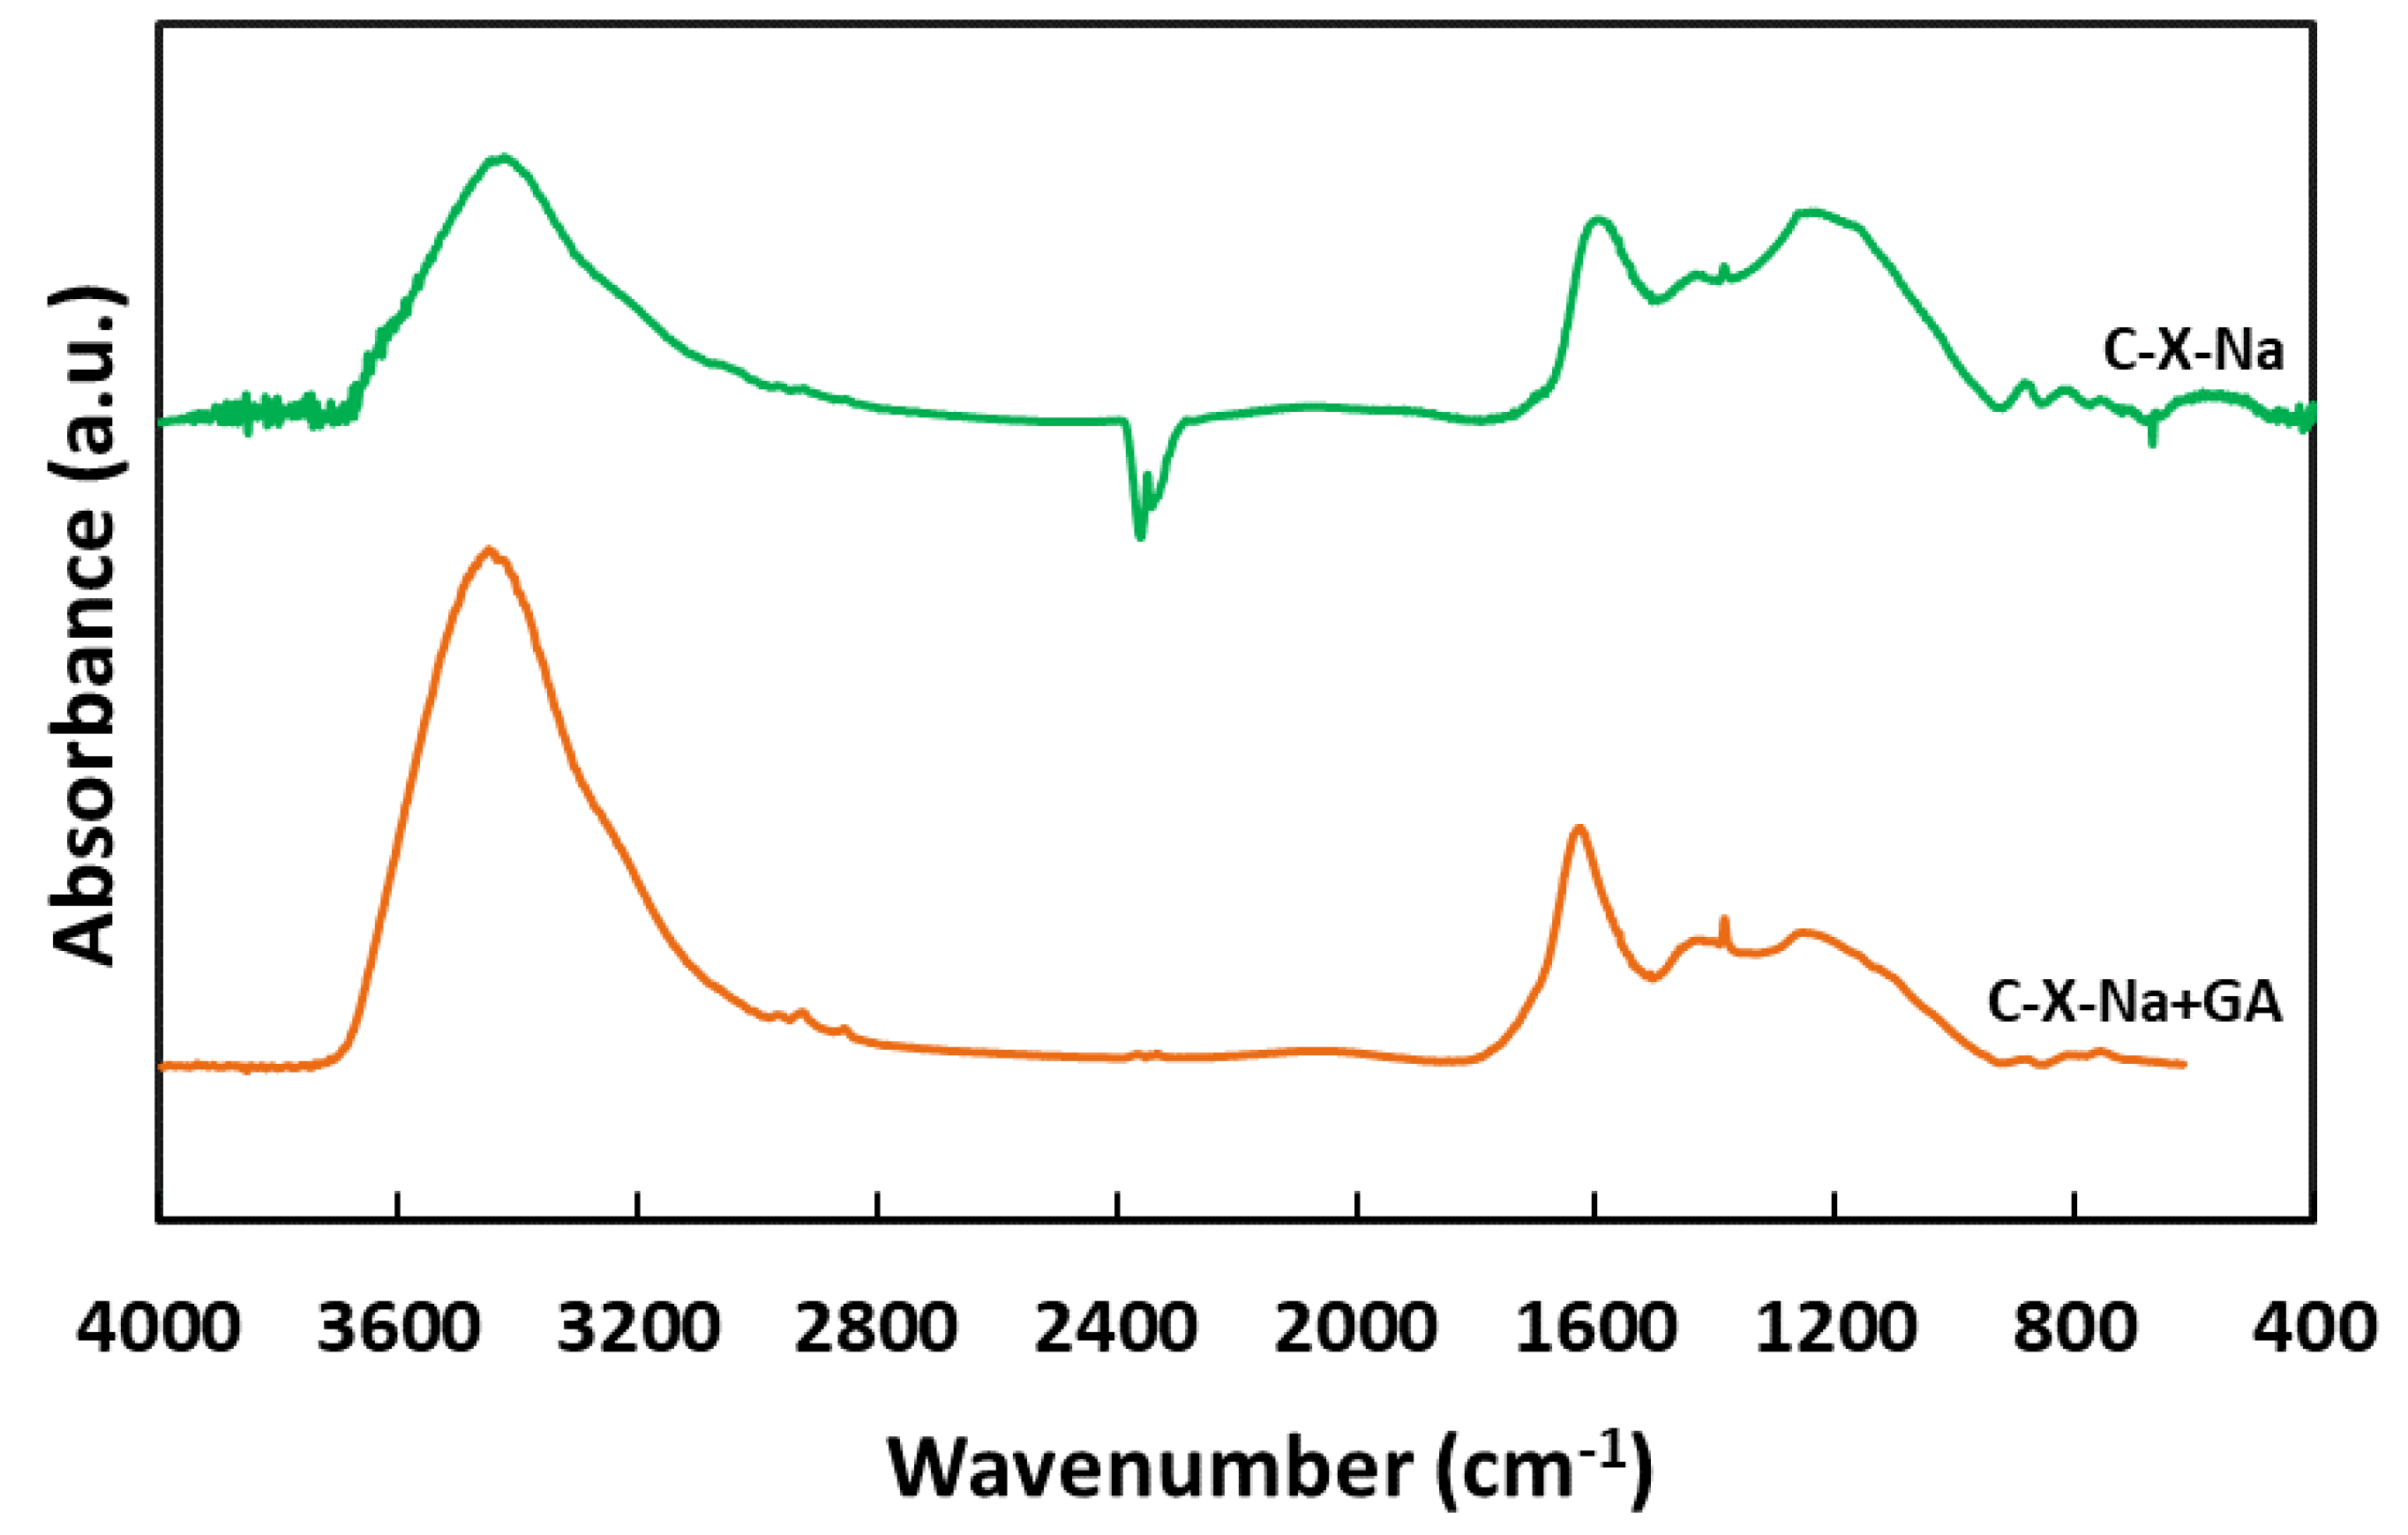
Figure 3.
XPS S 2p spectrum of C-X-S (black points) with deconvolution graph (green and blue, components; red, sum of components).
Figure 3.
XPS S 2p spectrum of C-X-S (black points) with deconvolution graph (green and blue, components; red, sum of components).
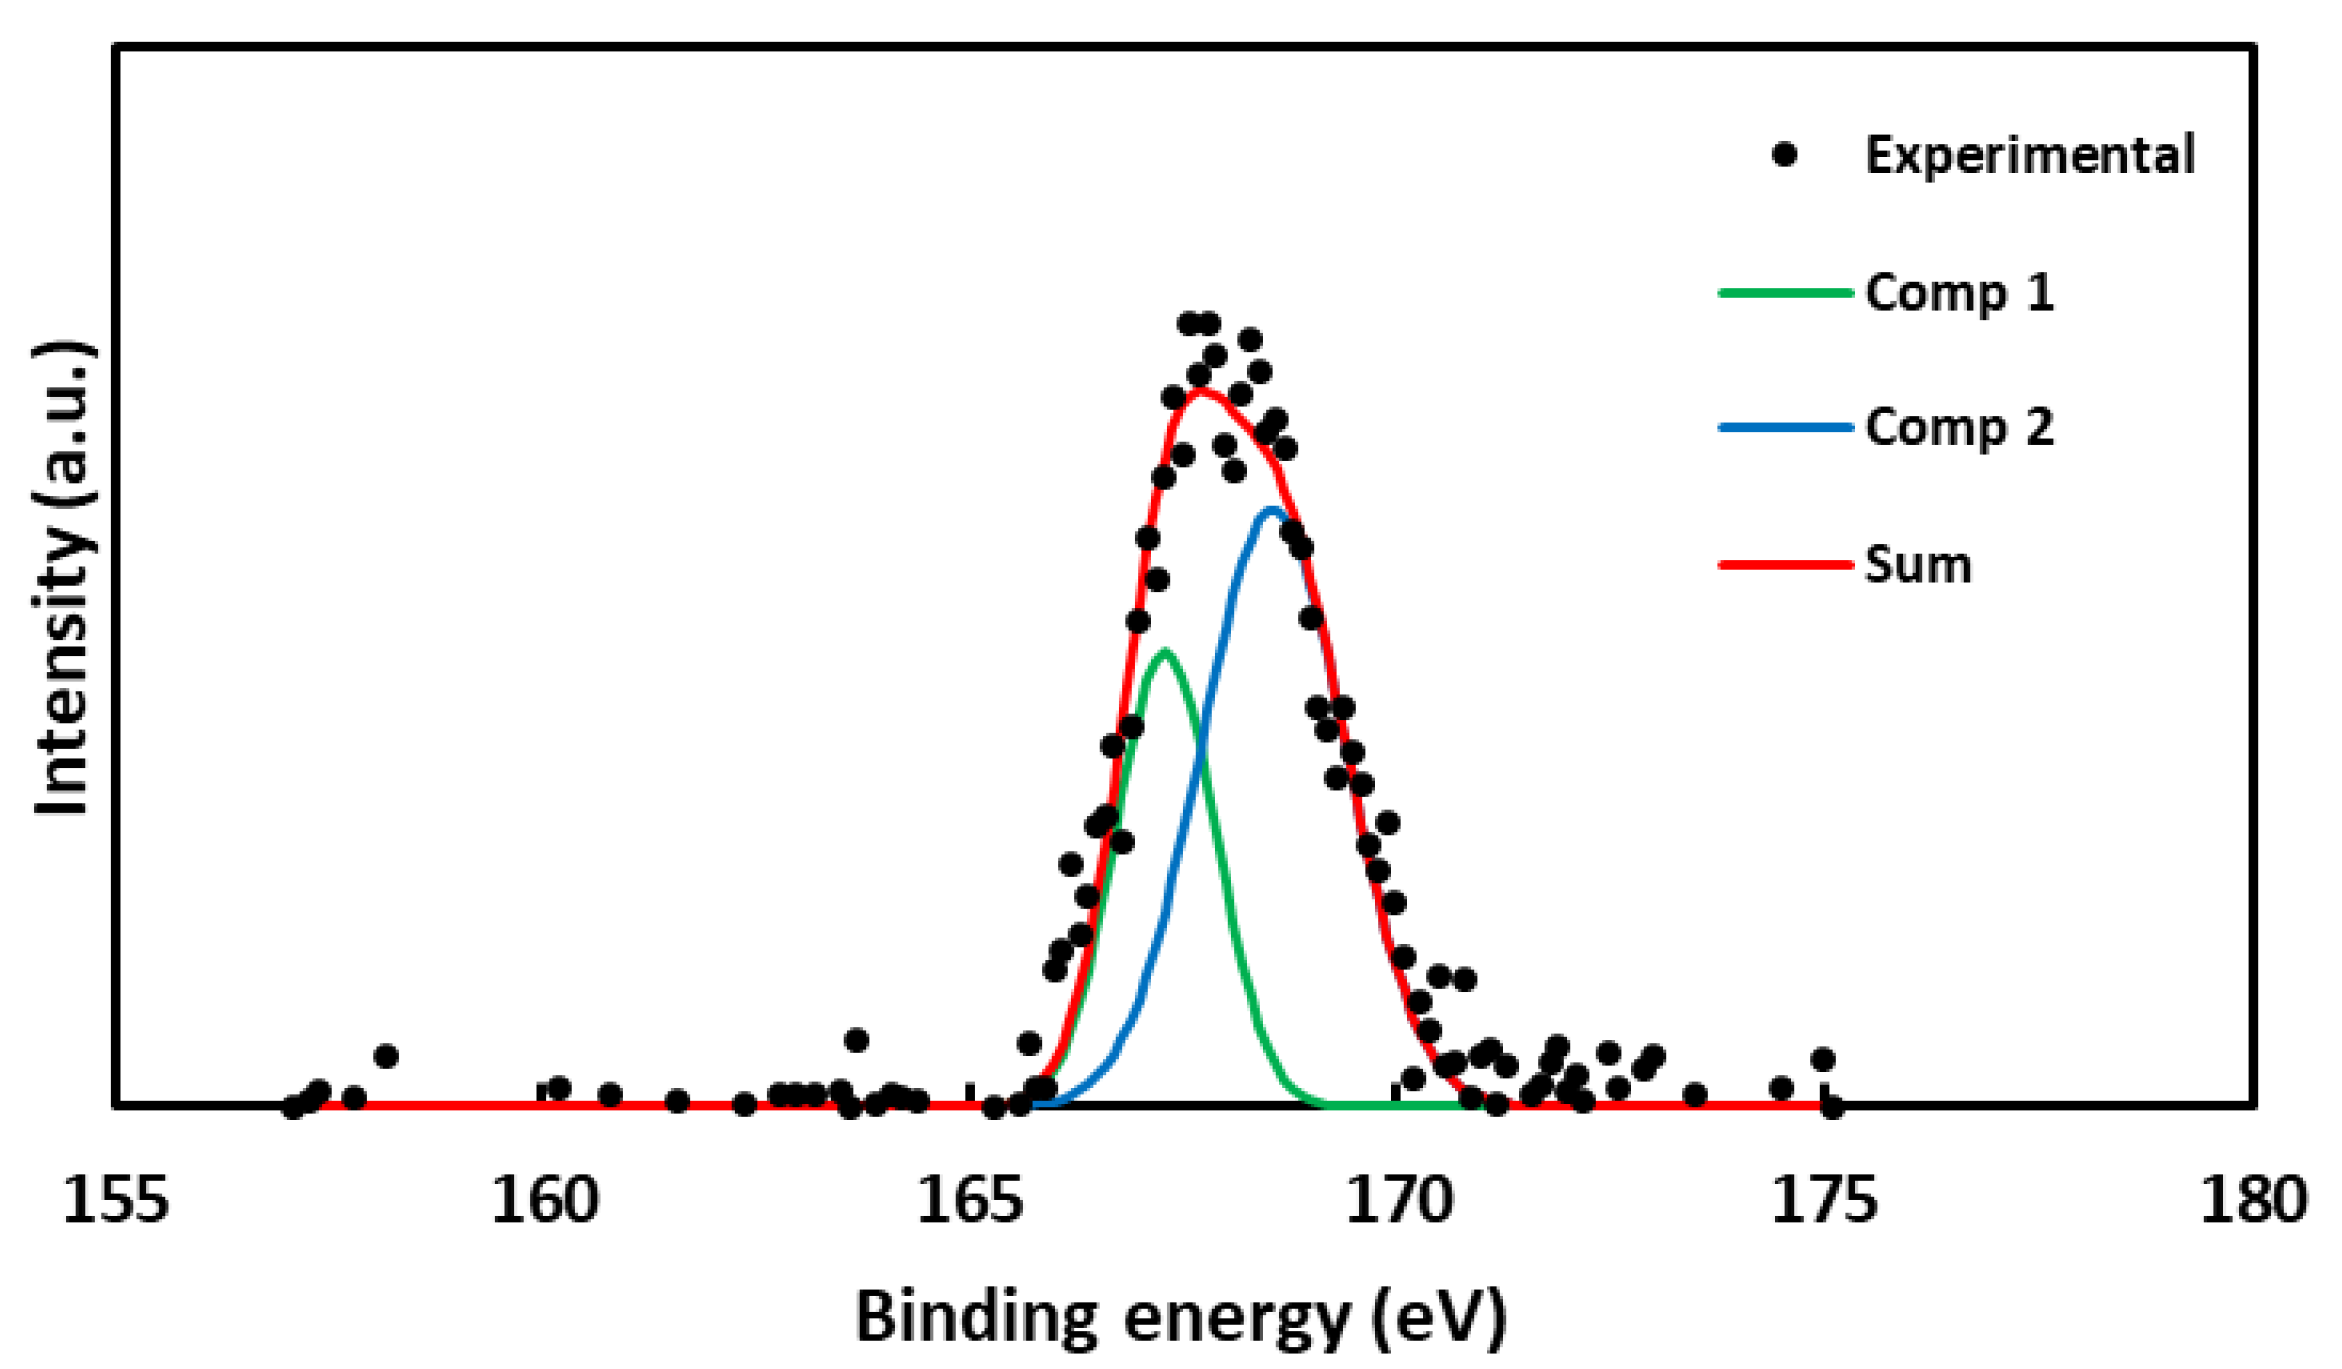
Figure 4.
XPS N 1s spectrum of C-X-N(black points) with deconvolution graph (green and blue, components; red, sum of components).
Figure 4.
XPS N 1s spectrum of C-X-N(black points) with deconvolution graph (green and blue, components; red, sum of components).
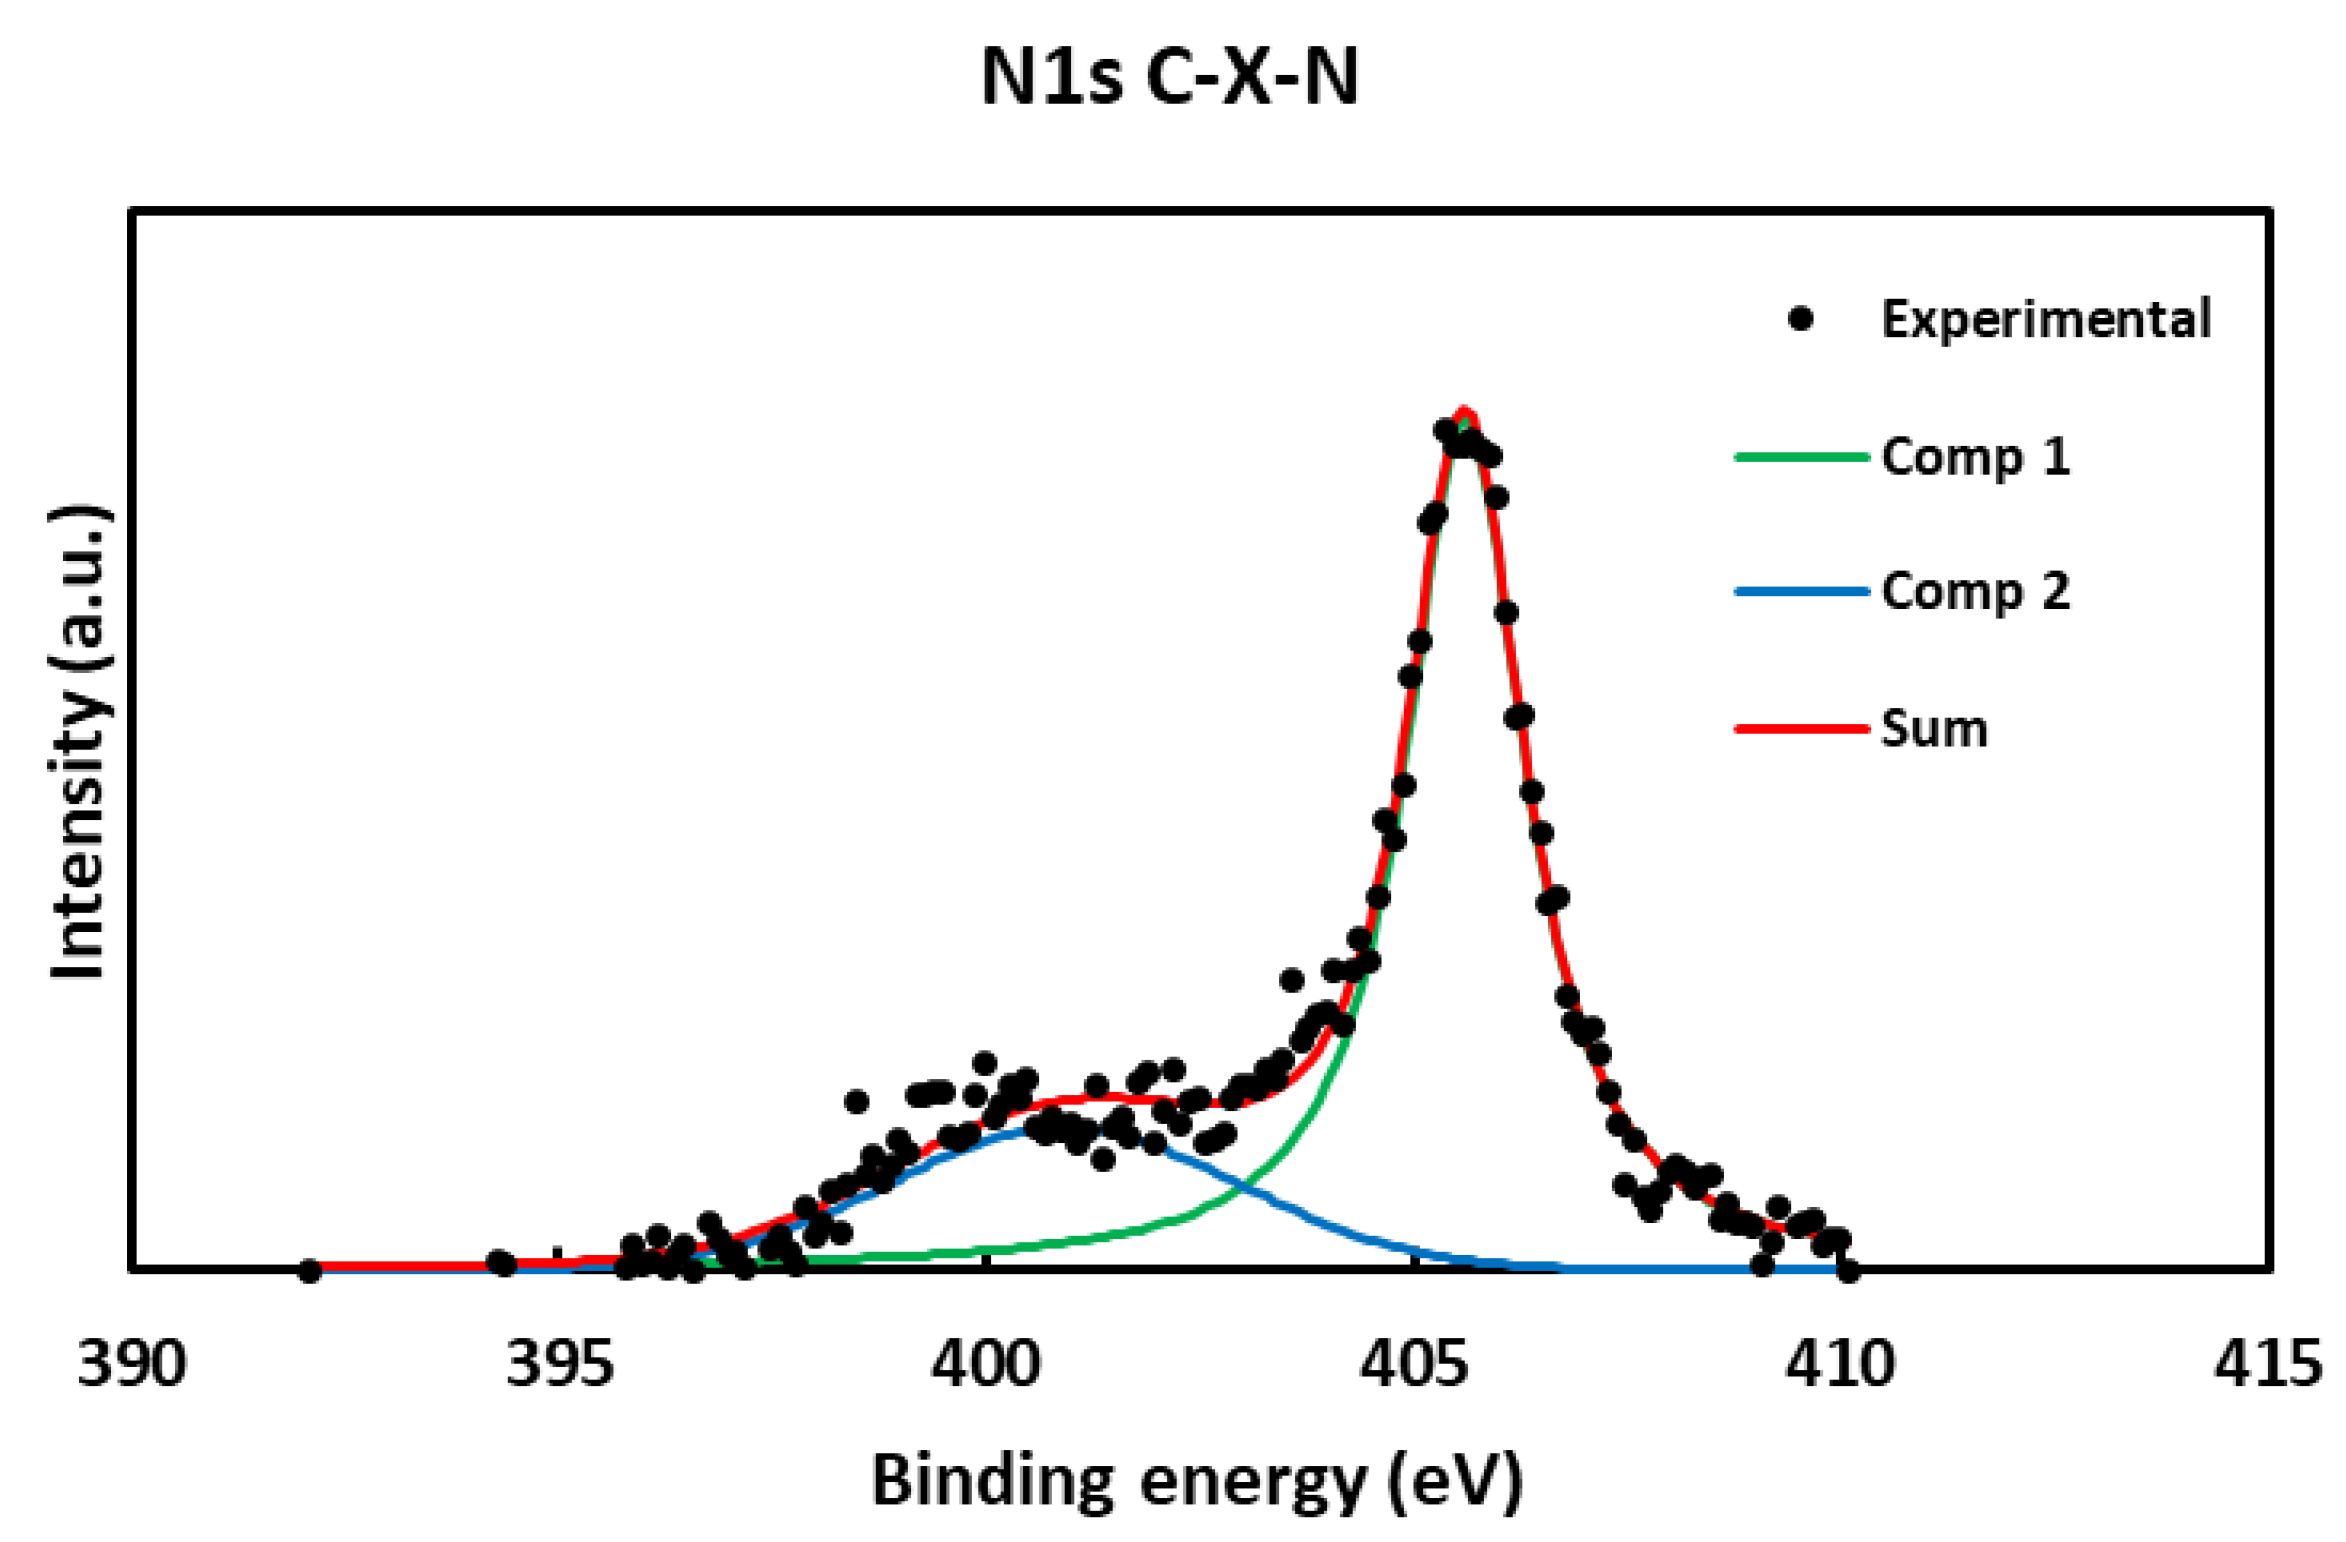
Figure 5.
Adsorption isotherms of N2 a -196 °C.
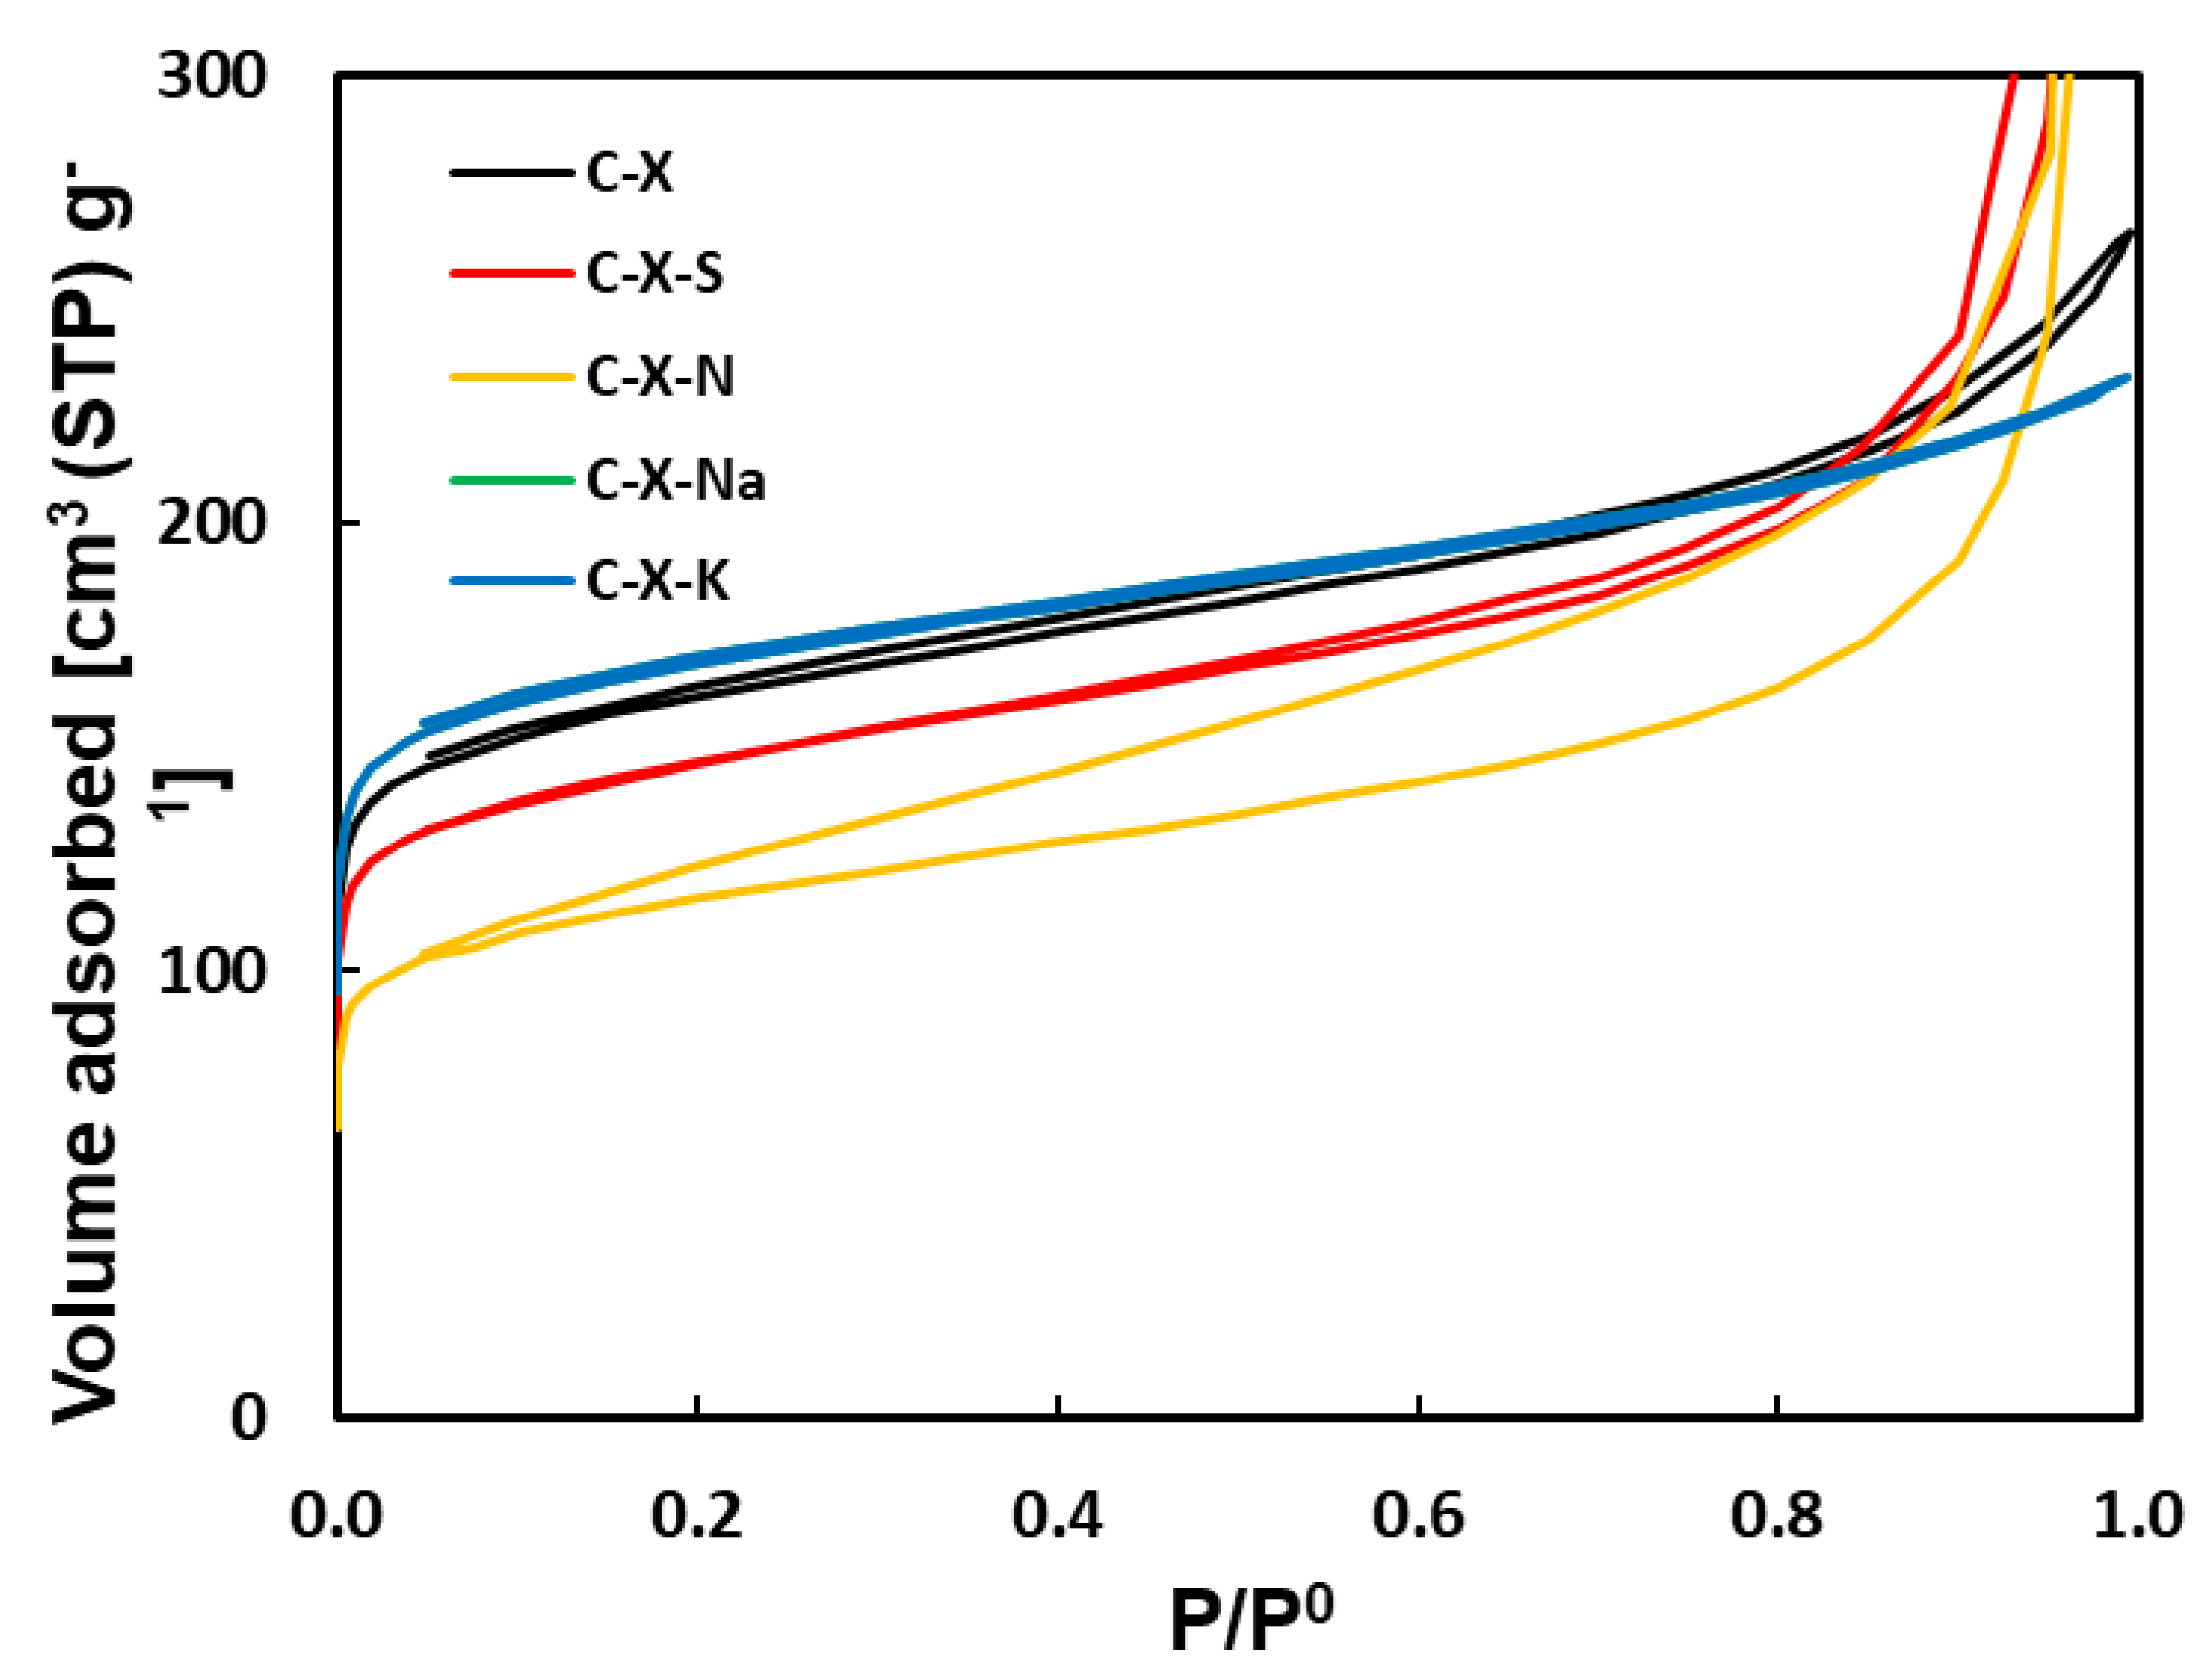
Figure 6.
Curves of mercury intrusion.
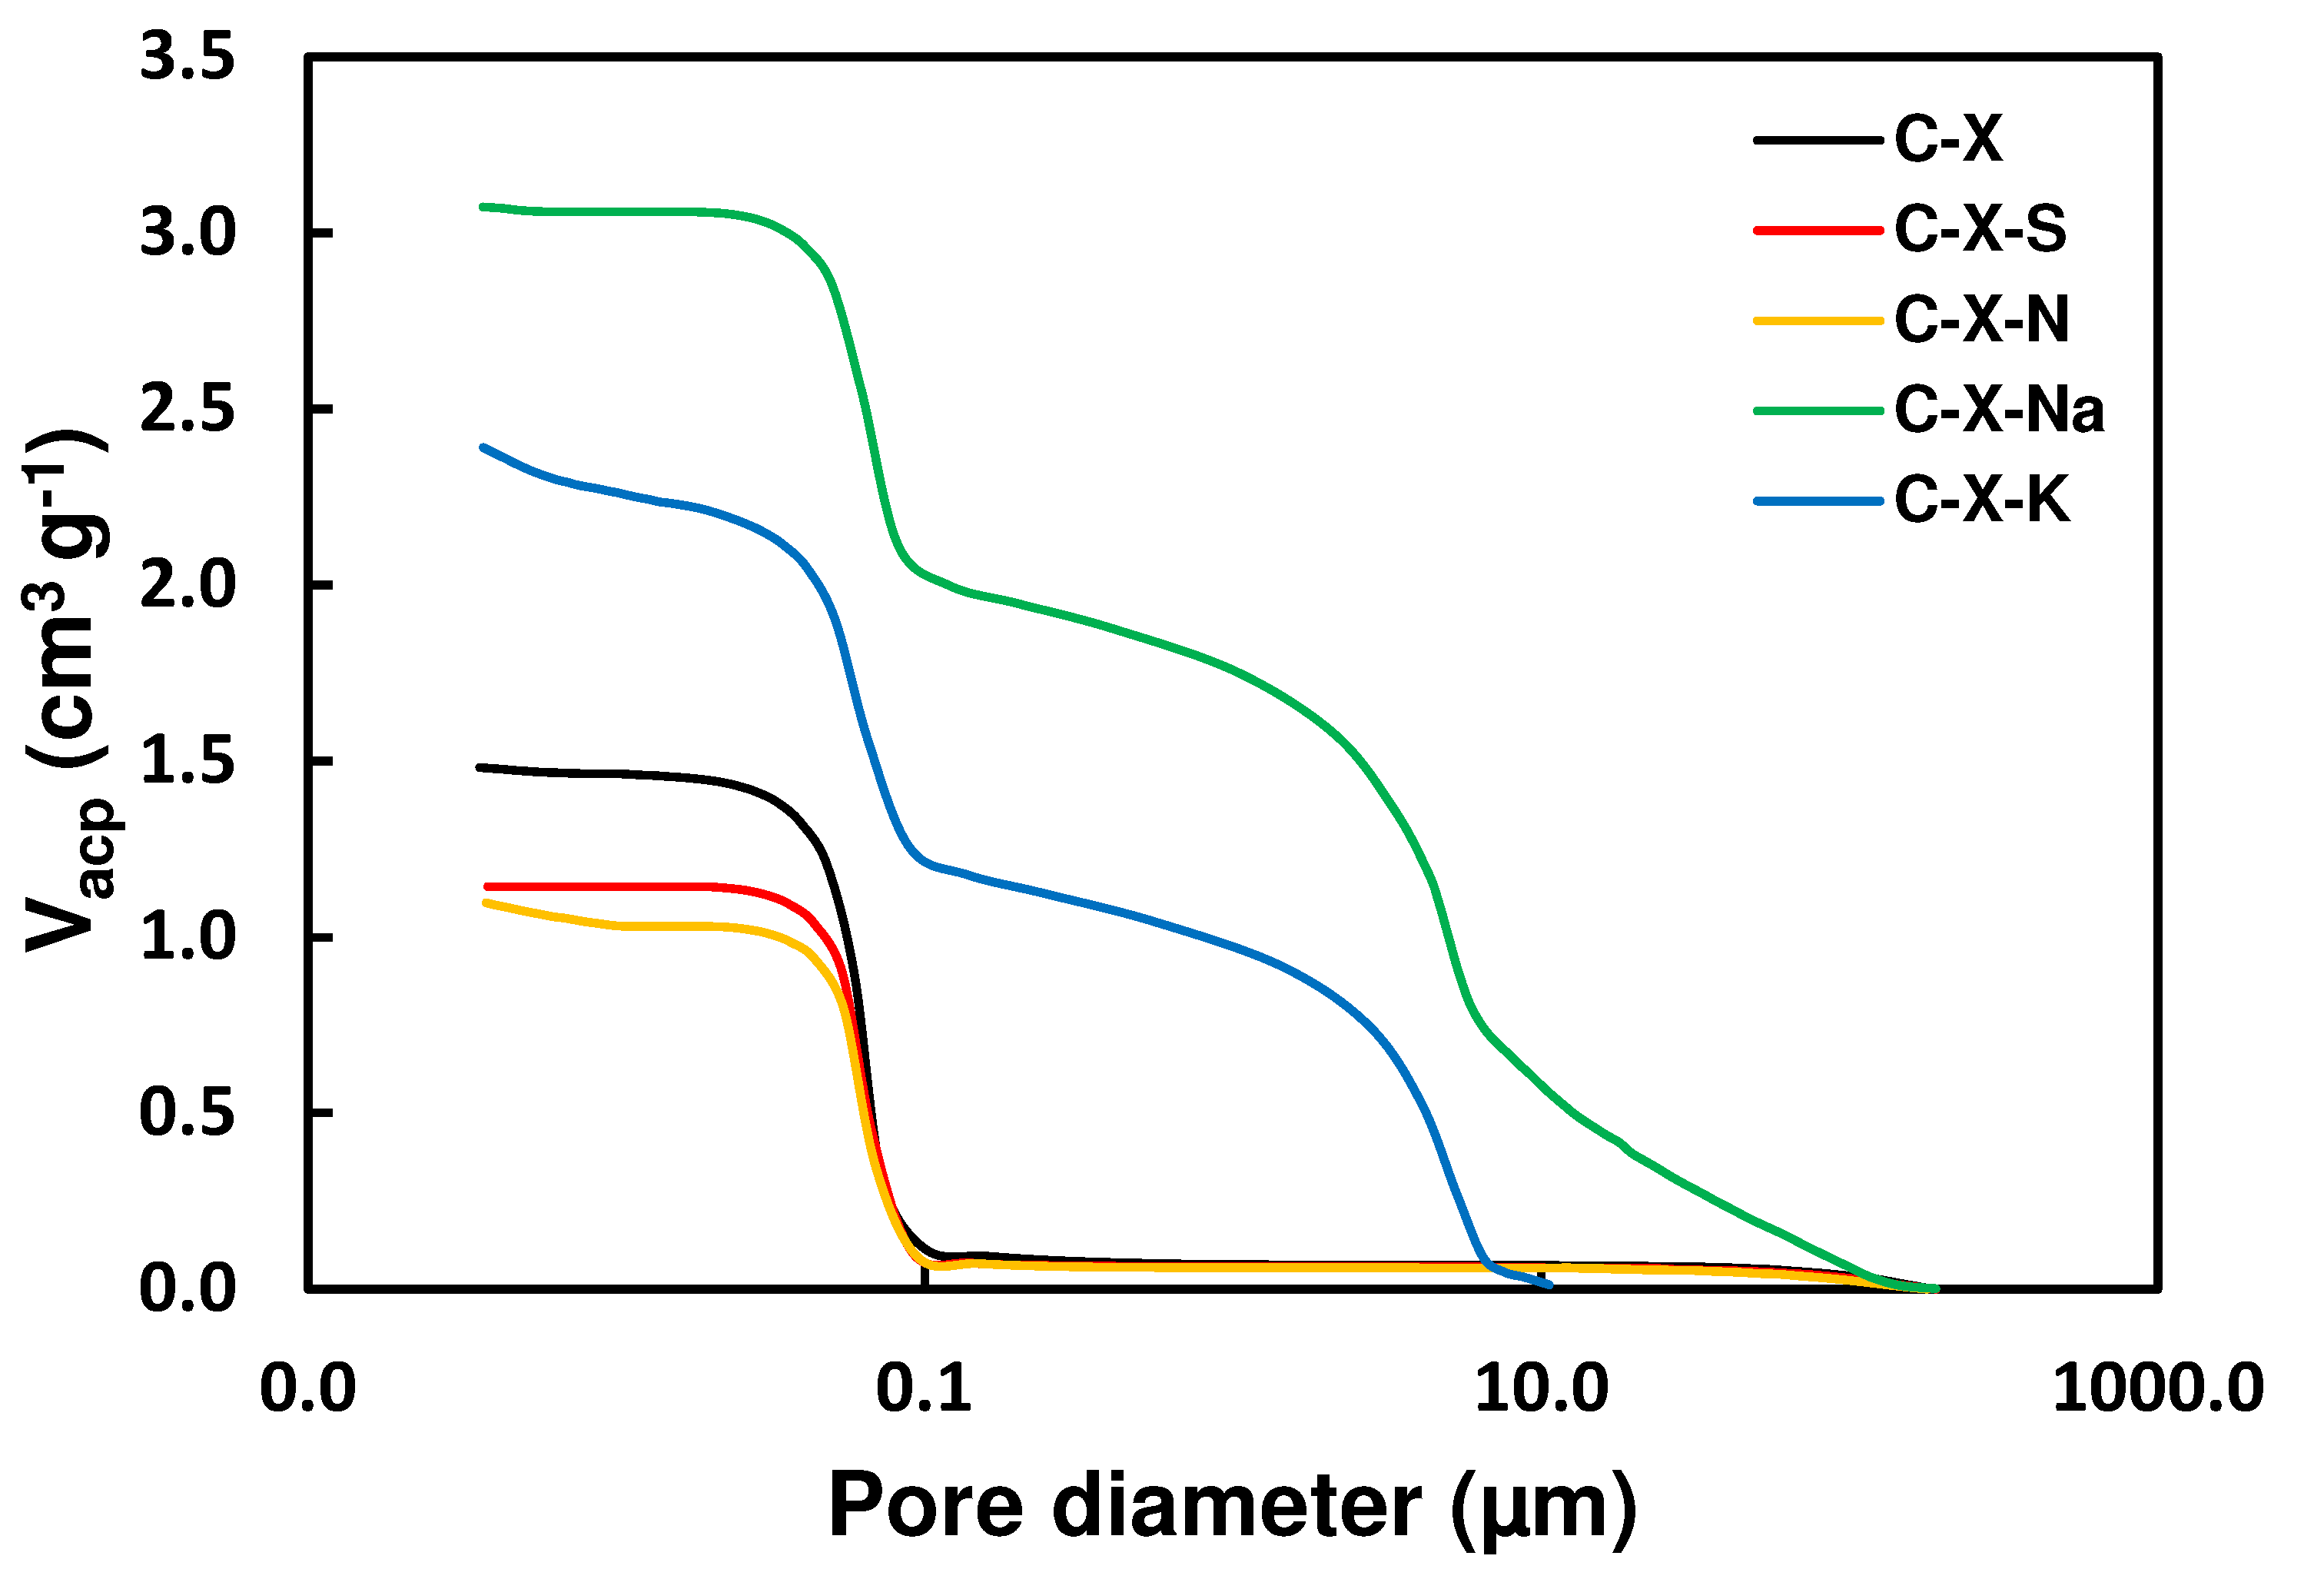
Figure 7.
Pore diameter distribution.
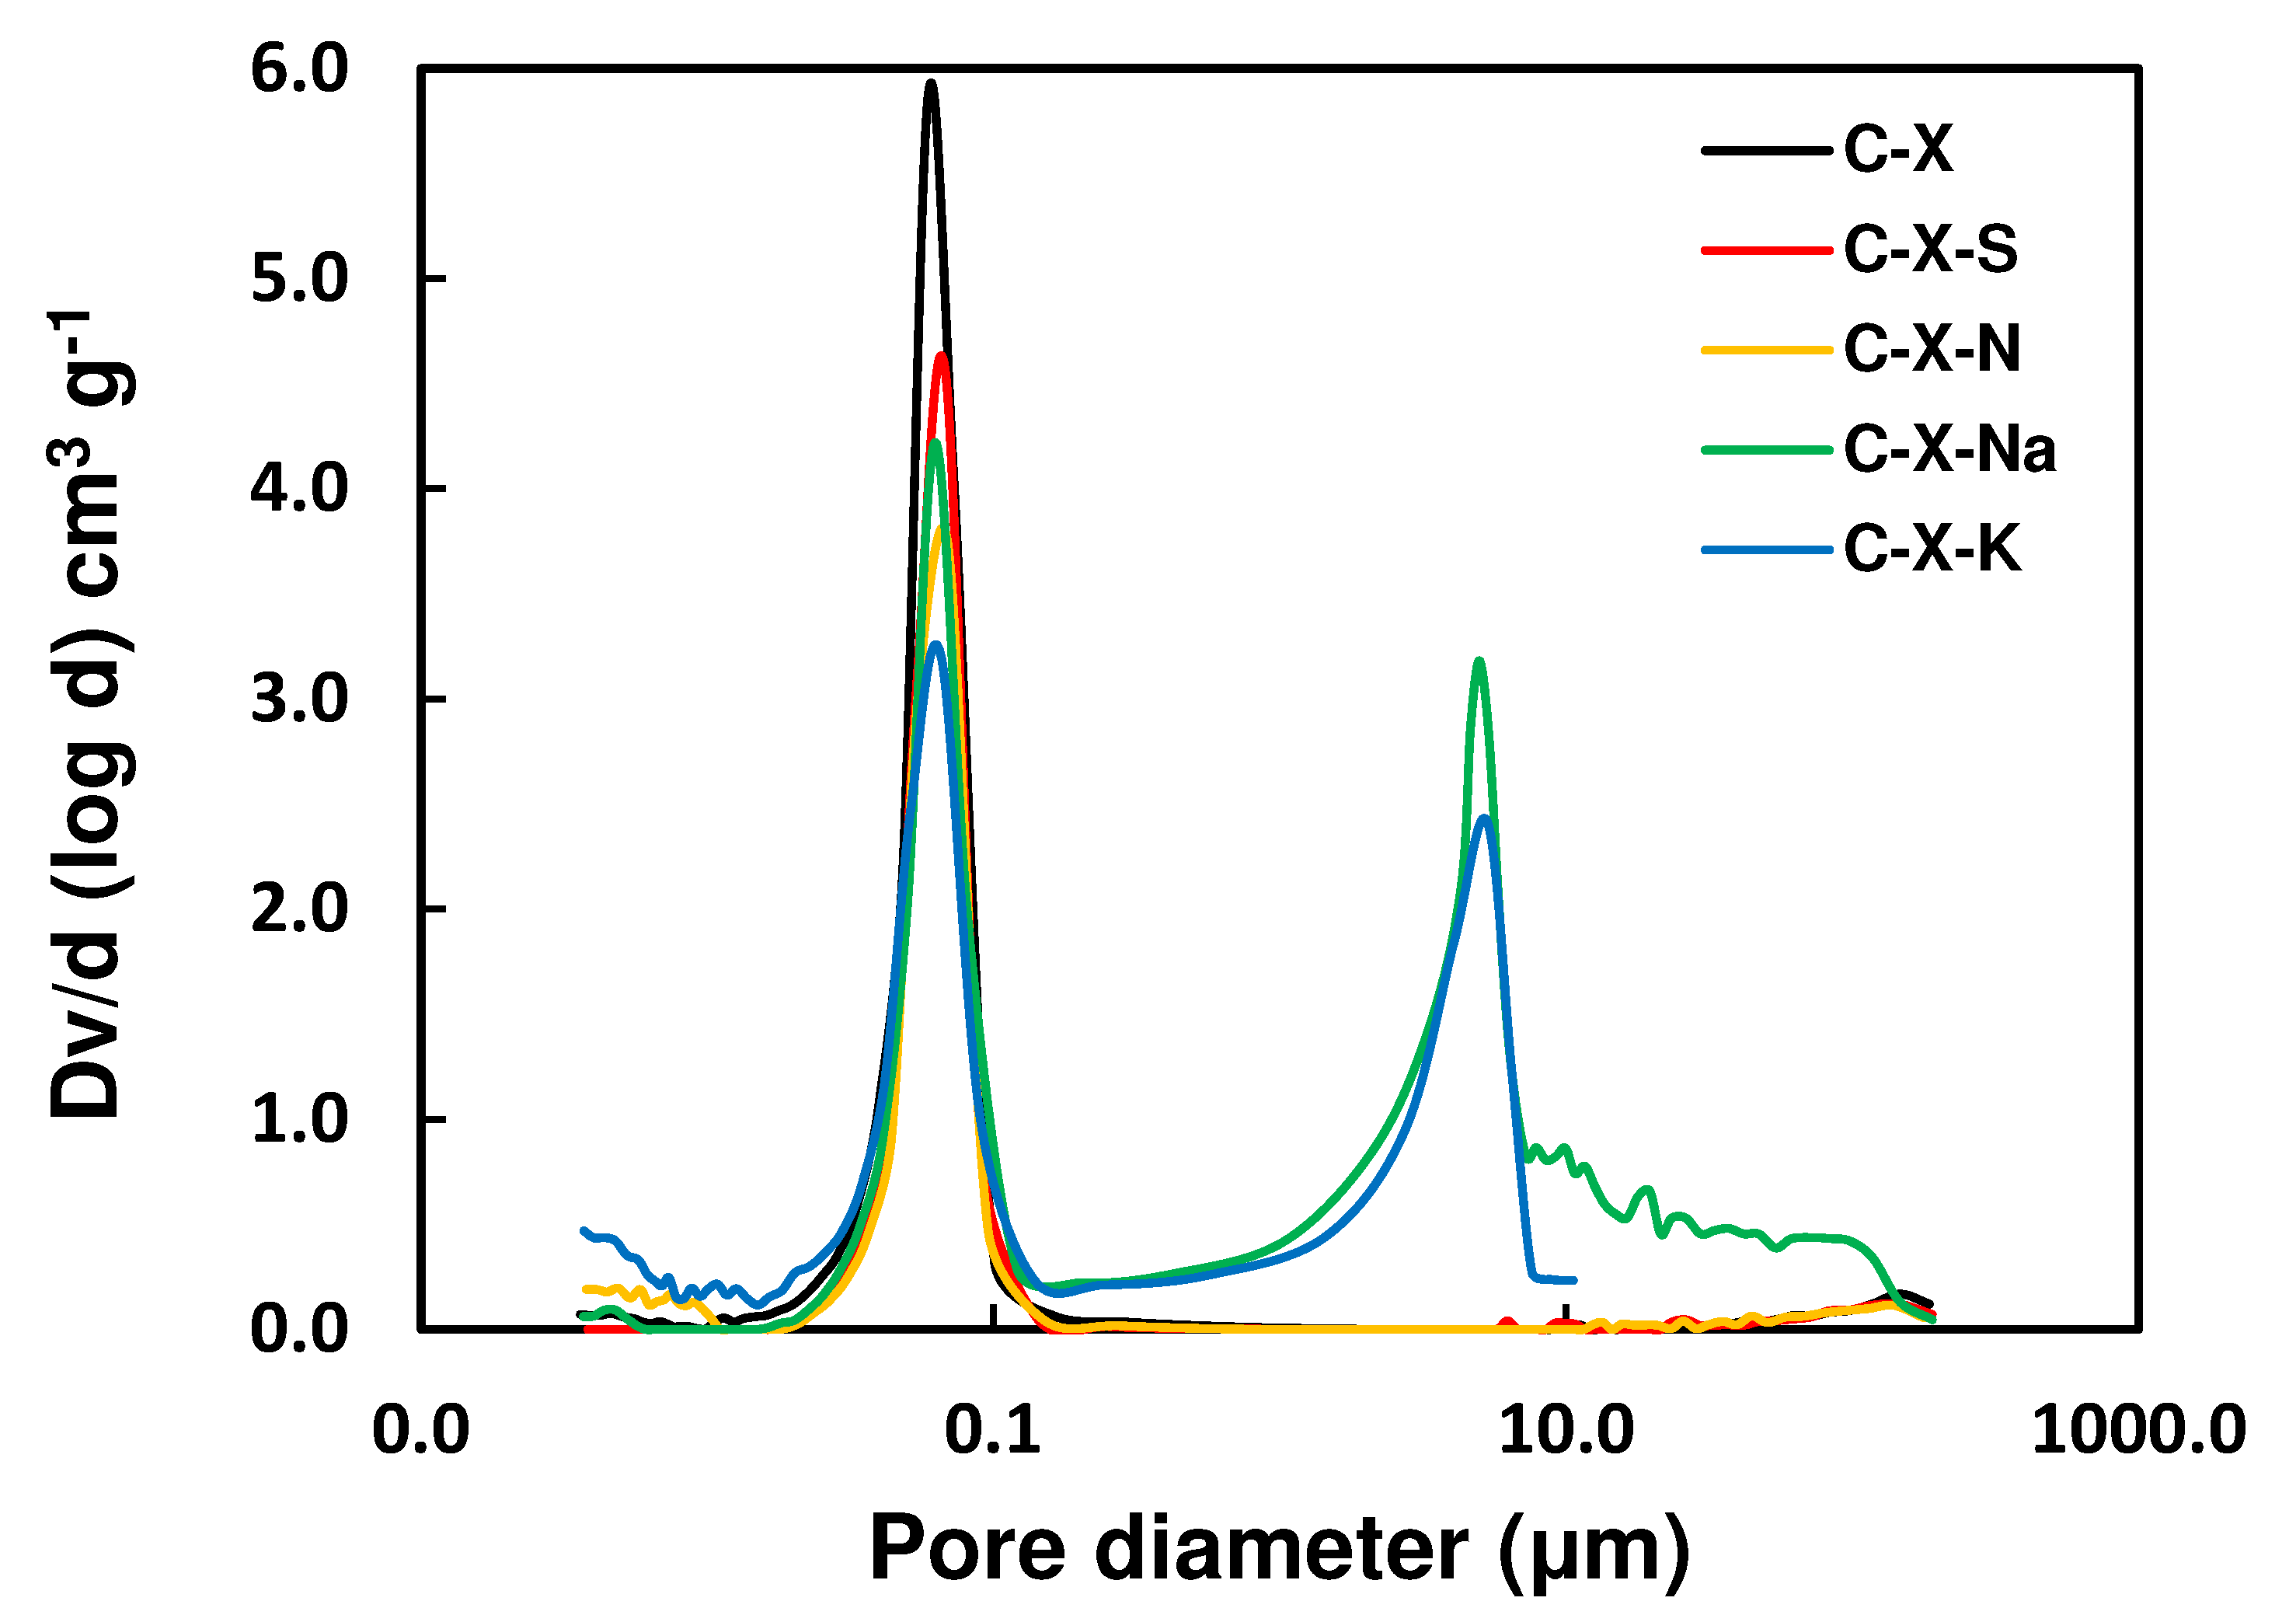
Figure 8.
Adsorption kinetics of gallic acid on the adsorbents prepared. Interval of error in measurements: ±2.5%.
Figure 8.
Adsorption kinetics of gallic acid on the adsorbents prepared. Interval of error in measurements: ±2.5%.
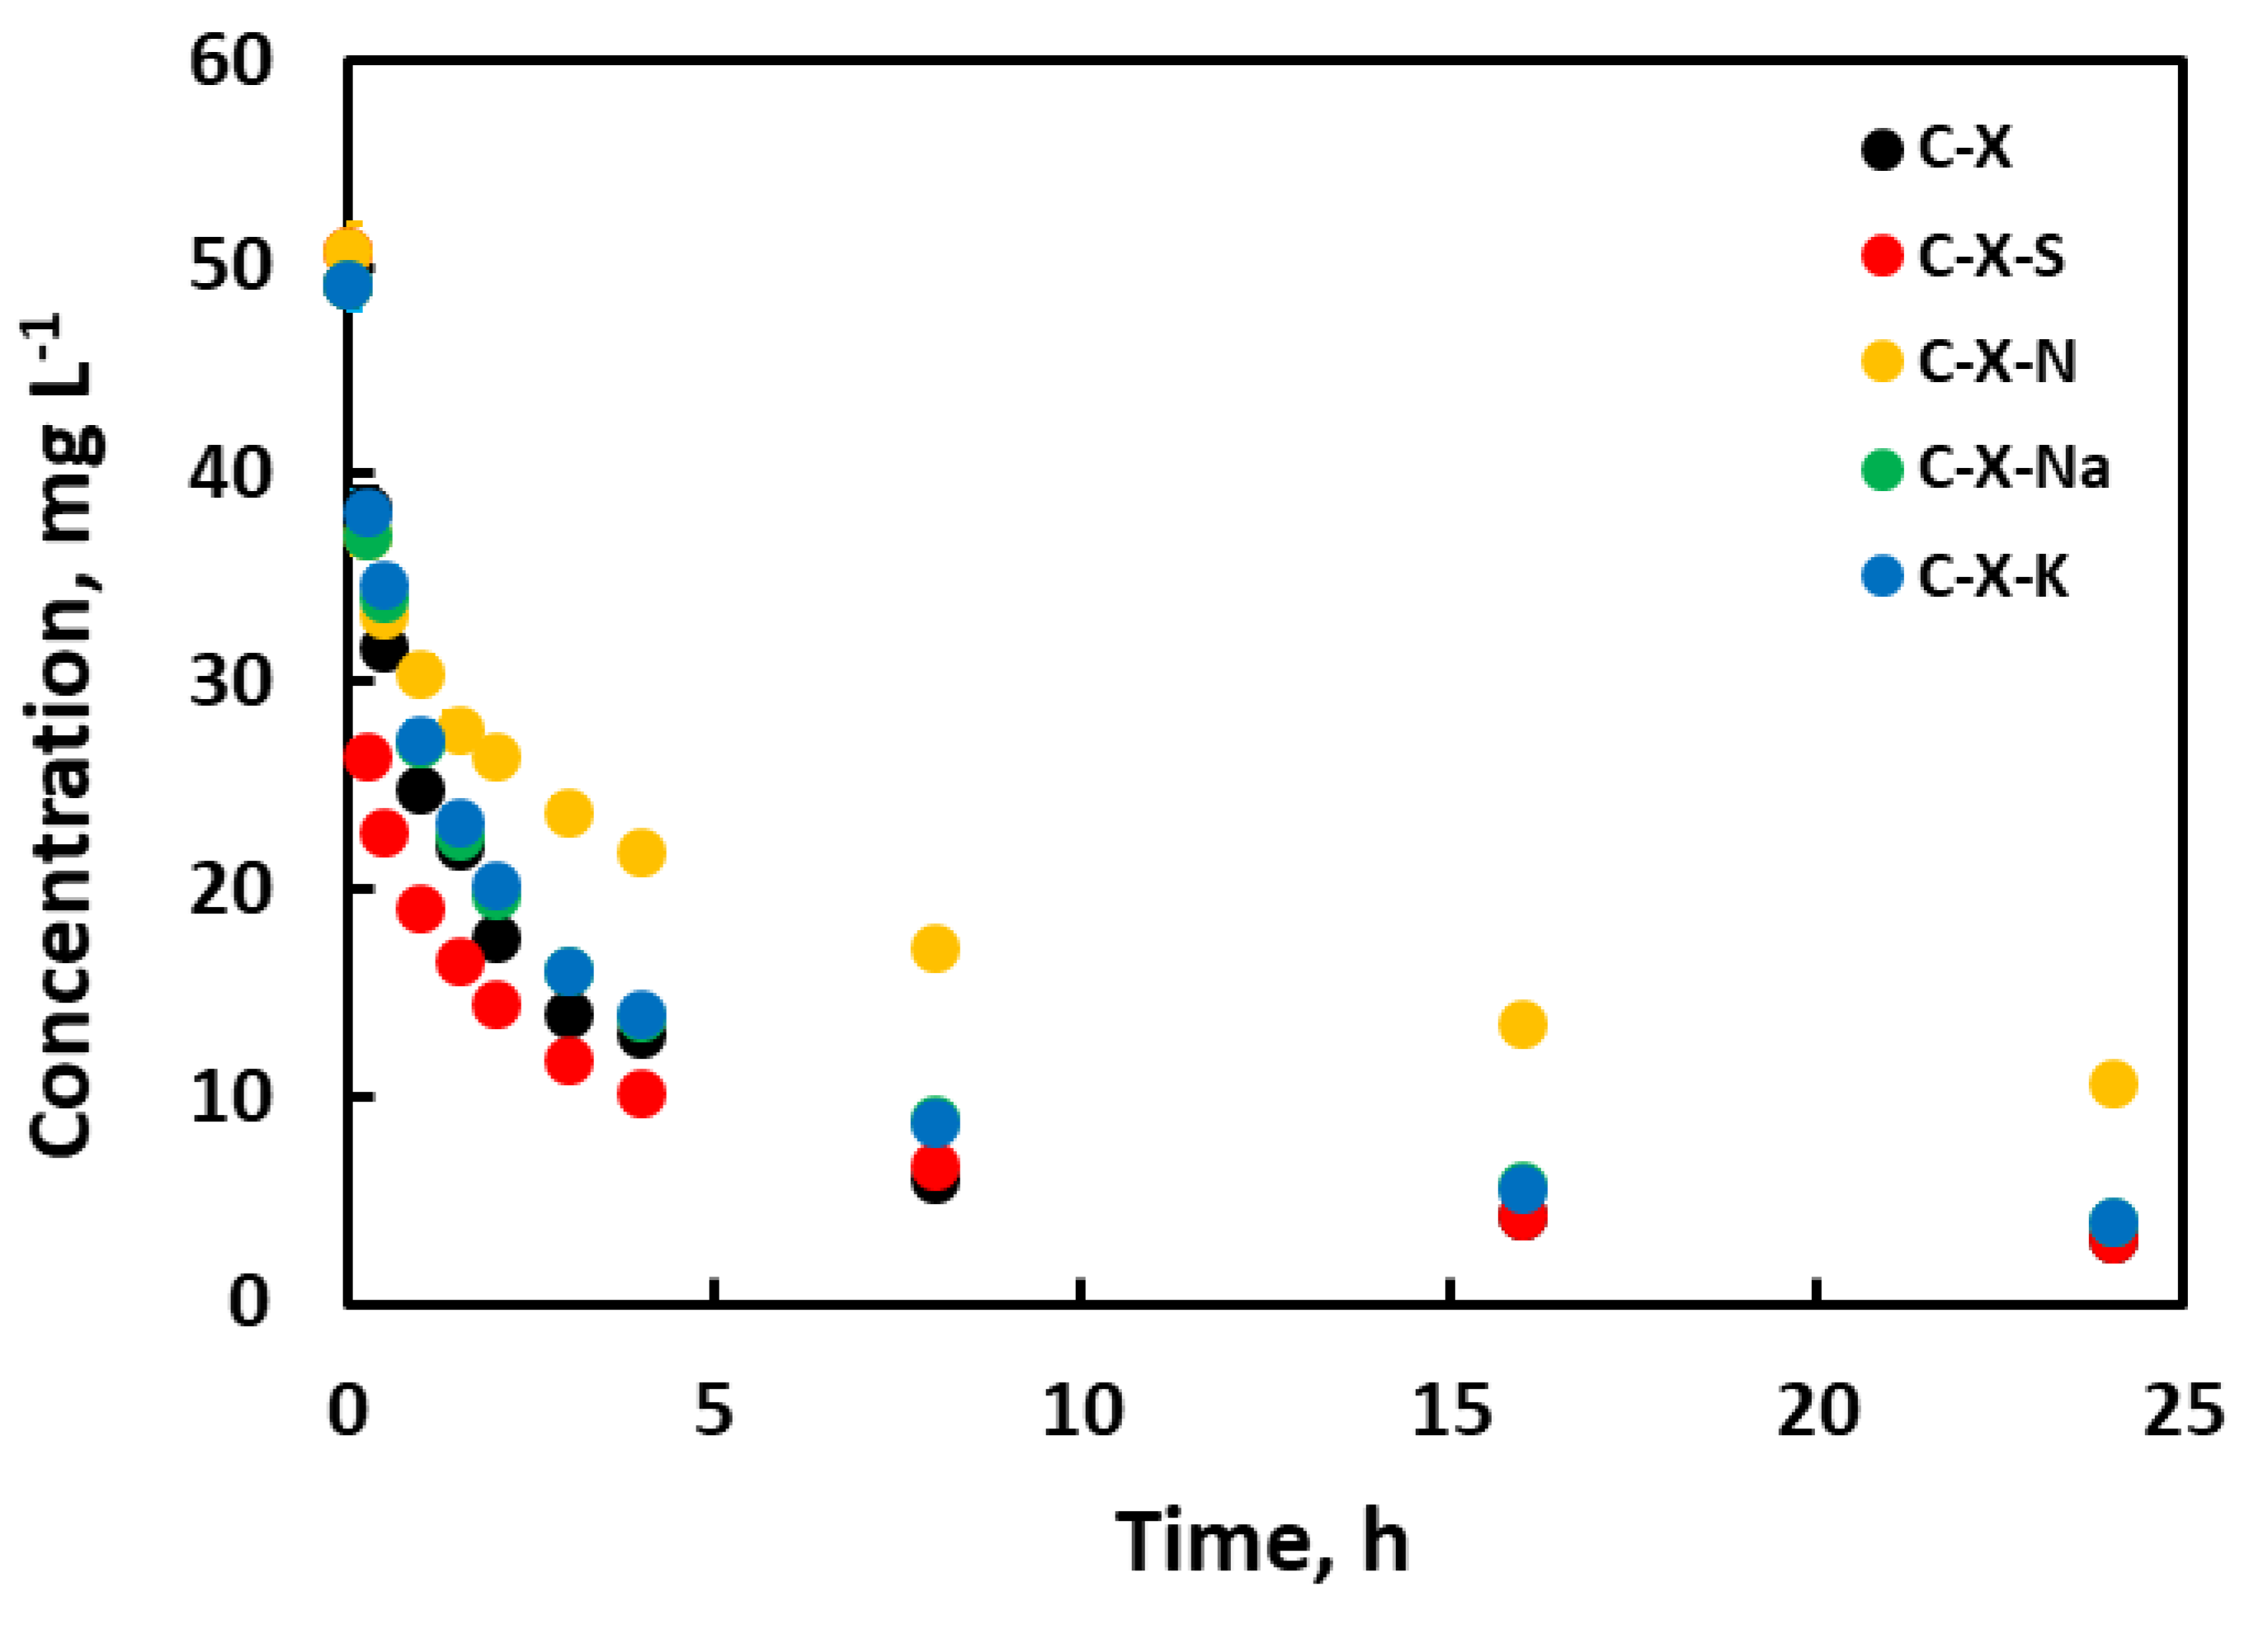
Figure 9.
Adsorption isotherms of gallic acid on the adsorbents prepared.
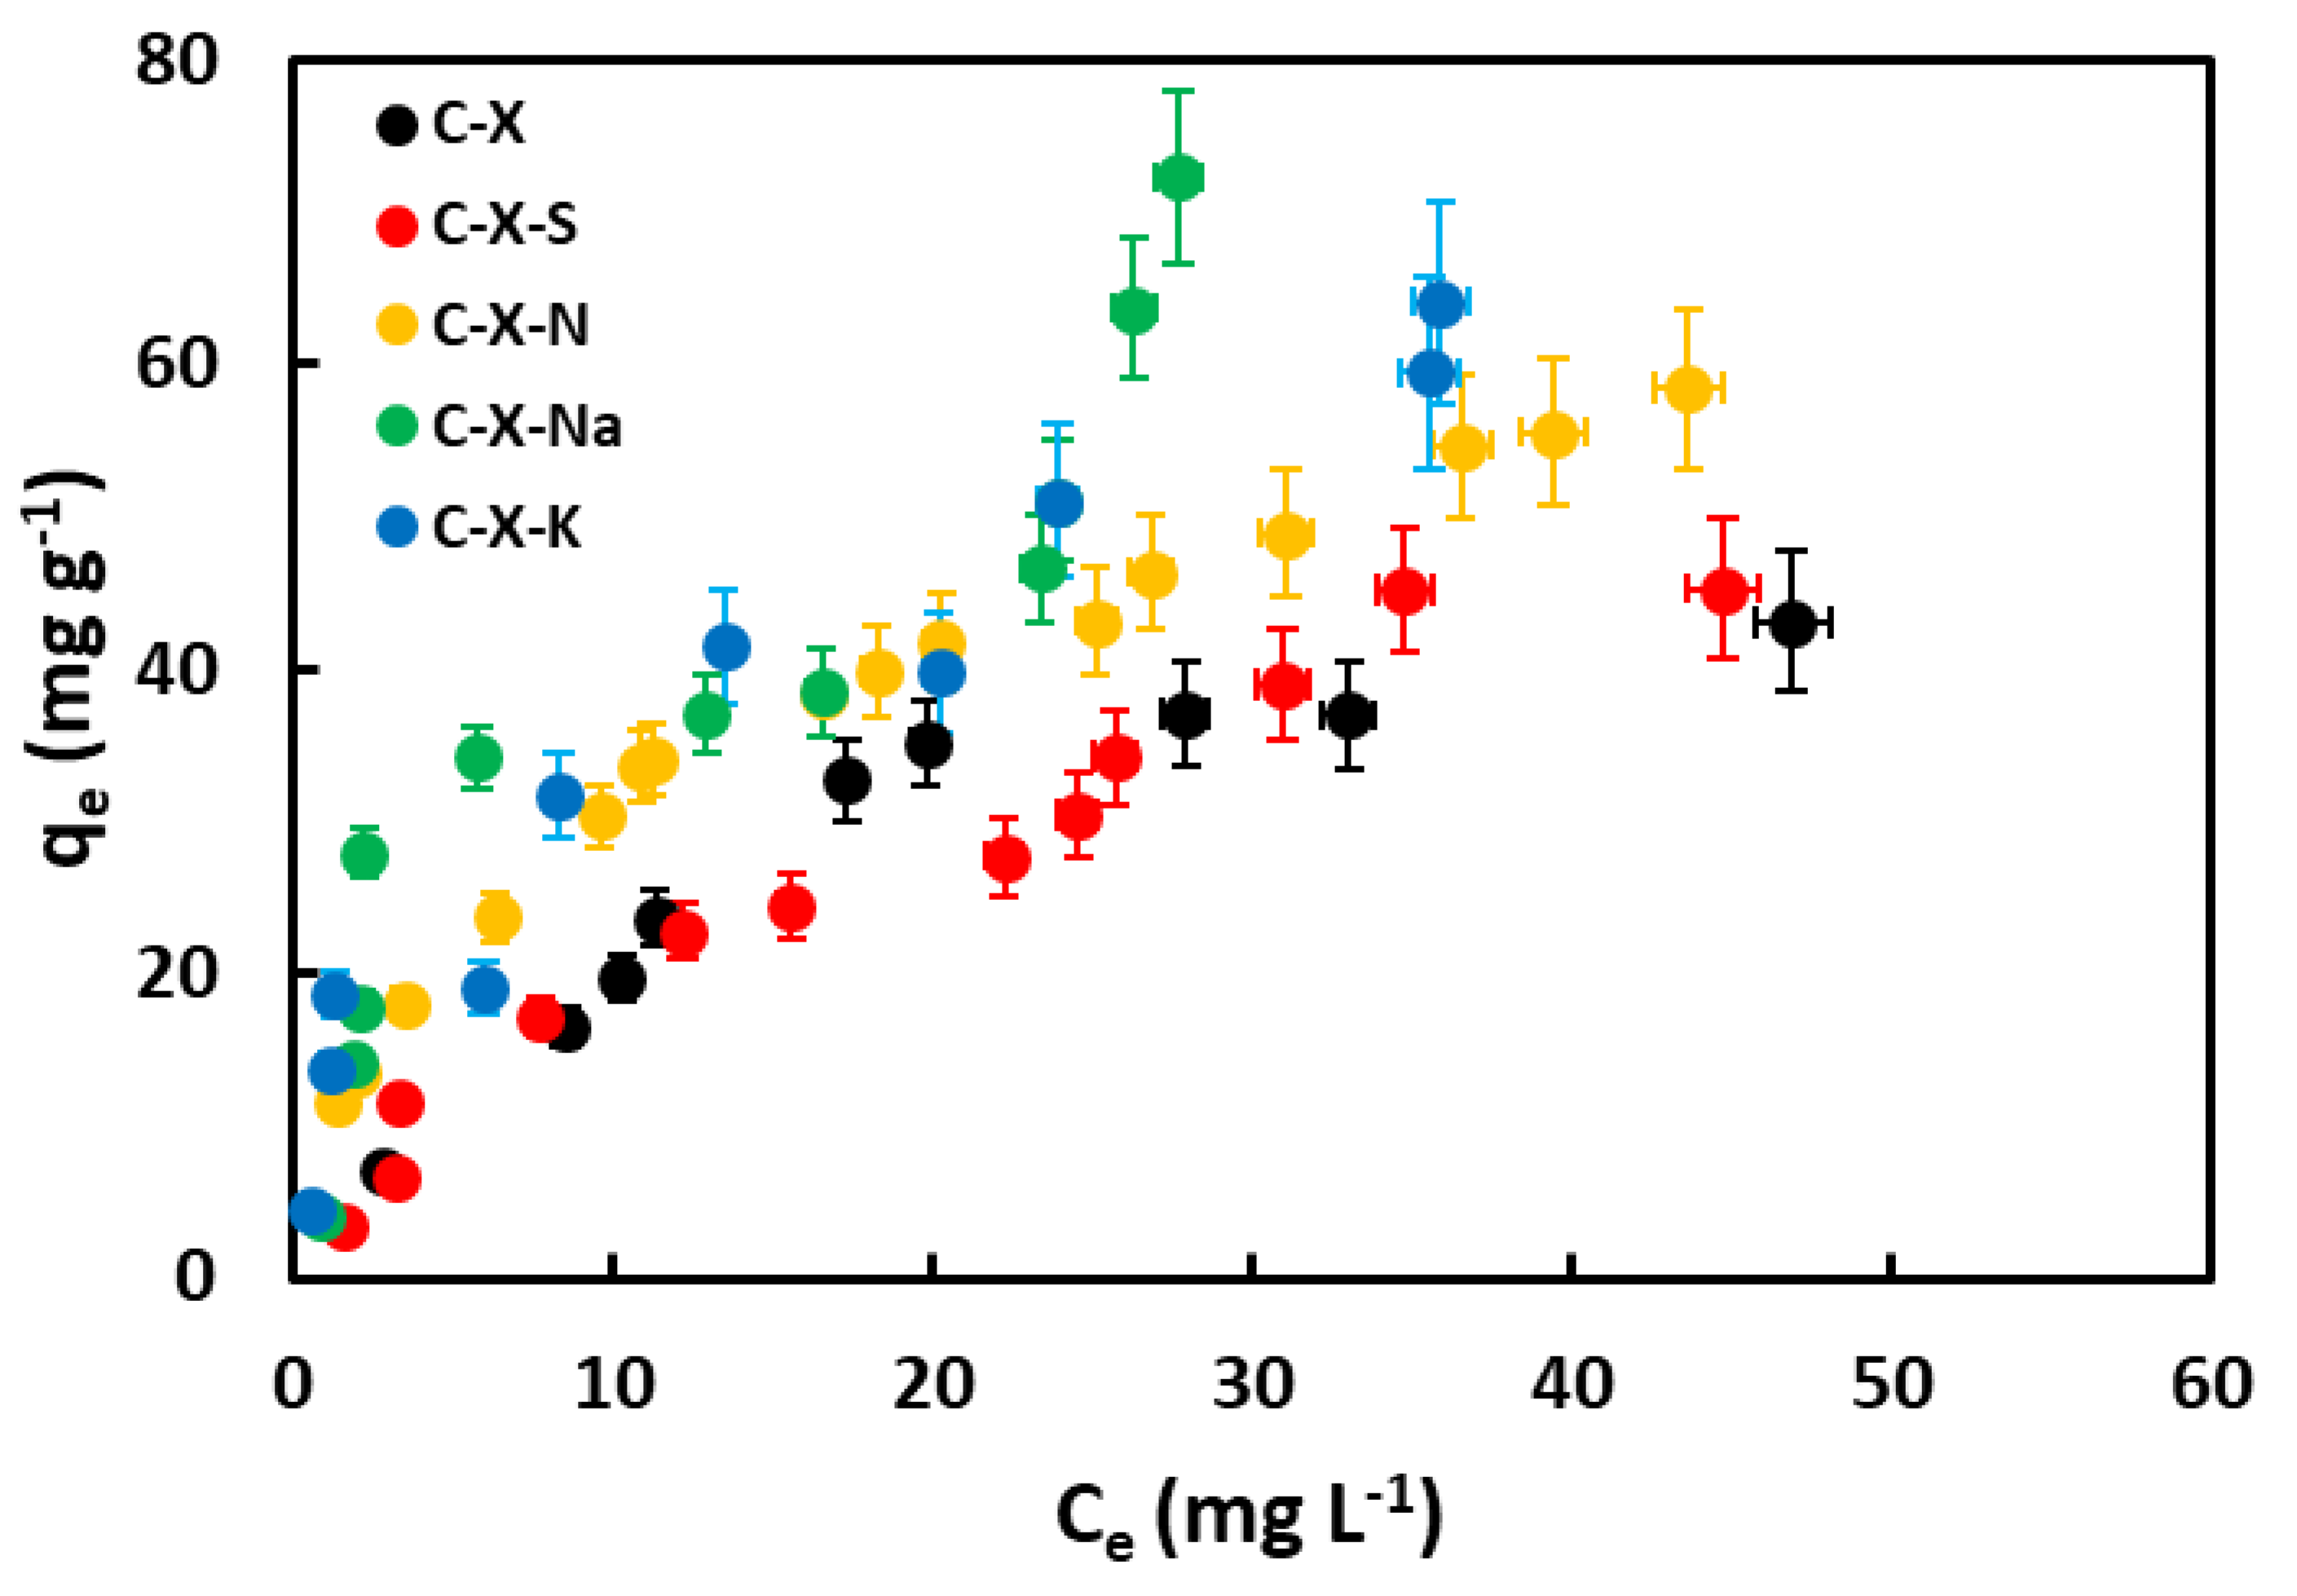
Figure 10.
Influence of pH.
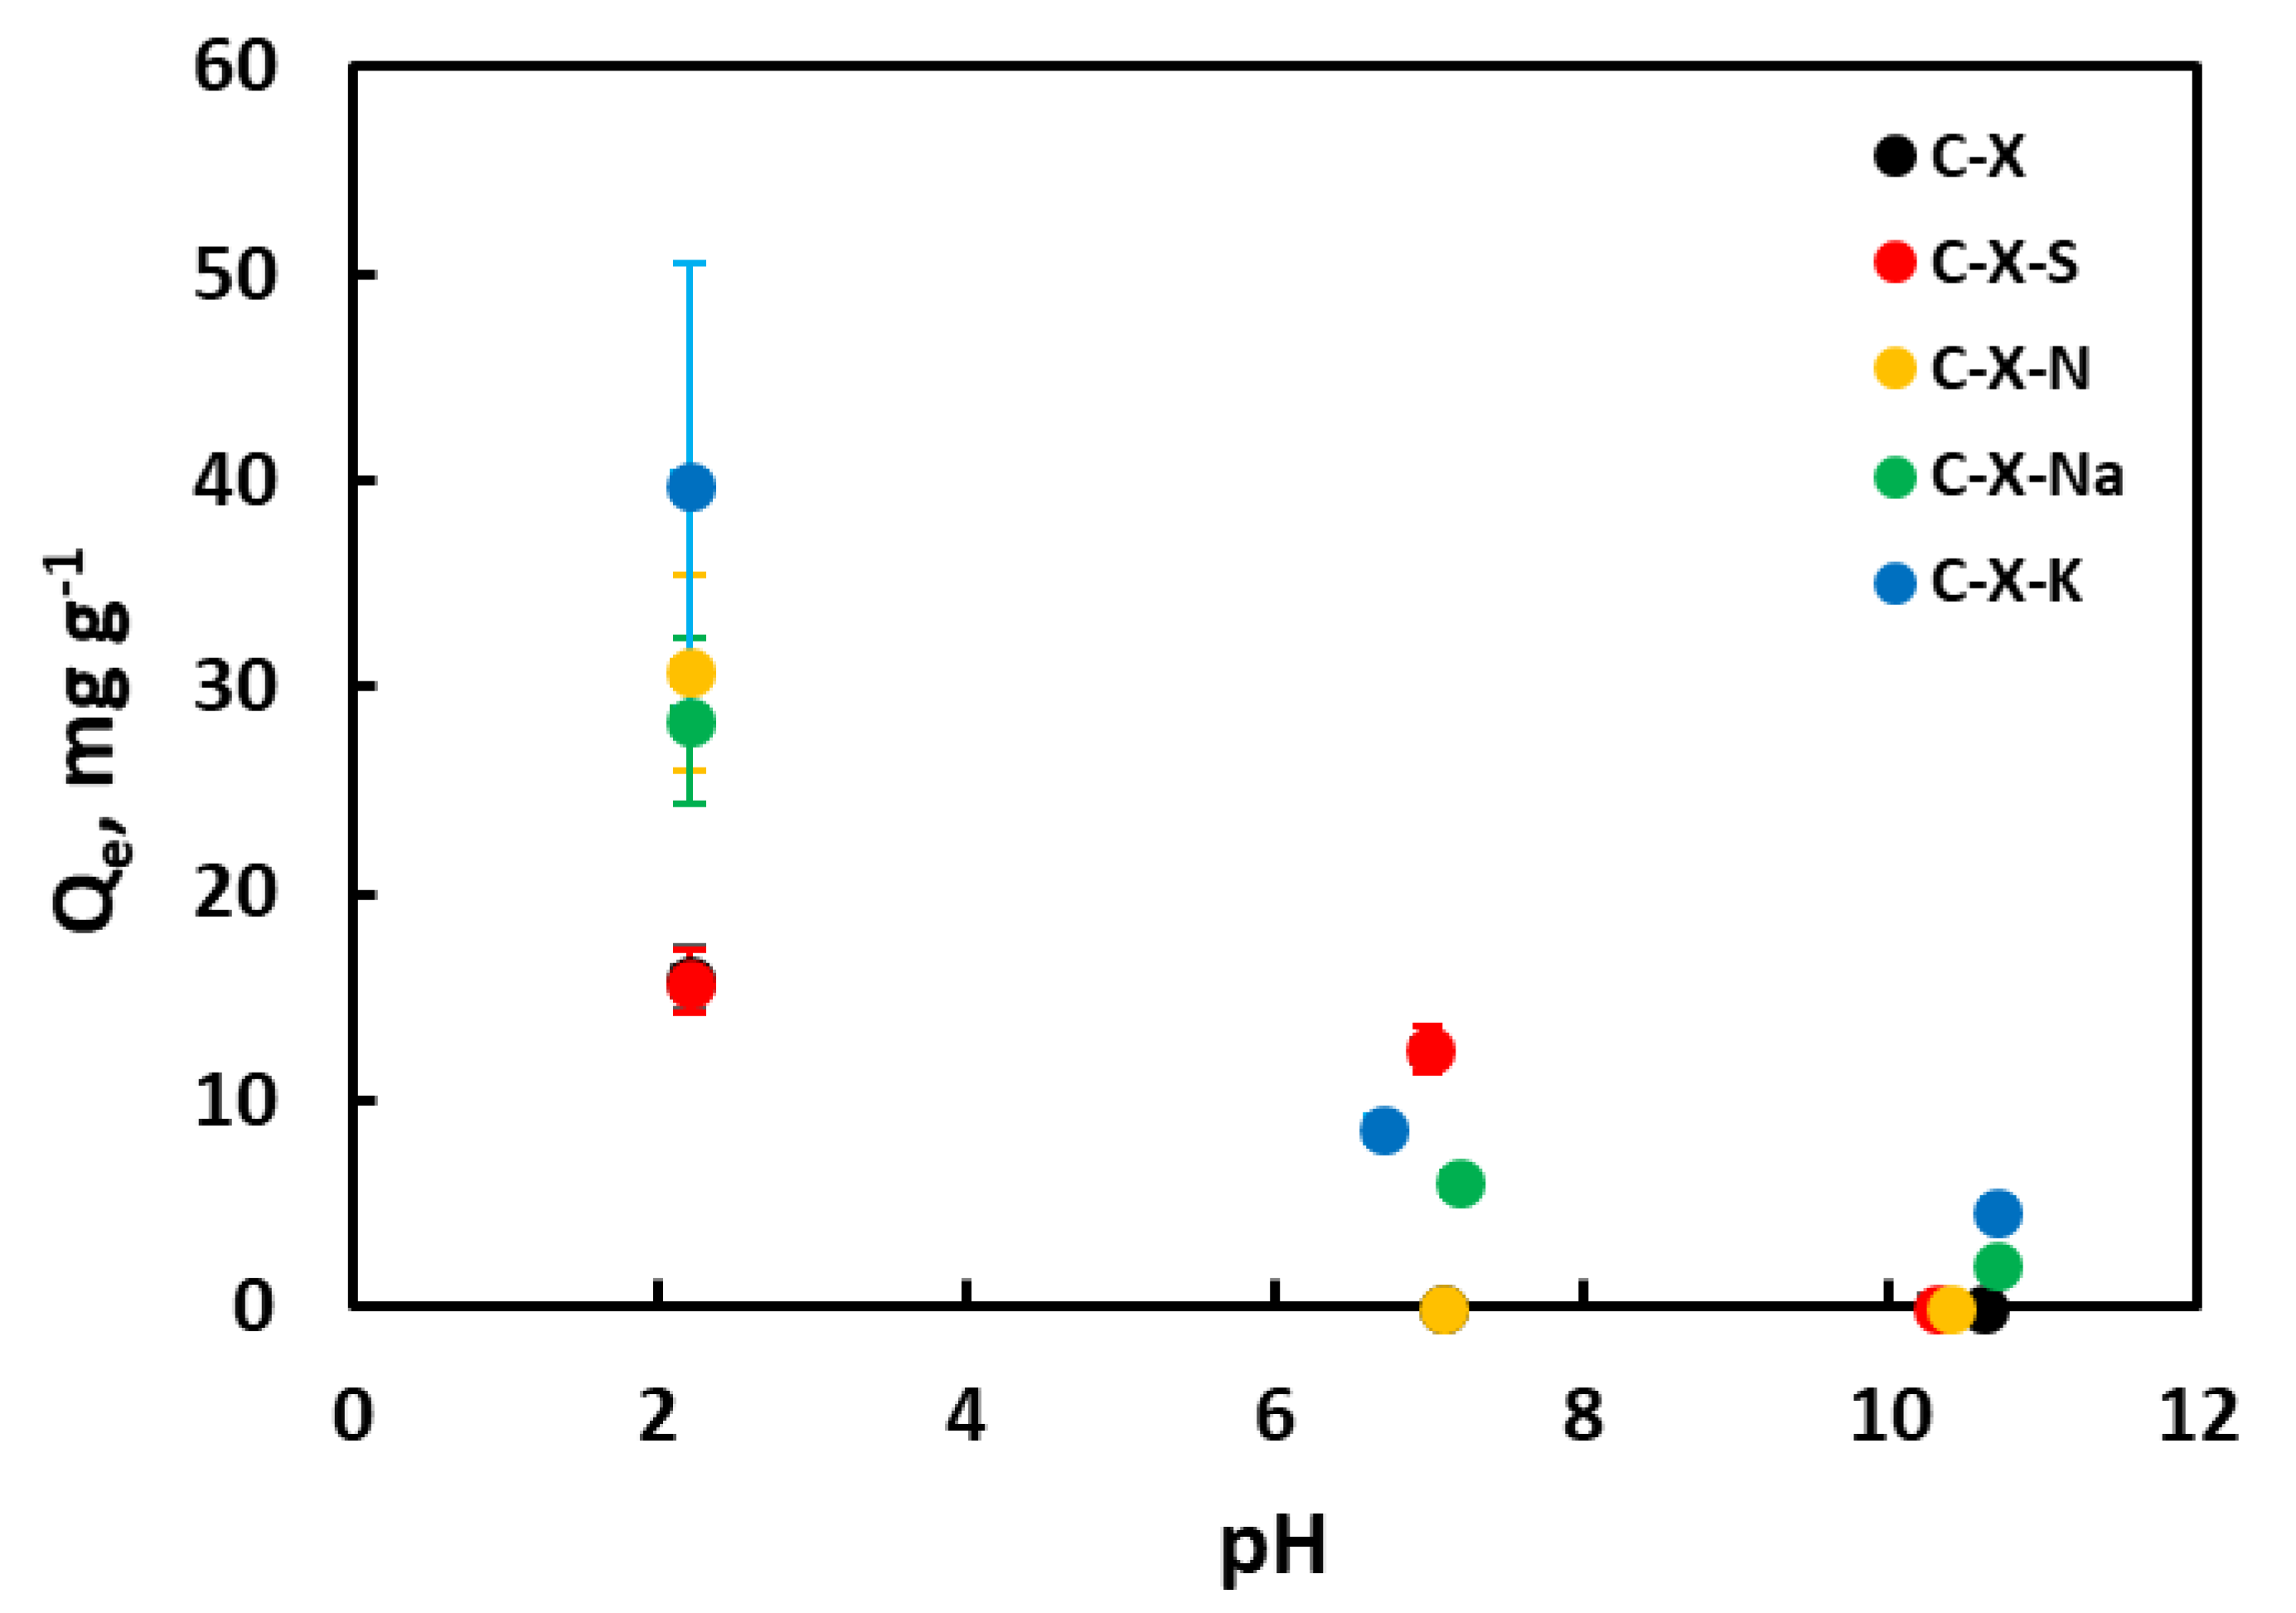
Figure 11.
Electronic density calculated (DFT). Maximum positive charge (dark blue) = 0.085; maximum negative charge (dark red) = -0.307.
Figure 11.
Electronic density calculated (DFT). Maximum positive charge (dark blue) = 0.085; maximum negative charge (dark red) = -0.307.
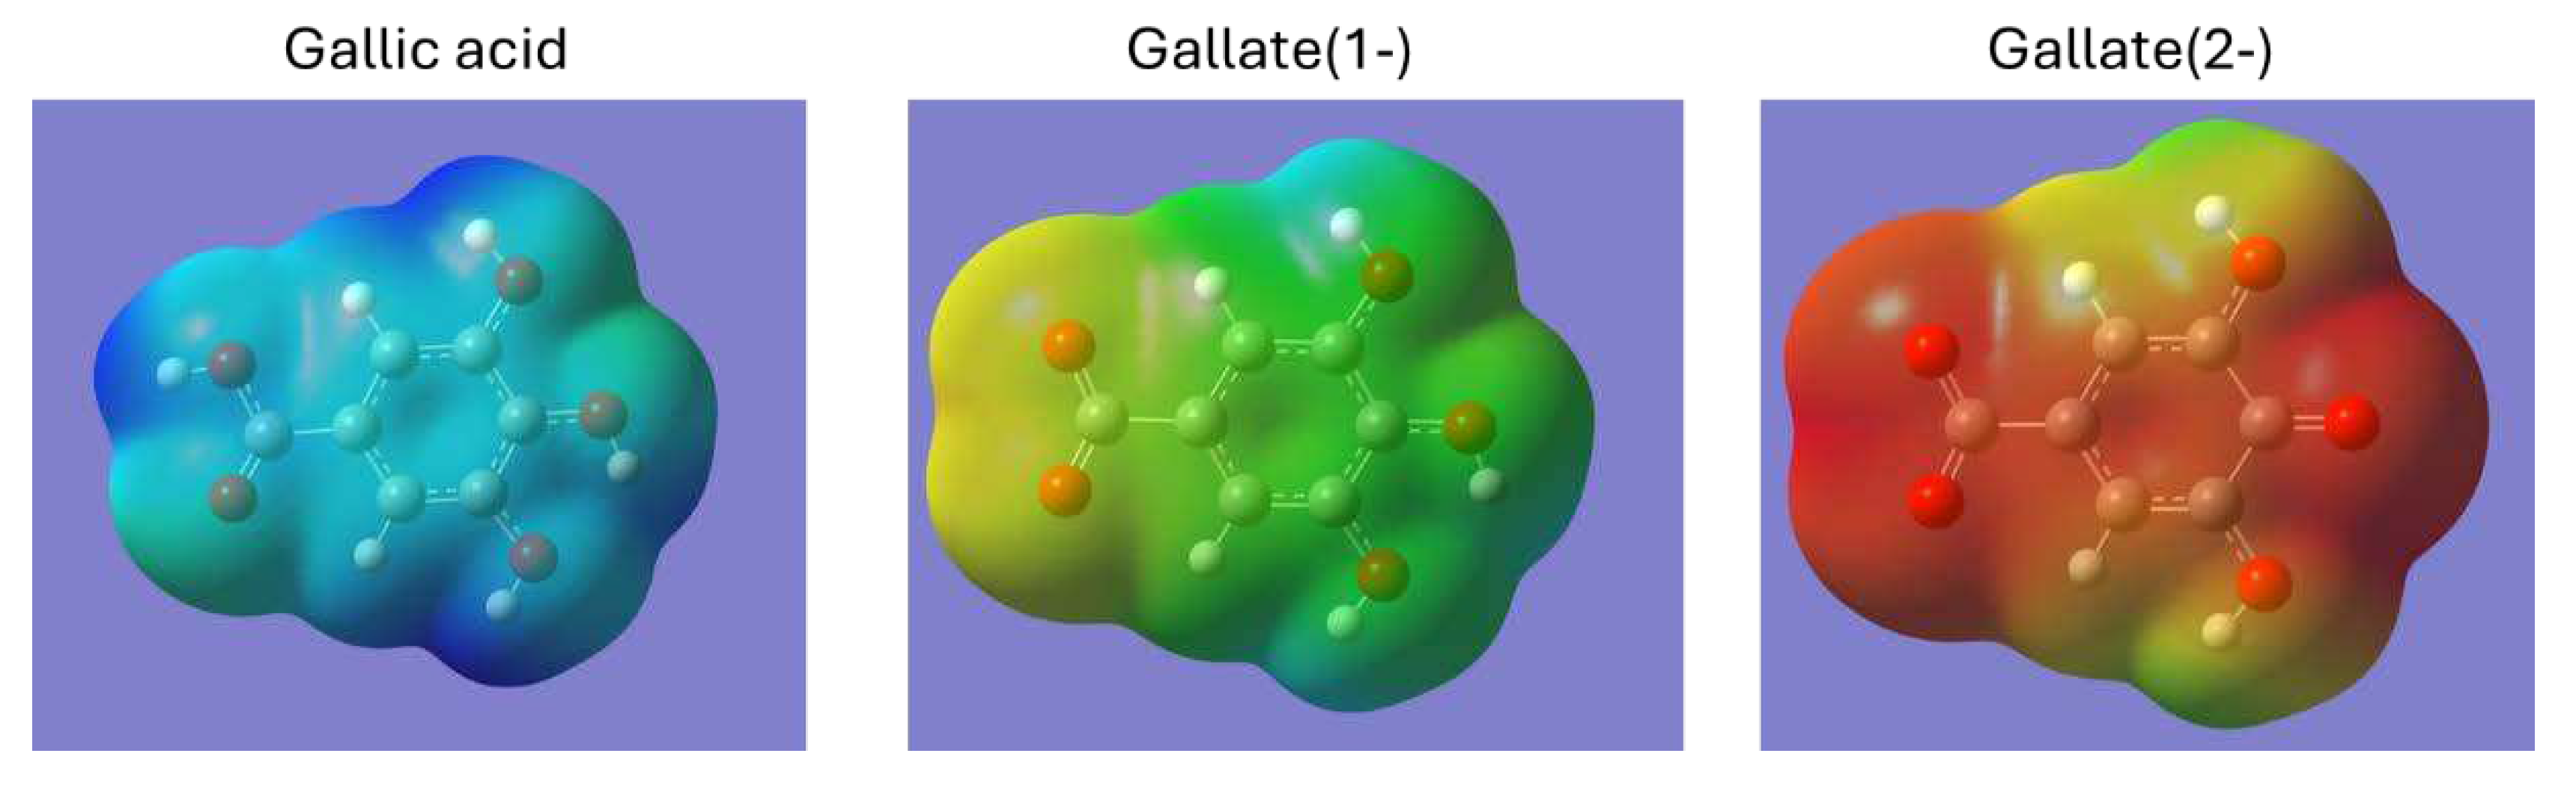
Figure 12.
Graphical representation of the mechanism of adsorption in acidic and alkaline media. Blue, positive charge; red, negative charge. The representation of charges in acidic media may change depending on the p.z.c. of each xerogel.
Figure 12.
Graphical representation of the mechanism of adsorption in acidic and alkaline media. Blue, positive charge; red, negative charge. The representation of charges in acidic media may change depending on the p.z.c. of each xerogel.
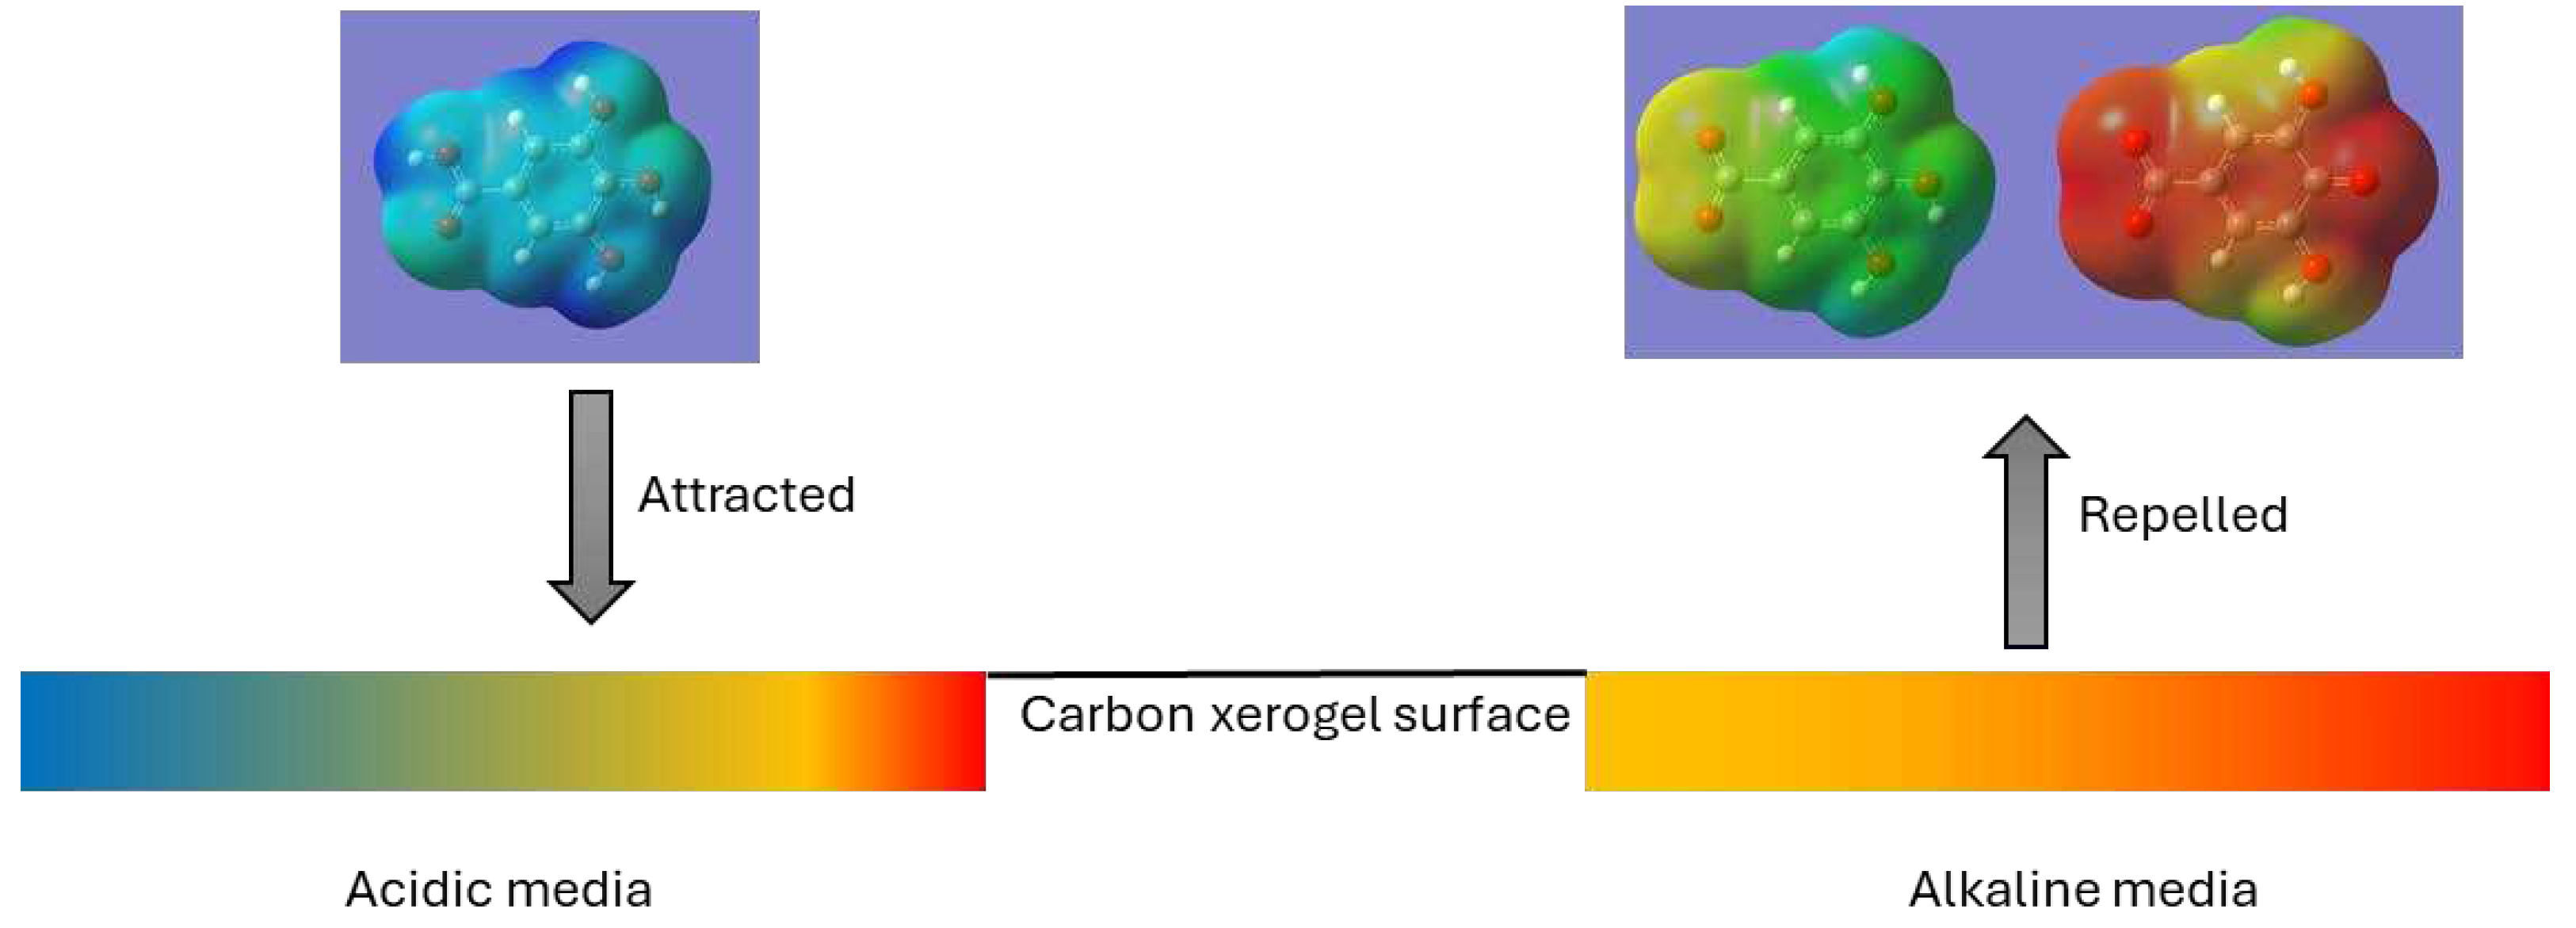
Figure 13.
Influence of temperature on GA adsorption for selected samples.
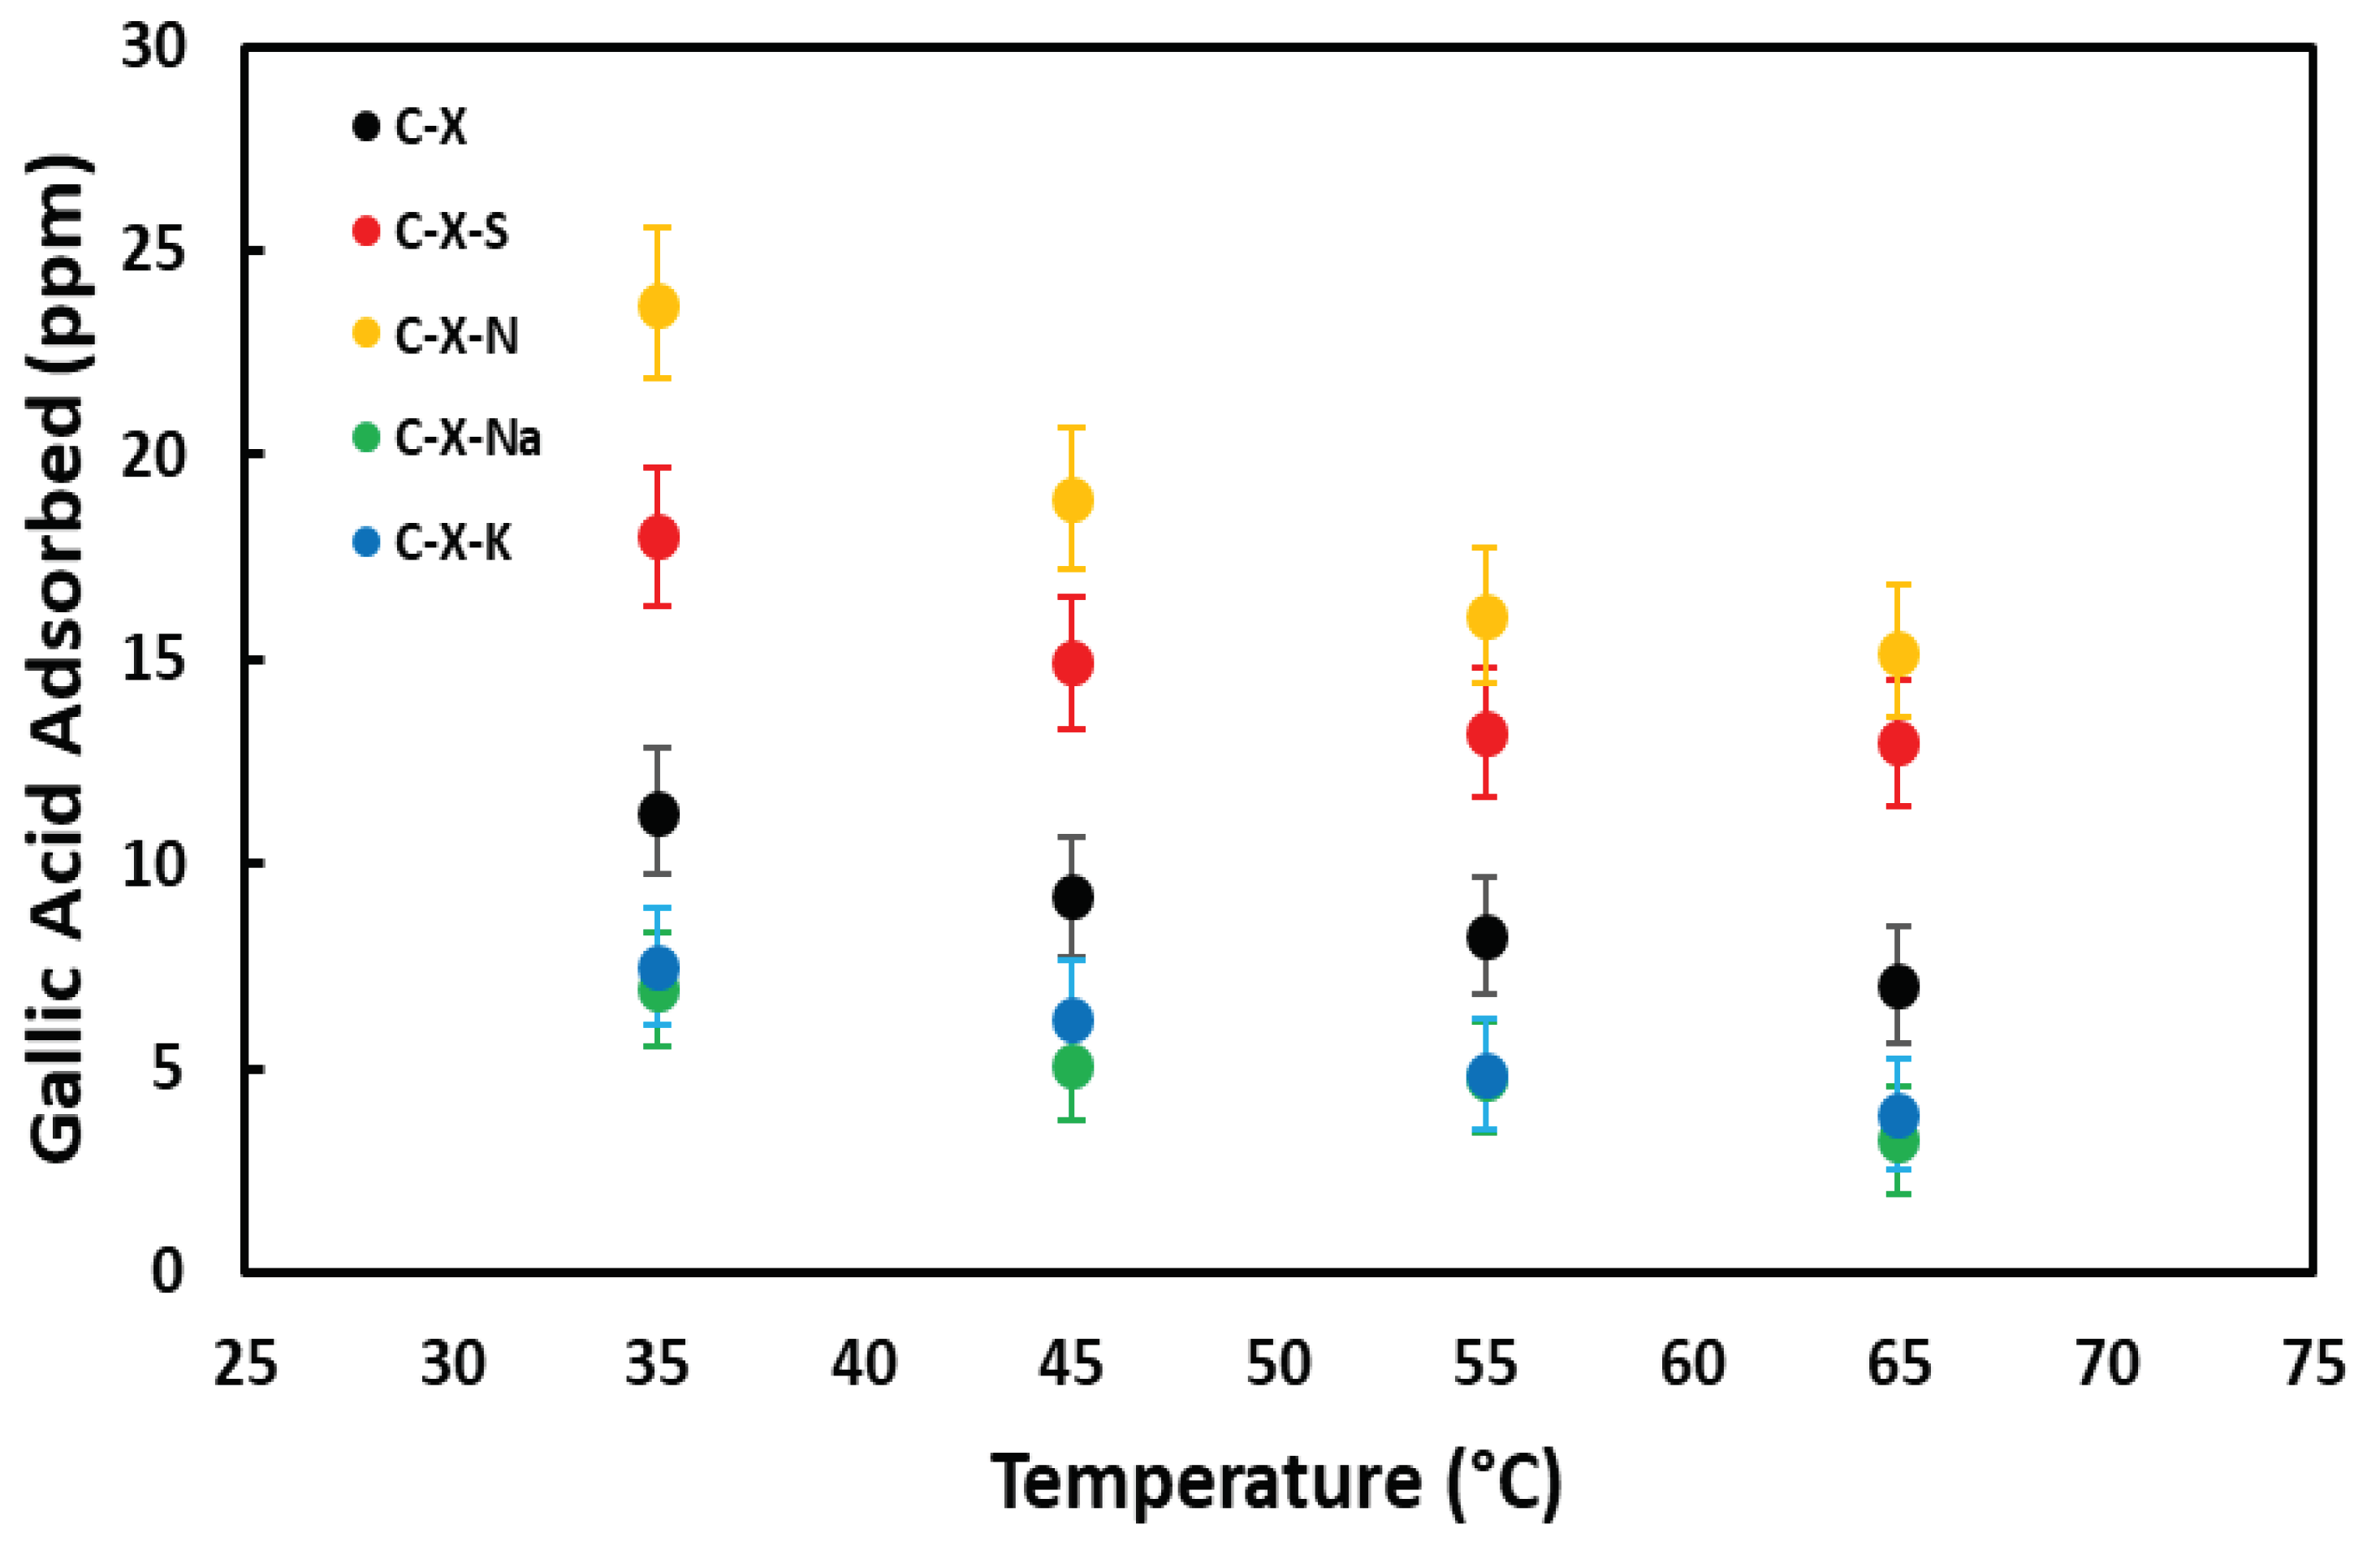

Table 1.
Catalysts/adsorbents preparation conditions and code.
| Starting material | Reagent | Temperature, °C | Time, h | Code |
|---|---|---|---|---|
| CX-5 | - | - | - | C-X |
| 98% sulfuric acid | 25±2 | 1.5 | C-X-S | |
| 65% nitric acid | 25±2 | 1.5 | C-X-N | |
| 1M sodium chloride | 80±1 | 48 | C-X-Na | |
| 1M potassium chloride | 80±1 | 48 | C-X-K |
Table 2.
Elemental analysis.
| Sample | %C | %H | %N | %S | %O* | %Na | %K | % others |
|---|---|---|---|---|---|---|---|---|
| C-X | 85.7 | 2.3 | 0.0 | 0.0 | 12.0 | N.M.** | N.M. | N.M. |
| C-X-S | 81.2 | 2.6 | 0.0 | 0.7 | 15.5 | N.M. | N.M. | N.M. |
| C-X-N | 74.7 | 2.1 | 1.4 | 0.0 | 21.8 | N.M. | N.M. | N.M. |
| C-X-Na | 85.7 | 2.6 | 0.0 | 0.0 | 10.9 | 0.5 | 0.0 | 0.8 (Cl, Cu) |
| C-X-K | 84.9 | 2.5 | 0.0 | 0.0 | 10.1 | 0.0 | 0.9 | 1.0 (Cl, Cu, Fe) |
*Oxygen obtained by difference. ** N.M.: not measured.
Table 3.
Elemental analysis of samples by XPS. Percentages of the total mass measured.
| Sample | % C | % H | % N | % S |
|---|---|---|---|---|
| C-X | 92.8 | 7.2 | 0.0 | 0.0 |
| C-X-S | 90.6 | 8.5 | 0.0 | 0.9 |
| C-X-N | 86.1 | 12.2 | 1.7 | 0.0 |
| C-X-Na | 94.0 | 6.0 | 0.0 | 0.0 |
| C-X-K | 93.2 | 6.8 | 0.0 | 0.0 |
Table 4.
Deconvolution peak C1s (% atomic).
| Carbon | 284.8 eV | Approx. 286 eV | Approx. 289 eV |
|---|---|---|---|
| C-X | 53.8 | 29.5 | 16.7 |
| C-X-S | 57.1 | 22.7 | 20.2 |
| C-X-N | 53.0 | 23.0 | 24.0 |
| C-X-Na | 53.1 | 23.8 | 23.1 |
| C-X-K | 69.0 | 17.2 | 13.8 |
Table 5.
Deconvolution peak O1s (% atomic).
| Carbon | Approx. 532.0 eV | Approx. 533.5 eV | Approx. 536.5 eV |
|---|---|---|---|
| C-X | 30.5 | 69.5 | - |
| C-X-S | 45.1 | 54.9 | - |
| C-X-N | 45.4 | 54.6 | - |
| C-X-Na | 12.2 | 73.8 | 14.0 |
| C-X-K | 53.9 | 35.7 | 10.4 |
Table 6.
Deconvolution peak S2p (% atomic).
| S2p1/2 | S2p3/2 | |
|---|---|---|
| Carbon | 167.6 eV | 168.8 eV |
| C-X-S | 34.5 | 65.5 |
Table 7.
Deconvolution peak N1s (% atomic).
| Carbon | 401.2 eV | 405.9 eV |
| C-X-N | 24.2 | 75.8 |
Table 8.
P.z.c. measurements. Acidic and basic functional groups.
| Sample | p.z.c. | Acidic groups meq g-1 | Basic groups meq g-1 |
|---|---|---|---|
| C-X | 7.20 | 0.20 | 0.85 |
| C-X-S | 2.49 | 0.58 | 0.80 |
| C-X-N | 3.42 | 0.85 | 0.81 |
| C-X-Na | 6.87 | 0.34 | 1.04 |
| C-X-K | 6.59 | 0.23 | 0.98 |
Table 9.
Adsorption isotherms of N2 at -196 ºC. Textural data.
| Sample | SBET, m2 g-1 | Vmi DA, cm3 g-1 | Vmi DR, cm3 g-1 | Rporo DR, nm |
|---|---|---|---|---|
| C-X | 484 | 0.268 | 0.243 | 0.722 |
| C-X-S | 448 | 0.249 | 0.225 | 0.808 |
| C-X-N | 347 | 0.194 | 0.176 | 0.812 |
| C-X-Na | 508 | 0.284 | 0.257 | 0.725 |
| C-X-K | 563 | 0.291 | 0.267 | 0.528 |
Table 10.
Textural characterization of xerogels by mercury porosimetry.
| Sample | Vme-p, cm3 g-1 | Vma-p, cm3 g-1 |
|---|---|---|
| C-X | 0.79 | 0.70 |
| C-X-S | 0.75 | 0.39 |
| C-X-N | 0.74 | 0.36 |
| C-X-Na | 1.64 | 1.43 |
| C-X-K | 1.24 | 1.14 |
Table 11.
Fitting of kinetic data of gallic acid adsorption.
| Kinetic model | Parameter | C-X | C-X-S | C-X-N | C-X-Na | C-X-K |
|---|---|---|---|---|---|---|
| Pseudo-first order | Qe, mg g-1 | 31.29 | 19.83 | 21.61 | 26.22 | 29.74 |
| K1, h-1 | 0.329 | 0.253 | 0.176 | 0.220 | 0.267 | |
| R2 | 0.981 | 0.963 | 0.989 | 0.976 | 0.962 | |
| Pseudo-second order | Qe, mg g-1 | 48.54 | 47.62 | 40.32 | 47.62 | 47.85 |
| K2, h-1 | 0.021 | 0.035 | 0.020 | 0.019 | 0.018 | |
| R2 | 0.999 | 0.999 | 0.996 | 0.999 | 0.999 | |
| Weber and Morris | C, mg g-1 | 13.54 | 20.10 | 10.87 | 12.59 | 12.05 |
| Kid, mg min1/2 g-1 | 17.31 | 14.12 | 13.64 | 16.95 | 17.27 | |
| R2 | 0.771 | 0.647 | 0.838 | 0.797 | 0.804 |
Table 12.
Fitting of gallic acid adsorption isotherm data to isotherm models.
| Isotherm model | Parameter | C-X | C-X-S | C-X-N | C-X-Na | C-X-K |
|---|---|---|---|---|---|---|
| Langmuir | Sm, mg g-1 | 62.89 | 83.33 | 68.49 | 72.46 | 71.94 |
| KL | 0.049 | 0.027 | 0.090 | 0.129 | 0.133 | |
| R2 | 0.954 | 0.889 | 0.973 | 0.839 | 0.969 | |
| Freundlich | n | 1.54 | 1.28 | 2.12 | 2.34 | 2.47 |
| KF | 4.254 | 2.709 | 9.998 | 13.932 | 14.273 | |
| R2 | 0.941 | 0.975 | 0.993 | 0.857 | 0.978 |
Table 13.
Comparison of the Langmuir adsorption capacity of different adsorbents for gallic acid.
| Type of adsorbent | pH | T /ºC | Q0 /mg g-1 | Reference |
|---|---|---|---|---|
| Commercial activated carbon (Picachem 150) | - | 5-50 | 239.9 -318.2 | [58] |
| Activated carbons | - | 25 | 20.4 - 27.2 | [59] |
| Activated carbon from date stones | 4.5 | 25 | 156.1 | [1] |
| Powdered AC | - | 25 | 57.5 | [60] |
| Multiwalled C-nanotubes | - | 25 | 17.6 - 23.5 | |
| TiO2-coated AC | 3 | 25 | 4.9 | [5] |
| Olive pomace AC in alginate beads: granular-powdered | 4.4 | 25 | 62.5 - 208.3 | [6] |
| Polymeric adsorbent WJN-09 | - | 30 | 97 | [2] |
| HF-02 (resin) | - | 15-45 | 141.6 - 171.3 | [61] |
| Montmorillonite | 5 | 25 | 20.2 | [62] |
| Iron-oxide coated montmorillonite clay | 4.2 | - | 88.5 | [63] |
| Nanoclay modified with poly (diallyldimethylammonium) | 4 | 15-45 | 39.15 - 80.58 | [64] |
| Chitosan-HAP composite | 6 | 30 | 23.3 | [65] |
| Chitosan-diatomite | 6 | 30 | 22.9 | [66] |
| Magnetic chitosan | - | 30-50 | 27.2 - 48.4 | [67] |
| Carbon xerogels | ≈4 | 30 | 62.89 - 83.33 | This study |
Table 13.
Thermodynamic parameters of gallic acid adsorption on prepared adsorbents.
| Sample | ∆S, KJ K-1 mol-1 | ∆H, KJ mol-1 | ∆G298K, KJ mol-1 |
|---|---|---|---|
| C-X | 0.063 | 16.10 | -2.57 |
| C-X-S | 0.051 | 13.97 | -1.09 |
| C-X-N | 0.070 | 21.21 | 0.28 |
| C-X-Na | 0.088 | 22.34 | -3.80 |
| C-X-K | 0.084 | 21.46 | -3.55 |
Table 14.
Adsorption/desorption results. Experiment A.
| Adsorption | Desorption | ||||||
|---|---|---|---|---|---|---|---|
| [GA]0, ppm |
[GA]F, ppm | GA ads., % |
qe, mg g-1 |
[GA]ext, ppm | GA ext., % |
qext, mg g-1 |
|
| Cycle 1 | 105.84 | 27.94 | 73.60 | 77.9 | 25.10 | 32.22 | 25.1 |
| Cycle 2 | 105.84 | 49.56 | 53.17 | 56.3 | 29.56 | 52.52 | 29.6 |
| Cycle 3 | 107.64 | 44.48 | 58.68 | 63.2 | 30.44 | 48.20 | 30.4 |
[GA]0, initial concentration; [GA]F, concentration after adsorption; GA ads., adsorbed percent; qe, adsorbed quantity; [GA]ext, concetration in solution after extraction; GA ext., extracted percent relative to last adsorption; qext, extracted quantity.
Table 15.
Adsorption/desorption results. Experiment B.
| Adsorption | Desorption | ||||||
|---|---|---|---|---|---|---|---|
| [GA]0, ppm |
[GA]F, ppm | GA ads., % |
qe, mg g-1 |
[GA]ext, ppm | GA ext., % |
qext, mg g-1 |
|
| Cycle 1 | 105.84 | 27.94 | 73.60 | 77.9 | 7.34 | 9.42 | 7.3 |
| Cycle 2 | 105.84 | 45.14 | 57.35 | 60.7 | 16.16 | 26.62 | 16.2 |
| Cycle 3 | 107.64 | 50.24 | 53.33 | 57.4 | 18.28 | 31.85 | 18.3 |
Disclaimer/Publisher’s Note: The statements, opinions and data contained in all publications are solely those of the individual author(s) and contributor(s) and not of MDPI and/or the editor(s). MDPI and/or the editor(s) disclaim responsibility for any injury to people or property resulting from any ideas, methods, instructions or products referred to in the content. |
© 2024 by the authors. Licensee MDPI, Basel, Switzerland. This article is an open access article distributed under the terms and conditions of the Creative Commons Attribution (CC BY) license (http://creativecommons.org/licenses/by/4.0/).
Copyright: This open access article is published under a Creative Commons CC BY 4.0 license, which permit the free download, distribution, and reuse, provided that the author and preprint are cited in any reuse.


