Submitted:
24 January 2024
Posted:
25 January 2024
You are already at the latest version
Abstract
Keywords: Addis Ababa; dietary factors; nutritional status; school-age children
Keywords:
Addis Ababa
; dietary factors
; nutritional status
; school-age children
1. Introduction
Childhood malnutrition is a major global health crisis, especially in urban low-income settings. The convergence of socio-economic, environmental, and cultural factors significantly impacts dietary habits in these settings [1]. According to the World Health Organization (WHO), malnutrition is deficiencies, excesses, or imbalances in energy and nutrient intake, which can lead to undernutrition, overweight, obesity, or micronutrient-related issues [2]. Malnutrition affects worldwide, with particularly severe consequences in low-income settings. In 2020, UNICEF, WHO, and the World Bank reported 148 million stunted, 45 million wasted, and 39 million overweight children [3]. These numbers highlight the urgent need to address malnutrition.
Ethiopia is tackling a widespread malnutrition crisis exacerbated by conflicts, climate issues, and the COVID-19 pandemic. In 2021, 26.3 million people, including 14 million children, needed humanitarian aid—a 17.9% rise in severely malnourished children [4]. School-age children in Ethiopia, mirroring the broader African context, experience high rates of stunting, underweight, and wasting in Addis Ababa [5], the malnutrition challenge is complex, driven by poverty, food insecurity, limited dietary diversity, and susceptibility to diseases [6]. Low-income households face stunting, wasting, and underweight issues, while wealthier households deal with overweight or obesity due to processed food consumption [7]. Many families struggle to afford nutritious foods, relying on micronutrient-lacking staples, which intensify health risks for children [8].
Urban low-income settings worsen the risks of malnutrition due to factors such as high population density, environmental pollution, social marginalization, and violence [9]. These areas are abundant in processed, energy-dense foods lacking essential nutrients, further contributing to malnutrition problems [10]. In urban areas, disparities within and between communities highlight the prevalent social and economic inequalities, particularly for the urban poor who live in informal settlements or slums [1]. The coexistence of both undernutrition and overnutrition emphasizes the complex interplay between socioeconomic factors and malnutrition [11].
The complex nature of malnutrition emphasizes socio-economic factors such as education and income, which are crucial for women and children. Higher levels of education and income enhance health knowledge and access to nutritious foods, while low levels elevate the risk of food insecurity and infections [12]. The Ethiopian government, in collaboration with UNICEF and the World Food Programme (WFP), is targeting interventions in vulnerable districts, to reduce stunting among under-five children [13]. Despite progress, socio-economic disparities persist, highlighting the need for further research in urban poor areas of Addis Ababa. Therefore, this study aimed to examine the association between dietary factors and nutritional status among school-age children in urban poor areas of Addis Ababa to provide insights for targeted interventions and policy formulation.
2. Materials and Methods
2.1. Study Settings and Population
The study was conducted in Addis Ababa, the capital and largest city of Ethiopia. Addis Ababa has an estimated total population of 3,945,000 urban and rural inhabitants, with a high population density of around 5,165 individuals per square kilometer across its 527 square kilometers [14]. Nearly a quarter of Ethiopia's urban population resides in Addis Ababa. The city is administratively divided into 11 sub-cities and 120 districts.
The study areas were chosen to reflect the diverse socio-economic landscape of Addis Ababa. Peripheral areas such as Kolfe Keraniyo and Nifas Silk Lafto sub-cities were selected to capture locations characterized by poor infrastructure and housing conditions, primarily inhabited by low-income residents [15]. In contrast, inner-city areas, which have modern housing, well-developed road infrastructure, and access to essential amenities, catering to high-income individuals, were also included in the study. The inclusion of informal settlements in inner-city areas adds complexity to the urban living dynamics in Addis Ababa.
2.2. Study Design
From March 2023 to August 2023, we conducted a community-based cross-sectional study targeting a cohort of 309 school-age children within urban low-income settings in Addis Ababa. The study specifically focused on school-age children aged 6 to 14 years, enrolled in one elementary school (grades 1-8) in each of the ten districts across two sub-cities—Kolfe Keraniyo and Nifas Silk Lafto. The selection criteria for participants were based on the student's roster, ensuring the representation of children from all grades in the study cohort.
2.3. Inclusion and Exclusion Criteria
The study included households that met specific criteria. These criteria were as follows: the household had to have at least one child between the ages of six and fourteen who attended school, and the parents or caregivers had to willingly agree to participate. Additionally, children within the age range of 6-14 years were included if they expressed willingness to participate. However, parents or caregivers who could not be reached after more than two visits were excluded from the study. Furthermore, children who were culturally influenced, as well as those with health defects such as gluten intolerance, lactose intolerance, severe health risks, or those who did not respond appropriately to the questions were also excluded from the study.
2.4. Ethics
The study procedures received approval from the Institutional Review Board (IRB) of the College of Natural and Computational Sciences at Addis Ababa University (AAU) (with the code of approval: CNCSDO/515/15/2023). This research protocol adhered to the Ethical Principles for Medical Research Involving Human Subjects as outlined in the Helsinki Declaration amended in Fortaleza, Brazil, in October 2013 [16]. Before participating, all study participants and their guardians read and signed a voluntary consent form.
2.5. Sampling and Sampling Procedure
The required sample size was determined using the formula for a single population proportion [17]. The parameters used in the calculation were as follows: a 24% prevalence of underweight among school children in Addis Ababa [18], a Z-score of 1.96 for a 95% confidence level, a margin of error of 0.05, and a non-response rate of 10%. The sampling strategy employed a multi-stage sampling technique using community-based approaches. First, the sample size was distributed proportionally to the two sub-cities. Then, five districts were randomly selected from each sub-city using simple random sampling (SRS). Next, 31 households were systematically sampled from each district by calculating the sampling interval (K). For the selection of school children, ten elementary schools were randomly chosen from both the private and public sectors, with two public schools and eight private schools. Finally, 31 school children were randomly selected from each school using computer-generated simple random sampling. To assess dietary intake, one child per household was selected. If a household had more than one eligible child, one child was chosen at random.
2.5. Data Collection Procedures
This study involved two rounds of data collection. The first round took place during a fasting period when followers of the Orthodox religion refrained from consuming animal-source foods. The second round occurred after the fasting period, during which all children consumed all types of food. We used a structured interviewer-administered questionnaire. The questionnaire encompassed socio-demographic factors such as age, sex, gender, education, income, occupation, marital status, household size, religion, household wealth index derived using principal component analysis (PCA), grade level of children, and school type. Additionally, it included dietary factors such as dietary diversity, meal frequency, meal skipping, awareness of nutrition, dietary habits, and absorption inhibitors. This study used sex as a biological attribute to differentiate male and female, and gender as social and cultural norm as per the SAGER guideline [19].
2.7. Wealth Index Determination
The quality of housing, as well as the type and quantity of household assets, were used to create a wealth index. A common factor score was assigned to each household using PCA. This process included variables that ranged from 0 to 1. Only variables with communality values above 0.5 were used to calculate the factor score. The factor scores were then summed up and divided into three groups of socioeconomic status: low, medium, and high. Household assets such as access to water and electricity, toilet facilities, televisions, radios, beds, tables, bicycles, motorbikes, refrigerators, and the type of floor material were the factors that determined these groups. The wealth index values were derived from the PCA with the highest eigenvalues and then split into three wealth categories: poor, medium, and rich. This index is a relative measure of household economic status [20].
2.8. Dietary Assessment
The dietary assessment questionnaire consisted of six food groups, as outlined in the Ethiopian FBDG [21]. These groups included: cereal, grains, white roots and tubers; Legumes; nuts and oil seeds; Milk and dairy foods, meat, fish and egg; Fruits and vegetables; and Fats and oils. To record all food consumption, the 24-hour dietary recall method was utilized. Parents/caregivers reported the ingredients and quantities of foods, whether consumed or not, with the aid of photographs for each item to aid in recall and verification of consumption within the past 24 hours. The NutriSurvey software was employed to calculate the energy and nutrient content based on the 24-hour recall protocol [22]. Dietary diversity scores (DDS) were calculated from the food groups using a “yes”/ “no” response and categorized as high (if more than four food groups were consumed) or low (if less than four food groups were consumed), following Ethiopian FBDG. The adequacy of macronutrient and micronutrient intake was evaluated according to the Dietary Reference Intakes (DRI) set by The Institute of Medicine of The National Academies [23]. Reported energy intakes were compared to minimal energy requirements to assess adequacy.
2.9. Anthropometrics Indices
Anthropometric measurements were taken for all school children at their respective schools. The average weight, height, and MUAC measurements were recorded for each child. The anthropometric indices, such as weight-for-age (WAZ), BMI-for-age, and height-for-age (HAZ) standard Z-scores, were calculated using the WHO Anthro 3.2.2.1 software [24]. However, the software did not calculate WAZ for children above 10 years old, resulting in missing data in the SPSS analysis. To address this issue, the MUAC measurement was used to classify children’s nutritional status as either wasting or normal, following the Food and Nutrition Technical Assistance (FANTA) guideline [25]. Children were classified as stunted, underweight, overweight, or wasted when their HAZ and BAZ scores were below -2SD, respectively.
2.10. Statistical Analysis Methods
Data analyses were conducted using SPSS IBM version 23 [26]. Frequency and percentage were computed for categorical variables. The association between nutritional status and dietary diversity with socio-demographic factors was evaluated separately by binary logistic regression model for univariate and multivariate analysis to estimate their log odds (AOR) at a 95% confidence interval (95% CI). A significance level of 5% (p-value < 0.05) was used. Additionally, for response variables with more than two options (underweight, normal, and overweight), a multinomial logistic regression was employed after potential variables were identified using binary logistic regression. Outliers were checked, and multicollinearity was examined using the variance inflation factor (VIF) with a cut-off set below 5.
2.11. Data Quality Control
Three data collectors, one of whom was a supervisor, were responsible for collecting the data. The questionnaire was initially written in English and subsequently translated into the Amharic language. The translation process involved a professional in the English language and a native speaker of Amharic. Data collectors received two days of training covering interviewing techniques, questionnaire content, and anthropometric measurements. We took several steps to minimize bias during our study. Firstly, we did not inform the data collectors about the survey's purpose or content. Similarly, we kept the study's hypothesis hidden from the study respondents to ensure unbiased responses. We conducted a pre-test of the study tool using 10% of the sample from outside the study subjects and made necessary corrections to address spelling errors and grammar problems based on the pre-test data.
To establish a trusting relationship with the participants, we were transparent about the study's purpose and the importance of truthful answers. We provided clear instructions on how to complete surveys or questionnaires and highlighted the significance of accuracy. To minimize reliance on participants' memories, we designed questions that focused on recent or significant events. We cross-checked self-reported data with information obtained from different sources to identify any discrepancies. Lastly, we allowed participants to choose the "Don't Know" or "Prefer Not to Answer" options.
To minimize recall bias, we utilized a multiple 24-hour recall questionnaire and included photographs of various food groups and equipment. To control confounding bias, we implemented multivariate logistic regression for confounders. With these measures in place, we are confident that our research results are reliable and unbiased. For data cleaning, Epi-data version 3.1 [27] was utilized. It was used to identify and correct errors, inconsistencies, and anomalies in the data.
3. Results
3.1. Socio-Demographic Characteristics of Caregivers/Parents and Children
A total of 309 households, with a response rate of 100%, participated in the study. The socio-demographic characteristics of the parents/ caregivers are presented in Table 1. The majority of the parents/caregivers were married (67%), had a diploma or higher education (61.2%), and worked in the private sector (35%). The ages of the parents/caregivers ranged from 18 to 65 years old, with an average age of 33.3 years. On average, the parents/caregivers had a family size of five, ranging between one to eight members. Compared to high-income and wealthy caregivers, those with lower incomes and poorer parents were more likely to have larger families, lower education levels, and government-subsidized rent.
The socio-demographic characteristics of the school children were evenly distributed by age group, with 49.8% falling into the 6-10 years category and 50.2% falling into the 11-14 years category. Similarly, the distribution of school type was almost equal, with 55.7% attending public school and 44.3% attending private school. However, there were more females (57.6%) than males (42.4%), Table 2.
The majority (59.5%) of children studied had poor dietary habits; evidenced by meal skipping (56.6%) and consumption of undiversified (less than four) food groups (65.7%). The mean (± SD) height-for-age, BMI-for-age, MUAC, weight, and height were recorded as -0.78 (±1.59), -1.03 (±2.08), 194 (±29) mm, 32.1 (± 9.7) kg, and 139.8 (± 15.3) cm, respectively. Furthermore, the prevalence of wasting, stunting, underweight, and overweight among children was 14.9%, 24.3%, 35.9%, and 18.8%, respectively.
More than half of the children had access to a water supply (60.5%) and consumed absorption inhibitors (53.1%). However, less than half had access to toilet facilities (44%) and only 50.5% ate three or more meals per day.
3.2. Macro and Micronutrient Nutrient Intake of School-Age Children
The average macronutrient intake for school-age children falls within acceptable ranges: 302.7g of carbohydrates (45-65% of energy), 69g of protein (10-35% of energy), and 36.8g of fat (20-35% of energy). The average energy intake is 1803.8 kcal, which is slightly below the recommended levels. Micronutrient intake raises concerns: calcium at 507.2 mg is below the recommended 1000 mg, iron at 133.6 mg exceeds the recommended value, and vitamin A at 375.4 µg surpasses the recommended value. However, the intake of polyunsaturated fatty acids was 4.2 g, which is below the adequate daily intake (10.5- 17.5g for boys and 9.1-22.3g for girls) [28,29]. Additionally, potassium was deficient at 2322.7 mg compared to the recommended 4700 mg. The average nutrient intake among school-age children is presented in (Figure 1).
3.3. Macro and Micronutrient Intake by School Type
Public school children had a slightly lower mean energy intake level (1796.32 Kcal) compared to private school children (1814.45 Kcal). Similarly, the mean fat intake (36.49g), carbohydrate intake (295.53g), dietary fiber intake (21.96g), calcium intake (504.88 mg), and iron intake (129.16 mg) were lower than those of the private school children. However, their mean protein intake (69.17g), and zinc intake (12.11 mg) were slightly higher than those of the private school children (Figure 2).
3.4. Dietary Diversity and Nutritional Gaps in Urban Low-Income School Children
In low-income urban areas of Addis Ababa, schoolchildren exhibited distinct food consumption patterns (Figure 3). Generally, schoolchildren’s diets were dominated by fats and oils, constituting 79.3% of the diet, which reflects a notable reliance on fat sources. The legumes were closely followed (70.2%), providing significant protein and fiber. Fruits and vegetables contributed substantially (66.3%), offering essential vitamins and minerals. Cereals, grains, roots, and tubers (CGTR) constituted 68.3%, highlighting their significance. Milk and dairy foods, meat, fish, and eggs (DMFE) accounted for 52.4%, while nuts and oilseeds represented a lower proportion (11.7%). Emphasizing a balanced approach across food groups is essential for a comprehensive nutrient intake. The nutritional gap appears to be related to the consumption of nuts and oil seeds, with a frequency of only 11.7%. This suggests a potential deficiency in essential fatty acids and other nutrients provided by this food group.
3.5. Nutritional Status of School-Age Children
The Mean (±SD) of BMI-for-age, height-for-age, and MUAC of school-age children were -1.03 (±2.08), -0.78 (±1.59), and 194 (±29), respectively. According to the WHO growth reference for school-age children, 24% (95%CI: 20.08-28.46) were stunted, 15% (95%CI: 11.65-18.13) were wasted, 36% (95%CI: 31- 41) were underweight, and 19% (95%CI: 15-23) were overweight.
3.6. Factors Associated with Stunting among School-Age Children
The findings of the logistic regression analysis of the variables associated with stunting in school-age children are presented in Table 3. The results indicate that children from single-parent households are 5.19 times males (AOR: 5.19, 95% CI: 2.37, 11.4) more likely to experience stunting than those with married parents. Renting from private or government sources increases the likelihood of stunting by 3.76 and 3.86 times (AOR: 3.76, 95% CI: 1.82, 7.79), and (AOR: 3.86, 95% CI: 1.55, 9.59) respectively, compared to private ownership. Lower levels of education among parents or caregivers are correlated with higher odds of stunting; individuals who are unable to read and write have 4.16 times (AOR: 4.16, 95% CI: 1.19, 14.51) higher odds of stunting than those with a diploma or higher education. Additionally, female children have lower odds of stunting than males (AOR: 0.43, 95% CI: 0.22, 0.83), while skipping meals increases the odds (AOR: 2.77, 95% CI: 1.35, 5.66). Caregivers who lack awareness about nutrition also face higher odds of stunting (AOR: 1.99, 95% CI: 1.05, 3.79).
3.7. Factors Associated with Wasting among School-Age Children
Table 4 outlines the results of the logistic regression analysis of the factors linked to wasting in school-age children. Findings indicate that children from affluent households have significantly lower wasting odds than those from poor households (AOR: 0.19, 95% CI: 0.07, 0.54). Similarly, children aged 11-14 exhibit lower wasting odds than those aged 6-10 (AOR: 0.36, 95% CI: 0.16, 0.82). Lower wasting odds are associated with consuming four or more food groups (AOR: 0.28, 95% CI: 0.12, 0.64), maintaining good dietary habits (AOR: 0.32, 95% CI: 0.14, 0.70), avoiding absorption inhibitors (AOR: 0.26, 95% CI: 0.11, 0.62), and having access to water supply (AOR: 0.15, 95% CI: 0.06, 0.39).
3.8. Factors Associated with Underweight and Overweight among School-Age Children
Table 5 displays the results of a multinomial regression analysis of factors influencing the nutritional status of school-age children in the urban low-income areas of Addis Ababa. Findings indicate that children with parents/caregivers aged 26-35 face lower underweight risk (AOR: 0.31, 95% CI: 0.12, 0.80), as do those from smaller families (1-4 members) (AOR: 0.23, 95% CI: 0.09, 0.59). Children with divorced parents/caregivers also have a lower underweight risk (AOR: 0.10, 95% CI: 0.02, 0.48). More meal times per day correlate with lower underweight risk (AOR: 0.35, 95% CI: 0.14, 0.88) while attending public schools increases the risk of being overweight (AOR: 3.86, 95% CI: 1.55, 9.59).
4. Discussion
Our study sought to examine dietary factors and their association with the nutritional status of school-age children attending public and private schools in Addis Ababa. A community-based cross-sectional study involving 309 participants was conducted. Anthropometric measurements were performed using standardized techniques. Dietary diversity was assessed using a 24-hour recall questionnaire. Subsequent analysis was performed using SPSS version 23 software. To identify statistically significant variables, adjusted odds ratios along with their corresponding 95% confidence intervals were utilized. This finding indicates acceptable macronutrient intake but lower consumption of micronutrients, with a notable reliance on fats oils, and legumes as the second most consumed food group, underscoring the importance of achieving a balanced nutrient intake across various food groups.
We found a stunting rate of 24.3% among school-age children, which is consistent with a study from Jimma [30]. However, quite lower than estimates from several other regions in Ethiopia including Arba Minch city (41.9%) [31], Gondar town (46.1%) [32], and Humbo District (57%) [33]. On the other hand, it is higher than estimates from Bahir Dar City (15.13%) [34] and Eastern Ethiopia (8.9%) [35].
Compared to international figures, it exceeds the rates of stunting in urban areas from many other African countries, such as South Africa (9%) [36], and Egypt (7.8%) [37]. It also exceeds rates in Mexico (10%) [38]. This variation is likely due to differences in study settings, methods, sample sizes, socioeconomic factors, dietary practices, environmental conditions, and healthcare services among the diverse communities. This signifies the significant burden of stunting in urban Ethiopia.
A recent study identified significant factors associated with stunting in school-age children. The study found that the marital status of parents/caregivers and house ownership were significant factors. Single parents/caregivers face challenges in providing adequate nutrition and psychosocial stimulation, which could lead to stunting [39]. Additionally, children living in rented or government-owned houses have limited access to water, sanitation, and hygiene facilities, thereby increasing the risk of infections and malnutrition [40]. The educational level of the parents/ caregivers/ was found to be significant, with lower levels of education being associated with higher odds of stunting. These findings align with those of studies in Ethiopia [41], and Indonesia [40].
Another significant association was found between child sex and stunting, with female children being less likely to suffer from stunting than male children. This finding is consistent with studies conducted in Ethiopia [42], India [43], and Tanzania [44], but differs from some studies conducted in China and Pakistan [45,46], possibly due to socio-cultural factors that affect child nutrition and health. Additionally, it was found that children who skipped meals were more likely to experience stunted growth, which is supported by studies conducted in Ethiopia [31], and Egypt [37]. The study also highlighted the impact of caregivers' nutritional knowledge on the risk of stunting. Caregivers who were unaware of nutritional issues had a higher risk of stunting among the schoolchildren. This aligns with findings from a study conducted in Tanzania [47], which emphasizes the importance of nutrition education in influencing food quality and diversity in children.
In the present study, the prevalence of wasting among school children was 15%. This result is lower than that of a systematic review on Ethiopia, which reported a prevalence of 22% [42] as well as the study conducted in the Gedeo Zone, South Ethiopia, which found a prevalence of 18.2% [48], and Zegie Peninsula, northwestern Ethiopia with 27.6% [49]. However, our result is higher than that of Gondar Town, northwest Ethiopia, with a prevalence of 9%-11% [32], and the Philippines with 9.5% [50]. However, our results were lower than those of studies conducted in Northern Sri Lanka which reported a prevalence of wasting of 30.6% for boys and 29.1% for girls [51].
This study revealed a statistically significant association between the wealth index (WI) and wasting among school-age children, which aligns with previous findings in the Philippines [52], and South Ari District in Southern Ethiopia [53]. Furthermore, the odds of wasting were significantly lower for children aged 11-14 years compared to those aged 6-10 years, which is consistent with studies conducted in Gondar town, northwestern Ethiopia [32], Gedeo Zone in South Ethiopia [48], Northern Sri Lanka [51], the Philippines [52], and North East of Morocco [54]. Additionally, children who consumed four or more food groups had lower odds of wasting, as supported by similar studies conducted in the Semien Bench district in Ethiopia [55], and rural Bangladesh [56].
The study also discovered a significant link between dietary habits and wasting, which is supported by previous studies conducted in Tabriz, Iran [57], and the Abuja Municipal Area Council [58]. Children who did not consume any absorption inhibitor (AI=No) had 74% lower odds of wasting than those who consumed an absorption inhibitor (AI=Yes). This finding is consistent with that of a previous study conducted in Gondar town, northwest Ethiopia [59]. Furthermore, access to water supplies and toilet facilities was associated with significantly lower odds of wasting, which is in agreement with studies conducted in rural Ethiopia [60], and Bangladesh [61]. These findings highlight the multifaceted impacts of socioeconomic factors, dietary practices, and access to basic amenities on the prevalence of wasting among school-age children.
The study found that 36% of school-age children were underweight. Our study's prevalence of underweight was higher than that reported in a previous study elsewhere in Ethiopia [41], but lower than that reported in studies from Gondar Zuria District [62], and Central India [63]. Differences in study design, sample size, sampling methodology, data collection strategy, data quality, sociodemographic traits, food habits, degree of physical activity, and environmental factors can contribute to these discrepancies [64].
Our study discovered a significant connection between the age group of parents or caregivers and the nutritional status of children. This finding is consistent with a study conducted in Terengganu, Malaysia [65], which demonstrated a positive correlation between parental age and the risk of underweight in children. Likewise, children born to younger mothers had a lower likelihood of underweight [6]. The likelihood of being underweight was lower for children in households with 1-4 family members compared to those with more than 8 family members, which is consistent with studies conducted in different Ethiopian settings [6]. Additionally, children who had less than three mealtimes per day were more likely to be underweight, highlighting the significance of having regular and sufficient meals to prevent undernutrition. This finding is further supported by research conducted in Bangladesh [66].
Additionally, our study found that 19% of school-aged children were overweight, which is consistent with a study conducted in Kenya [67] and Tanzania's Morogoro region [91]. However, our results were higher than those of a previous study in Ethiopia reported by [68] and other developing countries, including Palestine [69], Lomé, Togo [70], the Caribbean [71], and Southern Nigeria [72]. However, it was lower than the prevalence observed in Argentina [73], Albania [74], and Bangladesh [75]. These differences may be attributed to variations in the methods of measuring and defining overweight, sample size and characteristics, socioeconomic and environmental factors, dietary and physical activity patterns, and genetic and biological factors among different populations [76].
The study also found a significant association between school type and being overweight among school-age children. Those attending public schools had a 65% lower chance of being overweight than their counterparts in private schools. This aligns with previous studies conducted in Bahir Dar City [77], Dire Dawa in Eastern Ethiopia [78], Tanzania [68], Kerman province, and Iran [79]. However, our results are inconsistent with a study conducted in Spain [80], which showed that children from public schools were more likely to have excess weight than those from private schools. This discrepancy could be explained by different government funding for school feeding programs in high-income nations such as Spain and low-income nations such as Ethiopia.
5. Limitations of the Study
This study had several limitations that should be acknowledged. These limitations include, such as its cross-sectional design, reliance on self-reported data, and limited generalizability. However, despite these limitations, the study still provides valuable information for policymakers, healthcare professionals, and researchers. It, reveals the factors that influence the nutritional status of school-age children and also offers recommendations for comprehensive, context-specific interventions.
6. Conclusions
Generally, the study reveals high levels of both undernutrition and overnutrition among school-age children in urban low-income settings in Addis Ababa. The adjusted analysis identified key factors that influence stunting, wasting, underweight, and overweight, including parents' marital status, house ownership, education, child's gender, meal habits, and nutrition knowledge. Interventions should target socio-economic factors, parental education, and dietary practices. This study emphasizes the need for coordinated efforts by the government, scholars, and communities to address the complex nature of malnutrition. Furthermore, it suggests improving existing nutrition programs, creating a healthier school environment, integrating cultural and behavioral aspects into interventions, and considering the effect of urbanization on nutrition.
Author Contributions
Conceptualization, Y.M, A.A, and T.Z.; methodology, Y.M.; software, Y.M.; validation, Y.M., A.A. and T.Z.; formal analysis, Y.M.; investigation, Y.M.; resources, Y.M.; data curation, Y.M.; writing—original draft preparation, Y.M.; writing—review and editing, Y.M, A.A, and T.Z.; visualization, Y.M.; supervision, Y.M.; project administration, Y.M.; funding acquisition, A.A. All authors have read and agreed to the published version of the manuscript.
Funding
This research received no external funding
Institutional Review Board Statement
The study was conducted as per the Declaration of Helsinki, and approved by The Institutional Review Board (IRB) of the College of Natural and Computational Sciences of Addis Ababa University (AAU) (code of approval: CNCSDO/515/15/2023, date of approval February 20, 2023.
Informed Consent Statement
Both accents and informed consent were obtained from all subjects involved in the study. Written informed consent has been obtained from study participants to publish this paper.
Data Availability Statement
The dataset supporting the conclusion presented in this article is available on request from the corresponding author on reasonable request.
Acknowledgments
We extend our gratitude to all the staff for their cooperation. Additionally, we thank the staff at the Center of Food Science and Nutrition at Addis Ababa University for their collaboration. The authors would also like to acknowledge the data collectors, supervisors, and study participants.
Conflicts of Interest
The authors declare no conflicts of interest.
References
- Kimani-Murage, E.W.; Muthuri, S.K.; Oti, S.O.; Mutua, M.K.; Van De Vijver, S.; Kyobutungi, C. Evidence of a double burden of malnutrition in urban poor settings in Nairobi, Kenya. PLoS ONE 2015, 10. [Google Scholar] [CrossRef]
- Malnutrition. Available online: https://www.who.int/news-room/fact-sheets/detail/malnutrition (accessed on 20 December 2023).
- Levels and trends in child malnutrition: UNICEF/WHO/The World Bank Group joint child malnutrition estimates: key findings of the 2021 edition. Available online: https://www.who.int/publications/i/item/9789240025257 (accessed on 5 May 2021).
- UNICEF Ethiopia Country Office Annual Report 2021. Available online: https://www.unicef.org/reports/country-regional-divisional-annual-reports-2021/Ethiopia (accessed on March 2022).
- Mohammed, S.H.; Habtewold, T.D.; Arero, A.G.; Esmaillzadeh, A. The state of child nutrition in Ethiopia: an umbrella review of systematic review and meta-analysis reports. BMC Pediatr 2020, 20, 404. [Google Scholar] [CrossRef]
- Degarege, D.; Degarege, A.; Animut, A. Undernutrition and associated risk factors among school-age children in Addis Ababa, Ethiopia Global health. BMC Public Health 2015, 15, 1–9. [Google Scholar] [CrossRef]
- 7. Unicef. UNICEF, WHO, The World BANK. Levels and Trends in Child Malnutrition, Joint Child Malnutrition Estimates 2020 Edition. 2020 Edition 2020.
- Hirvonen, K.; de Brauw, A.; Abate, G.T. Food Consumption and Food Security during the COVID-19 Pandemic in Addis Ababa. Am J Agric Econ 2021, 103, 772–789. [Google Scholar] [CrossRef]
- Vilar-Compte, M.; Burrola-Méndez, S.; Lozano-Marrufo, A.; Ferré-Eguiluz, I.; Flores, D.; Gaitán-Rossi, P.; Teruel, G.; Pérez-Escamilla, R. Urban poverty and nutrition challenges associated with accessibility to a healthy diet: a global systematic literature review. International Journal for Equity in Health 2021, 20. [Google Scholar] [CrossRef] [PubMed]
- Popkin, B.M.; Corvalan, C.; Grummer-Strawn, L.M. Dynamics of the double burden of malnutrition and the changing nutrition reality. The Lancet 2020, 395. [Google Scholar] [CrossRef] [PubMed]
- Min, J.; Zhao, Y.; Slivka, L.; Wang, Y. Double burden of diseases worldwide: coexistence of undernutrition and overnutrition-related non-communicable chronic diseases. Obes Rev 2018, 19, 49–61. [Google Scholar] [CrossRef] [PubMed]
- Healthy Eating Learning Opportunities and Nutrition Education. Available online: https://www.cdc.gov/healthyschools/nutrition/school_nutrition_education.htm (accessed on 10 January 2023).
- Central Statistical Agency - CSA/Ethiopia; ICF. Ethiopia Demographic and Health Survey 2016; CSA and ICF: Addis Ababa, Ethiopia, 2017. [Google Scholar]
- Population Projection. Available online: http://www.statsethiopia.gov.et/population-projection/ (accessed on July 2023).
- Issa, E.H. Life in a slum neighborhood of Addis Ababa, Ethiopia: morphological facts and their dysfunctions. Heliyon 2021, 7. [Google Scholar] [CrossRef]
- World Medical Association Declaration of Helsinki: ethical principles for medical research involving human subjects. Jama 2013, 310, 2191–2194. [CrossRef]
- Ogston, S.A.; Lemeshow, S.; Hosmer, D.W.; Klar, J.; Lwanga, S.K. Adequacy of Sample Size in Health Studies. Biometrics 1991, 47, 347–347. [Google Scholar] [CrossRef]
- Zerfu, M.; Mekasha, A. Anthropometric assessment of school-age children in Addis Ababa. Ethiopian Medical Journal 2006, 44, 347–352. [Google Scholar] [PubMed]
- Heidari, S.; Babor, T.F.; De Castro, P.; Tort, S.; Curno, M. Sex, and Gender Equity in Research: rationale for the SAGER guidelines and recommended use. Research Integrity and Peer Review 2016, 1, 2. [Google Scholar] [CrossRef] [PubMed]
- Rutstein, S.O. Steps to constructing the new DHS wealth index. Rockville, MD: ICF International 2015, 6. [Google Scholar]
- Ethiopia: Food-Based Dietary Guidelines-2022. Available online: https://www.fao.org/nutrition/education/food-dietary-guidelines/regions/countries/ethiopia/en/ (accessed on March 2014).
- 24-hour dietary recalls. IN: DAPA Measurement Toolkit. Available online: https://dapa-toolkit.mrc.ac.uk/diet/subjective-methods/24-hour-dietary-recall (accessed on September 2020).
- Medicine, I.o. Dietary Reference Intakes: The Essential Guide to Nutrient Requirements; The National Academies Press: Washington, DC, 2006; p. 1344. [Google Scholar]
- WHO Anthro for personal computers. Available online: http://www.who.int/childgrowth/software/en/ (accessed on September 2020).
- Guide to Anthropometry: A Practical Tool for Program Planners, Managers, and Implementers. Available online: https://www.ennonline.net/fex/58/guidetoanthropometry (accessed on Sep 13, 2018).
- IBM SPSS Statistics for Windows (Version 23.0) [Computer software]. IBM Corp. Available online: https://www.ibm.com/products/spss-statistics (accessed on Jun 27, 2022).
- EpiData Software Available online:. Available online: https://www.epidata.dk/ (accessed on June 2004).
- Lázaro Cuesta, L.; Rearte, A.; Rodríguez, S.; Niglia, M.; Scipioni, H.; Rodríguez, D.; Salinas, R.; Sosa, C.; Rasse, S. Anthropometric and biochemical assessment of nutritional status and dietary intake in school children aged 6-14 years, Province of Buenos Aires, Argentina. Arch Argent Pediatr 2018, 116, e34–e46. [Google Scholar] [CrossRef] [PubMed]
- López-Sobaler, A.M.; Aparicio, A.; Rubio, J.; Marcos, V.; Sanchidrián, R.; Santos, S.; Pérez-Farinós, N.; Dal-Re, M.; Villar-Villalba, C.; Yusta-Boyo, M.J.; et al. Adequacy of usual macronutrient intake and macronutrient distribution in children and adolescents in Spain: A National Dietary Survey on the Child and Adolescent Population, ENALIA 2013-2014. Eur J Nutr 2019, 58, 705–719. [Google Scholar] [CrossRef]
- Abate, K.H.; Belachew, T. Care and not wealth is a predictor of wasting and stunting of 'The Coffee Kids' of Jimma Zone, southwest Ethiopia. Nutr Health 2017, 23, 193–202. [Google Scholar] [CrossRef] [PubMed]
- Tariku, E.Z.; Abebe, G.A.; Melketsedik, Z.A.; Gutema, B.T. Prevalence and factors associated with stunting and thinness among school-age children in Arba Minch Health and Demographic Surveillance Site, Southern Ethiopia. PLoS One 2018, 13, e0206659. [Google Scholar] [CrossRef] [PubMed]
- Getaneh, Z.; Melku, M.; Geta, M.; Melak, T.; Hunegnaw, M.T. Prevalence and determinants of stunting and wasting among public primary school children in Gondar town, northwest, Ethiopia. BMC Pediatr 2019, 19, 207. [Google Scholar] [CrossRef] [PubMed]
- Bogale, T.Y.; Bala, E.T.; Tadesse, M.; Asamoah, B.O. Prevalence and associated factors for stunting among 6-12 years old school-age children from rural community of Humbo district, Southern Ethiopia. BMC Public Health 2018, 18, 653. [Google Scholar] [CrossRef]
- Bantie, G.M.; Aynie, A.A.; Akenew, K.H.; Belete, M.T.; Tena, E.T.; Gebretsadik, G.G.; Tsegaw, A.N.; Woldemariam, T.B.; Woya, A.A.; Melese, A.A.; et al. Prevalence of stunting and associated factors among public primary school pupils of Bahir Dar city, Ethiopia: School-based cross-sectional study. PLoS One 2021, 16, e0248108. [Google Scholar] [CrossRef]
- Mesfin, F.; Worku, A.; Birhane, Y. Prevalence and associated factors of stunting among primary school children in Eastern Ethiopia. Nutrition and Dietary Supplements 2015, 61. [Google Scholar] [CrossRef]
- Beckmann, J.; Lang, C.; du Randt, R.; Gresse, A.; Long, K.Z.; Ludyga, S.; Müller, I.; Nqweniso, S.; Pühse, U.; Utzinger, J.; et al. Prevalence of Stunting and Relationship between Stunting and Associated Risk Factors with Academic Achievement and Cognitive Function: A Cross-Sectional Study with South African Primary School Children. Int J Environ Res Public Health 2021, 18. [Google Scholar] [CrossRef] [PubMed]
- Metwally, A.M.; El-Sonbaty, M.M.; El Etreby, L.A.; El-Din, E.M.S.; Hamid, N.A.; Hussien, H.A.; Hassanin, A.; Monir, Z.M. Stunting and its determinants among governmental primary school children in Egypt: A school-based cross-sectional study. Open Access Macedonian Journal of Medical Sciences 2020, 8. [Google Scholar] [CrossRef]
- Flores, M.; Macías, N.; Rivera, M.; Barquera, S.; Hernández, L.; García-Guerra, A.; Rivera, J.A. Energy and nutrient intake among Mexican school-aged children, Mexican National Health and Nutrition Survey 2006. Salud Publica Mex 2009, 51 Suppl 4, S540–550. [Google Scholar] [CrossRef]
- Laksono, A.D.; Sukoco, N.E.W.; Rachmawati, T.; Wulandari, R.D. Factors Related to Stunting Incidence in Toddlers with Working Mothers in Indonesia. Int J Environ Res Public Health 2022, 19. [Google Scholar] [CrossRef] [PubMed]
- Hassan, F.; Asim, M.; Salim, S.; Humayun, A. House ownership, frequency of illness, fathers' education: the most significant socio-demographic determinants of poor nutritional status in adolescent girls from low-income households of Lahore, Pakistan. Int J Equity Health 2017, 16, 122. [Google Scholar] [CrossRef] [PubMed]
- Yisak, H.; Tadege, M.; Ambaw, B.; Ewunetei, A. Prevalence and Determinants of Stunting, Wasting, and Underweight Among School-Age Children Aged 6-12 Years in South Gondar Zone, Ethiopia. Pediatric Health Med Ther 2021, 12, 23–33. [Google Scholar] [CrossRef] [PubMed]
- Hailegebriel, T. Prevalence and Determinants of Stunting and Thinness/Wasting Among Schoolchildren of Ethiopia: A Systematic Review and Meta-Analysis. Food Nutr Bull 2020, 41, 474–493. [Google Scholar] [CrossRef] [PubMed]
- Srivastava, A.; Mahmood, S.E.; Srivastava, P.M.; Shrotriya, V.P.; Kumar, B. Nutritional status of school-age children - A scenario of urban slums in India. Arch Public Health 2012, 70, 8. [Google Scholar] [CrossRef]
- Altare, C.; Delbiso, T.D.; Mutwiri, G.M.; Kopplow, R.; Guha-Sapir, D. Factors Associated with Stunting among Pre-school Children in Southern Highlands of Tanzania. J Trop Pediatr 2016, 62, 390–408. [Google Scholar] [CrossRef]
- Khuwaja, S.; Selwyn, B.J.; Shah, S.M. Prevalence and correlates of stunting among primary school children in rural areas of southern Pakistan. J Trop Pediatr 2005, 51, 72–77. [Google Scholar] [CrossRef] [PubMed]
- Song, Y.; Agardh, A.; Ma, J.; Li, L.; Lei, Y.; Stafford, R.S.; Prochaska, J.J. National trends in stunting, thinness and overweight among Chinese school-aged children, 1985-2014. Int J Obes (Lond) 2019, 43, 402–411. [Google Scholar] [CrossRef] [PubMed]
- Russell, A.L.; Hentschel, E.; Fulcher, I.; Ravà, M.S.; Abdulkarim, G.; Abdalla, O.; Said, S.; Khamis, H.; Hedt-Gauthier, B.; Wilson, K. Caregiver parenting practices, dietary diversity knowledge, and association with early childhood development outcomes among children aged 18-29 months in Zanzibar, Tanzania: a cross-sectional survey. BMC Public Health 2022, 22, 762. [Google Scholar] [CrossRef] [PubMed]
- Molla, W.; Argaw, D.; Kabthymer, R.H.; Wudneh, A. Prevalence and associated factors of wasting among school children in Ethiopia: Multi-centered cross-sectional study. Clinical Epidemiology and Global Health 2022, 14, 100965. [Google Scholar] [CrossRef]
- Abdi, M.; Nibret, E.; Munshea, A. Prevalence of intestinal helminthic infections and malnutrition among schoolchildren of the Zegie Peninsula, northwestern Ethiopia. J Infect Public Health 2017, 10, 84–92. [Google Scholar] [CrossRef] [PubMed]
- Mationg, M.L.S.; Williams, G.M.; Tallo, V.L.; Olveda, R.M.; Aung, E.; Alday, P.; Reñosa, M.D.; Daga, C.M.; Landicho, J.; Demonteverde, M.P.; et al. Soil-transmitted helminth infections and nutritional indices among Filipino schoolchildren. PLoS Negl Trop Dis 2021, 15, e0010008. [Google Scholar] [CrossRef] [PubMed]
- Sathiadas, M.G.; Antonyraja, A.; Viswalingam, A.; Thangaraja, K.; Wickramasinghe, V.P. Nutritional status of school children living in Northern part of Sri Lanka. BMC Pediatr 2021, 21, 43. [Google Scholar] [CrossRef] [PubMed]
- Dela Luna, K.L.G.; Talavera, M.T.M. Factors Affecting the Nutritional Status of School-aged Children Belonging to Farming Households in the Philippines. Philippine Journal of Science 2021, 150. [Google Scholar] [CrossRef]
- Toma, T.M.; Andargie, K.T.; Alula, R.A.; Kebede, B.M.; Gujo, M.M. Factors associated with wasting and stunting among children aged 06-59 months in South Ari District, Southern Ethiopia: a community-based cross-sectional study. BMC Nutr 2023, 9, 34. [Google Scholar] [CrossRef]
- El Hioui, M.; Ahami, A.; Fadel, H.; Azzaoui, F.-Z. Anthropometric measurements of school children in North-Eastern Morocco. International Research Journal of Public and Environmental Health 2020, 7. [Google Scholar] [CrossRef]
- Fufa, D.A.; Laloto, T.D. Factors associated with undernutrition among children aged between 6–36 months in Semien Bench district, Ethiopia. Heliyon 2021, 7. [Google Scholar] [CrossRef] [PubMed]
- Rah, J.H.; Akhter, N.; Semba, R.D.; Pee, S.D.; Bloem, M.W.; Campbell, A.A.; Moench-Pfanner, R.; Sun, K.; Badham, J.; Kraemer, K. Low dietary diversity is a predictor of child stunting in rural Bangladesh. European Journal of Clinical Nutrition 2010, 64. [Google Scholar] [CrossRef]
- Alipour, B.; Abbasalizad Farhangi, M.; Asghari, S.; Amirkhizi, F.; Dahri, M.; Abedimanesh, N.; Farsad-Naimi, A.; Hojegani, S. Child-specific food insecurity and its sociodemographic and nutritional determinants among Iranian schoolchildren. Ecology of Food and Nutrition 2016, 55. [Google Scholar] [CrossRef] [PubMed]
- Otuneye, A.T.; Ahmed, P.A.; Abdulkarim, A.A.; Aluko, O.O.; Shatima, D.R. Relationship between dietary habits and nutritional status among adolescents in Abuja municipal area council of Nigeria. Nigerian Journal of Paediatrics 2017, 44. [Google Scholar] [CrossRef]
- Getaneh, Z.; Melku, M.; Geta, M.; Melak, T.; Hunegnaw, M.T. Prevalence and determinants of stunting and wasting among public primary school children in Gondar town, northwest, Ethiopia. BMC Pediatrics 2019, 19. [Google Scholar] [CrossRef] [PubMed]
- van Cooten, M.H.; Bilal, S.M.; Gebremedhin, S.; Spigt, M. The association between acute malnutrition and water, sanitation, and hygiene among children aged 6-59 months in rural Ethiopia. Matern Child Nutr 2019, 15, e12631. [Google Scholar] [CrossRef] [PubMed]
- Hasan, M.M.; Asif, C.A.A.; Barua, A.; Banerjee, A.; Kalam, M.A.; Kader, A.; Wahed, T.; Noman, M.W.; Talukder, A. Association of access to water, sanitation and handwashing facilities with undernutrition of children below 5 years of age in Bangladesh: evidence from two population-based, nationally representative surveys. BMJ Open 2023, 13, e065330. [Google Scholar] [CrossRef] [PubMed]
- Tebeje, D.B.; Agitew, G.; Mengistu, N.W.; Aychiluhm, S.B. Under-nutrition and its determinants among school-aged children in northwest Ethiopia. Heliyon 2022, 8, e11235. [Google Scholar] [CrossRef] [PubMed]
- Prabhu, S.A.; Shukla, N.K.; Mandala, S.R. "Assessment of Nutritional Status of Rural Children (0-18 years) in Central India Using World Health Organization (WHO) Child Growth Standards 2007". Indian J Community Med 2020, 45, 323–327. [Google Scholar] [CrossRef]
- Gebrie, A.; Alebel, A.; Zegeye, A.; Tesfaye, B.; Ferede, A. Prevalence and associated factors of overweight/ obesity among children and adolescents in Ethiopia: a systematic review and meta-analysis. BMC Obes 2018, 5, 19. [Google Scholar] [CrossRef]
- Mohamad, R.H.; Hakim, B.N.A.; Mitra, A.K.; Shahril, M.R.; Mohamed, W.; Wafa, S.; Burgermaster, M.; Mohamed, H.J.J. Higher Parental Age and Lower Educational Level are Associated with Underweight among Preschool Children in Terengganu, Malaysia. J Gizi Pangan 2022, 17, 11–18. [Google Scholar] [CrossRef] [PubMed]
- Khanam, S.J.; Haque, M.A. Prevalence And Determinants Of Malnutrition Among Primary School Going Children In The Haor Areas Of Kishoreganj District Of Bangladesh. Heliyon 2021, 7. [Google Scholar] [CrossRef] [PubMed]
- Kyallo, F.; Makokha, A.; Mwangi, A.M. Overweight and obesity among public and private primary school children in Nairobi, Kenya. Health 2013, 05. [Google Scholar] [CrossRef]
- Mosha, T.C.; Fungo, S. Prevalence of overweight and obesity among children aged 6-12 years in Dodoma and Kinondoni municipalities, Tanzania. Tanzan J Health Res 2010, 12, 6–16. [Google Scholar] [CrossRef] [PubMed]
- Al-Lahham, S.; Jaradat, N.; Altamimi, M.; Anabtawi, O.; Irshid, A.; AlQub, M.; Dwikat, M.; Nafaa, F.; Badran, L.; Mohareb, R.; et al. Prevalence of underweight, overweight and obesity among Palestinian school-age children and the associated risk factors: a cross-sectional study. BMC Pediatr 2019, 19, 483. [Google Scholar] [CrossRef] [PubMed]
- Sagbo, H.; Ekouevi, D.K.; Ranjandriarison, D.T.; Niangoran, S.; Bakai, T.A.; Afanvi, A.; Dieudonné, S.; Kassankogno, Y.; Vanhems, P.; Khanafer, N. Prevalence and factors associated with overweight and obesity among children from primary schools in urban areas of Lomé, Togo. Public Health Nutr 2018, 21, 1048–1056. [Google Scholar] [CrossRef] [PubMed]
- Mumena, W.A.; Francis-Granderson, I.; Phillip, L.E.; Gray-Donald, K. Rapid increase of overweight and obesity among primary school-aged children in the Caribbean; high initial BMI is the most significant predictor. BMC Obes 2018, 5, 4. [Google Scholar] [CrossRef]
- Ene-Obong, H.; Ibeanu, V.; Onuoha, N.; Ejekwu, A. Prevalence of overweight, obesity, and thinness among urban school-aged children and adolescents in southern Nigeria. Food Nutr Bull 2012, 33, 242–250. [Google Scholar] [CrossRef]
- Kovalskys, I.; Rausch Herscovici, C.; De Gregorio, M.J. Nutritional status of school-aged children of Buenos Aires, Argentina: data using three references. J Public Health (Oxf) 2011, 33, 403–411. [Google Scholar] [CrossRef]
- Tarp, J.; Jarani, J.; Muca, F.; Spahi, A.; Grøntved, A. Prevalence of overweight and obesity and anthropometric reference centiles for Albanian children and adolescents living in four Balkan nation-states. J Pediatr Endocrinol Metab 2018, 31, 1199–1206. [Google Scholar] [CrossRef]
- Tariqujjaman, M.; Sheikh, S.P.; Smith, G.; Hasan, A.M.R.; Khatun, F.; Kabir, A.; Rashid, M.H.; Rasheed, S. Determinants of Double Burden of Malnutrition Among School Children and Adolescents in Urban Dhaka: A Multi-Level Analyses. Front Public Health 2022, 10, 926571. [Google Scholar] [CrossRef] [PubMed]
- Tong, Z.; Kong, Z.; Jia, X.; Zhang, H.; Zhang, Y. Multiscale Impact of Environmental and Socio-Economic Factors on Low Physical Fitness among Chinese Adolescents and Regionalized Coping Strategies. Int J Environ Res Public Health 2022, 19. [Google Scholar] [CrossRef] [PubMed]
- Mekonnen, T.; Tariku, A.; Abebe, S.M. Overweight/obesity among school-aged children in Bahir Dar City: Cross-sectional study. Italian Journal of Pediatrics 2018, 44. [Google Scholar] [CrossRef] [PubMed]
- Desalew, A.; Mandesh, A.; Semahegn, A. Childhood overweight, obesity and associated factors among primary school children in dire dawa, eastern Ethiopia; a cross-sectional study. BMC Obes 2017, 4, 20. [Google Scholar] [CrossRef] [PubMed]
- Sanjari, M.; Amirkhosravi, L.; Hosseini, S.E.; Tavakolinejad Kermani, M.; Abdollahi, F.; Maghfoori, A.; Eghbalian, M. Underweight, overweight, obesity and associated factors among elementary school children: A cross-sectional study in Kerman province, Iran. Obesity Medicine 2023, 38, 100477. [Google Scholar] [CrossRef]
- López-Gil, J.F.; López-Benavente, A.; Tárraga López, P.J.; Yuste Lucas, J.L. Sociodemographic Correlates of Obesity among Spanish Schoolchildren: A Cross-Sectional Study. Children (Basel) 2020, 7. [Google Scholar] [CrossRef]
Figure 1.
The average intake of nutrients by school-age children versus the recommended daily value.
Figure 1.
The average intake of nutrients by school-age children versus the recommended daily value.
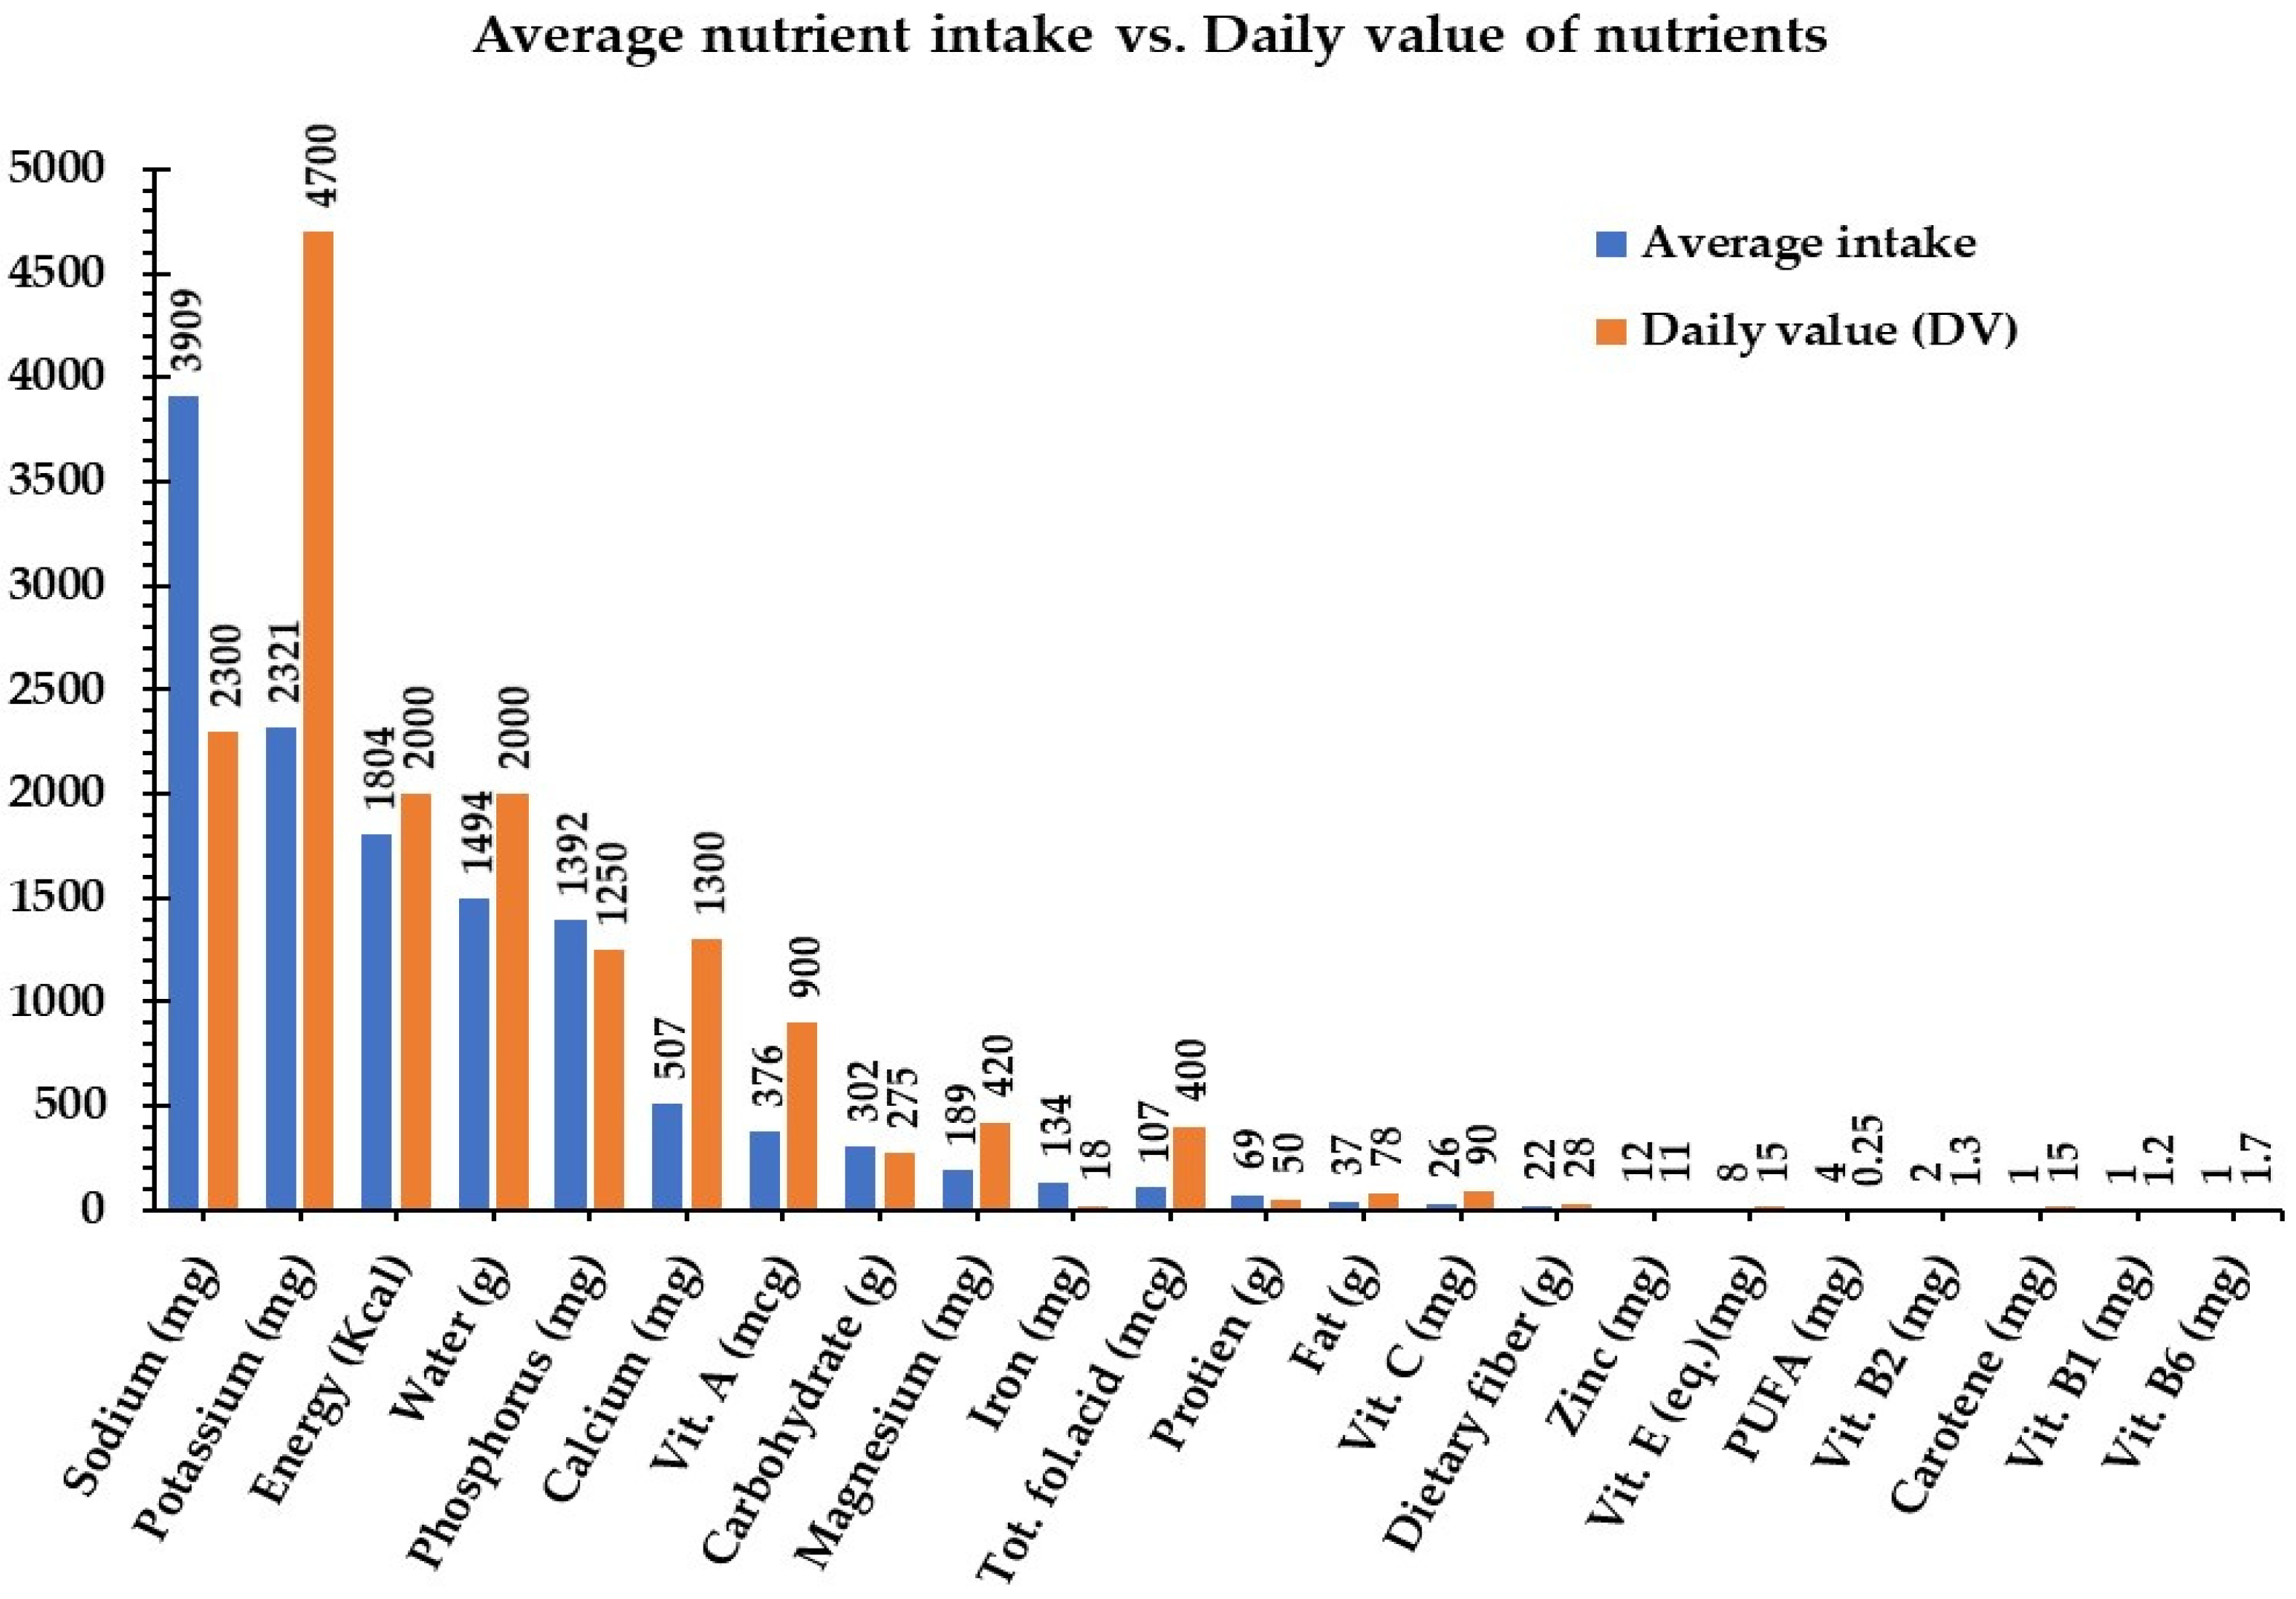
Figure 2.
The distribution of nutrient intake within school-type.
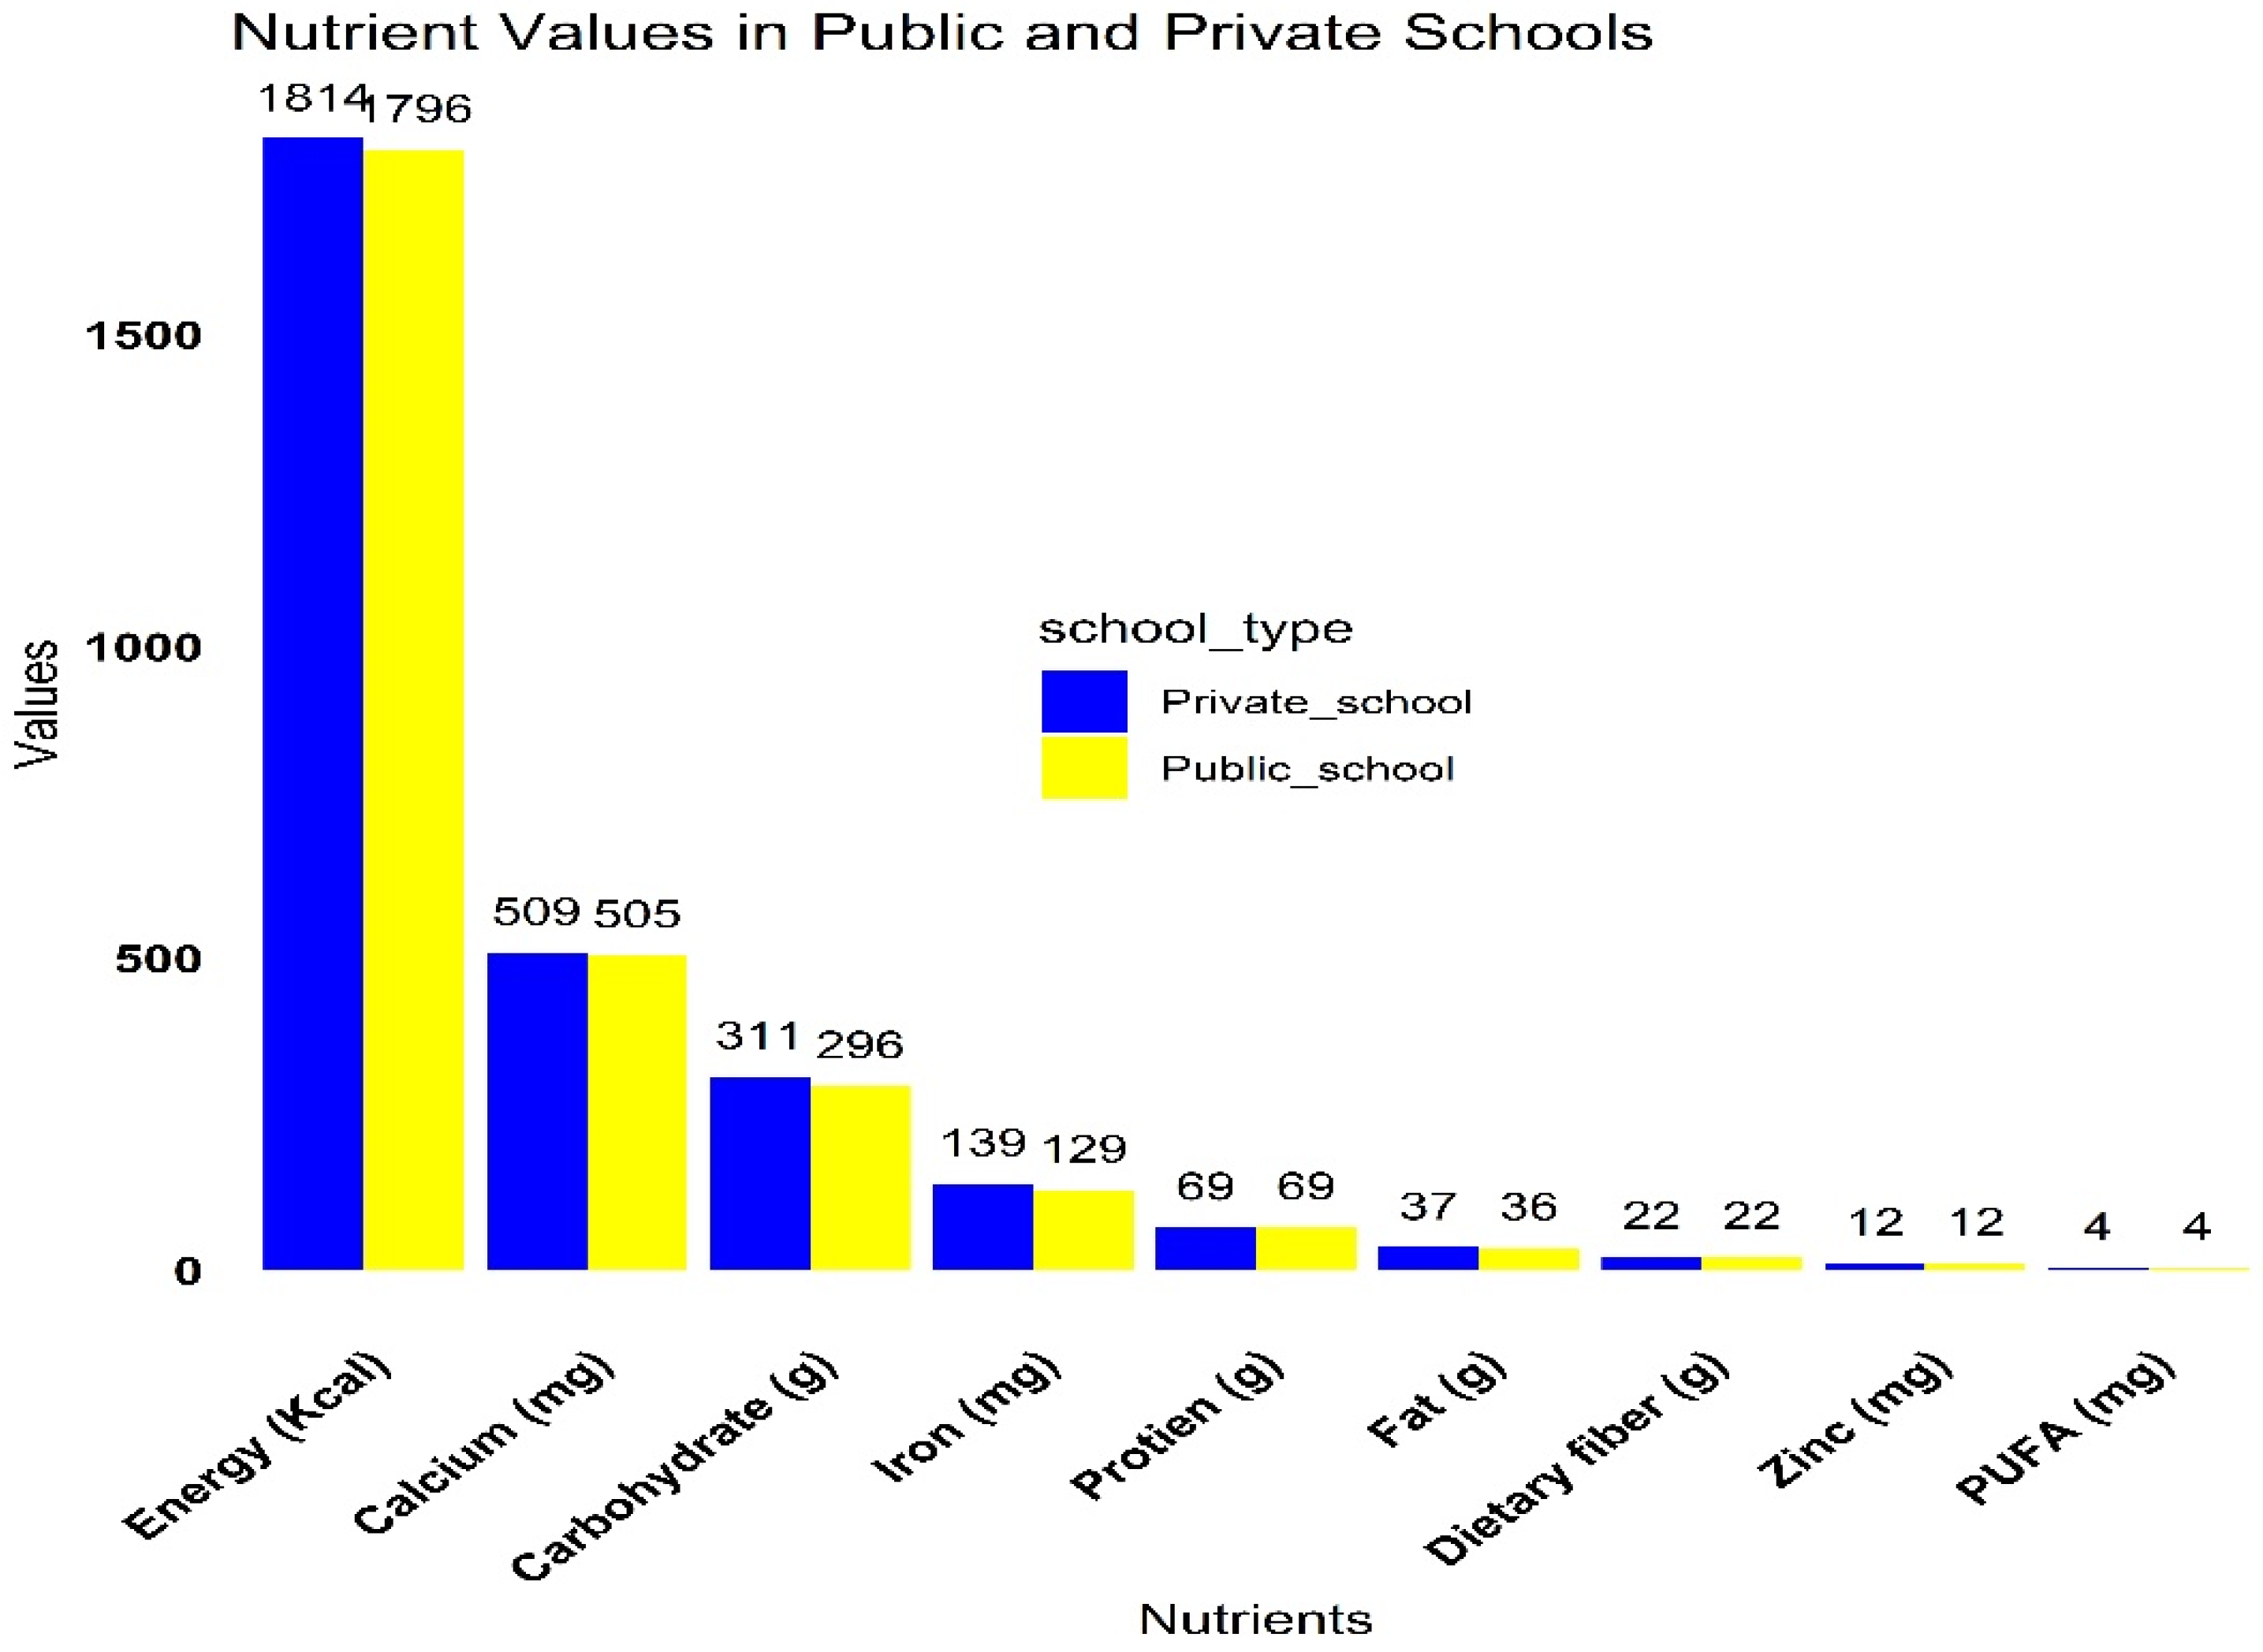
Figure 3.
Percentage distribution of food categories consumed by school children in urban low-income areas of Addis Ababa.
Figure 3.
Percentage distribution of food categories consumed by school children in urban low-income areas of Addis Ababa.
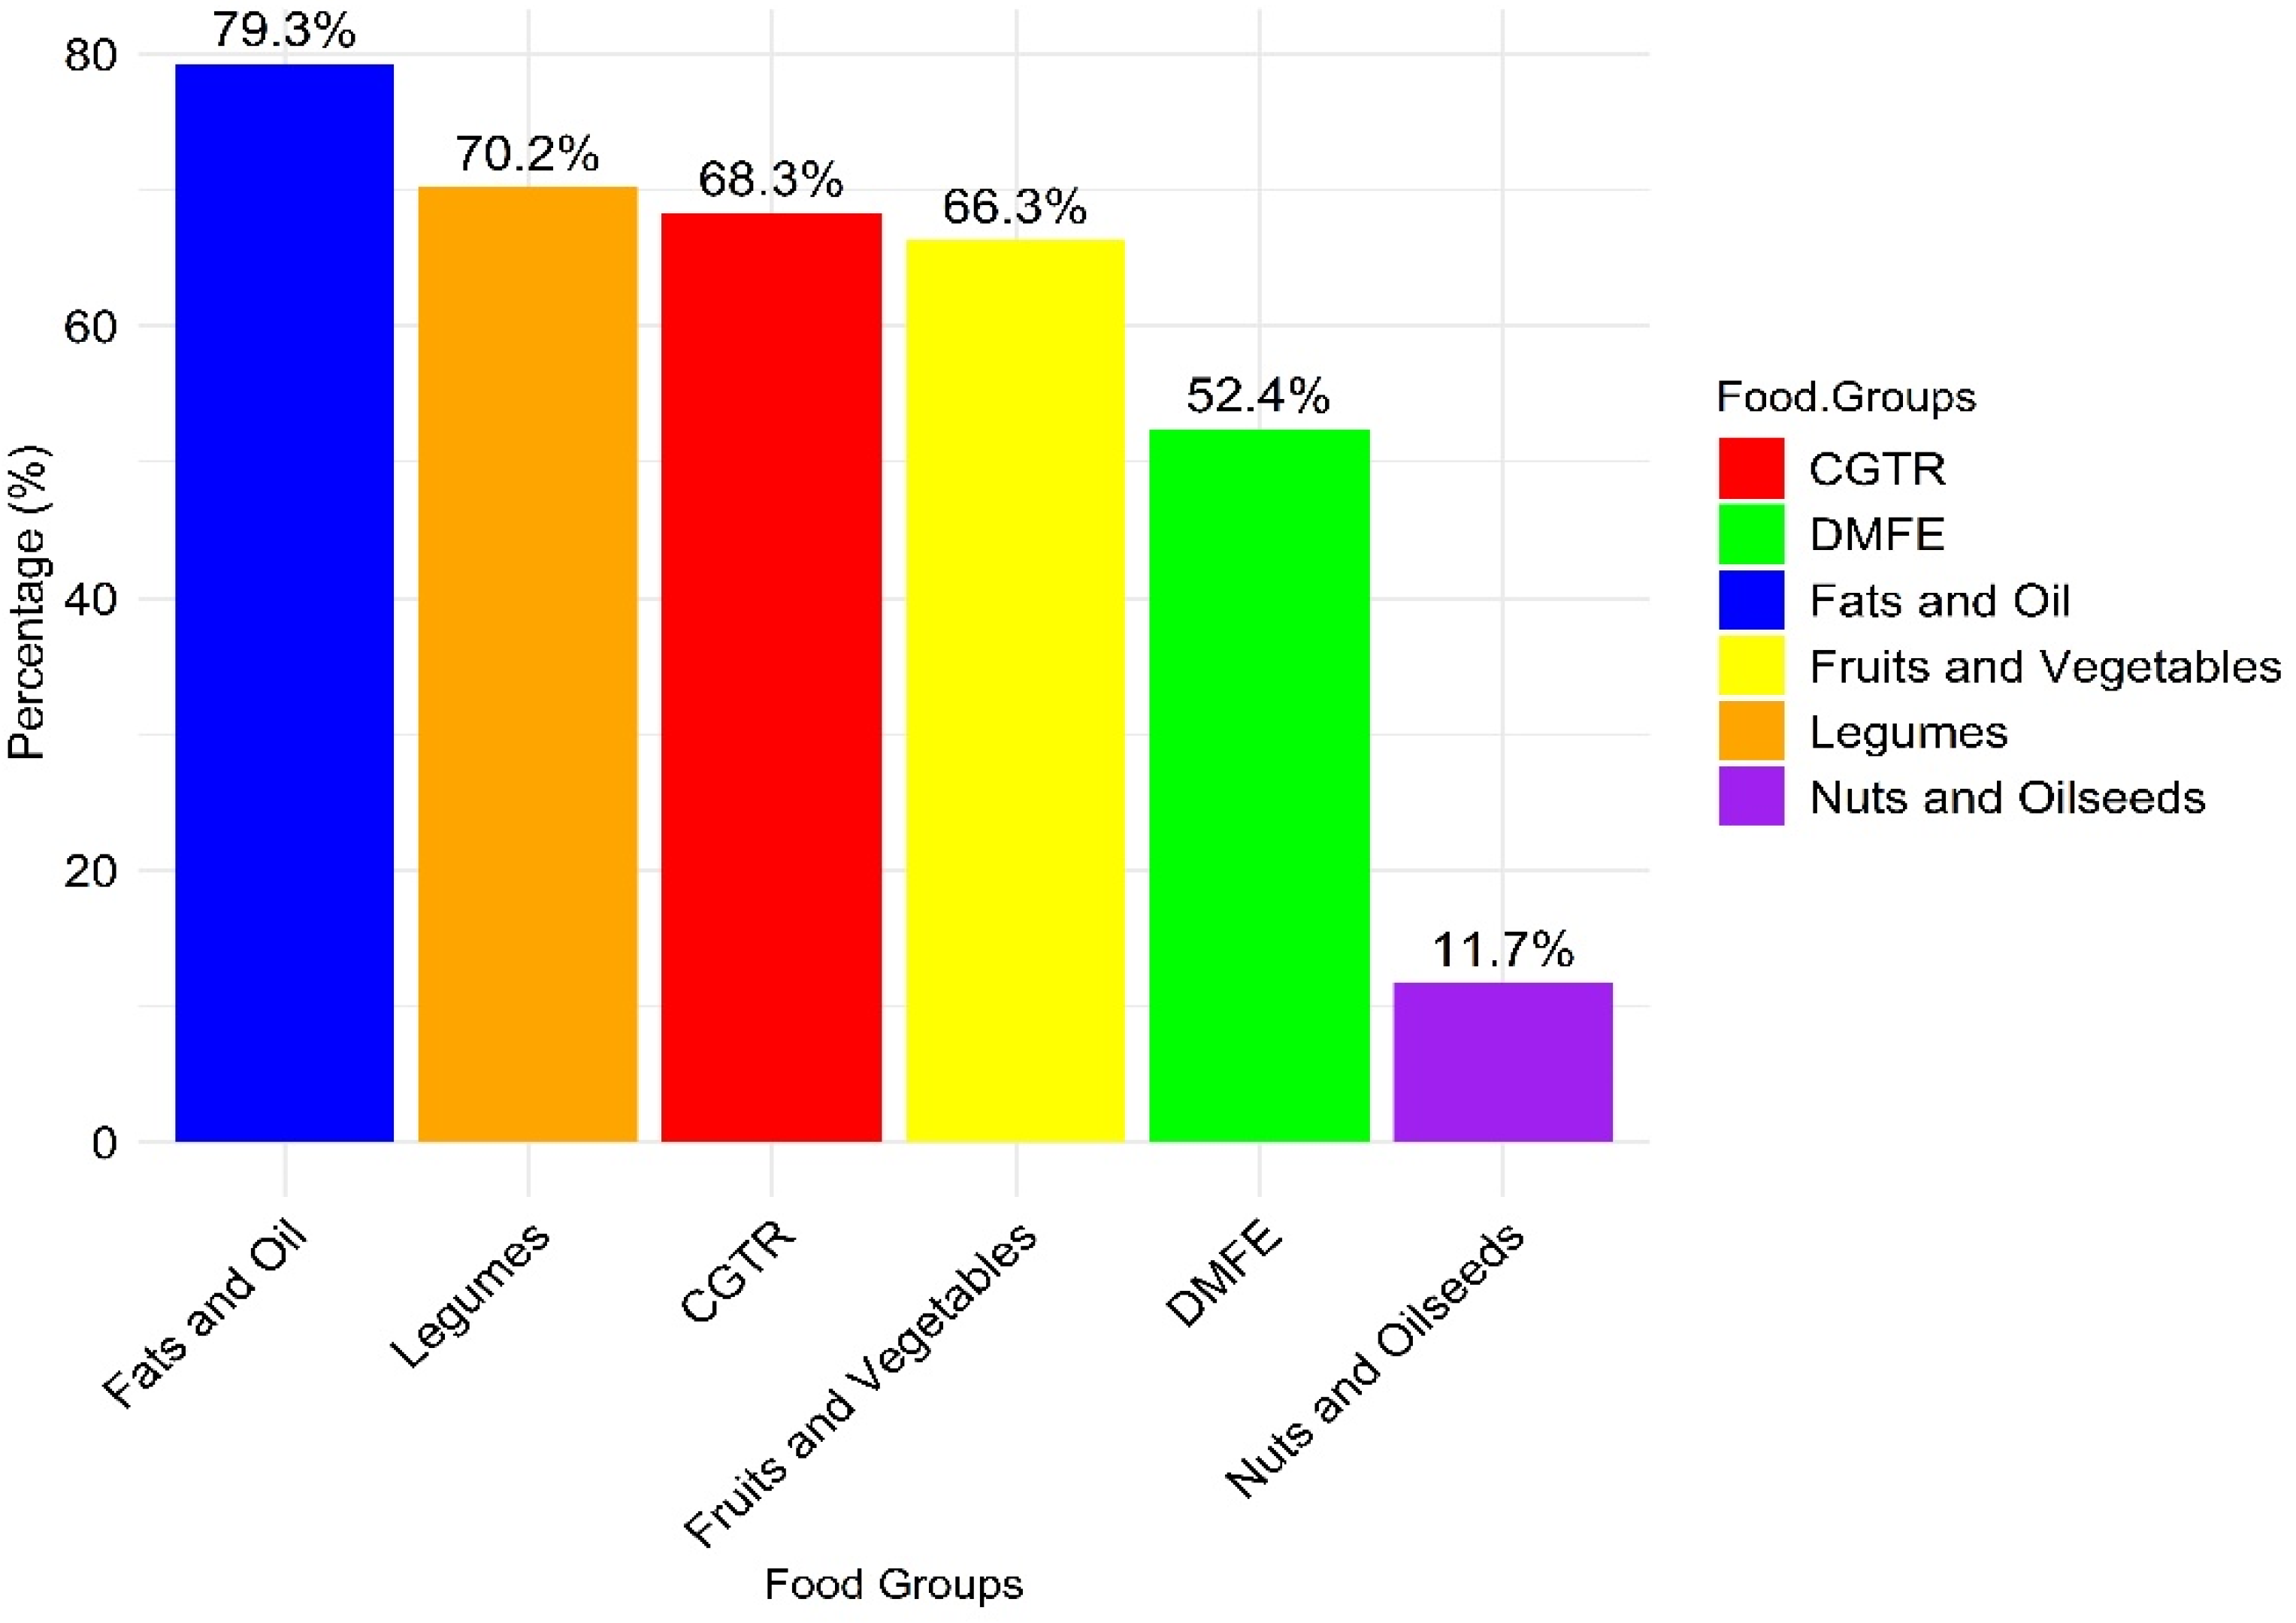

Table 1.
Socio-demographic characteristics of caregivers/parents in urban low-income settings of Addis Ababa, Ethiopia, 2023.
Table 1.
Socio-demographic characteristics of caregivers/parents in urban low-income settings of Addis Ababa, Ethiopia, 2023.
| Background characteristics | Categories | n / (%) |
|---|---|---|
| Caregivers/parents Age | 18-25 years | 94(30.4) |
| 26-35 years | 102(33.0) | |
| 36 and above | 113(36.6) | |
| Gender | Male | 146(47.2) |
| Female | 163(52.8) | |
| Family size | 1-4 family size | 142(46.0) |
| 5-8 family size | 94(30.4) | |
| Above 8 families | 73(23.6) | |
| Marital status | Married | 207(67.0) |
| Single | 53(17.2) | |
| Divorced | 29(9.4) | |
| Widowed | 20(6.5) | |
| Educational status | Diploma and above | 189(61.2) |
| 9-12 grade | 62(20.1) | |
| 1-8 grade | 23(7.4) | |
| Read and write only | 18(5.8) | |
| Unable to read and write | 17(5.5) | |
| Occupation | Government | 72(23.3) |
| Private | 108(35.0) | |
| Farmer | 11(3.6) | |
| Merchant | 68(22.0) | |
| Housewife | 50(16.2) | |
| Household income | Low | 88(28.5) |
| Middle | 78(25.2) | |
| High | 143(46.3) | |
| Religion | Orthodox Christian | 141(45.6) |
| Muslim | 75(24.3) | |
| Protestant | 64(20.7) | |
| Others* | 29(9.4) | |
| House owner | Private Owned | 162(52.4) |
| Rent from private | 105(34.0) | |
| Rent from gov't | 42(13.6) | |
| Wealth index | Poor | 85(27.5) |
| Middle | 106(34.3) | |
| Rich | 118(38.2) |
% = percentage of respondent, n = number of respondents * Catholic, Jehovah, and wake feta.
Table 2.
Socio-demographic characteristics, nutritional status, and dietary diversity score of children in urban low-income settings of Addis Ababa, Ethiopia, 2023.
Table 2.
Socio-demographic characteristics, nutritional status, and dietary diversity score of children in urban low-income settings of Addis Ababa, Ethiopia, 2023.
| Characteristics | Categories | n / (%) |
|---|---|---|
| Age in years | 6-10 years | 154(49.8) |
| 11-14 years | 155(50.2) | |
| Sex | Male | 131(42.4) |
| Female | 178(57.6) | |
| School type | Public school | 172(55.7) |
| Private school | 137(44.3) | |
| Children school grade | 1-4 Grade | 150(48.5) |
| 5-8 Grade | 159(51.5) | |
| Meal frequency | Less than three meal times | 153(49.5) |
| Three and above 3 meal times | 156(50.5) | |
| Dietary diversity score | <4 food groups | 203(65.7) |
| 4 and above food groups | 106(34.3) | |
| Skipping meal | Not skipped | 134(43.4) |
| Skipped | 175(56.6) | |
| Dietary habit | Good dietary habit | 125(40.5) |
| Poor dietary habit | 184(59.5) | |
| Absorption inhibitor | No | 145(46.9) |
| Yes | 164(53.1) | |
| Water supply | No | 122(39.5) |
| Yes | 187(60.5) | |
| Toilet | No | 173(56.0) |
| Yes | 136(44.0) | |
| Wasting | Wasting | 46(14.9) |
| Stunted indices | Stunted | 75(24.3) |
| BMI Indices | Underweight | 111(35.9) |
| Overweight | 58(18.8) | |
| Height for age | Mean±SD | -.78±1.59 |
| BMI for age | Mean±SD | -1.03±2.08 |
| MUAC (mm) | Mean±SD | 194±29 |
| Weight (kg) | Mean±SD | 32.1±9.7 |
| Height (cm) | Mean±SD | 139.8±15.3 |
% = percentage of the respondent, MUAC= mid-upper arm circumference, BMI = body mass index, Mean = average value, SD = standard deviation.
Table 3.
Multivariate logistic regression analysis for factors associated with stunting among school-age children (n=309), urban low-income settings of Addis Ababa, Ethiopia, 2023.
Table 3.
Multivariate logistic regression analysis for factors associated with stunting among school-age children (n=309), urban low-income settings of Addis Ababa, Ethiopia, 2023.
| Predictor variables | Stunting (Height for age) HAZ<-2SDa | |||||
|---|---|---|---|---|---|---|
| No (%) | Yes (%) | COR (95%CI) | p<0.05 | AOR (95%CI) | p<0.05 | |
| Gender | ||||||
| Male | 103(44.0) | 43(57.3) | Ref | Ref | ||
| Female | 131(56.0) | 32(42.7) | 0.59(0.35,0.99) | 0.046 | 0.69 (0.35,1.38) | 0.297 |
| Marital status | ||||||
| Married | 174(74.4) | 33(44.0) | Ref | Ref | ||
| Single** | 29(12.4) | 24(32.0) | 4.36 (2.26,8.41) | 0.000 | 5.19(2.37,11.4) | 0.000 |
| Divorced** | 18(7.7) | 11(14.7) | 3.22 (1.39,7.44) | 0.006 | 3.15(1.17,8.48) | 0.023 |
| Widowed | 13(5.6) | 7(9.3) | 2.84 (1.06,7.65) | 0.039 | 1.59(0.45,5.57) | 0.469 |
| House owner | ||||||
| Private Owned | 139(59.4) | 23(30.7) | Ref | Ref | ||
| Rent from private** | 68(29.1) | 37(49.3) | 3.29 (1.81,5.97) | 0.000 | 3.76(1.82,7.79) | 0.000 |
| Rent from gov't** | 27(11.5) | 15(20.0) | 3.36 (1.55,7.25) | 0.002 | 3.86(1.55,9.59) | 0.004 |
| Education level of parents | ||||||
| Diploma and above | 161(68.8) | 28(37.3) | Ref | Ref | ||
| 9-12 grade** | 41(17.5) | 21(28.0) | 2.95 (1.52,5.71) | 0.001 | 3.60(1.61,8.07) | 0.002 |
| 1-8 grade** | 13(5.6) | 10(13.3) | 4.42 (1.77,11.06) | 0.001 | 4.14(1.46,11.72) | 0.008 |
| Read and write only** | 10(4.3) | 8(10.7) | 4.60 (1.67,12.66) | 0.003 | 4.98(1.49,16.64) | 0.009 |
| Unable to read and write* | 9(3.8) | 8(10.7) | 5.11 (1.82,14.37) | 0.002 | 4.16(1.19,14.51) | 0.025 |
| Child gender | ||||||
| Male | 87(37.2) | 44(58.7) | Ref | Ref | ||
| Female* | 147(62.8) | 31(41.3) | 0.42 (0.25,0.71) | 0.001 | 0.43 (0.22,0.83) | 0.012 |
| Meal skipping | ||||||
| Not skipped | 115(49.1) | 19(25.3) | Ref | Ref | ||
| Skipped** | 119(50.9) | 56(74.7) | 2.85 (1.60,5.09) | 0.000 | 2.77 (1.35,5.66) | 0.005 |
| Information about nutrition | ||||||
| Awareness | 157(67.1) | 32(42.7) | Ref | Ref | ||
| Lack of awareness* | 77(32.9) | 43(57.3) | 2.74 (1.61,4.67) | 0.000 | 1.99 (1.05,3.79) | 0.035 |
All the first explanatory variables and outcome variables are set to “reference category”. a Except p-value all figures in the table are rounded to two digits. AOR = Adjusted Odd Ratio; CI = Confidence interval; COR = Crude Odd Ratio; HAZ = Height for age z-score; Ref = Reference category; *p – value <0.05; **p -value <0.01.
Table 4.
Factors associated with wasting among school-age children (n=309), in urban low-income settings of Addis Ababa, Ethiopia, 2023.
Table 4.
Factors associated with wasting among school-age children (n=309), in urban low-income settings of Addis Ababa, Ethiopia, 2023.
| Predictor variables | Wasting (MUAC in cm) (Z<-2SD) | |||||
|---|---|---|---|---|---|---|
| No (%) | Yes (%) | COR (95%CI) | p<0.05 | AOR (95%CI) | p<0.05 | |
| Parents occupation | ||||||
| Government | 68(25.9) | 4(8.7) | Ref | Ref | ||
| Private | 86(32.7) | 18(39.1) | 0.28 (0.09,0.87) | 0.028 | 0.35(0.09,1.29) | 0.115 |
| Farmer | 15(5.7) | 4(8.7) | 0.22 (0.05,0.98) | 0.047 | 0.37(0.06,2.24) | 0.277 |
| Merchant | 46(17.5) | 10(21.7) | 0.27 (0.08,0.92) | 0.035 | 0.33(0.08,1.33) | 0.119 |
| Housewife | 48(18.3) | 10(21.7) | 0.28 (0.08,0.95) | 0.042 | 0.51(0.13,2.05) | 0.341 |
| Wealth Index (WI) | ||||||
| Poor | 115(43.7) | 7(15.2) | Ref | Ref | ||
| Middle | 78(29.7) | 17(37.0) | 0.28 (0.11,0.71) | 0.007 | 0.40(0.13,1.23) | 0.109 |
| Rich** | 70(26.6) | 22(47.8) | 0.19 (0.08,0.48) | 0.000 | 0.19(0.07,0.54) | 0.002 |
| Child age | ||||||
| 6-10 years | 140(53.2) | 14(30.4) | Ref | Ref | ||
| 11-14 years* | 123(46.8) | 32(69.6) | 0.38 (0.20,0.75) | 0.005 | 0.36(0.16,0.82) | 0.015 |
| Meal skipping | ||||||
| Not skipped | 107(40.7) | 27(58.7) | Ref | |||
| Skipped | 156(59.3) | 19(41.3) | 2.07(1.09,3.92) | 0.025 | 1.57(0.71,3.50) | 0.267 |
| Child DDS# | ||||||
| <4 food groups | 181(68.8) | 22(47.8) | Ref | Ref | ||
| ≥4 and above** | 82(31.2) | 24(52.2) | 0.42 (0.22,0.78) | 0.007 | 0.28(0.12,0.64) | 0.002 |
| Dietary habit | ||||||
| Good DH | 95(36.1) | 30(65.2) | Ref | Ref | ||
| Poor DH** | 168(63.9) | 16(34.8) | 3.32 (1.35,6.39) | 0.000 | 3.18(1.44,7.02) | 0.004 |
| Absorption Inhibitor (AI) | ||||||
| No | 112(42.6) | 33(71.7) | Ref | Ref | ||
| Yes** | 151(57.4) | 13(28.3) | 3.42 (1.72,6.80) | 0.000 | 3.87(1.59,9.44) | 0.003 |
| Water Access | ||||||
| No | 114(43.3) | 8(17.4) | Ref | Ref | ||
| Yes** | 149(56.7) | 38(82.6) | 3.63(1.63,8.09) | 0.002 | 0.15(0.06,0.39) | 0.000 |
| Toilet facility | ||||||
| No | 156(59.3) | 17(37.0) | Ref | Ref | ||
| Yes* | 107(40.7) | 29(63.0) | 0.40 (0.21,0.77) | 0.006 | 0.45(0.21,0.96) | 0.04 |
#Dietary diversity score, MUAC = Mid-Upper Arm Circumference, cm = centimeter.
Table 5.
A multinomial regression analysis for factors associated with the nutritional status (overweight and underweight) among school-age children in urban low-income settings of Addis Ababa, Ethiopia, 2023.
Table 5.
A multinomial regression analysis for factors associated with the nutritional status (overweight and underweight) among school-age children in urban low-income settings of Addis Ababa, Ethiopia, 2023.
| Variables | Underweight (Z<2SD) | Overweight (Z<2SD) | ||||
|---|---|---|---|---|---|---|
| No (%) | Yes (%) | AOR (95%CI) | p<0.05 | AOR (95%CI) | p<0.05 | |
| Caregivers/parents Age | ||||||
| 18-25 years | 56(28.3) | 38(34.2) | 0.96(0.50,1.83) | 0.901 | ||
| 26-35 years* | 77(38.9) | 25(22.5) | 0.44(0.23,0.87) | 0.018 | ||
| 36 and above | 65(32.8) | 48(43.2) | Ref | |||
| Marital Status | ||||||
| Married | 122(61.6) | 85(76.6) | 0.58(0.19,1.79) | 0.343 | ||
| Single | 39(19.7) | 14(12.6) | 0.36(0.10,1.28) | 0.115 | ||
| Divorced* | 26(13.1) | 3(2.7) | 0.11(0.02,0.59) | 0.010 | ||
| Widowed | 11(5.6) | 9(8.1) | Ref | |||
| Family size | ||||||
| 1-4 family size | 107(54.0) | 35(31.5) | 0.58(0.19,1.79) | 0.343 | ||
| 5-8 family size | 55(27.8) | 39(35.1) | 0.36(0.10,1.28) | 0.115 | ||
| ≥8 families | 36(18.2) | 37(33.3) | Ref | |||
| Meal frequency | ||||||
| <3 meal times* | 89(44.9) | 64(57.7) | 1.83(1.08,3.12) | 0.026 | ||
| ≥3 meal times | 109(55.1) | 47(42.3) | Ref | |||
| School type | ||||||
| Public school** | 152(60.6) | 20(34.5) | 0.35(0.18-0.67) | 0.002 | ||
| Private school | 99(39.4) | 38(65.5) | Ref | |||
All the last explanatory variables and the outcome variable (normal) are set to “reference category”.
Disclaimer/Publisher’s Note: The statements, opinions and data contained in all publications are solely those of the individual author(s) and contributor(s) and not of MDPI and/or the editor(s). MDPI and/or the editor(s) disclaim responsibility for any injury to people or property resulting from any ideas, methods, instructions or products referred to in the content. |
© 2024 by the authors. Licensee MDPI, Basel, Switzerland. This article is an open access article distributed under the terms and conditions of the Creative Commons Attribution (CC BY) license (http://creativecommons.org/licenses/by/4.0/).
Copyright: This open access article is published under a Creative Commons CC BY 4.0 license, which permit the free download, distribution, and reuse, provided that the author and preprint are cited in any reuse.


