Submitted:
19 January 2024
Posted:
22 January 2024
You are already at the latest version
Abstract
The active form of fingolimod (FTY720; FT) is a sphingosine-1-phosphate receptor agonist with potential ocular applications. The goal of the present study was to develop an FT-loaded nanoemulsion (NE; FT-NE) formulation for the efficient and prolonged delivery of FT to the posterior segment of the eye through the topical route. FT-NE formulations were prepared with homogenization followed by probe sonication method. The lead FT-NE formulation (0.15% and 0.3% w/v loading), comprising soybean oil as lipid and Tween® 80 and Poloxamer 188 as surfactants, was further evaluated for in vitro release, surface morphology, filtration sterilization, and stability at refrigerated temperature. The formulation, at both dose levels, showed desirable physicochemical characteristics, a nearly spherical shape with homogenous nanometric size distribution, and was stable for 180 days (last time point checked) at refrigerated temperature post-filtration through polyethersulfone (0.22 µm) membrane. In vitro release studies showed prolonged release, compared with the control FT solution (FT-S), over 24 h. The results from these studies demonstrate that the FT-NE formulation can serve as a viable platform for the ocular delivery of FT through the topical route.
Keywords:
Fingolimod
; nanoemulsion
; ocular drug delivery
; sterilization
; stability
; physicochemical characterization
1. Introduction
Topical eye drop is the most preferred route and mode of delivery for the treatment of ocular diseases because of ease of administration, patient compliance and minimal systemic exposure [1,2]. Presently eye drops represent about 90% of the available ophthalmic medications in the world [3,4]. From an ophthalmic disease treatment point of view, topical delivery is favored over systemic drug administration. Following systemic administration, the drug needs to cross the blood-retinal barriers efficiently to reach the intended ocular tissue. To achieve that, a high plasma concentration is needed, which could lead to systemic side effects [5,6,7,8]. Topical delivery provides patients with a local and non-invasive drug delivery option, thereby circumventing the potential systemic toxicity issue (2, 9, 10). However, the unique precorneal and anatomical barriers of the eye make delivery to the back of the eye a very challenging task. The precorneal factors include dilution of the drug by the tear film, overflow of applied formulation, reflex blinking, and nasolacrimal drainage. Tear provides the first barrier due to its high turnover rate. Human tear volume is estimated to be 7 microliter; however, due to tear film’s rapid restoration time, a major part of the topically administered solutions are washed out within 15 to 30 seconds following application. The cornea, which covers the anterior portion of the eye, provides a mechanical barrier that limits the entry of exogenous substances into the eye. Additionally, the corneal surface lipids and the ultrastructure of the cornea, namely the epithelium, stroma, and endothelium, provide a major resistance to the permeability of lipophilic drugs. Taken together, these factors reduce the availability of topically administered drugs to less than 5 percent [9,10,11].
Nanoemulsions (NE) are liquid-in-liquid colloidal dispersions with droplet sizes ranging from 10 to 200 nm, having an upper limit of 1000 nm [12,13,14]. Due to the negative nature of the ocular surface, cationic NE can increase the retention period in the eye through electrostatic interaction with the ocular surface mucus layer [15]. They are composed of a continuous water phase and a dispersed oil phase, along with surfactants to reduce the surface tension at the interphase of the two immiscible phases [14,15]. NE’s are an attractive formulation option for ophthalmic drugs due to their ability to penetrate the ocular surface layers, provide a sustained release of the drug, and be retained on the ocular surface for a longer duration because of their interaction with the hydrophobic ocular surface, thus increasing ocular bioavailability [16,17]. Furthermore, a transparent appearance, reduced frequency of application and dose-associated side effects, and increased shelf life make NE one of the most promising formulation approaches for delivering lipophilic compounds to deeper ocular tissues [18].
Fingolimod (FT; FTY720), marketed under the brand name Gilenya®, is an FDA-approved drug for the treatment of relapsing multiple sclerosis (MS). It is a structural analog of sphingosine, a synthetic analog of the fungal toxin myriocin [19,20]. Following oral administration, it gets phosphorylated by sphingosine kinase 2 (majorly) in the liver into active fingolimod phosphate, which structurally mimics the bioactive sphingolipid sphingosine-1-phosphate (S1P) (44, 45). Thus, it can bind and modulate four of the five cognate S1P receptors (S1P1, S1P3, S1P4, and S1P5) by initiating their internalization and thereby inhibiting the S1P signal transduction [21,22,23]. Its mode of action in the case of MS is to inhibit inflammation in the CNS by modulating lymphocyte trafficking and thus directly affecting the other immune inflammatory cells, especially macrophages and dendritic cells [20,22]. It also inhibits lymphocyte egress from the thymus and lymph nodes, sequestering them in these tissues and reducing their numbers in peripheral blood and the CNS (45-47). However, several research studies have shown that FT can have a neuroprotective effect by inhibiting cell-death-inducing ceramide formation in neural tissues and therefore it can be a promising ophthalmic drug against retinal degenerative diseases [22,23,24,25]. In a study using experimental autoimmune encephalomyelitis (EAE) mice, FT treatment could alleviate the hyperactivated microglia in the retina and the optic nerve along with significant reduction in the apoptosis of retinal ganglionic cells (RGC) and oligodendrocytes in the optic nerve [25]. It can also protect the photoreceptor apoptosis in rat models of light-induced retinal degeneration and retinal dystrophic P23H-1 rats [26,27].
The goal of the present study was to develop an NE formulation for efficient and prolonged delivery of FT (FT-NE) to the posterior segment of the eye through the topical route.
2. Materials and Methods
2.1. Chemicals and Reagents
Tween® 80 NF, Poloxamer 188 NF, Glycerin USP, and Soybean oil USP were purchased from Spectrum Chemicals (Gardena, CA, USA). d-α-tocopheryl polyethylene glycol 1000 succinate (TPGS) was obtained from Antares Healthcare Products, Inc. (St. Charles, IL, USA). FT, as the hydrochloride salt, was obtained from LC laboratories (Woburn, MA, USA). Other chemicals and materials required for the project, including HPLC grade solvents, centrifuge tubes, HPLC vials, and scintillation vials, were obtained from Fischer Scientific (Hampton, NH, USA).
2.2. High Pressure Liquid Chromatography (HPLC)
An HPLC protocol, based on a previously published method with slight modifications [28], was used for the analysis of FT. The HPLC system comprised of Waters® 600 Controller equipped with an in-line degasser, 717plus Autosampler, and 2487 Dual λ absorbance detector. The column used was C8 Luna® 5μ (250 mm x 4.6 mm) and was protected by a guard column. The mobile phase comprised of acetonitrile (ACN): 50 mM pH 5.0 potassium dihydrogen phosphate buffer in a 55:45 ratio by volume. The elution flow rate was 1.0 mL/min with the detection wavelength at 220 nm, and the autosampler was maintained at 4°C. The injection volume for each sample was 20 μL.
2.3. Selection of Oils for FT-NE Development
To identify the most appropriate oil for the development of the NE formulation, saturation solubility of FT was studied in four oils present in commercial ophthalmic formulations: castor oil, soyabean oil, cottonseed oil, and sesame oil. The solubility study was performed by adding excess drug to 1 mL of the respective oils. FT was added incrementally to the oil maintained at 70oC. Following saturation (visual observation of undissolved FT), FT was extracted from the oil using the mobile phase, and the drug concentration was estimated using the HPLC method described above.
2.4. Preparation of FT-NE Formulations
FT-NE formulation was prepared using homogenization and probe sonication method. The FT-NE formulation consisted of two phases: the lipid phase and the aqueous phase. The lipid phase consists of the oil and FT, while the aqueous phase consists of Tween® 80, Poloxamer 188, TPGS, glycerin, and double distilled (milli-Q) water. The FT and oil phase was heated at 80.0 ± 5.0 °C in a glass vial with continuous stirring at 2000 rpm. Simultaneously, in a separate vial, the aqueous phase was heated to the same temperature and was added to the lipid phase drop by drop with constant stirring to get a premix. This premix was homogenized with T25 digital ultra-Turrax (IKA, USA) for 5 min at 11000 rpm to form a hot pre-emulsion. The pre-emulsion was then sonicated (Sonics Vibra Cell Sonicator, Newtown, USA) for 10 minutes at 40% amplitude with a pulse of 10 sec ON and 15 sec OFF (52) in an ice-cold beaker. The emulsion thus obtained was allowed to cool to room temperature to get the final formulation.
2.5. FT Solution (FT-S) Formulation
FT-S formulation (0.15% and 0.3% w/v) was prepared by dissolving FT in milli-Q water and used as a control formulation for the release and permeation studies.
2.6. Measurement of Droplet Size, Zeta Potential (ZP), and Polydispersity Index (PDI)
The hydrodynamic radius, PDI, and ZP of the FT-NE formulation was determined by photon correlation spectroscopy at 25°C using a Zetasizer (Nano ZS Zen 3600, Malvern Instruments, Inc., MA, USA). The sample was diluted 100-fold using milli-Q water, filtered through 0.2 μm syringe filter, and used for the size distribution analysis [18]. Droplet size was evaluated based on the volume distribution.
2.7. Drug Content
FT was extracted from the formulations (10 μL) using 990 μL of ACN and vortexed for one minute. This was further diluted ten times with ACN. The 1000-fold diluted sample was then analyzed for FT content using the HPLC as method described above.
2.8. pH
The pH of the NE placebo formulations was measured using a pH meter (Mettler Toledo, USA) following preparation. The pH meter was calibrated using standard pH buffers 4.01, 7.00, and 10.01.
2.9. Drug-Excipient Compatibility
The drug-excipient compatibility was studied with Fourier transform infrared spectrophotometry (FTIR). Spectrum of pure drug, oil, mixture of oil and drug, placebo formulation, and the lead FT-NE formulation was collected using a bench top FTIR spectrophotometer (Agilent Technologies, Santa Clara, CA, USA) fitted with a MIRacle ATR sampling accessory (Pike Technologies, Madison WI, USA). The transformation spectrum obtained was overlayed and compared.
3. Scanning Transmission Electron Microscope (STEM) Imaging
The surface morphology of the lead FT-NE formulation was studied with a JSM-7200FLV Scanning Electron Microscope (JOEL, Peabody, MA, USA) attached with a STEM detector. The sample was analyzed through a negative staining protocol. The grid was placed over a 20 µL drop of the sample solution for one minute, and the excess sample was drawn off the grid using filter paper. The grid was then washed briefly by dipping it in distilled water and removing the excess water from the grid by using filter paper. It was then stained immediately using UranyLess for one minute and then allowed to dry for a few minutes, followed by imaging using JSM-7200FLV Scanning Electron Microscope. The image was taken at X40K times magnification [18].
3.1. Sterilization and Stability Studies
FT-NE formulation was sterilized through a filtration process. About 5.0 mL of FT-NE formulation was filtered through 0.22 μm polyethersulfone (PES) and 0.22 μm Durapore® membranes using a 13 mm stainless steel filtration set. Post-filtration formulation stability, with respect to drug content and physical and chemical characteristics, was evaluated at 4 oC, 25 oC , and 40 oC storage conditions.
3.2. In vitro Drug Release
In vitro release from the FT-NE lead formulation was studied in triplicate using a dialysis method at 34.0 ± 0.5°C to simulate the ocular surface temperature [29]. FT-S was used as the control formulation. The receiving media was composed of 20 mL phosphate buffer saline (PBS, pH 7.4). Drug release/diffusion was studied through a semipermeable membrane (Slide-A-Lyzer® MINI Dialysis Devices, 10K molecular weight cutoff) at 900 rpm using a multi-station magnetic stirrer. At definite time intervals, 1.0 mL of the sample was withdrawn and replaced with fresh receiving media. Drug concentration in the samples was determined using HPLC method. Percent drug release was plotted as a function of time.
4. Results and Discussion
4.1. Solubility in Selected Oils
FT is a lipophilic compound with a Log P of about 4.0. Drug loading is a critical factor in developing NE formulations for poorly water-soluble drugs, which is dependent on its solubility in various formulation components [9,20]. Lower drug solubility in selected oils will require higher oil concentrations in the formulation to achieve the necessary drug load. This would lead to higher surfactant concentrations and ocular discomfort and irritation. To select the oil with the highest FT solubilizing capacity, saturation solubility in four oils, namely castor oil, soyabean oil, cottonseed oil, and sesame oil, was determined (Table 1). FT showed significantly higher solubility in soybean oil and castor oil, and these oils were thus selected for the preparation of the FT-NE formulations.
4.2. FT-NE Formulation Development
FT-NE formulation was prepared using homogenization followed by sonication method. Based on our earlier reports, Tween 80 and Poloxamer 188 were selected as surfactants, TPGS as stabilizer, and glycerin as a tonicity agent. When used together, it was observed that Tween 80 and Poloxamer 188, both non-ionic surfactants and considered less toxic than cationic surfactants, reduce the droplet size of the oil globules. The effect of oil concentration, Tween 80 concentration (0.75 – 4.0%), and drug loading (0.15 – 0.6% w/v) was studied while keeping the Poloxamer 188 (0.2 %w/v), glycerin (2.25 %w/v) and TPGS (0.002% w/v) concentrations constant in FT-NE formulation development. A placebo NE formulation was prepared to optimize the homogenization speed, time, and sonication time. From the results (data not shown), homogenization at 11000 rpm for 5 min, 10 minutes with pulse of 10 sec ON and 15 sec OFF as processing conditions was selected for the preparation of the FT-NE formulations.
4.3. Measurement of Droplet Size, PDI and ZP
The prepared FT-NE formulations were characterized for size distribution using Zetasizer. Droplet size is used to classify emulsions into micro or NE, with the droplet size in NE ranging from 20 to 500 nm. Droplet size influences surface area and substantially impacts the formulation’s bioavailability, effectiveness, and shelf-life [30,31].
FT-NE formulations prepared with 5.0% w/v of castor or soybean oil and 0.3 %w/v of FT produced a droplet size of below 250 nm and PDI of 0.3. However, FT-NE formulations prepared with castor oil showed changes in physical characteristics (p>0.05) after one week of storage at room temperature. On the other hand, the formulation prepared with 5.0% soybean oil was stable for 30 days (last time point tested) at room temperature. Hence, soyabean oil was selected as the oil for further development of FT-NE formulations.
Oil concentration: Droplet size (173.5±1.8 nm, 401.8±10.0, and 886.4±20.4) and PDI (0.24±0.01, 0.69±0.03, and 0.47±0.2) increased with an increase in the soybean oil concentration (5.0, 15.0, and 25.0 % w/v). The surfactant concentration was kept constant. This observation is consistent with the effects of oil concentration on droplet size [32]. Therefore, 5.0 %w/v soybean oil was selected for further FT development of FT-NE formulations.
Effect of Tween 80 concentration: FT-NE formulations were prepared with Tween 80 concentrations ranging from 0.75 – 4.0% w/v and FT at 0.3% w/v, keeping other components constant, and examined for droplet size distribution. It was observed that the droplet size of the NE formulations tended to decrease as the concentration of Tween 80 increased from 0.75 – 4.0% w/v. Although no significant (p>0.05) difference was observed between 0.75 (202.3 ± 5 nm), 1.0% w/v (199.7 ±2.9 nm) and 2.0% w/v (173.5 ±1.8 nm) of Tween 80, a significant (p<0.05) difference in droplet size (146.7 ± 3.4 nm) was observed with 4.0 % w/v Tween 80. However, since the droplet size of all FT-NE formulations prepared with 0.75 – 4.0% w/v Tween 80 concentrations were below 220 nm, the formulations could be sterilized through the filtration method [33]. Thus, 2.0 %w/v of Tween 80 and 0.2 %w/v of Poloxamer 188 were selected to prepare FT-NE formulation.
Effect of drug loading: FT-NE formulations were prepared with 0.15 – 0.6 %w/v of FT and observed for physical stability. The formulation prepared with 0.6 %w/v of FT showed precipitation immediately on preparation. FT-NE formulations prepared with 0.15 %w/v of FT (FT-NE-S3) and 0.3 %w/v of FT (FT-NE-S2) were physically stable at room temperature and were continued for the sterilization, post-sterilization stability and in vitro studies. The composition, physical and chemical characteristics of the lead NE formulations, FT-NE-S2 and FT-NE-S3, are presented in Table 2.
4.4. pH of the FT-NE Formulations
The pH of the lead NE placebo formulation was in the range of 6.5 ± 0.5 (Table 2), which is close to that of human tears (6.5-7.5).
4.5. Compatibility Studies - FTIR
FTIR spectra were collected and compared to identify any physical or chemical interactions. The FTIR spectra were recorded for each component, as shown in Figure 1. The characteristic wavelength numbers were observed to be similar to those reported in the literature [16,20]. The characteristic peaks in the fingerprint region from 4000 cm−1 to 800 cm−1 were observed for both drug and oil (Figure 1). For the mixture, the spectra of the formulation were identical to that of the oil alone, indicating that the entire drug was completely solubilized in the oil. This was further confirmed by overlapping spectra of the formulation with (FT-NE) and without (placebo, NE-P) the drug (Figure 1).
4.6. Scanning Transmission Electronic Microscopy (STEM) Images
STEM was used to examine the shape of the FT-NE-S2 formulation, and the results are presented in Figure 2. From the images, it was observed that FT-NE formulation droplets were nearly spherical in shape with a homogenous nanometric size distribution. STEM studies revealed that the droplet size of the FT-NE formulation was 150 nm and 200 nm in diameter, and these results were similar to the droplet size measured with the zertasizer.
4.7. Sterilization and Stability Studies
Sterility is an important requirement for ophthalmic formulations. Sterilization of the final product is often accomplished by filtering and/or autoclaving. The most convenient way is to sterilize the formulation by filtration, which does not require heat, which seems to be an important factor for the stability of the FT-NE formulation. The FT-NE formulations were subjected to membrane filtration using 0.22 μm Durapore (DP) and PES membranes and observed for stability at room temperature.
The effect of the filtration process on the physical and chemical characteristics of the FT-NE-S2 and FT-NE-S3 formulations was evaluated. Filtration decreased the droplet size of the formulation, while no significant difference was observed in PDI. Although no immediate effect on the physicochemical characteristics was observed post-filtration through either membrane, a drop in the content was observed in formulations filtered through the Durapore membrane (data not shown). This was not observed with the formulations filtered through the PES membrane. Therefore, the PES filter membrane was used to sterilize the FT-NE formulations and observed for stability at different storage conditions. Post-filtration stability data of FT-NE-S2 and FT-NE-S3 through PES membrane is presented in Table 3 and Table 4. Both formulations were stable for 180 days at 4 oC (as the last time point observed) and up to the 30-day time point at room temperature. At 40 oC, the formulation degraded (%assay dropped) within 30 days. This is not unexpected, considering FT (active ingredient) has to be stored at 4 oC.
5. In Vitro Release Studies
Release of a drug from a drug delivery system (DDS) involves both dissolution and diffusion, and several mathematical models describe the dissolution and/or release of the drug from the DDS. To facilitate a comparison between the release behaviors from the NE and solution (FT-NE and FT-S) formulations, mean drug release (% MDR) was calculated. MDR is defined as the average percent drug release in each vial in a specific time interval. At the end of 24 hrs, the control formulations FT-S (0.15% FT) released almost 82.5±1.7%, and FT-S (0.3% FT) released 79.9±2.5%, and FT-NE-S3 released 71.9±2.9% of FT, respectively, with no significant difference in the rate of release (Figure 3). However, FT-NE-S2 released 50.2±6.4% drug at the end of 24 h with a significantly lower release rate than the other formulations tested (Figure 3). The data showed that FT-NE-S2 undergoes and follows the Higuchi model of sustained release, and this is maintained until total depletion of the drug in the dosage form is achieved.
6. Conclusions
In this study, a FT-loaded nanoemulsion formulation was successfully formulated using soybean oil as the oil and Tween®80 and Poloxamer 188 as surfactants. The formulation exhibited droplet size below 200 nm and was amenable to sterilization by filtration. The NE formulation demonstrated sustained release of FT from the formulation. The formulation was stable for up to 3 months (last time point tested) at 4 oC , but failed at the 1 and 2-month time points at 40 oC and 25oC, respectively. This is not surprising considering that FT by itself needs to be stored under refrigeration and protected from light. The sustained release characteristics and improved retention on the ocular surface, compared to regular solutions, should allow increased ocular bioavailability and better retinal FT concentrations. Thus, a lead topical ophthalmic FT formulation has been developed, which can be used to evaluate the in-vivo efficacy of FT against retinal degeneration.
Acknowledgments
Scanning Transmission Electron Microscopy images presented in this work were generated using the instruments and services at the Microscopy and Imaging Center at the University of Mississippi. This facility is supported in part by grant 1726880, National Science Foundation.”.
Conflicts of Interest
The authors declare that they have no known competing interests.
References
- Patel, A., Cholkar, K., Agrahari, V., andMitra, A. K. (2013) Ocular drug delivery systems: An overview World J Pharmacol 2, 47-64. [CrossRef]
- Yang, Y., andLockwood, A. (2022) Topical ocular drug delivery systems: Innovations for an unmet need Experimental Eye Research 218, 109006. [CrossRef]
- Jumelle, C., Gholizadeh, S., Annabi, N., andDana, R. (2020) Advances and limitations of drug delivery systems formulated as eye drops Journal of Controlled Release 321, 1-22.
- Campbell, M., andHumphries, P. (2013) The blood-retina barrier: tight junctions and barrier modulation Biology and regulation of blood-tissue barriers 70-84.
- Varela-Fernández, R., Díaz-Tomé, V., Luaces-Rodríguez, A., Conde-Penedo, A., García-Otero, X., Luzardo-Álvarez, A. et al. (2020) Drug delivery to the posterior segment of the eye: biopharmaceutic and pharmacokinetic considerations Pharmaceutics 12, 269.
- Ahmed, S., Amin, M. M., and Sayed, S. (2023) Ocular Drug Delivery: a Comprehensive Review AAPS PharmSciTech 24, 66. [CrossRef]
- Elsayed, I., andSayed, S. (2017) Tailored nanostructured platforms for boosting transcorneal permeation: box–Behnken statistical optimization, comprehensive in vitro, ex vivo and in vivo characterization International Journal of Nanomedicine 12, 7947.
- Kang-Mieler, J. J., Rudeen, K. M., Liu, W., andMieler, W. F. (2020) Advances in ocular drug delivery systems Eye 34, 1371-1379. [CrossRef]
- Kang-Mieler, J. J., Osswald, C. R., andMieler, W. F. (2014) Advances in ocular drug delivery: emphasis on the posterior segment Expert opinion on drug delivery 11, 1647-1660.
- Maulvi, F. A., Shetty, K. H., Desai, D. T., Shah, D. O., andWillcox, M. D. P. (2021) Recent advances in ophthalmic preparations: Ocular barriers, dosage forms and routes of administration International Journal of Pharmaceutics 608, 121105. [CrossRef]
- Liu, S., Dozois, M. D., Chang, C. N., Ahmad, A., Ng, D. L. T., Hileeto, D. et al. (2016) Prolonged Ocular Retention of Mucoadhesive Nanoparticle Eye Drop Formulation Enables Treatment of Eye Diseases Using Significantly Reduced Dosage Molecular Pharmaceutics 13, 2897-2905. [CrossRef]
- Dhahir, R. K., Al-Nima, A. M., andAl-Bazzaz, F. Y. (2021) Nanoemulsions as Ophthalmic Drug Delivery Systems Turk J Pharm Sci 18, 652-664. [CrossRef]
- Ammar, H. O., Salama, H. A., Ghorab, M., andMahmoud, A. A. (2009) Nanoemulsion as a potential ophthalmic delivery system for dorzolamide hydrochloride AAPS PharmSciTech 10, 808-819. [CrossRef]
- Gupta, A. (2020) Nanoemulsions In Nanoparticles for Biomedical Applications, Elsevier, 371-384.
- Youssef AA, Cai C, Dudhipala N, Majumdar S. Design of topical ocular ciprofloxacin nanoemulsion for the management of bacterial keratitis. Pharmaceuticals. 2021 Mar 3;14(3):210.
- Gawin-Mikołajewicz, A., Nartowski, K. P., Dyba, A. J., Gołkowska, A. M., Malec, K., andKarolewicz, B. (2021) Ophthalmic Nanoemulsions: From Composition to Technological Processes and Quality Control Mol Pharm 18, 3719-3740. [CrossRef]
- Senapati S, Youssef AA, Sweeney C, Cai C, Dudhipala N, Majumdar S. Cannabidiol Loaded Topical Ophthalmic Nanoemulsion Lowers Intraocular Pressure in Normotensive Dutch-Belted Rabbits. Pharmaceutics. 2022 Nov 24;14(12):2585.
- Sanford, M. (2014) Fingolimod: A Review of Its Use in Relapsing-Remitting Multiple Sclerosis Drugs 74, 1411-1433. [CrossRef]
- Qi, H., Cole, J., 2nd, Grambergs, R. C., Gillenwater, J. R., Mondal, K., Khanam, S. et al. (2019) Sphingosine Kinase 2 Phosphorylation of FTY720 is Unnecessary for Prevention of Light-Induced Retinal Damage Sci Rep 9, 7771. [CrossRef]
- Aktas, O., Küry, P., Kieseier, B., andHartung, H.-P. (2010) Fingolimod is a potential novel therapy for multiple sclerosis Nature Reviews Neurology 6, 373-382,.
- Masoudipour, E., Kashanian, S., Maleki, N., Karamyan, A., andOmidfar, K. (2018) A novel intracellular pH-responsive formulation for FTY720 based on PEGylated graphene oxide nano-sheets Drug Development and Industrial Pharmacy 44, 99-108. [CrossRef]
- Mehling, M., Johnson, T., Antel, J., Kappos, L., andBar-Or, A. (2011) Clinical immunology of the sphingosine 1-phosphate receptor modulator fingolimod (FTY720) in multiple sclerosis Neurology 76, S20-S27.
- Yang, T., Zha, Z., Yang, X., Kang, Y., Wang, X., Tong, Y. et al. (2021) Neuroprotective Effects of Fingolimod Supplement on the Retina and Optic Nerve in the Mouse Model of Experimental Autoimmune Encephalomyelitis Front Neurosci 15, 663541. [CrossRef]
- Chen, H., Tran, J.-T. A., Eckerd, A., Huynh, T.-P., Elliott, M. H., Brush, R. S. et al. (2013) Inhibition of de novo ceramide biosynthesis by FTY720 protects rat retina from light-induced degeneration Journal of Lipid Research 54, 1616-1629. [CrossRef]
- Stiles, M., Qi, H., Sun, E., Tan, J., Porter, H., Allegood, J. et al. (2016) Sphingolipid profile alters in retinal dystrophic P23H-1 rats and systemic FTY720 can delay retinal degeneration[S] Journal of Lipid Research 57, 818-831.
- Souri, E., Zargarpoor, M., Mottaghi, S., Ahmadkhaniha, R., andKebriaeezadeh, A. (2015) A Stability-Indicating HPLC Method for the Determination of Fingolimod in Pharmaceutical Dosage Forms Sci Pharm 83, 85-93. [CrossRef]
- 52.
- Joshi PH, Youssef AA, Ghonge M, Varner C, Tripathi S, Dudhipala N, Majumdar S. Gatifloxacin Loaded Nano Lipid Carriers for the Management of Bacterial Conjunctivitis. Antibiotics. 2023 Aug 15;12(8):1318.
- Agarwal, P., Craig, J. P., andRupenthal, I. D. (2021) Formulation Considerations for the Management of Dry Eye Disease Pharmaceutics 13. [CrossRef]
- Usón, N., Garcia, M. J., andSolans, C. (2004) Formation of water-in-oil (W/O) nanoemulsions in a water/mixed non-ionic surfactant/oil systems prepared by a low-energy emulsification method Colloids and Surfaces A: Physicochemical and Engineering Aspects 250, 415-421. [CrossRef]
- Sakeena, M. H., Elrashid, S. M., Munavvar, A. S., andAzmin, M. N. (2011) Effects of oil and drug concentrations on droplets size of palm oil esters (POEs) nanoemulsion J Oleo Sci 60, 155-158. [CrossRef]
- Sarheed, O., Dibi, M., andRamesh, K. (2020) Studies on the Effect of Oil and Surfactant on the Formation of Alginate-Based O/W Lidocaine Nanocarriers Using Nanoemulsion Template Pharmaceutics 12. [CrossRef]
- Sweeney, C., Dudhipala, N., Thakkar, R., Mehraj, T., Marathe, S., Gul, W. et al. (2021) Effect of surfactant concentration and sterilization process on intraocular pressure-lowering activity of Δ(9)-tetrahydrocannabinol-valine-hemisuccinate (NB1111) nanoemulsions Drug Deliv Transl Res 11, 2096-2107. [CrossRef]
Figure 1.
FTIR spectra of pure fingolimod hydrochloride (FTY720 and FTY7201), soybean oil, physical mixture, placebo nanoemulsion formulation, and drug-loaded nanoemulsion formulation (down to up).
Figure 1.
FTIR spectra of pure fingolimod hydrochloride (FTY720 and FTY7201), soybean oil, physical mixture, placebo nanoemulsion formulation, and drug-loaded nanoemulsion formulation (down to up).
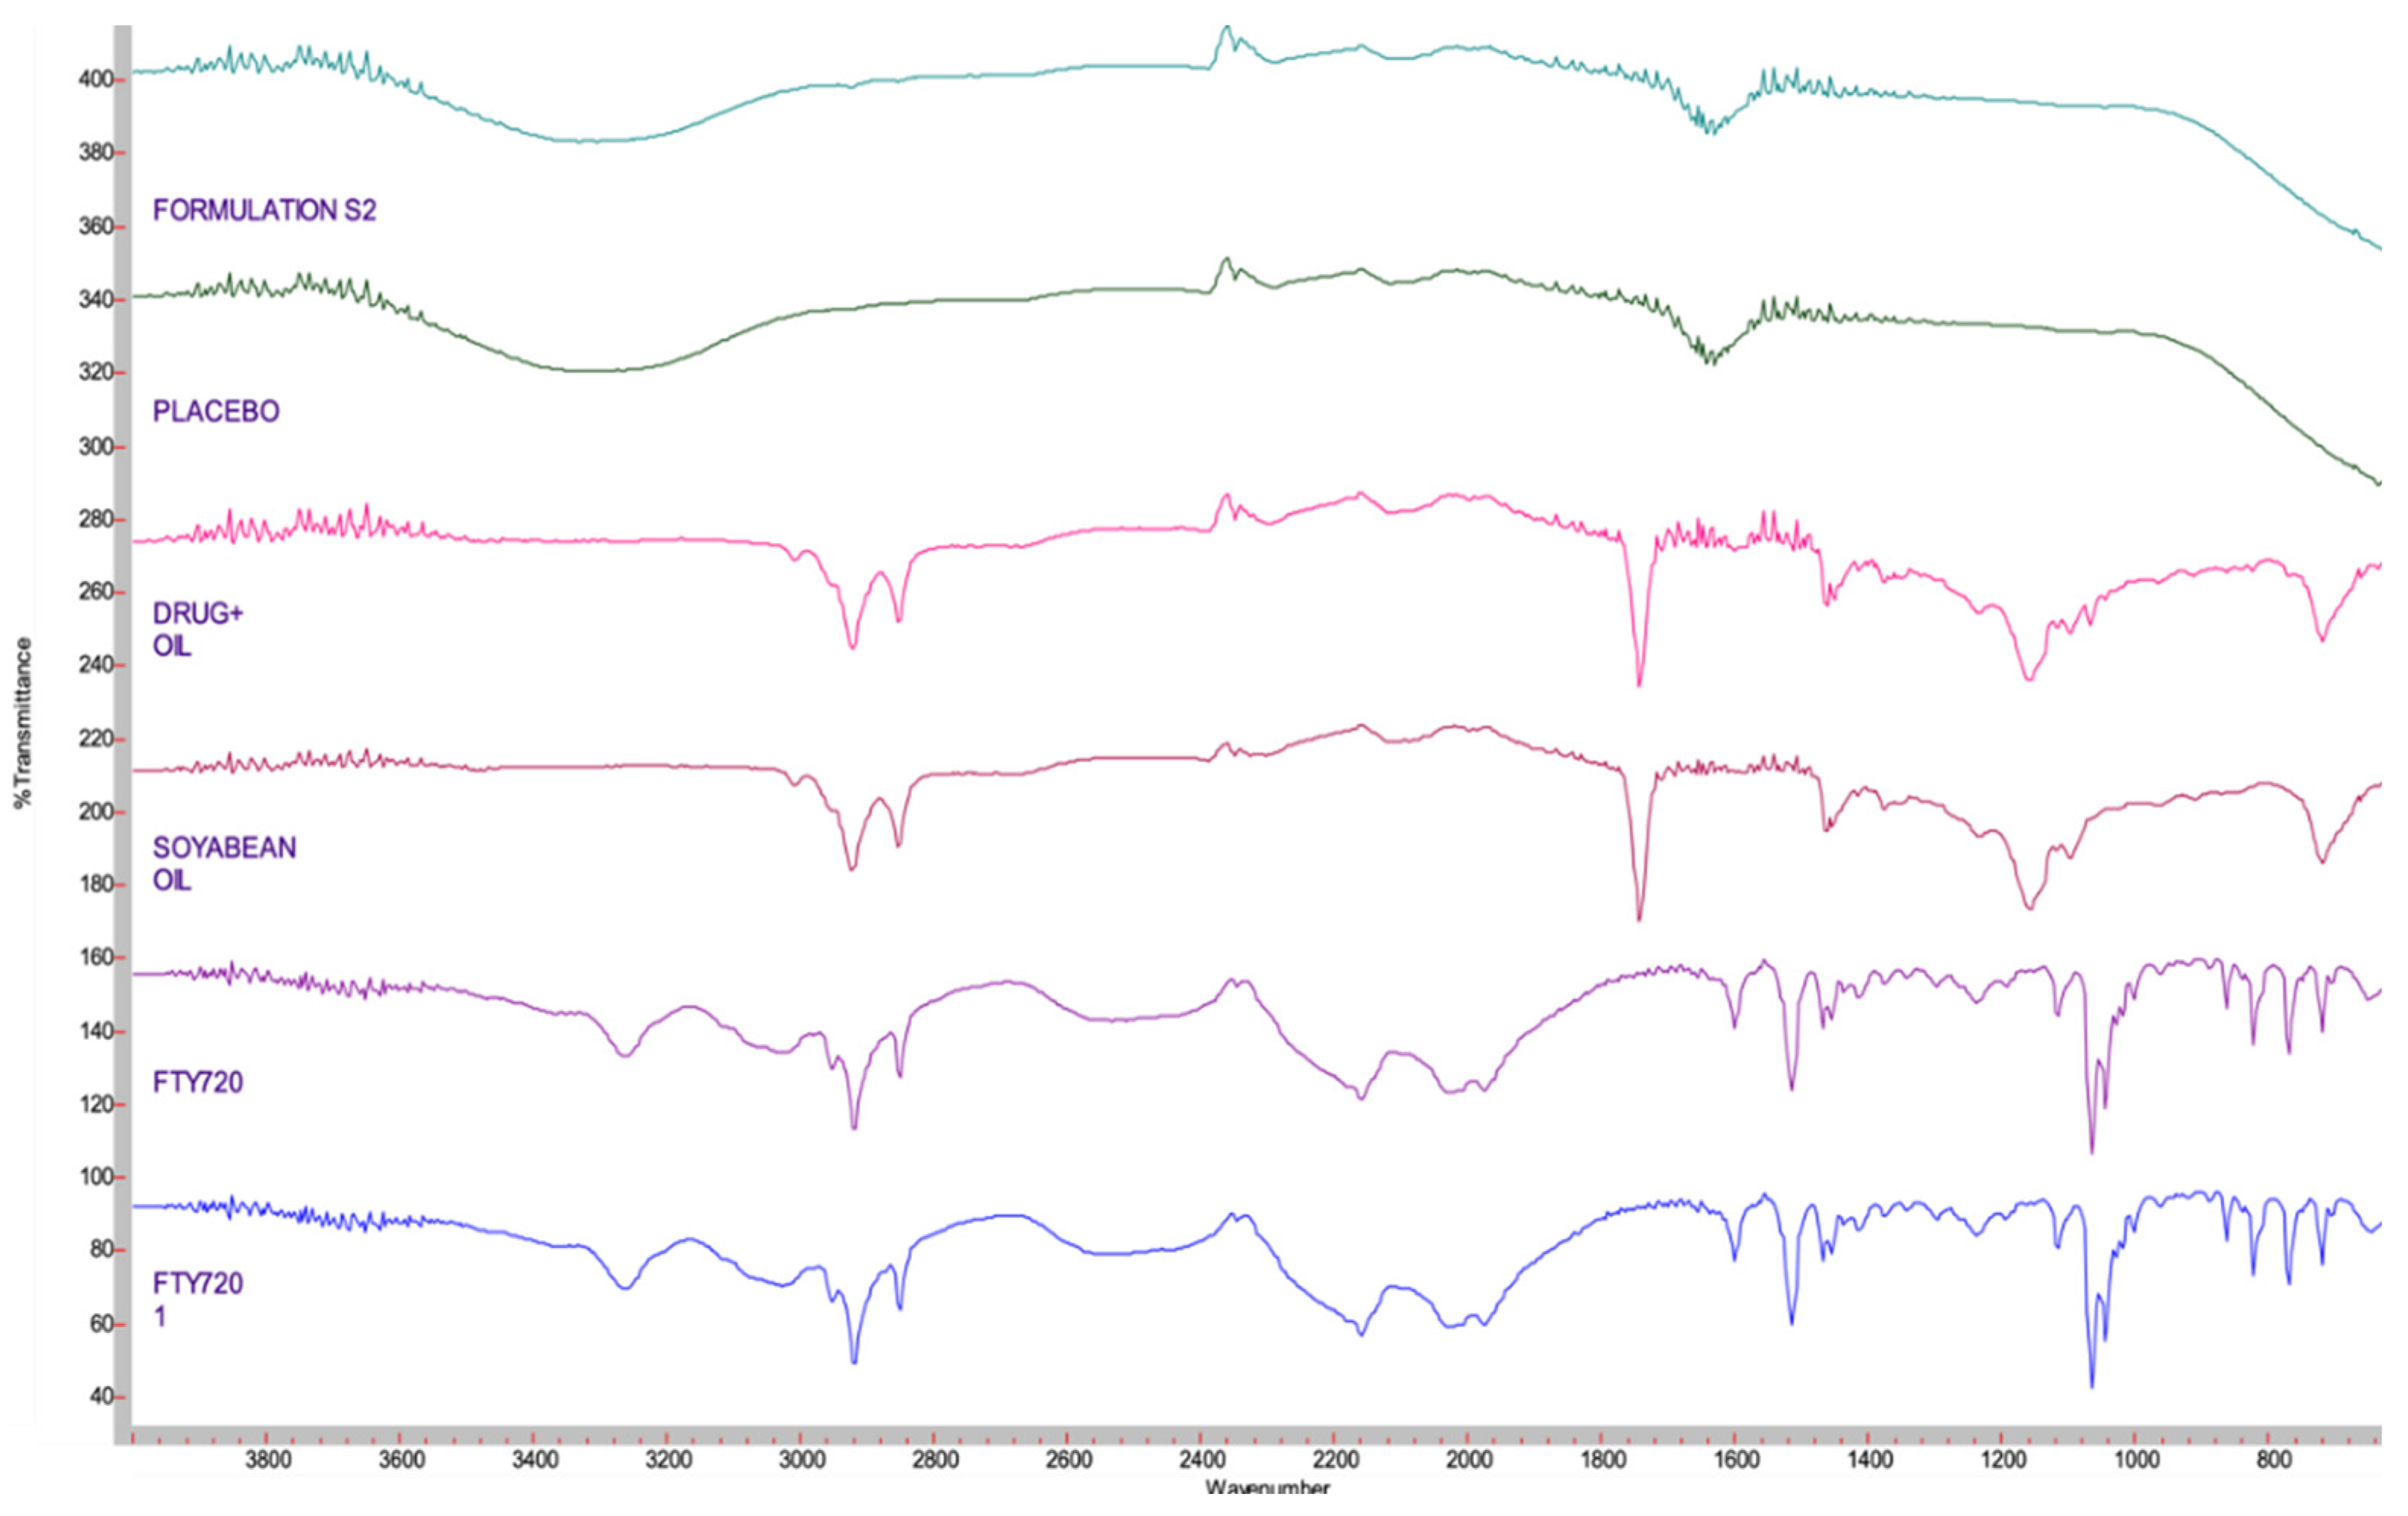
Figure 2.
Scanning transmission electron microscope (STEM) image of the fingolimod hydrochloride nanoemulsion (FT-NE-S2) formulation.
Figure 2.
Scanning transmission electron microscope (STEM) image of the fingolimod hydrochloride nanoemulsion (FT-NE-S2) formulation.
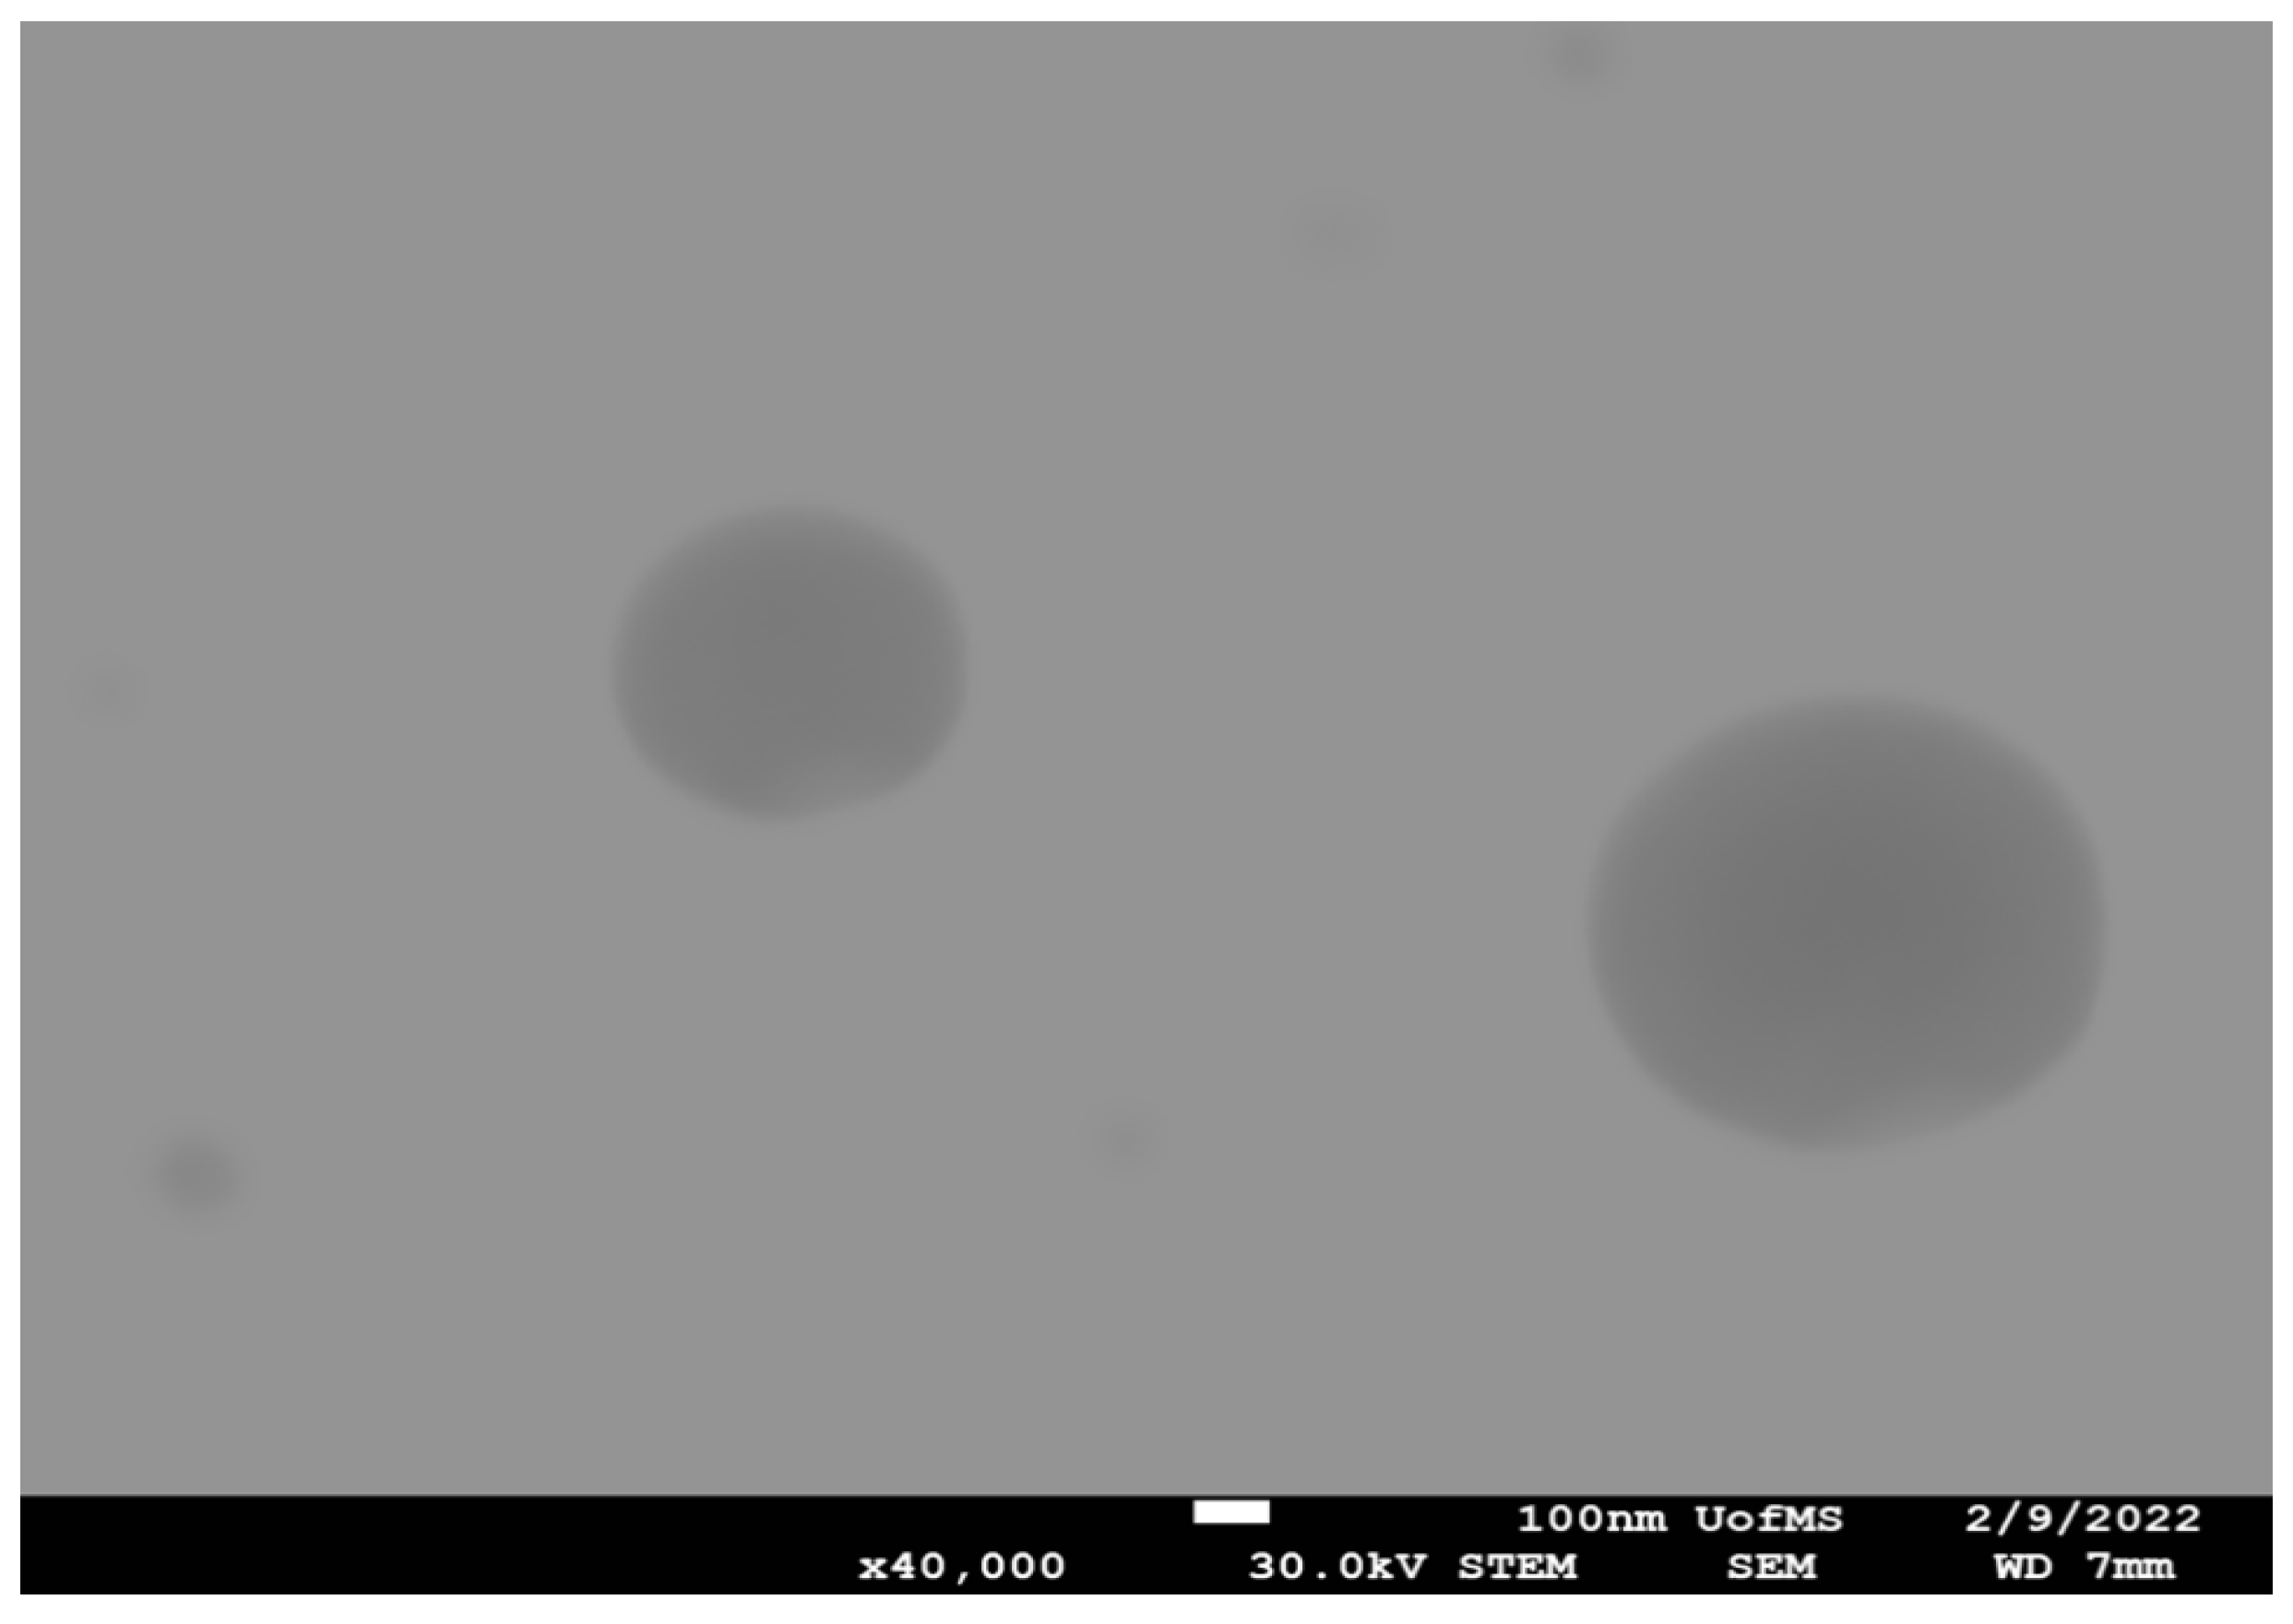
Figure 3.
In-vitro release profiles of fingolimod hydrochloride from fingolimod hydrochloride nanoemulsion and solution formulations through Slide-A-Lyzer® MINI Dialysis Devices (mean ± SD, n=3). FT-NE-S2 and FT-NE-S3 – 0.3 and 0.15 %w/v fingolimod hydrochloride loaded nanoemulsion formulations, respectively. FT-S - fingolimod hydrochloride solution was used as a control.
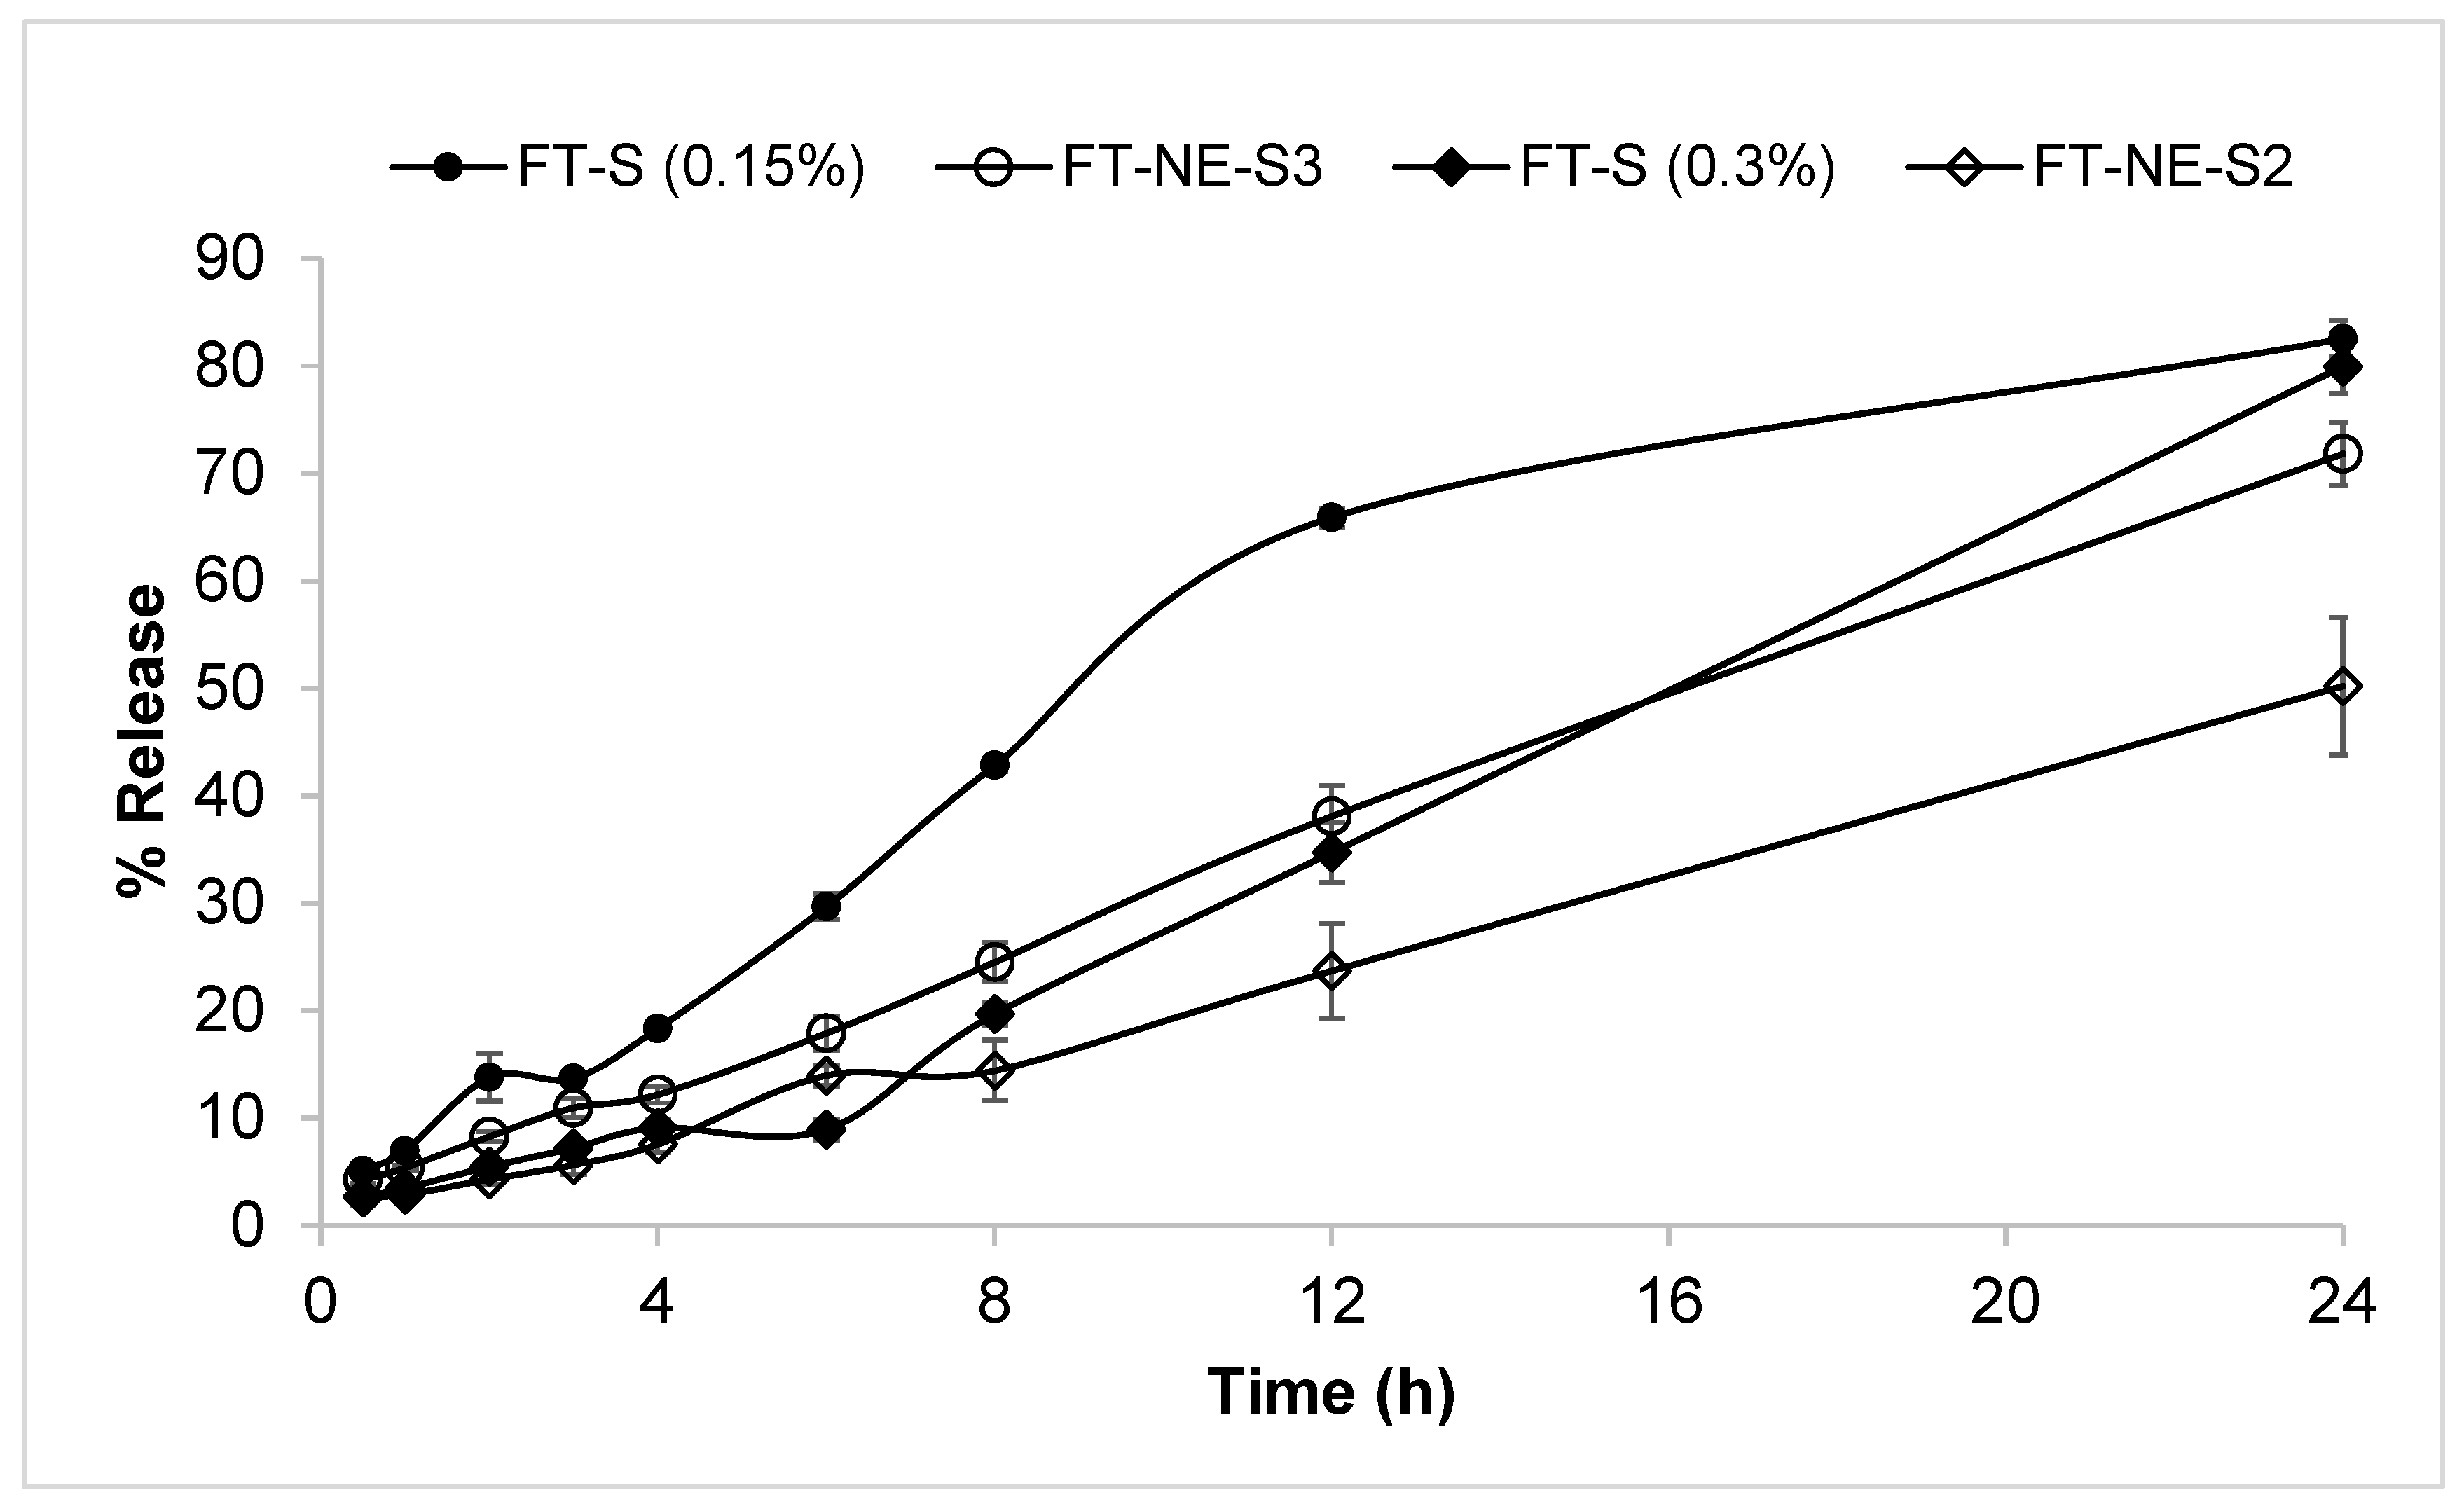

Table 1.
Solubility of fingolimod hydrochloride in different oils (mean ± SD, n=3).
| Oil | Solubility of FT (µg/mL) |
|---|---|
| Castor Oil | 3.9 ± 0.07 |
| Soybean Oil | 13.8 ± 0.03 |
| Cottonseed Oil | 0.3 ± 0.002 |
| Sesame Oil | 0.3 ± 0.008 |
Table 2.
Composition and physicochemical characteristics of fingolimod hydrochloride loaded nanoemulsion (FT-NE) formulations.
Table 2.
Composition and physicochemical characteristics of fingolimod hydrochloride loaded nanoemulsion (FT-NE) formulations.
| Ingredients (%w/v) | Formulation composition | |
|---|---|---|
| FT-NE-S2 | FT-NE-S3 | |
| Soybean oil | 5.0 | 5.0 |
| Fingolimod HCl | 0.3 | 0.15 |
| d-α-tocopheryl succinate | 0.002 | 0.002 |
| Tween 80 | 2 | 2 |
| Poloxamer 188 | 0.2 | 0.2 |
| Glycerin | 2.25 | 2.25 |
| Water (mL) | QS 10ml | QS 10ml |
| Parameter | Physicochemical characteristics (mean ± SD, n = 3) | |
| Droplet size (nm) | 195.3±3.6 | 181.1±1.1 |
| PDI | 0.24±0.02 | 0.24±0.02 |
| ZP (mV) | 53.8±1.4 | 41.4±1.7 |
| Assay (%) | 104.5±2.8 | 104.6±4.1 |
| pH* | 6.5 ± 0.5 | 6.5 ± 0.5 |
*placebo formulations used.
Table 3.
Stability of FT-NE-S2 formulations, filtered through PES membrane at refrigerator (4 °C), room (25 °C) and accelerated (40 °C) temperature. Data represents mean ± SD (n=3).
Table 3.
Stability of FT-NE-S2 formulations, filtered through PES membrane at refrigerator (4 °C), room (25 °C) and accelerated (40 °C) temperature. Data represents mean ± SD (n=3).
| Time (day) | Droplet size (nm) | PDI | ZP (mV) | Assay (%) |
|---|---|---|---|---|
| Pre-filtration | ||||
| Initial | 186.3±2.9 | 0.25±0.01 | 50.6±0.6 | 102.0±7.3 |
| Post-filtration at 4 oC | ||||
| Initial | 169.8±1.2 | 0.23±0.002 | 47.7±2.8 | 100.9±3.0 |
| 30 | 167.5±2.4 | 0.24±0.05 | 36.6±1.9 | 108.9±3.1 |
| 60 | 166.3±3.2 | 0.22±0.6 | 35.8±1.7 | 104.9±6.2 |
| 90 | 165.8±2.3 | 0.21±0.01 | 34.1±0.45 | 100.3±3.5 |
| 180 | 167.1±2.8 | 0.24±0.01 | 44.6±1.9 | 94.4±3.7 |
| Post-filtration at 25 oC | ||||
| Initial | 166.4±2.5 | 0.25±0.01 | 39.9±0.1 | 109.5±8.5 |
| 30 | 167.3±1.3 | 0.23±0.01 | 30.6±2.3 | 101.2±2.5 |
| Post-filtration at 40 oC | ||||
| Initial | 162.2±0.3 | 0.23±0.01 | 35.8±0.7 | 100.3±3.5 |
| 30 | 160.7±1.3 | 0.26±0.07 | 27.6±2 | 80.3± 8.2 |
FT-NE-S2 – 0.3 %w/v fingolimod hydrochloride loaded nanoemulsion formulation.. PDI – polydispersity index, ZP – Zeta potential.
Table 4.
Post-filtration stability studies of FT-NE-S3 formulation through PES membrane at refrigerator (4 °C), room (25 °C) and accelerated (40 °C) temperature (Mean ± SD, n=3).
Table 4.
Post-filtration stability studies of FT-NE-S3 formulation through PES membrane at refrigerator (4 °C), room (25 °C) and accelerated (40 °C) temperature (Mean ± SD, n=3).
| Time (day) | Droplet size (nm) | PDI | ZP (mV) | Assay (%) |
|---|---|---|---|---|
| Pre-filtration | ||||
| Initial | 181.8±1.7 | 0.22±0.01 | 35.2±0.5 | 112.3±0.5 |
| Post-filtration at 4 oC | ||||
| Initial | 177.9±1.4 | 0.24±0.02 | 37.8±0.4 | 112.8±0.7 |
| 30 | 175.8±1.8 | 0.23±0.02 | 33.4±0.8 | 102.2±6.5 |
| 60 | 177.8±1.2 | 0.19±0.001 | 31.6±0.6 | 108.3±4.0 |
| 90 | 171.0±0.6 | 0.22±0.005 | 36.1±1.2 | 103.2±3.6 |
| 180 | 172.3±1.4 | 0.25±0.007 | 37.1±0.2 | 100.4± 3.3 |
| Post-filtration at 25 oC | ||||
| Initial | 174.9±1.8 | 0.22±0.01 | 34.0±1.3 | 107.1±5.1 |
| 30 | 173.2±0.9 | 0.23±0.04 | 27.6±2.3 | 108.2±2.4 |
| Post-filtration at 40 oC | ||||
| Initial | 171.9±1.6 | 0.23±0.01 | 32.3±0.7 | 80.6± 9.0 |
| 30 | 169.4±1.7 | 0.24±0.04 | 23.6±1.4 | 80.14±2.7 |
FT-NE-S3– 0.15 %w/v fingolimod hydrochloride loaded nanoemulsion formulation.. PDI – polydispersity index, ZP – Zeta potential.
Disclaimer/Publisher’s Note: The statements, opinions and data contained in all publications are solely those of the individual author(s) and contributor(s) and not of MDPI and/or the editor(s). MDPI and/or the editor(s) disclaim responsibility for any injury to people or property resulting from any ideas, methods, instructions or products referred to in the content. |
© 2024 by the authors. Licensee MDPI, Basel, Switzerland. This article is an open access article distributed under the terms and conditions of the Creative Commons Attribution (CC BY) license (http://creativecommons.org/licenses/by/4.0/).
Copyright: This open access article is published under a Creative Commons CC BY 4.0 license, which permit the free download, distribution, and reuse, provided that the author and preprint are cited in any reuse.


