

Submitted:
15 January 2024
Posted:
16 January 2024
You are already at the latest version
Abstract
The role of the databases is to allow persisting data, no matter if they are of the SQL or NoSQL type. In SQL databases, data is structured in a set of tables in the relational database model, grouped in rows and columns. The CRUD operations (create, read, update, and delete) are used to manage the information contained in the relational databases. Several dialects of the SQL language exist, as well as frameworks for mapping Java classes (models) to a relational database. The question is what we should choose for our Java application and why. A comparison between the most used relational database management systems, mixed with the most used frameworks should give us some guidance about when to use what. The evaluation is done on timing for each CRUD operation, from thousands to millions of entries, using the possible combinations between the relational database system and the framework. The experiments included the possibilities to warm up the Java Virtual Machine before the execution of the queries. Also, the research investigated the time spent inside different methods of the code, to determine the critical regions. Thus, the conclusions provide a comprehensive overview of the performances of Java applications accessing databases depending on the suite of decisions considering the database type, the framework in use, the type of operation, and supporting architects and developers for their technological decisions and for improving the speed of their programs.
Keywords:
Java
; relational databases
; CRUD operations
; Java Persistence API
; Hibernate
; Spring Data JPA
; database performance.
1. Introduction
Accessing relational databases from Java applications is the application domain. It is essential for any application to persist its data and this thing can be done with Object Relational Mapping (ORM) which is concerned with the mapping of classes to database tables [1].
There are a lot of frameworks and SQL dialects to be used when you start a new application, but this makes the choice harder. [2] Each of them has its own advantages and disadvantages, in the end coming to a trade-off, as it frequently happens in information technology. A developer should be aware of his application's needs to pick the right combination, generally being able to select, as a framework, between JPA, Hibernate [3,4], and Spring Data JPA [5].
This will help developers to choose the option that best fits their Java application. Having no clue about frameworks and just using them on other people's recommendations is not a great way to start an application.
2. Proposed Research Approach
The proposed research approach is to run an average-complexity application with different frameworks and dialects, on a Windows operating system and to test the necessary time to handle different amounts (up to 500 thousand entries) of each CRUD operation. The amount of code and its simplicity will also be taken into consideration when the comparison is made.
3. Problem Background
“In relational databases, the data is organized in tables. Each entry in the table should have a unique identifier called Primary Key (PK). Columns are specific data attributes defined when a table is created. Related tables are connected with Foreign Keys (FK).” [6]
There are four principles to define relational database transactions:
- atomicity – ensures that the transaction operations are all executed or none
- consistency – ensures that only correct data is added to the database
- isolation – ensures that transactions are not affected by other transactions
- durability – ensures that data committed to the database is stored permanently
There are also four categories of commands:
- DDL (data definition language)
- DQL (data query language)
- DML (data manipulation language)
- DCL (data control language)
The experiments will focus on the main operations of an application, DQL (SELECT commands to query the content of the database), and DML (INSERT, UPDATE, and DELETE commands).
Java-based applications apply these four operations on the database with the support of different frameworks like JPA, Hibernate, Spring Data JPA, MyBatis, etc. They are responsible for the object-relational mapping. This means they map a Java model to specific tables from a database.
These frameworks have different approaches to handling the mapping problem. The Java Database Connectivity (JDBC) is one way to work with databases in Java because it offers APIs that allow the user to execute SQL statements.
Object Relational Mapping makes the development effort simpler as JDBC, as:
- it hides the SQL interaction
- it offers development with objects instead of database tables
- there is no need to take care of the database implementation
- there is less code written for the same job
- it is based on the JBDC, in the underlying
Database connections in Java applications are managed through a JDBC driver, specific to the RDBMS. A specific dialect also needs to be set up by the developers when configuring the database connection so that the queries are created in the right language.
The most popular RDBMSs today are:
- MySQL
- Oracle SQL
- Microsoft SQL Server
- PostgreSQL
Selecting one of the dialects mentioned above and combining it with the frameworks that best match the requirements can be a hard decision to make. Some combinations might give faster performance for the CRUD operations but with the price of writing a lot of code.
This research intends to help developers select the correct combination of technologies that suits their application’s needs. For example, an application might not need a fast response from the database so it should focus on keeping the code simpler and easier to maintain. Also, if speed is crucial for the implementation needs, then the architects and developers must consider a trade-off between code complexity and speed. Furthermore, inefficient combinations will also be discovered in the research. This will help developers to avoid bad, unoptimized solutions.
The research would like to assess the behavior of an average-complexity Java application. Joins will be a key element in our application because this is a key operation when working with a relational database.
4. Previous Research
Several studies investigate what SQL dialects or ORM frameworks the developer should choose and why.
Haseeb Yousaf compares, experimenting on the Ubuntu operating system, several ORM frameworks: Hibernate, OpenJPA, and EclipseLink. He performed “five queries on a table: read by ID (PK), read by three different type attributes and one combined read based on two attributes. The results show that Hibernate is the fastest of those three frameworks from 10000 records up to 160000 records, while OpenJPA is the slowest. EclipseLink is getting closer to Hibernate as the number of records increases.” [7]
Another work compares “the most popular five relational database management systems: MySQL, Oracle, PostgreSQL, SQLite, and Microsoft SQL Server. The first test he does is measuring the installation time for each one of them. Oracle and SQL Server seem to be the slowest ones, while SQLite and MySQL’s installations take less than five minutes. The second test he does is measuring query times for every CRUD operation on a different number of entries. From his work, Oracle is the slowest when it comes to reading information from the database, but pretty good at updating and deleting. MySQL is far from Oracle’s update and delete performance with very big times on these operations, while PostgreSQL proves to be the fastest one. The other two, SQLite and Microsoft SQL Server can be the second option when starting a new application, besides PostgreSQL.” [8]
The comparisons mentioned above are made at the same level of technology, either to test different ORM frameworks or to measure the performances of RDBMSs.
The research we propose covers the suite of all the technologies needed for an application and achieves a comprehensive evaluation, including the combinations between the ORM framework and the SQL database.
Another research using the .NET programming language was conducted at the University of Oradea, where the analysis compared “the execution times and the memory usage of an application, based on three distinct ORM frameworks combined with SQL Server on the database side.” [9]
5. Architecture of the Application
Usually, people tend to choose the technologies they know best. This research aims to encourage them, if the selected combination of components is efficient, or to change the perspective on database communication, by providing actual results.
Each combination will be a separate and independent project as they must not interfere with each other. This way, a safer evaluation can be done. In the future, it can be changed to choose the corresponding framework configuration file and to execute the specific test, because the entities that the solution exposes are used in all the different approaches. Code reuse can be achieved through this way of development, which is a great principle for an application.
All the implementations must follow a standard for the data model because otherwise, the results might become irrelevant. The standard is the Java Persistence API, on top of which all the selected frameworks are mapped.
The solution is based on two main components: the ORM framework and the RDBMS. “The ORM framework is responsible for mapping Java objects on database models. It controls the flow until data reaches the database.” [10]
For testing purposes, the chosen framework was JUnit [11]. This is the most popular testing extension in the Java community. Assertions are the main functionality, as they are used to check the actual results versus the expected results.
To improve the testing, Java Microbenchmark Harness (JMH) [12] was added to the project to check if warming up the Java Virtual Machine will reduce the execution times. It can also be used for extracting code optimization paths or measuring the execution of different methods. “The ORM framework is responsible for mapping Java objects on database models. It controls the flow until data reaches the database.” [4]
The architecture of the testing application is described in Figure 1, demonstrating how the different combinations of the implementation are created:
A combination that will be subject to testing is represented by one component from the left side (ORM framework) plus one on the right side (RDBMS). The color legend is as follows:
- BLUE -> JPA with all RDBMS
- GREEN -> Hibernate with all RDBMS
- ORANGE -> Spring Data JPA with all RDBMS
Each testing scenario is mapped by an arrow. This way, all the possibilities between these technologies are covered and it provides more reliable results. The Java application can be considered the central part because that is the entry point from which the project will start.
The current research extends our previously published papers, looks for optimization possibilities, and investigates the critical regions. Extending the experiments, “the evaluation will be done by implementing a medium-complexity betting application in which the main entities will be: tickets, bets, and matches. These entities will be described in the implementation section.” [4]
6. Implementation of the Solution
Usually, people tend to choose the technologies they know best. This research aims to encourage them to decide if the selected combination of components is efficient or to change the perspective on database communication, by providing actual results.
“The application used for testing focuses on a soccer betting service model. This means that testing is done by creating a different number of tickets, each with its bets and corresponding matches, and simulating their behavior in relationship with the database and the ORM framework. There are three main entities of the project on which the CRUD operations are tested: Ticket, Bet, and Match.” [4]
Figure 2 presents ”the data model with the relationship between entities. One ticket can have multiple bets on it (one-to-many relationship), and one bet is based on one match (one-to-one relationship).” [4]
The tables have several attributes:
-
Ticket
- ticket id -> the unique identifier for a ticket
- status -> one of the following values: WON, LOST, PENDING
- sum -> represents the amount placed on the ticket as betting value
-
Bet
- bet id -> the unique identifier for a bet
- match id -> the identifier of the match the bet is placed on
- ticket id -> the identifier of the ticket the bet belongs to
- result choice -> one of the following: 1 (host wins), 2 (visitor wins), X (even)
-
Match
- name -> a string like “Real Madrid – Barcelona”
- score -> the final score of the match
- host team win odd -> the odd for the host’s win
- visitor team win odd -> the odd for the visitor’s win
- draw odd -> the odd in case the match is even
- match date -> the date when the match will be played
- match id -> the unique identifier for a match
The setup of the machine where experiments were run is the same as for the previously published work [5]:
- CPU: Intel i7 – 6700HQ @ 2.6 GHz
- RAM: 8 GB
- Operating System: Windows 10 Pro 64-bit
To review how the previous experiments were done:
“The tests on the development of a betting service were designed to measure the length of each CRUD action for a different number of tickets, each carrying one bet on one match. The number of the tickets were: 1000, 2000, 5000, 10000, 20000, 50000, 100000, 200000, and 500000.
To maintain the activities running on all three database tables, the update operation modified the ticket's status, the bet's outcome selection, and the name of the match. This increased the application's complexity.
These tests were done on each combination of ORM framework and relational database system, resulting in twelve distinct situations (3 ORM frameworks and 4 RDBMSs), in the first phase.” [4]
We extended the experiments, and the second phase introduced now involved Java Microbenchmark Harness (JMH), which was responsible for handling the warm-up phase of the Java Virtual Machine. It was set up to only run one iteration for a warm-up and one for measurement, due to the extended running time for larger entry numbers, and both iterations had their results interpreted.
Executing the tests with the same available resources and in the same conditions was another important point that was taken care of in the evaluation.
7. Evaluation without JMH
7.1. Java Persistence API
7.2. Hibernate
7.3. Spring Data JPA
8. Evaluation with JMH
The second step was to introduce Java Microbenchmark Harness (JMH) in the measurements. The benchmark was set to run with one warm-up iteration, followed by one measurement iteration, after warm-up. The execution times will be presented for both iterations, as it could offer an interesting interpretation of the results.
8.1. Java Persistence API, Warm-up Iteration
8.2. Hibernate, Warm-up Iteration
8.3. Spring Data JPA, Warm-up Iteration
8.4. Java Persistence API after Warm-up
8.5. Hibernate after Warm-up
8.6. Spring Data JPA after Warm-up
9. Bottlenecks Investigation
A quick comparison between this research and the previous one presented in [2] revealed some common findings:
- Spring Data JPA has a big overhead, the slowest of all frameworks for batch operations
- Hibernate and JPA solutions go side by side, with almost overlapping graphs
- Spring Data JPA requires the fewest lines of code
The execution times in milliseconds for 50k entries for both solutions for each framework and operation on MySQL database are presented below in Table 37.
For JPA and Hibernate the execution times are quite linear for each CRUD operation except reading, which is reasonable considering that the current research works with three entities and the previous one works with a single entity.
Reading seems to be slower on a single database table, but this could be due to a newer more powerful generation of Intel CPU that has been used in the current research.
Both these approaches revealed a big overhead in the execution times for Spring Data JPA for each operation and RDBMS tested. This triggered an interest in investigating the time discrepancies between the mentioned framework and the other ones (Hibernate and JPA). The overhead for Spring Data JPA is even bigger for the previous research, despite having just one entity, which makes the research on the bottlenecks more interesting.
9.1. Spring Data JPA Bottlenecks Investigation
The experiments demonstrate that Spring Data JPA comes with the least amount of code written, but also with a big overhead in the execution times, in comparison with JPA and Hibernate.
To locate the bottlenecks, an analysis of the framework methods execution times had to be done. This was achieved by using YourKit Java Profiler 2022.9, which according to its description, “utilizes many JVM and OS features to obtain information about methods and times with the minimum overhead. CPU profiles can be visualized as call trees or lists of hot spots. CPU flame graph is an efficient way to visualize application performance, which allows to find performance bottlenecks quickly and easily.” [13]
Previous research indicated that more than half of performance bottlenecks originate in the data access layer. [14] The current analysis intended to locate more accurately the bottlenecks and to retrieve the top five hot spots for each RDBMS for runs with the number of entries starting from 50k and comparing them with the top five hot spots for a 50k run with Hibernate.
MySQL – Hibernate hot spots for 50k entries:
- com.mysql.cj.jdbc.ClientPreparedStatement.executeUpdate()
- org.hibernate.internal.SessionImpl.persist(Object)
- com.mysql.cj.jdbc.ConnectionImpl.prepareStatement(String, int)
- com.mysql.cj.jdbc.ConnectionImpl.prepareStatement(String)
- java.util.Properties.load(InputSteam)
MySQL – Spring Data JPA hot spots for 50k entries:
- com.mysql.cj.jdbc.ClientPreparedStatement.executeUpdate()
- org.hibernate.internal.SessionImpl.persist(Object)
- com.mysql.cj.jdbc.ClientPreparedStatement.executeQuery()
- com.mysql.cj.jdbc.ConnectionImpl.prepareStatement(String)
- com.mysql.cj.jdbc.ConnectionImpl.prepareStatement(String, int)
MySQL – Spring Data JPA hot spots for 100k, 200k, and 500k entries:
- com.mysql.cj.jdbc.ClientPreparedStatement.executeUpdate()
- com.mysql.cj.jdbc.ClientPreparedStatement.executeQuery()
- com.mysql.cj.jdbc.ConnectionImpl.prepareStatement(String)
- com.mysql.cj.jdbc.ConnectionImpl.prepareStatement(String, int)
- org.hibernate.internal.SessionImpl.persist(Object)
Oracle – Hibernate hot spots for 50k entries:
- oracle.jdbc.driver.OraclePreparedStatementWrapper.executeUpdate()
- org.hibernate.internal.SessionImpl.persist(Object)
- oracle.jdbc.driver.PhysicalConnection.prepareStatement(String, String[])
- oracle.jdbc.driver.PhysicalConnection.prepareStatement(String)
- java.util.Properties.load(InputSteam)
Oracle – Spring Data JPA hot spots for 50k entries:
- oracle.jdbc.driver.OraclePreparedStatementWrapper.executeUpdate()
- org.hibernate.internal.SessionImpl.persist(Object)
- oracle.jdbc.driver.OraclePreparedStatementWrapper.executeQuery()
- oracle.jdbc.driver.PhysicalConnection.prepareStatement(String, String[])
- oracle.jdbc.driver.PhysicalConnection.prepareStatement(String)
Oracle – Spring Data JPA hot spots for 100k, 200k, and 500k entries:
- oracle.jdbc.driver.OraclePreparedStatementWrapper.executeUpdate()
- oracle.jdbc.driver.OraclePreparedStatementWrapper.executeQuery()
- oracle.jdbc.driver.PhysicalConnection.prepareStatement(String)
- oracle.jdbc.driver.PhysicalConnection.prepareStatement(String, String[])
- org.hibernate.internal.SessionImpl.persist(Object)
PostgreSQL – Hibernate hot spots for 50k entries:
- org.postgresql.jdbc.PgPreparedStatement.executeUpdate()
- org.hibernate.internal.SessionImpl.persist(Object)
- org.postgresql.jdbc.PgConnection.prepareStatement(String, int)
- org.postgresql.jdbc.PgConnection.prepareStatement(String)
- java.util.Properties.load(InputSteam)
PostgreSQL – Spring Data JPA hot spots for 50k entries:
- org.postgresql.jdbc.PgPreparedStatement.executeUpdate()
- org.postgresql.jdbc.PgPreparedStatement.executeQuery()
- org.hibernate.internal.SessionImpl.persist(Object)
- org.postgresql.jdbc.PgConnection.prepareStatement(String, int)
- org.postgresql.jdbc.PgConnection.prepareStatement(String)
Spring Data JPA hot spots for 100k, 200k and 500k entries:
- org.postgresql.jdbc.PgPreparedStatement.executeUpdate()
- org.postgresql.jdbc.PgPreparedStatement.executeQuery()
- org.postgresql.jdbc.PgConnection.prepareStatement(String, int)
- org.postgresql.jdbc.PgConnection.prepareStatement(String)
- org.hibernate.internal.SessionImpl.persist(Object)
SQLServer – Hibernate hot spots for 50k entries:
- com.microsoft.sqlserver.jdbc.SQLServerPreparedStatement.executeUpdate()
- org.hibernate.internal.SessionImpl.persist(Object)
- com.microsoft.sqlserver.jdbc.SQLServerConnection.prepareStatement(String, int)
- com.microsoft.sqlserver.jdbc.SQLServerConnection.prepareStatement(String)
- java.util.Properties.load(InputSteam)
SQLServer – Spring Data JPA hot spots for 50k entries:
- com.microsoft.sqlserver.jdbc.SQLServerPreparedStatement.executeUpdate()
- com.microsoft.sqlserver.jdbc.SQLServerPreparedStatement.executeQuery()
- org.hibernate.internal.SessionImpl.persist(Object)
- com.microsoft.sqlserver.jdbc.SQLServerConnection.prepareStatement(String, int)
- com.microsoft.sqlserver.jdbc.SQLServerConnection.prepareStatement(String)
SQLServer – Spring Data JPA hot spots for 100k, 200k, and 500k entries:
- com.microsoft.sqlserver.jdbc.SQLServerPreparedStatement.executeUpdate()
- com.microsoft.sqlserver.jdbc.SQLServerPreparedStatement.executeQuery()
- com.microsoft.sqlserver.jdbc.SQLServerConnection.prepareStatement(String, int)
- com.microsoft.sqlserver.jdbc.SQLServerConnection.prepareStatement(String)
- org.hibernate.internal.SessionImpl.persist(Object)
The main thing that can be noticed from the results above is that Spring Data JPA makes really time-consuming calls on the executeQuery() method, which is missing in the Hibernate implementations. That happens because when Spring Data JPA deletes an entry, at first it looks for the entry and then makes the deletion. The deletions are done one by one with the deleteAll(Iterable<Ticket>). Since the delete operation is the most time-consuming one, the executeQuery() method becomes one of the most active methods.
Another interesting fact is that most of the time is spent inside drivers’ methods for each RDBMS tested and not in a framework method.
9.2. Reducing Spring Data JPA Bottlenecks
The first attempt to reduce the bottlenecks was to override the void delete(Ticket) method from the created SimpleJpaRepository<Ticket, ID>. To do this, we created an interface that extends CrudRepository<Ticket, ID>:
@NoRepositoryBean
public interface CustomCrudRepository<ID> extends CrudRepository<Ticket, ID> {
void delete(Ticket entity);
}
An implementation of this interface was needed to override the method and skip the queries given to the database:
public class CustomJpaRepository<ID> extends SimpleJpaRepository<Ticket, ID>
implements CustomCrudRepository<ID> {
private EntityManager entityManager;
public CustomJpaRepository(EntityManager entityManager) {
super(Ticket.class, entityManager);
this.entityManager = entityManager;
}
@Override
public void delete(Ticket entity) {
this.entityManager.remove(this.entityManager.contains(entity) ?
entity : this.entityManager.merge(entity));
}
}
After creating the repository bean and injecting the EntityManager dependency into it, the profiling was performed again. There was an improvement of about 10% in the execution times, but it was still not close to the other two ORM frameworks tested.
There were also interesting pop-up messages while the investigation with YourKit finished for Spring Data JPA runs: “Potential deadlock: Frozen threads found -> frozen for at least 19m 10s”. This happened for a run with PostgreSQL and Spring Data JPA with 100k entries, but also for runs with other RDBMSs. The record was established by a PostgreSQL run with Spring Data JPA with 500k entries: 1d 0h 47m 18s, which explains why the biggest scenario runs for so long.
The problem is not a deadlock, but a long starvation, as the program finishes its run successfully. Because of that, another attempt to reduce the bottlenecks was to replace the transaction management done by Spring Data JPA.
Removing the @EnableTransactionManagement annotation was the first step in the process. Then, the EntityManagerFactory used for the JPA implementation was used to replace the factory used by Spring Data JPA.
The CustomCrudRepository<ID> interface was changed to:
@NoRepositoryBean
public interface CustomCrudRepository<ID> extends CrudRepository<Ticket, ID> {
void delete(Ticket entity);
Iterable<Ticket> findAll();
void customSaveAll(List<Ticket> ticketList);
List<Ticket> customUpdateAll(List<Ticket> ticketList);
void customDeleteAll(Iterable<Ticket> entities);
}
And the CustomJpaRepository<ID> implementation to:
public class CustomJpaRepository<ID> extends SimpleJpaRepository<Ticket, ID>
implements CustomCrudRepository<ID> {
private EntityManager entityManager;
public CustomJpaRepository(EntityManager entityManager) {
super(Ticket.class, entityManager);
this.entityManager = entityManager;
}
@Override
public void delete(Ticket entity) {
this.entityManager.remove(this.entityManager.contains(entity) ?
entity : this.entityManager.merge(entity));
}
@Override
public void customDeleteAll(Iterable<Ticket> entities) {
entityManager.getTransaction().begin();
entities.forEach(this::delete);
entityManager.getTransaction().commit();
}
public void customSave(Ticket entity) {
this.entityManager.persist(entity);
}
public void customSaveAll(List<Ticket> ticketList) {
entityManager.getTransaction().begin();
ticketList.forEach(this::customSave);
entityManager.getTransaction().commit();
}
public List<Ticket> customUpdateAll(List<Ticket> ticketList) {
entityManager.getTransaction().begin();
List<Ticket> result = ticketList.stream().
map(this::customUpdate).collect(Collectors.toList());
entityManager.getTransaction().commit();
return result;
}
public Ticket customUpdate(Ticket entity) {
return this.entityManager.merge(entity);
}
@Override
public List<Ticket> findAll() {
CriteriaBuilder criteriaBuilder = entityManager.getCriteriaBuilder();
CriteriaQuery<Ticket> criteriaQuery = criteriaBuilder.createQuery(Ticket.class);
Root<Ticket> rootEntry = criteriaQuery.from(Ticket.class);
CriteriaQuery<Ticket> all = criteriaQuery.select(rootEntry);
TypedQuery<Ticket> allQuery = entityManager.createQuery(all);
return allQuery.getResultList();
}
}
The logic for all CRUD operations did not change too much, they were overridden to use custom transaction management through the EntityManagerFactory. After these changes took place, the execution times for 50k entries for each CRUD operation for each RDBMS tested with Spring Data JPA were remeasured and the results are presented in Table 38 and Table 39.
Comparing the new results with the Hibernate ones proves a significant decrease in time for Spring Data JPA when the transaction management is changed.
It is to emphasize that the purpose of changing Spring Data JPA’s transaction management is experimental, to investigate how the classic EntityManager behaves in Spring’s environment. It does not intend to solve the bottlenecks, further research on transaction management needs to be done.
10. Conclusions
To emphasize the performance differences after introducing the warm-up, we’ll briefly review the conclusions of the experiments that were not using it.
10.1. Conclusions without JMH
10.1.1. Java Persistence API
“The first combination (MySQL – JPA) looks good, with an overall time for the 500k operations test of under 1200 seconds (less than 20 minutes). The CREATE operation is a little bit more time-consuming than the UPDATE one, while READ is really fast, under one second even for the biggest test. DELETE seems to double its execution time when doubling the number of operations, making it quite linear.
For, Oracle, serious differences can be observed. The DELETE operation on 500k entries lasts for almost 2 hours, while the CREATE one, which is also time-consuming compared to the MySQL implementation, is about 10 times quicker. An advantage of this implementation is the UPDATE operation, overpassing the MySQL implementation.”[5]
Getting to the third RDBMS, Microsoft SQL Server has clearly the best execution times for the UPDATE operation. This advantage is covered by a greater disadvantage: the DELETE operation runs for 4.5 hours for 500k entries which is a very bad performance when looking at the MySQL test. READ is also pretty good, while CREATE fits in the average time so far in the tests.
“For a small number of entries (less than 5k), PostgreSQL is the best solution, but if the number of entries is increasing, developers might consider switching the RDBMS. At 500k entries, the deletion is even worse than the one in the previous combination. The advantages of a bigger number of entries can be observed in all other three CRUD operations, setting the record so far. The deletion overhead is so big that it can represent a strong reason not to choose this RDBMS in the described case.” [3]
A great overall performance is offered by MySQL. “It has incredibly good execution times, despite having a slower performance than PostgreSQL for creating, reading, and updating entries, but it saves a lot of time on the delete operation (over 70 times faster).” [3]
“SQLServer has the best reading, while Oracle has the worst one, but this cannot be a deciding factor when choosing the technologies needed to build an application. That is because the difference between these two is under 5 seconds, for 500k entries. Oracle has the slowest insertion of all four RDBMSs.” [4]
10.1.2. Hibernate
For small data sets with less than 5,000 entries, PostgreSQL is a good option. Increasing the number of records, a different RDBMS may be a better option. When there are 500,000 entries, deletion performance becomes much slower compared to when there are fewer entries. On the other hand, the advantage of having a larger number of entries is demonstrated by the improvement in three CRUD operations. The substantial decrease in deletion performance may make PostgreSQL unsuitable for this scenario.
10.1.3. Spring Data JPA
“The combination MySQL - Spring Data JPA appears to be the most effective, with a total duration of less than 1800 seconds (less than 30 minutes) for the 500k operations test. The UPDATE process takes somewhat longer than the CREATE operation, but READ is extremely fast, taking less than four seconds even for the most demanding test. DELETE's execution time doubles with each doubling of the number of operations, making it a linear process.” [3]
Spring Data JPA introduces its particular overhead while executing the operations. Although the creation time is the shortest of all Oracle implementations for 200k+ entries, the other three operations are much slower. The deletion process takes over 3 hours, while the UPDATE operation is less performant compared to the MySQL implementation.
The third RDBMS, Microsoft SQL Server, experiences difficulties with the DELETE and UPDATE operations. The deletion of 500k entries takes almost 8 hours, and the update needs about half of this time. The creation is like the MySQL combination.
“With Spring Data JPA, PostgreSQL provides the fastest speeds for generating and reading entries. However, it experiences the same issue as the SQL Server implementation with a significant increase in the update execution time. Regardless of the RDBMS, the deletion of 500k records is a slow process.” [3]
10.1.4. Overall conclusions
The experiments were designed to provide multi-criteria analysis, using different RDBMSs together with different ORM frameworks. This way, software engineers may decide based on the specificity of their projects and on the operations that they forecast to be intensive for their circumstances.
Performance is similar for Hibernate and Java Persistence API, while Spring Data JPA brings a lot of overhead with it, but it also offers an easier solution regarding the code dimension, to access and modify data.
10.2. Conclusions with JMH
10.2.1. Java Persistence API
MySQL provides the best DELETE time for both iterations. The UPDATE operation has the worst execution time in the warm-up, but it gets average after it.
The second RDBMS tested with this framework, Oracle, has the worst READ execution time by far and the warm-up does not change its position at all. The same is available for the CREATE operation. A good point for Oracle is the deletion time, as it is placed in second place, after MySQL.
SQL Server has some visible changes after the warm-up. At first, it has a pretty good time on the CREATE operation for fewer entries than 100k, but it becomes the worst at this operation for 500k entries or more. It gets better after warming up at the READ operation, jumping from the second position to the first one. Something that remains the same is the DELETE operation, the second worst one.
The best RDBMS for creating, reading, and updating without a warm-up is PostgreSQL, which has an issue with the slowest deletion. Creating and updating are the only positions maintained after the warm-up phase.
10.2.2. Hibernate
Regarding the warmup execution times, PostgreSQL has the best timing on the CREATE and UPDATE operations for each number of entries tested, but it is terrible when it comes to deleting more than 100k entries.
Reading is also great with PostgreSQL, but this time for over 50k entries. For less than this number, MySQL seems to be the best choice. The most valuable point for MySQL is the deletion, which is more than 12.5 times faster than the second RDBMS (Oracle), for a 500k entries run.
Oracle looks a bit lazy, especially for the READ operation, almost 7 times slower at the biggest run than MySQL, which is placed in the third position. Its strengths are updating and deleting for big numbers of entries, making it the second-best choice for these operations. Oracle is the worst solution for less than 50k entries, at every operation.
Ranking second for the CREATE and READ operations, SQL Server is a solution to be taken into consideration when developing a new application, but only if it is not planned to make lots of deletions, because it performs almost as badly as PostgreSQL for this operation.
The most visible impact the warmup had on the second run is observed when looking at the READ operation. It runs almost instantly for a number of entries smaller than 50k and reaches a maximum of half a second for 500k entries, except for the Oracle RDBMS, but a big improvement can be noticed here also.
Even if the execution times after the warmup iteration are expected to be lower, this is true only for the CREATE operation measured on the Oracle and SQL Server RDBMSs. This operation has better results on MySQL and PostgreSQL too, but not for more than 100k entries.
On the MySQL RDBMS, the UPDATE and DELETE operations have almost the same performance, with or without warmup. The same thing is available for deleting on an SQL Server RDBMS or a PostgreSQL one.
Updating execution times are reduced for less than 50k entries with MySQL, 100k entries with PostgreSQL, and 500k entries with Oracle. The most visible change overall was for Oracle, which reduced the durations for almost every number of entries.
The final results after the second iteration made some slight changes in the comparison of the performance for each operation, by each RDBMS. However, PostgreSQL still has the best timing for creating and updating entries, and also the worst overall timing when it comes to deletions.
SQL Server comes forward with the best reading, over-passing PostgreSQL and MySQL, which falls to the third position after it was first in the warmup phase. Oracle has some serious time reduction for less than 200k entries, but at the largest run, it has almost the same time as before, a bit over 5 seconds.
The best deletion is taken again by MySQL, with an even bigger difference from the warmup comparison: almost 17 times faster than the Oracle performance. But something new for this RDBMS is the poor performance when it comes to updating entries because it is the worst solution of all four.
10.2.3. Spring Data JPA
MySQL has the fastest performance for both UPDATE and DELETE operations, while its other CRUD operations have an average performance like other RDBMS tested using the benchmark.
Oracle has the slowest READ time and this does not change with a warm-up iteration. It also performs poorly in CREATE operations. However, Oracle has the second fastest time for both DELETE and UPDATE.
SQL Server maintains its position after warm-up, unlike in the JPA implementation. It has the fastest READ performance, but the second slowest DELETE and UPDATE, after PostgreSQL. PostgreSQL has the best performance for CREATE operations, but the slowest for DELETE and UPDATE, making it the least ideal choice for this framework. These statistics remain unchanged after the warm-up iteration.
Compared to the other two ORM frameworks, Spring Data JPA brings a big overhead to the table, making it interesting for further investigations at the level of the internal operations that slow down the execution. An advantage of this framework is the reduced size of the code that was to be written for the database interaction, and a trade-off between the development speed and the execution times needs to be considered.
10.2.4. Overall conclusions
Oracle seems to be the worst choice in terms of reading data. It performs the worst using every framework. The same thing is valid for PostgreSQL, but for deleting data. In this case, the overhead is so big that it may be a better idea to change the RDBMS if the DELETE operation is frequently used.
An overall good solution is represented by MySQL, which is the only one that keeps close times on every ORM framework. SQL Server also has good average timing but without any outstanding performance on a specific operation.
After the warm-up phase, the only CRUD operation that had a visible and constant improvement was the READ one. For the rest of the operations, the improvements are generally noticed on a small number of entries (less than 20k or 50k). What may be surprising is that sometimes, usually for a large number of entries (500k), the warm-up phase is useless, as the execution times for the second iteration are even bigger.
After researching what could make Spring Data JPA’s transaction management act so slow, the conclusion was that it does not have only one EntityManager, but it has a SharedEntityManagerCreator which creates more objects of type EntityManager to avoid possible thread safety issues.
The classic EntityManager generated by EntityManagerFactory used in the JPA implementation does not offer thread safety, but in the proposed experiment this is not necessary. Using it makes Spring Data JPA faster in the interaction with the relational database management system.
Switching the transaction management turns Spring Data JPA into a similar solution in terms of performance like JPA or Hibernate. This means that probably the starvation situations mentioned by the YourKit profiler are happening somewhere inside the transaction mechanism proposed by Spring Data JPA.
Designing enterprise applications nowadays is a real challenge and involves a lot of high-level skills and experience. Besides designing [15] and assessing the architecture [16], selecting and applying the software development methodology [17], and testing the functionality [11], performance plays an essential role in modern software.
Author Contributions
Conceptualization, Cătălin Tudose; Formal analysis, Alexandru Marius Bonteanu and Cătălin Tudose; Investigation, Alexandru Marius Bonteanu and Cătălin Tudose; Methodology, Alexandru Marius Bonteanu and Cătălin Tudose; Software, Alexandru Marius Bonteanu; Supervision, Cătălin Tudose; Validation, Alexandru Marius Bonteanu and Cătălin Tudose; Writing – original draft, Alexandru Marius Bonteanu; Writing – review & editing, Cătălin Tudose. All authors have read and agreed to the published version of the manuscript.
Conflicts of Interest
The authors declare no conflict of interest.
References
- Keith, M.; Schnicariol, M. Object-relational mapping. Pro JPA 2, Apress 2009, pp. 69-106.
- Tudose, C.; Odubăşteanu, C. Object-relational Mapping Using JPA, Hibernate, and Spring Data JPA. In Proceedings of the 23rd International Conference on Control Systems and Computer Science, Bucharest, Romania, 26-28 May 2021. [Google Scholar]
- Bonteanu, A.-M.; Tudose, C. Multi-platform Performance Analysis for CRUD Operations in Relational Databases from Java Programs Using Hibernate. In Proceedings Big Data Intelligence and Computing: International Conference, DataCom 2022, Denarau Island, Fiji, December 8–10, 2022, pp. 275–288.
- Bonteanu, A.M.; Tudose, C.; Anghel, A. M. Performance Analysis for CRUD Operations in Relational Databases from Java Programs Using Hibernate. In Proceedings of the 24th International Conference on Control Systems and Computer Science (CSCS), Bucharest, Romania, 24-26 May 2023. [Google Scholar]
- Bonteanu, A.-M.; Tudose, C.; Anghel, A. M. Multi-Platform Performance Analysis for CRUD Operations in Relational Databases from Java Programs using Spring Data JPA. 13th International Symposium on Advanced Topics in Electrical Engineering (ATEE), Bucharest, Romania, 23-25 March 2023.
- Atzeni, P.; De Antonellis, V. Relational database theory. Benjamin-Cummings Publishing Co., Inc. 1993. [Google Scholar]
- Yousaf, H. Performance evaluation of Java object-relational mapping tools. Master of Science Thesis, University of Georgia. 2012. [Google Scholar]
- Hossain I.; Sazal M.; Das Santa T. Oracle, MySQL, PostgreSQL, SQLite, SQL Server: Performance-based competitive analysis, Bachelor of Science Degree in Computer Science and Engineering, Daffodil International University Dhaka, Bangladesh. 2019.
- Zmaranda, D.; Pop-Fele, L.; Gyorödi, C.; Gyorödi, R.; Pecherle, G. Performance Comparison of CRUD methods using NET Object Relational Mappers: A Case Study. International Journal of Advanced Computer Science and Applications, 2020; 55–65. [Google Scholar]
- Tudose, C. Java Persistence with Spring Data and Hibernate. Manning. 2023. [Google Scholar]
- Tudose, C. JUnit in Action. Manning. 2020. [Google Scholar]
- Costa D. E. D.; Bezemer C.; Leitner P.; Andrzejak A. What's Wrong With My Benchmark Results? Studying Bad Practices in JMH Benchmarks. IEEE Transactions on Software Engineering, 2019.
- YourKit. (2003-2023). YourKit Java Profiler. Available online: https://www.yourkit.com/java/profiler/features/ (accessed on 20 December 2023).
- Mihalcea V. High-Performance Java Persistence. self-published, Cluj-Napoca, 2019.
- Erder, M.; Pureur, P.; Woods, E. Continuous Architecture in Practice: Software Architecture in the Age of Agility and DevOps. 2021. [Google Scholar]
- CiceriC.; FarleyD.; Ford N.; Harmel-Law A.; Keeling M.; Lilienthal C.; Rosa J.; von Zitzewitz A.; Weiss R.; Woods E. Software Architecture Metrics, O'Reilly Media, Inc, 2022.
- Anghel, I.I.; Calin, R.S.; Nedelea, M.L.; Stanica, I.C.; Tudose, C.; Boiangiu, C.A. Software development methodologies: a comparative analysis. UPB Scientific Bulletin. 2022, Series C, 3(84).
Figure 1.
Testing architecture including the combinations framework - RDBMS.

Figure 2.
The data model for the application to be tested.
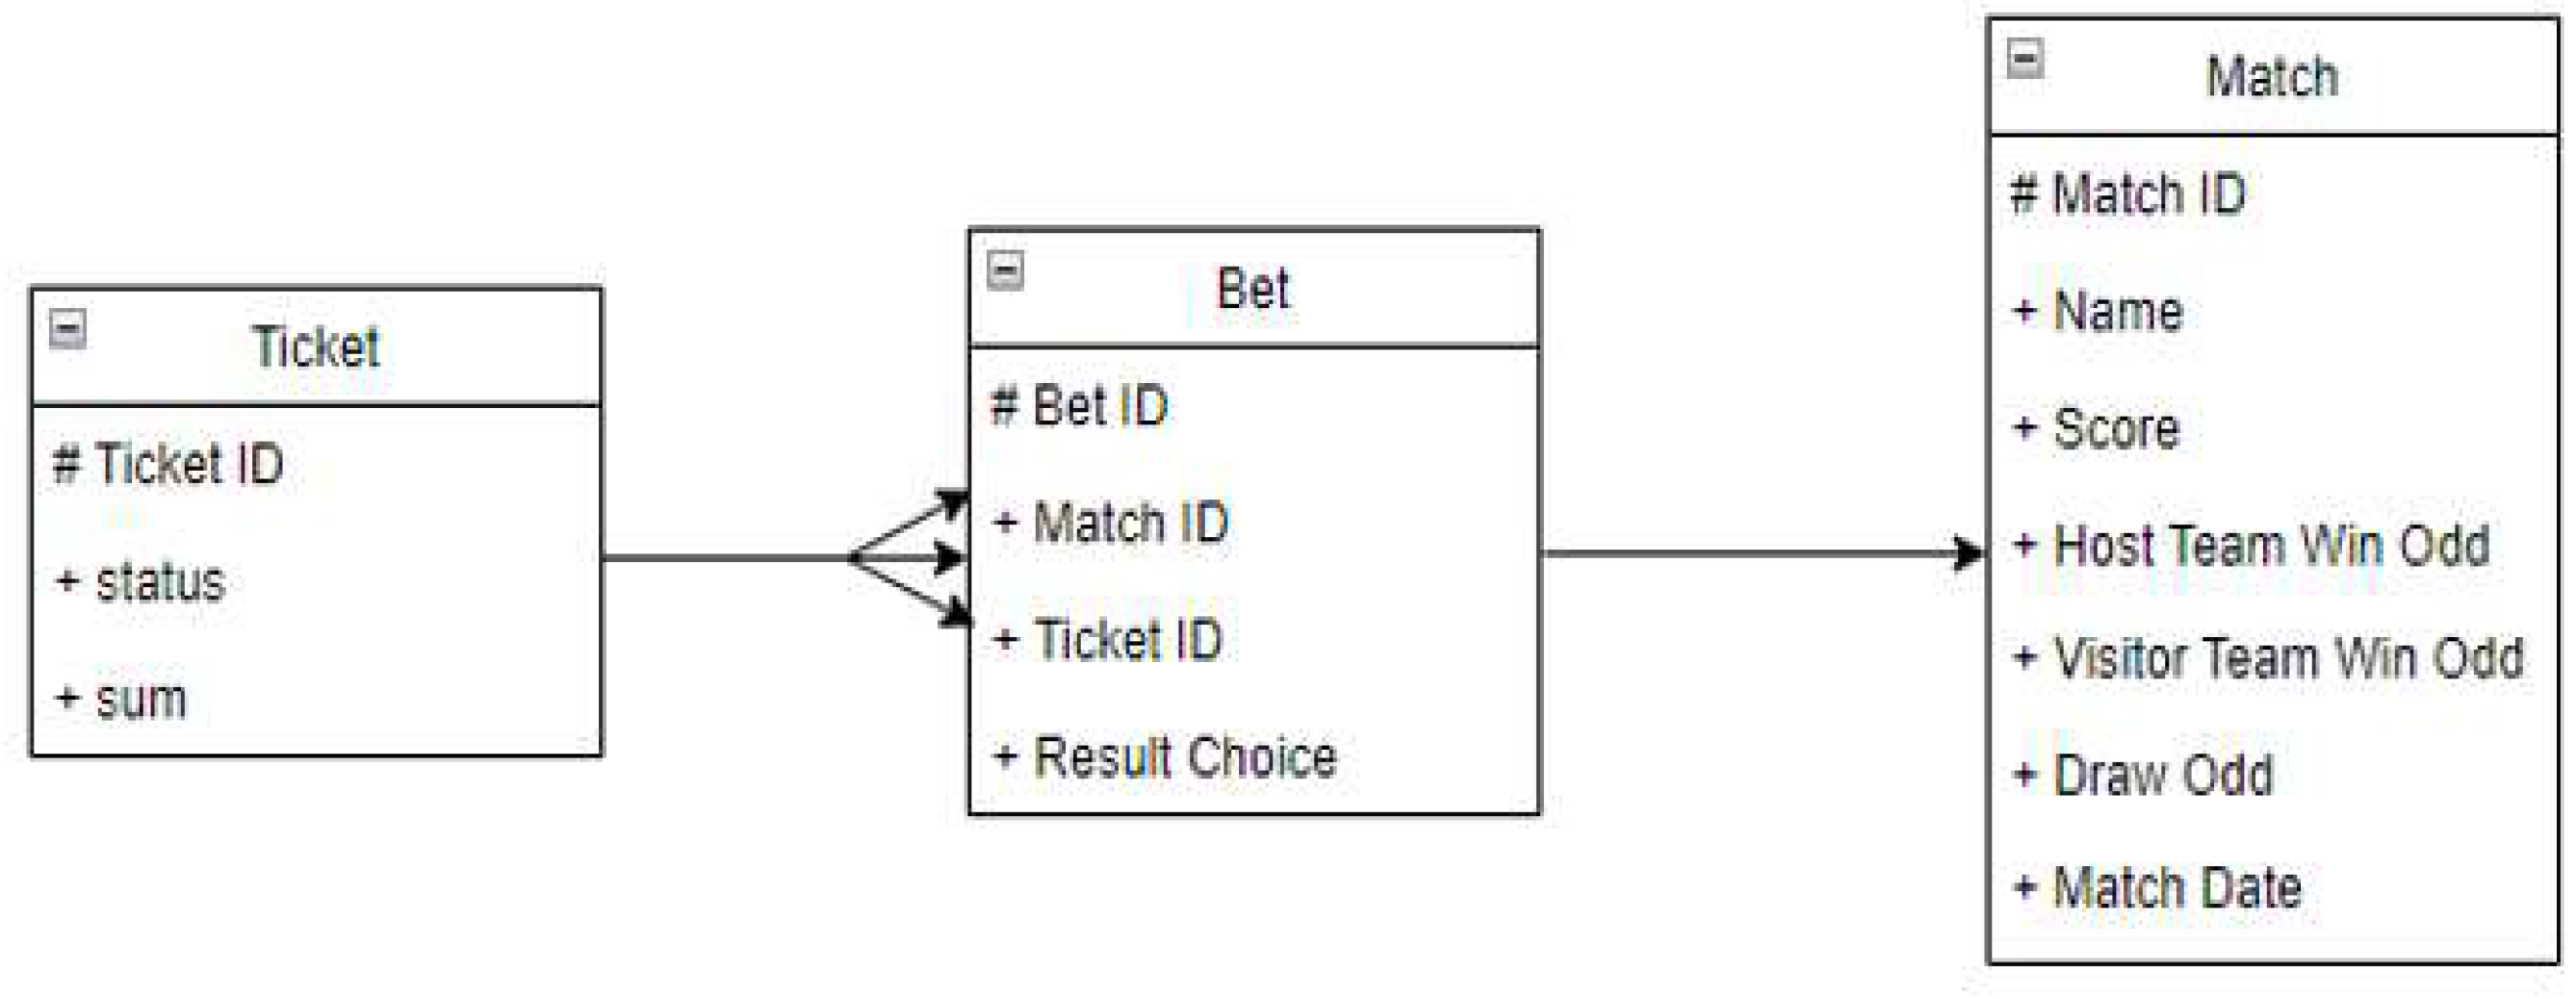
Figure 3.
Create execution times using JPA without warm-up.
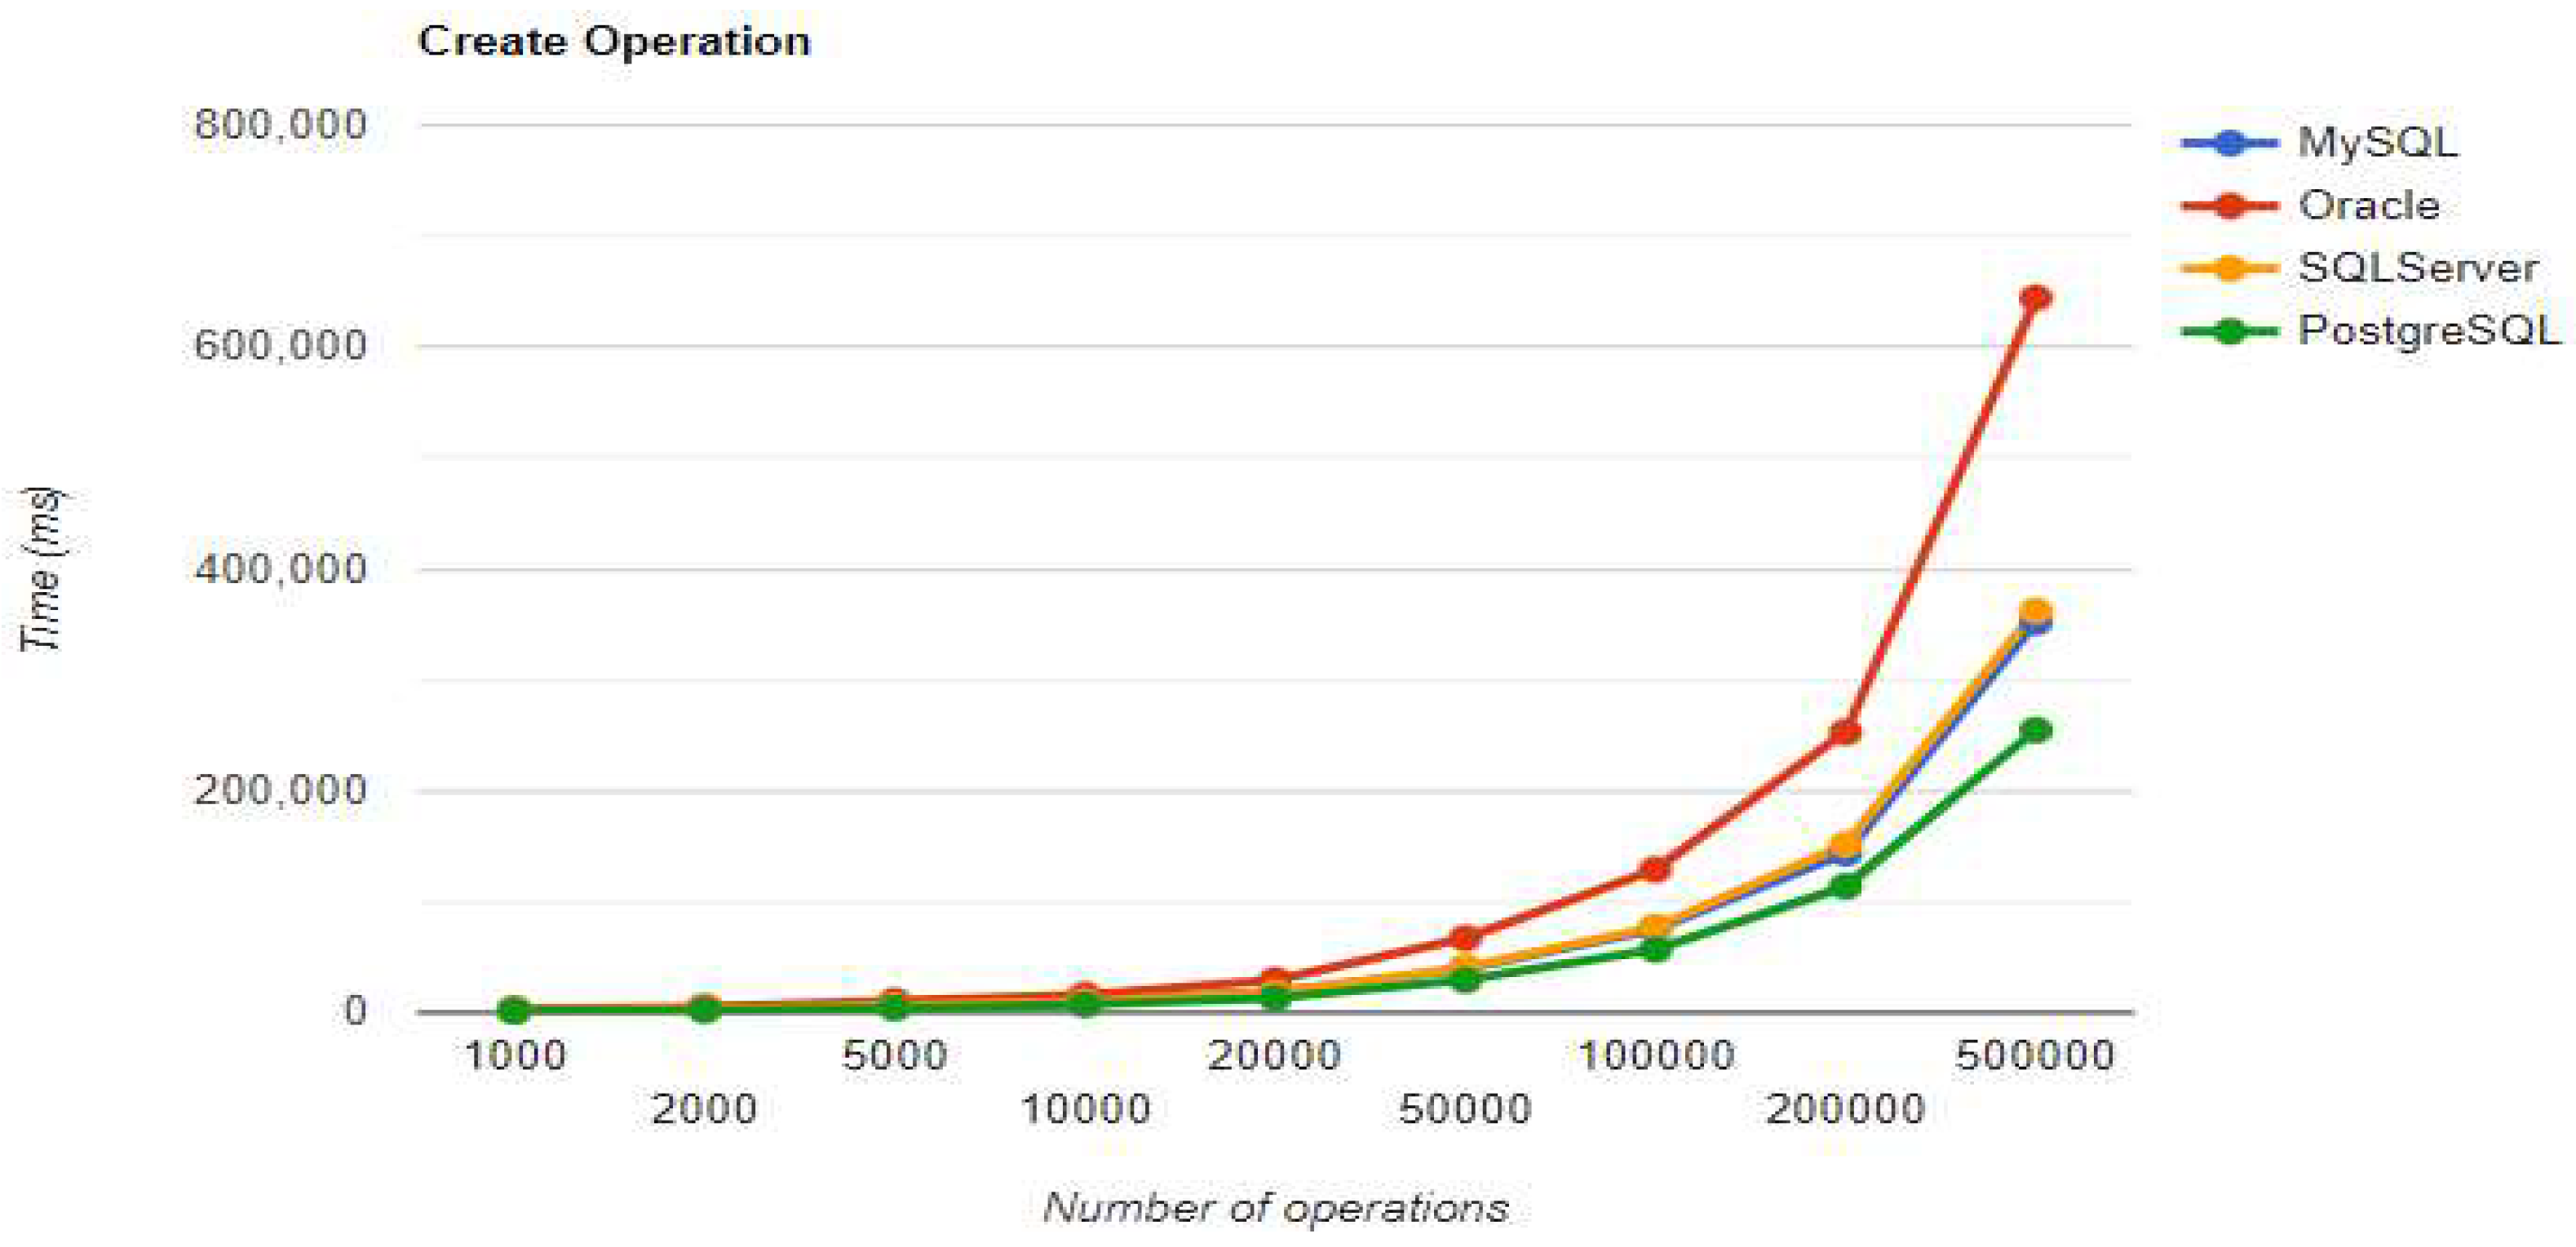
Figure 4.
Read execution times using JPA without warm-up.
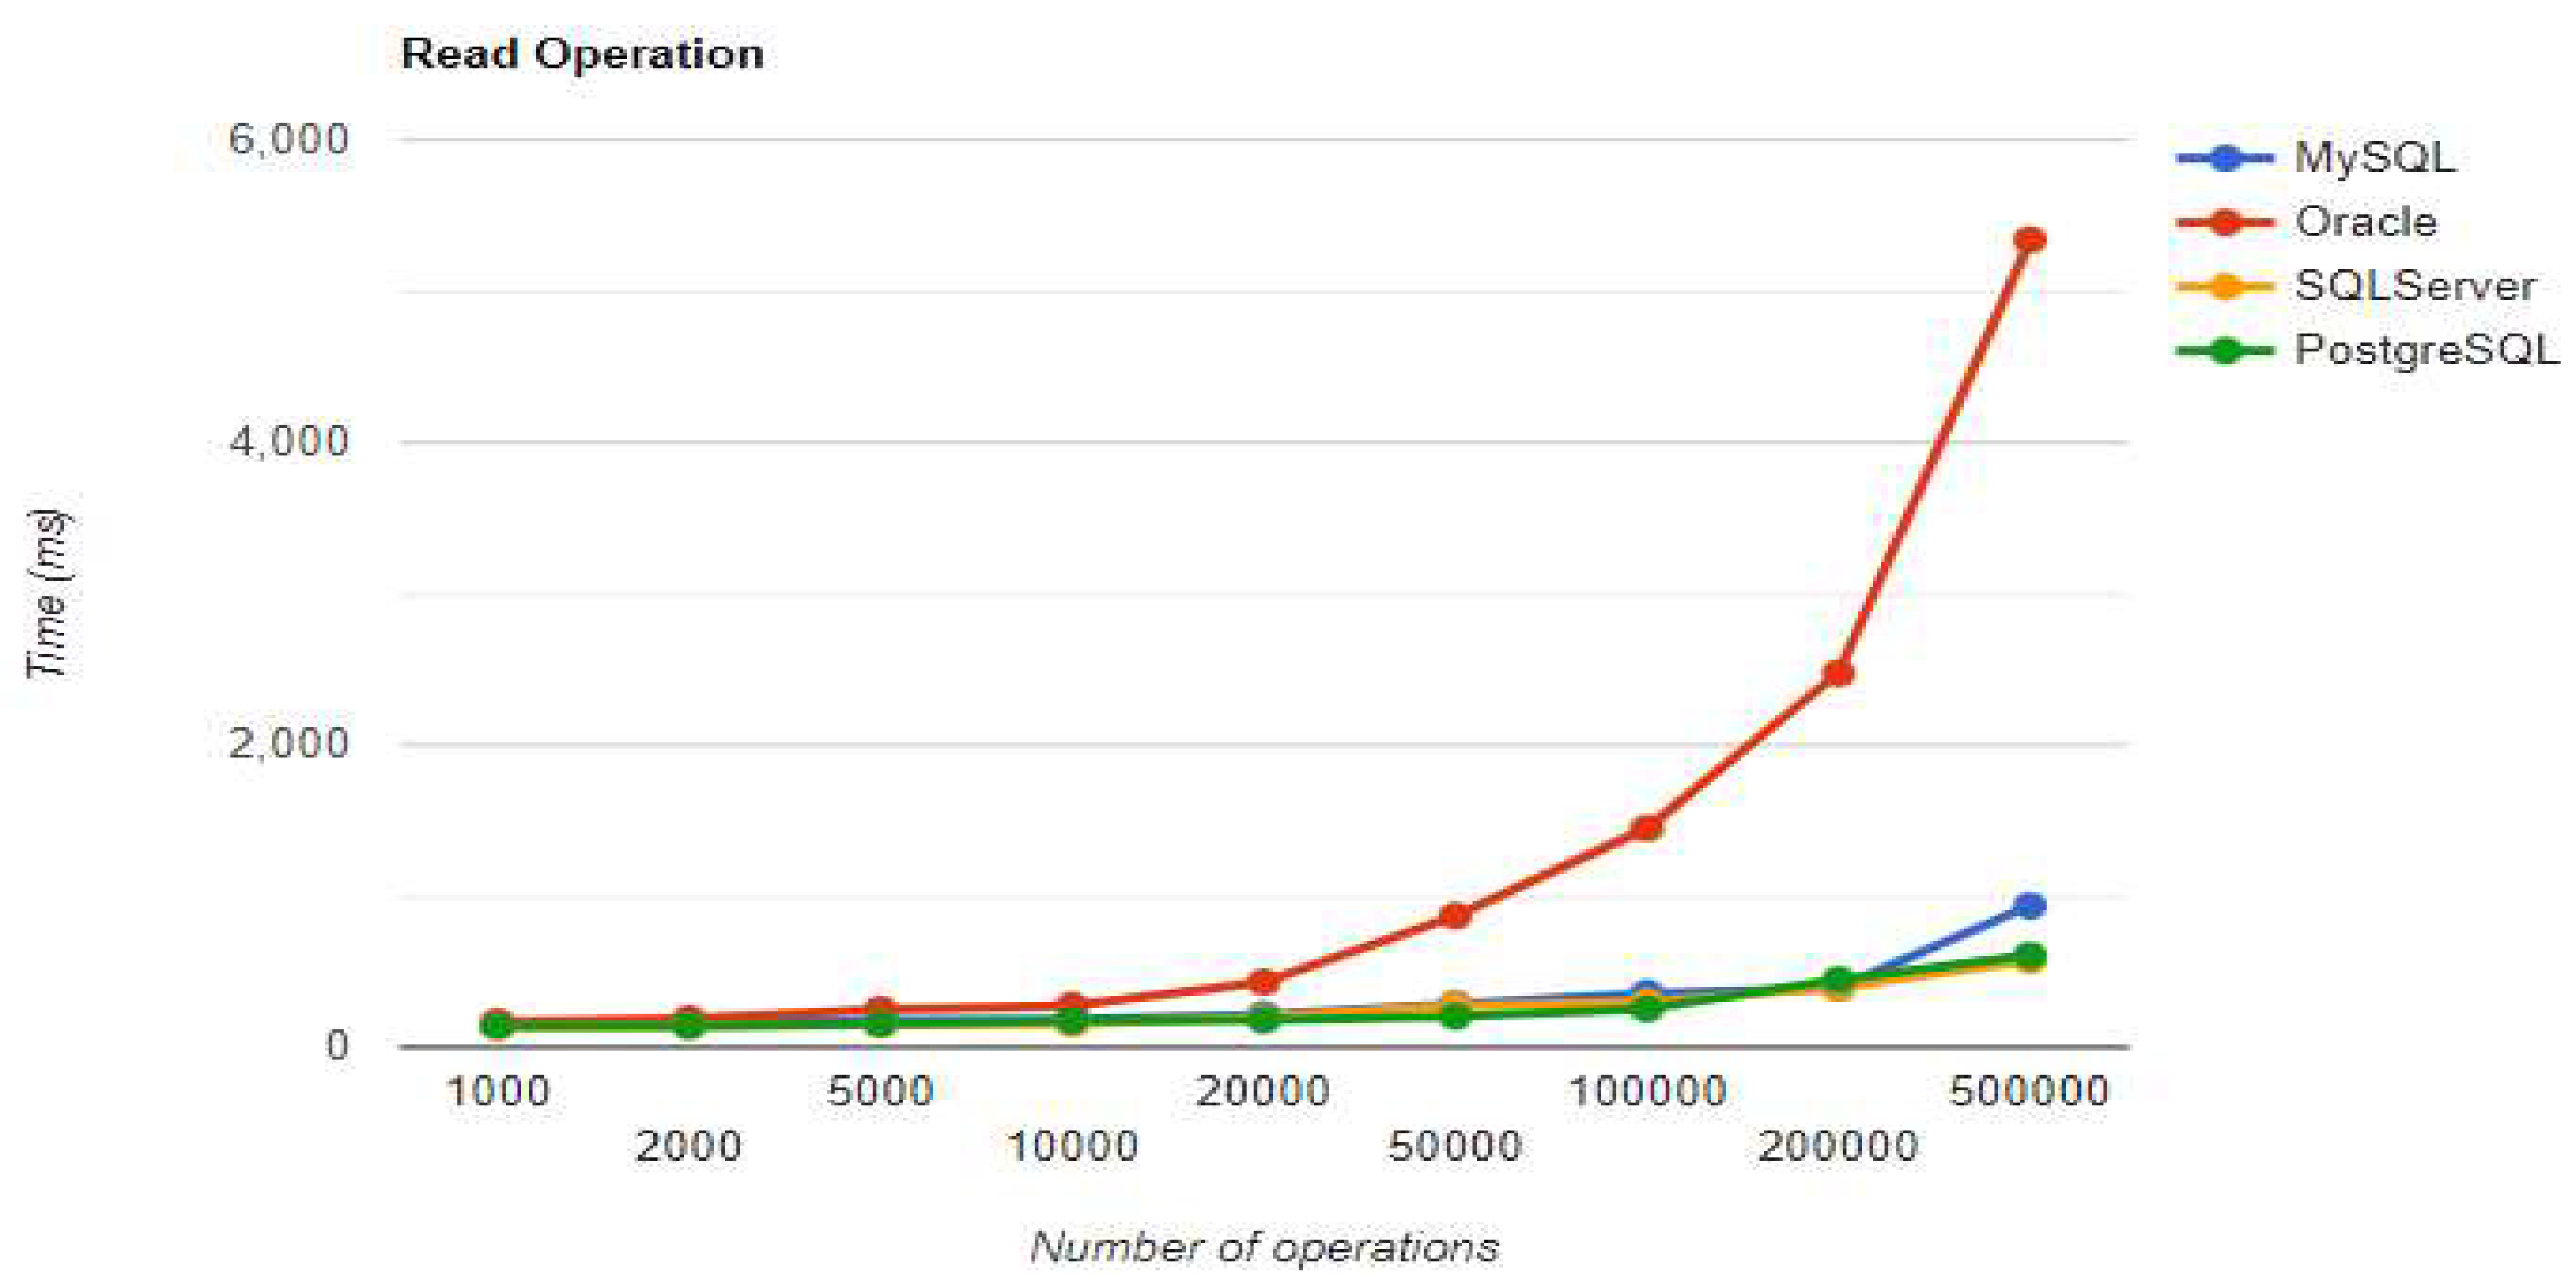
Figure 5.
Update execution times using JPA without warm-up.
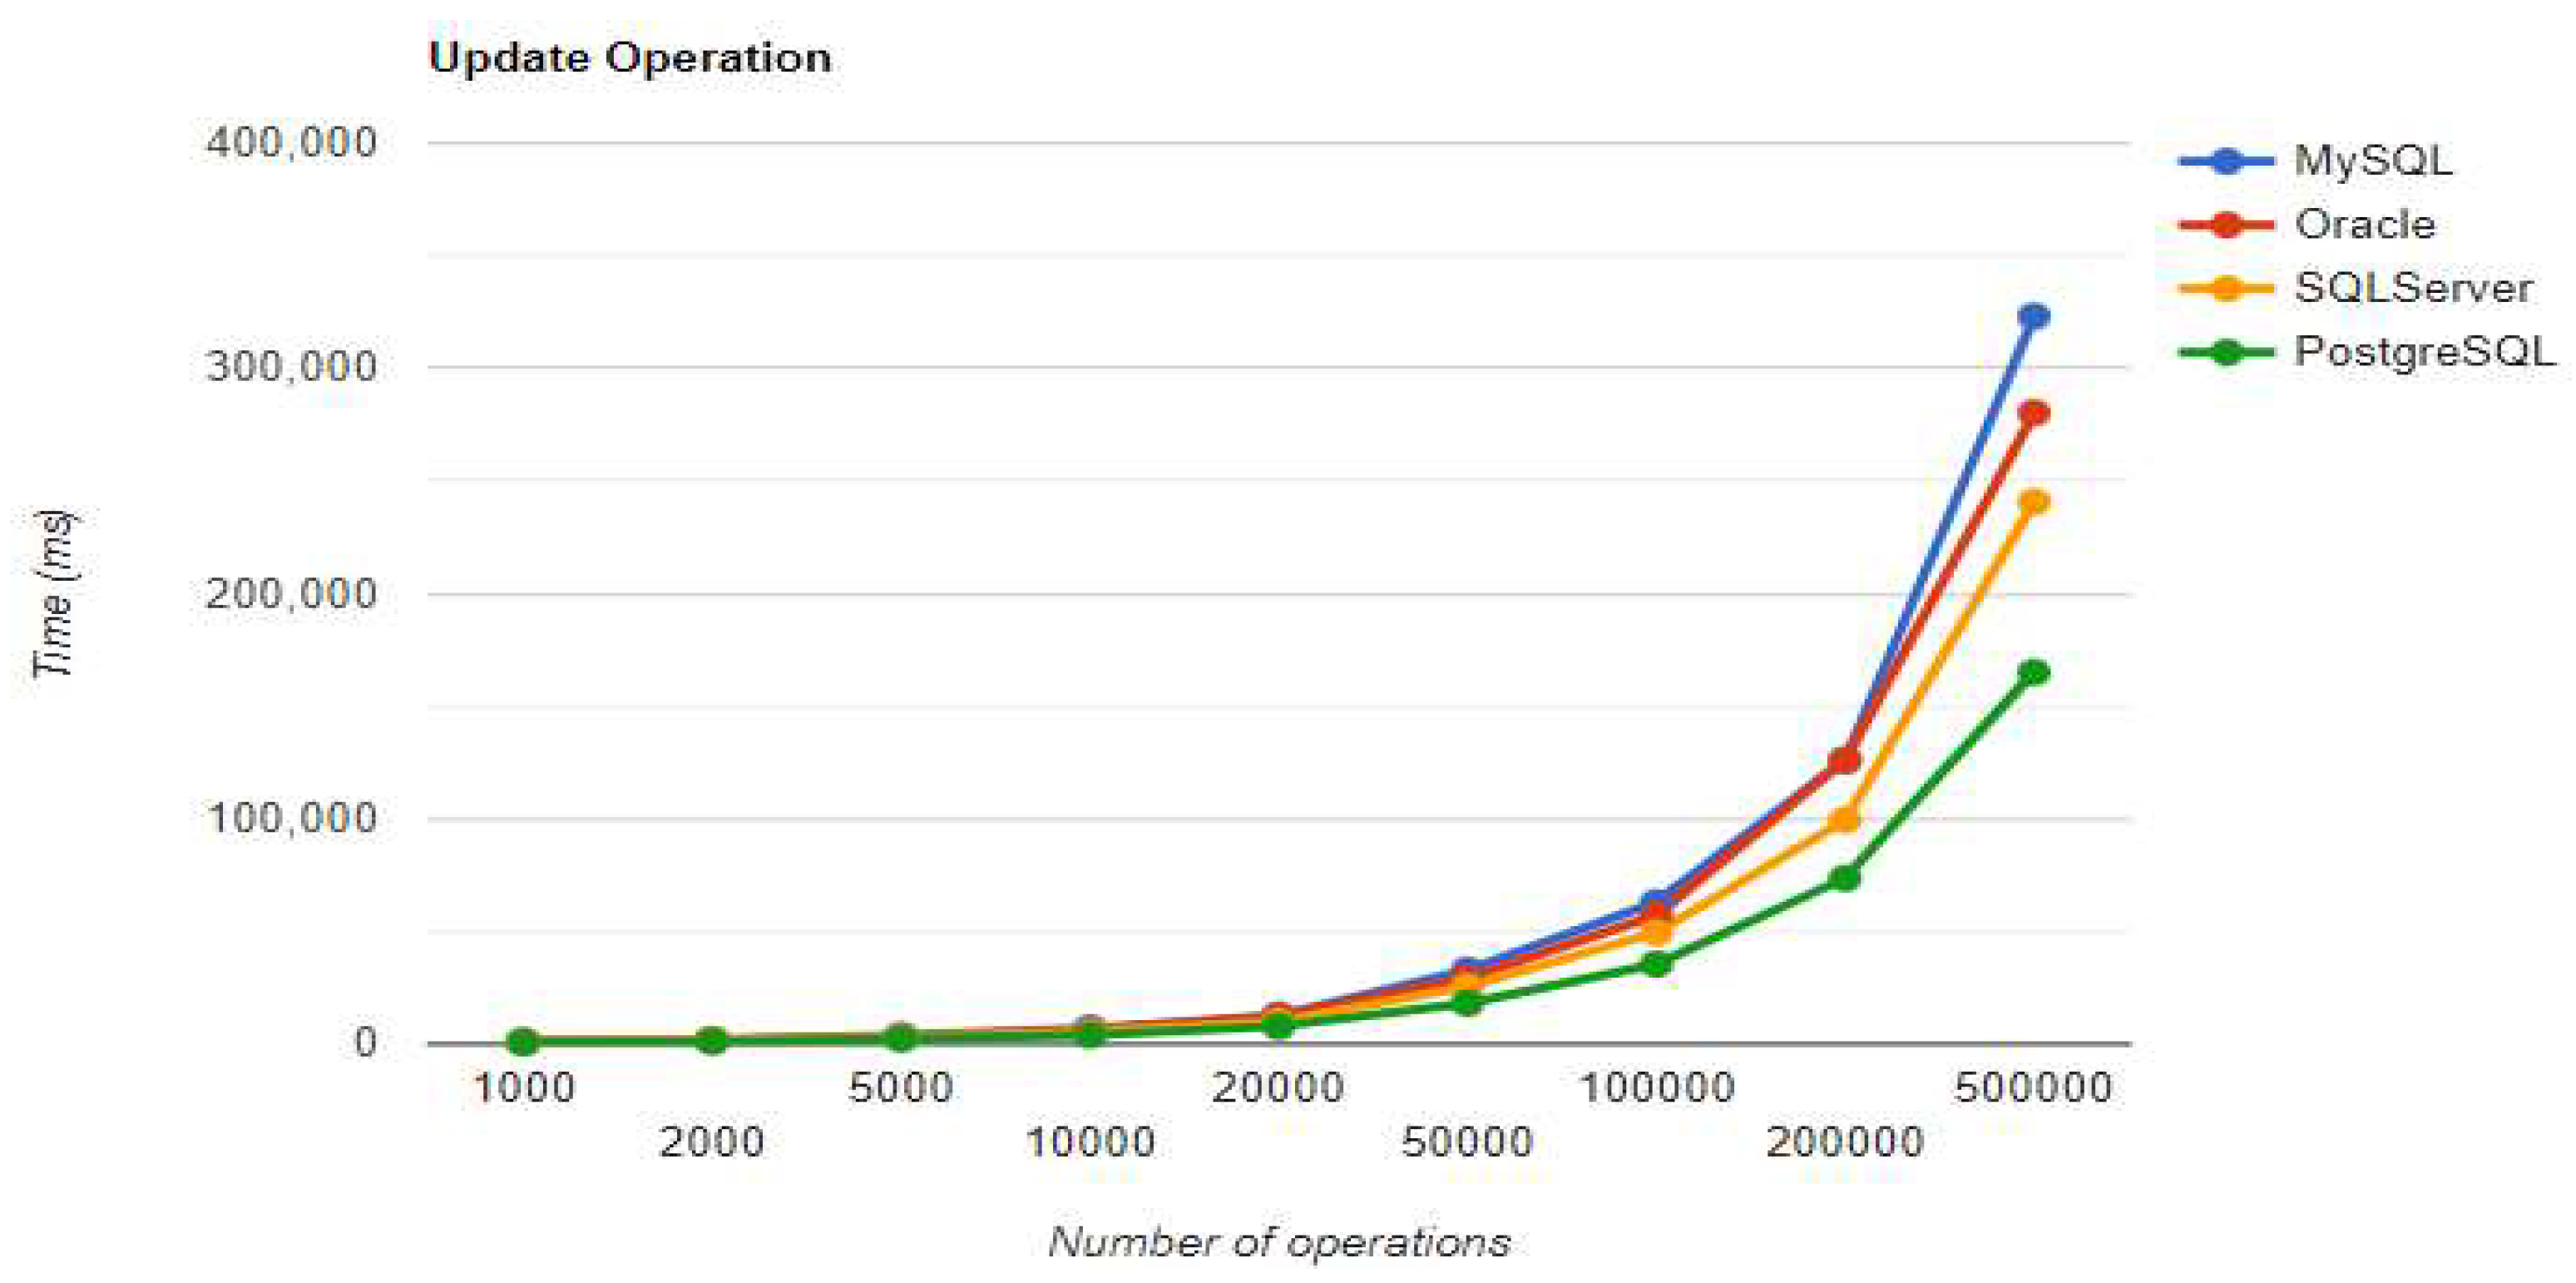
Figure 6.
Delete execution times using JPA without warm-up.
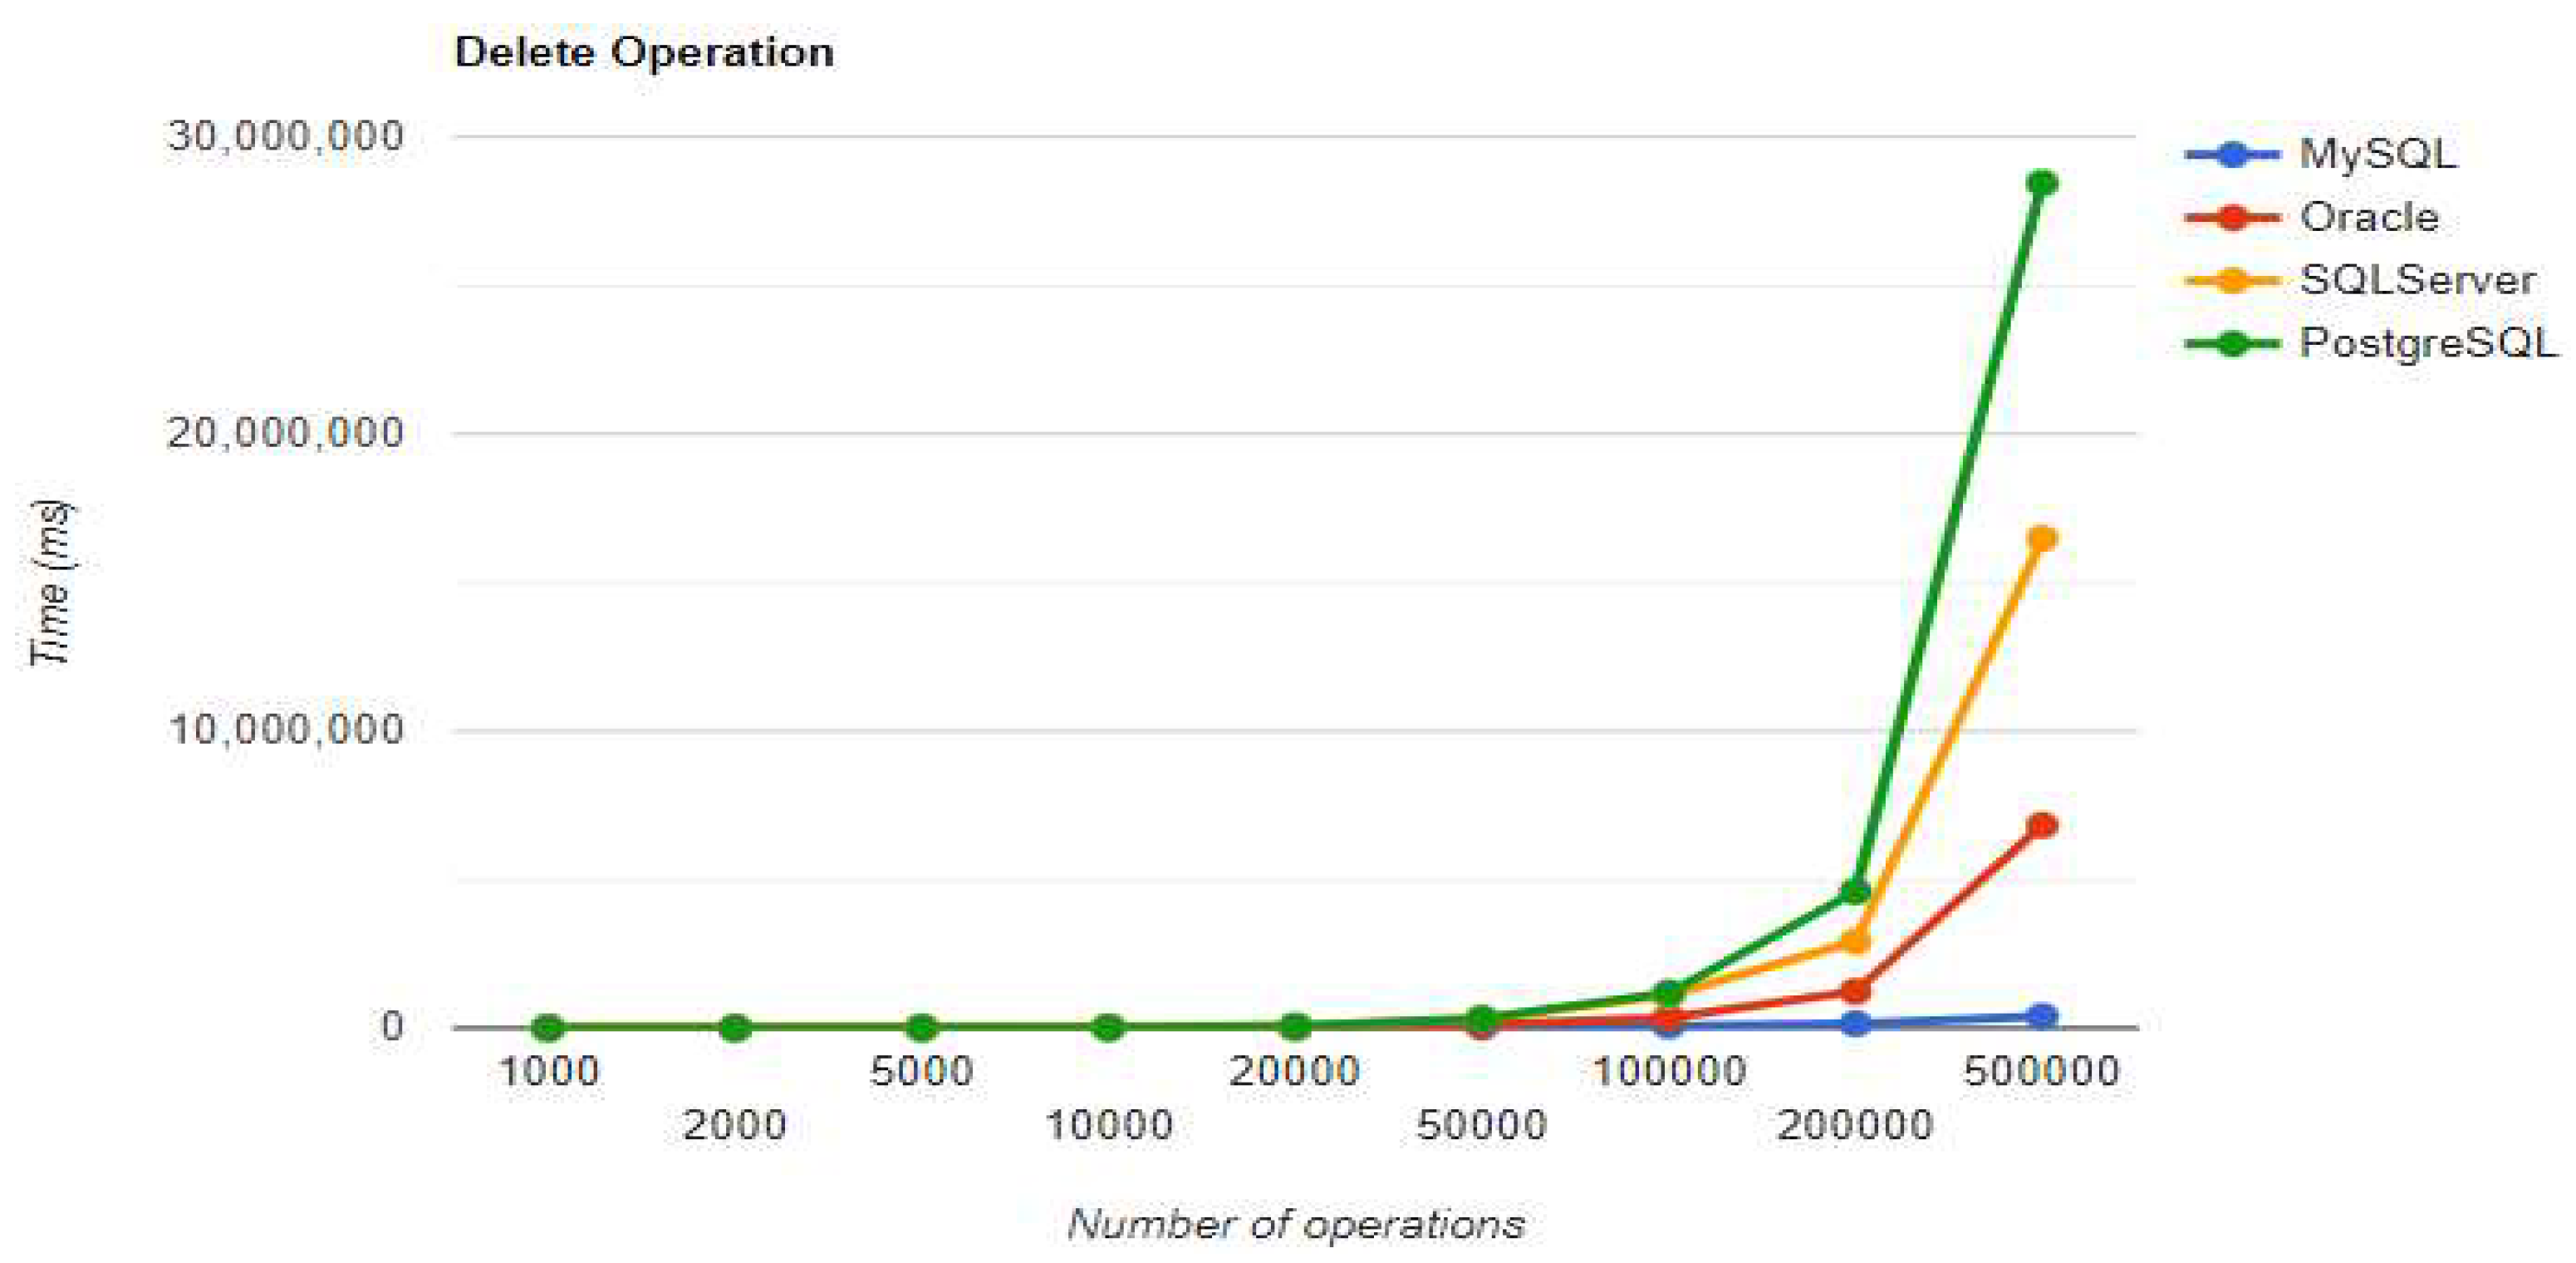
Figure 7.
Create execution times using Hibernate without warm-up.
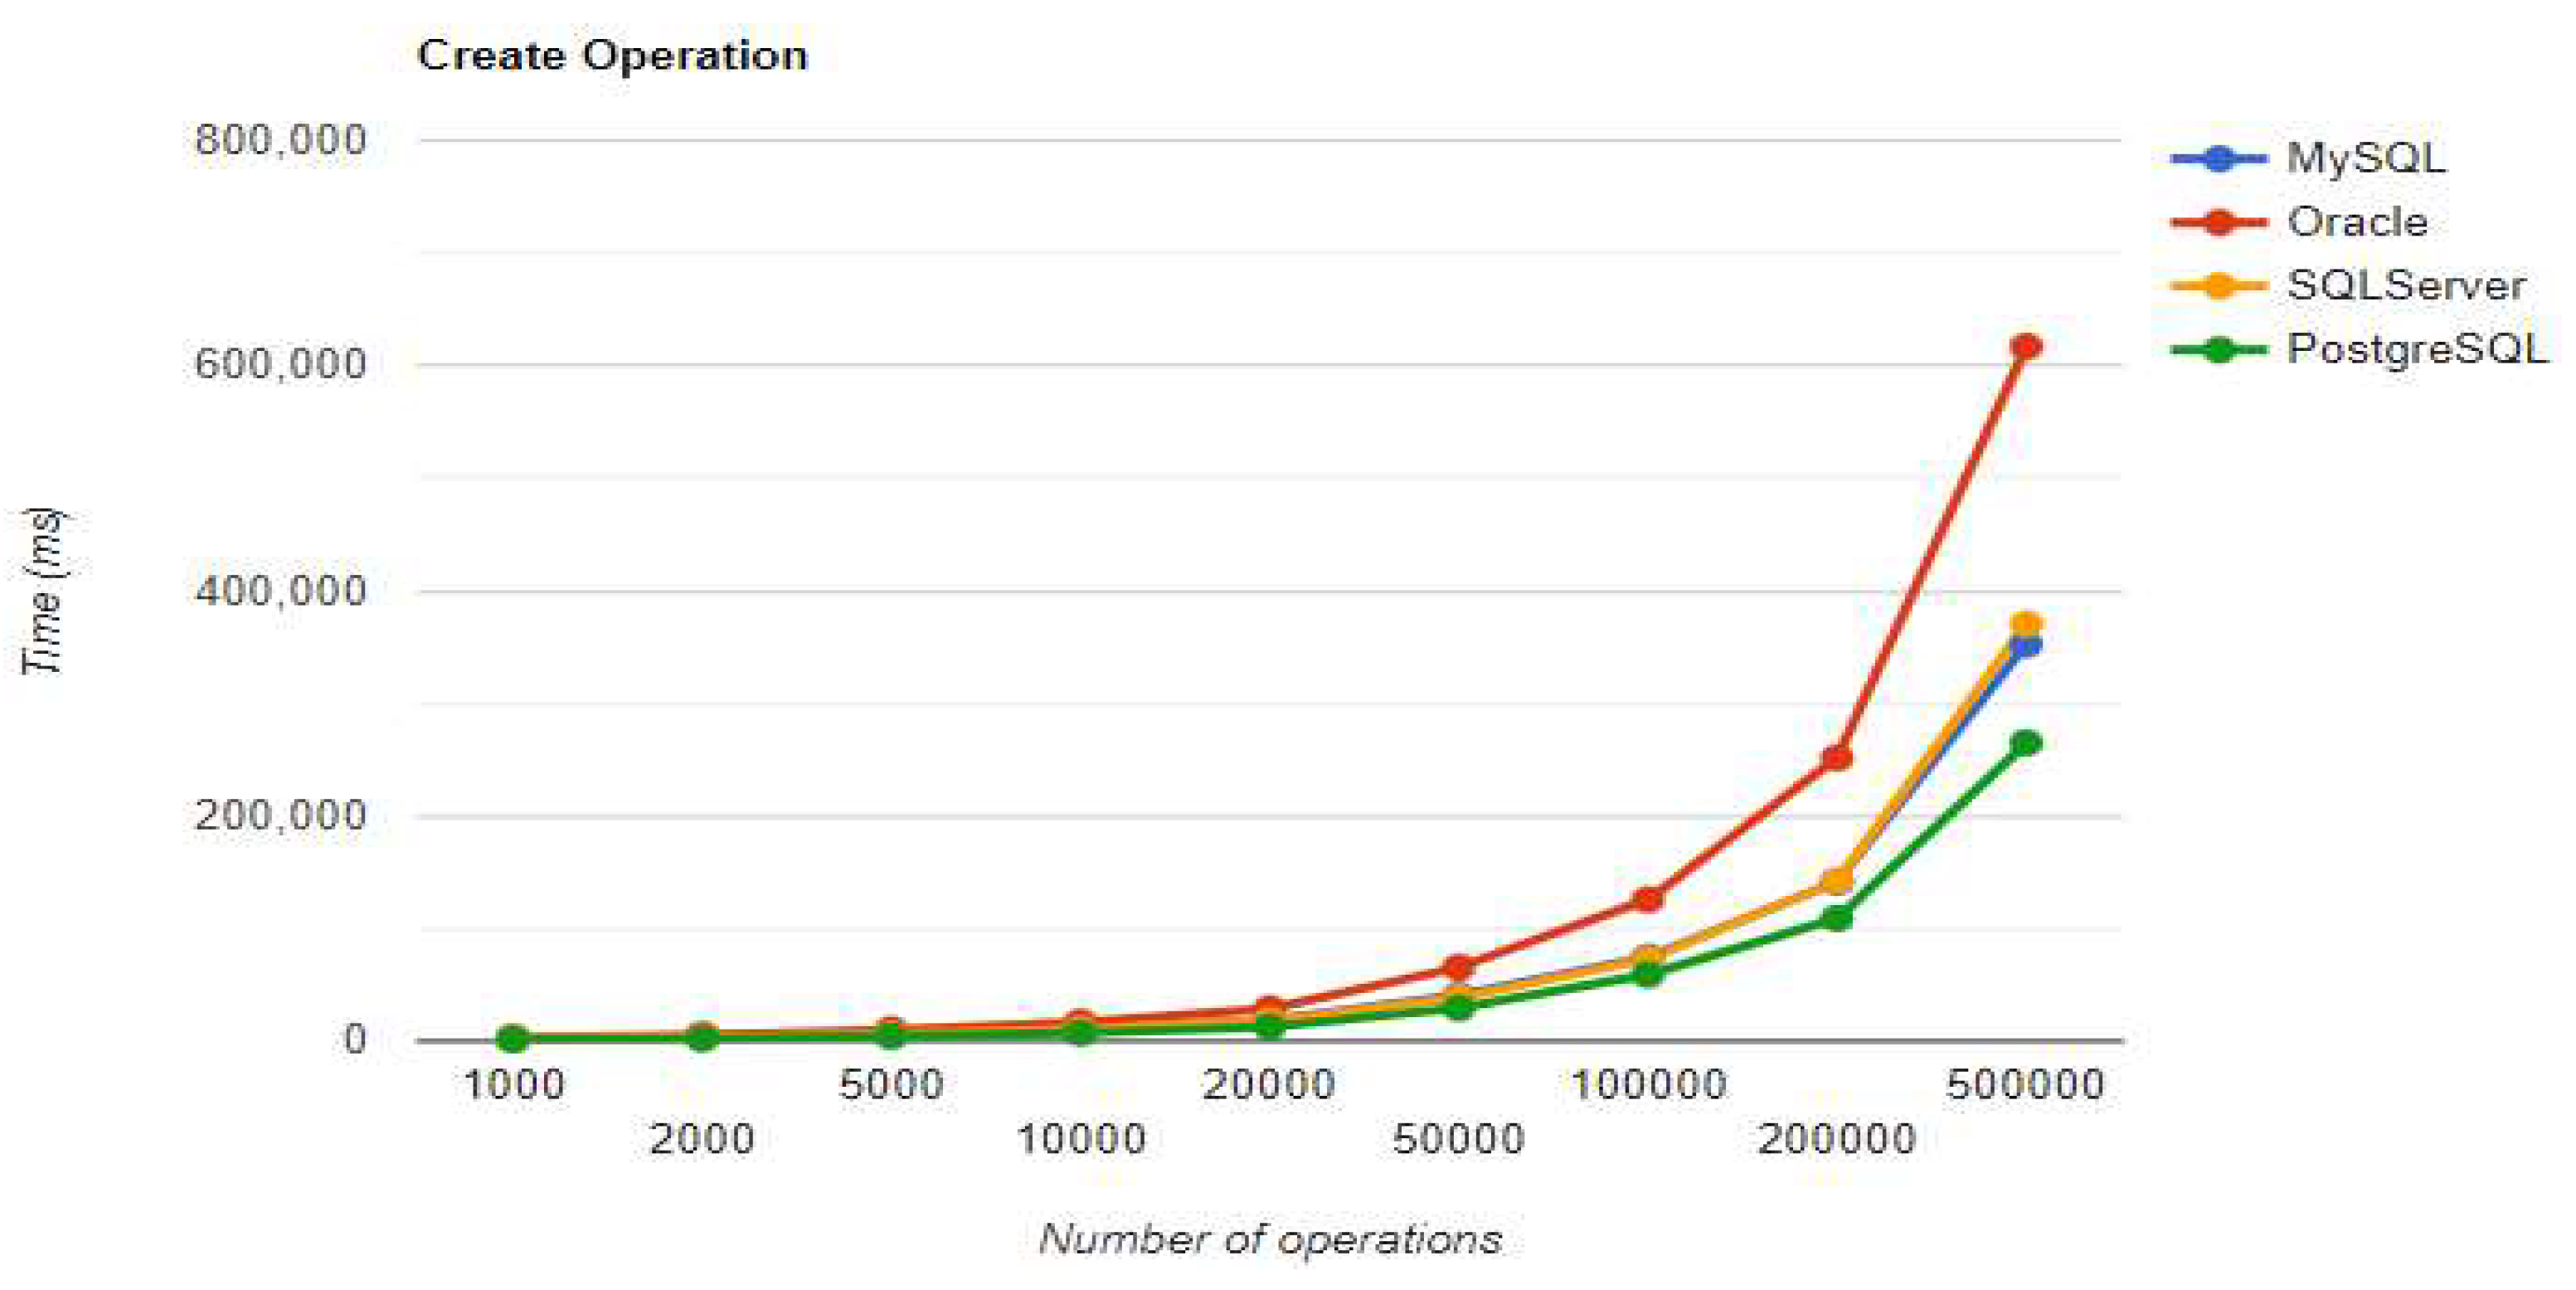
Figure 8.
Read execution times using Hibernate without warm-up.
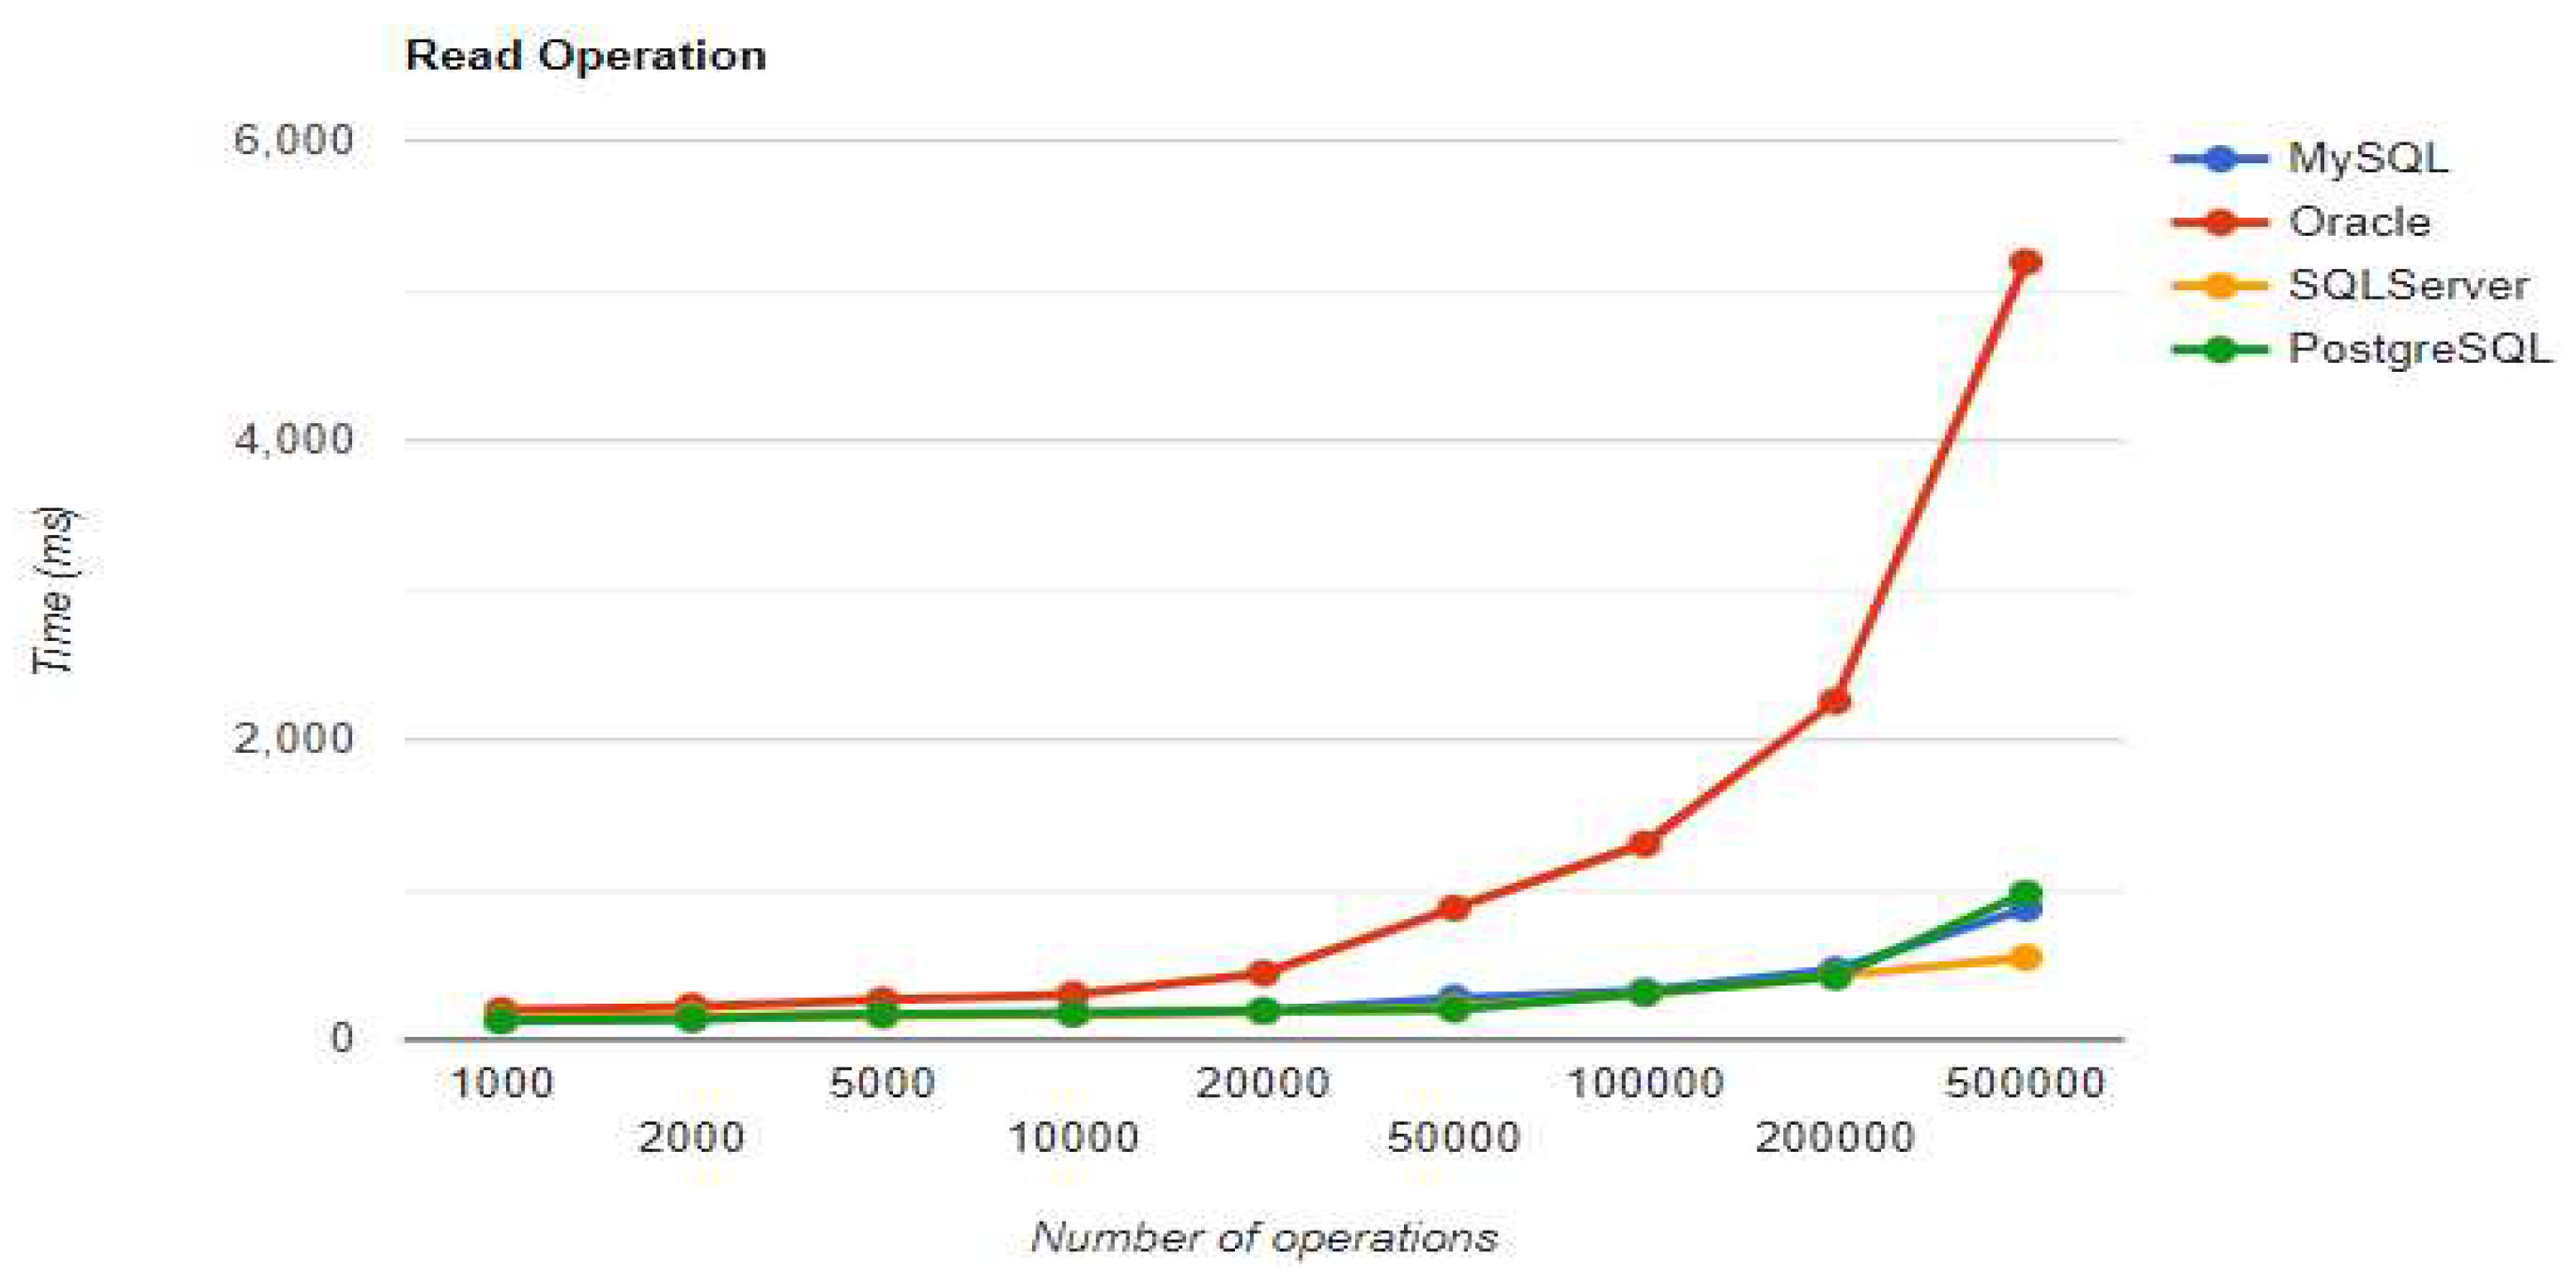
Figure 9.
Update execution times using Hibernate without warm-up.
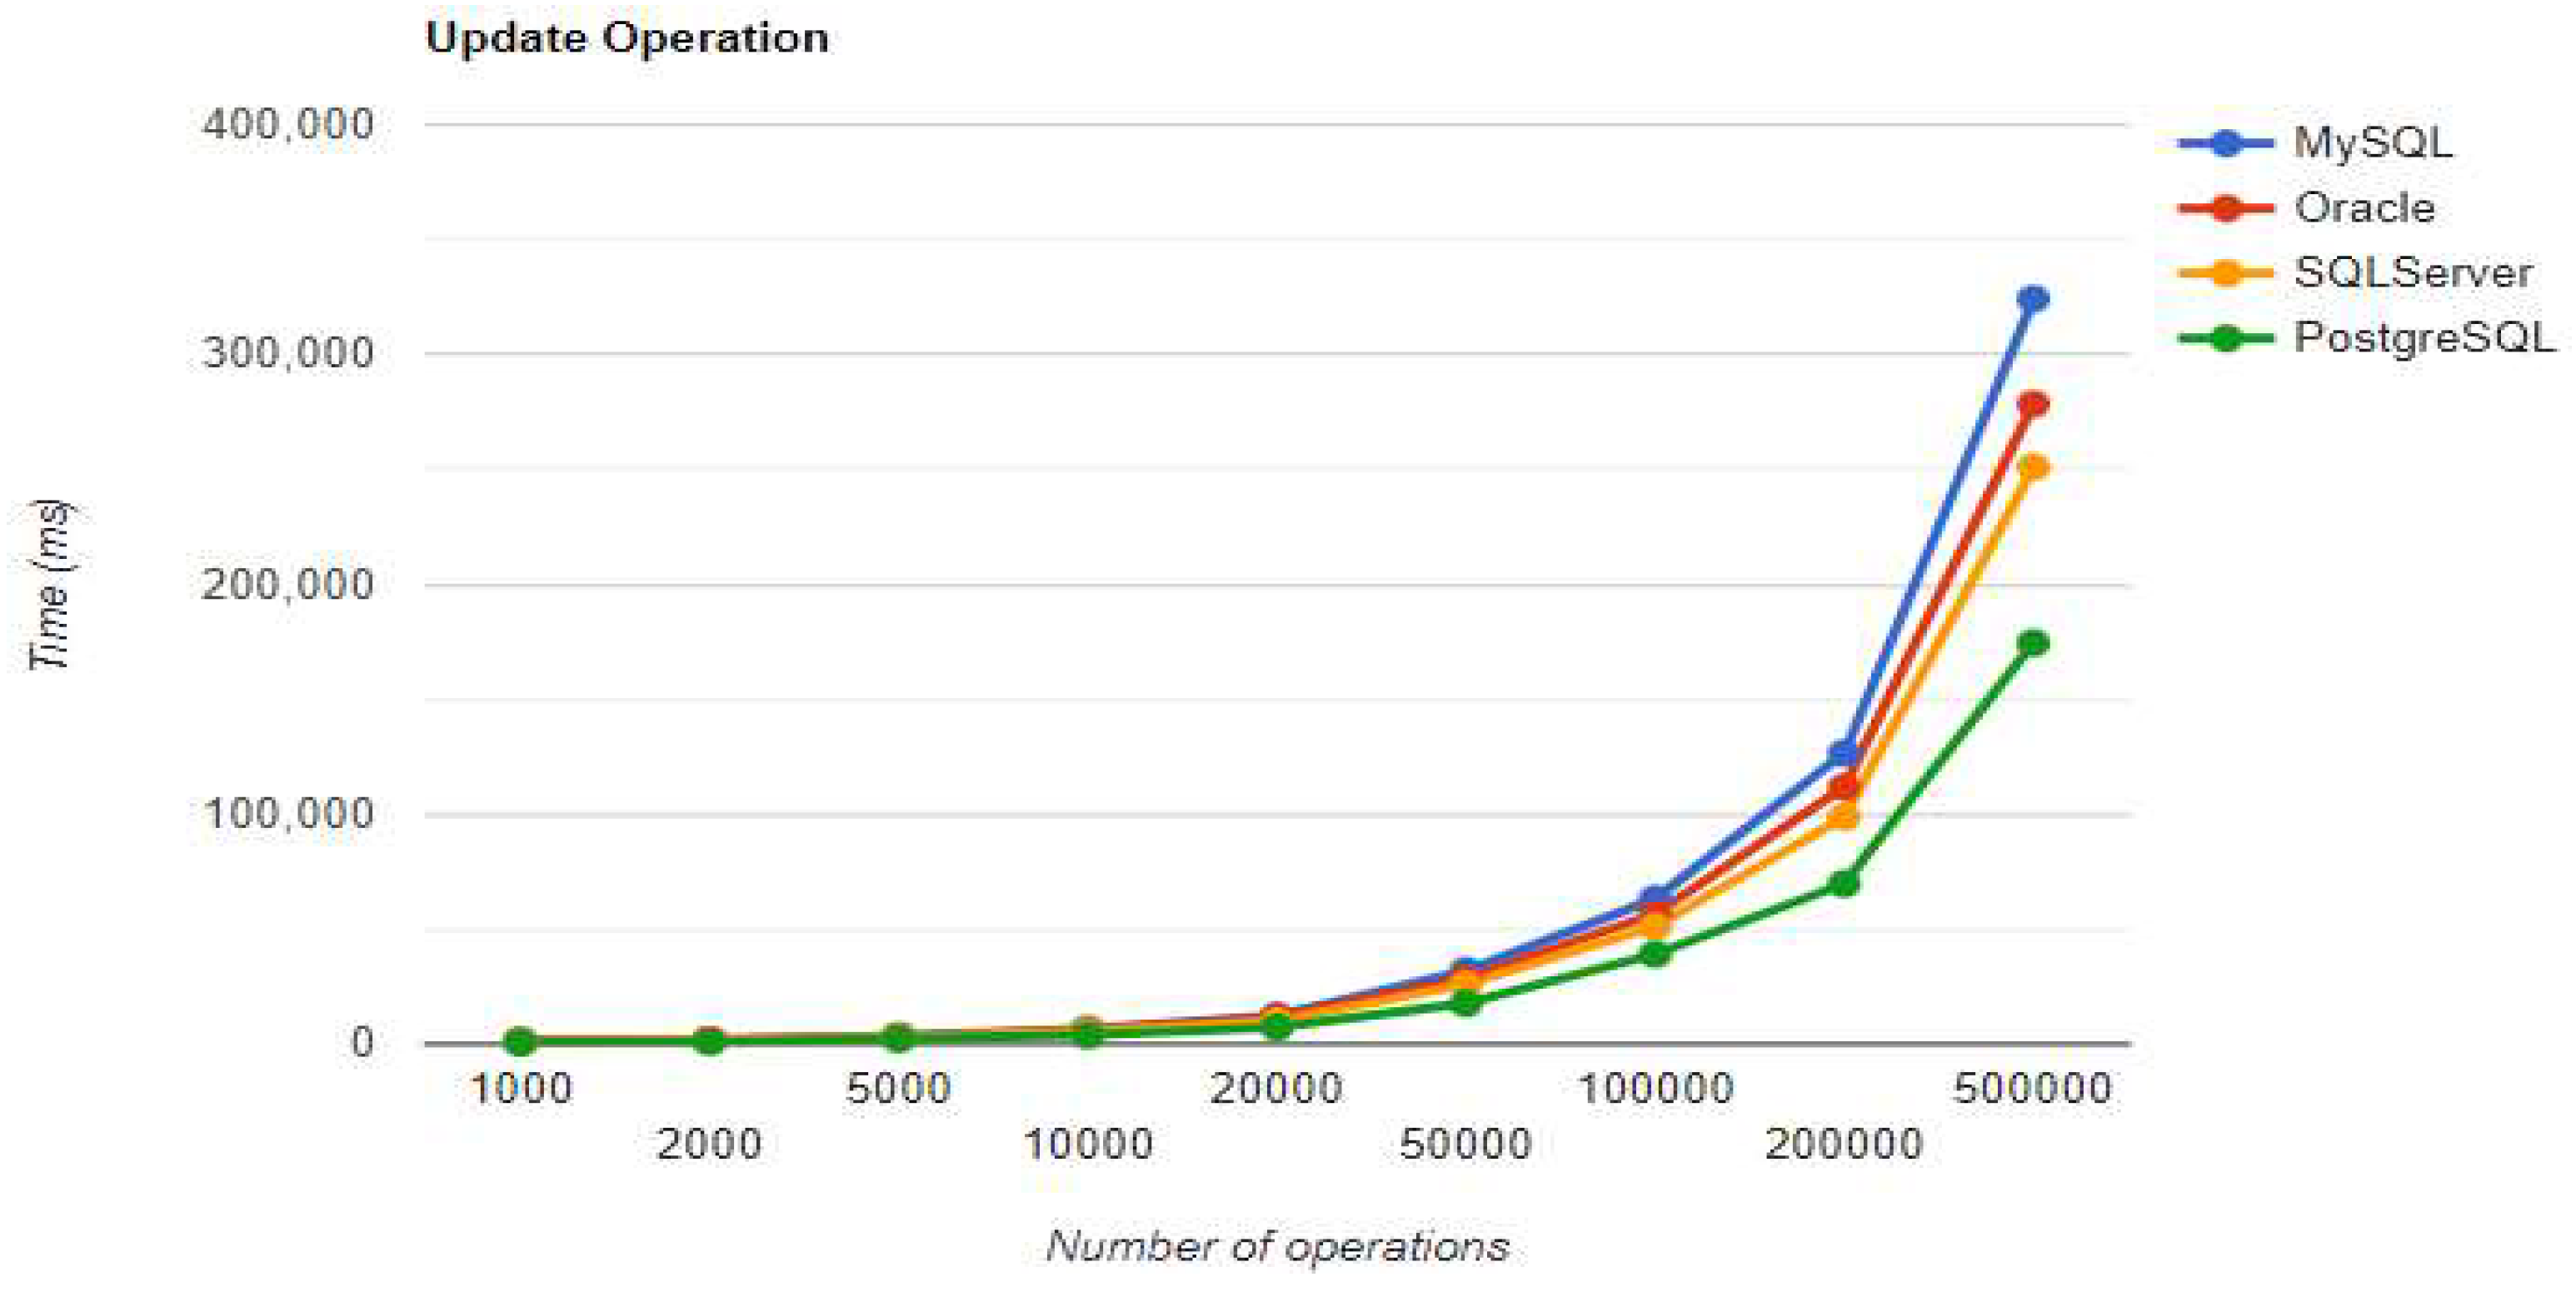
Figure 10.
Delete execution times using Hibernate without warm-up.
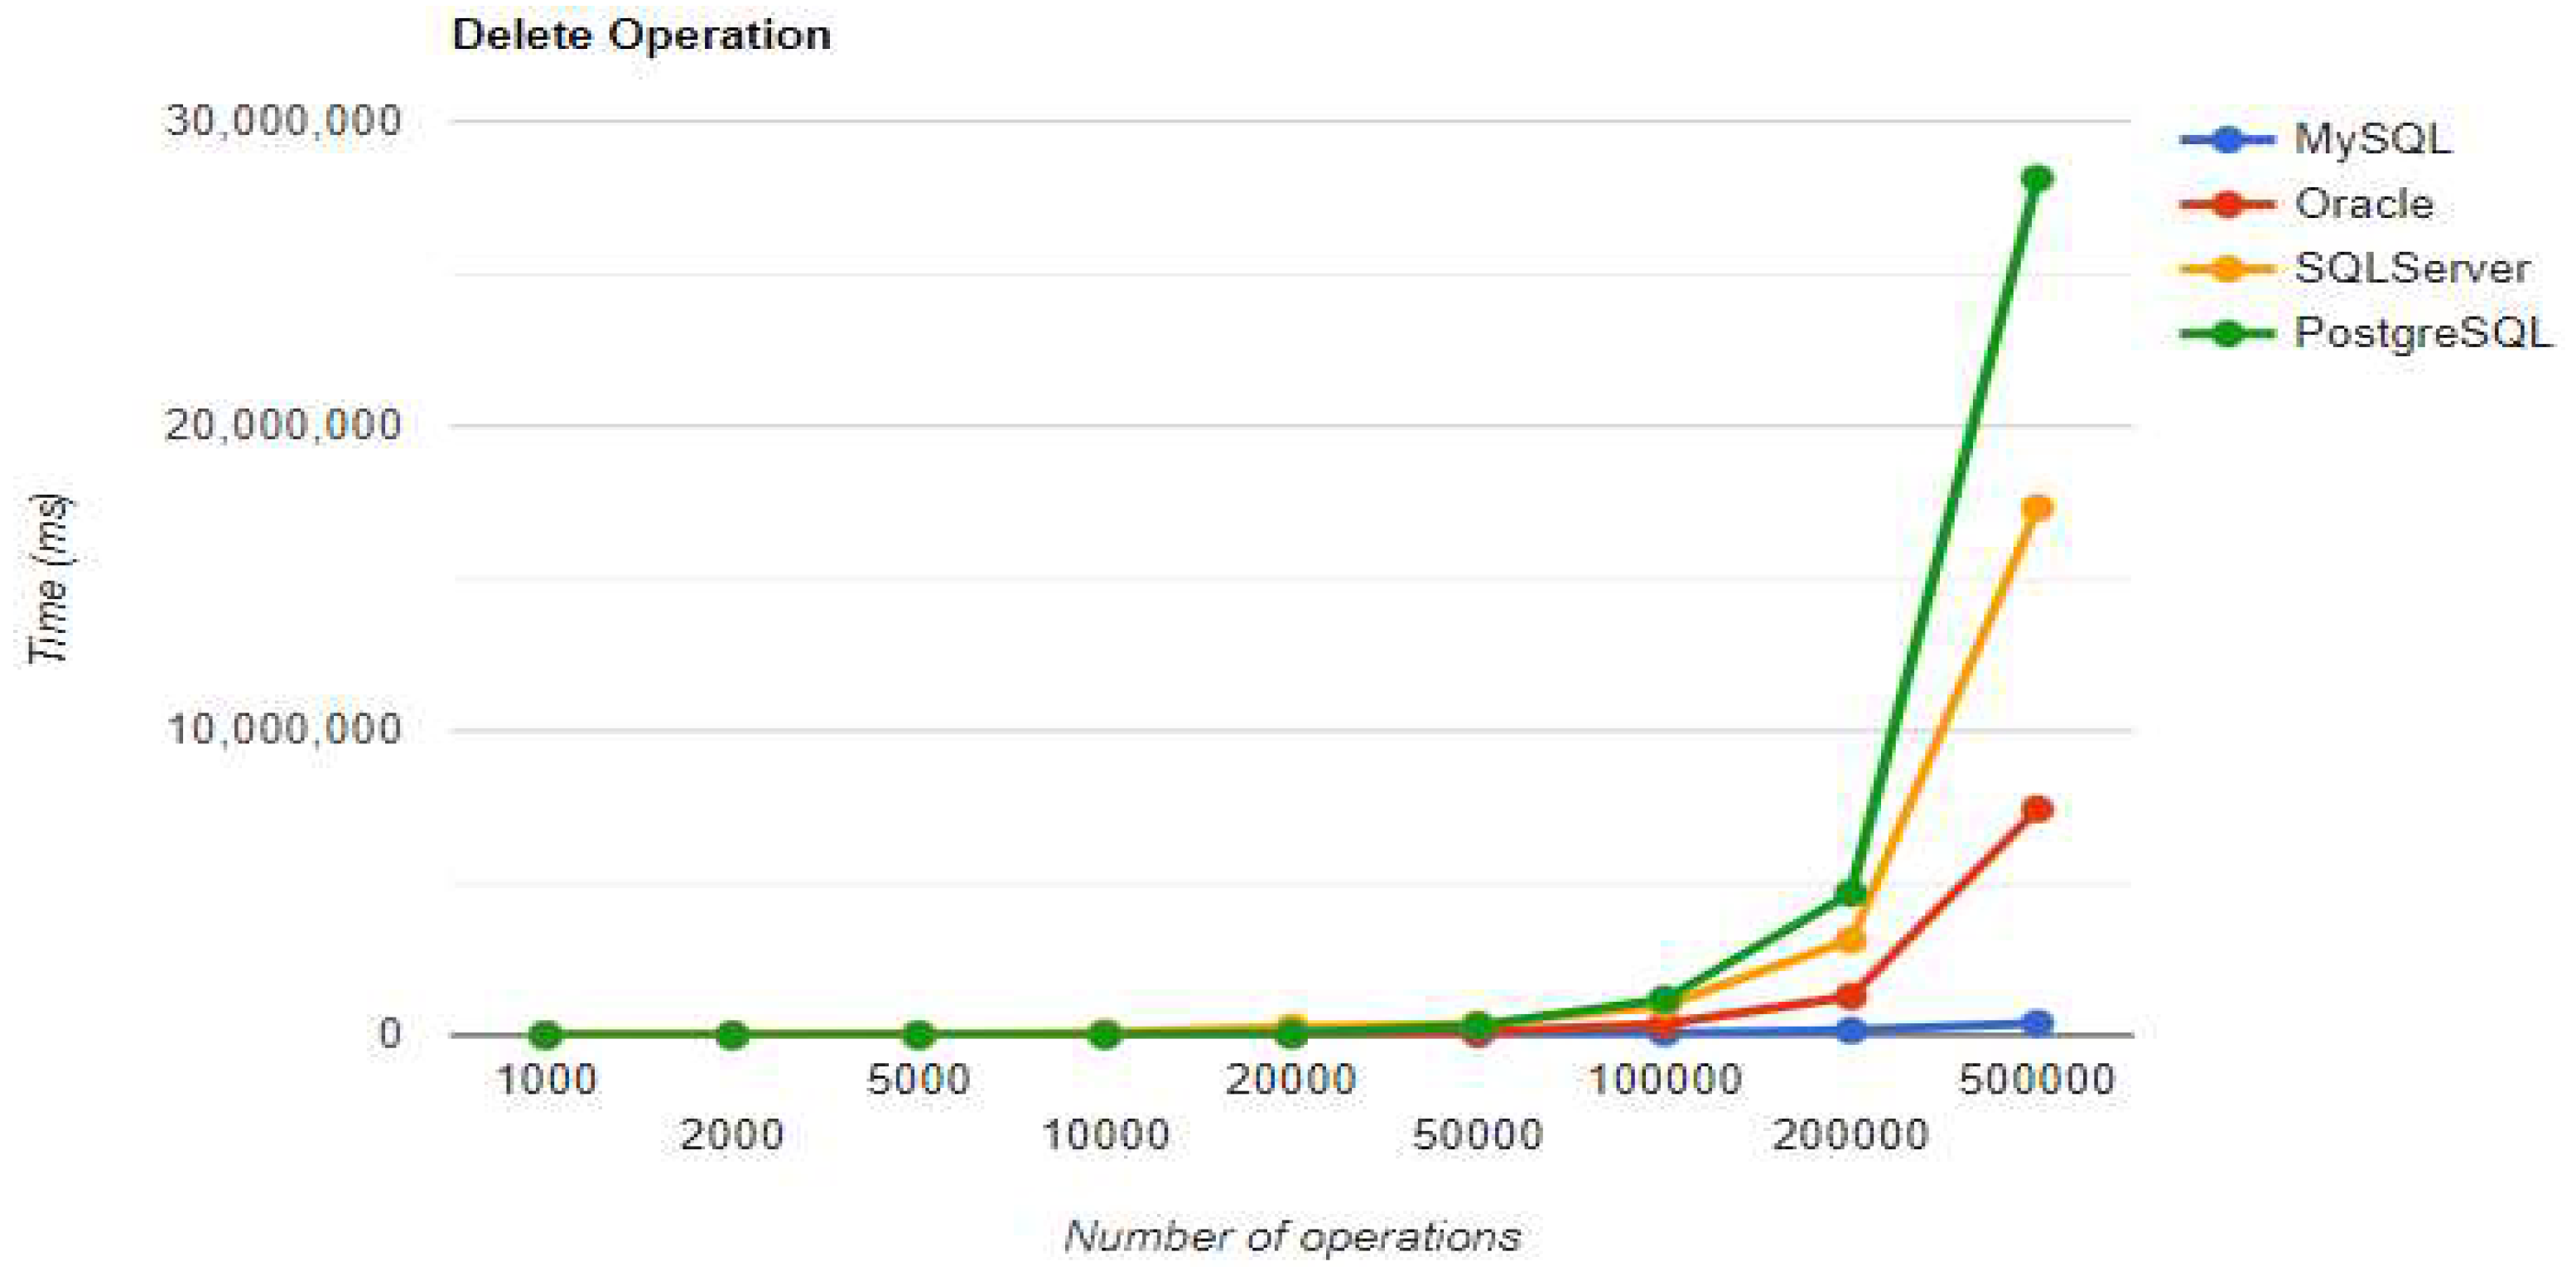
Figure 11.
Create execution times using Spring Data JPA without warm-up.
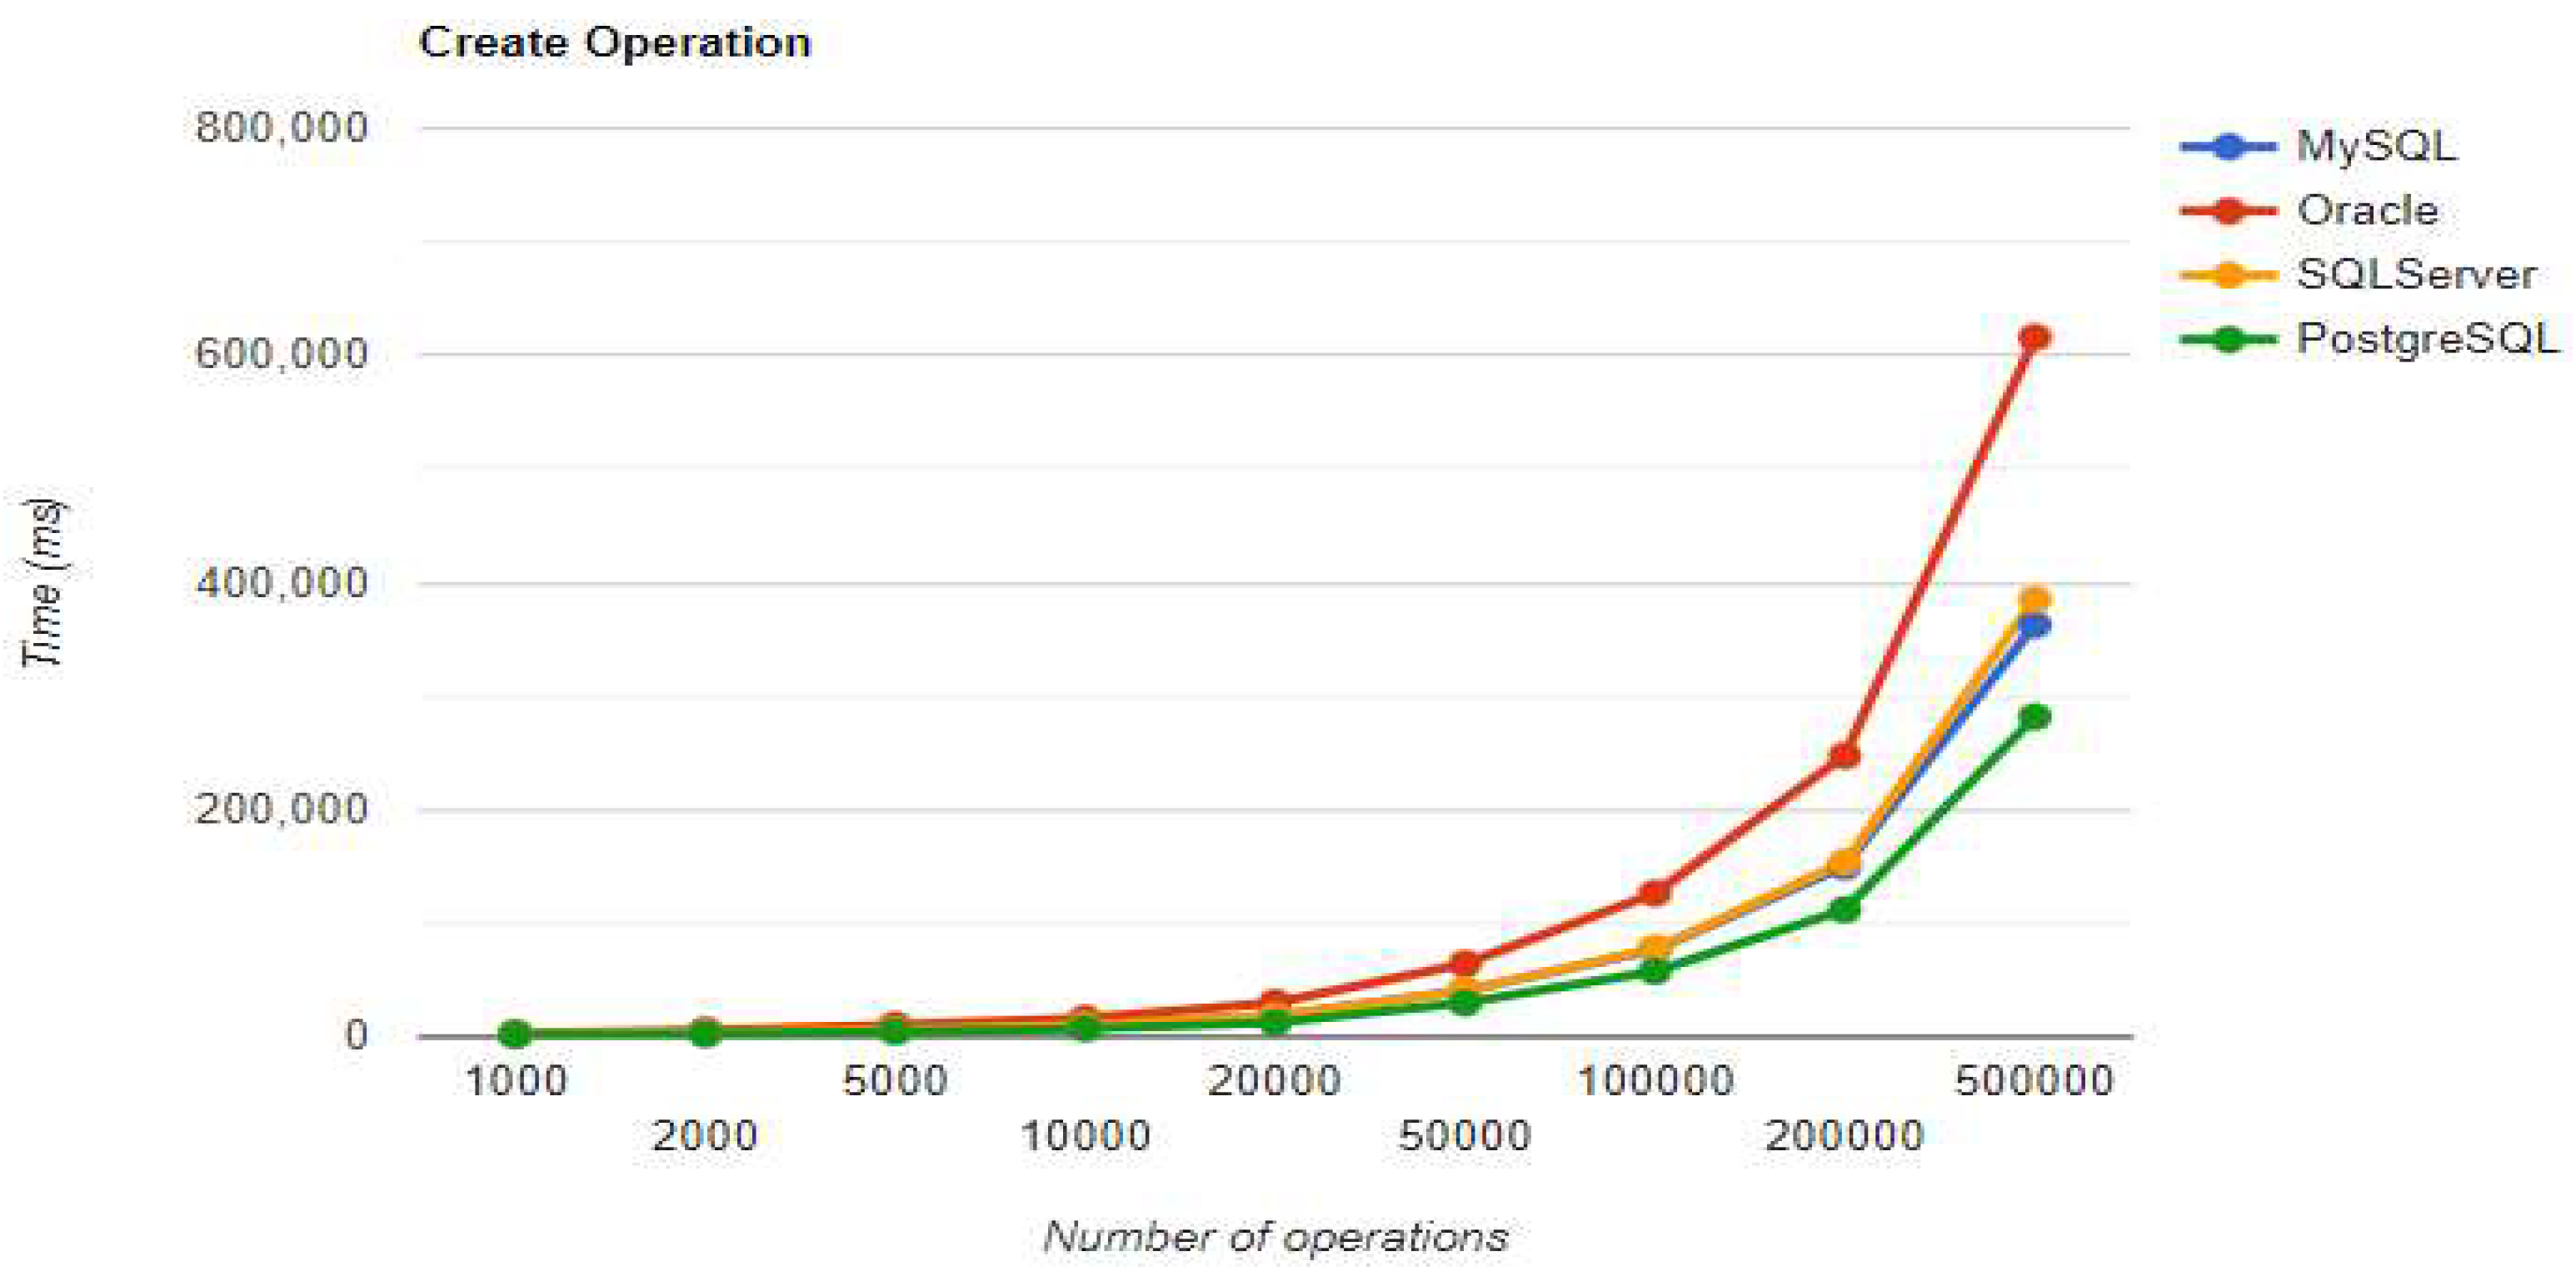
Figure 12.
Read execution times using Spring Data JPA without warm-up.
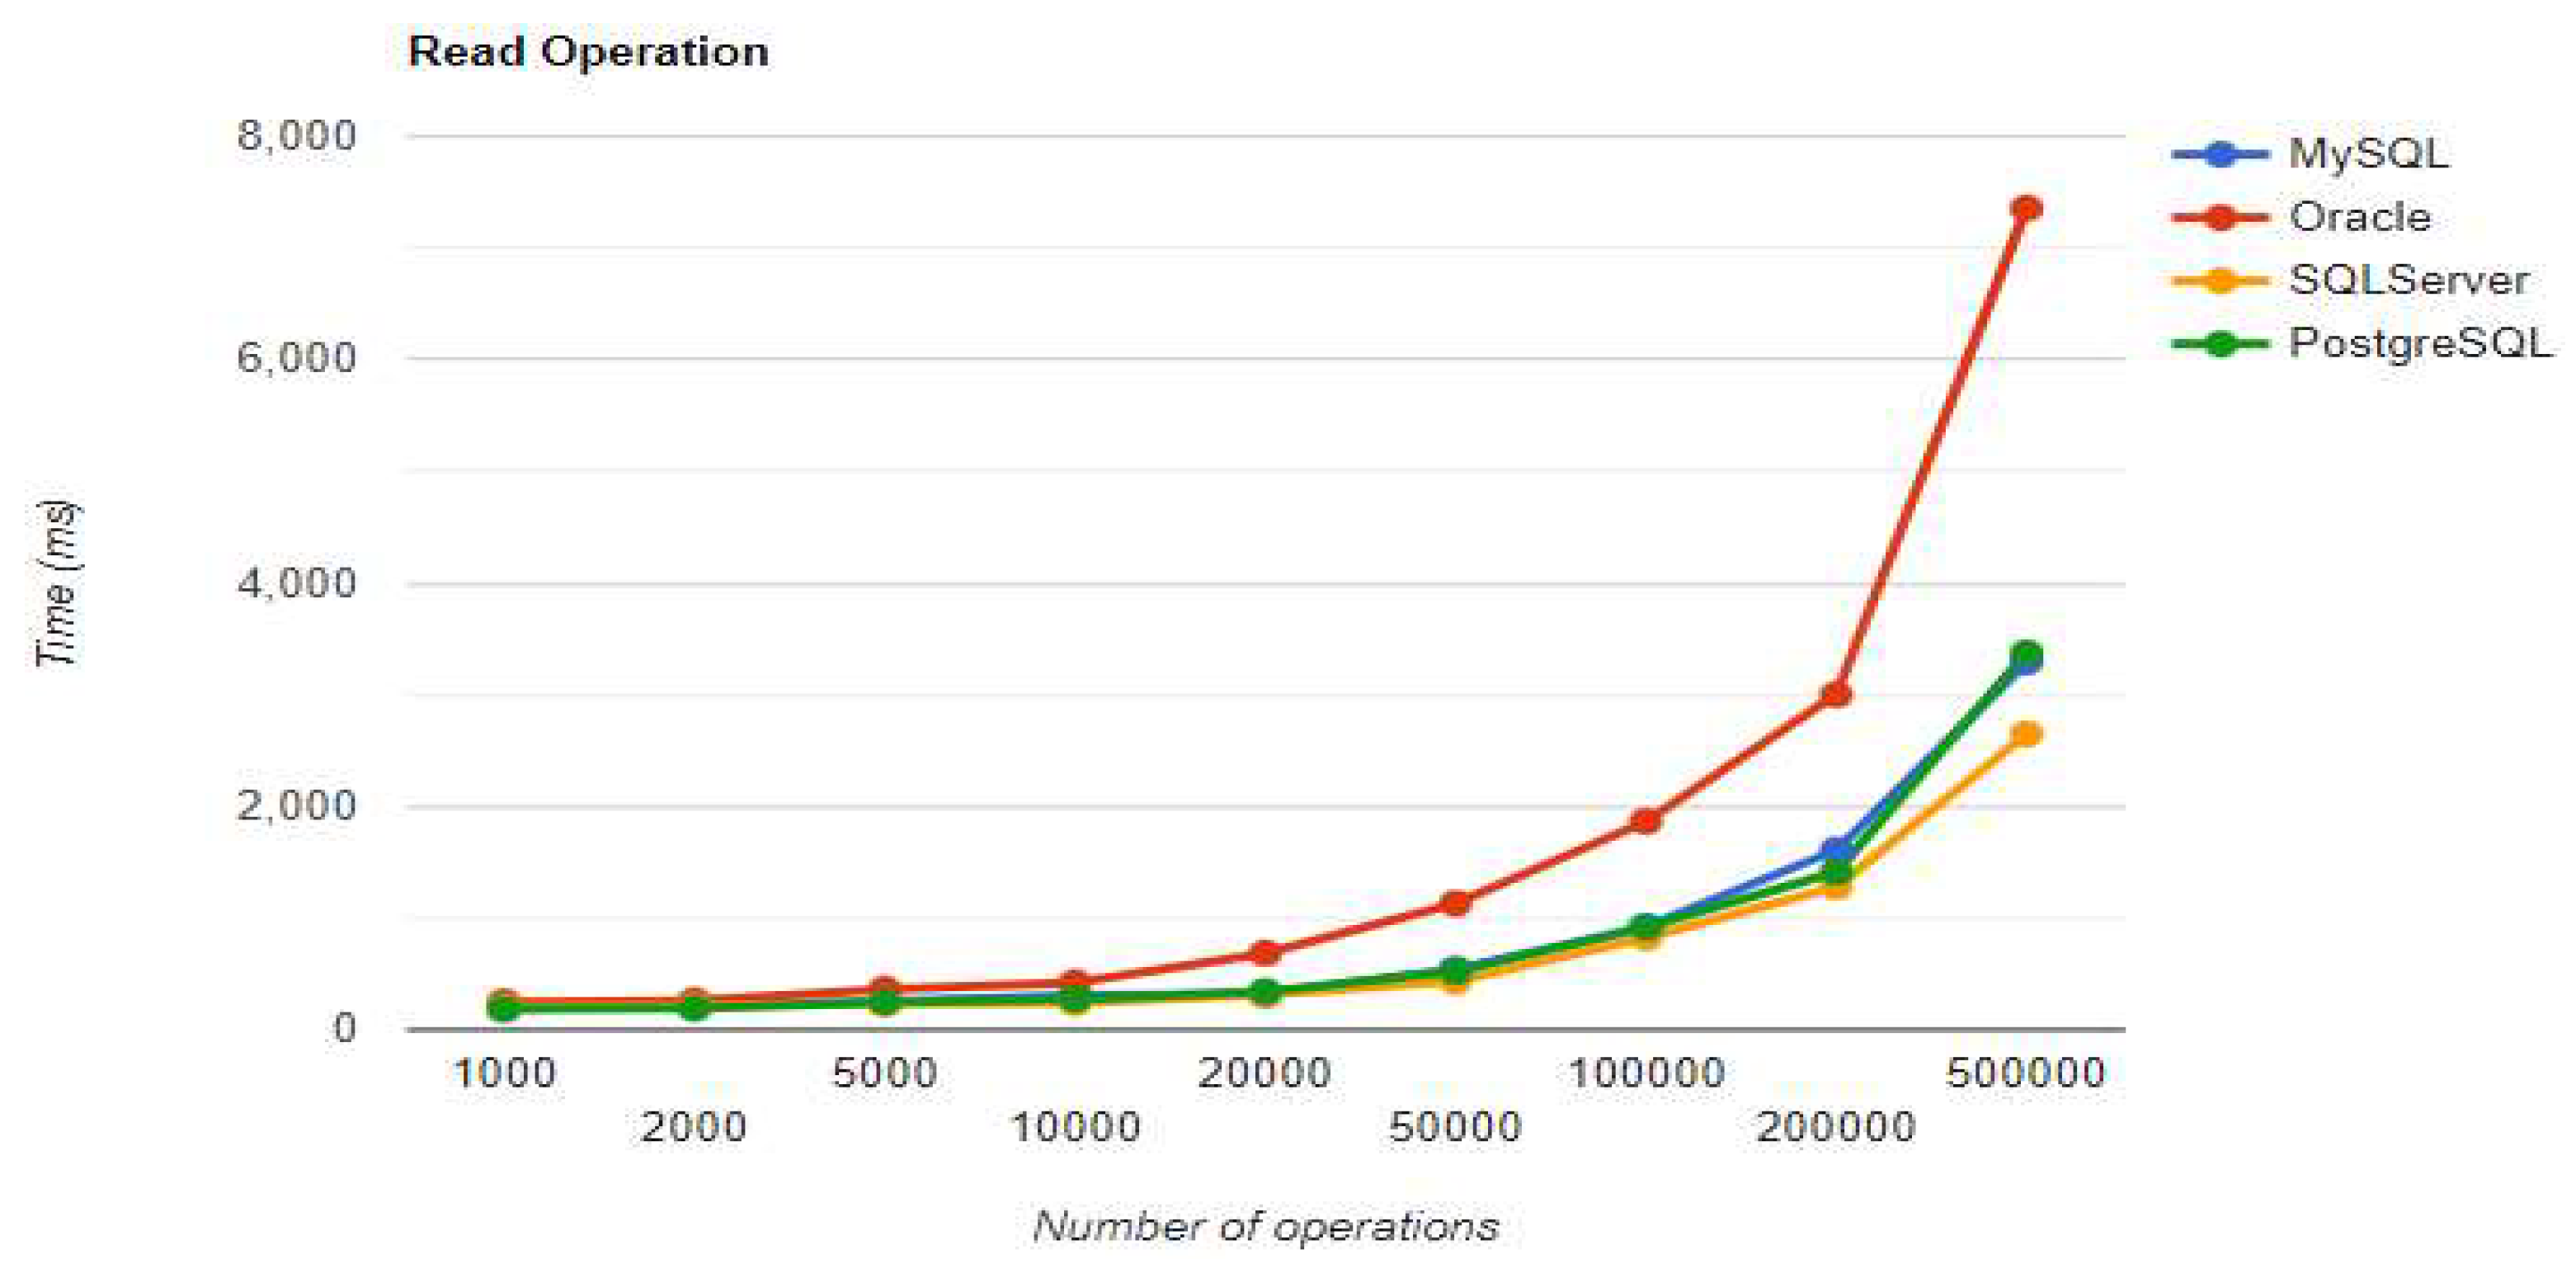
Figure 13.
Update execution times using Spring Data JPA without warm-up.
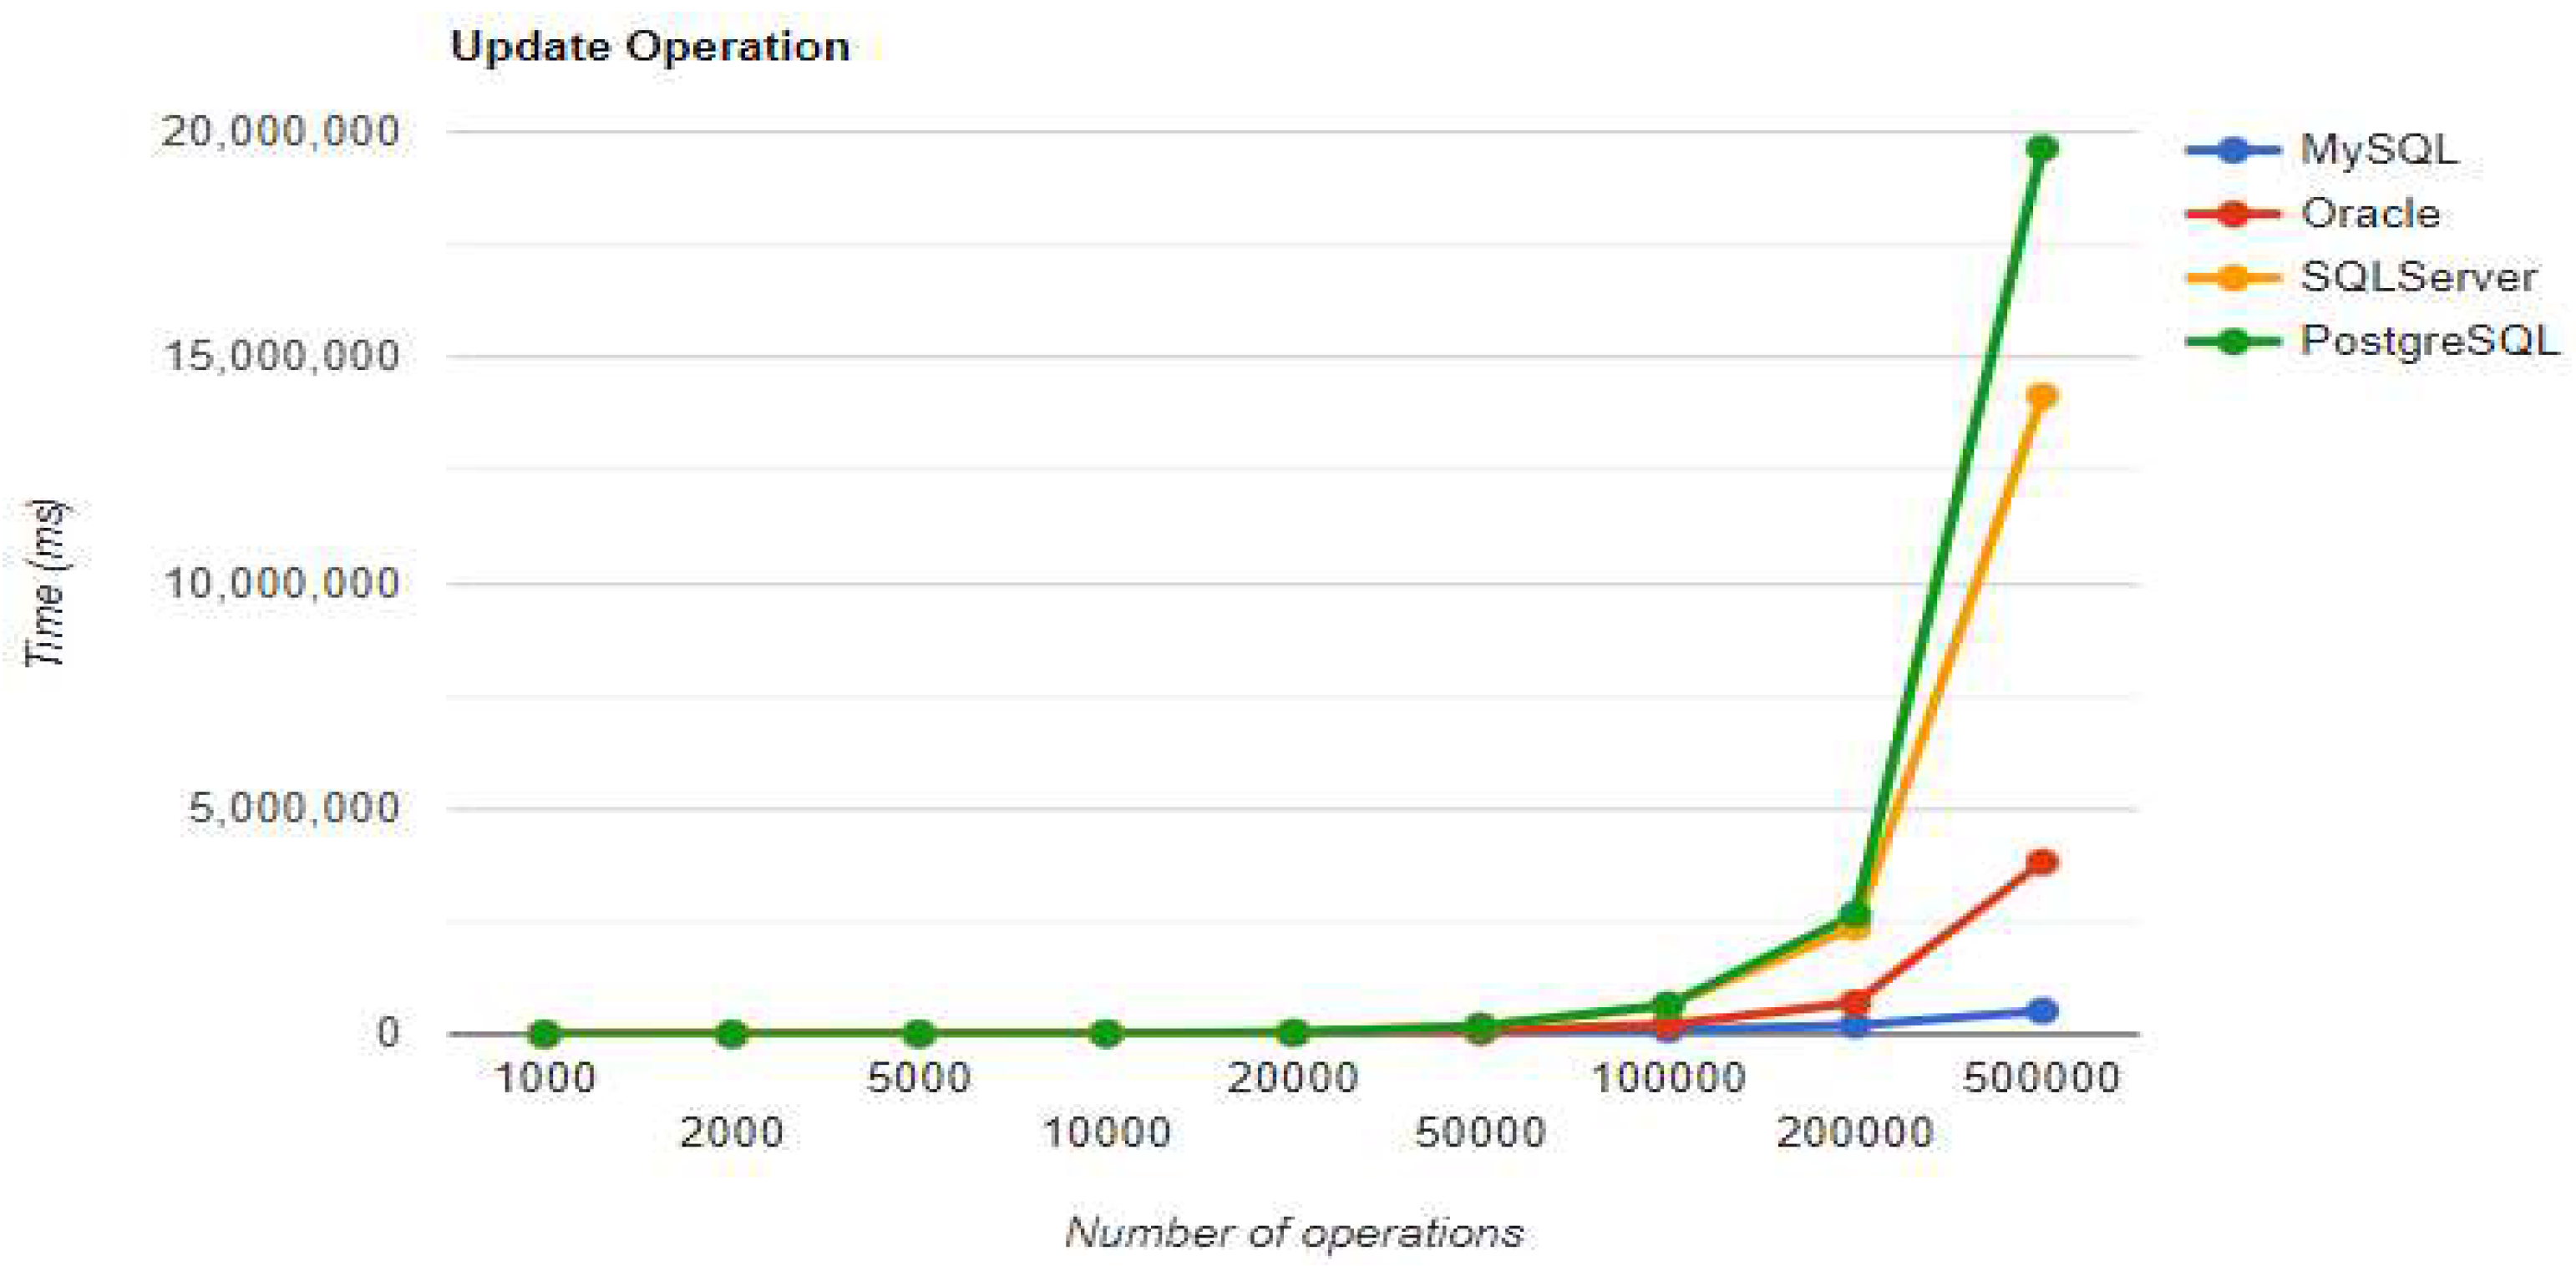
Figure 14.
Delete execution times using Spring Data JPA without warm-up.
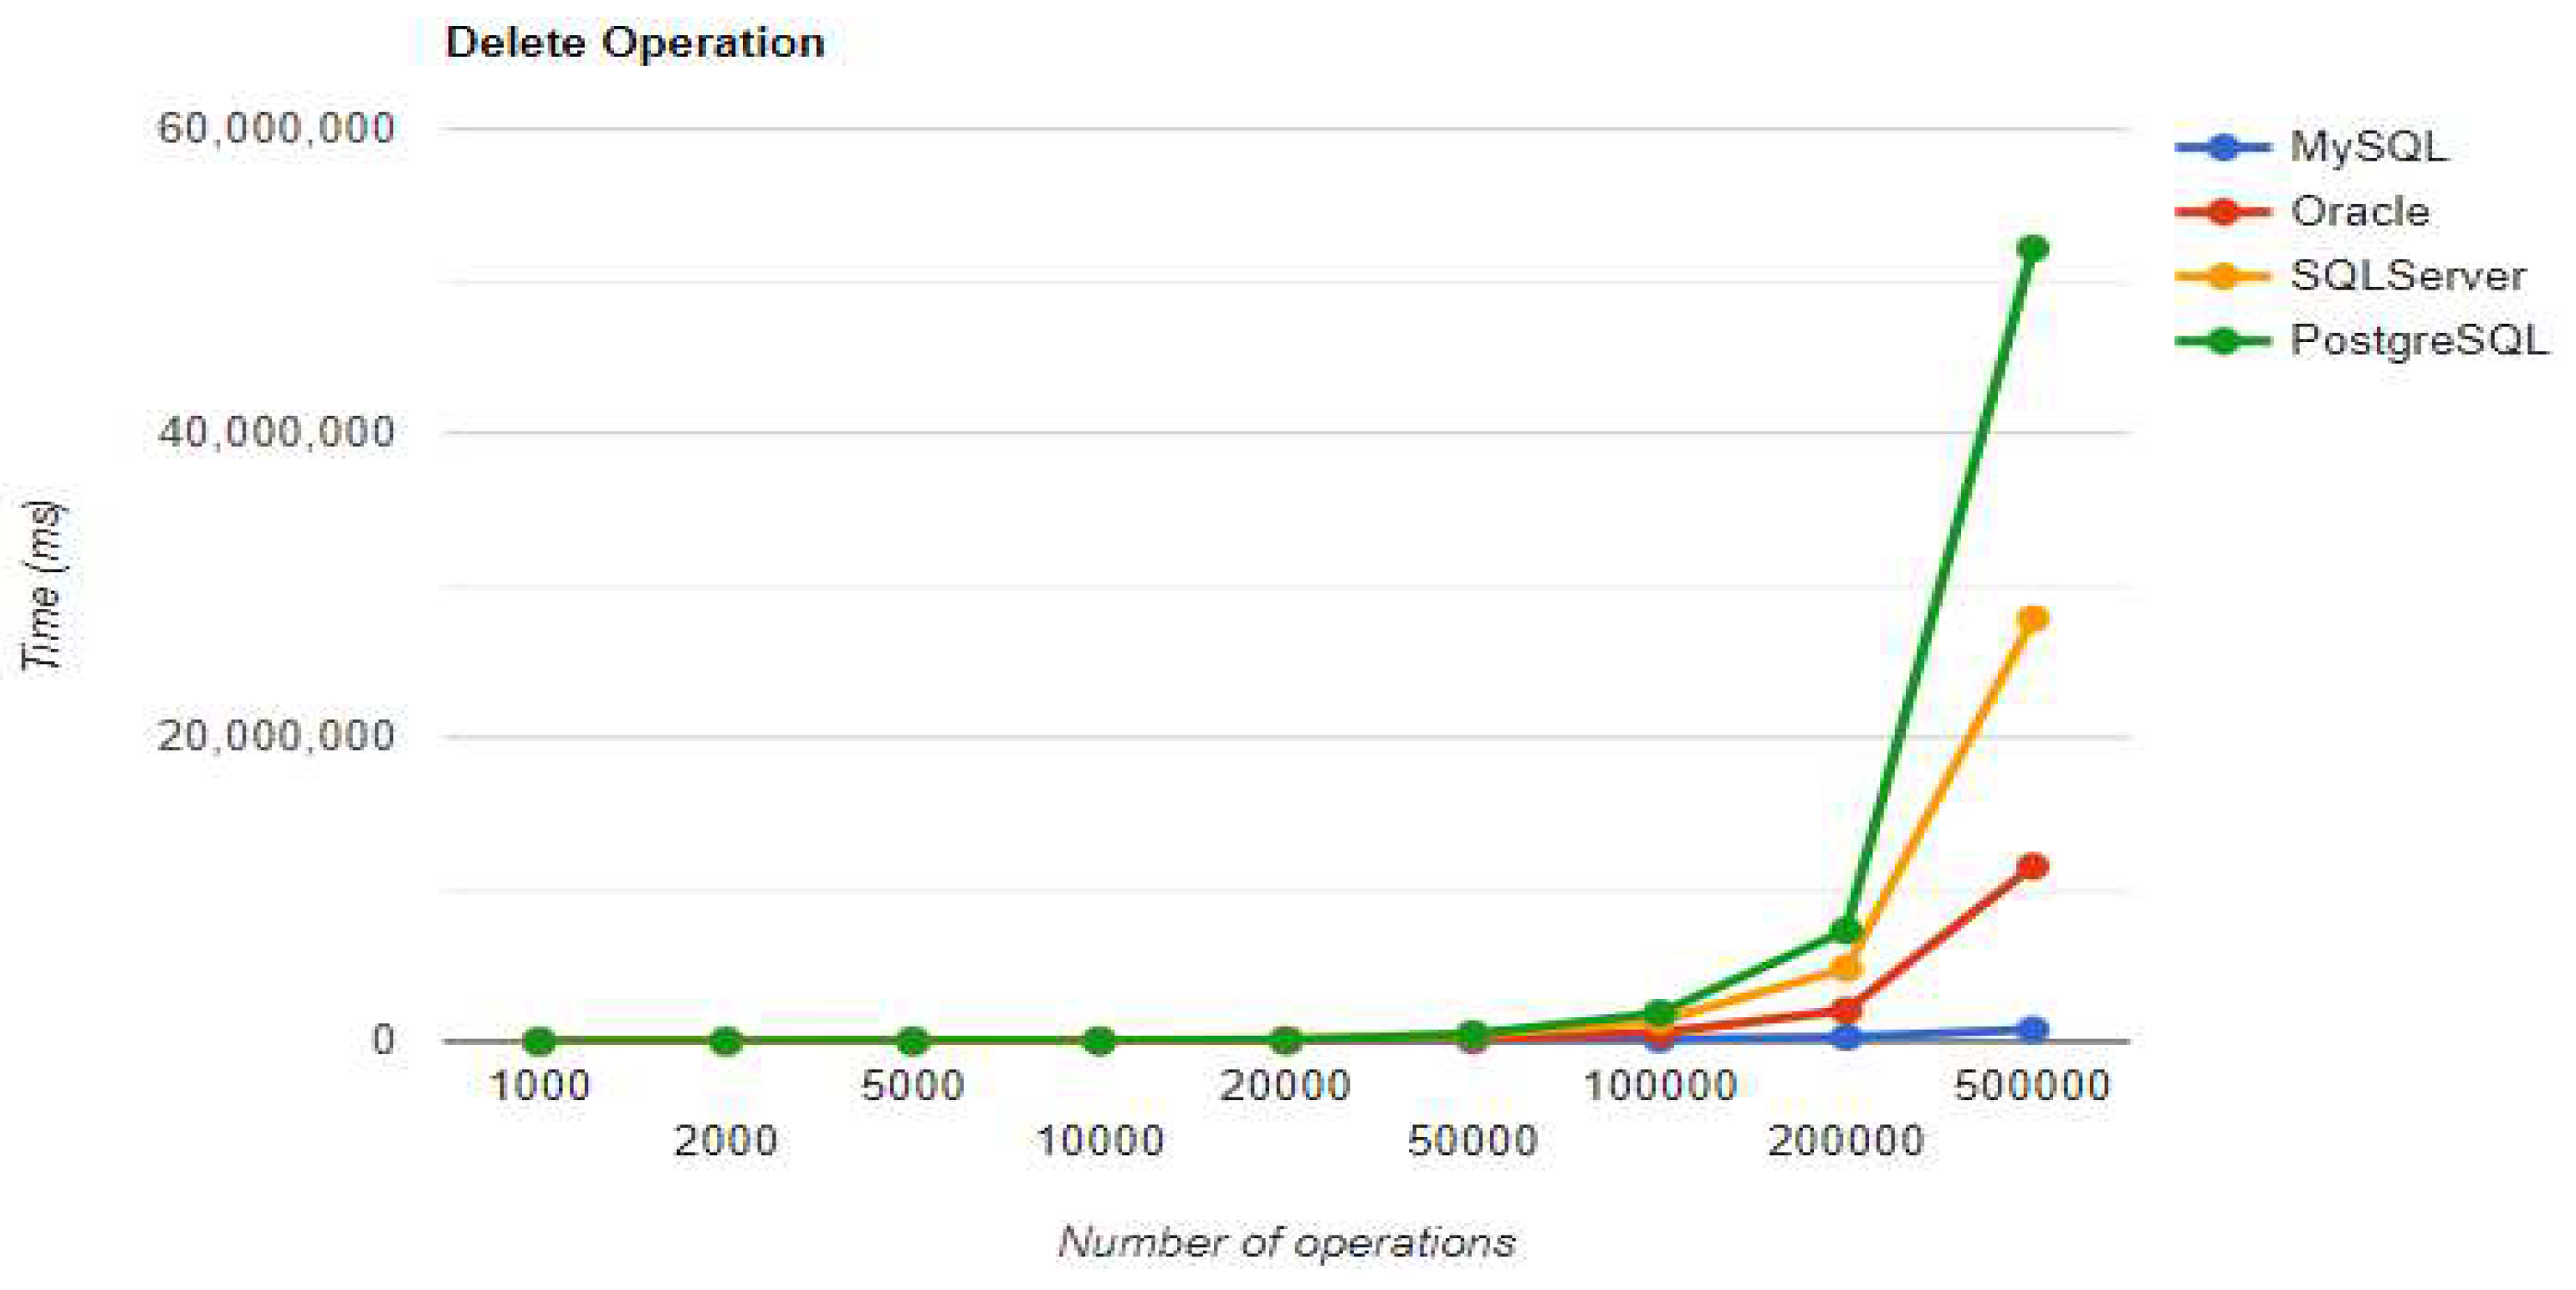
Figure 15.
Create warm-up iteration execution times using JPA.
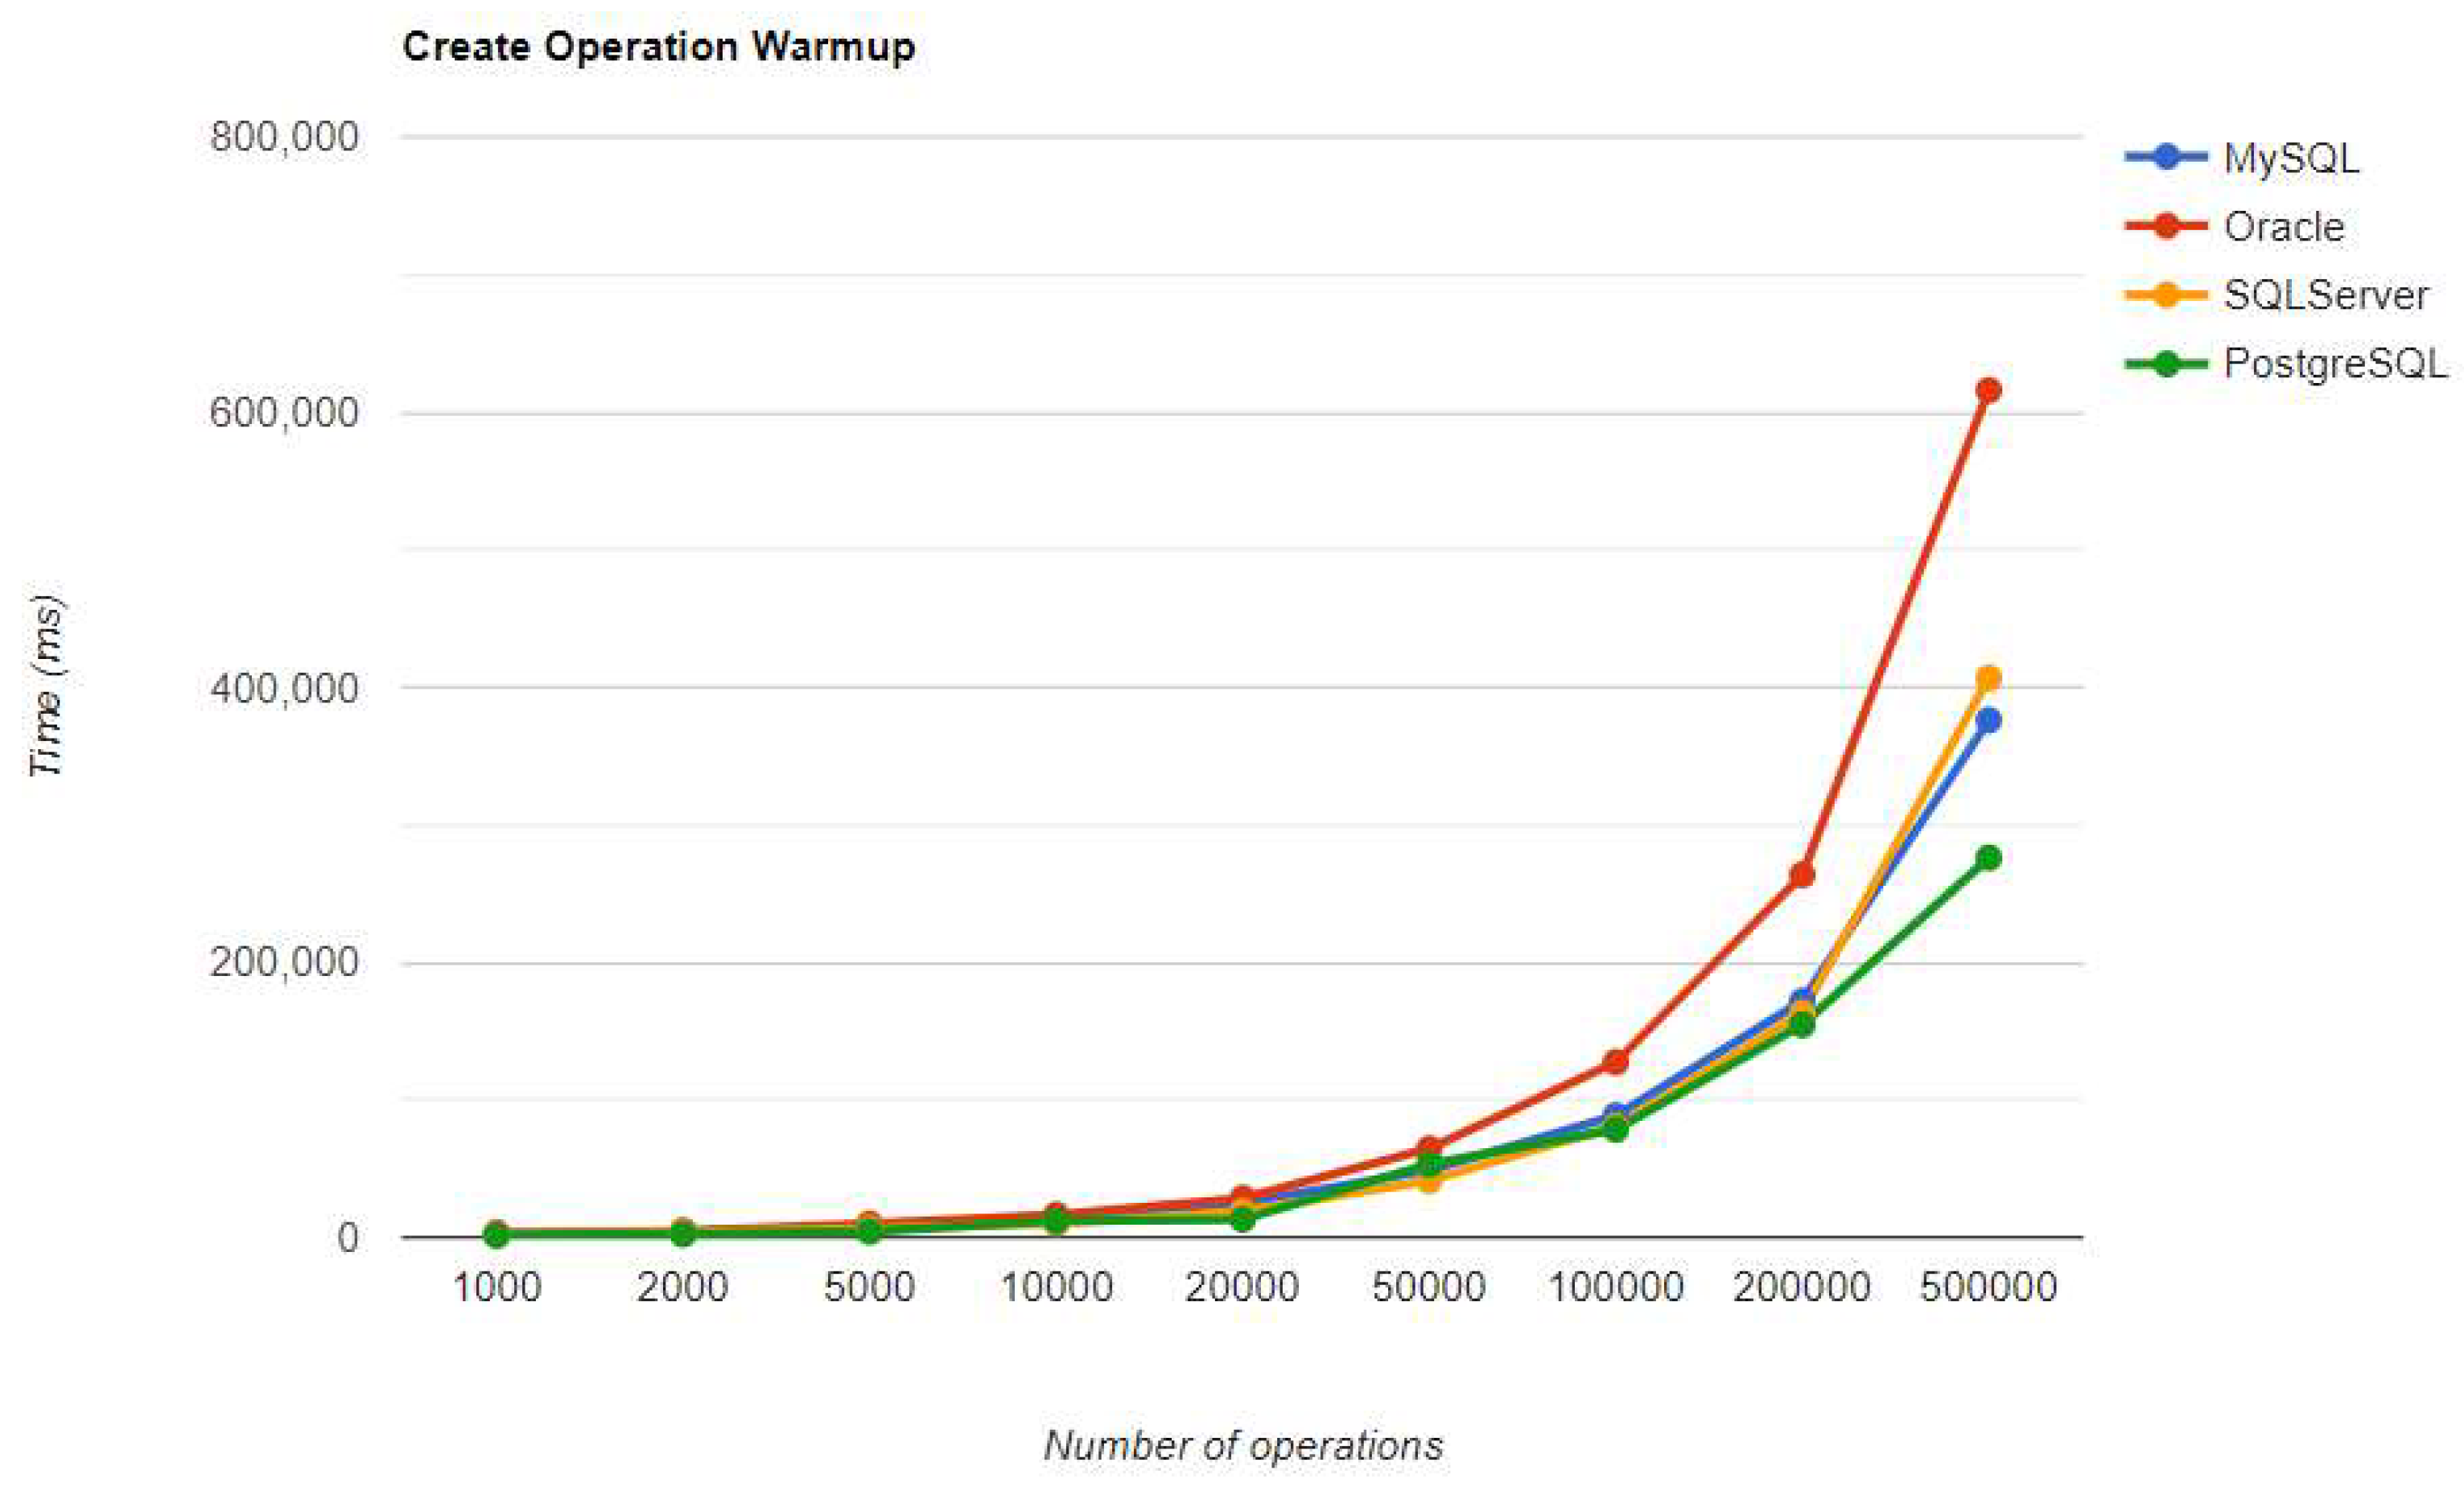
Figure 16.
Read warm-up iteration execution times using JPA.
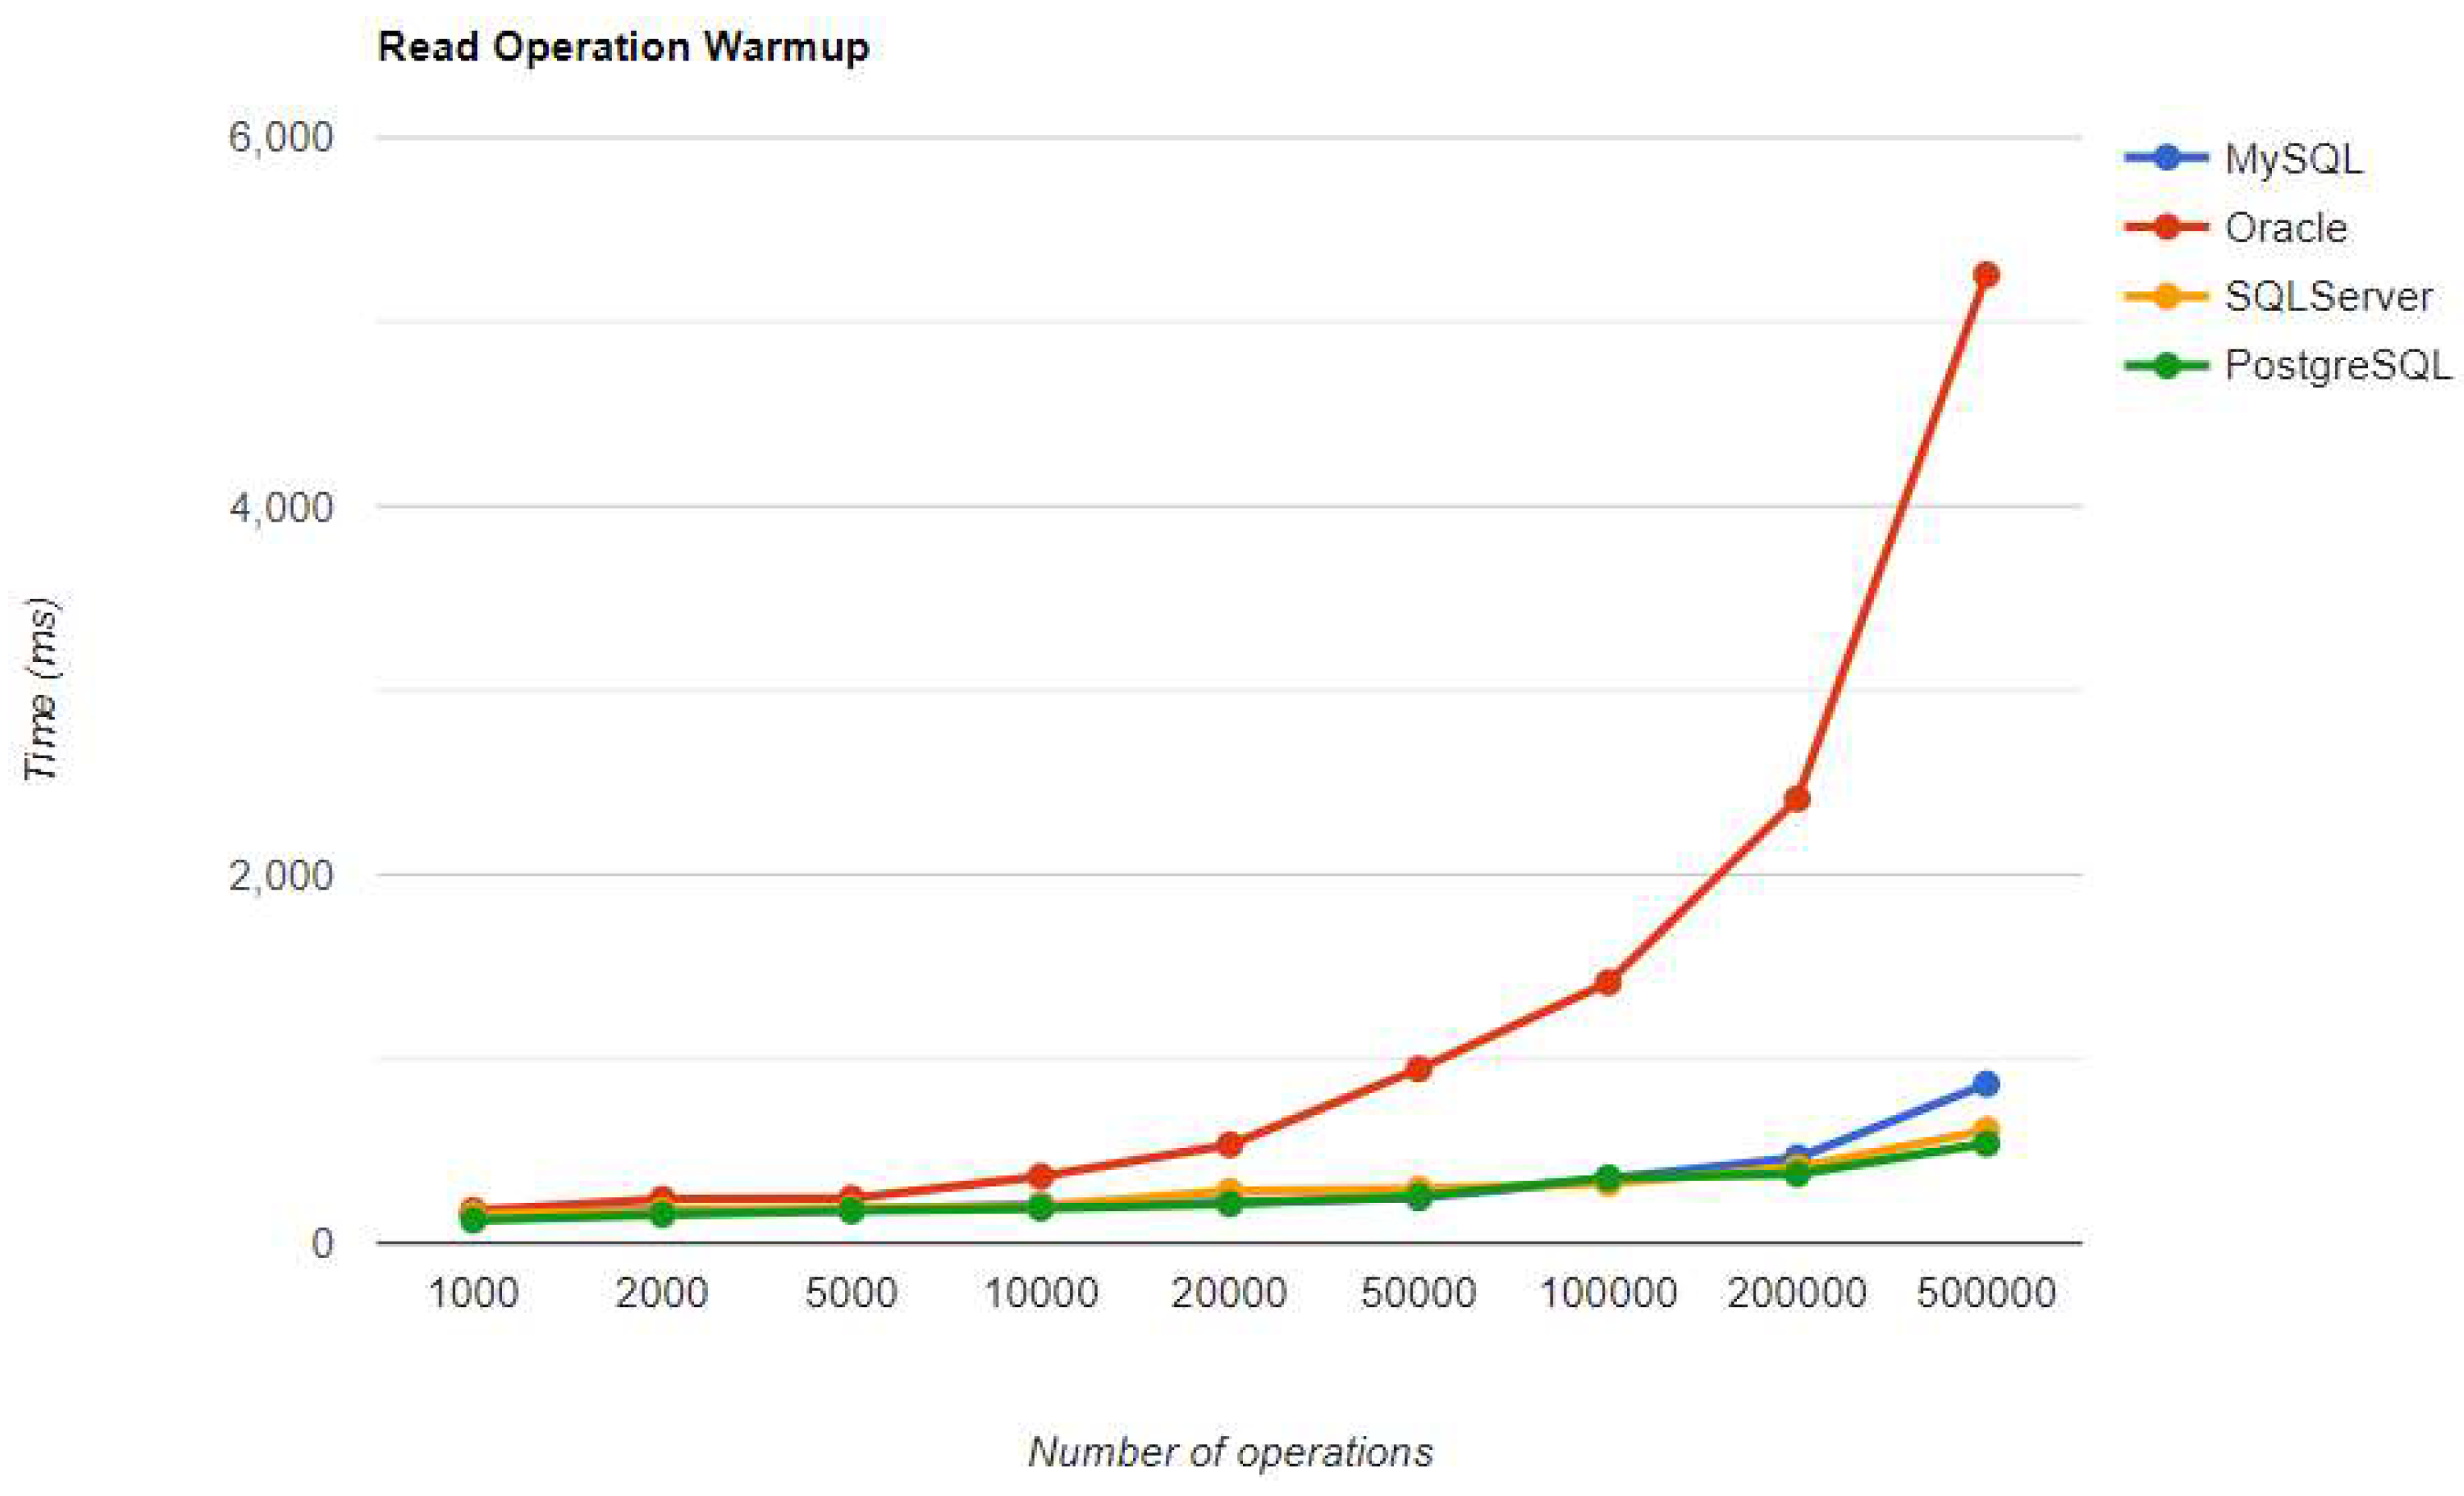
Figure 17.
Update warm-up iteration execution times using JPA.
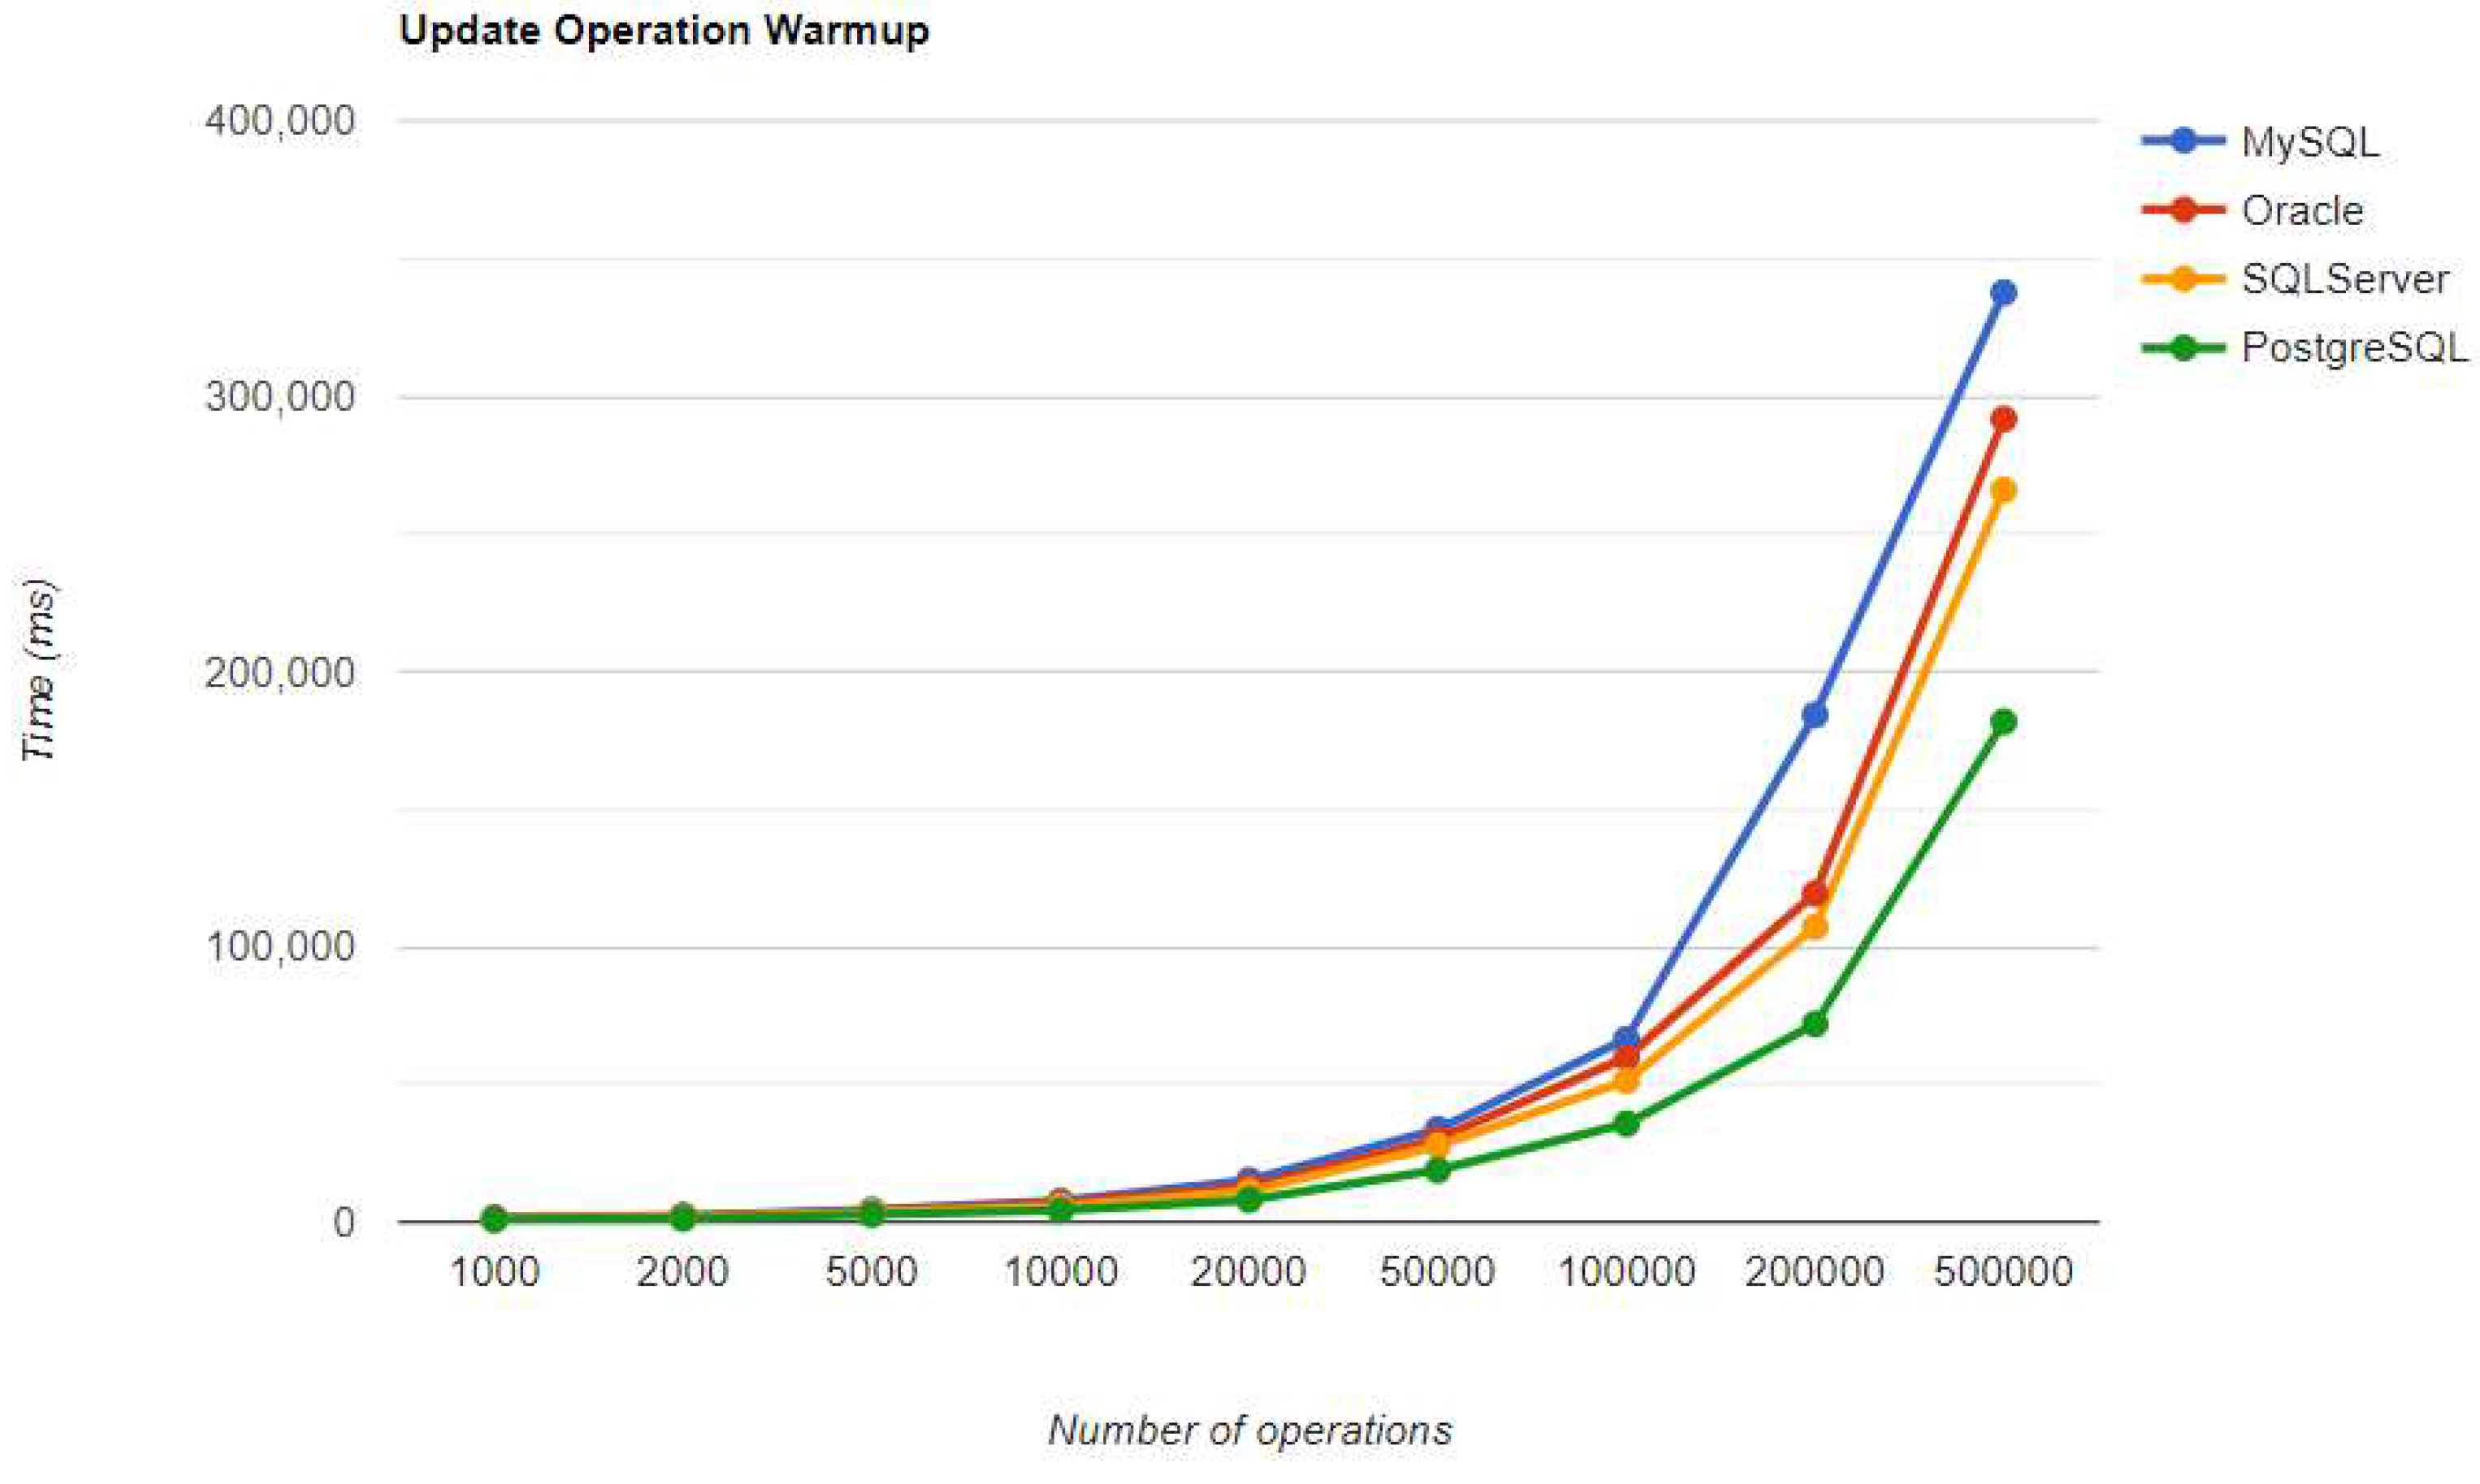
Figure 18.
Delete warm-up iteration execution times using JPA.
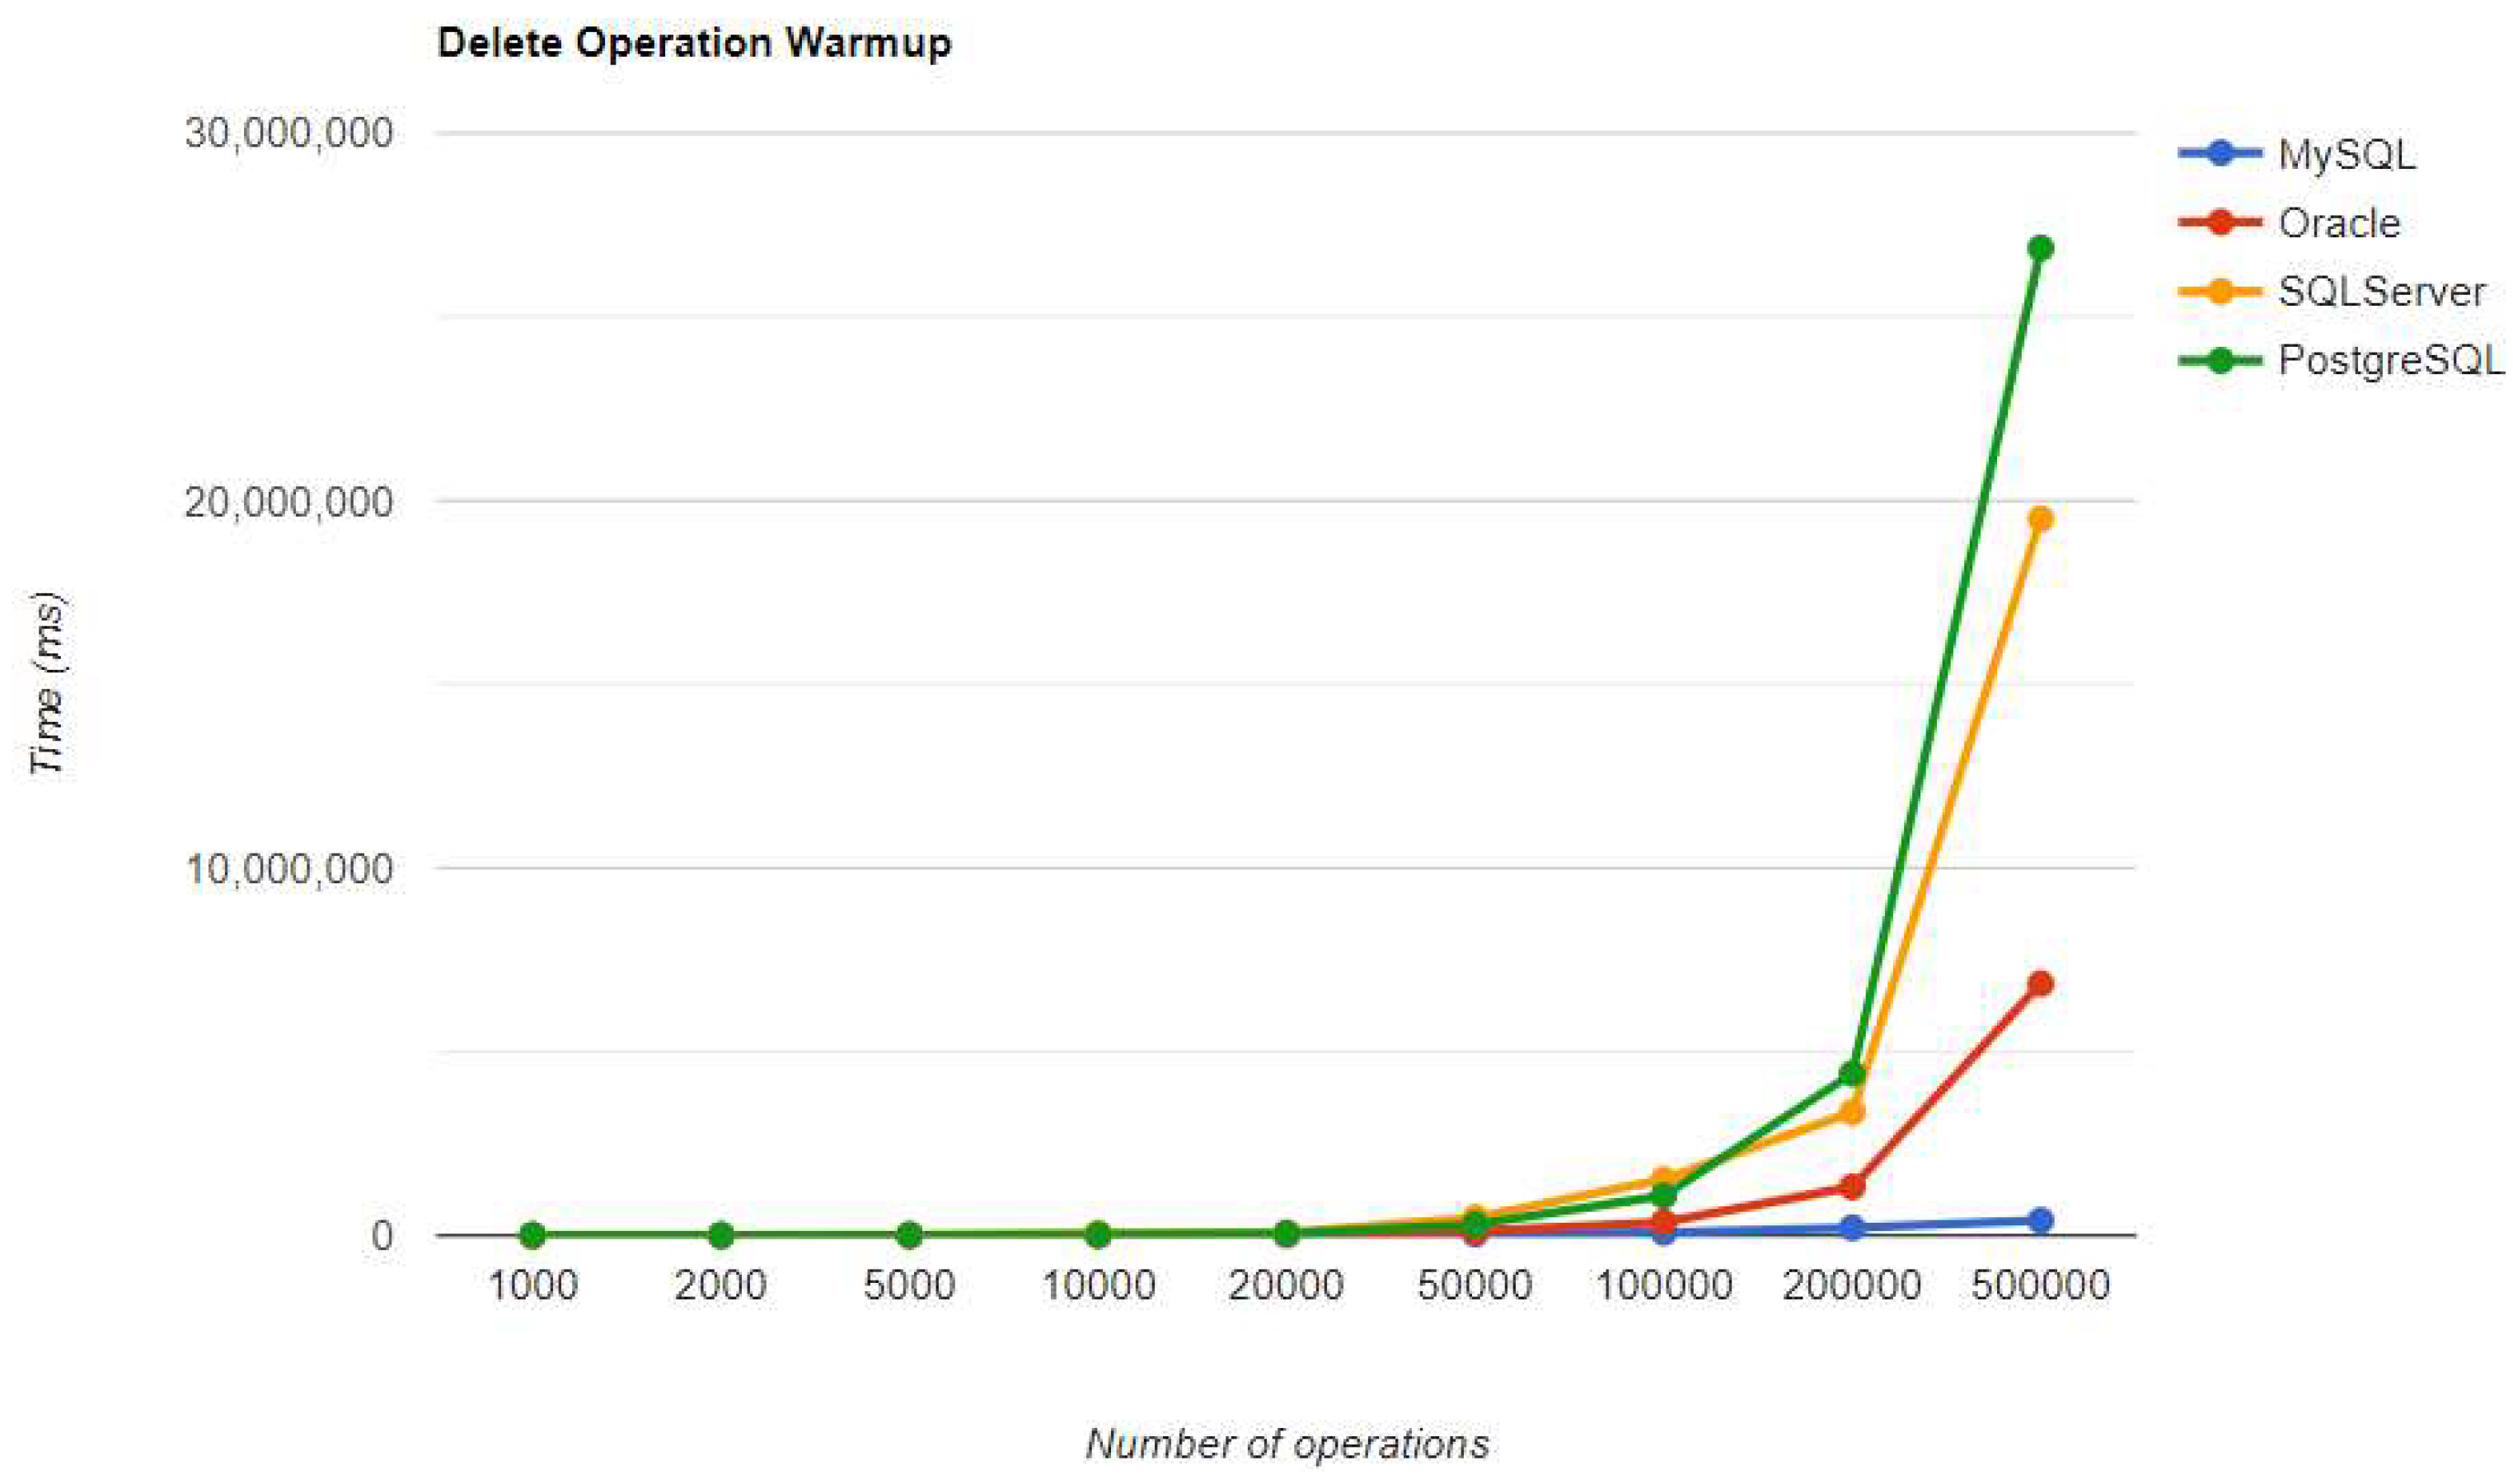
Figure 19.
Create warm-up iteration execution times using Hibernate
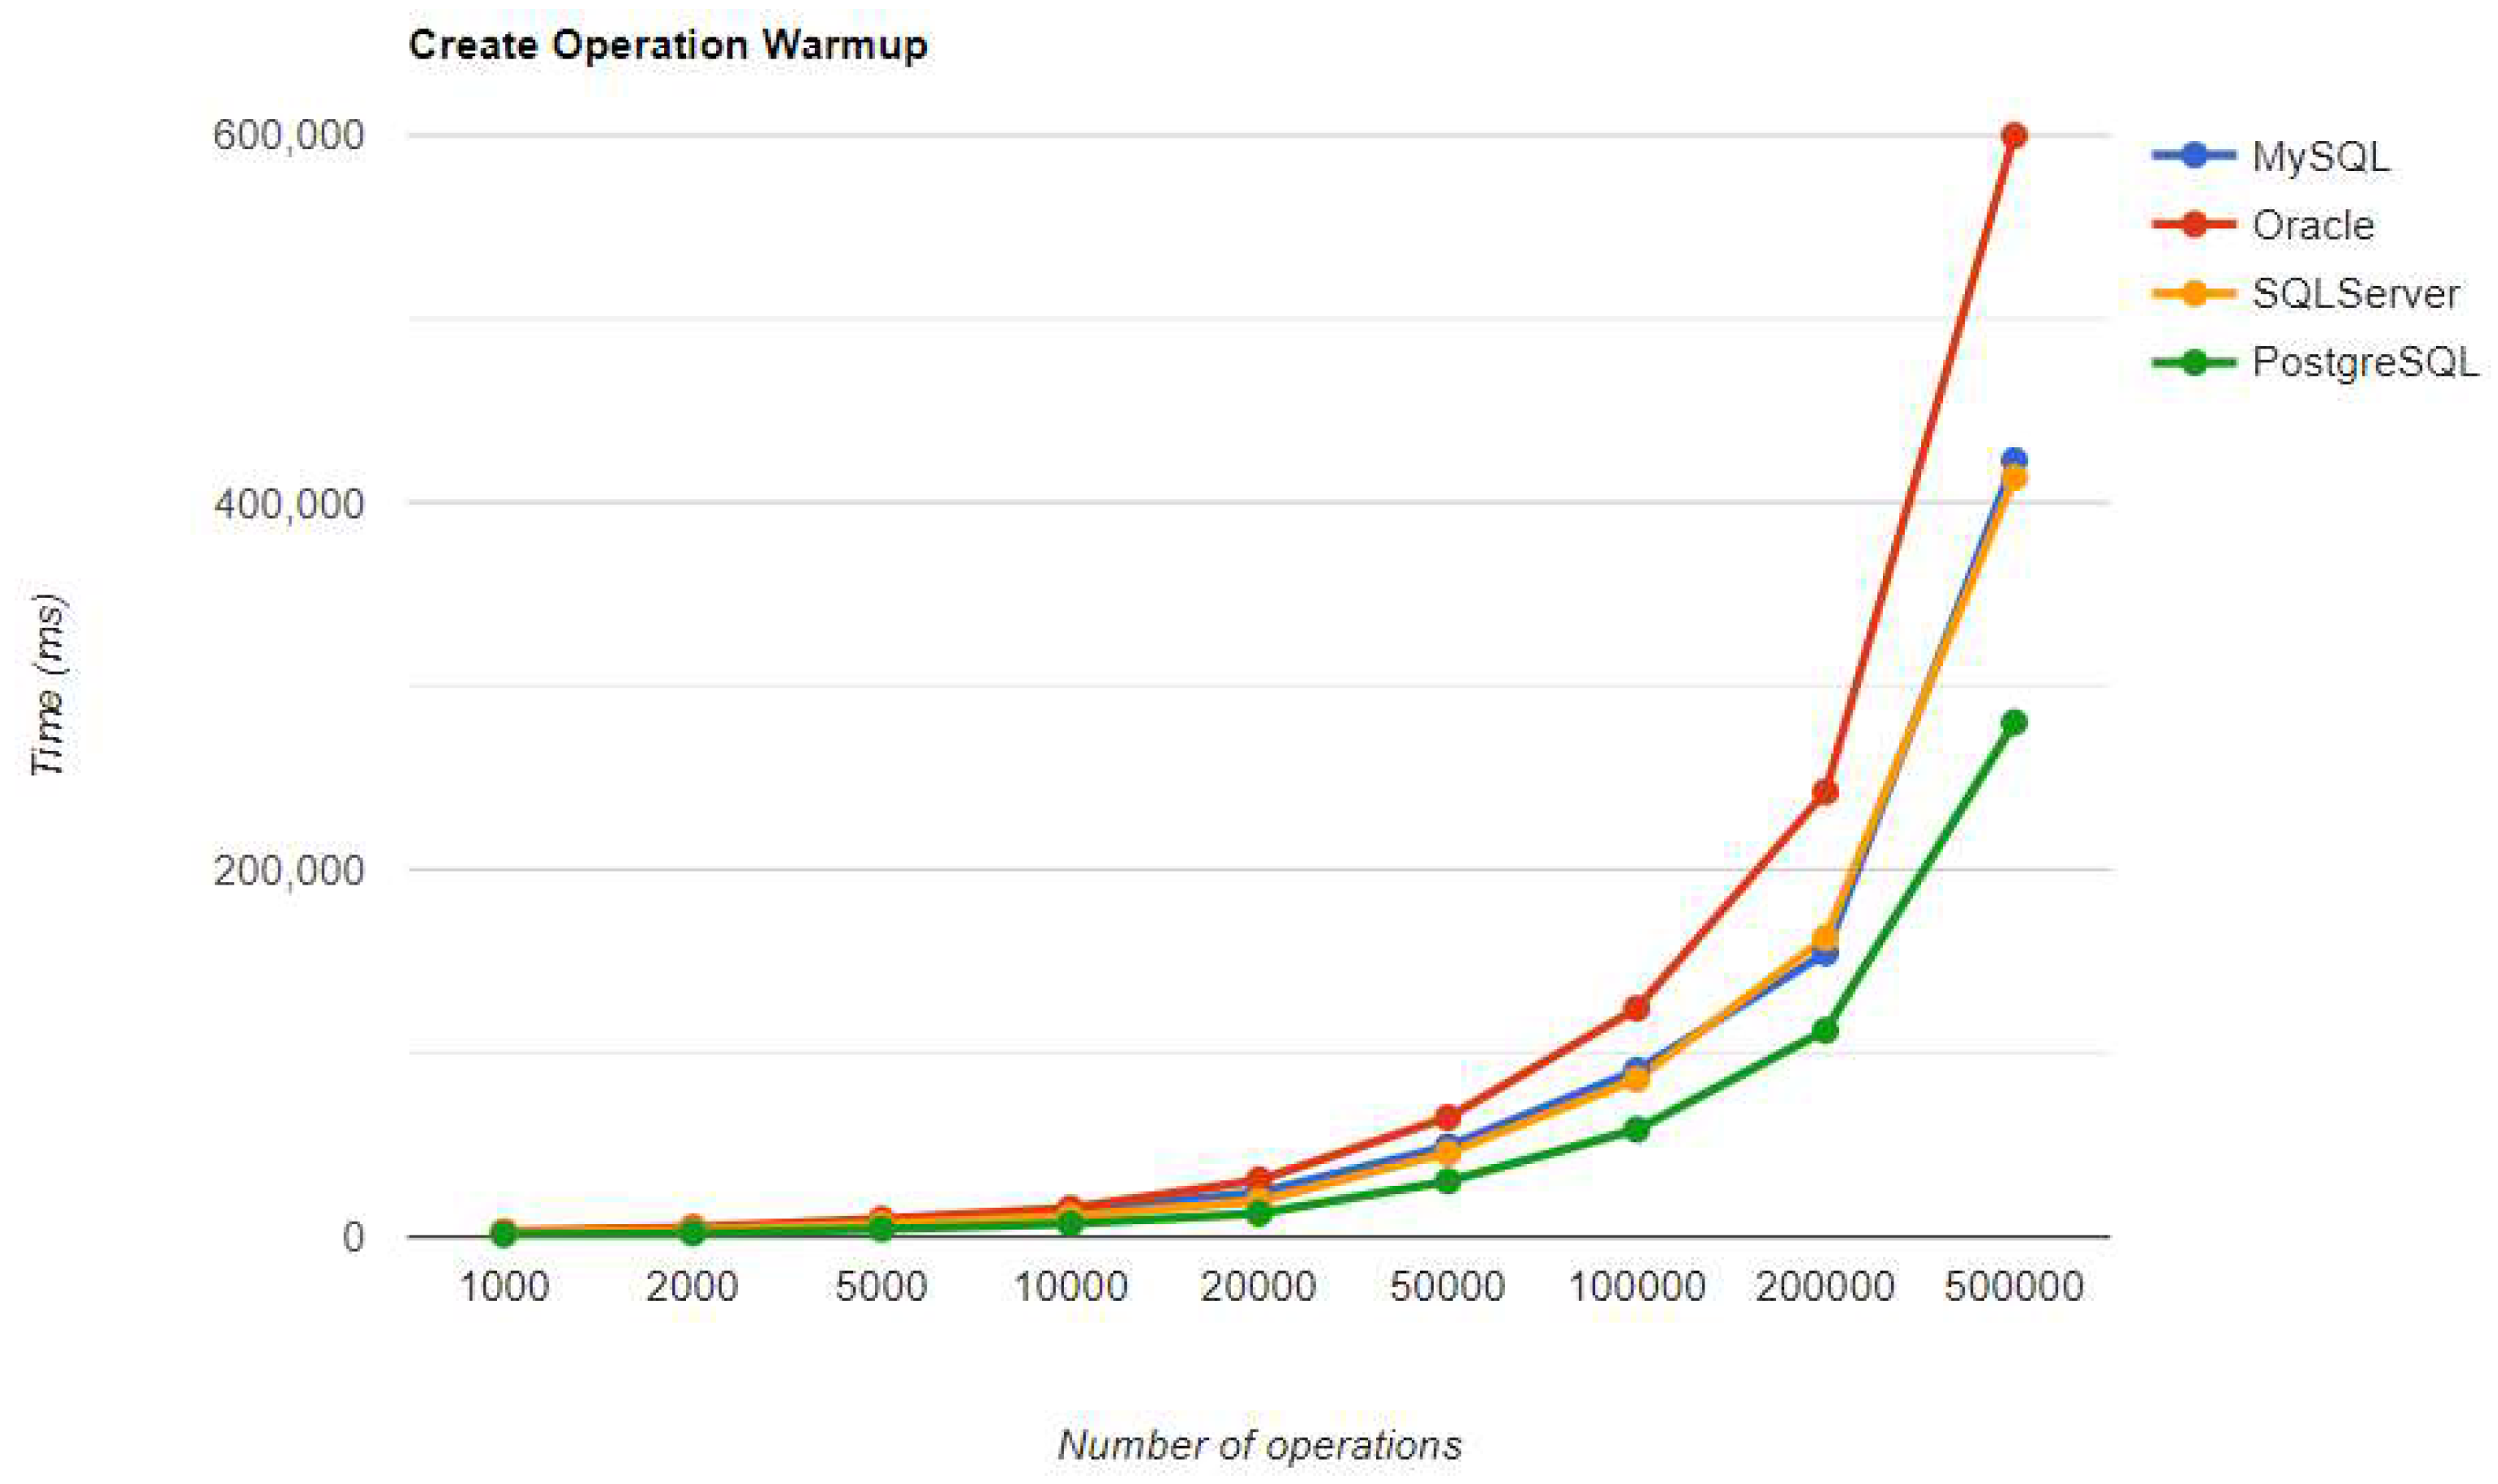
Figure 20.
Read warm-up iteration execution times using Hibernate.
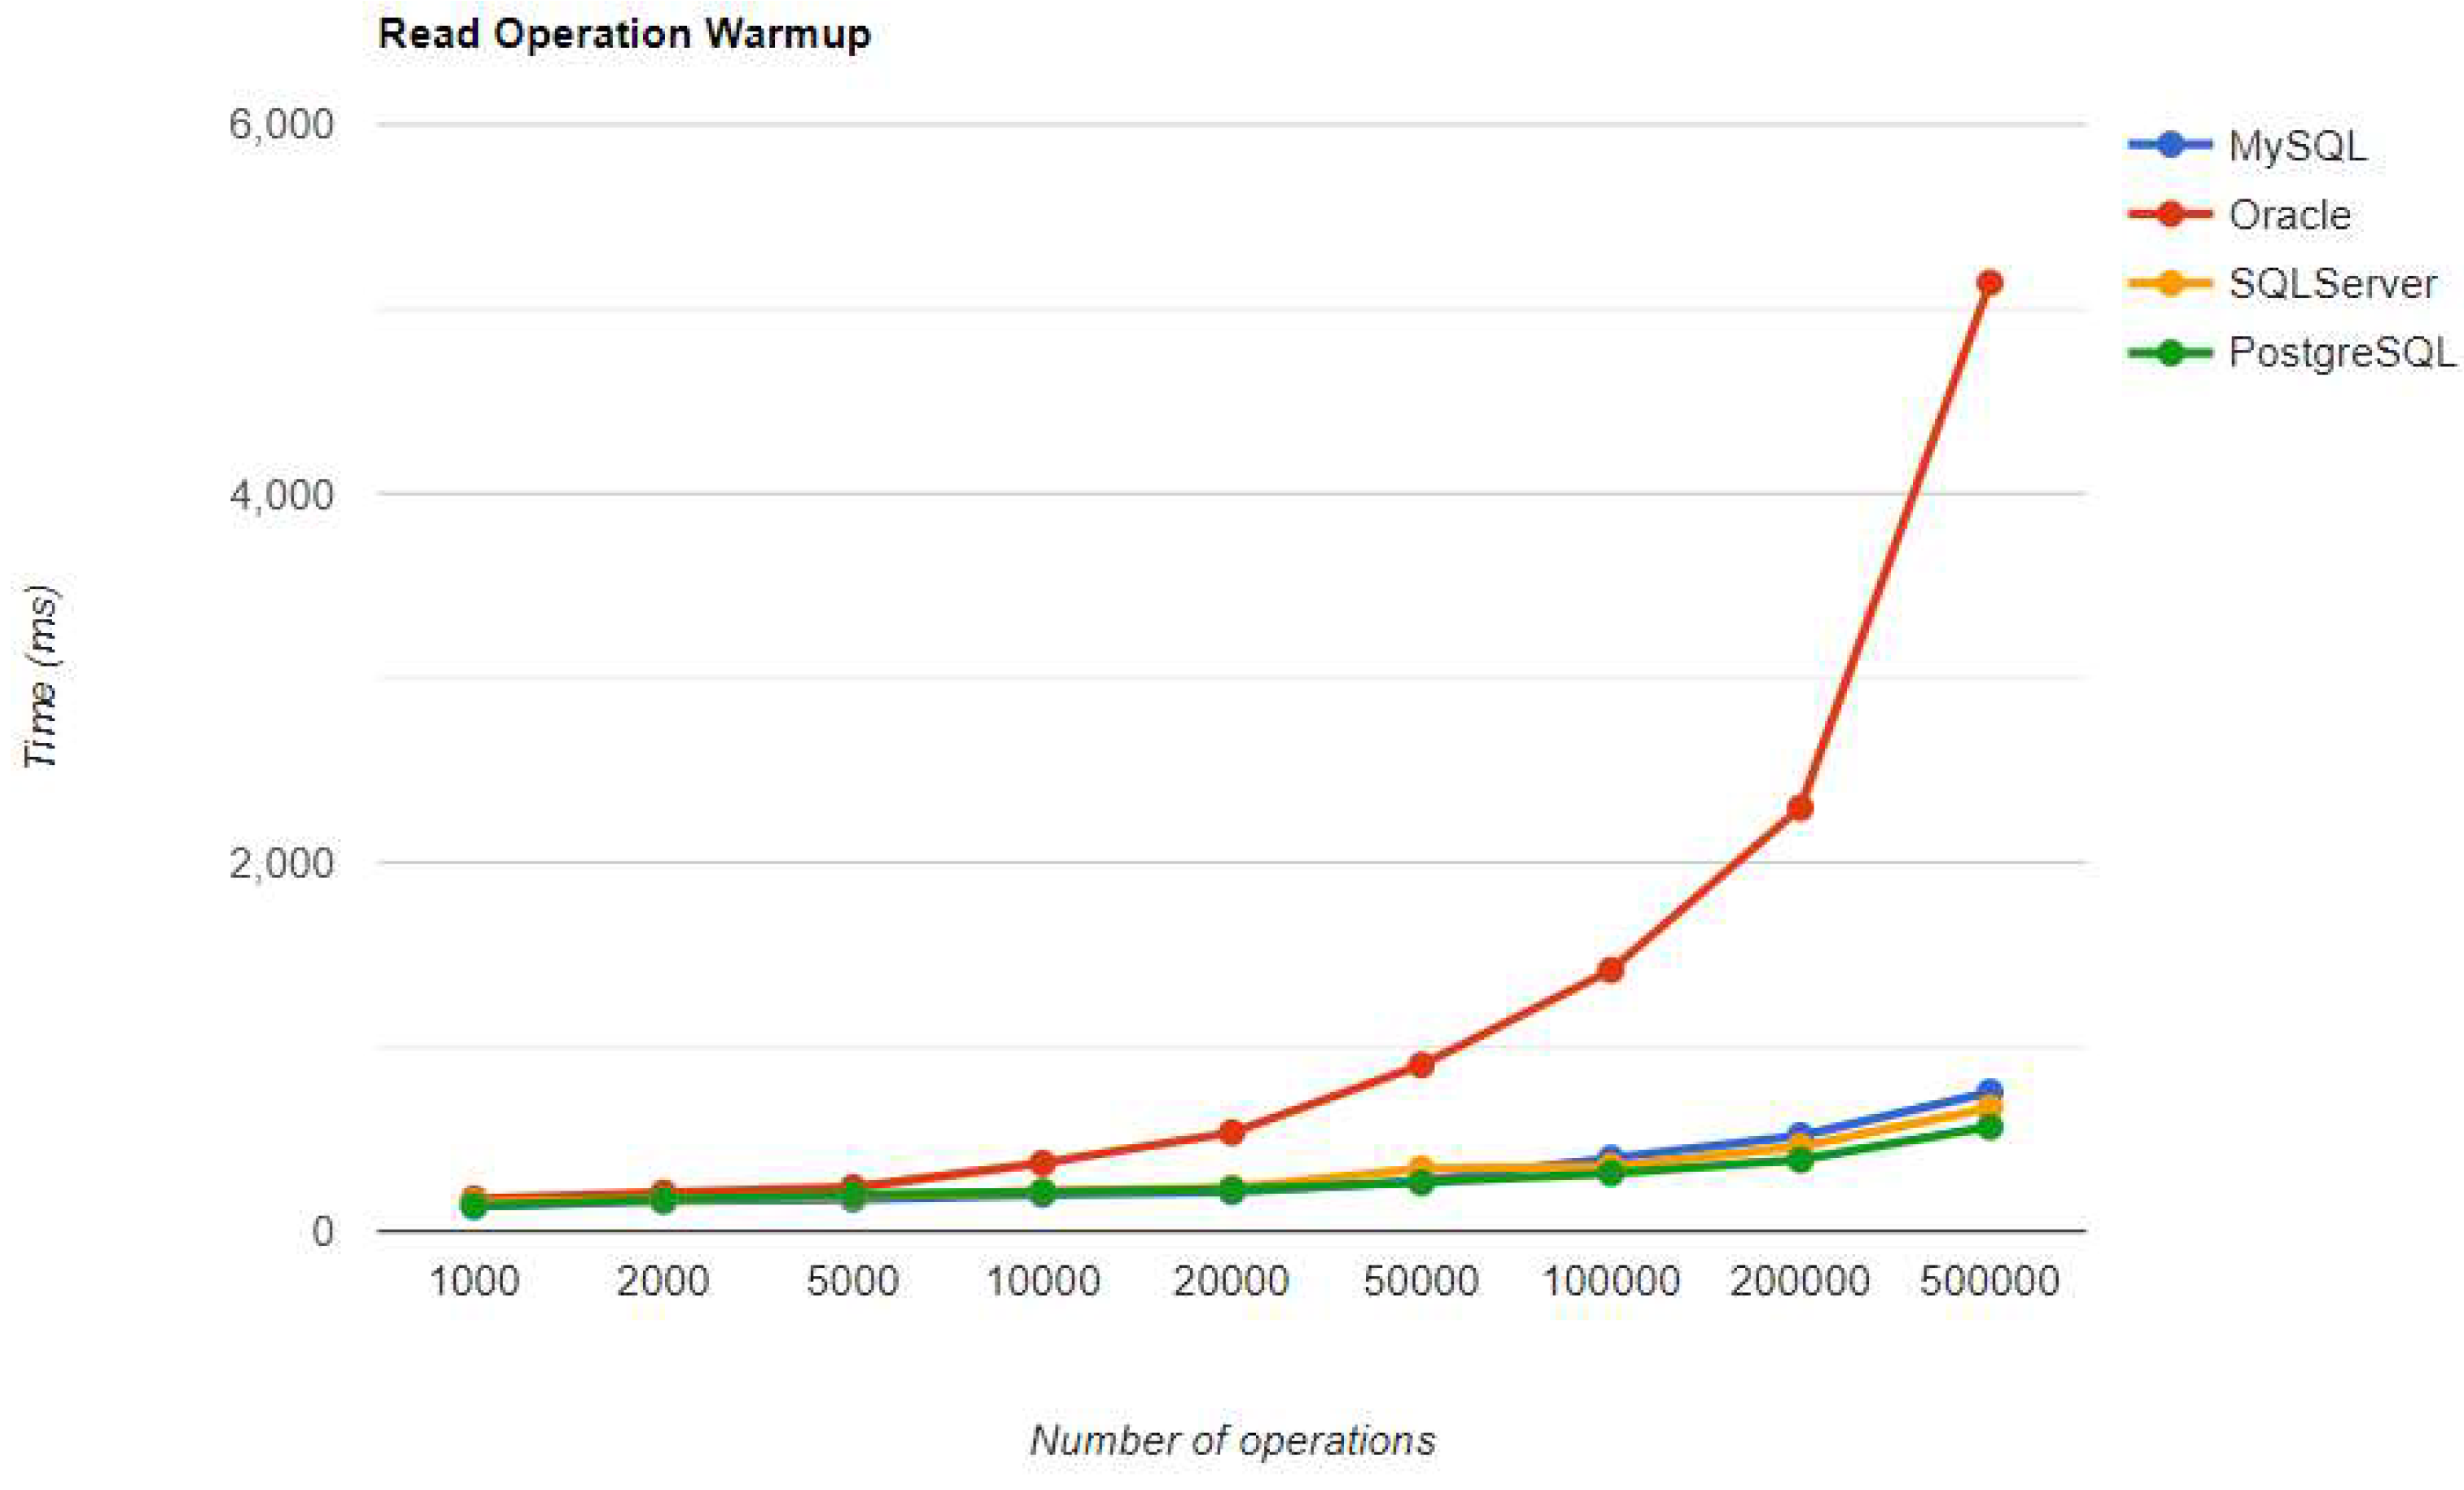
Figure 21.
Update warm-up iteration execution times using Hibernate.
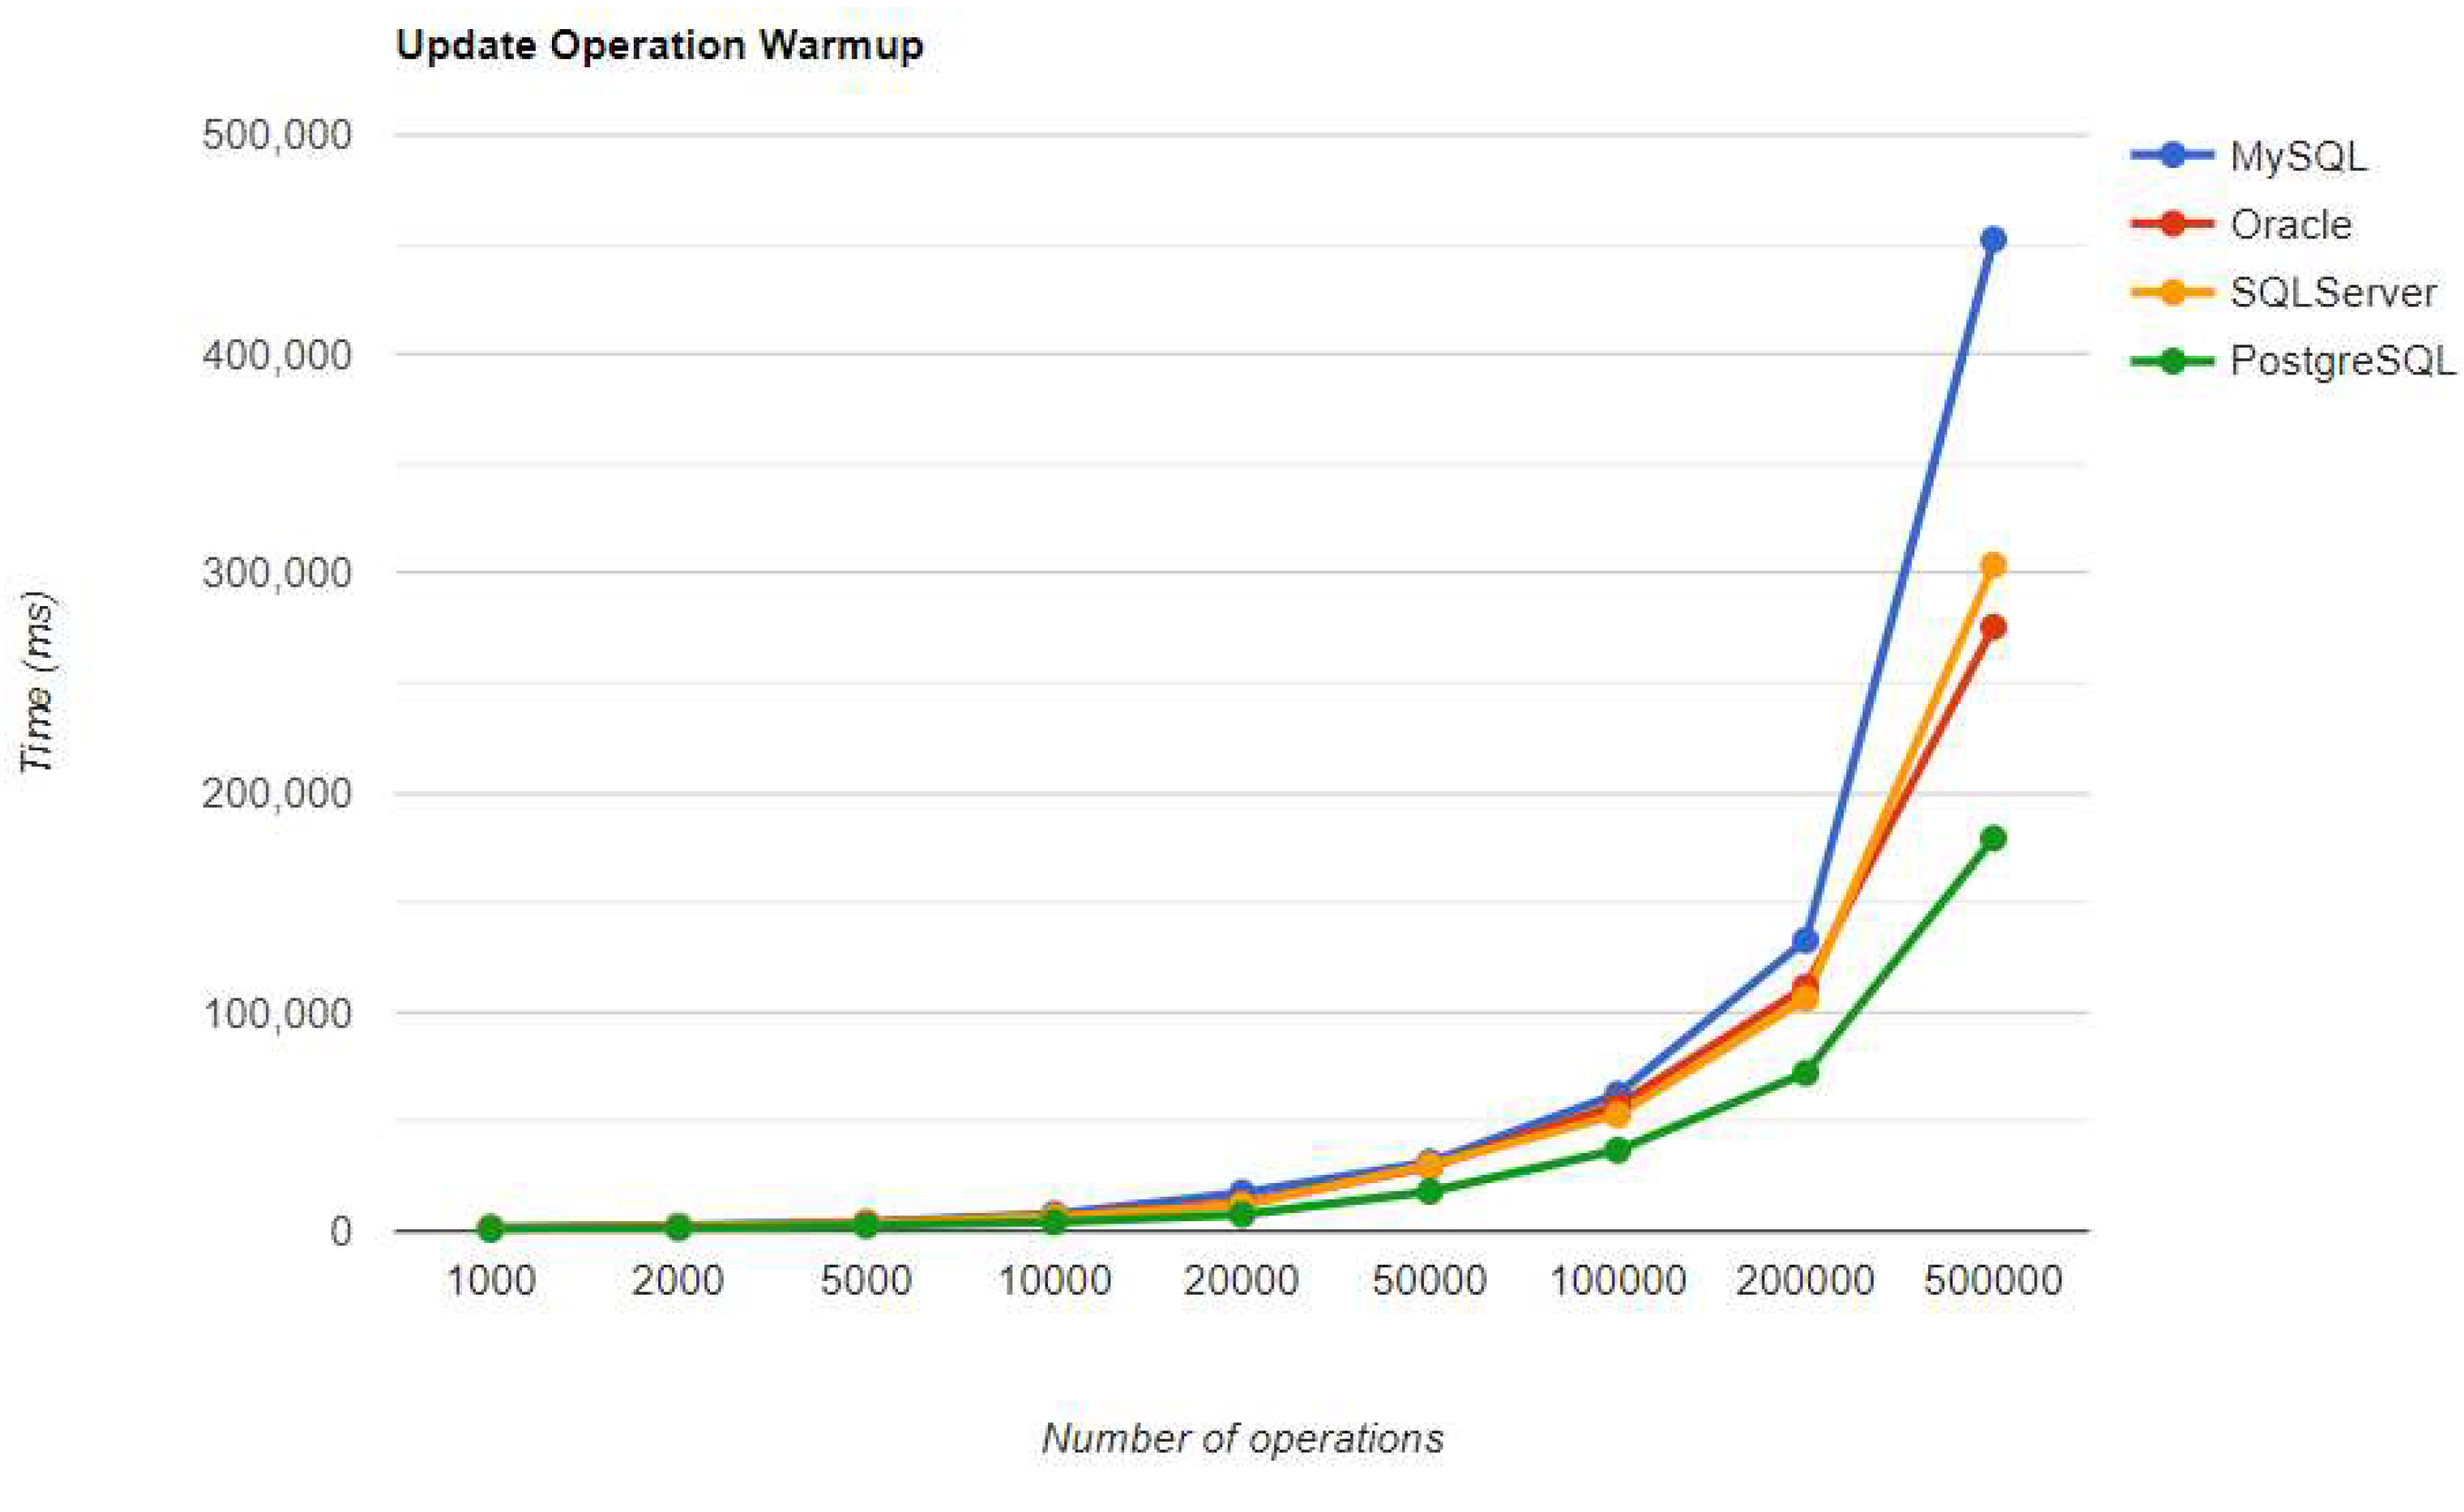
Figure 22.
Delete warm-up iteration execution times using Hibernate.
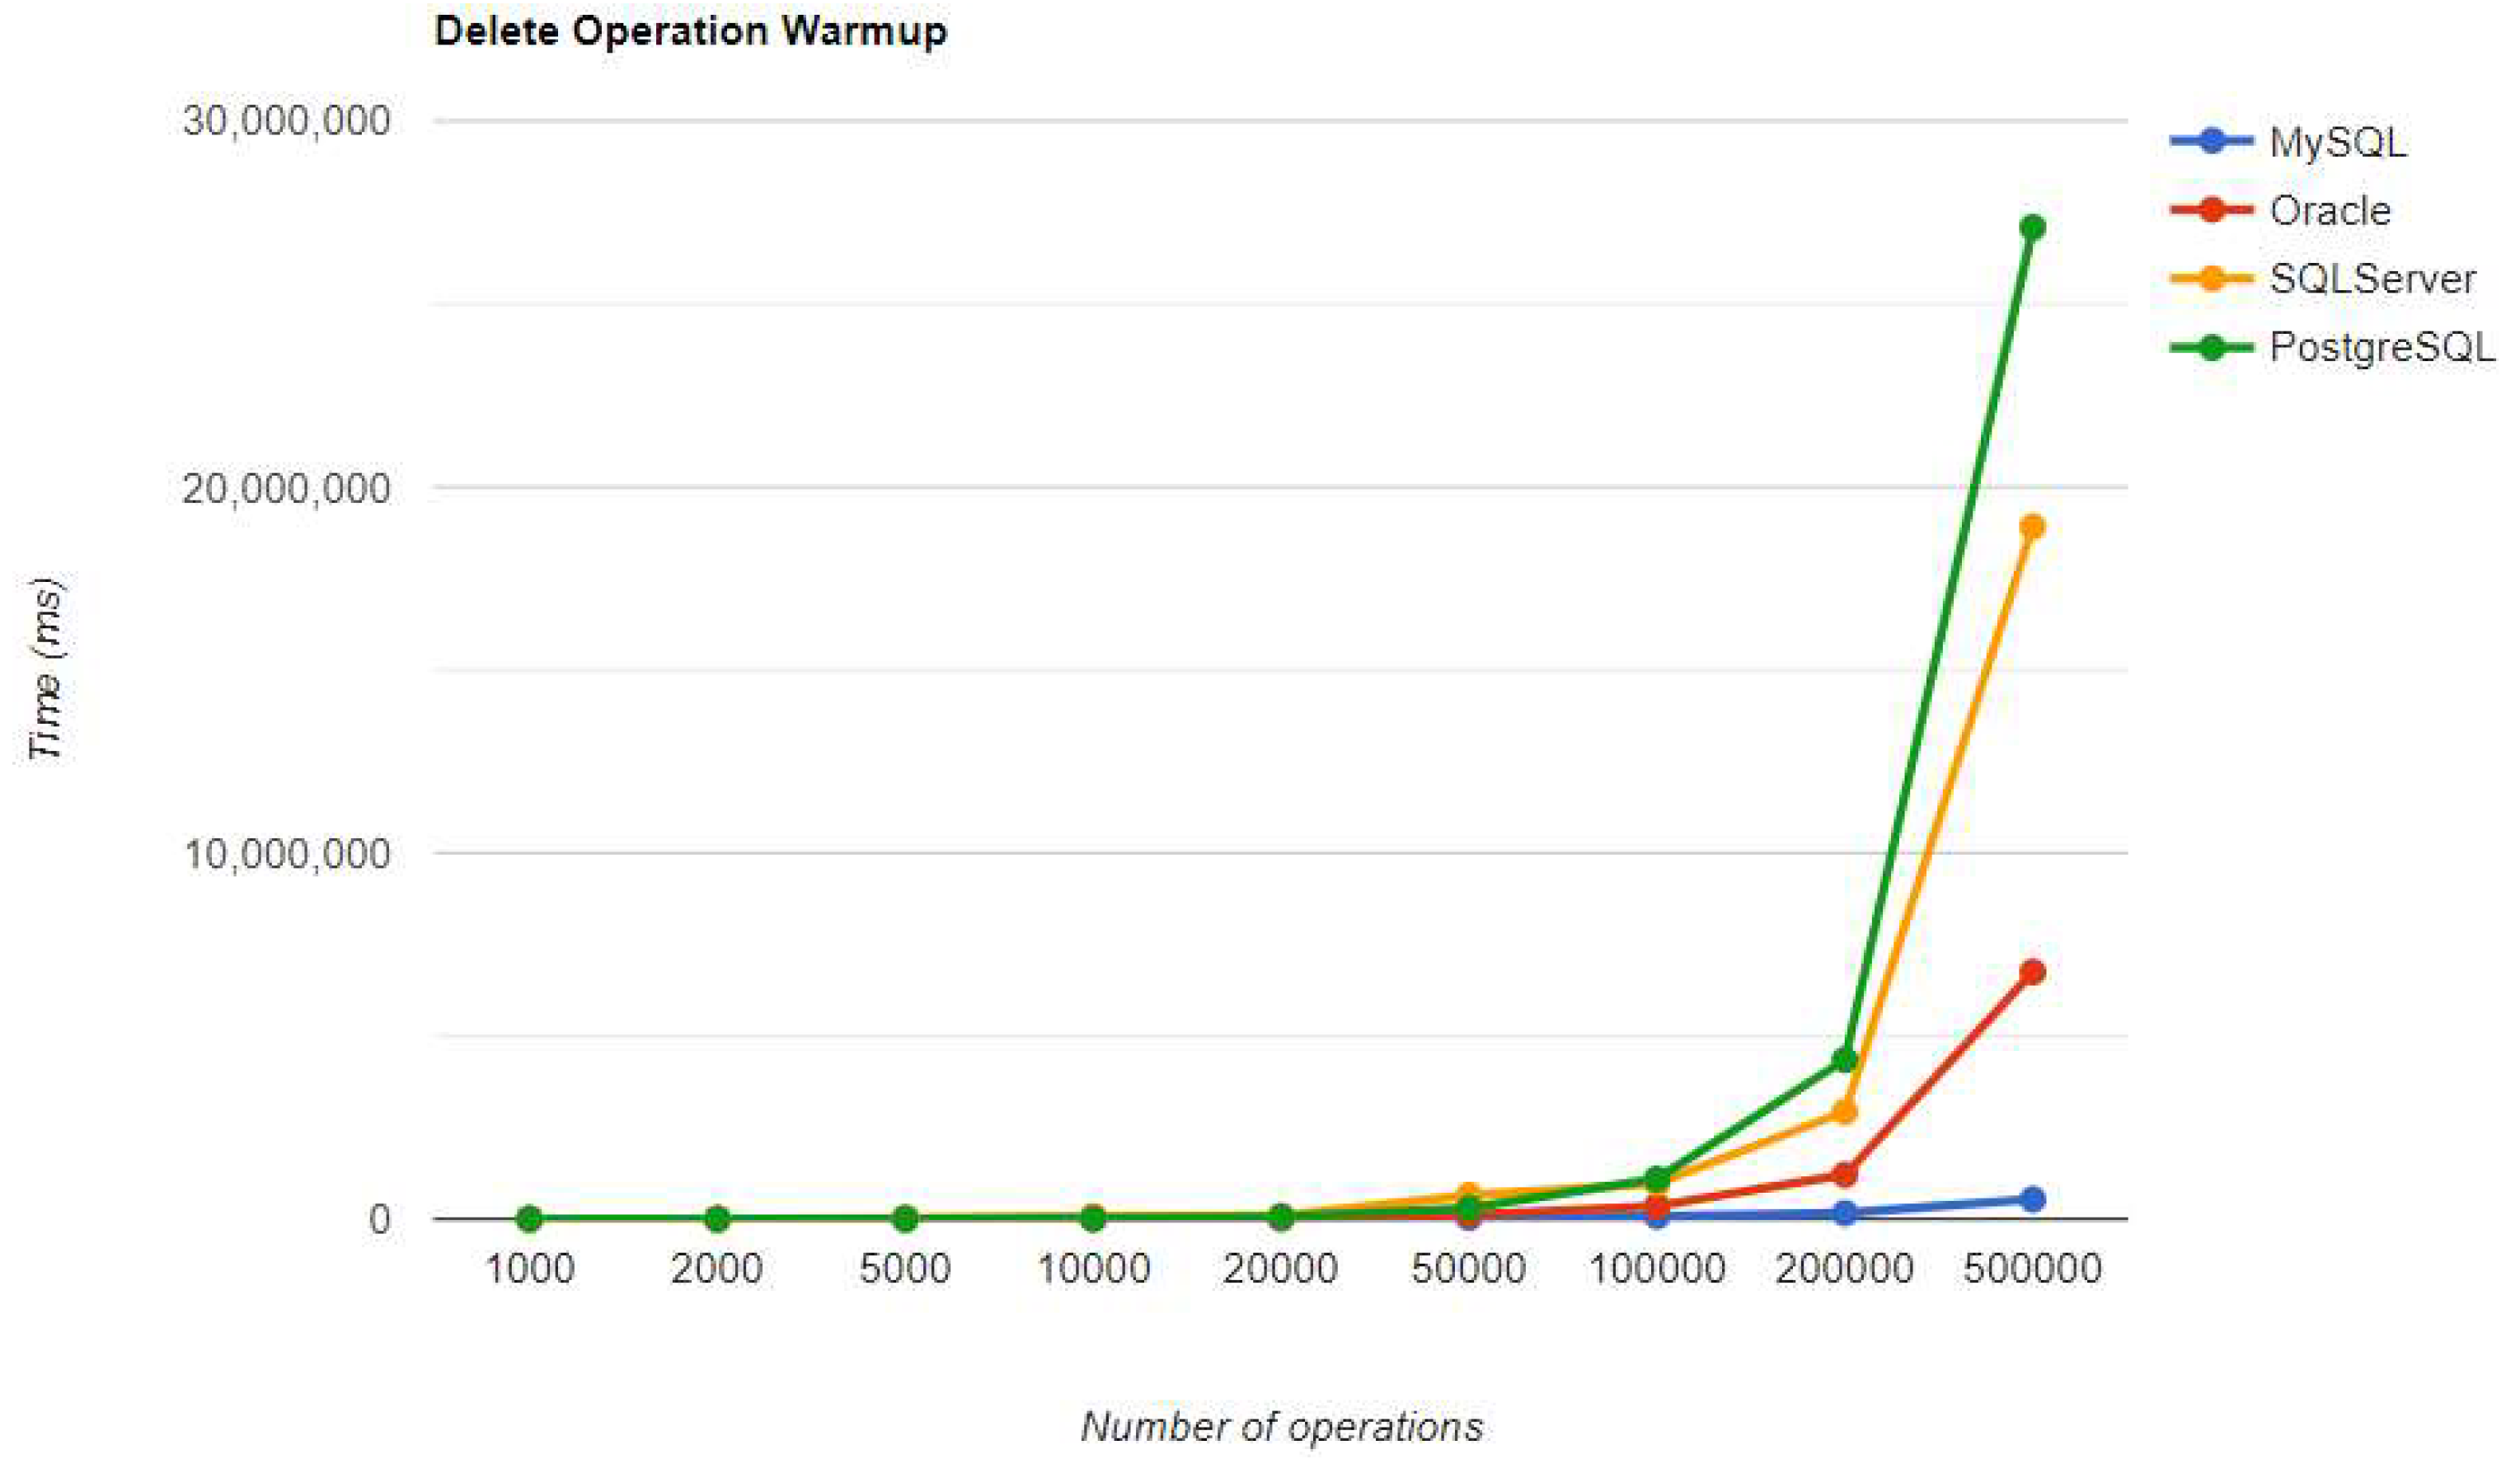
Figure 23.
Create warm-up iteration execution times using Spring Data JPA.
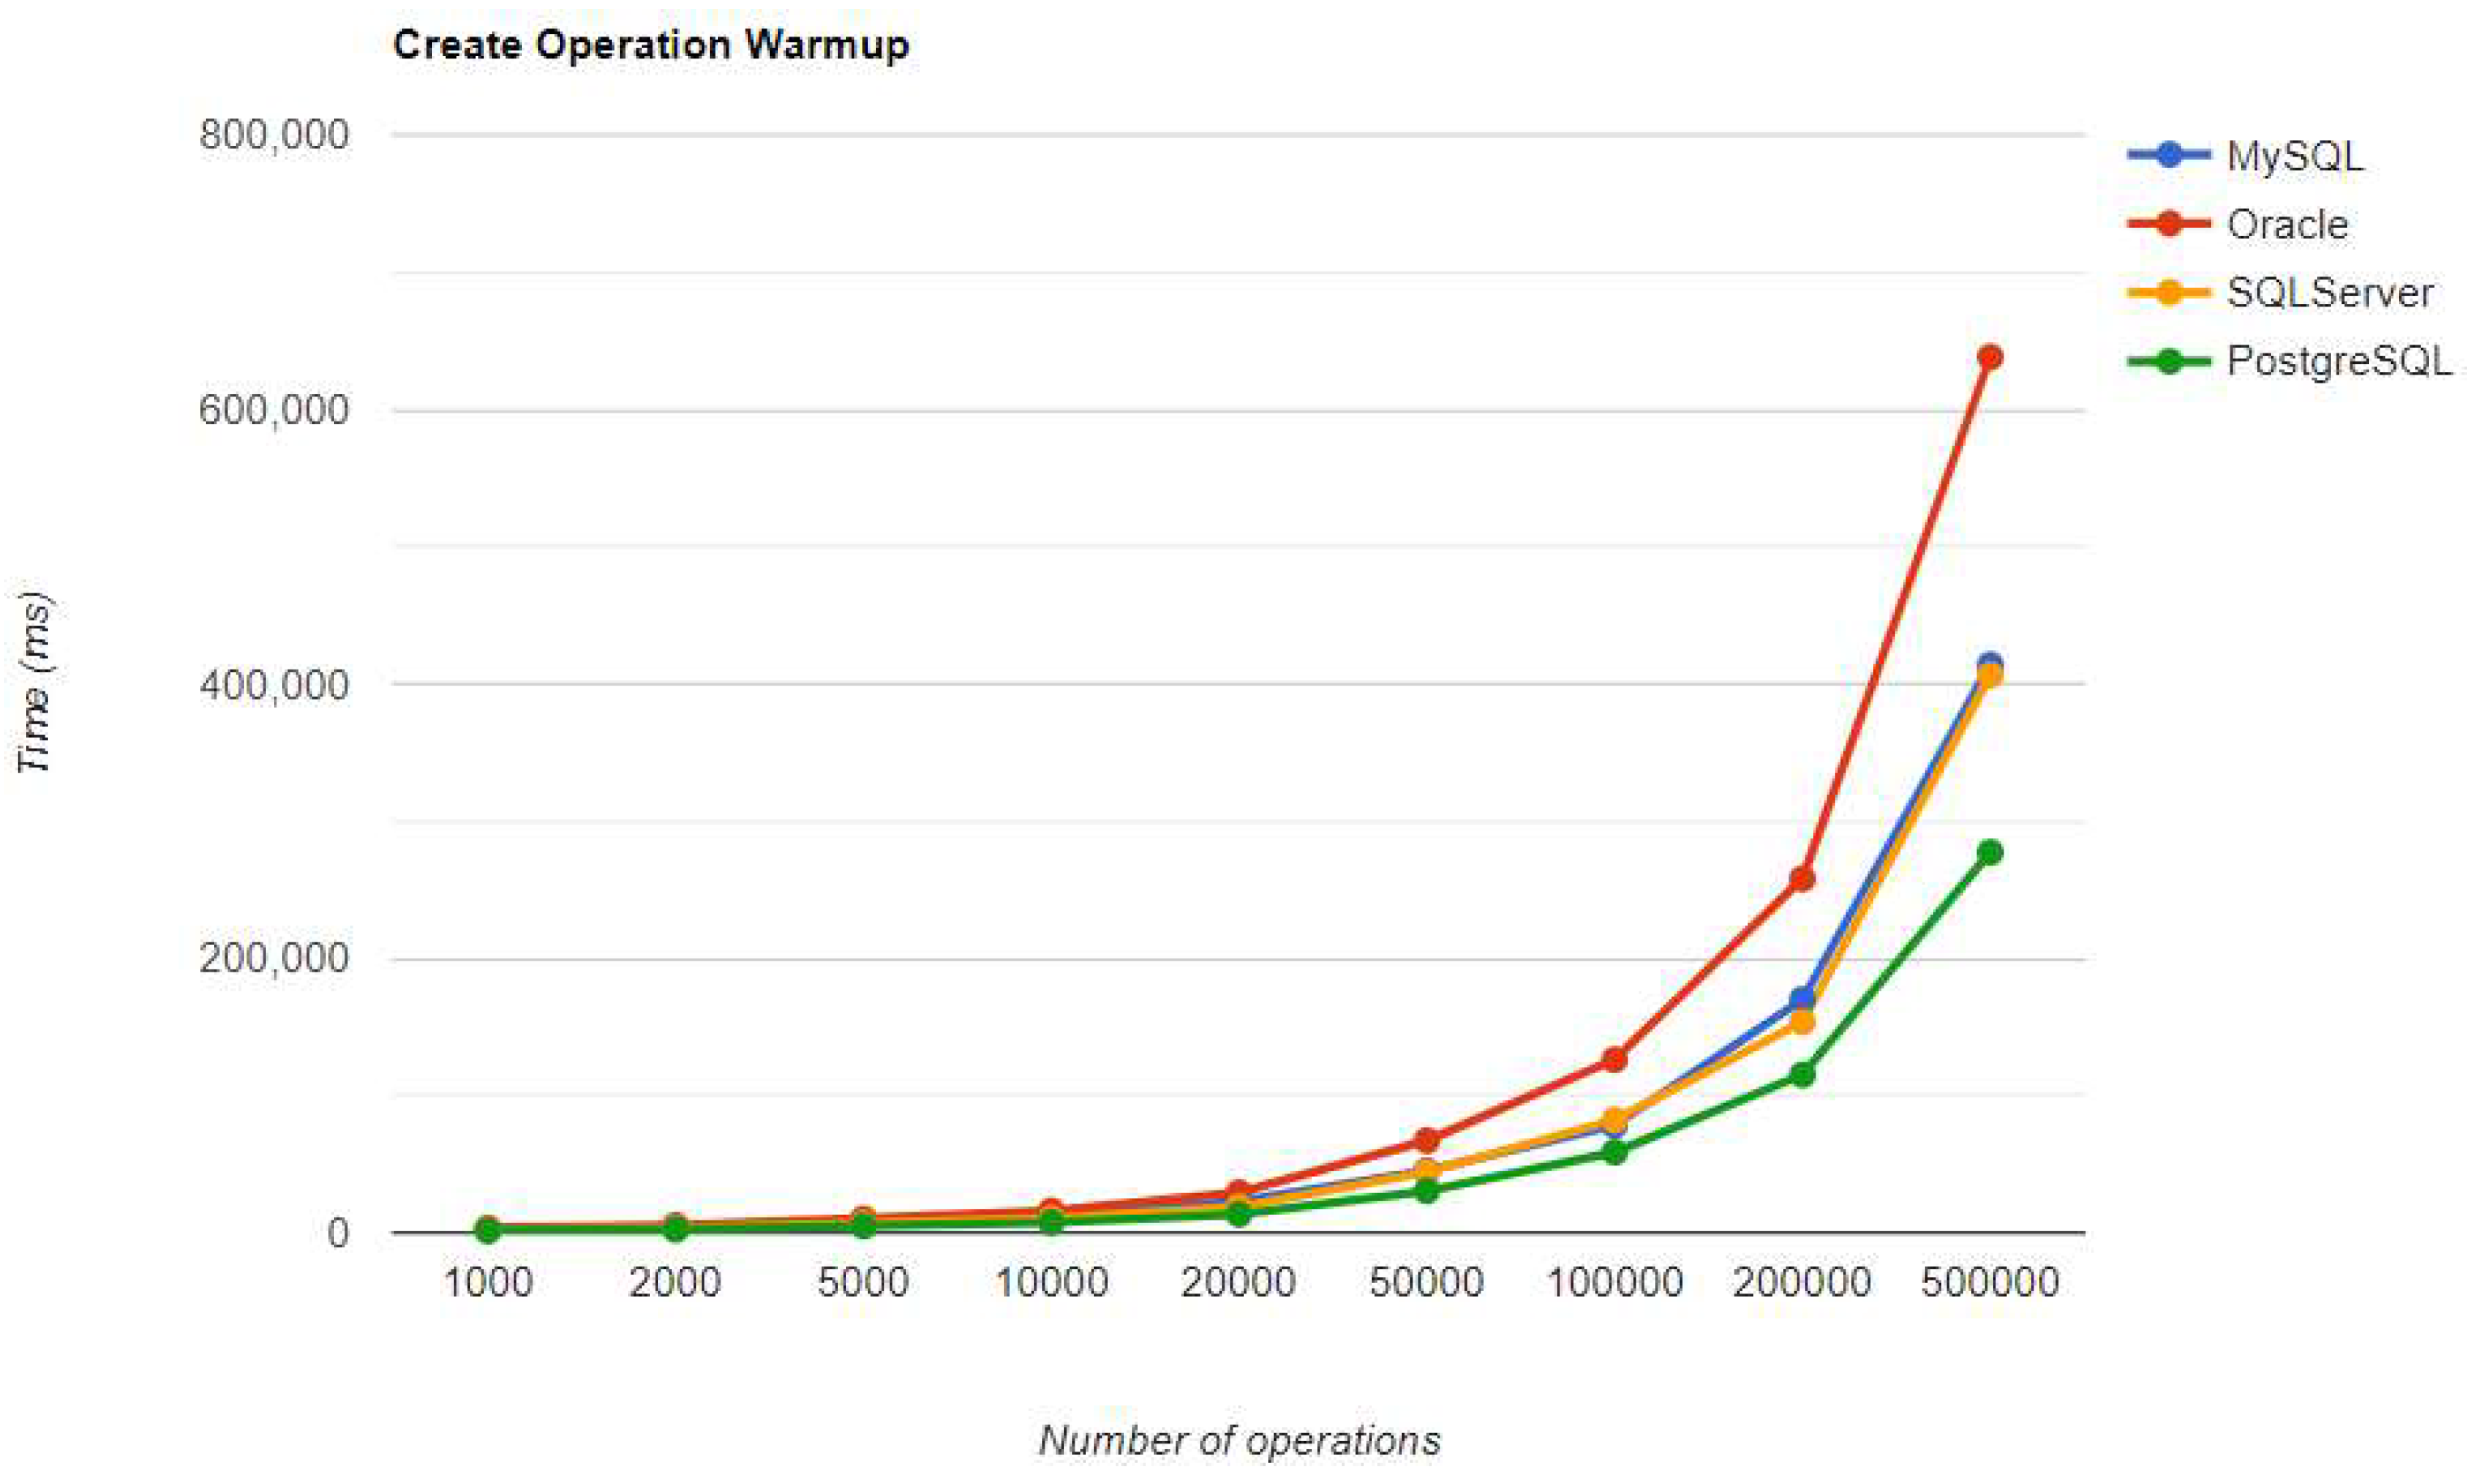
Figure 24.
Read warm-up iteration execution times using Spring Data JPA.
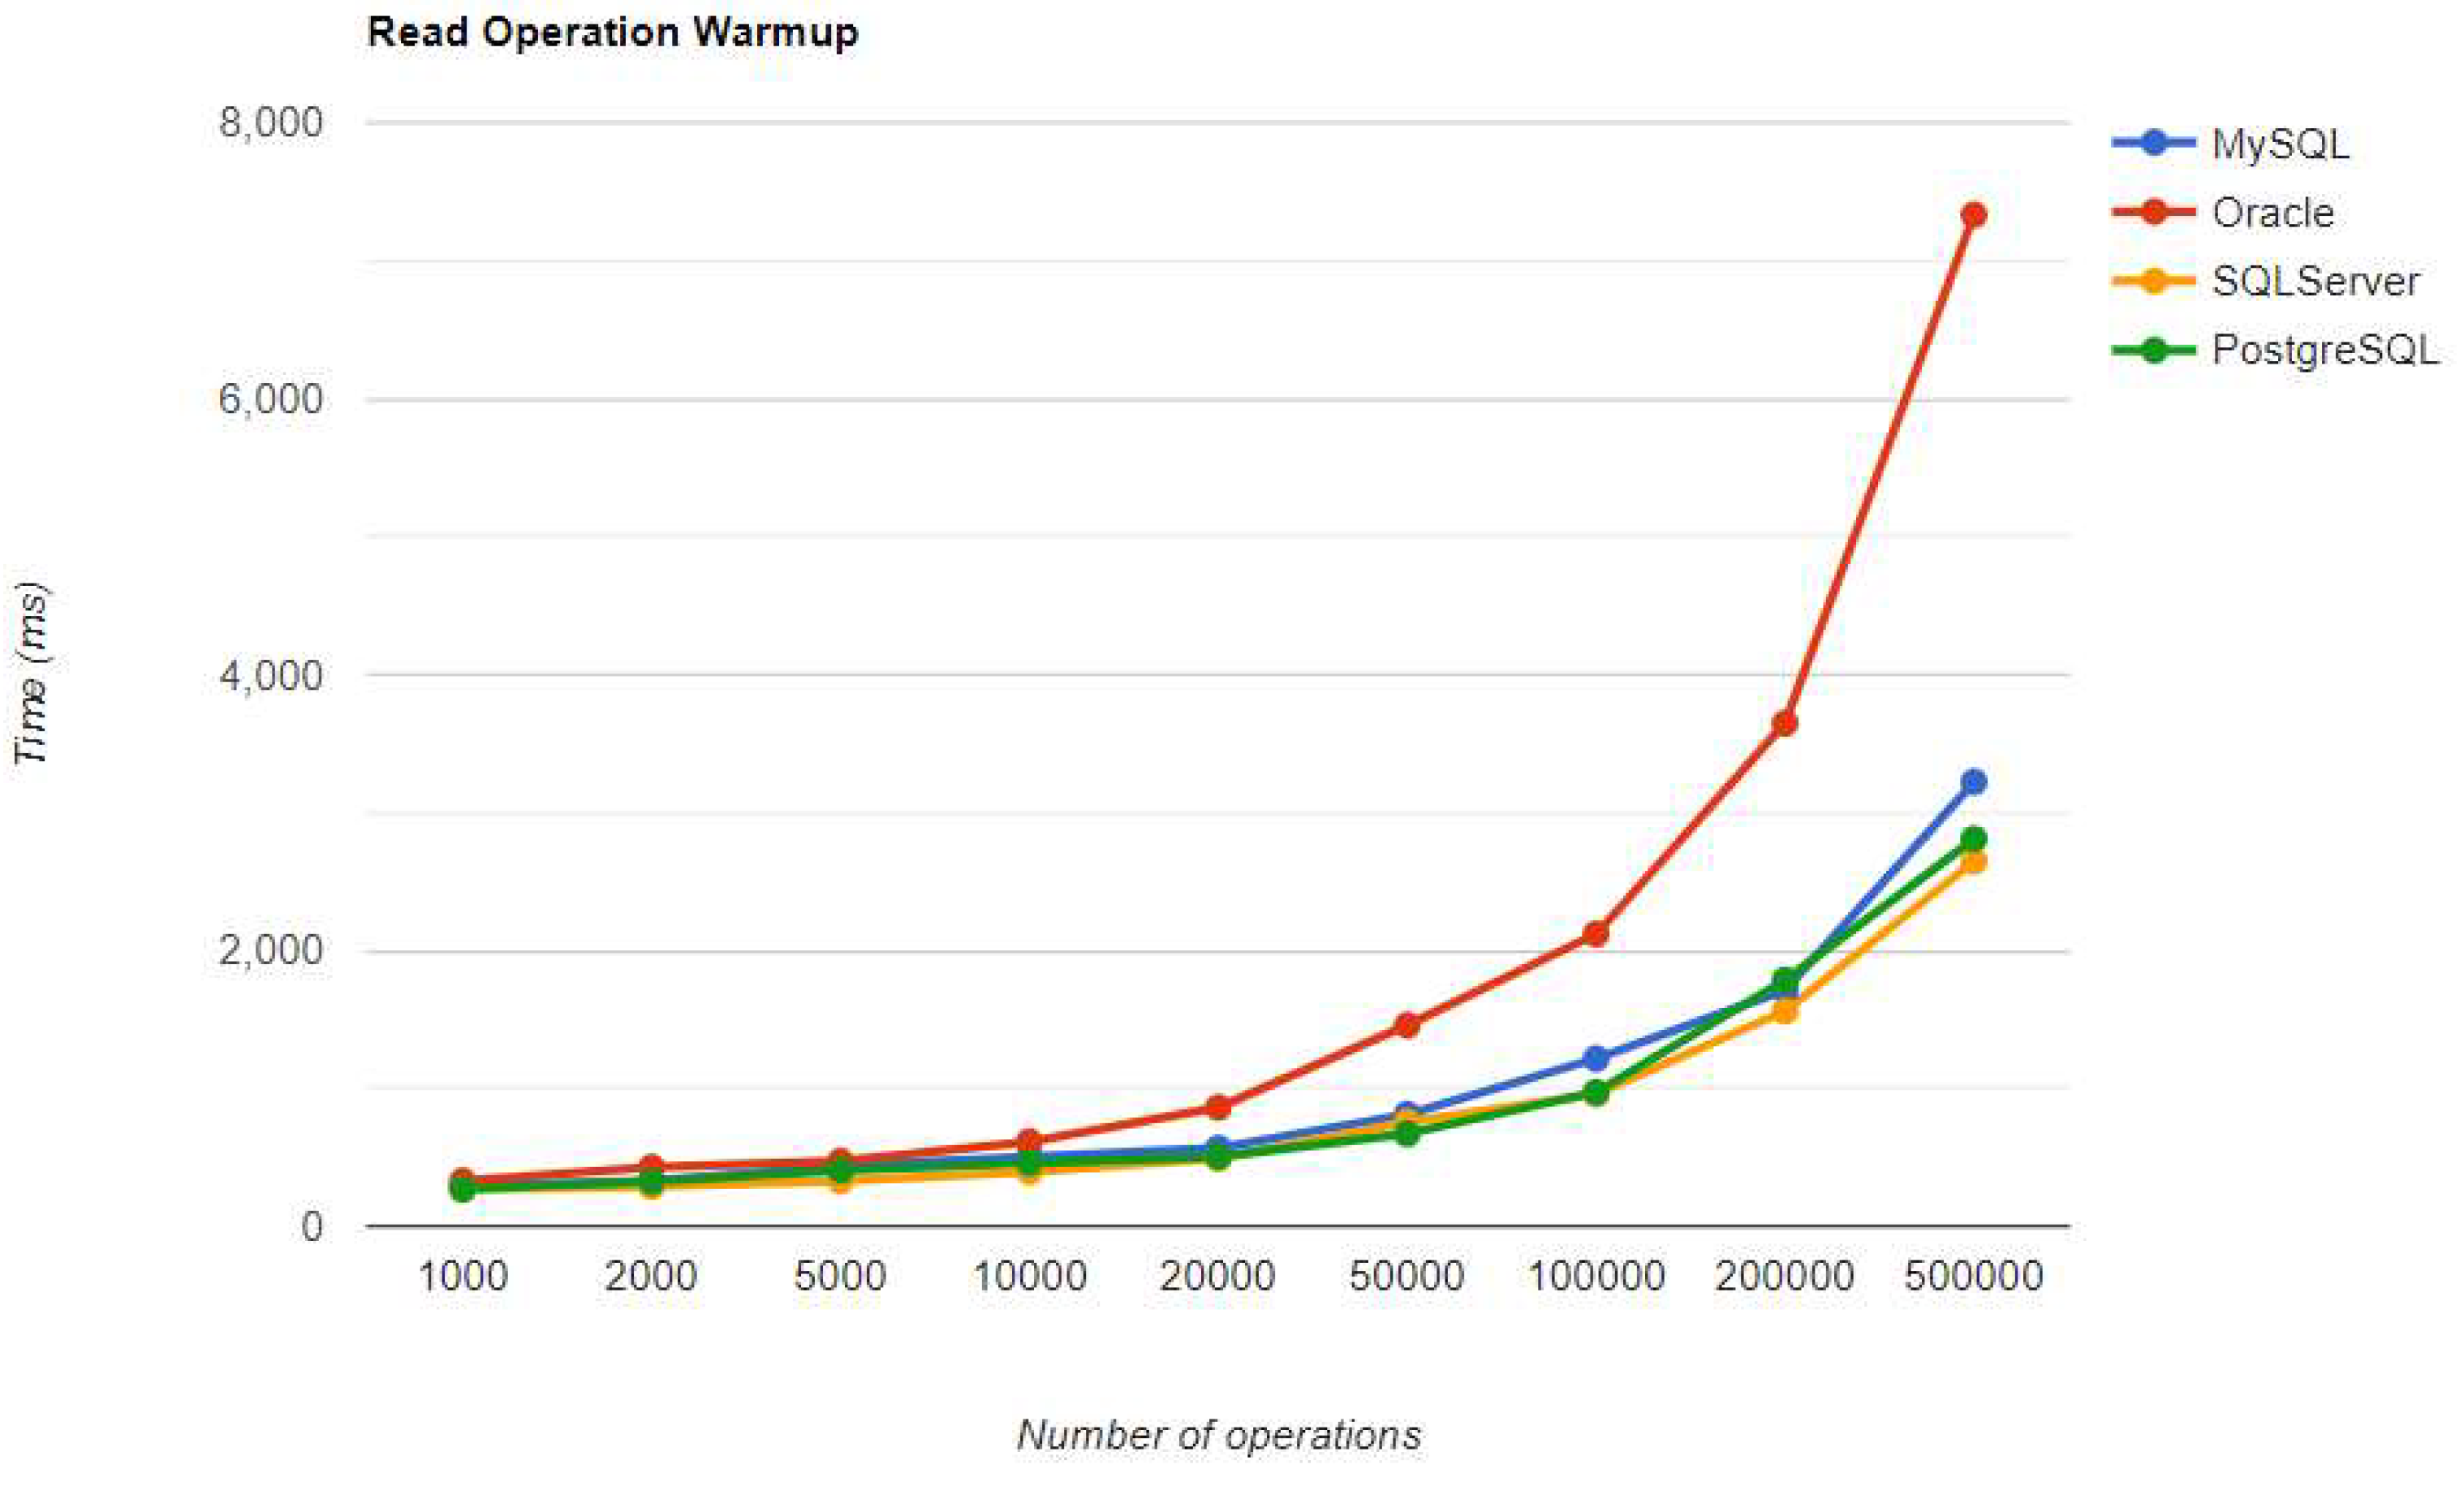
Figure 25.
Update warm-up iteration execution times using Spring Data JPA.
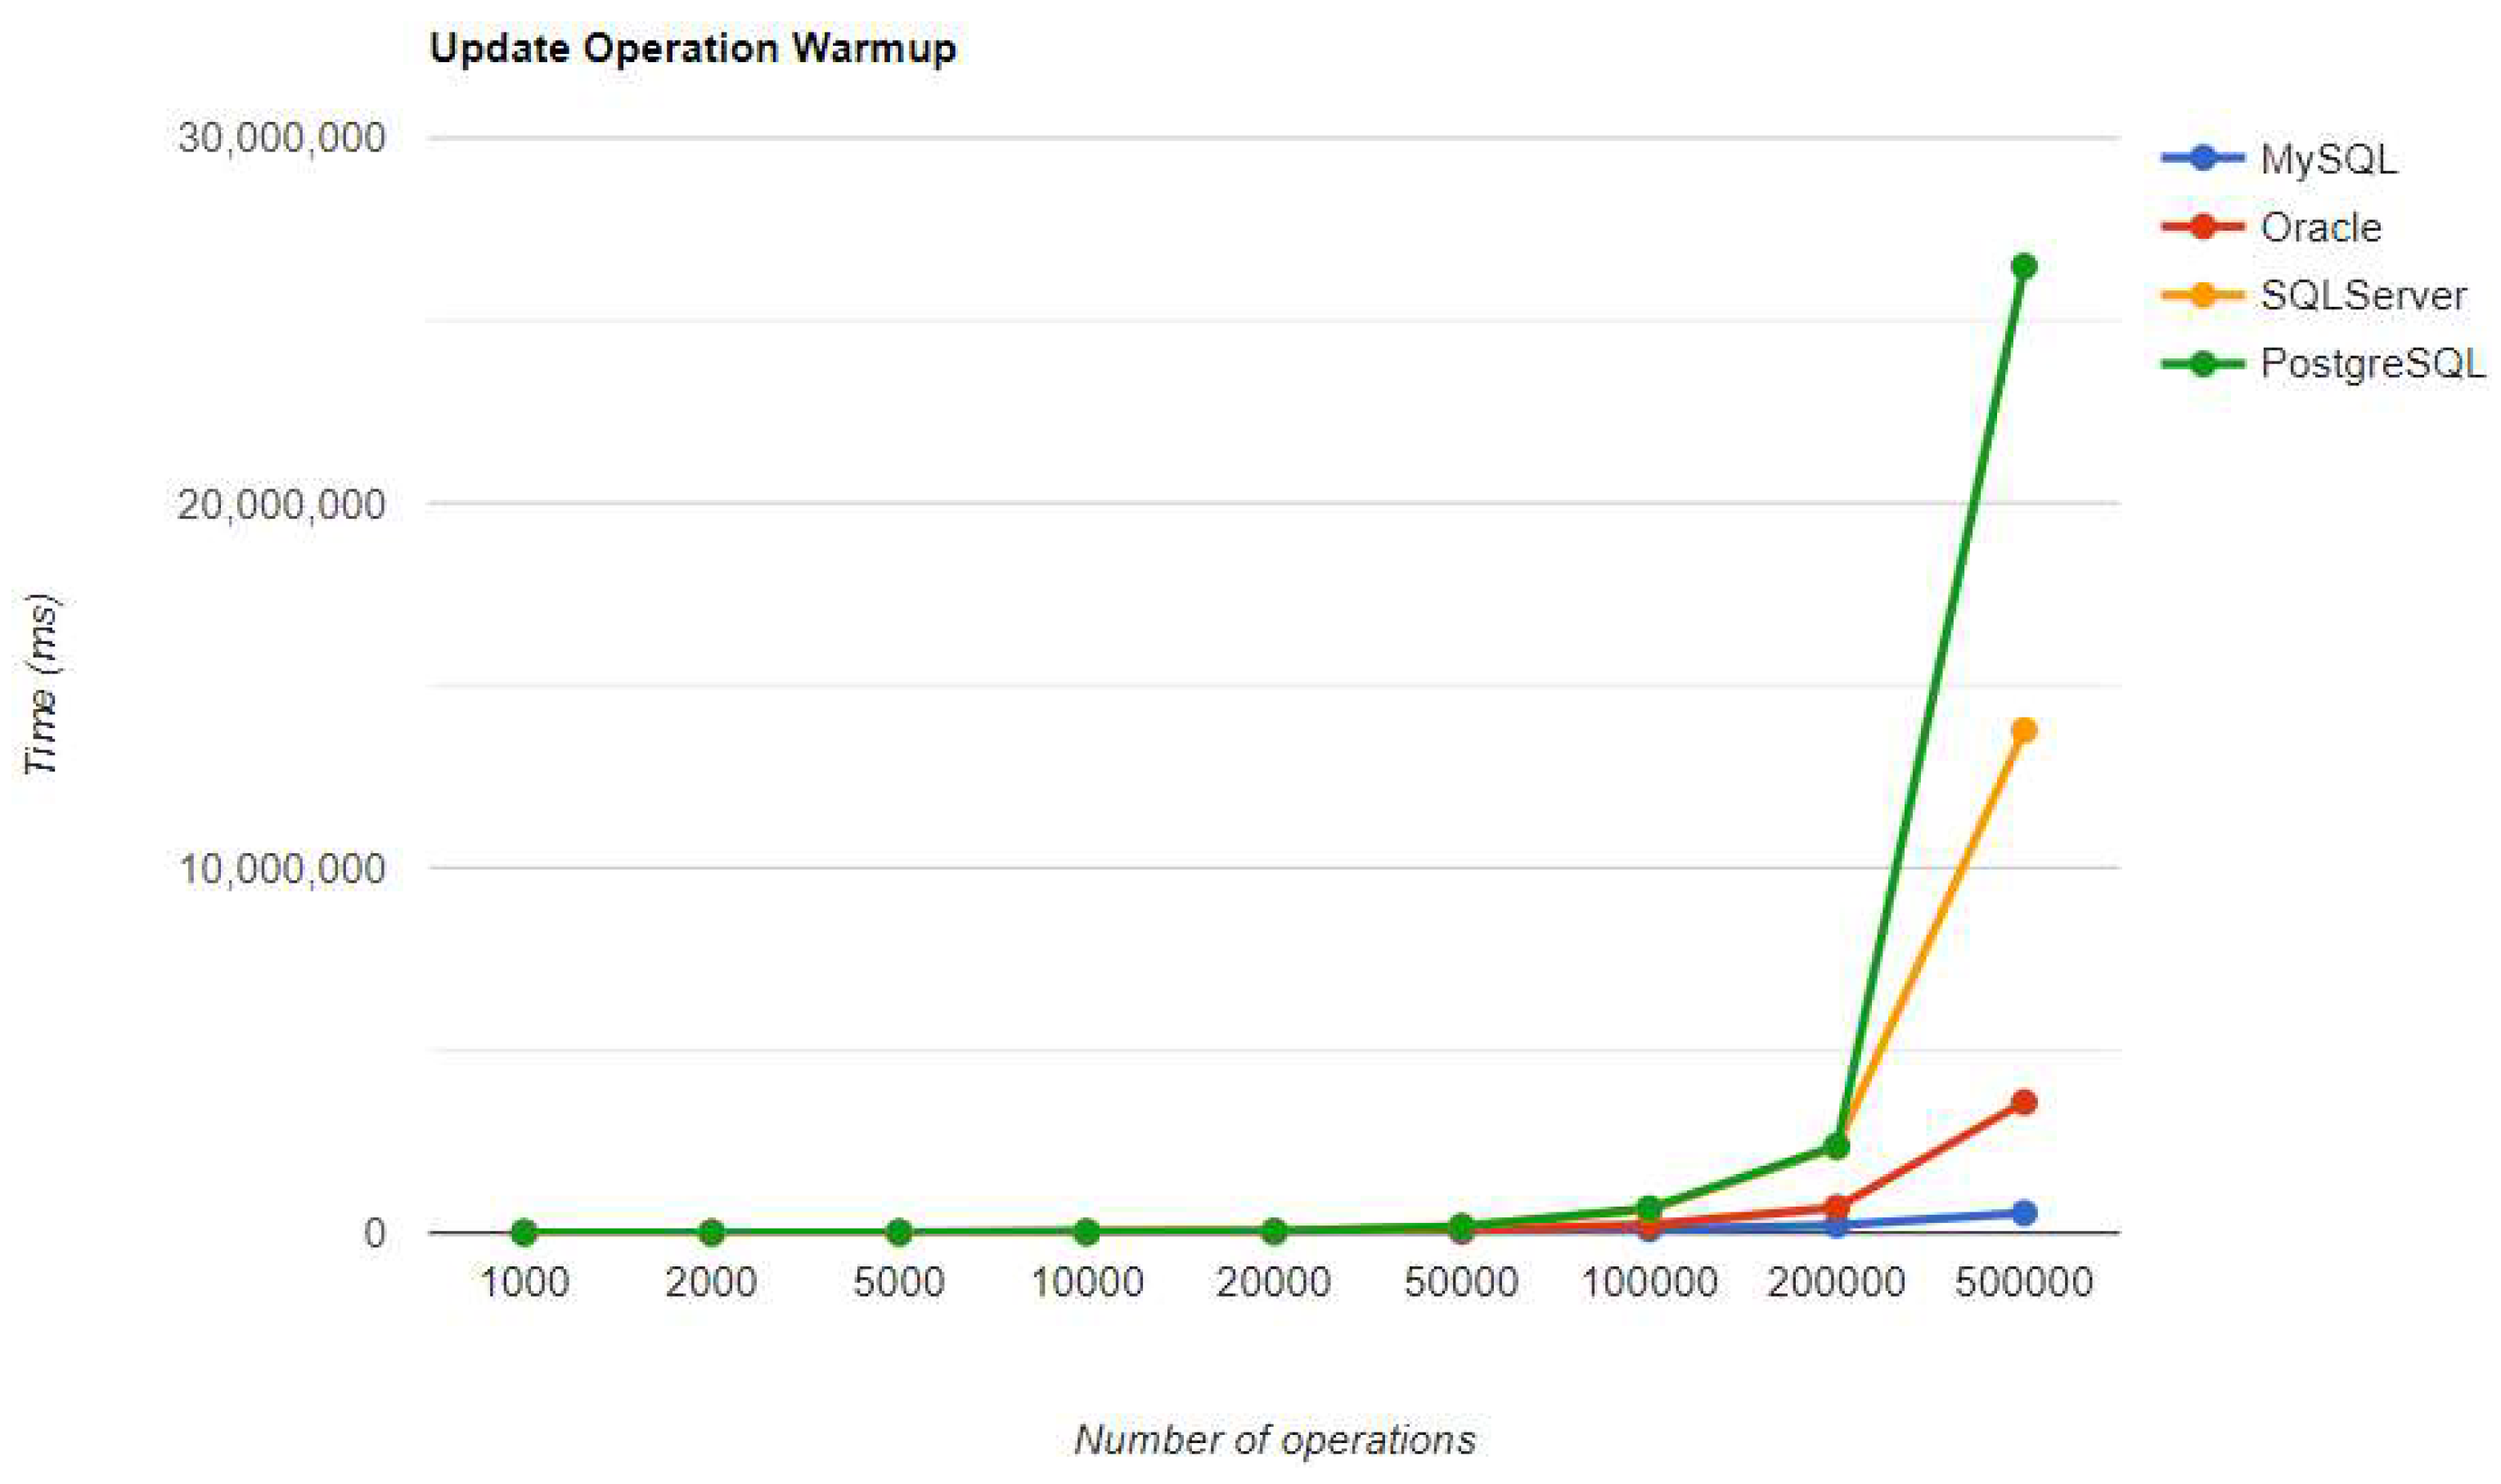
Figure 26.
Delete warm-up iteration execution times using Spring Data JPA.
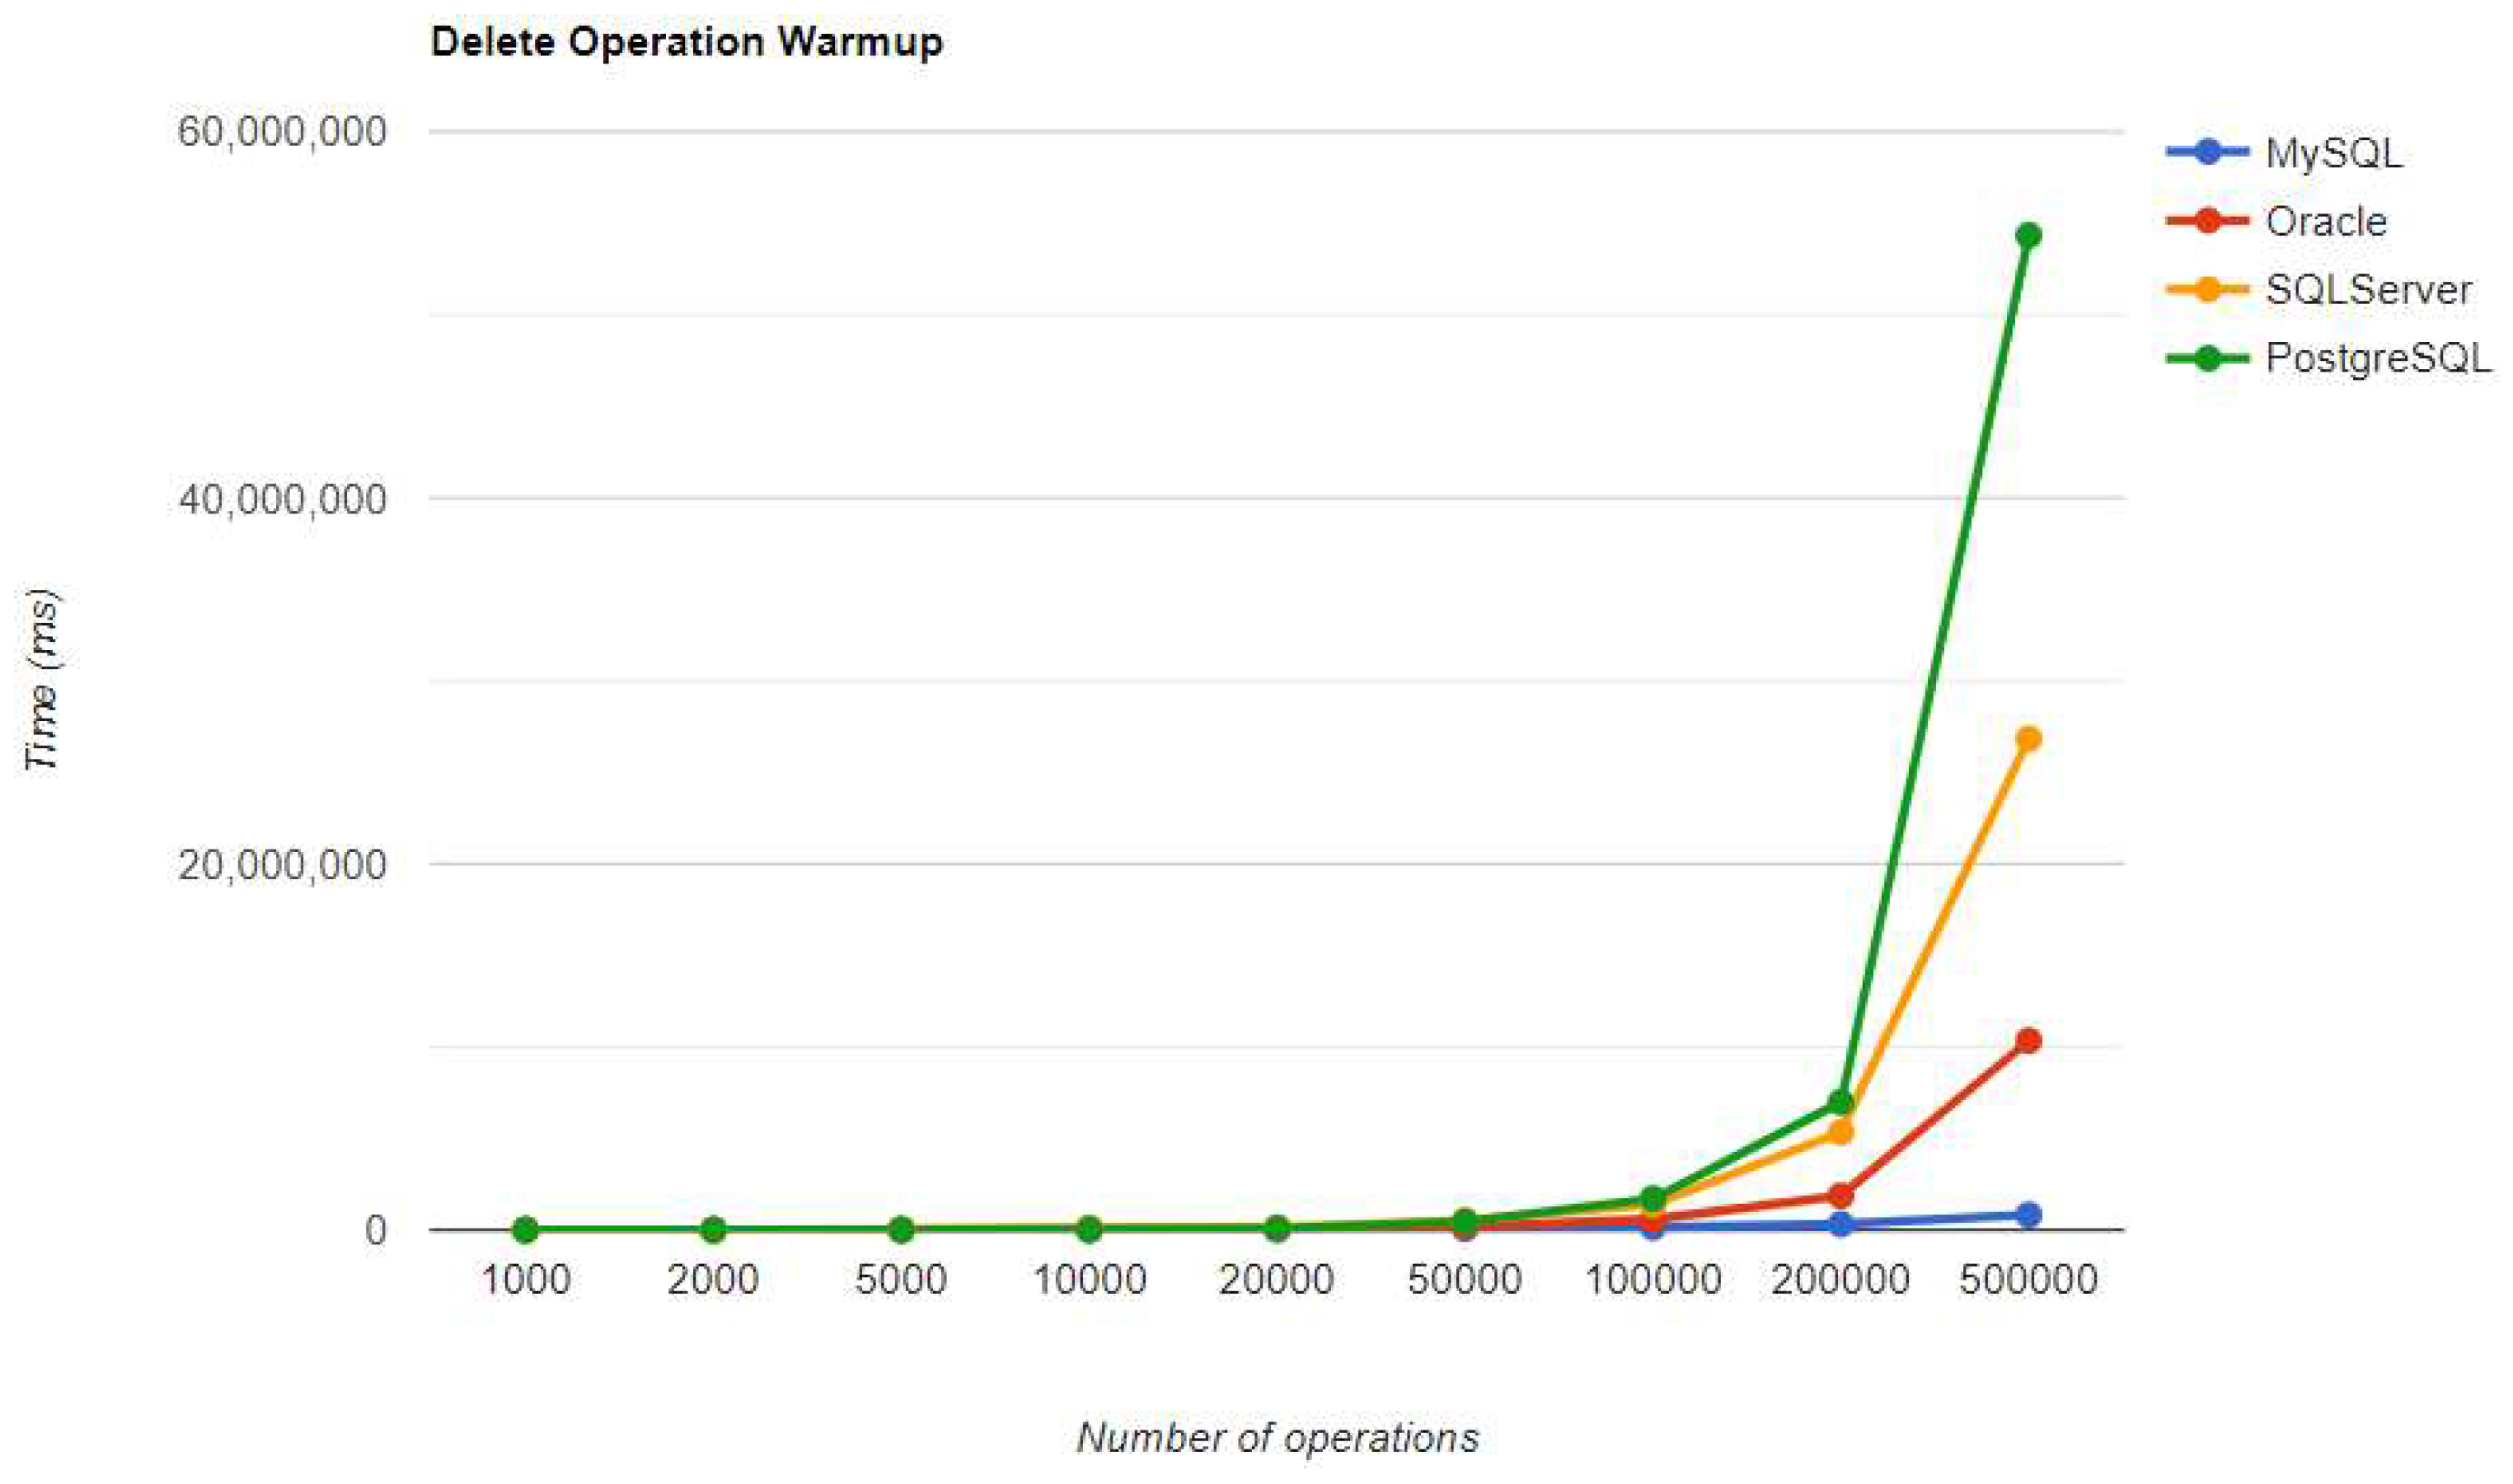
Figure 27.
Create execution times using JPA, after warm-up.
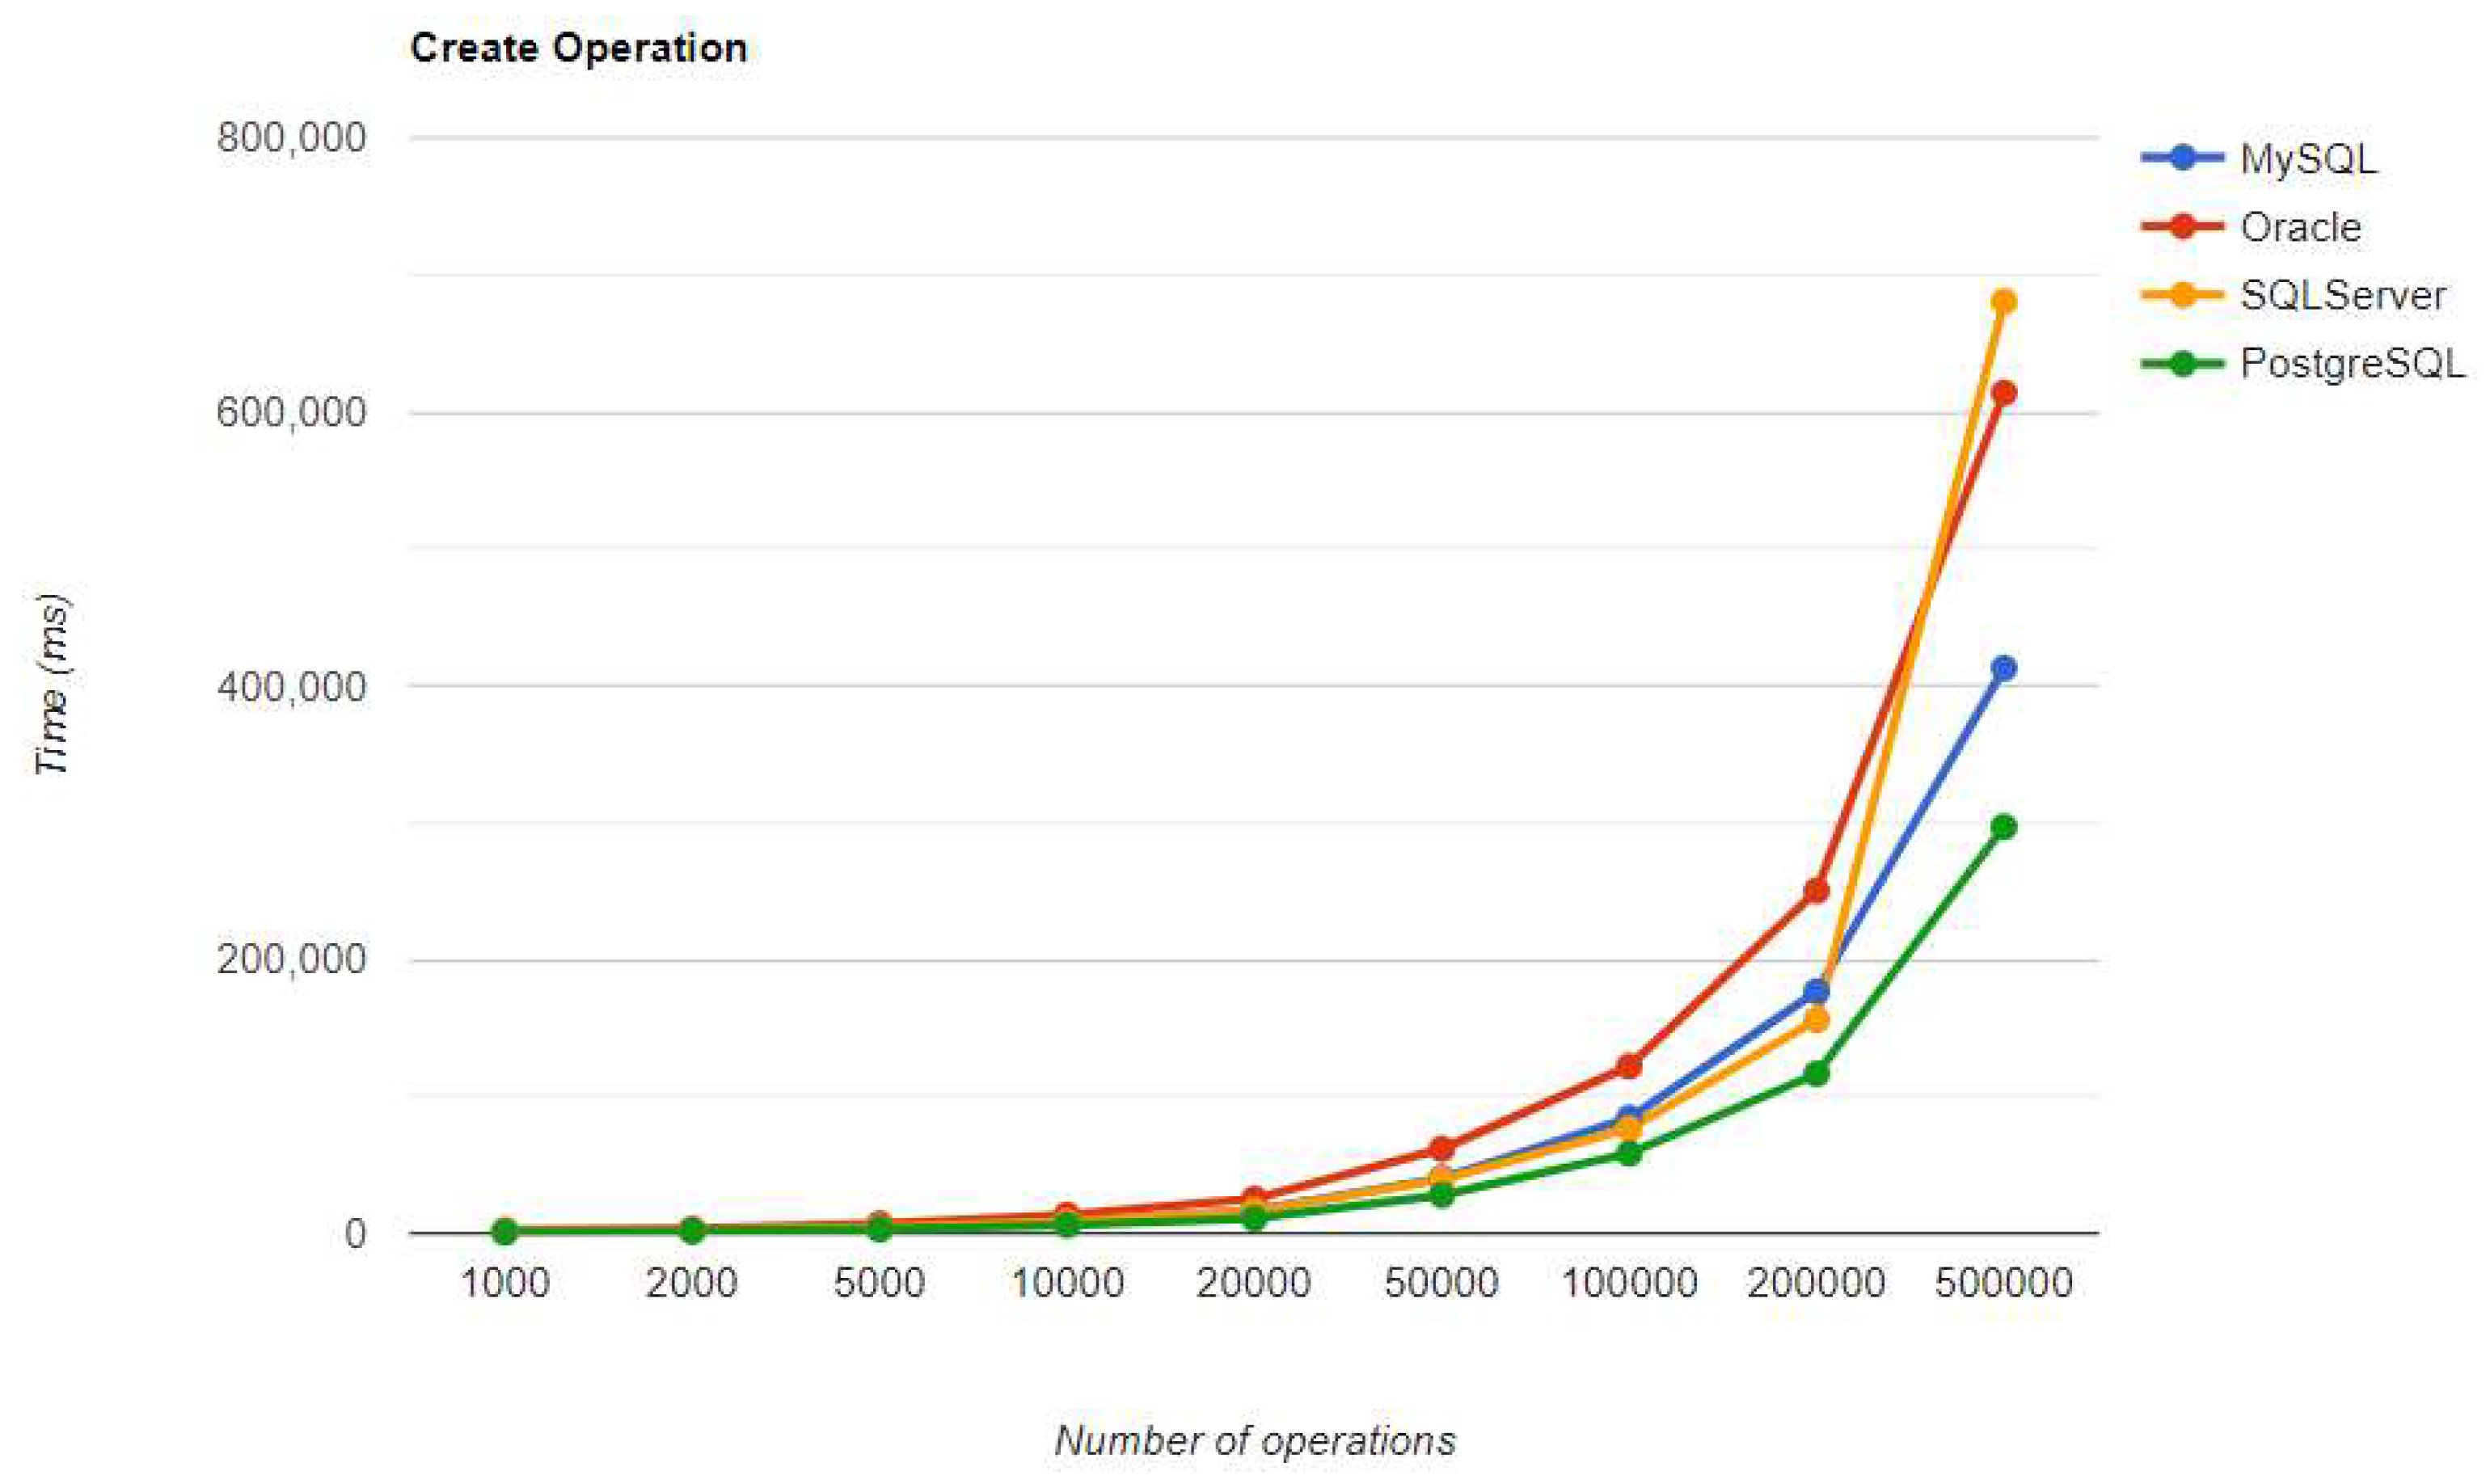
Figure 28.
Read execution times using JPA, after warm-up.
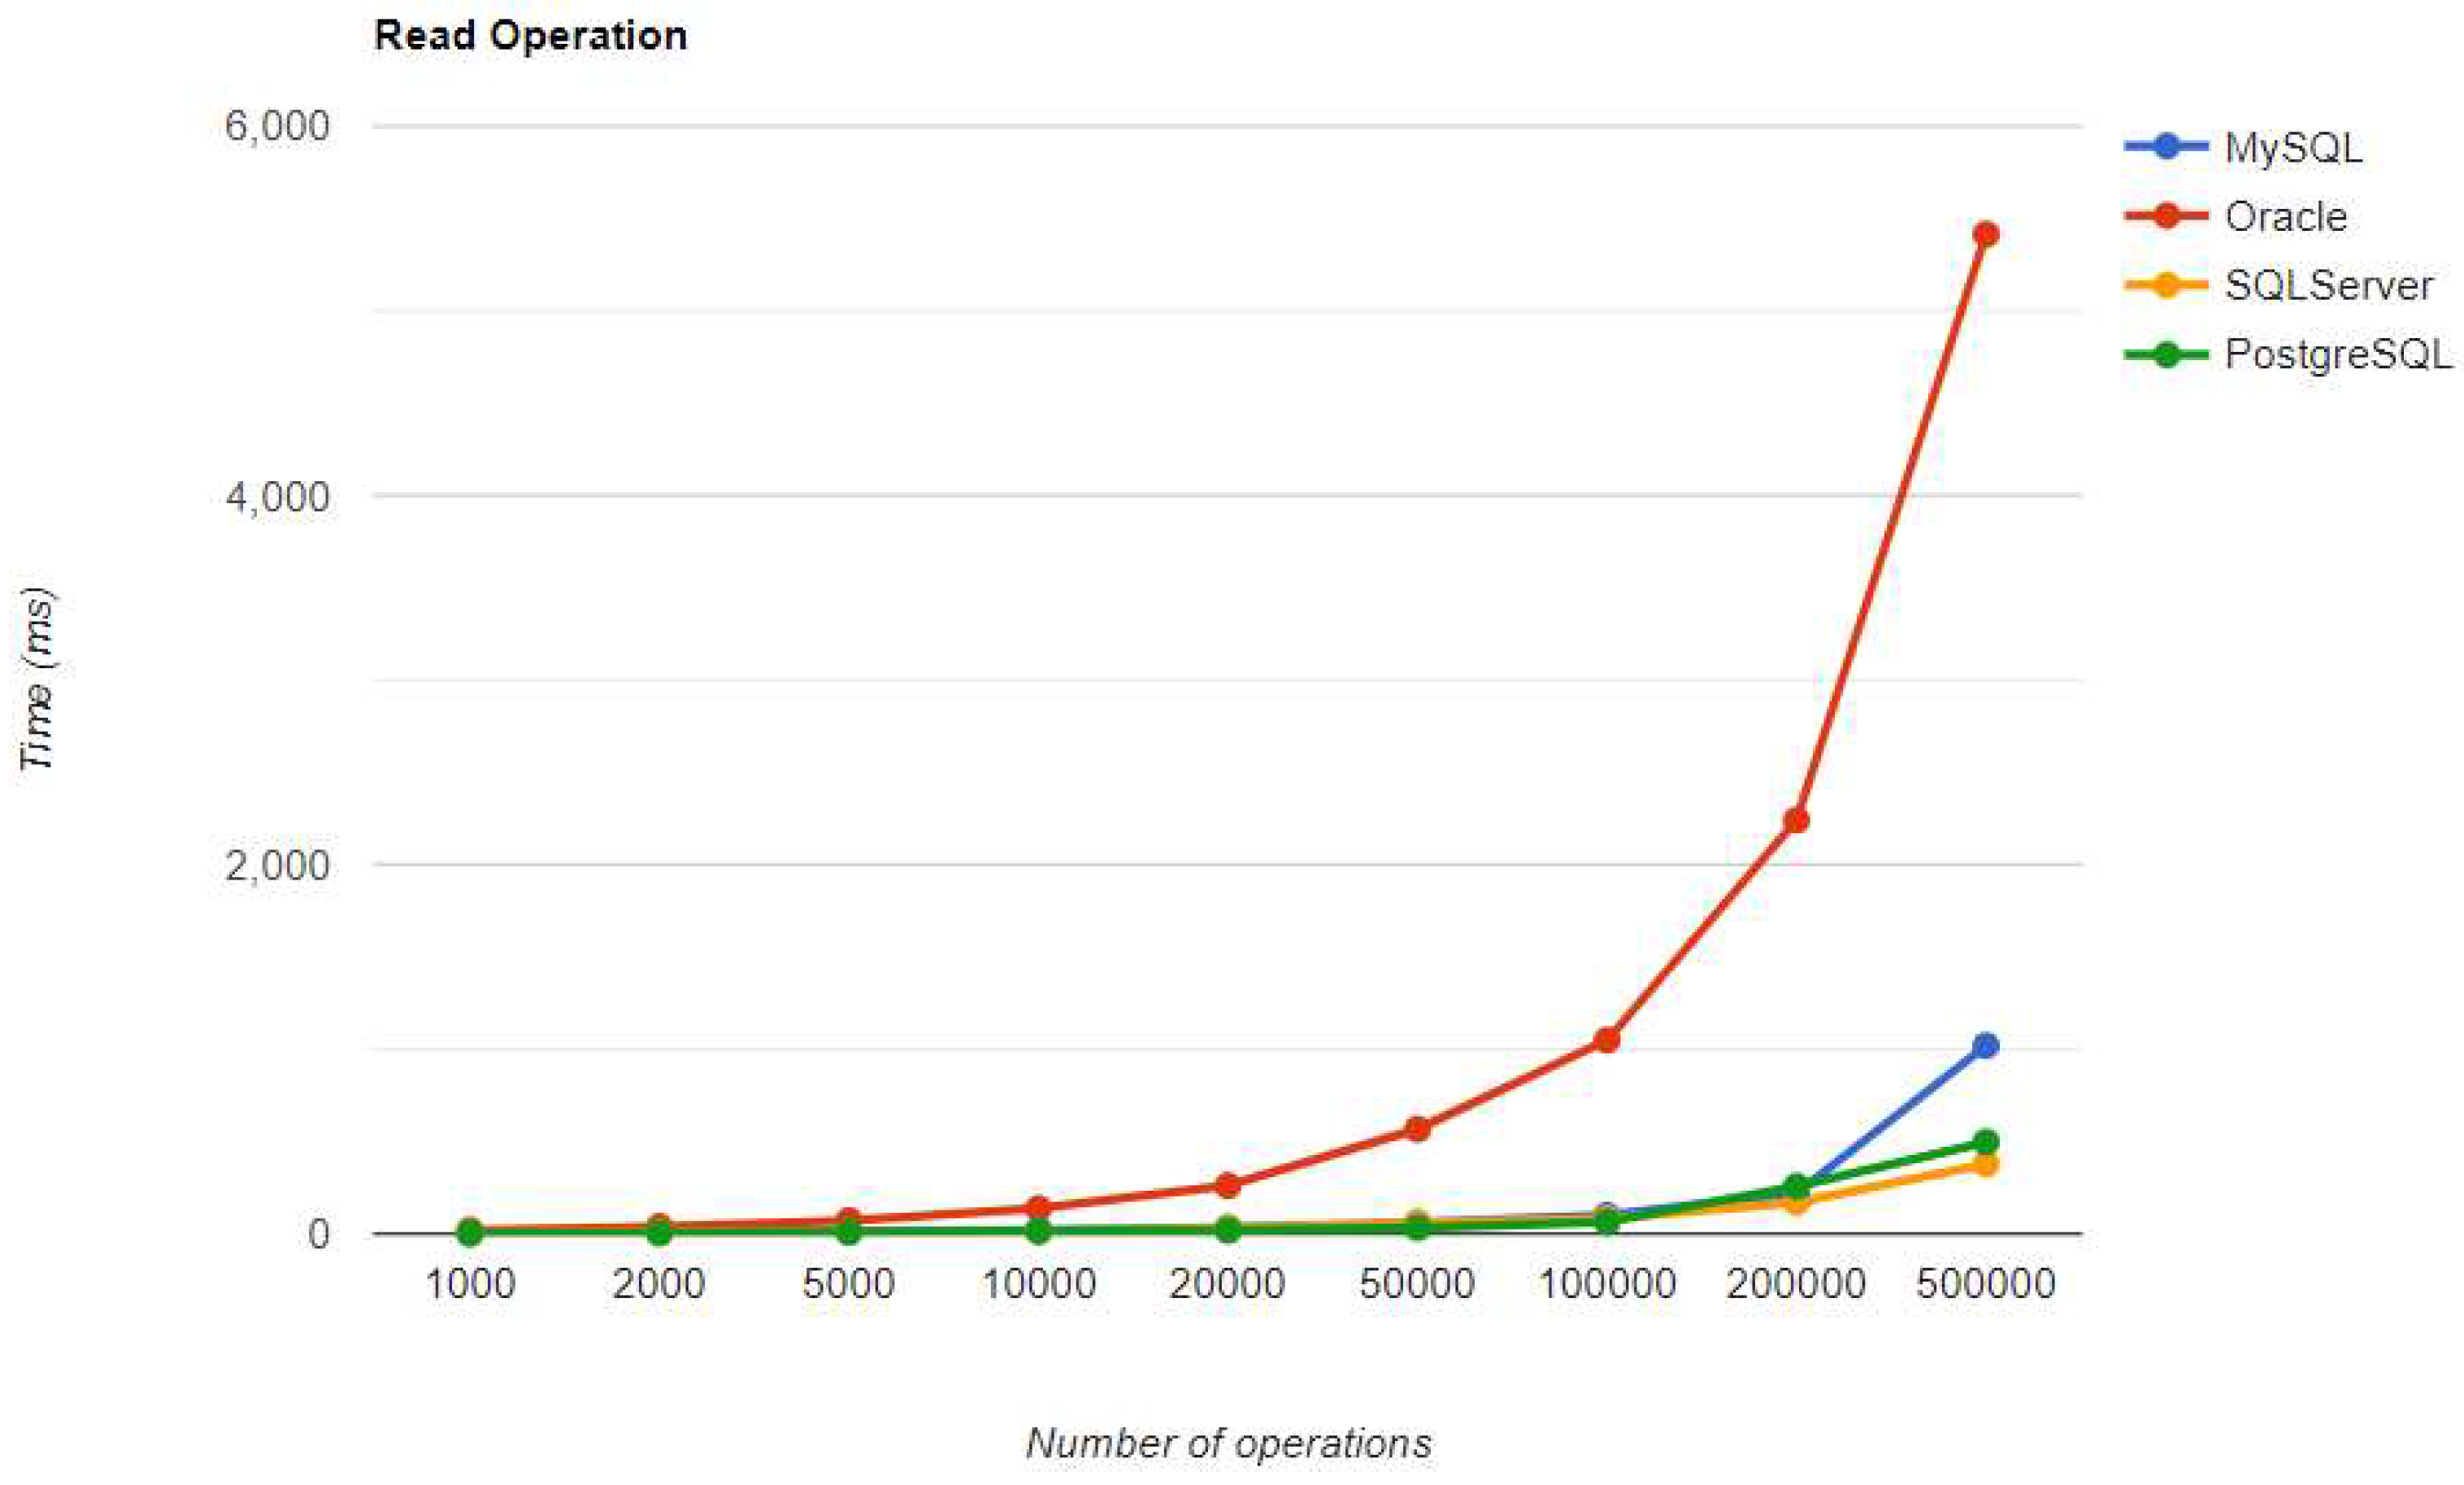
Figure 29.
Update execution times using JPA, after warm-up.
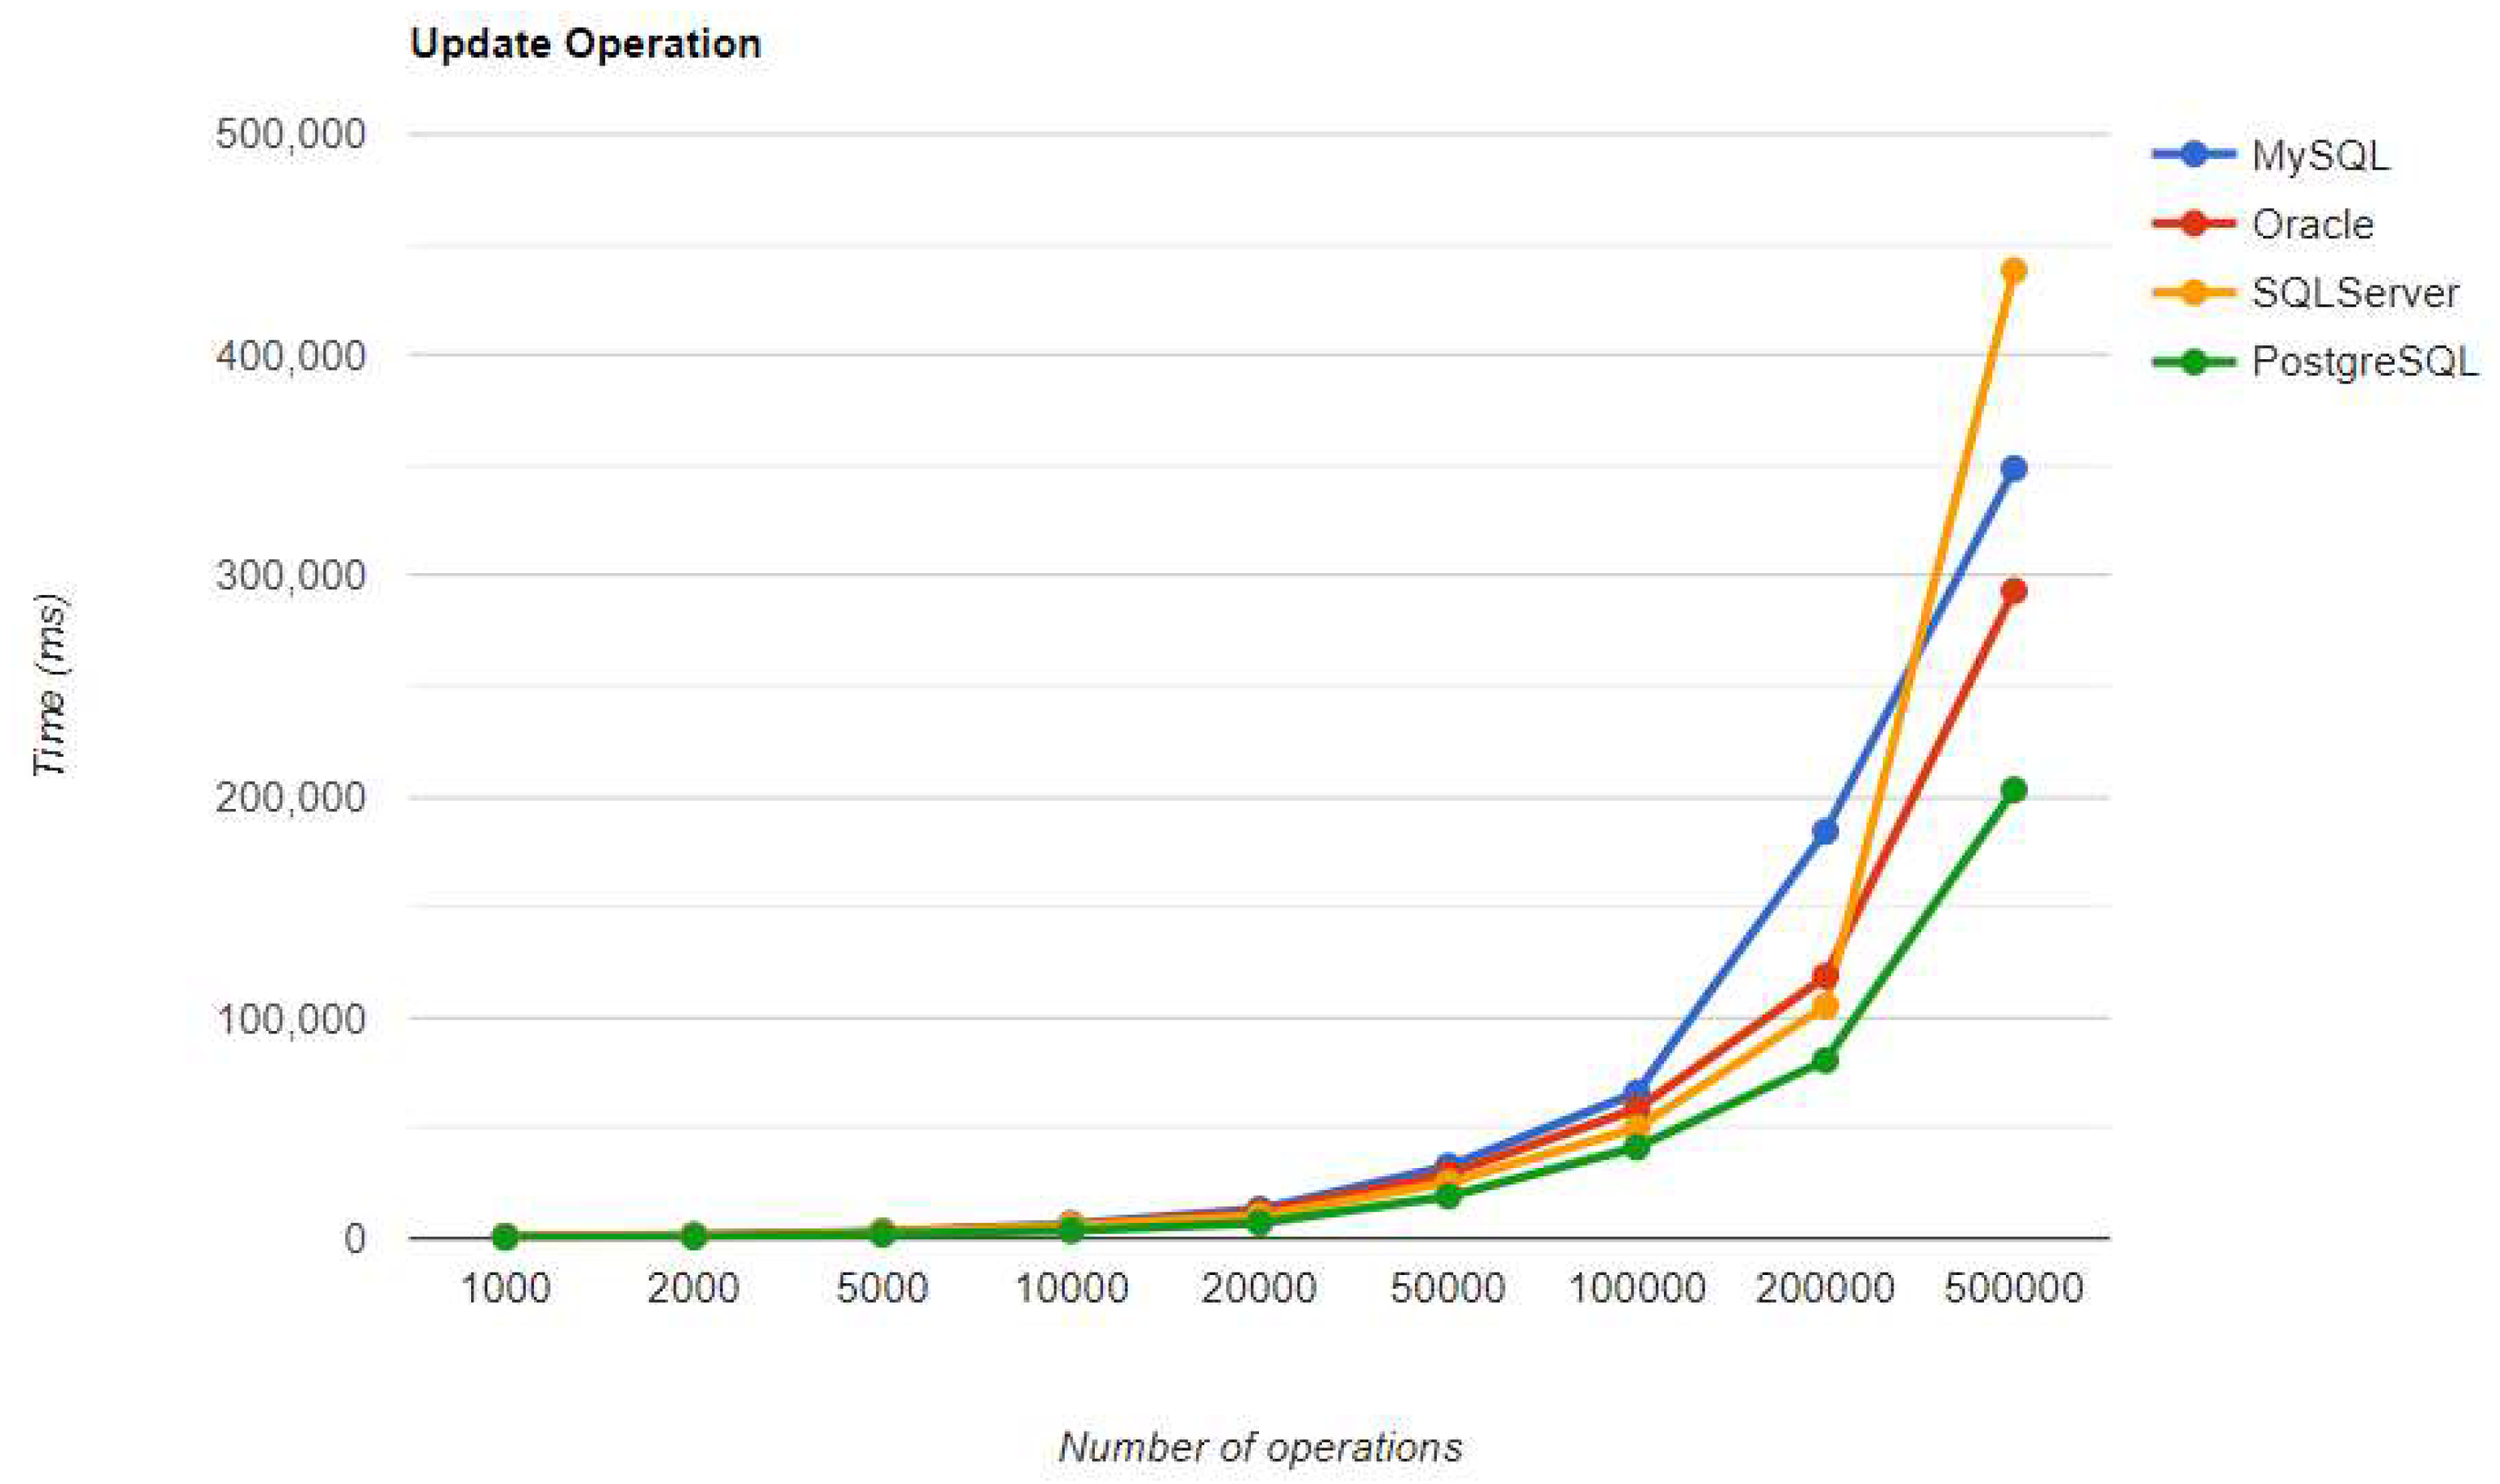
Figure 30.
Delete execution times using JPA, after warm-up.
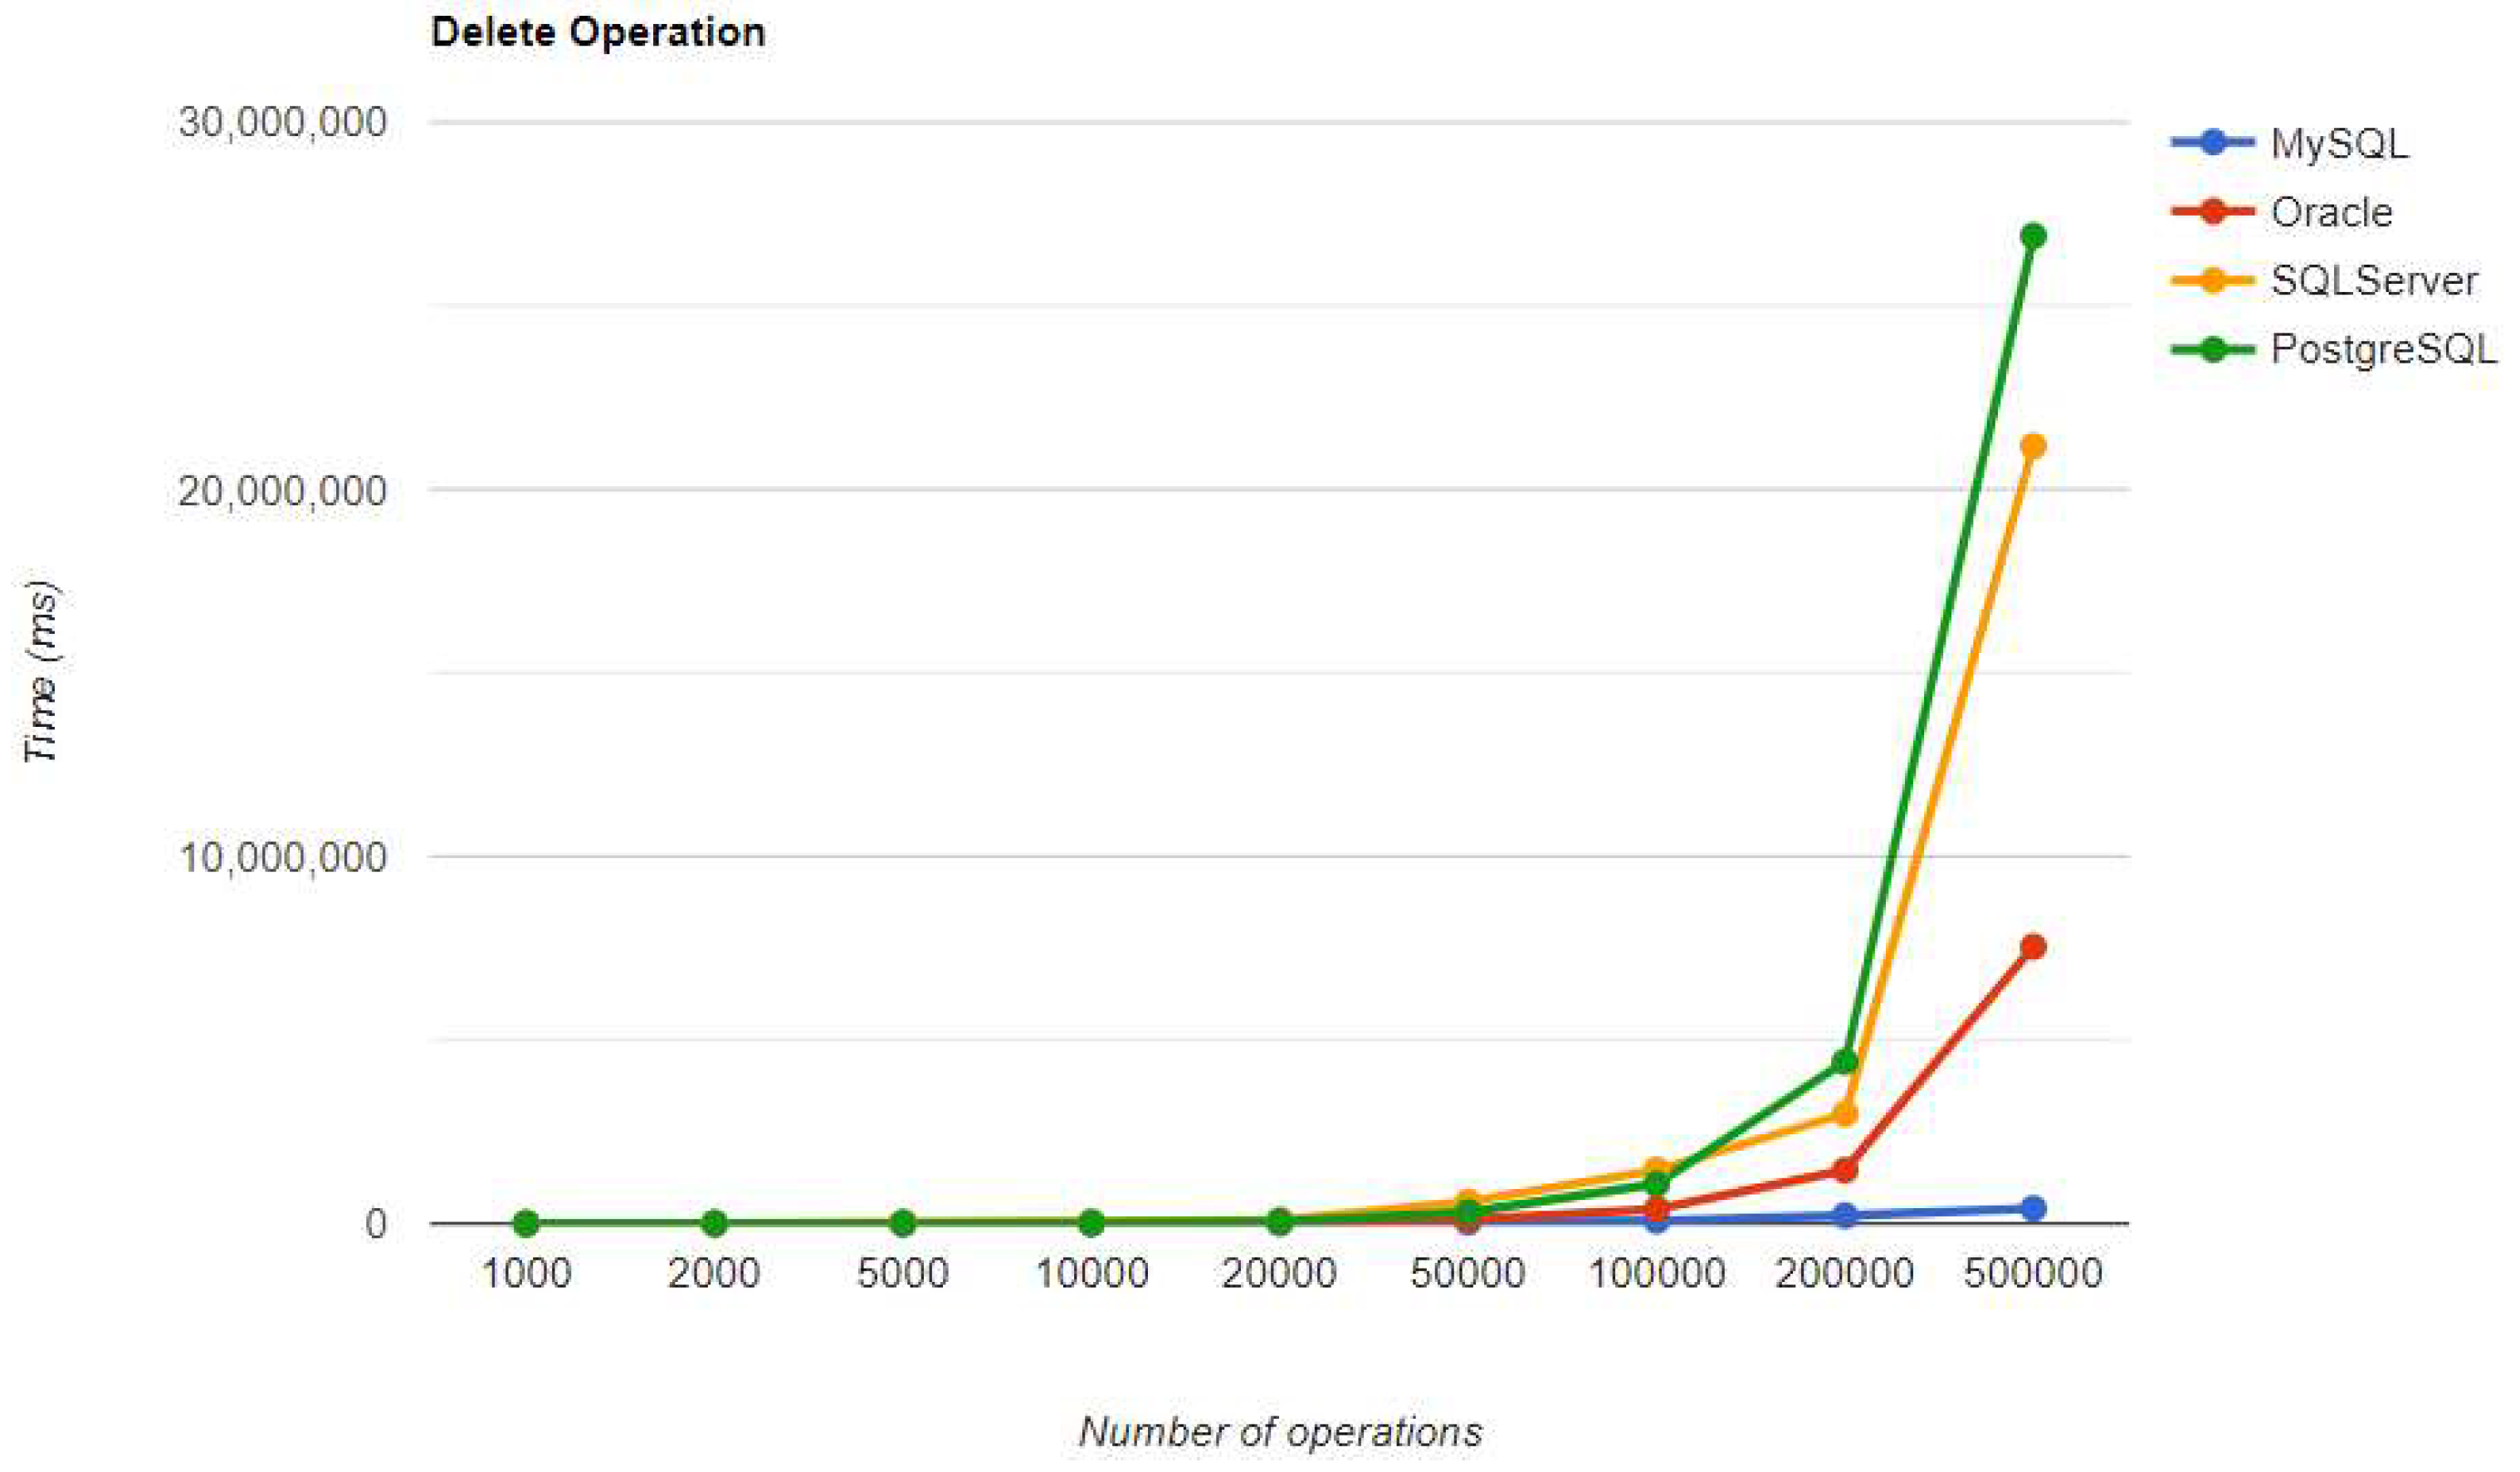
Figure 31.
Create execution times using Hibernate, after warm-up.
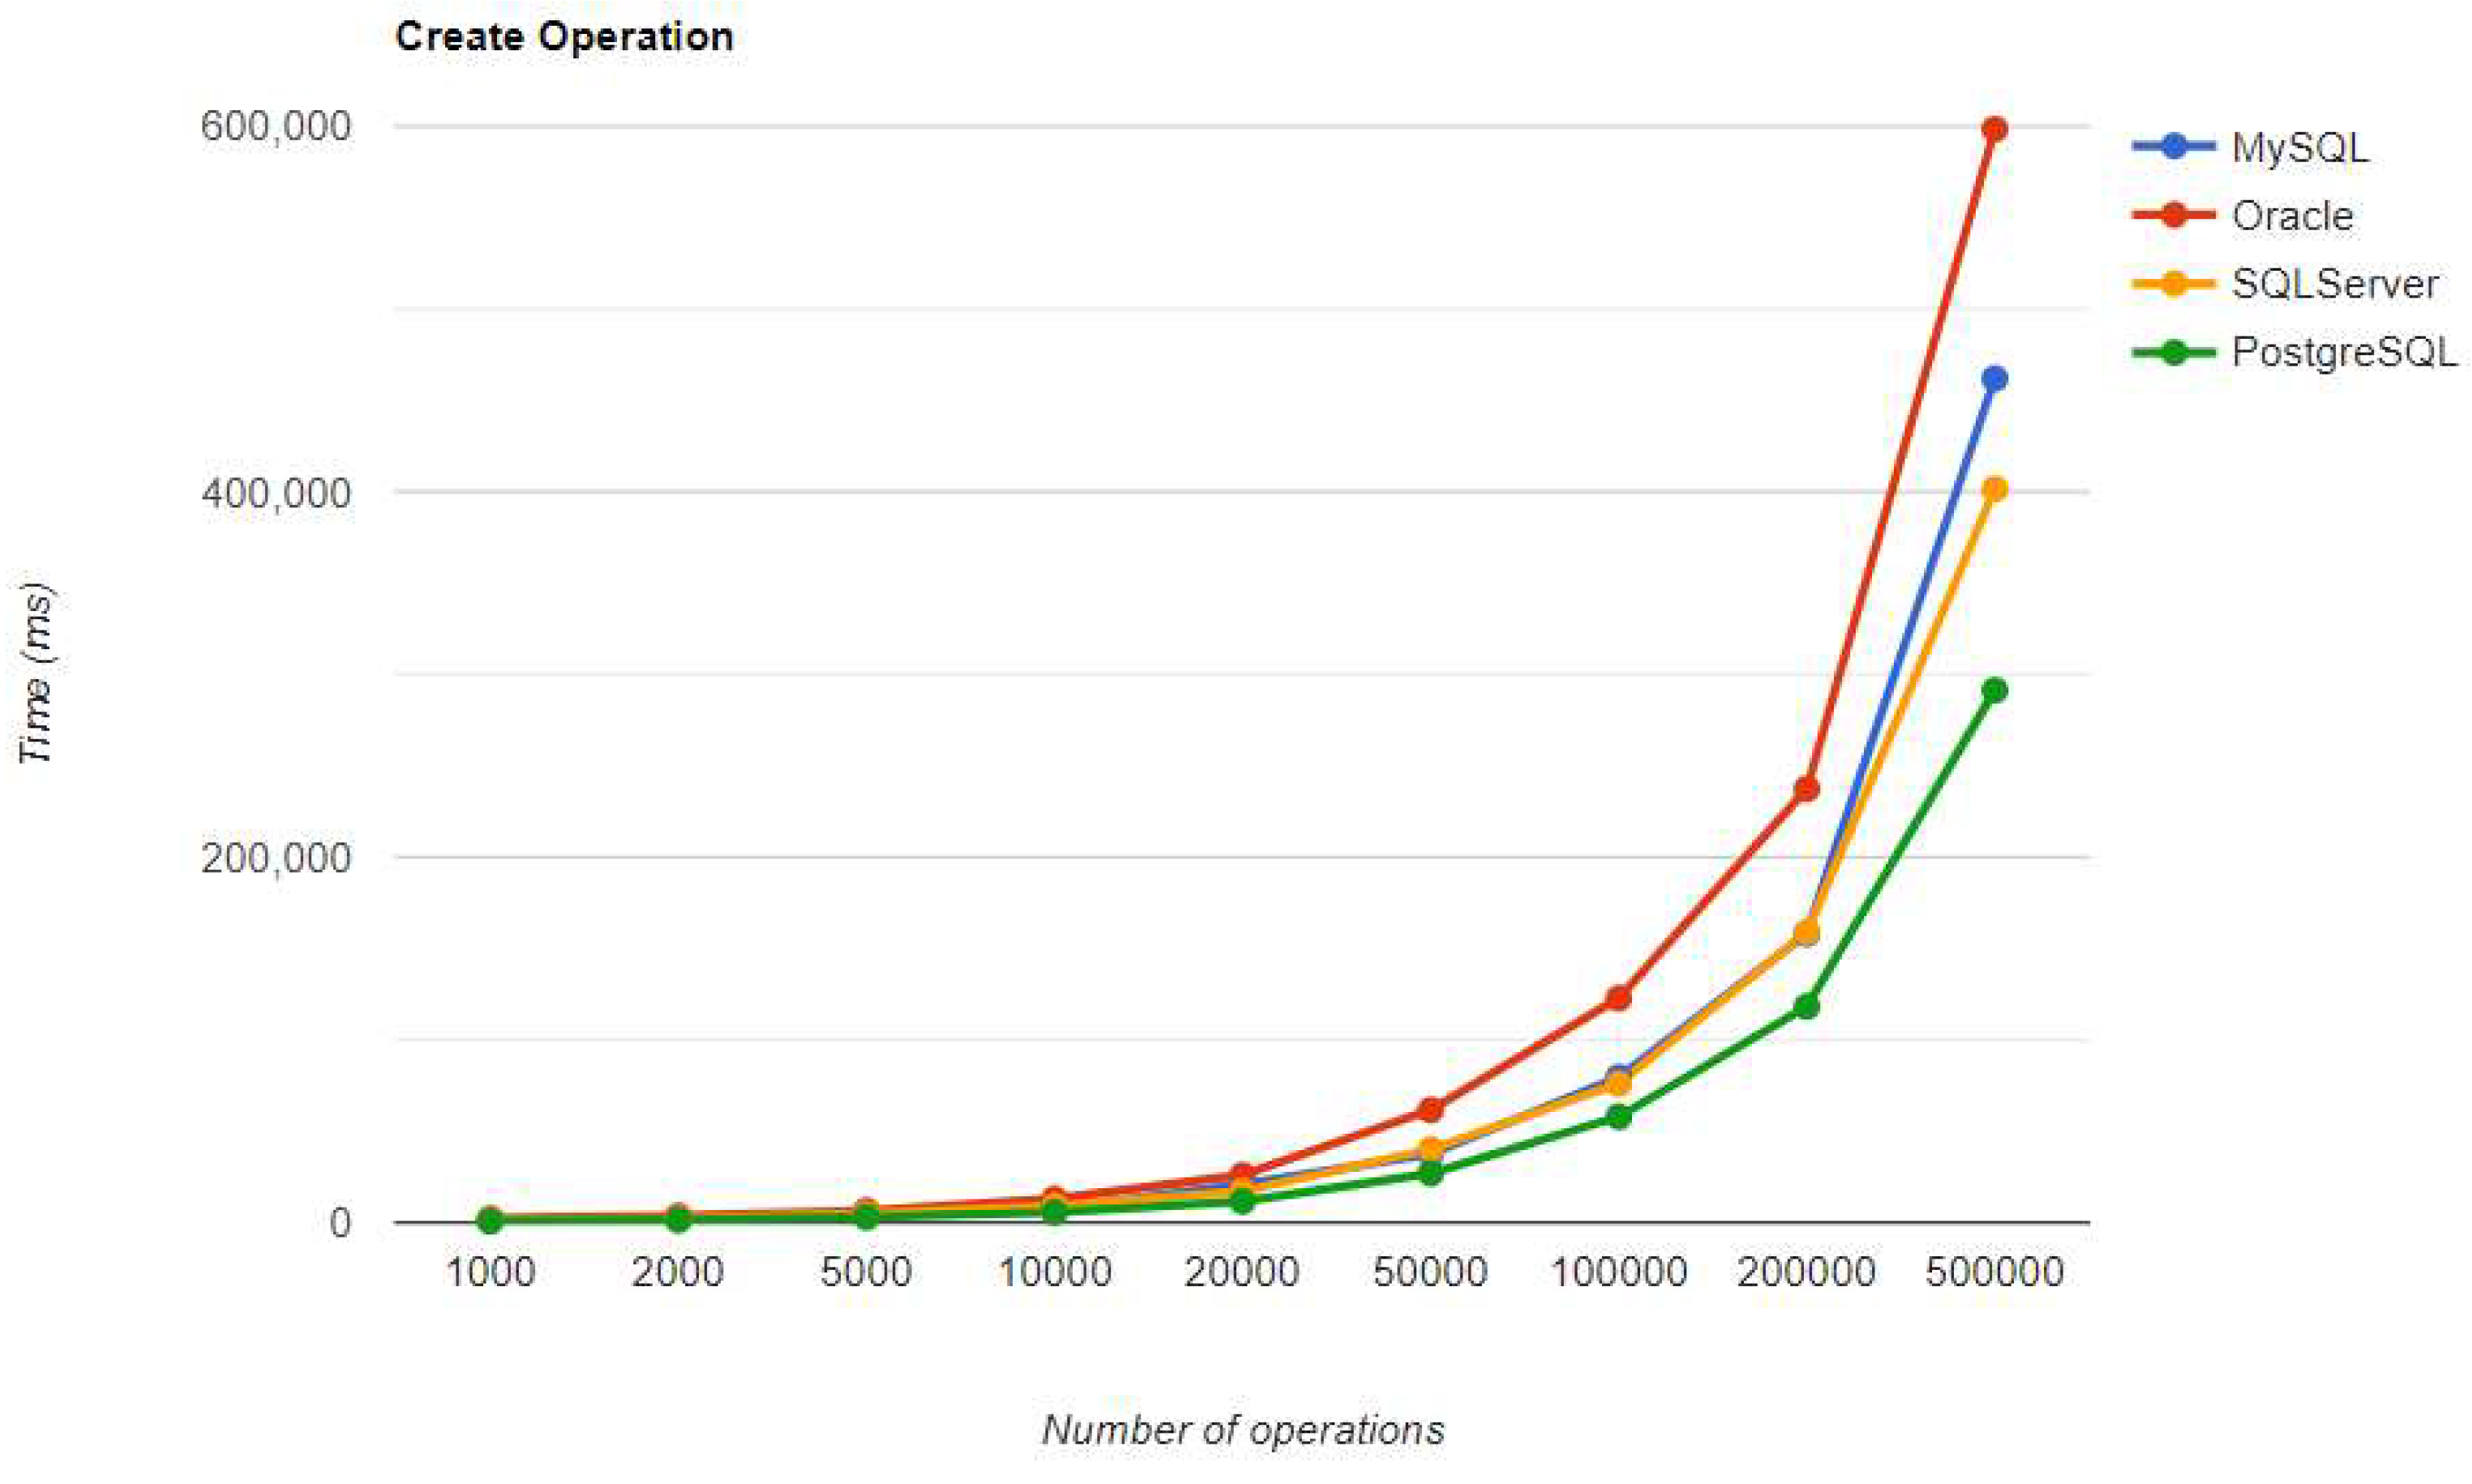
Figure 32.
Read execution times using Hibernate, after warm-up.
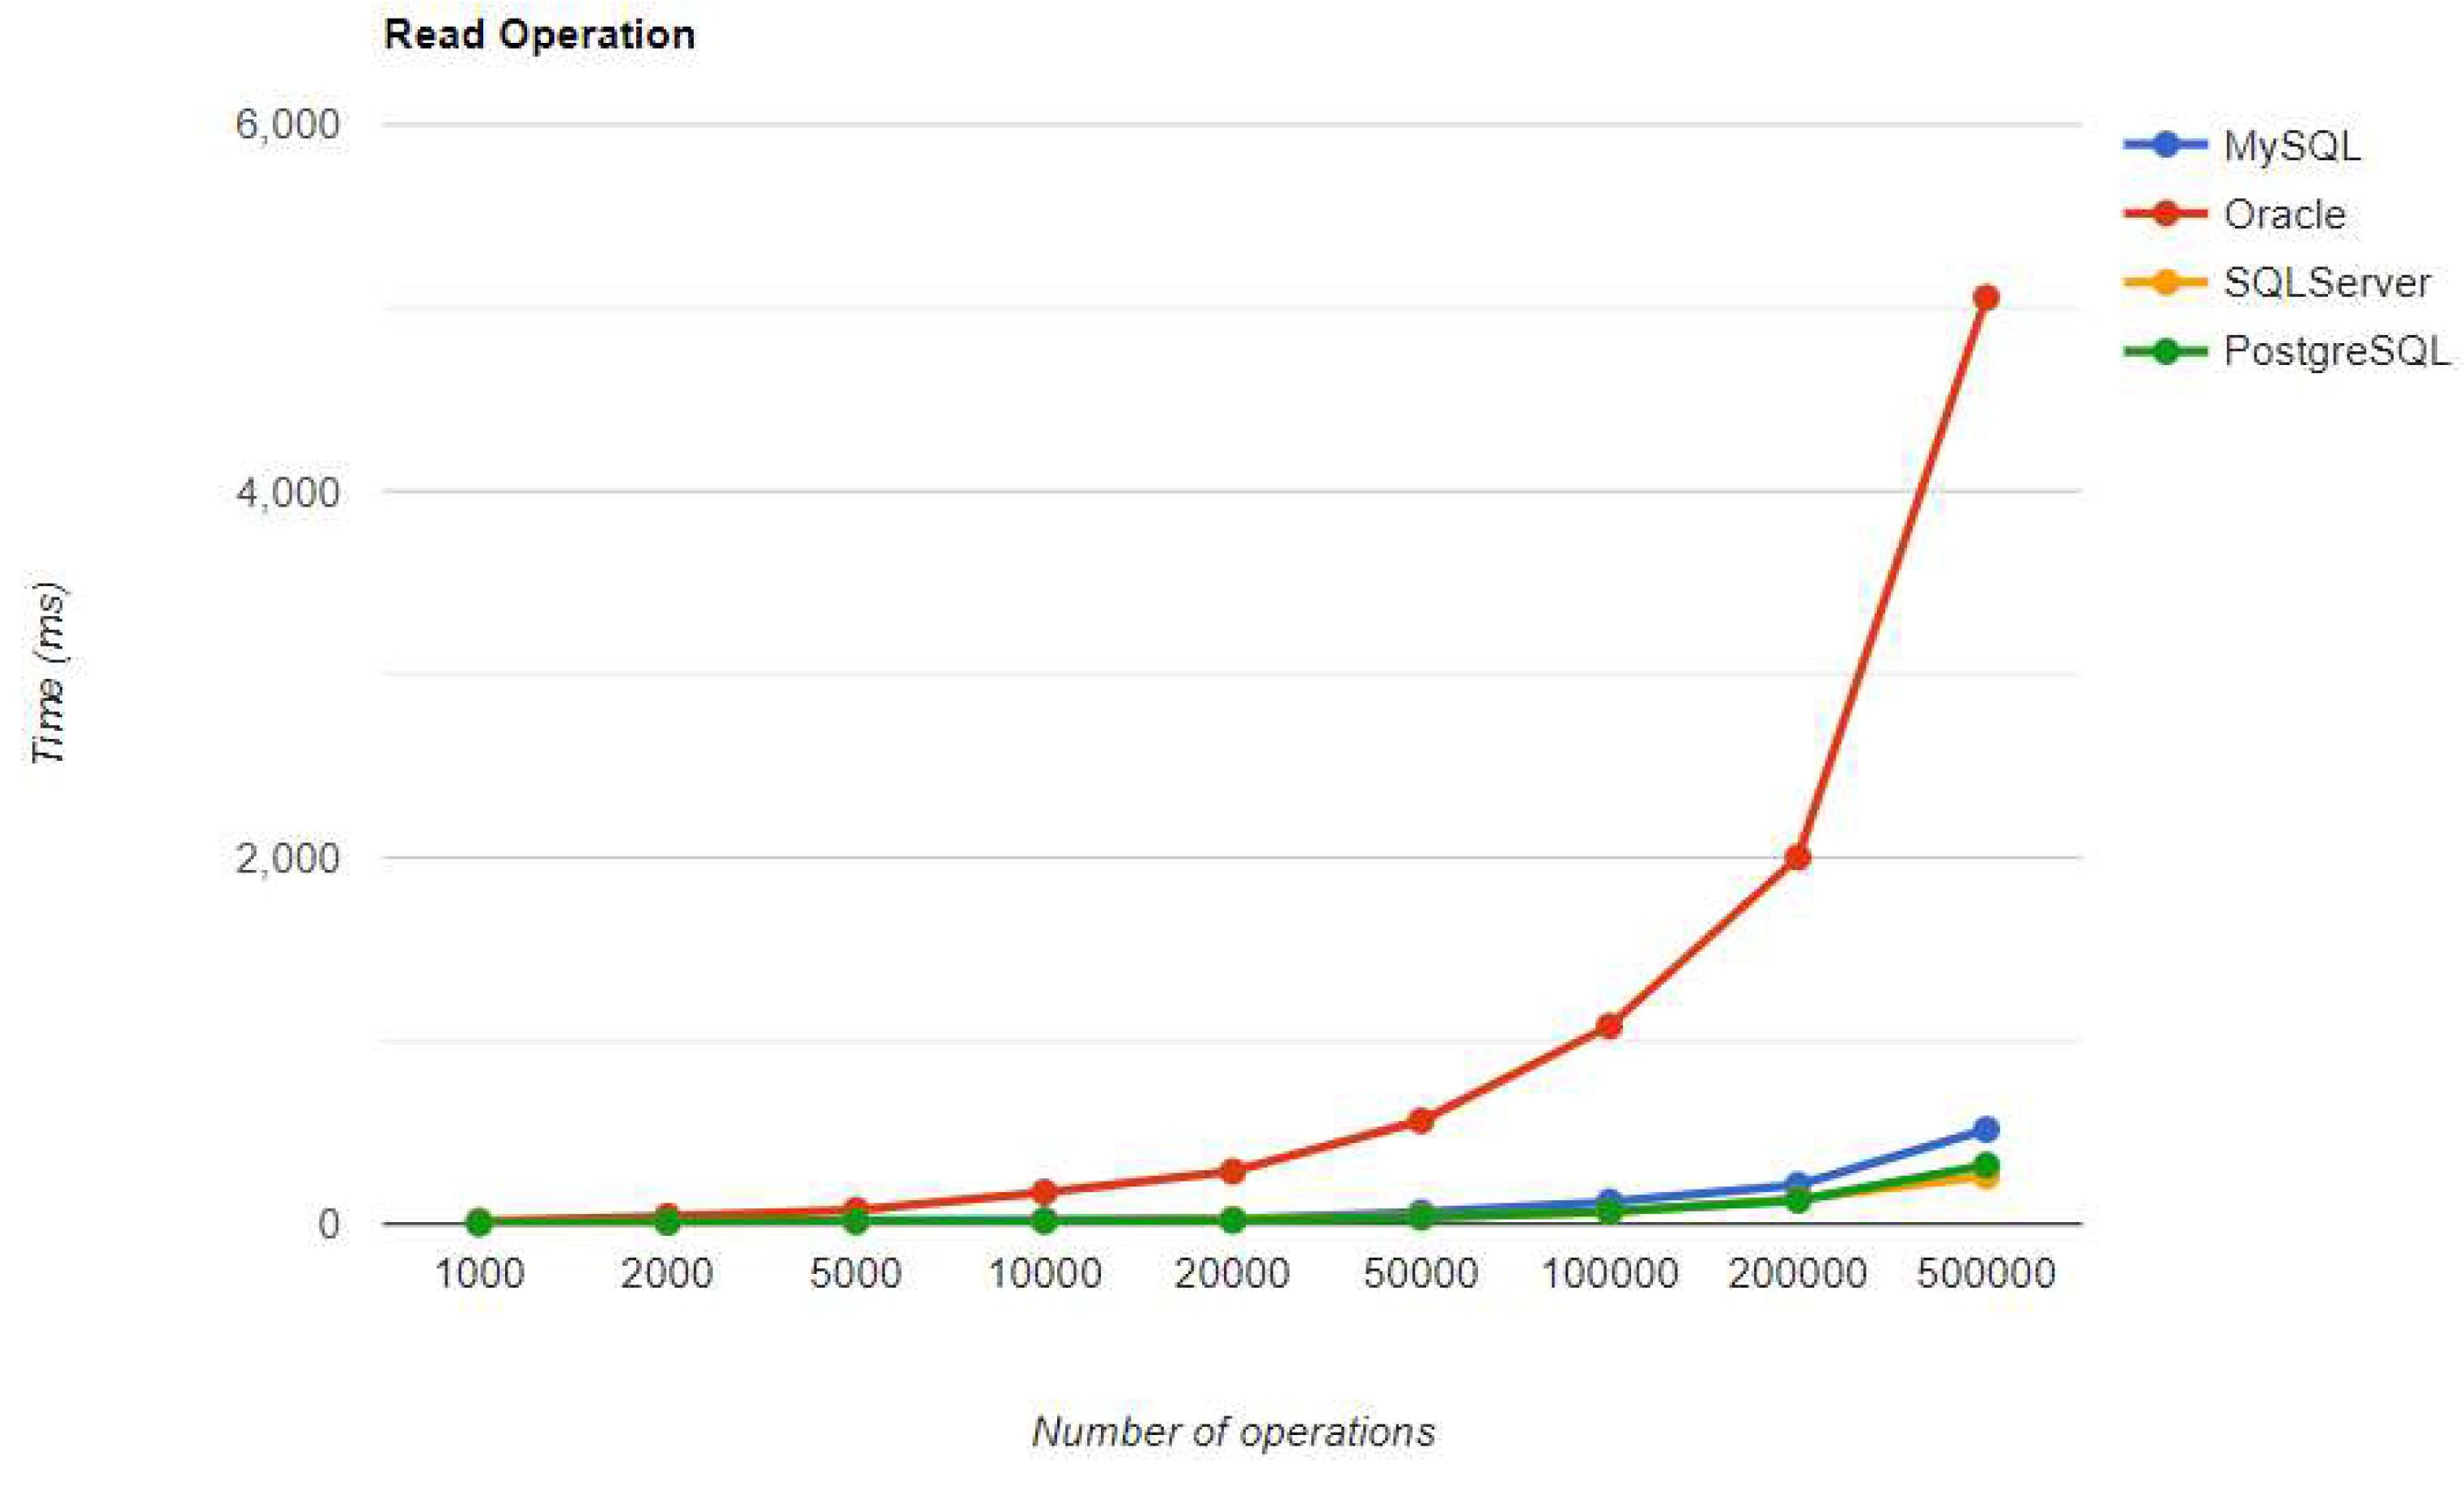
Figure 33.
Update execution times using Hibernate, after warm-up.
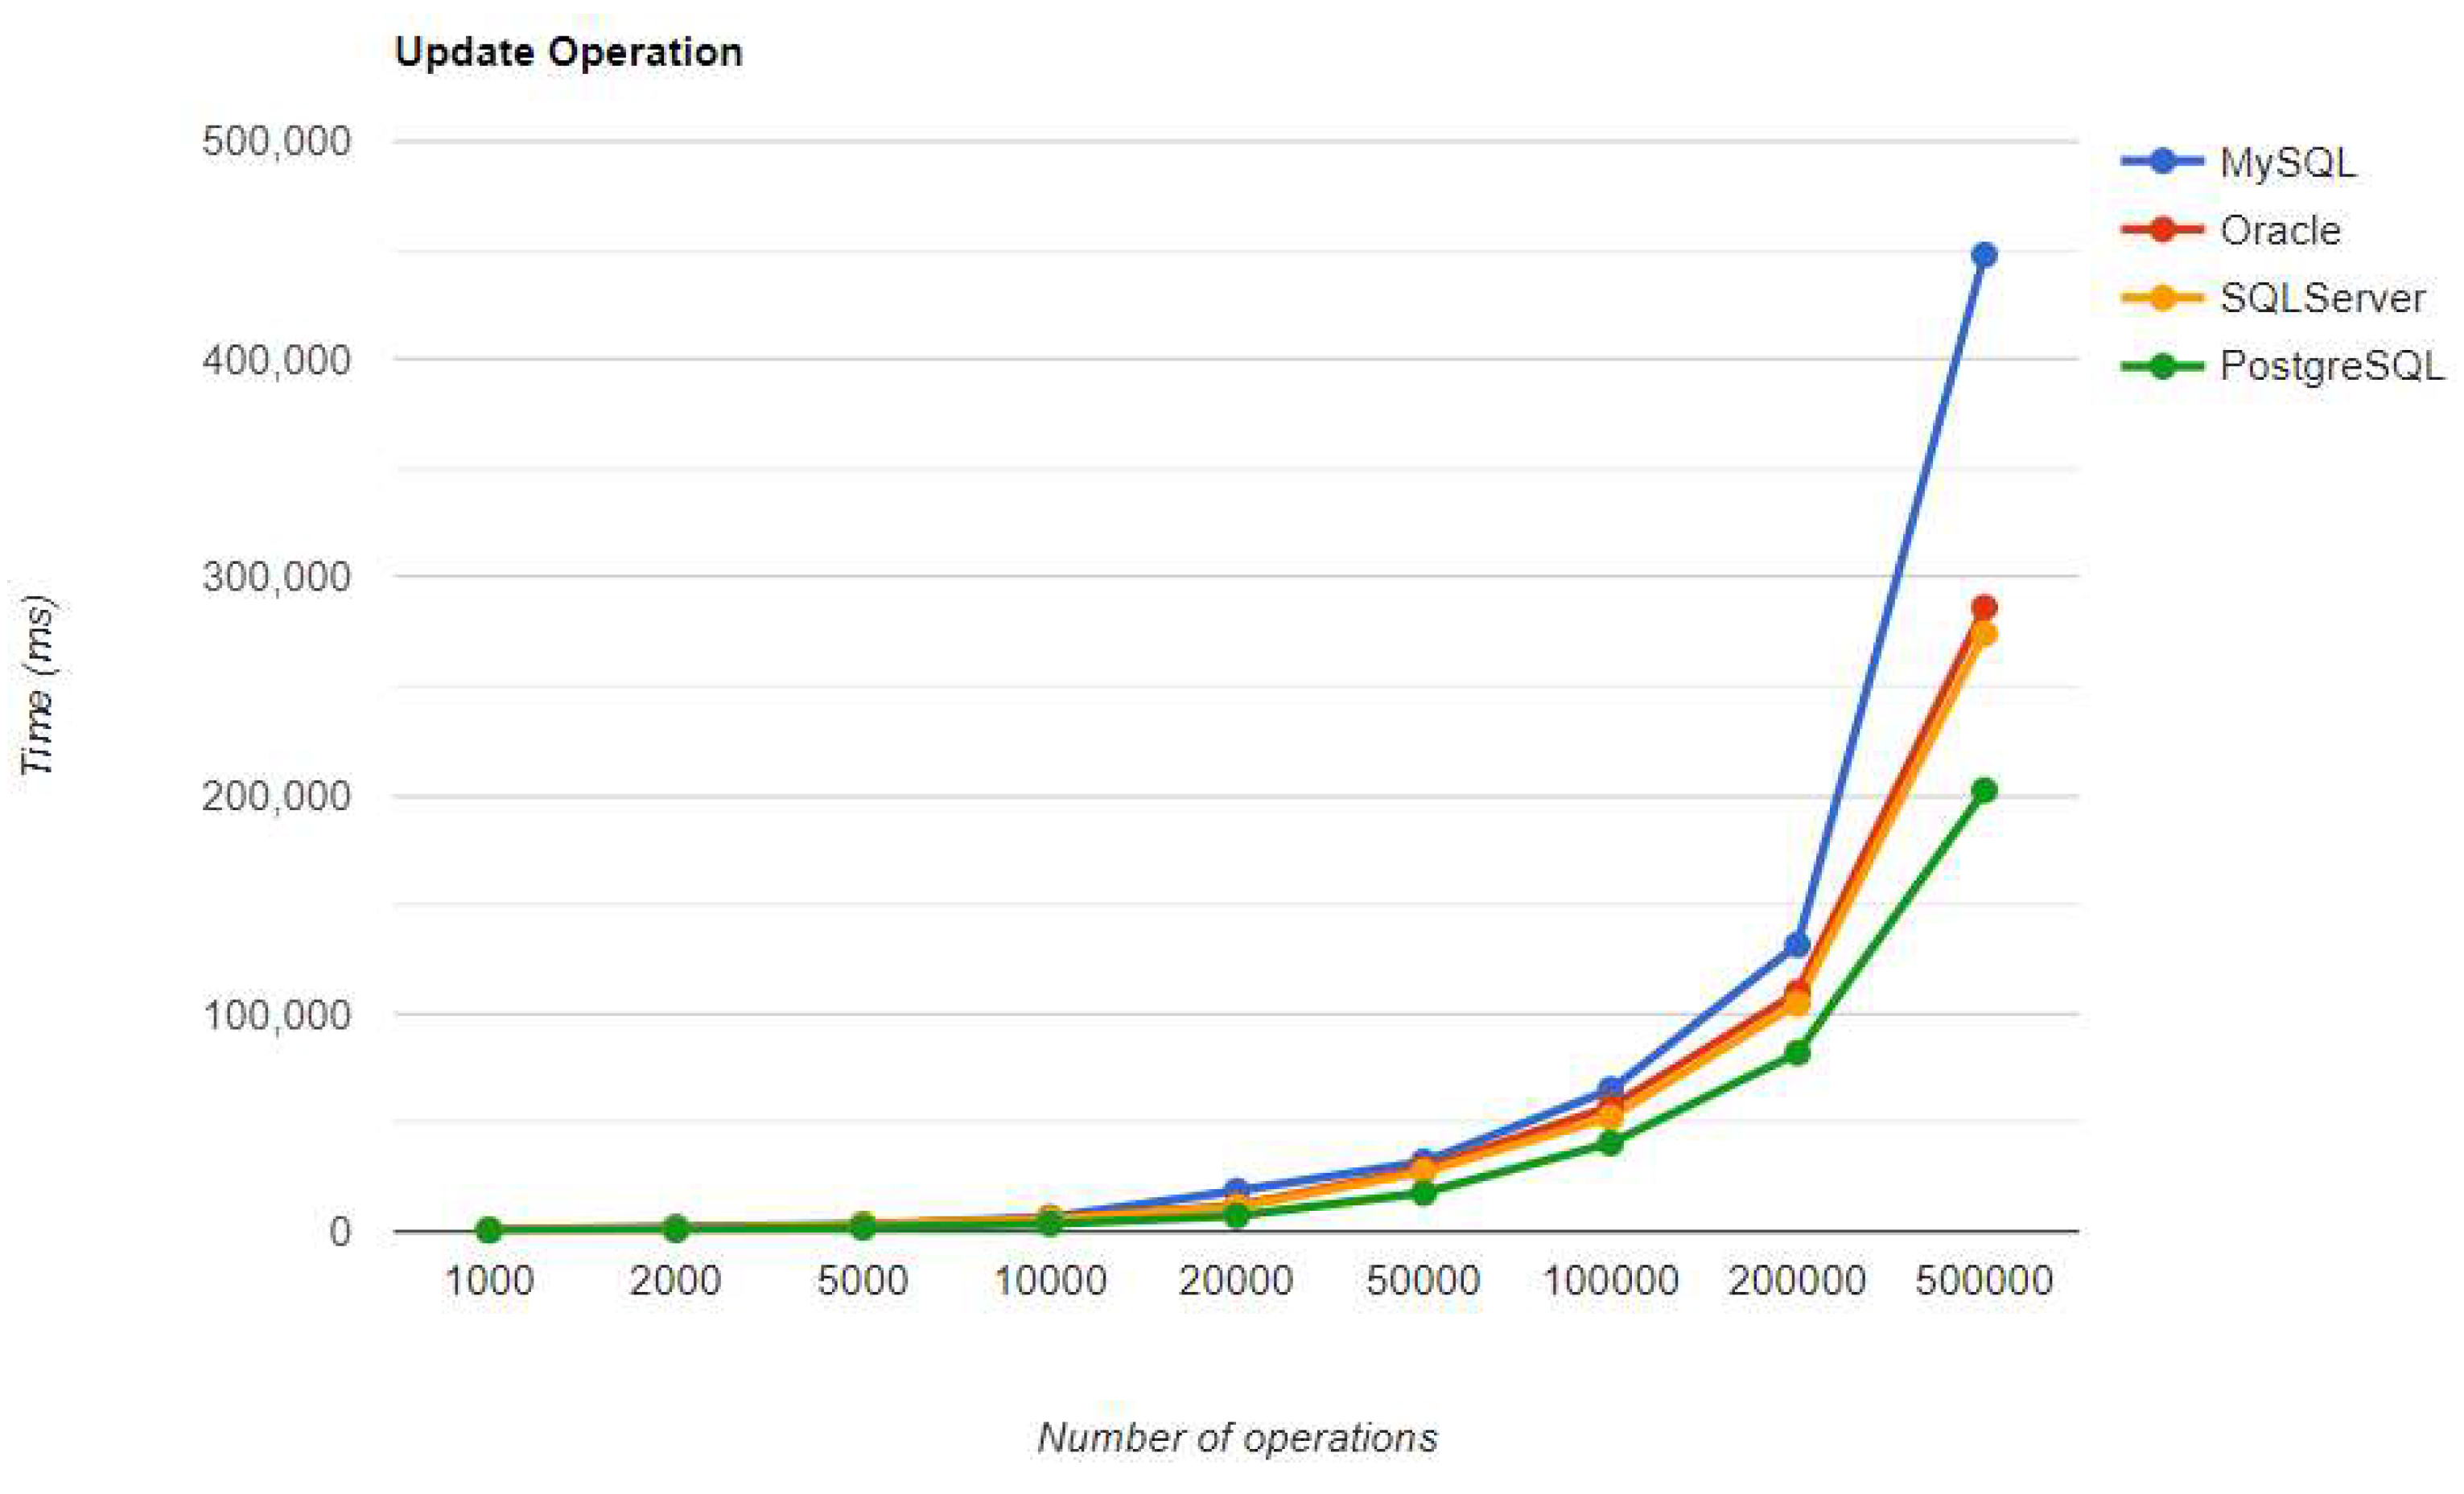
Figure 34.
Delete execution times using Hibernate, after warm-up.
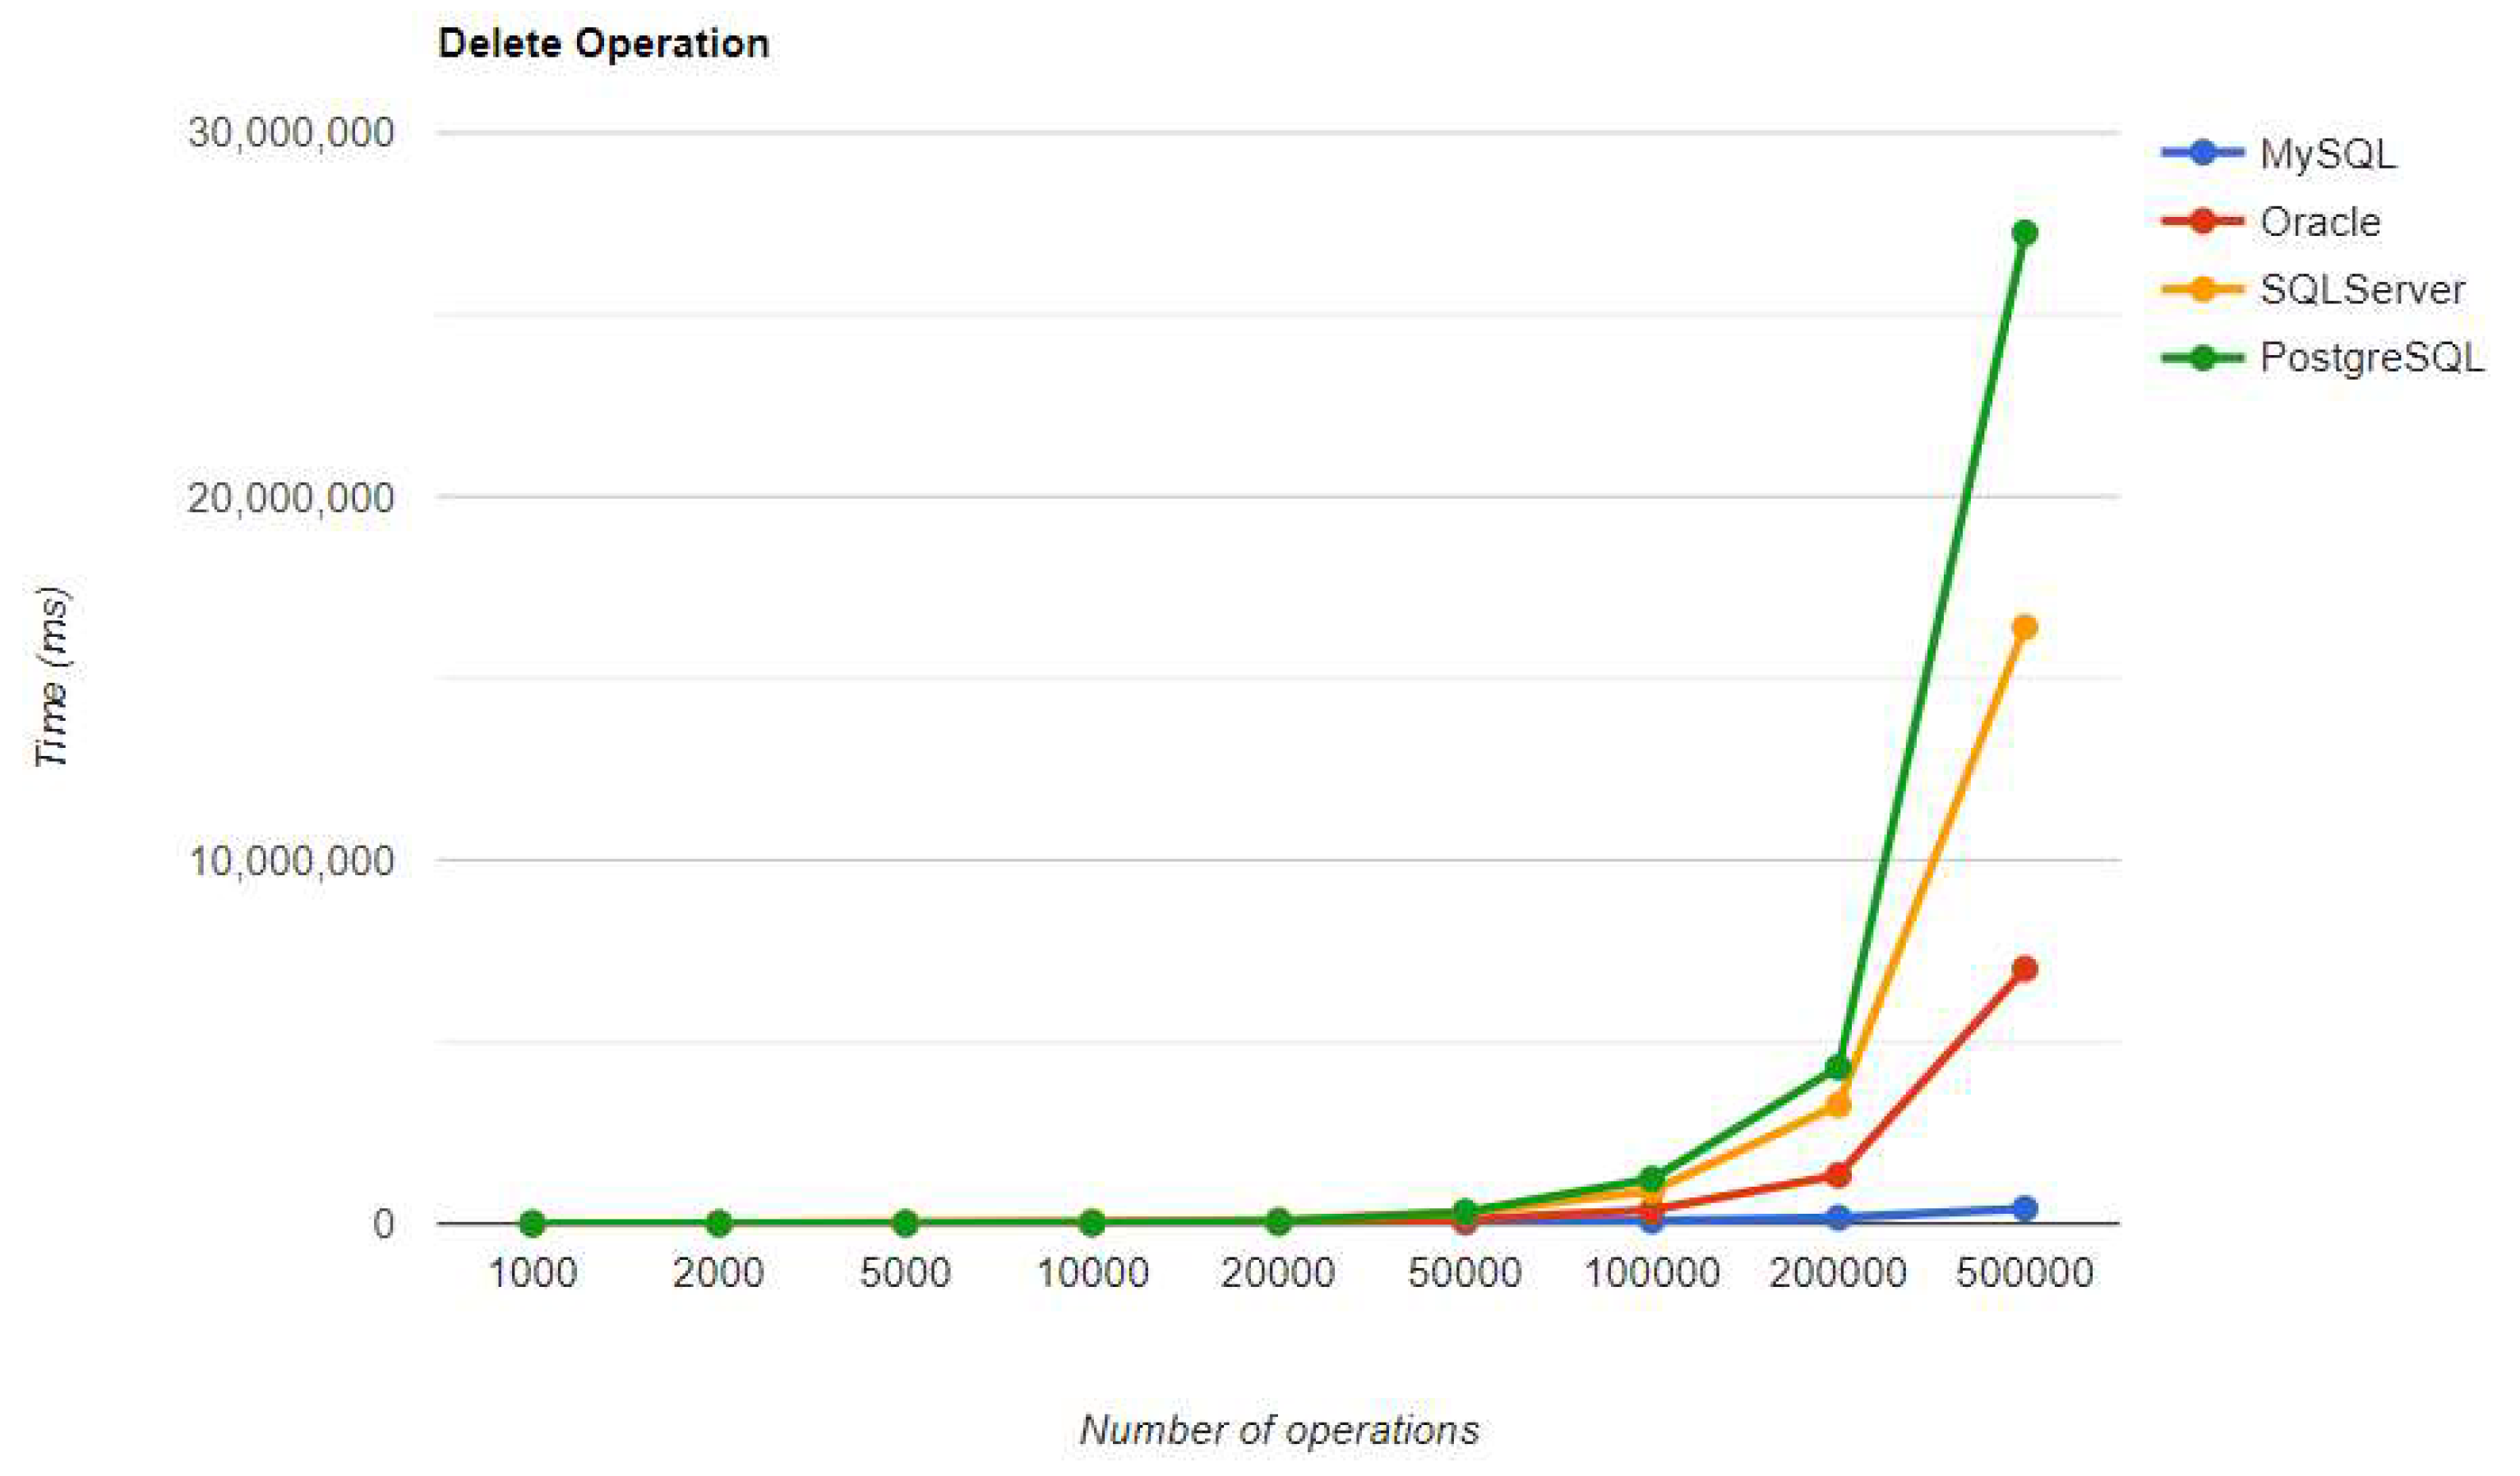
Figure 35.
Create execution times using Spring Data JPA, after warm-up.
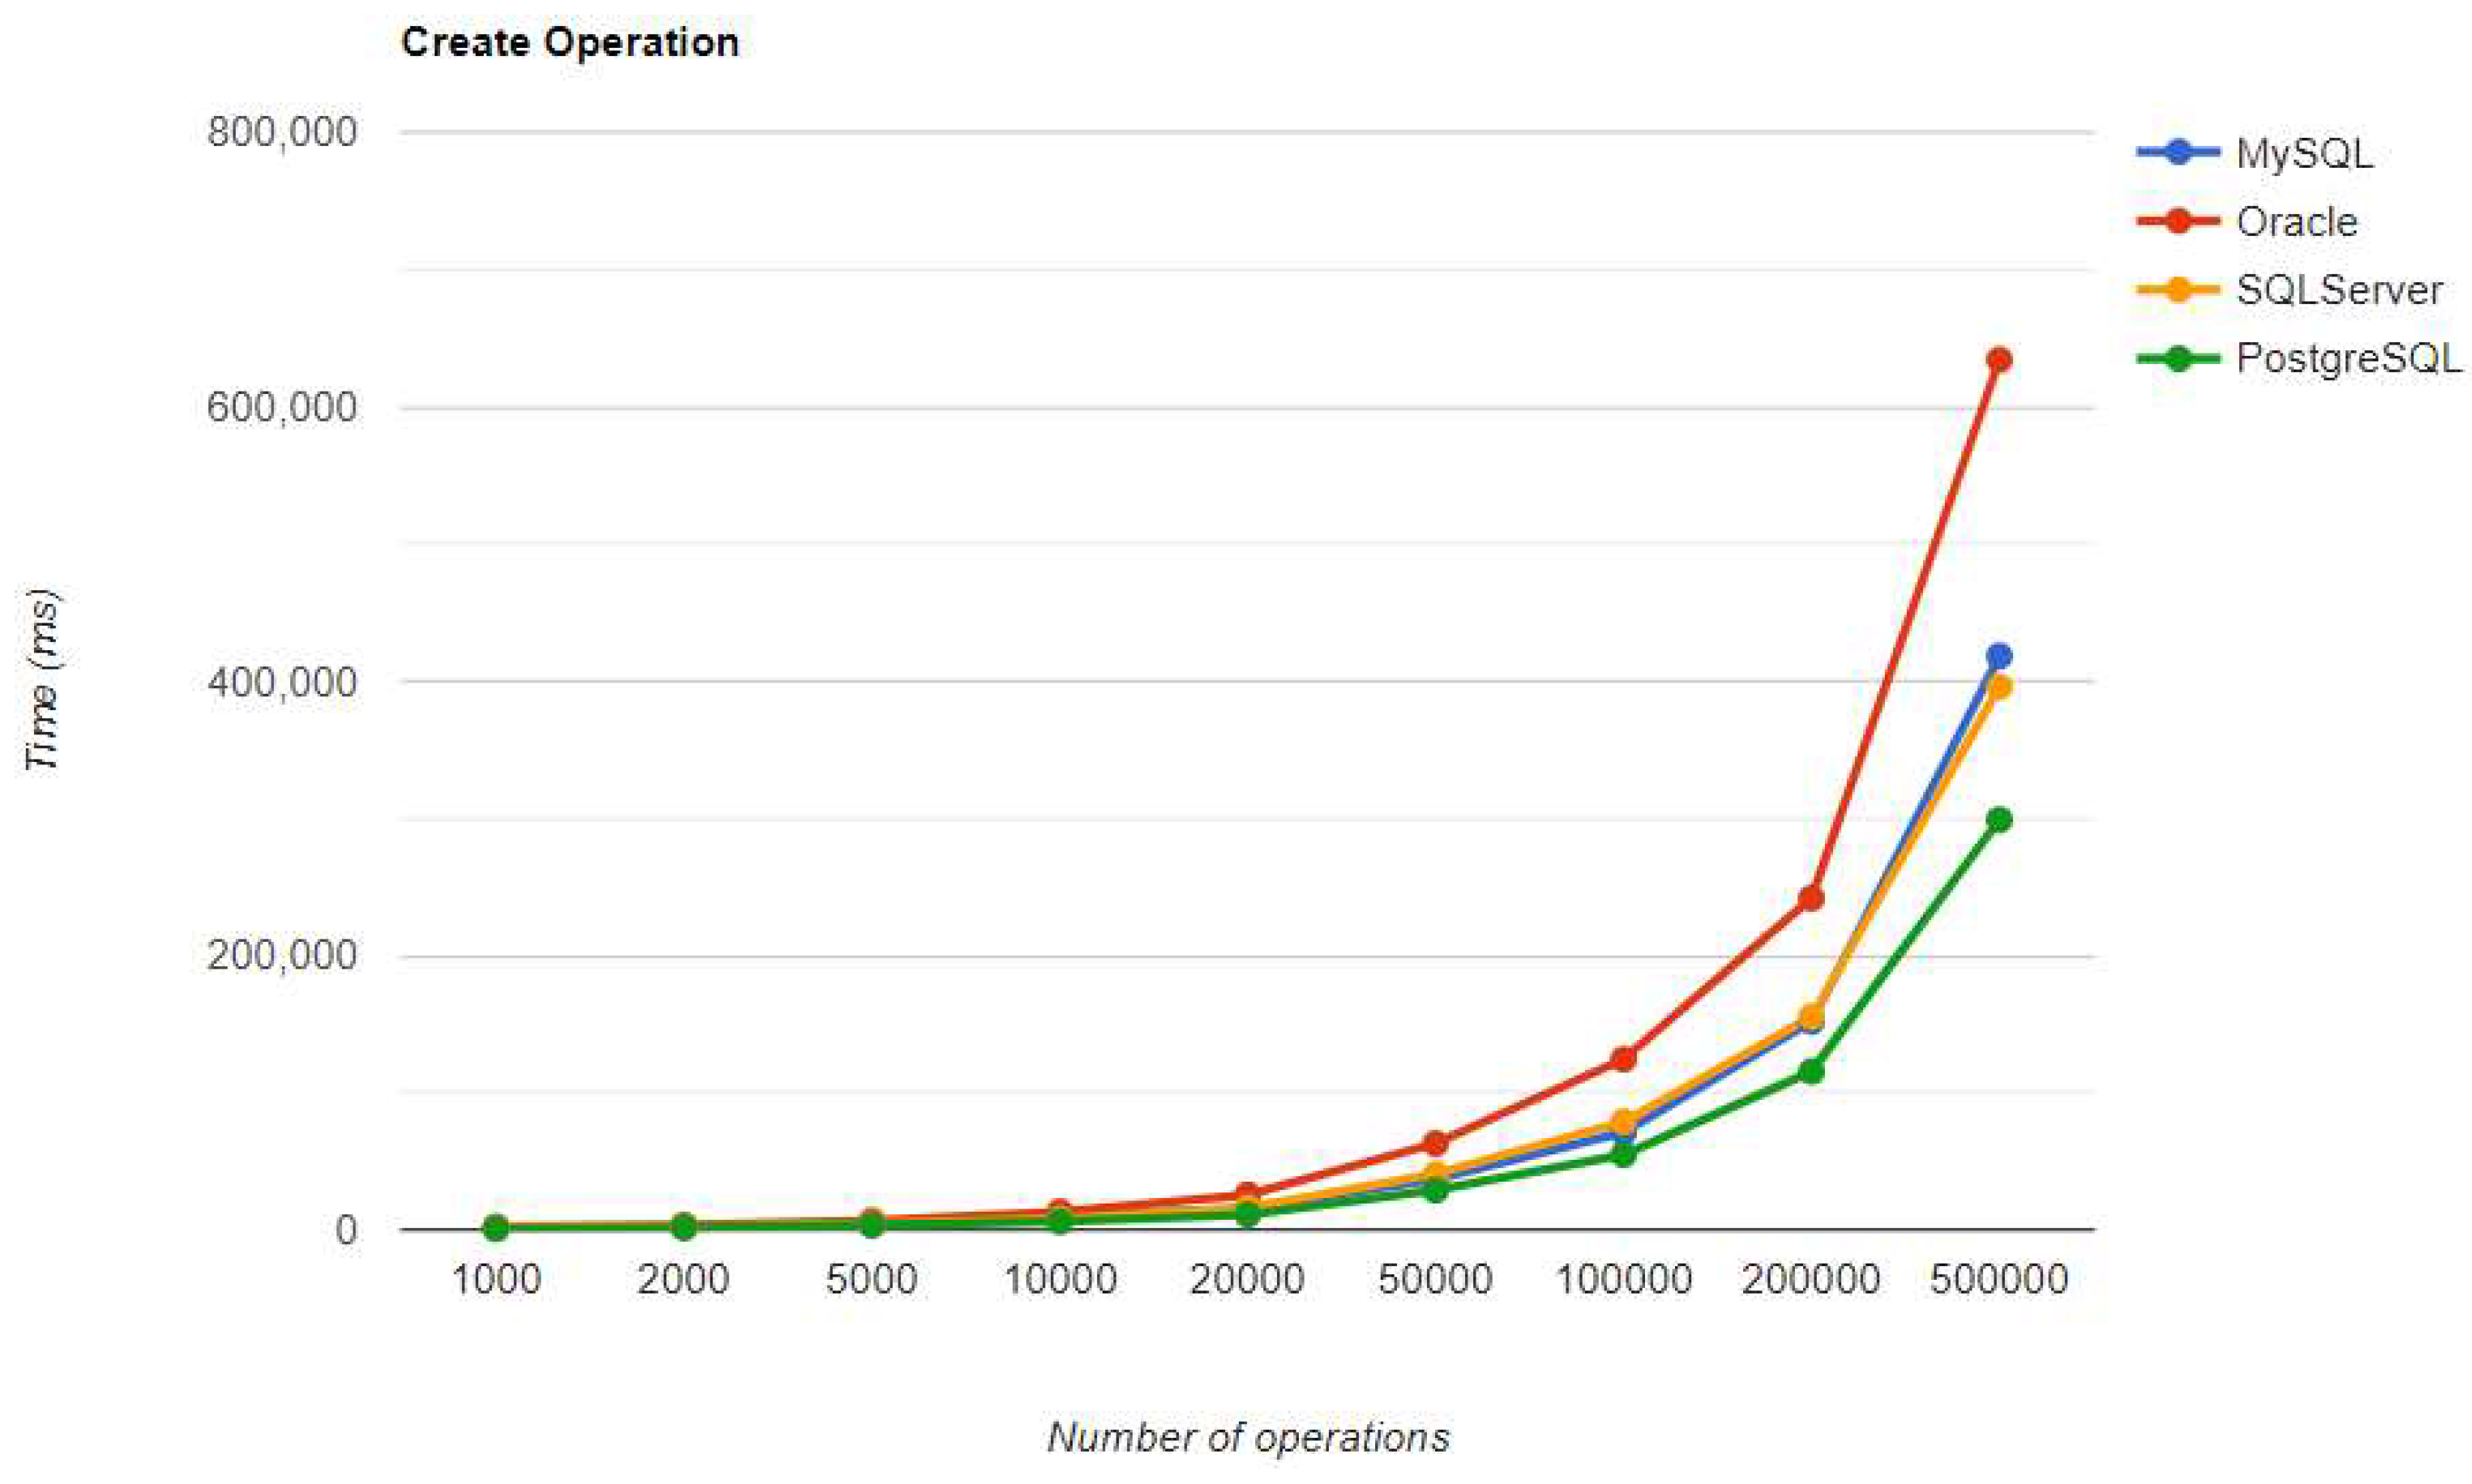
Figure 36.
Read execution times using Spring Data JPA, after warm-up.
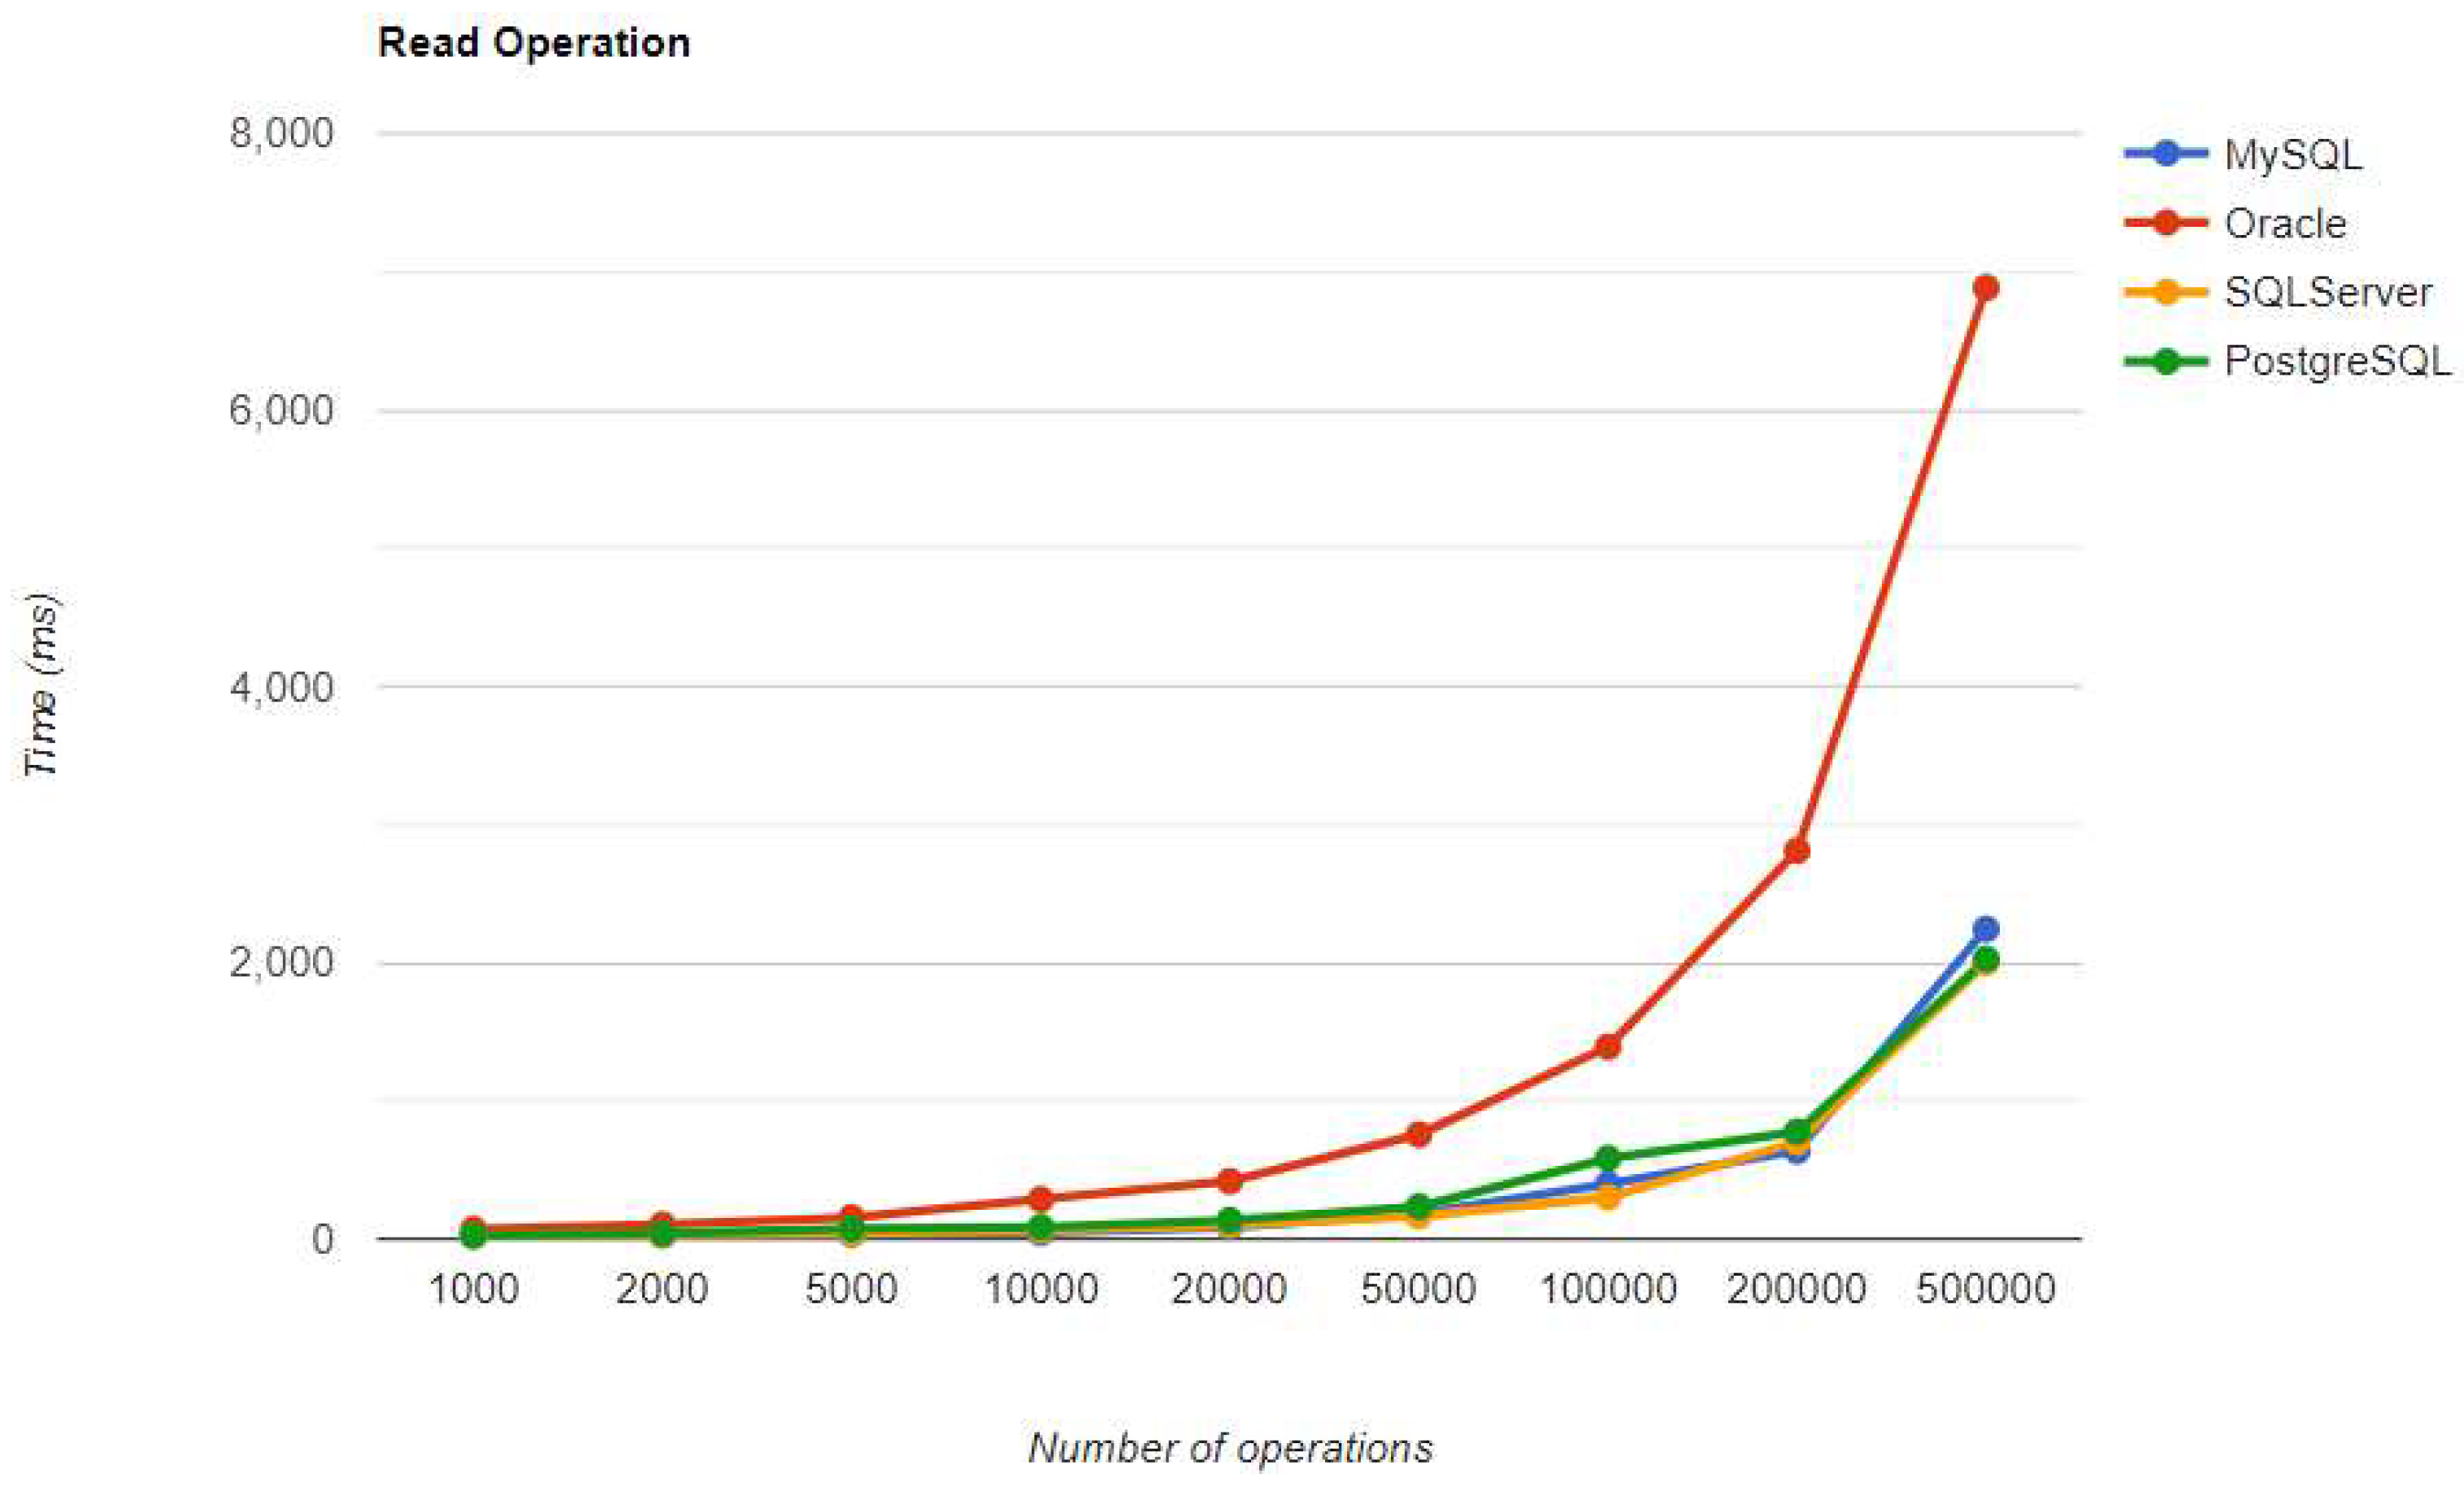
Figure 37.
Update execution times using Spring Data JPA, after warm-up.
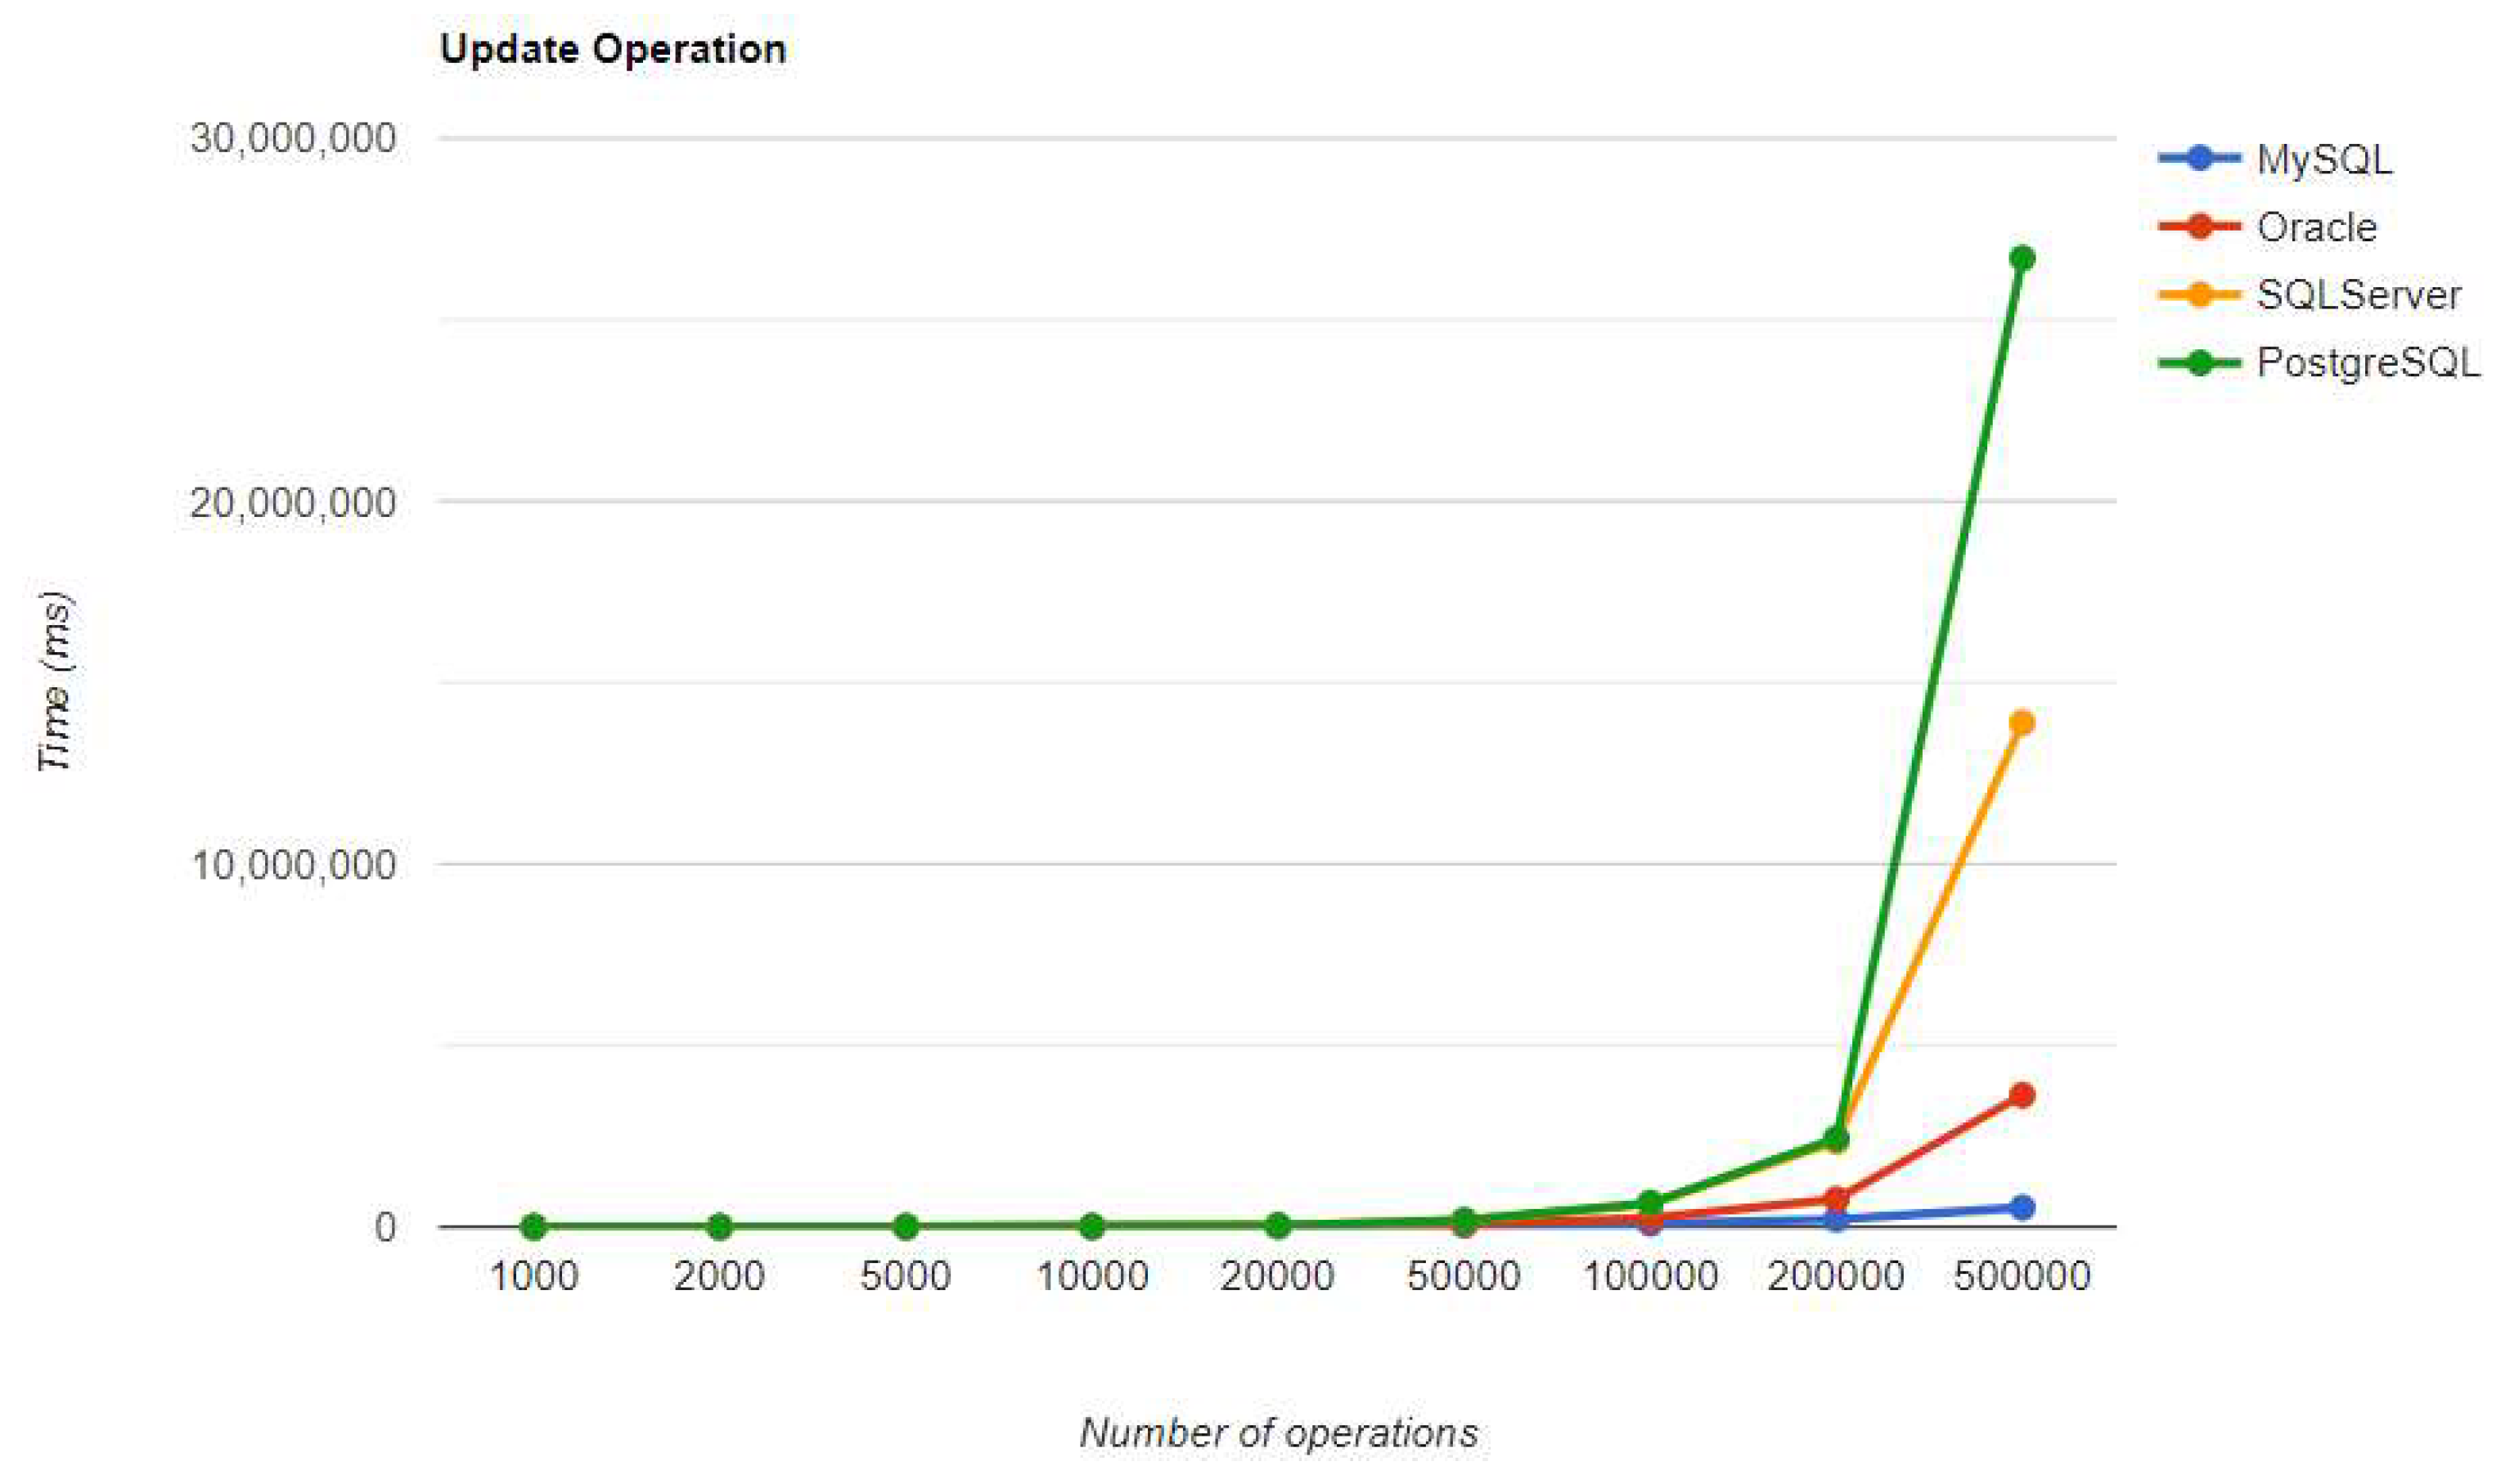
Figure 38.
Delete execution times using Spring Data JPA, after warm-up.
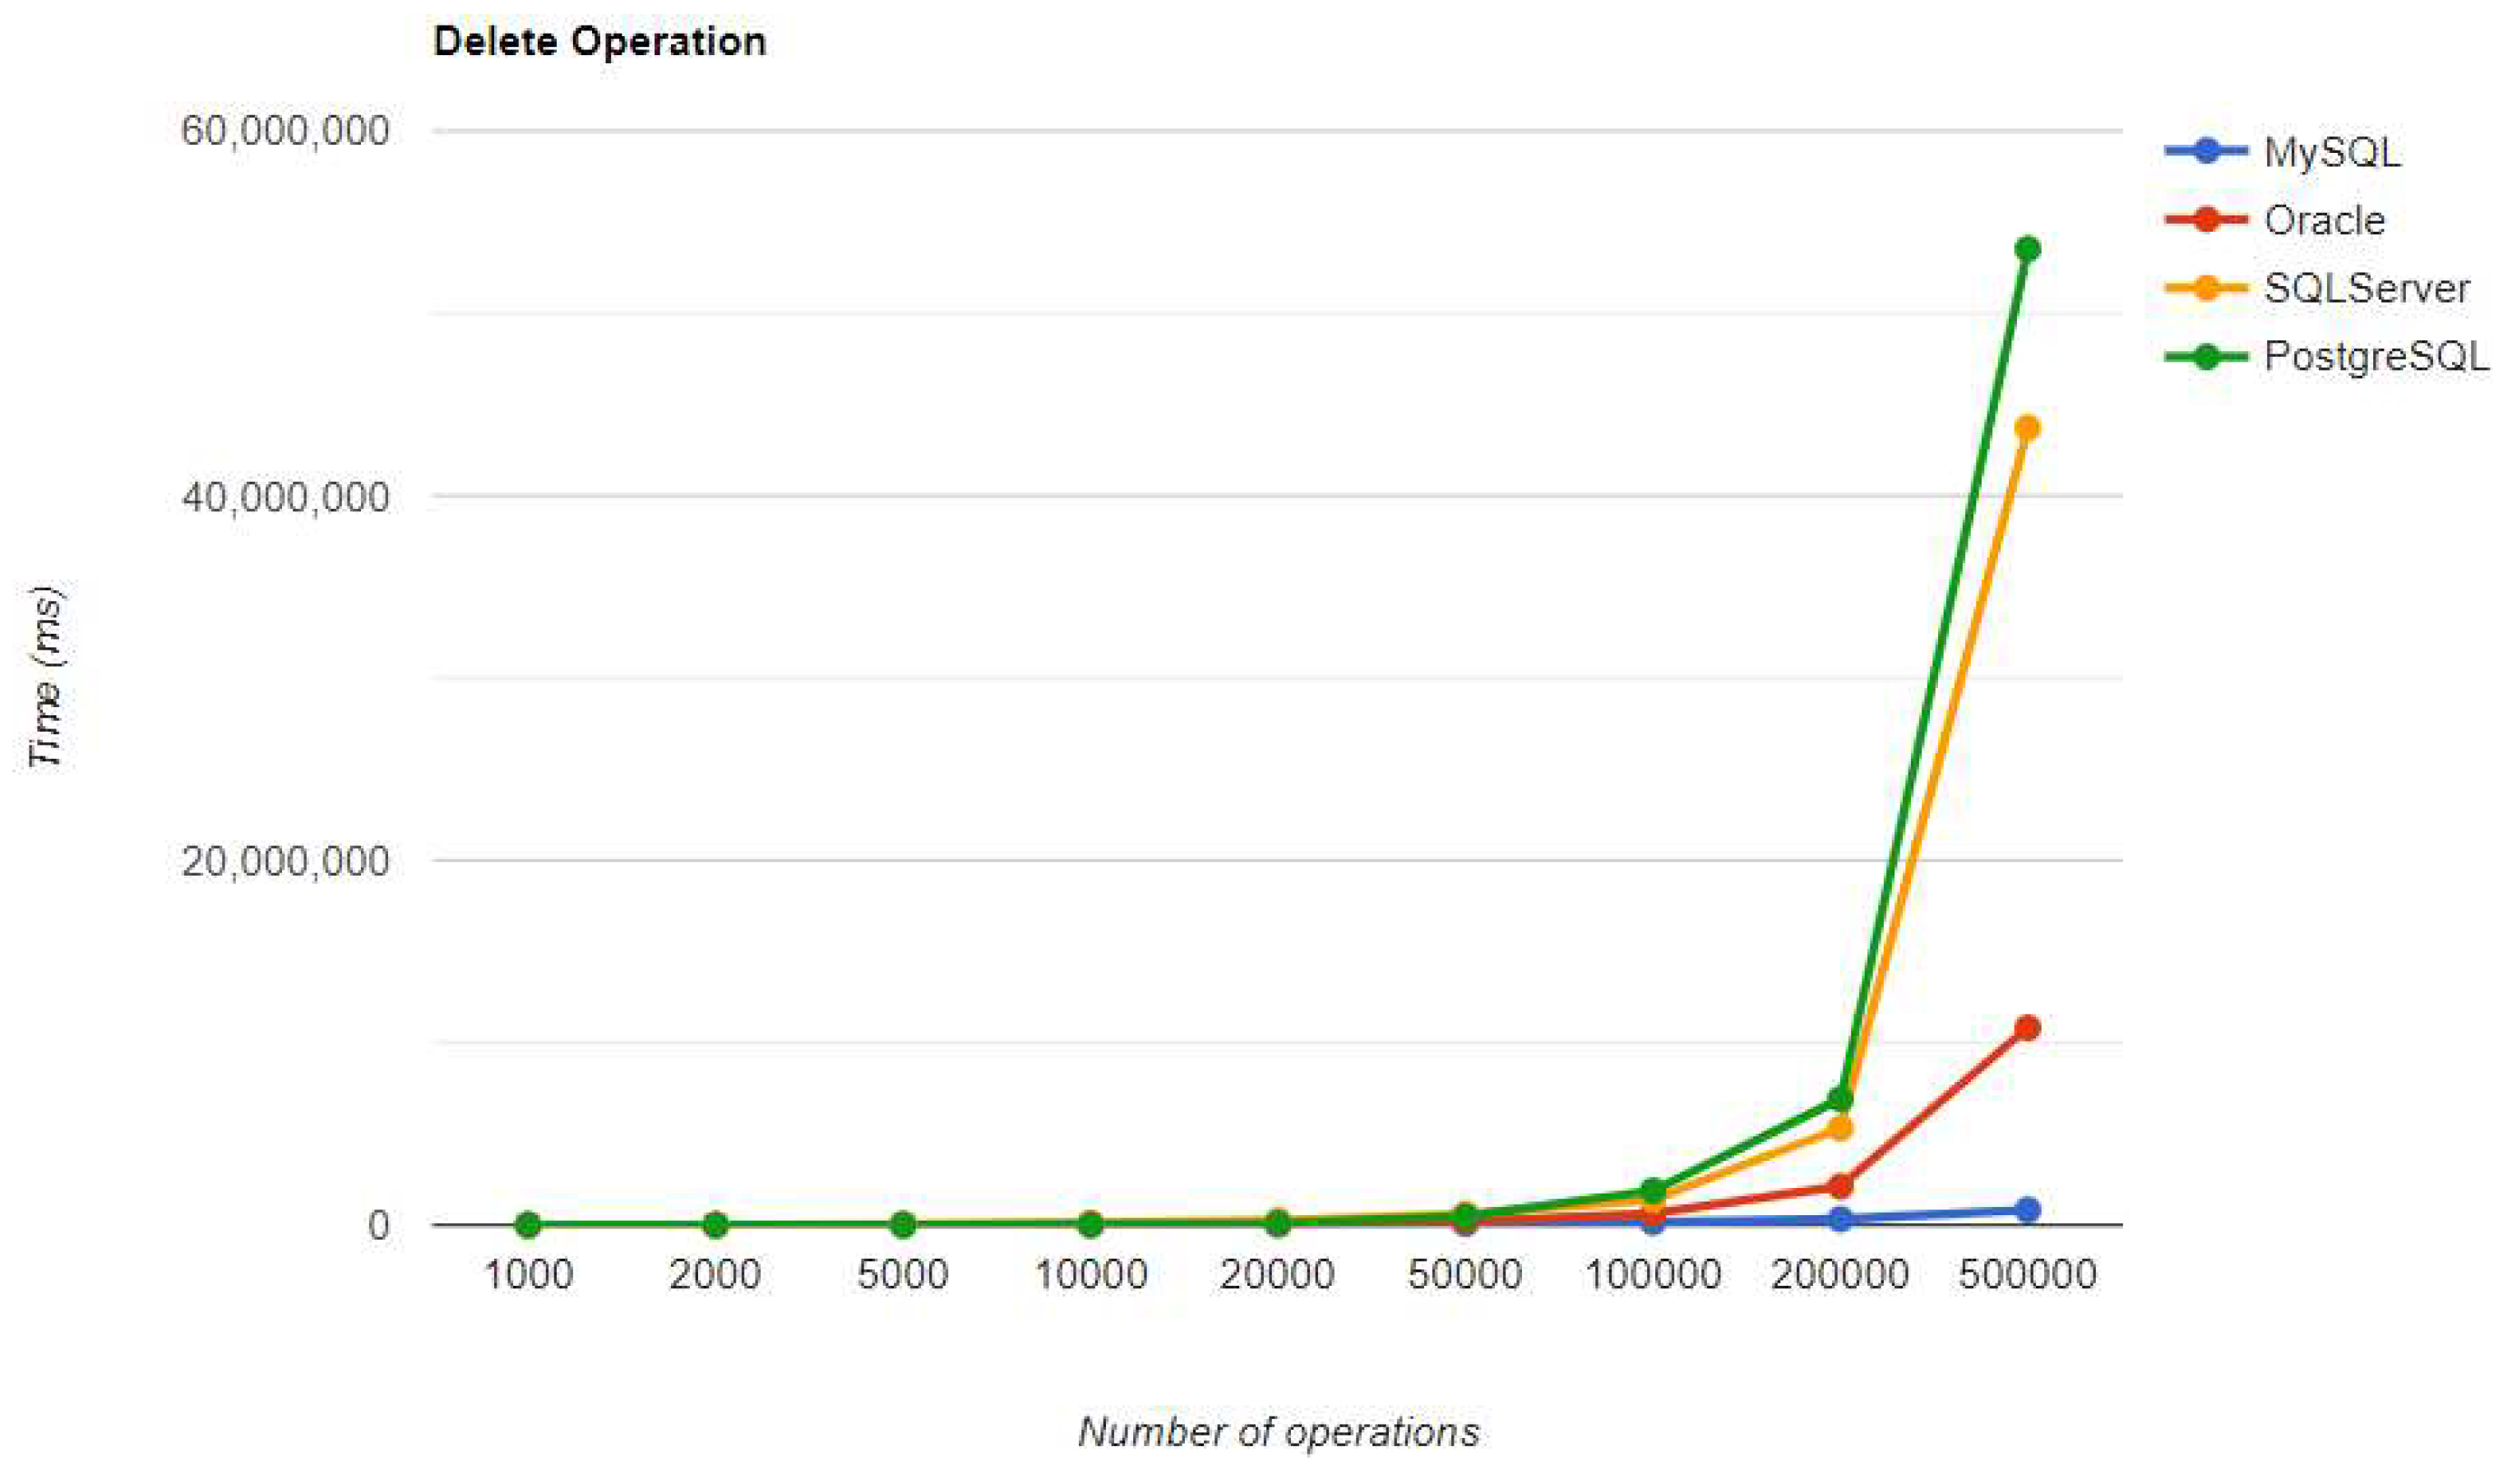

Table 1.
MySQL – JPA Results without warm-up.
|
Executions |
Times for execution (ms) | |||
|---|---|---|---|---|
| Create | Read | Update | Delete | |
| 1000 | 2516 | 151 | 1326 | 1042 |
| 2000 | 4159 | 162 | 1883 | 1878 |
| 5000 | 7098 | 181 | 3968 | 4261 |
| 10000 | 10929 | 185 | 7114 | 7999 |
| 20000 | 18421 | 218 | 12829 | 15744 |
| 50000 | 39153 | 287 | 32834 | 39249 |
| 100000 | 74956 | 358 | 62832 | 77197 |
| 200000 | 143590 | 394 | 126214 | 150652 |
| 500000 | 351963 | 936 | 323144 | 396503 |
Table 2.
Oracle – JPA Results without warm-up.
|
Executions |
Times for execution (ms) | |||
|---|---|---|---|---|
| Create | Read | Update | Delete | |
| 1000 | 3074 | 170 | 1138 | 1802 |
| 2000 | 5137 | 190 | 1947 | 2562 |
| 5000 | 10539 | 251 | 3412 | 6401 |
| 10000 | 15883 | 276 | 6260 | 13558 |
| 20000 | 29387 | 432 | 12358 | 31179 |
| 50000 | 67173 | 870 | 29059 | 114553 |
| 100000 | 128997 | 1448 | 57233 | 356399 |
| 200000 | 252797 | 2475 | 125805 | 1233955 |
| 500000 | 644428 | 5340 | 280292 | 6824038 |
Table 3.
SQL Server – JPA Results without warm-up.
|
Executions |
Times for execution (ms) | |||
|---|---|---|---|---|
| Create | Read | Update | Delete | |
| 1000 | 2025 | 137 | 919 | 1915 |
| 2000 | 3369 | 141 | 1449 | 5357 |
| 5000 | 6570 | 152 | 3093 | 14537 |
| 10000 | 10072 | 156 | 5463 | 43295 |
| 20000 | 18244 | 199 | 10037 | 69716 |
| 50000 | 40867 | 277 | 25499 | 332162 |
| 100000 | 77262 | 301 | 49460 | 1094771 |
| 200000 | 151551 | 398 | 99474 | 2915678 |
| 500000 | 362260 | 574 | 240687 | 16479860 |
Table 4.
PostgreSQL – JPA Results without warm-up.
|
Executions |
Times for execution (ms) | |||
|---|---|---|---|---|
| Create | Read | Update | Delete | |
| 1000 | 1266 | 140 | 631 | 780 |
| 2000 | 2066 | 142 | 1066 | 1674 |
| 5000 | 4159 | 156 | 2165 | 5987 |
| 10000 | 7081 | 175 | 3928 | 18109 |
| 20000 | 13088 | 181 | 7835 | 60117 |
| 50000 | 29135 | 206 | 18105 | 311499 |
| 100000 | 56766 | 255 | 35528 | 1184886 |
| 200000 | 113826 | 448 | 73619 | 4592037 |
| 500000 | 254584 | 608 | 165012 | 28444411 |
Table 5.
MySQL – Hibernate Results without warm-up.
|
Executions |
Times for execution (ms) | |||
|---|---|---|---|---|
| Create | Read | Update | Delete | |
| 1000 | 2470 | 125 | 1325 | 1253 |
| 2000 | 4554 | 138 | 1873 | 1922 |
| 5000 | 7456 | 168 | 3629 | 4159 |
| 10000 | 11004 | 177 | 6577 | 7793 |
| 20000 | 18374 | 191 | 12409 | 15337 |
| 50000 | 40688 | 278 | 31887 | 40001 |
| 100000 | 74397 | 325 | 63205 | 78410 |
| 200000 | 141294 | 466 | 126576 | 158083 |
| 500000 | 352569 | 876 | 324282 | 394135 |
Table 6.
Oracle – Hibernate Results without warm-up.
|
Executions |
Times for execution (ms) | |||
|---|---|---|---|---|
| Create | Read | Update | Delete | |
| 1000 | 3176 | 195 | 1424 | 1868 |
| 2000 | 5436 | 223 | 1871 | 2706 |
| 5000 | 10231 | 264 | 3347 | 6438 |
| 10000 | 16900 | 302 | 6025 | 14139 |
| 20000 | 28865 | 444 | 11561 | 30267 |
| 50000 | 65406 | 878 | 28601 | 112778 |
| 100000 | 125629 | 1306 | 56481 | 368699 |
| 200000 | 251595 | 2259 | 111793 | 1278305 |
| 500000 | 617148 | 5191 | 278557 | 7422952 |
Table 7.
SQL Server – Hibernate Results without warm-up.
|
Executions |
Times for execution (ms) | |||
|---|---|---|---|---|
| Create | Read | Update | Delete | |
| 1000 | 2200 | 139 | 932 | 2126 |
| 2000 | 3340 | 154 | 1437 | 5803 |
| 5000 | 6391 | 162 | 2905 | 27133 |
| 10000 | 10724 | 173 | 5510 | 102812 |
| 20000 | 18227 | 186 | 10045 | 273914 |
| 50000 | 39076 | 218 | 25955 | 359862 |
| 100000 | 72904 | 307 | 51129 | 979468 |
| 200000 | 142407 | 425 | 98792 | 3121897 |
| 500000 | 370316 | 548 | 251087 | 17313278 |
Table 8.
PostgreSQL – Hibernate Results without warm-up.
|
Executions |
Times for execution (ms) | |||
|---|---|---|---|---|
| Create | Read | Update | Delete | |
| 1000 | 1293 | 131 | 606 | 947 |
| 2000 | 2130 | 142 | 1002 | 1799 |
| 5000 | 4241 | 169 | 2094 | 6264 |
| 10000 | 7204 | 176 | 3776 | 18384 |
| 20000 | 12739 | 193 | 7217 | 59161 |
| 50000 | 29389 | 202 | 17682 | 314171 |
| 100000 | 59067 | 310 | 39052 | 1188371 |
| 200000 | 109056 | 420 | 69723 | 4668658 |
| 500000 | 265081 | 977 | 174504 | 28132449 |
Table 9.
MySQL – Spring Data JPA Results without warm-up.
|
Executions |
Times for execution (ms) | |||
|---|---|---|---|---|
| Create | Read | Update | Delete | |
| 1000 | 2787 | 196 | 3011 | 2623 |
| 2000 | 4564 | 213 | 4394 | 4627 |
| 5000 | 8013 | 256 | 7585 | 9971 |
| 10000 | 11890 | 310 | 12946 | 17137 |
| 20000 | 18832 | 321 | 22556 | 33349 |
| 50000 | 40862 | 542 | 51424 | 73632 |
| 100000 | 76899 | 924 | 100723 | 150835 |
| 200000 | 149905 | 1609 | 199141 | 289608 |
| 500000 | 362821 | 3295 | 517844 | 769762 |
Table 10.
Oracle – Spring Data JPA Results without warm-up.
|
Executions |
Times for execution (ms) | |||
|---|---|---|---|---|
| Create | Read | Update | Delete | |
| 1000 | 3443 | 250 | 2716 | 4105 |
| 2000 | 5659 | 261 | 3975 | 7832 |
| 5000 | 10350 | 364 | 7189 | 16157 |
| 10000 | 16403 | 423 | 13425 | 24223 |
| 20000 | 30325 | 685 | 27542 | 54462 |
| 50000 | 64517 | 1131 | 78725 | 192894 |
| 100000 | 126518 | 1865 | 217443 | 608504 |
| 200000 | 247627 | 3000 | 695207 | 2045420 |
| 500000 | 616130 | 7357 | 3812967 | 11518822 |
Table 11.
SQL Server – Spring Data JPA Results without warm-up.
|
Executions |
Times for execution (ms) | |||
|---|---|---|---|---|
| Create | Read | Update | Delete | |
| 1000 | 2402 | 204 | 2226 | 3825 |
| 2000 | 3719 | 216 | 3467 | 9568 |
| 5000 | 6563 | 233 | 7503 | 39334 |
| 10000 | 10836 | 241 | 16232 | 95429 |
| 20000 | 18401 | 313 | 41424 | 128738 |
| 50000 | 40906 | 434 | 183278 | 453490 |
| 100000 | 77917 | 824 | 635725 | 1367528 |
| 200000 | 154027 | 1281 | 2372789 | 4798632 |
| 500000 | 385139 | 2650 | 14151669 | 27788407 |
Table 12.
PostgreSQL – Spring Data JPA Results without warm-up.
|
Executions |
Times for execution (ms) | |||
|---|---|---|---|---|
| Create | Read | Update | Delete | |
| 1000 | 1537 | 184 | 1382 | 1909 |
| 2000 | 2333 | 193 | 2487 | 3840 |
| 5000 | 4568 | 249 | 5977 | 13474 |
| 10000 | 7449 | 276 | 13813 | 39817 |
| 20000 | 12753 | 344 | 39310 | 91798 |
| 50000 | 29917 | 520 | 177045 | 491999 |
| 100000 | 57678 | 916 | 649842 | 1871472 |
| 200000 | 112006 | 1412 | 2653937 | 7295456 |
| 500000 | 281934 | 3374 | 19642338 | 52153866 |
Table 13.
MySQL – JPA Warm-up Iteration Results.
|
Executions |
Times for execution (ms) | |||
|---|---|---|---|---|
| Create | Read | Update | Delete | |
| 1000 | 2597 | 159 | 1613 | 999 |
| 2000 | 3941 | 178 | 2189 | 2195 |
| 5000 | 7705 | 181 | 4392 | 4290 |
| 10000 | 13863 | 209 | 7590 | 9348 |
| 20000 | 25044 | 221 | 15168 | 17438 |
| 50000 | 48908 | 246 | 33677 | 39639 |
| 100000 | 88470 | 349 | 66443 | 80331 |
| 200000 | 171706 | 464 | 184202 | 211131 |
| 500000 | 376007 | 864 | 337634 | 406083 |
Table 14.
Oracle – JPA Warm-up Iteration Results.
|
Executions |
Times for execution (ms) | |||
|---|---|---|---|---|
| Create | Read | Update | Delete | |
| 1000 | 3210 | 177 | 1472 | 1740 |
| 2000 | 4711 | 239 | 2291 | 2421 |
| 5000 | 9812 | 243 | 3738 | 6461 |
| 10000 | 16374 | 362 | 7000 | 13310 |
| 20000 | 28576 | 534 | 12996 | 29308 |
| 50000 | 64462 | 946 | 30233 | 113767 |
| 100000 | 127381 | 1414 | 59729 | 355364 |
| 200000 | 263626 | 2411 | 119294 | 1321364 |
| 500000 | 615884 | 5256 | 291689 | 6856315 |
Table 15.
SQL Server – JPA Warm-up Iteration Results.
|
Executions |
Times for execution (ms) | |||
|---|---|---|---|---|
| Create | Read | Update | Delete | |
| 1000 | 2068 | 156 | 1053 | 2142 |
| 2000 | 3460 | 176 | 1694 | 6200 |
| 5000 | 6604 | 187 | 3611 | 26289 |
| 10000 | 10200 | 202 | 5829 | 61851 |
| 20000 | 18860 | 282 | 11136 | 76794 |
| 50000 | 41307 | 293 | 27672 | 485492 |
| 100000 | 80825 | 324 | 51316 | 1521422 |
| 200000 | 163146 | 410 | 107134 | 3353780 |
| 500000 | 406625 | 613 | 265850 | 19506821 |
Table 16.
PostgreSQL – JPA Warm-up Iteration Results.
|
Executions |
Times for execution (ms) | |||
|---|---|---|---|---|
| Create | Read | Update | Delete | |
| 1000 | 1388 | 124 | 839 | 837 |
| 2000 | 2315 | 155 | 1281 | 1696 |
| 5000 | 4267 | 176 | 2719 | 6418 |
| 10000 | 11808 | 189 | 4190 | 17863 |
| 20000 | 13154 | 213 | 8077 | 57640 |
| 50000 | 53033 | 254 | 18857 | 304455 |
| 100000 | 78439 | 353 | 35731 | 1084755 |
| 200000 | 154584 | 375 | 71922 | 4405165 |
| 500000 | 276020 | 539 | 181739 | 26875984 |
Table 17.
MySQL – Hibernate Warm-up Iteration Results.
|
Executions |
Times for execution (ms) | |||
|---|---|---|---|---|
| Create | Read | Update | Delete | |
| 1000 | 2580 | 134 | 1653 | 1291 |
| 2000 | 3883 | 163 | 2457 | 1922 |
| 5000 | 7981 | 174 | 3928 | 4483 |
| 10000 | 14121 | 200 | 7845 | 8437 |
| 20000 | 24161 | 214 | 17527 | 17779 |
| 50000 | 49300 | 272 | 31505 | 39011 |
| 100000 | 90727 | 395 | 62460 | 79682 |
| 200000 | 154690 | 519 | 132628 | 162276 |
| 500000 | 422960 | 754 | 452453 | 536749 |
Table 18.
Oracle – Hibernate Warm-up Iteration Results.
|
Executions |
Times for execution (ms) | |||
|---|---|---|---|---|
| Create | Read | Update | Delete | |
| 1000 | 2900 | 176 | 1366 | 1728 |
| 2000 | 5156 | 208 | 2127 | 2467 |
| 5000 | 9563 | 237 | 3660 | 6123 |
| 10000 | 15538 | 369 | 6736 | 13117 |
| 20000 | 31089 | 535 | 12600 | 32559 |
| 50000 | 65035 | 901 | 29441 | 112994 |
| 100000 | 124436 | 1416 | 57427 | 351471 |
| 200000 | 242417 | 2295 | 111213 | 1208644 |
| 500000 | 599872 | 5143 | 275656 | 6749529 |
Table 19.
SQL Server – Hibernate Warm-up Iteration Results.
|
Executions |
Times for execution (ms) | |||
|---|---|---|---|---|
| Create | Read | Update | Delete | |
| 1000 | 2249 | 157 | 1194 | 2519 |
| 2000 | 3612 | 172 | 2031 | 6098 |
| 5000 | 7056 | 191 | 3325 | 27331 |
| 10000 | 11151 | 215 | 6542 | 75966 |
| 20000 | 19603 | 235 | 11847 | 93770 |
| 50000 | 45659 | 339 | 30036 | 645622 |
| 100000 | 85737 | 351 | 53012 | 978065 |
| 200000 | 162910 | 459 | 106024 | 2931522 |
| 500000 | 413812 | 668 | 303875 | 18919726 |
Table 20.
PostgreSQL – Hibernate Warm-up Iteration Results.
|
Executions |
Times for execution (ms) | |||
|---|---|---|---|---|
| Create | Read | Update | Delete | |
| 1000 | 1272 | 139 | 794 | 1010 |
| 2000 | 2049 | 171 | 1298 | 1703 |
| 5000 | 4244 | 198 | 2451 | 5971 |
| 10000 | 7075 | 213 | 4028 | 17406 |
| 20000 | 12756 | 226 | 7514 | 57645 |
| 50000 | 30374 | 264 | 18040 | 299375 |
| 100000 | 58557 | 314 | 36891 | 1093245 |
| 200000 | 112398 | 387 | 72108 | 4350143 |
| 500000 | 280235 | 566 | 179190 | 27096855 |
Table 21.
MySQL – Spring Data JPA Warm-up Iteration Results.
|
Executions |
Times for execution (ms) | |||
|---|---|---|---|---|
| Create | Read | Update | Delete | |
| 1000 | 2806 | 291 | 3140 | 2588 |
| 2000 | 4452 | 327 | 4392 | 4321 |
| 5000 | 7538 | 436 | 8128 | 9205 |
| 10000 | 12296 | 503 | 14041 | 17983 |
| 20000 | 23047 | 566 | 23785 | 33954 |
| 50000 | 45282 | 812 | 31505 | 78208 |
| 100000 | 78175 | 1215 | 101722 | 149039 |
| 200000 | 170025 | 1709 | 209703 | 319511 |
| 500000 | 413793 | 3221 | 540120 | 823865 |
Table 22.
Oracle – Spring Data JPA Warm-up Iteration Results.
|
Executions |
Times for execution (ms) | |||
|---|---|---|---|---|
| Create | Read | Update | Delete | |
| 1000 | 3354 | 329 | 2850 | 3824 |
| 2000 | 5367 | 427 | 4483 | 7474 |
| 5000 | 10244 | 471 | 7589 | 15990 |
| 10000 | 16057 | 613 | 14430 | 24078 |
| 20000 | 29249 | 861 | 26599 | 53323 |
| 50000 | 67215 | 1457 | 81012 | 187120 |
| 100000 | 126109 | 2119 | 218015 | 583012 |
| 200000 | 257997 | 3646 | 693207 | 1875911 |
| 500000 | 638135 | 7332 | 3574677 | 10346277 |
Table 23.
SQL Server – Spring Data JPA Warm-up Iteration Results.
|
Executions |
Times for execution (ms) | |||
|---|---|---|---|---|
| Create | Read | Update | Delete | |
| 1000 | 2212 | 267 | 2250 | 3962 |
| 2000 | 3554 | 287 | 3797 | 10015 |
| 5000 | 6958 | 329 | 8462 | 44297 |
| 10000 | 10527 | 395 | 16498 | 131126 |
| 20000 | 18971 | 491 | 41816 | 150871 |
| 50000 | 44274 | 754 | 180711 | 514577 |
| 100000 | 82160 | 957 | 628961 | 1394642 |
| 200000 | 153596 | 1559 | 2340754 | 5339999 |
| 500000 | 406316 | 2646 | 13773496 | 26837548 |
Table 24.
PostgreSQL – Spring Data JPA Warm-up Iteration Results.
|
Executions |
Times for execution (ms) | |||
|---|---|---|---|---|
| Create | Read | Update | Delete | |
| 1000 | 1472 | 269 | 1567 | 1732 |
| 2000 | 2330 | 324 | 2660 | 3680 |
| 5000 | 4926 | 404 | 6273 | 13084 |
| 10000 | 7515 | 459 | 13335 | 28348 |
| 20000 | 13516 | 505 | 35993 | 86357 |
| 50000 | 30594 | 670 | 171188 | 456331 |
| 100000 | 58733 | 971 | 666459 | 1716667 |
| 200000 | 115133 | 1784 | 2383477 | 6986407 |
| 500000 | 277220 | 2808 | 26491209 | 54353530 |
Table 25.
MySQL – JPA after Warm-up Results.
|
Executions |
Times for execution (ms) | |||
|---|---|---|---|---|
| Create | Read | Update | Delete | |
| 1000 | 1320 | 5 | 977 | 1058 |
| 2000 | 2187 | 12 | 1424 | 1635 |
| 5000 | 5056 | 13 | 3217 | 3939 |
| 10000 | 8060 | 19 | 6615 | 8217 |
| 20000 | 16688 | 33 | 13225 | 15484 |
| 50000 | 40474 | 61 | 32740 | 38316 |
| 100000 | 84237 | 100 | 65969 | 79878 |
| 200000 | 176677 | 219 | 184273 | 218316 |
| 500000 | 412787 | 1019 | 348702 | 407195 |
Table 26.
Oracle – JPA after Warm-up Results.
|
Executions |
Times for execution (ms) | |||
|---|---|---|---|---|
| Create | Read | Update | Delete | |
| 1000 | 2324 | 20 | 938 | 1245 |
| 2000 | 3260 | 39 | 1257 | 2283 |
| 5000 | 7016 | 72 | 2929 | 6108 |
| 10000 | 13494 | 137 | 5656 | 13126 |
| 20000 | 25183 | 261 | 12050 | 30302 |
| 50000 | 61741 | 567 | 29169 | 117938 |
| 100000 | 122005 | 1049 | 58685 | 394943 |
| 200000 | 250263 | 2241 | 118758 | 1453254 |
| 500000 | 613879 | 5415 | 293187 | 7542581 |
Table 27.
SQL Server – JPA after Warm-up Results.
|
Executions |
Times for execution (ms) | |||
|---|---|---|---|---|
| Create | Read | Update | Delete | |
| 1000 | 1124 | 4 | 640 | 2034 |
| 2000 | 2122 | 8 | 1360 | 4731 |
| 5000 | 4335 | 9 | 2876 | 37794 |
| 10000 | 8395 | 14 | 5802 | 56715 |
| 20000 | 16621 | 31 | 10179 | 103396 |
| 50000 | 39454 | 60 | 25221 | 593536 |
| 100000 | 76385 | 84 | 50035 | 1462501 |
| 200000 | 155891 | 170 | 105117 | 2990621 |
| 500000 | 680402 | 378 | 438317 | 21181124 |
Table 28.
PostgreSQL – JPA after Warm-up Results.
|
Executions |
Times for execution (ms) | |||
|---|---|---|---|---|
| Create | Read | Update | Delete | |
| 1000 | 806 | 3 | 424 | 715 |
| 2000 | 1629 | 4 | 788 | 1591 |
| 5000 | 3013 | 10 | 1882 | 6244 |
| 10000 | 6033 | 15 | 3557 | 18733 |
| 20000 | 10851 | 18 | 7032 | 60424 |
| 50000 | 27968 | 32 | 19126 | 310546 |
| 100000 | 58389 | 64 | 41338 | 1081356 |
| 200000 | 116544 | 257 | 80634 | 4407783 |
| 500000 | 296800 | 497 | 203143 | 26909072 |
Table 29.
MySQL – Hibernate after Warm-up Results.
|
Executions |
Times for execution (ms) | |||
|---|---|---|---|---|
| Create | Read | Update | Delete | |
| 1000 | 1356 | 4 | 791 | 970 |
| 2000 | 2232 | 13 | 2042 | 2488 |
| 5000 | 4195 | 19 | 3251 | 4065 |
| 10000 | 7454 | 21 | 6414 | 7951 |
| 20000 | 20723 | 25 | 18556 | 20381 |
| 50000 | 37630 | 62 | 31941 | 37681 |
| 100000 | 79584 | 120 | 65103 | 75940 |
| 200000 | 158046 | 212 | 131501 | 160246 |
| 500000 | 462010 | 515 | 447930 | 416474 |
Table 30.
Oracle – Hibernate after Warm-up Results.
|
Executions |
Times for execution (ms) | |||
|---|---|---|---|---|
| Create | Read | Update | Delete | |
| 1000 | 2087 | 16 | 654 | 1150 |
| 2000 | 3613 | 42 | 1245 | 2374 |
| 5000 | 6525 | 76 | 2922 | 5934 |
| 10000 | 12877 | 173 | 5846 | 12888 |
| 20000 | 25958 | 286 | 11714 | 32497 |
| 50000 | 61604 | 563 | 28781 | 116607 |
| 100000 | 122788 | 1080 | 57296 | 368170 |
| 200000 | 237372 | 2001 | 109526 | 1330209 |
| 500000 | 598497 | 5056 | 286199 | 7009015 |
Table 31.
SQL Server – Hibernate after Warm-up Results.
|
Executions |
Times for execution (ms) | |||
|---|---|---|---|---|
| Create | Read | Update | Delete | |
| 1000 | 1144 | 4 | 736 | 2539 |
| 2000 | 2313 | 8 | 1347 | 6457 |
| 5000 | 4725 | 12 | 3118 | 35963 |
| 10000 | 8986 | 16 | 5528 | 64561 |
| 20000 | 17244 | 25 | 11309 | 98772 |
| 50000 | 40057 | 40 | 27389 | 308409 |
| 100000 | 76050 | 64 | 52283 | 904024 |
| 200000 | 158971 | 136 | 104486 | 3263787 |
| 500000 | 401552 | 260 | 274256 | 16404632 |
Table 32.
PostgreSQL – Hibernate after Warm-up Results.
|
Executions |
Times for execution (ms) | |||
|---|---|---|---|---|
| Create | Read | Update | Delete | |
| 1000 | 802 | 5 | 447 | 725 |
| 2000 | 1430 | 10 | 761 | 1625 |
| 5000 | 2962 | 14 | 1796 | 6317 |
| 10000 | 5612 | 16 | 3538 | 18831 |
| 20000 | 11625 | 18 | 7212 | 60457 |
| 50000 | 27041 | 36 | 17647 | 317984 |
| 100000 | 57995 | 67 | 40528 | 1228630 |
| 200000 | 118198 | 129 | 81967 | 4296717 |
| 500000 | 291326 | 320 | 202372 | 27254448 |
Table 33.
MySQL – Spring Data JPA after Warm-up Results.
|
Executions |
Times for execution (ms) | |||
|---|---|---|---|---|
| Create | Read | Update | Delete | |
| 1000 | 1182 | 24 | 1332 | 2096 |
| 2000 | 2186 | 28 | 2326 | 3729 |
| 5000 | 3994 | 34 | 5373 | 7672 |
| 10000 | 9729 | 45 | 10393 | 17336 |
| 20000 | 15456 | 88 | 19852 | 33132 |
| 50000 | 36829 | 183 | 50083 | 78464 |
| 100000 | 70941 | 396 | 97589 | 155536 |
| 200000 | 151731 | 638 | 209752 | 323955 |
| 500000 | 418229 | 2243 | 533016 | 832592 |
Table 34.
Oracle – Spring Data JPA after Warm-up Results.
|
Executions |
Times for execution (ms) | |||
|---|---|---|---|---|
| Create | Read | Update | Delete | |
| 1000 | 2247 | 71 | 1359 | 3310 |
| 2000 | 3400 | 104 | 2611 | 7532 |
| 5000 | 6552 | 156 | 5323 | 16118 |
| 10000 | 13101 | 287 | 11160 | 22235 |
| 20000 | 25568 | 418 | 24517 | 53358 |
| 50000 | 62852 | 756 | 80200 | 196963 |
| 100000 | 124192 | 1391 | 244591 | 631924 |
| 200000 | 241714 | 2809 | 764244 | 2118503 |
| 500000 | 634169 | 6883 | 3631567 | 10816927 |
Table 35.
SQL Server – Spring Data JPA after Warm-up Results.
|
Executions |
Times for execution (ms) | |||
|---|---|---|---|---|
| Create | Read | Update | Delete | |
| 1000 | 1256 | 27 | 1222 | 3397 |
| 2000 | 2153 | 29 | 2256 | 9380 |
| 5000 | 4273 | 39 | 5883 | 52667 |
| 10000 | 7870 | 63 | 15413 | 112954 |
| 20000 | 16079 | 102 | 40846 | 259930 |
| 50000 | 40557 | 167 | 180533 | 600696 |
| 100000 | 78826 | 301 | 635869 | 1388995 |
| 200000 | 155351 | 702 | 2349685 | 5306286 |
| 500000 | 395865 | 2001 | 13892803 | 43731425 |
Table 36.
PostgreSQL – Spring Data JPA after Warm-up Results.
|
Executions |
Times for execution (ms) | |||
|---|---|---|---|---|
| Create | Read | Update | Delete | |
| 1000 | 758 | 27 | 1049 | 1543 |
| 2000 | 1598 | 40 | 1872 | 3820 |
| 5000 | 3280 | 74 | 4695 | 9953 |
| 10000 | 5881 | 86 | 12357 | 28440 |
| 20000 | 11124 | 135 | 35065 | 91662 |
| 50000 | 28863 | 235 | 179051 | 474297 |
| 100000 | 54690 | 584 | 662215 | 1883730 |
| 200000 | 115369 | 776 | 2440448 | 6909755 |
| 500000 | 298820 | 2026 | 26700590 | 53540998 |
Table 37.
Results for both solutions for 50k entries on MySQL.
|
Operation |
Current research | Previous research | ||||
|---|---|---|---|---|---|---|
| JPA | Hibernate | Spring Data JPA | JPA | Hibernate | Spring Data JPA | |
| Create | 39153 | 40688 | 40862 | 16463 | 16512 | 59629 |
| Read | 287 | 278 | 542 | 344 | 362 | 2252 |
| Update | 32834 | 31887 | 51424 | 16355 | 16276 | 75071 |
| Delete | 39249 | 40001 | 73632 | 12768 | 12857 | 79799 |
Table 38.
Execution times in milliseconds, 50k entries, after transaction management refactor.
|
Operation |
Relational Database Management System | |||
|---|---|---|---|---|
| MySQL | Oracle | SQLServer | PostgreSQL | |
| Create | 43371 | 68977 | 42253 | 31839 |
| Read | 314 | 976 | 261 | 271 |
| Update | 33955 | 29537 | 27668 | 18924 |
| Delete | 42988 | 113404 | 381440 | 326854 |
Table 39.
Execution times in milliseconds for 50k entries with Hibernate.
|
Operation |
Relational Database Management System | |||
|---|---|---|---|---|
| MySQL | Oracle | SQLServer | PostgreSQL | |
| Create | 40688 | 65406 | 39076 | 29389 |
| Read | 278 | 878 | 218 | 202 |
| Update | 31887 | 28601 | 25955 | 17682 |
| Delete | 40001 | 112778 | 359862 | 314171 |
Disclaimer/Publisher’s Note: The statements, opinions and data contained in all publications are solely those of the individual author(s) and contributor(s) and not of MDPI and/or the editor(s). MDPI and/or the editor(s) disclaim responsibility for any injury to people or property resulting from any ideas, methods, instructions or products referred to in the content. |
© 2024 by the authors. Licensee MDPI, Basel, Switzerland. This article is an open access article distributed under the terms and conditions of the Creative Commons Attribution (CC BY) license (https://creativecommons.org/licenses/by/4.0/).
Copyright: This open access article is published under a Creative Commons CC BY 4.0 license, which permit the free download, distribution, and reuse, provided that the author and preprint are cited in any reuse.