Submitted:
15 January 2024
Posted:
15 January 2024
You are already at the latest version
Abstract
Roadway accidents significantly contribute to intermittent congestion and increased CO2 emissions on freeways. This research introduces a statistical approach designed to predict the rise in CO2 emissions resulting from traffic disturbances or jams triggered by such incidents. It also assesses the influence of varying levels of accident management effectiveness in different situations. To construct these scenarios, the study employs VISSIM, a traffic modeling software, incorporating diverse factors such as traffic volume, vehicle types, incident durations, and freeway lane counts. It then produces traffic flow characteristics in the form of vehicle paths. The emission estimates are derived by correlating these simulated vehicle paths with emission rates from the MOVES model. The study then applies a regression analysis to examine the connection between the increase in emissions and various influencing factors. The findings indicate that this approach efficiently reflects the impact of variables like accident duration, vehicle mix, and traffic volume on CO2 emissions across different lane configurations. The accuracy of these predictions is also confirmed. The outcomes suggest the model's potential usage in guiding efforts to lower emissions and determining the optimal duration of incident management, particularly in terms of lane closure, to mitigate emission impacts. This paper also discusses the limitations of the model and the future improvement direction.
Keywords:
Freeways
; CO2 Emission
; Accident Management Measures
1. Introduction
With the global energy-saving and carbon reduction in full swing, industries with high energy consumption and emissions, including transportation sector, are under significant pressure to translate into green practices, especially in the realm of road transportation. In 2021, greenhouse gas (GHG) emissions from road transportation in the United States accounts for 82.7% of the total emissions within the transportation sector [1]. In China, this proportion is similarly high, reaching 79.2% [2]. GHG emissions caused by traffic congestion, especially the freeway congestion, are huge owing to the prolonged idling and frequent acceleration and deceleration [3]. Previous studies have indicated that in 2020, additional fuel consumption due to traffic congestion in the United States reached 1.7 billion gallons, resulting in an additional 18 million tons of greenhouse gas emissions [4]. Among these, traffic accidents on freeways are one of the primary causes of temporary congestion. Existing research shows that episodic traffic congestion caused by freeway incidents, such as traffic accidents and vehicle breakdowns, accounts for 50% to 75% of the overall traffic congestion [5].
There are already several strategies to reduce the external impact of road accidents, including accident warning, traffic incident management [6,7], intelligent speed adaptation [6,8], etc. One of the key objectives for these strategies is to reduce the external impact of accidents to the traffic operations as much as possible through rapid accident emergency response. In other words, the accident management duration should be minimized through a series of efficient steps: accident identification, strategy generation, accident report recording, field cleanup, accident lane closure/re-open, etc. Considering the significant traffic congestion and vehicle emissions impact from accidents, an efficient method is necessary to quantify such impact under various operation scenarios, in a way that offers guidance on the accident management goal for CO2 emissions reduction.
There are now several methods to quantify the vehicle CO2 emission impact of road accidents, such as survival analysis methods [9], MEET model [10], impact factor method [11], standard driving schedule matching [12], etc. These do not quantify the external impacts of incident management scenarios on CO2 emissions in a very comprehensive way. Some studies have simply established the relationship between emissions and the average speed of the scenario [6,10], or simply assessed the impact of accidents in terms of traffic volume [11]. These models do not build the connection between emissions and accident management index (e.g., accident management duration, etc.) and are thus difficult to use for measure evaluation or comparison analysis.
Modeling requires consideration of model complexity, accuracy and robustness. For such a model, selecting the right predictors is critical. For accident emission reduction, the most common measure is to improve the efficiency of accident treatment in order to reduce the treatment time and the congestion duration. Although traffic accidents can lead to increased emissions due to congestion, it has been shown that efficient and rapid responses to the incidents lead to the reduction of this externality [9]. Therefore, accident duration is added to the model variables to enable the evaluation of accident management measures. In addition, there are also very significant effects of vehicle composition [10,12] and traffic demand [6] on traffic CO2 emissions. This paper proposes a model that balances data accessibility, model complexity, accuracy, and robustness to predict additional CO2 emissions caused by accidents under various operation and vehicle composition scenarios. Moreover, the focus of the model is to quantify reductions of emissions resulting from various accident management durations. As for now, the study focused only on single-lane-occupancy accidents.
With the advancement of microscopic traffic simulation software technology (VISSIM, AnyLogic, etc), some studies have proposed to use them to analyze the operation impact of traffic accidents by simulating traffic flow under multiple scenarios [12,13,14]. And traffic simulation software also enables output of vehicle trajectories that captures detailed interruption of traffic operations from different types and accidents in wide impact range.
Suitable emission model should be chosen to perform emission calculations and reflect the traffic flow characteristics from the simulation. There are already many emission models available, such as MOVES [15], CMEM [16], PERE [17]. MOVES is now one of the most widely used emission models. In MOVES, emission predictions can be made by using the default driving cycles in the model [12]. Alternatively, emission factors for predicting are available by different driving operating mode bins [18]. As for the simulation data, vehicle second-by-second speed and acceleration data are readily available, which can be used to capture the vehicle's operating modes. Therefore, in this study, the aforementioned attributes of MOVES can be utilized to acquire the second-by-second vehicle emission data for each simulation scenario, using the second-by-second vehicle operation results provided by VISSIM.
This study used nonlinear regression model for fitting based on the actual relationship between emissions and these predictors. For nonlinear regression, generalized additive models (GAM) and polynomial regression are commonly (others are either similar or not applicable). GAM is an automatic method of fitting a spline regression and does not require the specification of knots for the spline. it minimizes the residuals by assigning different spline functions to each variable. And the spline function fits the data points by computing a polynomial regression between each knot [19]. GAM tends to have a higher precision of fit than simple linear regression or polynomial regression, and is a keen choice of method for various research. However, too much precision often leads to overfitting. And more importantly, GAM is a nonparametric model. This means that the resulting model cannot decipher the physical meaning of the parameters like a parametric model which is this study looking for. So polynomial regression and variable transformation are chosen for model fitting.
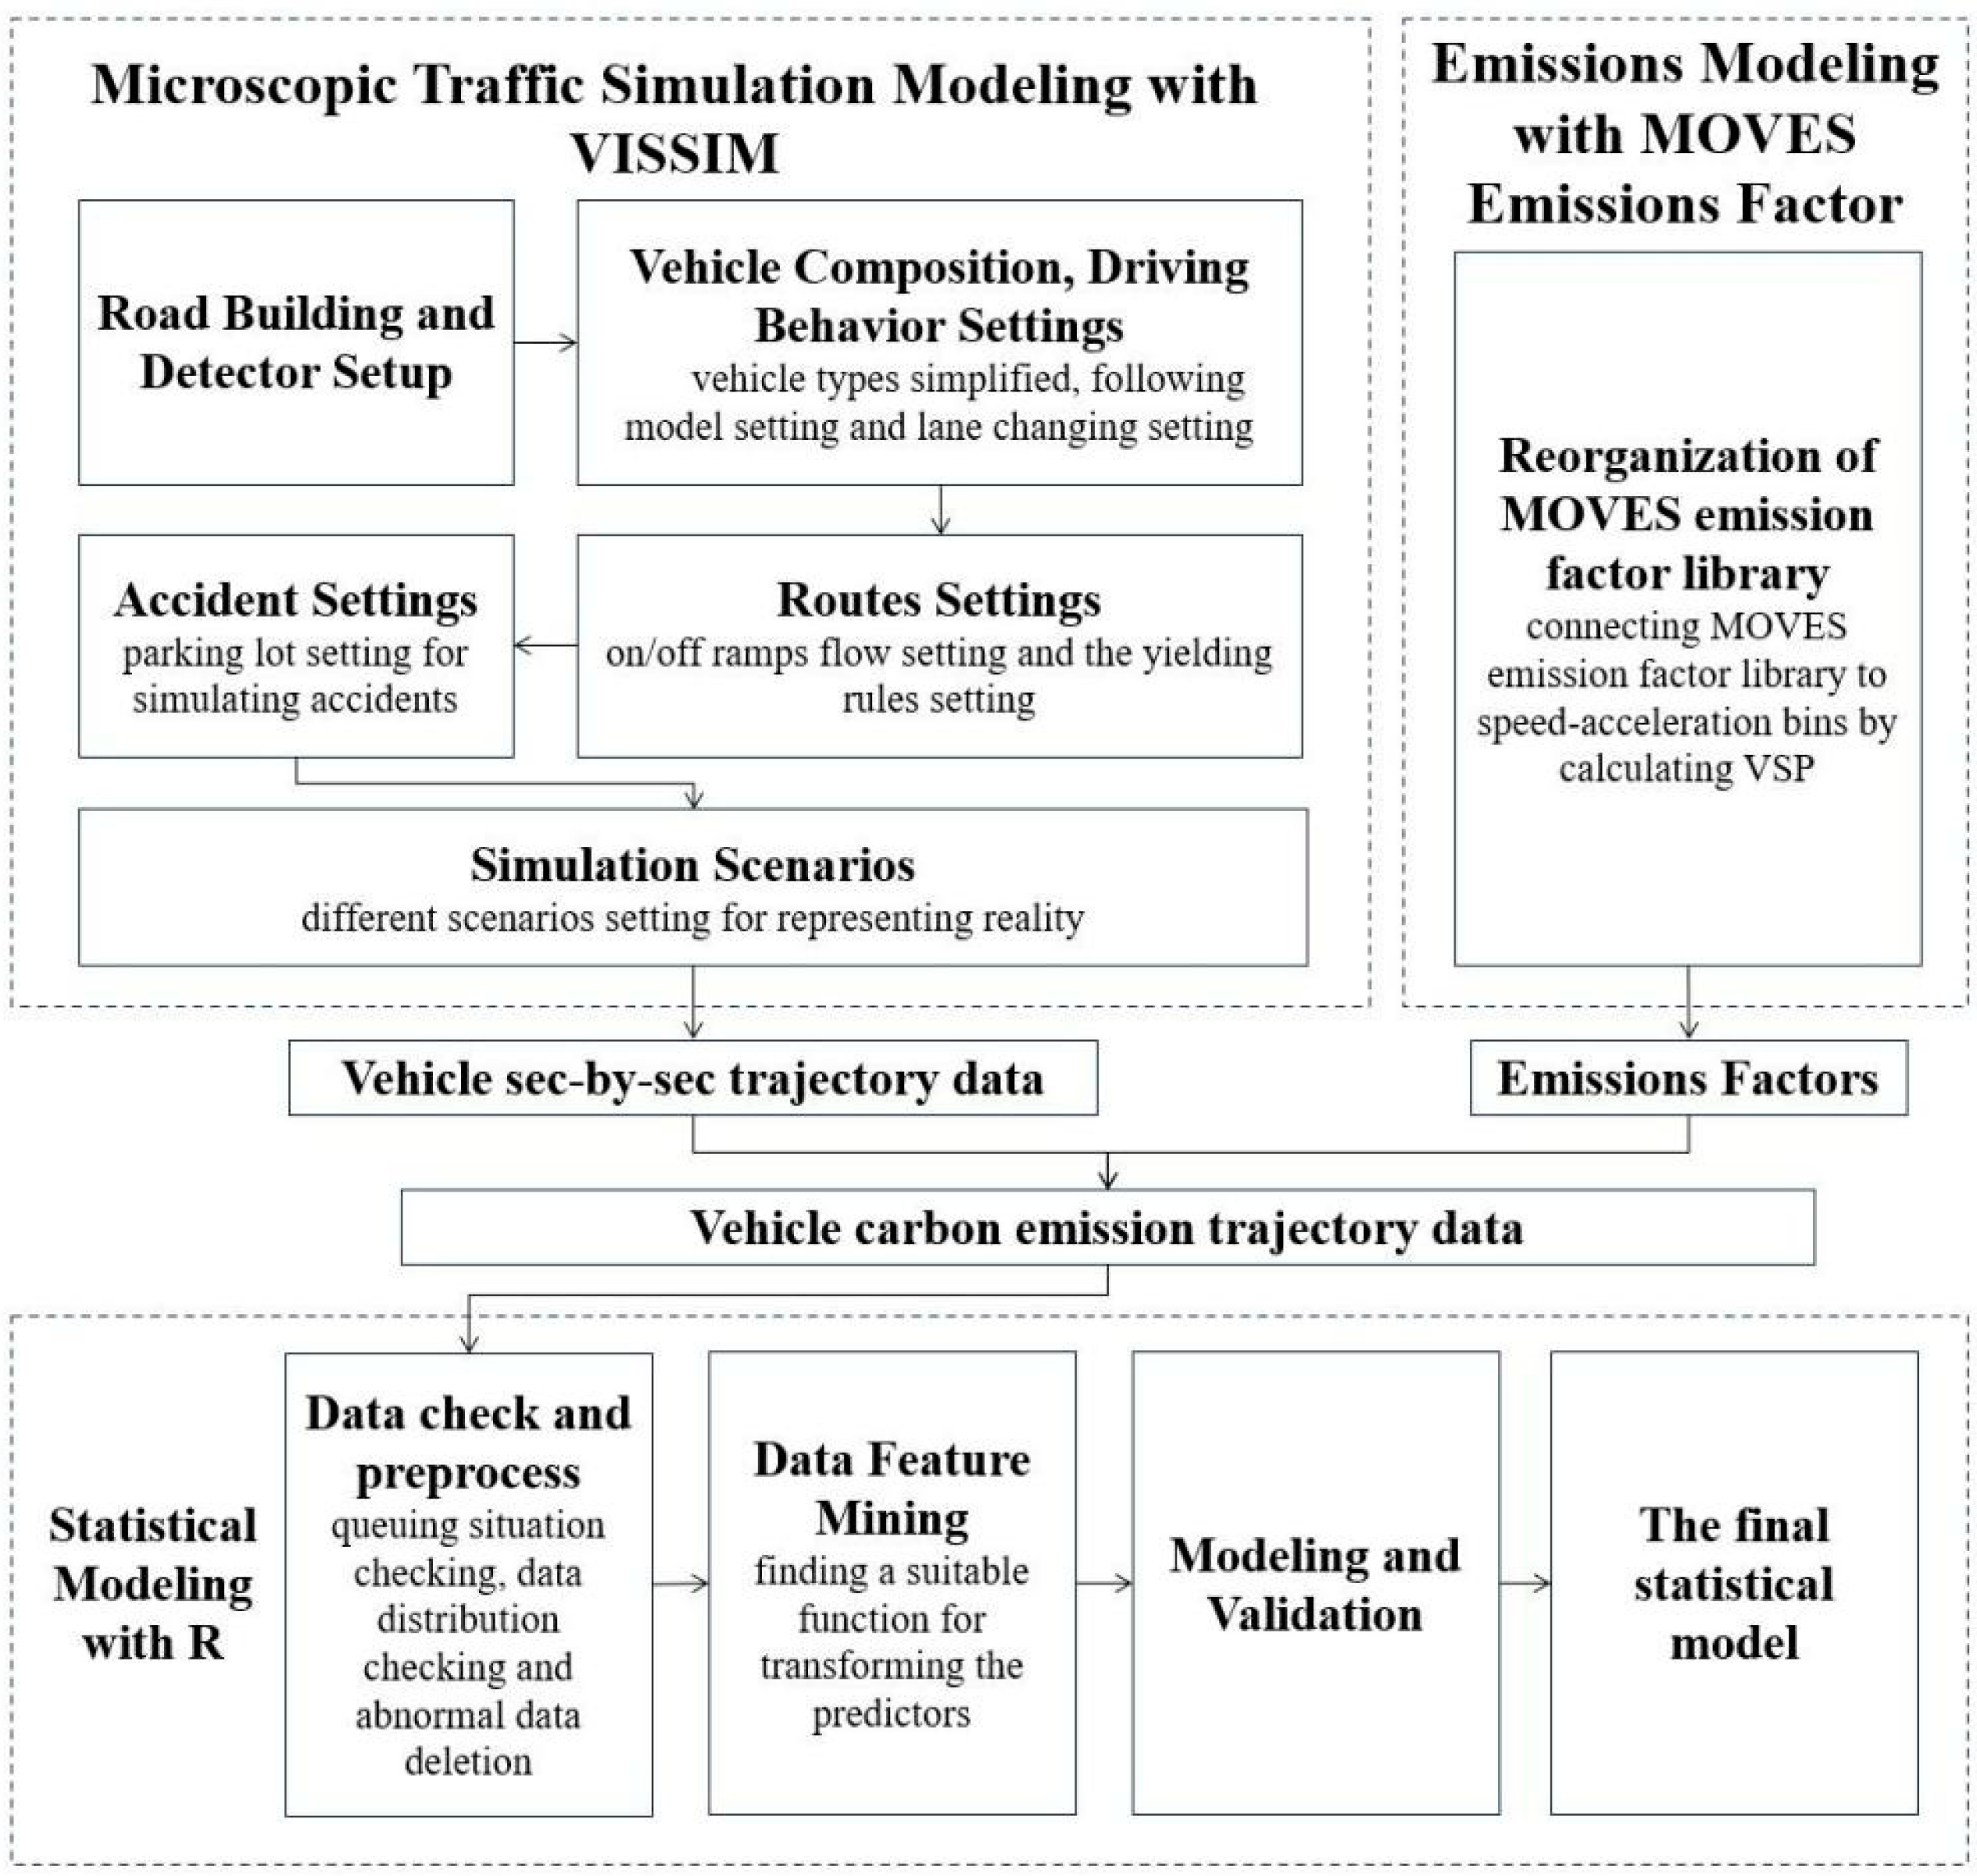
Based on the above requirements, the study will use VISSIM and MOVES to simulate the effect of the accident duration (including accident occurrence, response, management and resumption) on freeways CO2 emissions under various vehicle composition, traffic demand, and number of lanes, including their interactions and cumulative impact on CO2 emissions.
2. Research Design
This paper will consist of the following sections. Section 3 describes the scenario setting up and simulation in VISSIM to obtain the second-by-second vehicle trajectory data. And then, Section 4 describes the process of obtaining the emission factor library in MOVES. Section 5 uses the obtained second-by-second trajectory data and the emission factor database to analyze the relationship between additional CO2 emissions and predictors (traffic flow rate, car-truck ratio, and accident duration), to mine the data features and build a statistical model. Finally, the model results are analyzed and summarized in concluding section.
Figure 1.
Research design.
3. Microscopic Traffic Simulation Modeling
Leveraging the capabilities of VISSIM, a simulation scenario is constructed featuring a freeway long enough to record congestion avoiding its overflowing, which is spanning approximately 6 km with lane width of 3.75 meters. On this basis, the various data detectors required are set up, including vehicle travel time measurement, vehicle network performance recording, vehicle input data collection, etc.
Certain conditions have been simplified or omitted in this study. One such condition is the omission of slope effects. The reason is that in real situations, the gradient of accident congested sections, especially longer congested sections, is dynamic and constantly changing, which is difficult to obtain and consider in simulation and modeling. Future, more complex models can consider incorporating this factor. Besides, the vehicle types are simplified into two categories, cars and trucks. The parameters defining these vehicle types, such as length and width, are set to default values in VISSIM. Specifically, cars are defined with a default length ranging from 3.75 to 4.76 meters and a default width ranging from 1.85 to 2.07 meters, while trucks are defined with a default length of 10.22 meters and a default width of 2.50 meters.
3.1. Driving Behavior
Driving behavior is set to "freeway" in VISSIM including default vehicle following model type of freeways, default lane change rules of freeways, etc.
Vehicle-following refers to the state in which the following vehicle trails the front vehicle in a single lane, including the special case of free flow with no interactions between the following and the front vehicle [20]. Within VISSIM, driver's driving states are classified into four types based on the Wiedemann model: free driving, approaching, following and braking. The vehicle-following model of VISSIM is a time-based, discrete and stochastic microscopic model with driver-vehicle-unit as the basic entity, which contains two main types of vehicle-following models, namely Wiedemann 74 and Wiedemann 99. For this study, the Wiedemann 99 model is applied, as it aligns with driving behavior on suburban or freeway roads [21].
In VISSIM, there are a total of two types of lane change behaviors included: necessary lane changing (to reach the next connector of a route) and free lane changing (if there is enough space in adjacent lane and a higher speed is required). Addressing these aspects, VISSIM integrates two lane change models: “slow lane rule” and “free lane selection”. The “slow lane rule” define the minimum distance to a leading vehicle, allowing overtaking vehicles in other lanes transition to the slower lane. However, this rule is not applicable to freeways. Consequently, the study adopts the “free lane selection” rule, in which the parameters are default.
The calibration of vehicle speed and acceleration distributions is essential in VISSIM. Cars and trucks exhibit mean velocity distributions of “100km/h” (ranging from 88 to 130km/h) and “80km/h” (ranging from 75 to 110km/h), respectively. Regarding acceleration and deceleration behavior, it is need to set the maximum/desired acceleration/deceleration in VISSIM. The maximum acceleration ensures a certain speed on slopes, particularly in situations requiring stronger acceleration. And the maximum deceleration ensures that no even the desired deceleration can fall below it. Only the setting of desired acceleration is considered in this study. The others are set to default functions, whose settings have little effect on the study.
The speed-acceleration functions (desired acceleration functions) of cars and trucks in this study are calibrated using the research findings of Liu et al. [22], which is based on vehicle data collected from the 2011 Atlanta Household and Activity Travel Survey [23]. The reference distribution figure (Figure 2) by Liu et al. illustrates the speed-acceleration data points for cars and trucks, along with the 97.5th line (representing aggressive acceleration) [22]. In VISSIM, however, vehicle accelerations are randomly distributed, represented by the two boundary green curves defining the bandwidth and the red curve defining the median (Figure 2). Although the effect of slope is additionally considered in Liu et al.’s work, this study tentatively omits slope considerations. Thus, the red median line is set by referencing the 97.5th line under a 0% slope condition. As there is no explicit reference for the green boundary line, it is empirically adjusted to encompass a majority of the data points in the reference map. This setup indicates that a significant portion of vehicles will be driven at aggressive accelerations during the simulation, reflecting the future applicable scenario for the model in this study.
3.2. Route Settings
To closely replicate real-world conditions, the study establishes upstream/downstream sections and on/off ramps positioned at both ends of the freeway mainline (Figure 3). The ratio of mainline flow rate to on/off ramp flow rate is empirically set at 16:1. Because this study focuses on the impact of accidents on freeway mainline traffic and the ramp flow is not main concern in this study, its discussion is minimized. To mitigate congestion at the off-ramp during high-flow-rate scenarios, the ramp flow is deliberately maintained at a relatively low proportion. This precautionary measure is to avoid congestion spillover into the accident area, which could potentially interfere with congestion detection and compromise the accuracy of the final model.
When driving along a given route, vehicle behaviors (such as lane change for the off-ramp) need to be taken into account. This study mainly considers “the lane change for off-ramp” behavior setting, which mainly involves determining the distance between the point of lane changing location and the point of off-ramp entrance location. Notably, on freeways, drivers often execute lane changes (typically transitioning to the right lane) well before exiting the mainline road. To avert congestion near the off-ramp, where vehicles in the left lane may queue up and wait to change lanes for exiting the mainline roadway, setting an appropriate distance is crucial. Empirically, this distance between lane changing location and off-ramp entrance location is set at 800 meters.
Furthermore, the yielding rules in on- and off-ramp conflict zones are configured to mirror real-world scenarios, with a prioritization of yielding to the mainline traffic. Specifically, when a ramp vehicle seeks to enter the mainline, and a conflict arises with a moving vehicle in the rightmost lane of the mainline, the ramp vehicles come to a stop and waits until an adequate gap is available for lane changing. This approach is designed to simulate the conflict in the most realistic manner possible, and the interaction between the on-ramp vehicles and the original mainline vehicles.
3.3. Accident Setting
Certain assumptions are made during the simulation process. Notably, road accidents need to be assumed, as VISSIM lacks a module for directly simulating such events. Consequently, a parking lot is established within the driveway to simulate road accidents. Here, driving a vehicle into the parking lot signifies the start of an accident, while departing from the parking lot represents the conclusion of the accident. When the following vehicle detects a stationary vehicle ahead, it exhibits driving behaviors of slowing down, stopping or changing lanes. This response resembles the reaction of the following vehicle during an actual accident, thus justifying the utilization of parking simulation for accident.
The accident duration is controlled by configuring the opening hours of parking lot and parking time length distribution. For comprehensive data collection, the parking lot (accident area) is positioned on the road lane near the end of the detection area (Figure 3). This way, the parking lot can include as much congestion caused by the accident within the detection interval as possible (any incompletely record of congestion sections need to discard). Furthermore, to accommodate accident management activities, the length of parking lot is set to approximately 20-50 meters. Additionally, the lateral placement of the parking lot (accident area) varies in different lane scenarios. In this study, the parking lot is positioned in the second lane from left to right in the four-lane scenarios. Similarly, in the three-lane scenarios it is positioned in the middle lane, and in the two-lane scenarios, it is placed in the right lane.
3.4. Simulation Scenarios
A diverse array of scenarios is designed, encompassing different traffic flow (spanning from congestion to free flow), the accident duration, car-truck ratio, and number of lanes to effectively represent a comprehensive spectrum of real-world cases (Table 1). Each case is subjected to 3-5 random seeds during simulation to mitigate the impact of randomness. The simulation duration is set at 7200 seconds, with a warm-up time of 1800 seconds dedicated to traffic flow stabilization. The accident simulation and data recording start at 1900 seconds. It should be emphasized that in scenarios with varying numbers of lanes (two-, three-, and four -lane), only the number of lanes and the flow rate setting range need to modify. The accident location, the length of the detection area, and the length of the freeway remain consistent.
At last, after a total of 5808 times of simulations, the vehicle second-by-second trajectory data is obtained, which can be used for modeling later.
Based on the queuing situation of the accident lane in various scenarios (Figure 4), accidents primarily impact traffic flow through three distinct phases: the propagation of congestion after the accident onset, the dissipation of congestion after the accident conclusion, and the subsequent stop-and-go during congestion dissipation. The additional emissions arising from these phases collectively constitute the impact of the accident on traffic flow emissions. In the high-traffic scenario, clear patterns of queue gathering and dissipation waves are discernible (Figure 4). Conversely, in low-traffic scenario, such patterns are absent due to the ease with which vehicles can find lane-changing opportunities in adjacent lanes, allowing them to escape the queue, leading to varying queue lengths. However, in high-flow-rate scenarios, vehicles tend to persist in queuing until the accident is resolved, given the challenges associated with the difficulty of lane-changing. Consequently, a gathering wave occurs during the accident, followed by a dissipating wave after accident concludes. This leads to the development of a gathering wave during the accident and a dissipating wave following the conclusion of accident processing. Moreover, a noticeable stop-and-go phenomenon manifests during queue dissipation in high-traffic scenarios. During the queue dissipation phase, the traffic flow approaches the maximum flow rate that the road can accommodate. Therefore, traffic system becomes highly sensitive to various factors (e.g., vehicles changing lanes to exit the freeway), thus accentuating the stop-and-go phenomenon.
4. Emissions Modeling with Moves Emission Factor
The calculation and calibration of CO2 emissions in traffic simulation are achieved through the refinement of the "split-box" emission factor library of MOVES into the "speed-acceleration" emission factor library. The speed-acceleration library of vehicles is categorized into distinct ranges: speed∈[0, 140] km/h and acceleration∈[-2, 10] m/s2. The VSP value corresponding to each speed-acceleration bin is calculated by integrating the vehicle basic information. Subsequently, the study establishes binning intervals for each speed-acceleration bin according to the binning rules of the MOVES emission factor library. CO2 emission factors are then assigned to each speed-acceleration interval with reference to the CO2 emission factor levels in different bins of the MOVES emission factor library. The binning rules from the MOVES emission factor library are provided in the table below:

Table 2.
Binning rules for MOVES emission factor library (18).
| Operating Mode ID | Operating Mode Description | Vehicle Specific Power (VSP) | Vehicle Speed | Vehicle Acceleration |
|---|---|---|---|---|
| (KW/tonne) | (vt, mph) | (a, mph/sec) | ||
| 0 | Deceleration/Braking | at ≤ -2.0 OR (at < -1.0 AND at-1 <-1.0 AND at-2 <-1.0) | ||
| 1 | Idle | -1.0 ≤ vt < 1.0 | Any | |
| 11 | Coast | VSPt< 0 | 0 ≤ vt < 25 | Any |
| 12 | Cruise/Acceleration | 0 ≤ VSPt < 3 | 0 ≤ vt < 25 | Any |
| 13 | Cruise/Acceleration | 3 ≤ VSPt< 6 | 0 ≤ vt < 25 | Any |
| 14 | Cruise/Acceleration | 6 ≤ VSPt < 9 | 0 ≤ vt < 25 | Any |
| 15 | Cruise/Acceleration | 9 ≤ VSPt < 12 | 0 ≤ vt < 25 | Any |
| 16 | Cruise/Acceleration | 12 ≤ VSPt | 0 ≤ vt < 25 | Any |
| 21 | Coast | VSPt < 0 | 25 ≤ vt < 50 | Any |
| 22 | Cruise/Acceleration | 0 ≤ VSPt < 3 | 25 ≤ vt < 50 | Any |
| 23 | Cruise/Acceleration | 3 ≤ VSPt< 6 | 25 ≤ vt < 50 | Any |
| 24 | Cruise/Acceleration | 6 ≤ VSPt < 9 | 25 ≤ vt < 50 | Any |
| 25 | Cruise/Acceleration | 9 ≤ VSPt < 12 | 25 ≤ vt < 50 | Any |
| 27 | Cruise/Acceleration | 12 ≤ VSPt< 18 | 25 ≤ vt < 50 | Any |
| 28 | Cruise/Acceleration | 18 ≤ VSPt < 24 | 25 ≤ vt < 50 | Any |
| 29 | Cruise/Acceleration | 24 ≤ VSPt < 30 | 25 ≤ vt < 50 | Any |
| 30 | Cruise/Acceleration | 30 ≤ VSPt | 25 ≤ vt < 50 | Any |
| 33 | Cruise/Acceleration | VSPt < 6 | 50 ≤ vt | Any |
| 35 | Cruise/Acceleration | 6 ≤ VSPt < 12 | 50 ≤ vt | Any |
| 37 | Cruise/Acceleration | 12 ≤ VSPt <18 | 50 ≤ vt | Any |
| 38 | Cruise/Acceleration | 18 ≤ VSPt < 24 | 50 ≤ vt | Any |
| 39 | Cruise/Acceleration | 24 ≤ VSPt < 30 | 50 ≤ vt | Any |
| 40 | Cruise/Acceleration | 30 ≤ VSPt | 50 ≤ vt | Any |
This study concentrates on the development of CO2 emission factor library by analyzing the vehicle's operational states across various speed-acceleration modes and aligning them with the corresponding MOVES sub-compartment levels. This alignment enables the establishment of direct connections between the vehicle's "speed-acceleration" states and their corresponding CO2 emission levels (Figure 5).
In the above figure, the horizontal axis represents speed (from 0 km/h to 140 km/h), while the vertical axis represents acceleration (from 0 m/s2 to 10 m/s2). The legend on the right-hand side depicts various colors corresponding to emission factors (measured in g/s). This emission factor library serves as a valuable tool to compute the emission data of simulated vehicle trajectories.
5. Statistical Modeling and Results
In the section of traffic simulation, the second-by-second driving states (speed-acceleration information) for all vehicles in the fleet is obtained by the trajectory recording module, thus the speed-acceleration distribution of the fleet can be obtained (Figure 6). In the scenario of high flow rate and long accident duration, the vehicle travel states mainly cluster in the low-speed region, indicating more severe congestion in such scenarios. A substantial number of vehicles experience frequent acceleration and deceleration within congestion or stop-and-go conditions. As the flow rate and accident duration decrease, the proportion of vehicles in the low-speed region gradually diminishes, while the proportion of vehicles in high-speed and low-acceleration region gradually increases. It indicates that in freeway scenarios with low flow rate or brief accident duration, the majority of vehicles experience minimal accident-related impacts and can maintain high cruising speeds. Moreover, the change in vehicle speed-acceleration distribution with varying accident duration is more pronounced in the high-flow-rate scenarios, whereas this change is less notable in low-flow-rate scenarios. This observation offers compelling evidence of the interaction between the effects of these two variables on emissions.
The study integrates the speed-acceleration distribution data with the developed speed-acceleration emission factor library for estimation of vehicle CO2 emissions during the simulation process (Figure 7).
The study successfully derives the comprehensive CO2 emissions in distinct scenarios by aggregating the CO2 emissions from vehicles affected by traffic accidents (Figure 8). Each scenario reveals two prominent emission peaks corresponding to the two vehicle types (cars and trucks), with trucks contributing substantially to emissions despite their lower proportion (ratio=0.1) in the overall fleet. Moreover, in scenarios of high traffic volume and long accident duration, emissions in low-speed and low- acceleration, as well as low-speed and high-acceleration states, constitute a significant proportion. This is because a substantial number of vehicles is in low-speed states. Additionally, similar to the (data volume) speed-acceleration distribution, the emission peaks predominantly occur in the high-speed and low-acceleration region as flow rate and accident duration decrease.
The simulation data requires scrutiny and preprocess before modeling. The set length of the detection area in the simulation is 6 km, and the simulation time is limited to 7200s. As a result, if the congestion queue length exceeds 6 km, or if the congestion persists beyond the end of the simulation, some vehicle congestion is not recorded. To ensure the accuracy of modeling, such data segments need to be removed from the sample. Additionally, despite the requirement for parking (accident occurring), the situation where there is no parking still occurs. This arises from the parking duration being defined by the time length distribution. In other words, despite controlling the randomness of the parking duration with minimal variance, instances may arise where the required parking duration is longer than the opening time of parking lot, resulting in vehicles not parking (the accident does not occur). Consequently, such data segments need to be deleted.
The response variable of the model is the additional CO2 emissions of the scenario, calculated as the difference between the total CO2 emissions of the scenario with an accident and the total CO2 emissions of the scenario without an accident (with an accident duration of 0 min) under identical conditions. This approach highlights the impact of CO2 emissions resulting from accidents. Subsequently, considering the accessibility of the predictors and potential influence on emissions, the predictors are finally selected including the proportion of trucks (representing the car: truck ratio), hourly traffic volume (measured in veh/h) and the accident duration (measured in min).
The modeling process adheres to realistic constraints and incorporates relevant data features. Such as the nonlinear relationship that may exist between the response variable and each of the three predictors (Figure 9). After exhaustive comparisons of various function types, it is observed that the relationship between additional emissions and traffic flow rate exhibit a clear trend towards an exponential function. However, the impact of accident duration or proportion of trucks on additional emissions demonstrates trend towards power function. Furthermore, the interaction and correlation between each predictor are obvious (Figure 10). For instance, in the particular scenario (Flow Rate / Proportion of Trucks / Accident Duration= 4800 / 0.5 / 30), when accident duration or proportion of trucks decrease, it is evident that the additional emissions for the same flow rate are reduced. While the overall trend of the relationship between additional emissions and traffic flow rate remains consistent.
Additionally, the constraints considered by the model are as follows:
- When the flow rate is 0, the additional CO2 emission must be 0
- When the accident duration is 0, the additional CO2 emission must be 0
- When the truck proportion is 0, the additional CO2 emission must be greater than 0
Based on the data features and constraints, as well as the attempts of multiple functional forms, the final selected model form is as follows. The variable "Flow Rate" (veh/h) is transformed as "exp(b*flow) ", and the variables "accident duration" (min) and "the proportion of trucks" are transformed as "Accident-Duration^b" and “Truck-Proportion^b"(“b” is parameter required to fit). Estimates of each parameter are obtained using the nonlinear regression module of R (Table 3). The model formula is as Equation 1-3:
In Equation 1-3 and Table 3, is additional CO2 emissions due to accidental congestion (ton), is traffic flow rate (veh/h), is the proportion of trucks, is accident duration (min) and are the model parameters to be fitted.
In the process of parameter fitting, we mainly utilized the nonlinear least squares function in R and adopted the Gauss-Newton algorithm for solving. The use of this function requires providing initial values for each parameter, which are obtained empirically through repeated attempts to acquire well-behaved values.
The goodness-of-fit indicators for the model mainly include adjusted R2, RMSE and a comparison between predicted and actual (simulated) values. The models for each scenario exhibit compelling goodness of fit with notably high adjusted R2 (ranging from 0.960 to 0.977) and low RMSE values (ranging from 0.160 to 0.432). Meanwhile, the scattered points are evenly and closely distributed around the y = x line. These observations exhibit the strong alignment of the model result with the simulation data (Figure 11).
For validating the model, test data is obtained by resetting the VISSIM scenarios and conducting simulations. Specifically, the two-, three- and four-lane scenarios are simulated respectively, encompassing various conditions of high/low traffic flow rate, high/low proportion of trucks and high/low accident duration. Therefore, for each model, there are 240 different simulation results to test (Table 4). To ensure the integrity and credibility of data validation, this study intentionally select some cases that are not included in the previous sample data as much as possible, and even incorporated some extreme cases (such as the proportion of trucks is 0) to test the robustness of the model.
Regarding the model validation metrics, RMSE and comparison between predicted and actual (simulated) values are considered. As shown in the figure, the model validation results perform very well (Figure 12), which prove the robustness and accuracy of these models.
From this statistical model, it is evident that the impact of accident duration, truck proportion and traffic flow rate on the additional emissions caused by accidents is nonlinear (Equation 1-3). This nonlinearity indicates that the marginal effect of these three variables on emissions increases with the increase of themselves. Moreover, there is also a clear interaction between variables in the statistical model. The effects of each variable on emissions vary in response to changes in the other two, with a mutually reinforcing and positive relationship. For instance, at high traffic demand or long accident duration, optimizing accident management efficiency (reducing management time) results in more substantial emission reductions compared to scenarios with low traffic demand or short accident duration.
A comparison of the three models reveals that the two-lane model exhibits superior fit compared to the other two models (Figure 11, Figure 12). This superiority can be attributed to the fact that the two-lane model incorporates fewer stochastic factors, such as fewer free lane-changing behaviors, compared to the other two scenarios. Regardless of the number of lanes in the scenario, CO2 emissions demonstrate increasingly sensitivity to the accident duration as traffic flow rate and the proportion of trucks rise. In addition, CO2 emissions are more sensitive to traffic flow rate in comparison to accident duration and the proportion of trucks. This implies that implementing measures to evacuate vehicles from the accident area (to reduce traffic flow rate in the accident area) may prove more effective in mitigating emissions than other emission reduction measures.
6. Conclusions
This study quantifies the nonlinear relationship and positive interaction between additional CO2 emissions due to accidents and three key predictors (accident duration, traffic flow rate and the proportion of trucks). The findings demonstrate that optimizing accident management efficiency results in more substantial emission reductions in scenarios with high traffic demand or long accident duration. Moreover, the study suggests that implementing measures to evacuate vehicles from the accident area (to reduce traffic flow rate in the accident region) may be more effective than alternative emission reduction measures. The modeling approach employed in this paper can serve as a viable and valuable reference for future studies seeking to model real-world data.
The model proposed in this study holds promising potential for providing valuable guidance with formulating emission reduction strategies and serving as a reference for policy-making decisions. By quantitatively assessing the impact of accident on CO2 emissions and the impact of accident management efficiency, the model can help freeway O&M companies and relevant stakeholders adopting more targeted means to mitigate the influence of accidents on CO2 emissions. For instance, if improving the efficiency of accident management requires the employment of engineering equipment that emits more CO2, we should consider the impact of efficiency improving strategies from a full life cycle perspective. In other words, if the reduction in emissions from the improved efficiency is significantly less than the increase in emissions from the equipment, it will be unadvisable to implement those strategies to improve the efficiency of accident management.
There is still a lot of work ahead. Many assumptions and simplifications made during the current study present opportunities for further refinement. For instance, enrichment of simulated vehicle types and incorporating emission factors for vehicles with different emission standards are areas that warrant attention in future investigations. The model still has potential for improvement. The model validation of this study is currently conducted through VISSIM simulations, but future improvements may involve refining the model based on real-world data to enhance its applicability in real scenarios.
Moreover, there is scope for enhancing the research design in future work. While this study is conducted at the micro level, a more macroscopic simulation is essential to evaluate the impact of the accident duration on the traffic flow of road network (particularly for urban traffic accidents). In addition, this study can be used to evaluate measures of improving the efficiency of accident management, but there are numerous other measures for accident abatement (speed management, traffic flow smoothing, etc.). Future work can enrich and expand the model to encompass a broader range of measure assessments.
Author Contributions
The authors confirm contribution to the paper as follows: study conception and design: H.L.; data collection: C.L.; analysis and interpretation of results: Y.W., C.L., Q.N. and H.L.; draft manuscript preparation: Y.W., C.L. and Q.N. All authors reviewed the results and approved the final version of the manuscript.
Funding
This research was funded by Young Scientist Fund of the National Natural Science Foundation of China (NO. 52202420).The research is also partially supported by the Belt and Road Cooperation Program under the 2023 Shanghai Action Plan for Science, Technology and Innovation (NO. 23210750500), as well as Special Project for Carbon Peak and Carbon Neutrality under the 2022 Shanghai Action Plan for Science, Technology and Innovation (NO. 22dz1207403).
Institutional Review Board Statement
Not applicable.
Informed Consent Statement
Not applicable.
Data Availability Statement
Data are contained within the article.
Conflicts of Interest
The authors declare no conflicts of interest.
References
- US Environmental Protection Agency. (2023). Fast Facts on Transportation Greenhouse Gas Emissions 1990-2021. EPA-420-F-23-016.
- Pei-Ning, T. I. A. N., Bao-Hua, M. A. O., Rui-Yong, T. O. N. G., Hao-Xiang, Z. H. A. N. G., & Qi, Z. H. O. U. (2023). Analysis of carbon emission level and intensity of China’s transportation industry and different transportation modes. Advances in Climate Change Research, 19(3), 347.
- Smit, R., Brown, A. L., & Chan, Y. C. (2008). Do air pollution emissions and fuel consumption models for roadways include the effects of congestion in the roadway traffic flow?. Environmental Modelling & Software, 23(10-11), 1262-1270. [CrossRef]
- Schrank, D., Albert, L., Eisele, B., & Lomax, T. (2021). Urban mobility report 2021.
- Giuliano, G. (1989). Incident characteristics, frequency, and duration on a high volume urban freeway. Transportation Research Part A: General, 23(5), 387-396. [CrossRef]
- Barth, M., & Boriboonsomsin, K. (2008). Real-world carbon dioxide impacts of traffic congestion. Transportation research record, 2058(1), 163-171. [CrossRef]
- Owens, N., Armstrong, A., Sullivan, P., Mitchell, C., Newton, D., Brewster, R., & Trego, T. (2010). Traffic incident management handbook (No. FHWA-HOP-10-013).
- Servin, O., Boriboonsomsin, K., & Barth, M. (2006, September). An energy and emissions impact evaluation of intelligent speed adaptation. In 2006 IEEE Intelligent Transportation Systems Conference (pp. 1257-1262). IEEE.
- Chung, Y., Cho, H., & Choi, K. (2013). Impacts of freeway accidents on CO2 emissions: A case study for Orange County, California, US. Transportation research part D: transport and environment, 24, 120-126.
- de Barros Baltar, M. L., de Abreu, V. H. S., Ribeiro, G. M., & Santos, A. S. (2021). Evaluating impacts of traffic incidents on CO 2 emissions in express roads. LCA based carbon footprint assessment, 35-53. [CrossRef]
- Yu, Z., Yang, J., & Huang, H. H. (2023). Smoothing regression and impact measures for accidents of traffic flows. Journal of Applied Statistics, 1-16.
- Liao, X., Wu, G., Yang, L., & Barth, M. J. (2023). A Real-World Data-Driven approach for estimating environmental impacts of traffic accidents. Transportation research part D: transport and environment, 117, 103664. [CrossRef]
- Chien, S. I. J., Goulias, D. G., Yahalom, S., & Chowdhury, S. M. (2002). Simulation-based estimates of delays at freeway work zones. Journal of Advanced Transportation, 36(2), 131-156. [CrossRef]
- Karioti, E., Basbas, S., Mintsis, E., Mintsis, G., & Taxiltaris, C. (2017). Traffic and environmental impacts of traffic incidents on Thessaloniki’s inner ring road. Transportation research procedia, 24, 288-295. [CrossRef]
- US Environmental Protection Agency. (2018). MOVES2014a: Latest Version of MOtor Vehicle Emission Simulator (MOVES).
- Scora, G., & Barth, M. (2006). Comprehensive modal emissions model (cmem), version 3.01. User guide. Centre for environmental research and technology. University of California, Riverside, 1070, 1580.
- Nam, E. K., & Giannelli, R. (2005). Fuel consumption modeling of conventional and advanced technology vehicles in the physical emission rate estimator (PERE). US environmental protection agency.
- US Environmental Protection Agency. (2016). Population and activity of on-road vehicles in MOVES2014. EPA-420-R-16-003.
- Bruce, P., & Bruce, A. (2017). Practical Statistics for Data Scientists. O'Reilly Media. Inc., Sebastopol, CA. Bruce, P., & Bruce, A. (2017). Practical Statistics for Data Scientists. O'Reilly Media. Inc., Sebastopol, CA.
- Olstam, J. J., & Tapani, A. (2004). Comparison of Car-Following Models, Swedish National Road and Transport Research Institute. Project VTI meddelande, 960.
- Anil Chaudhari, A., Srinivasan, K. K., Rama Chilukuri, B., Treiber, M., & Okhrin, O. (2022). Calibrating Wiedemann-99 model parameters to trajectory data of mixed vehicular traffic. Transportation research record, 2676(1), 718-735. [CrossRef]
- Liu, H., Rodgers, M. O., & Guensler, R. (2019). Impact of road grade on vehicle speed-acceleration distribution, emissions and dispersion modeling on freeways. Transportation research part D: transport and environment, 69, 107-122.
- Atlanta Regional Commission. (2011). Household Travel Survey.
Figure 2.
Speed-Acceleration distribution of the car and the truck.
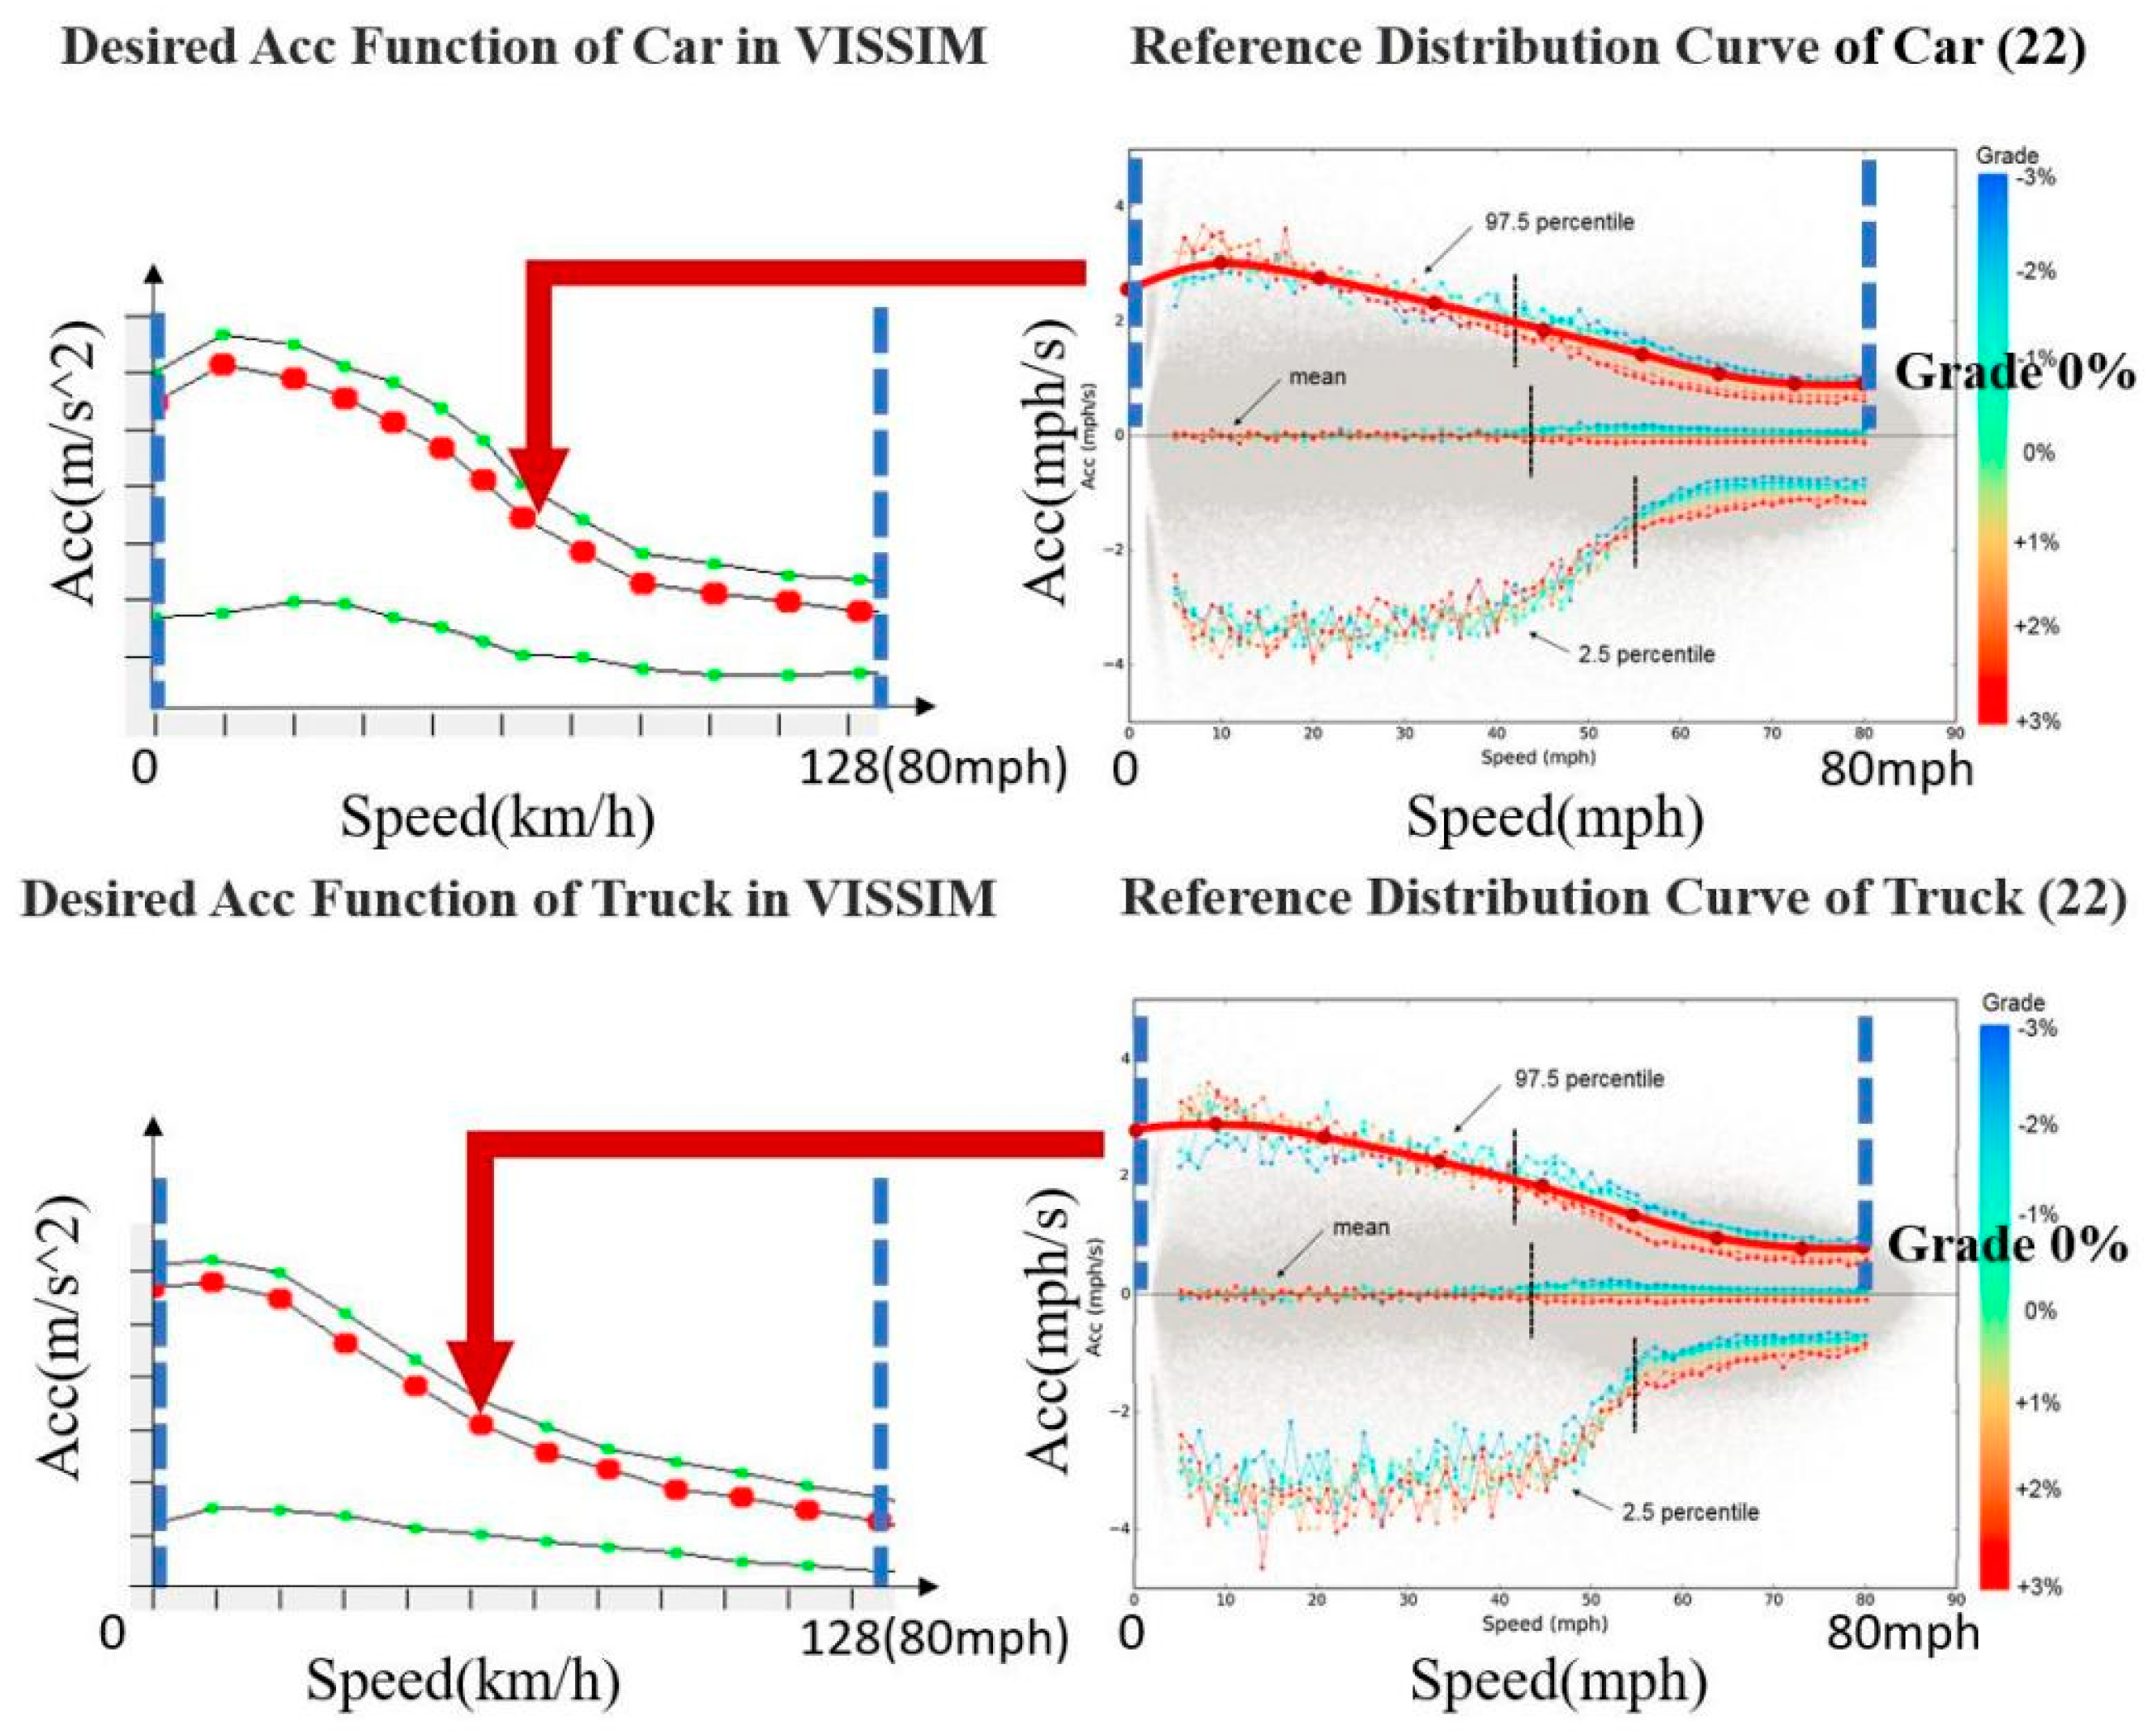
Figure 3.
VISSIM simulation scenario with screenshot of vehicle performance in the area around the parking lot during the accident (four lanes).
Figure 3.
VISSIM simulation scenario with screenshot of vehicle performance in the area around the parking lot during the accident (four lanes).
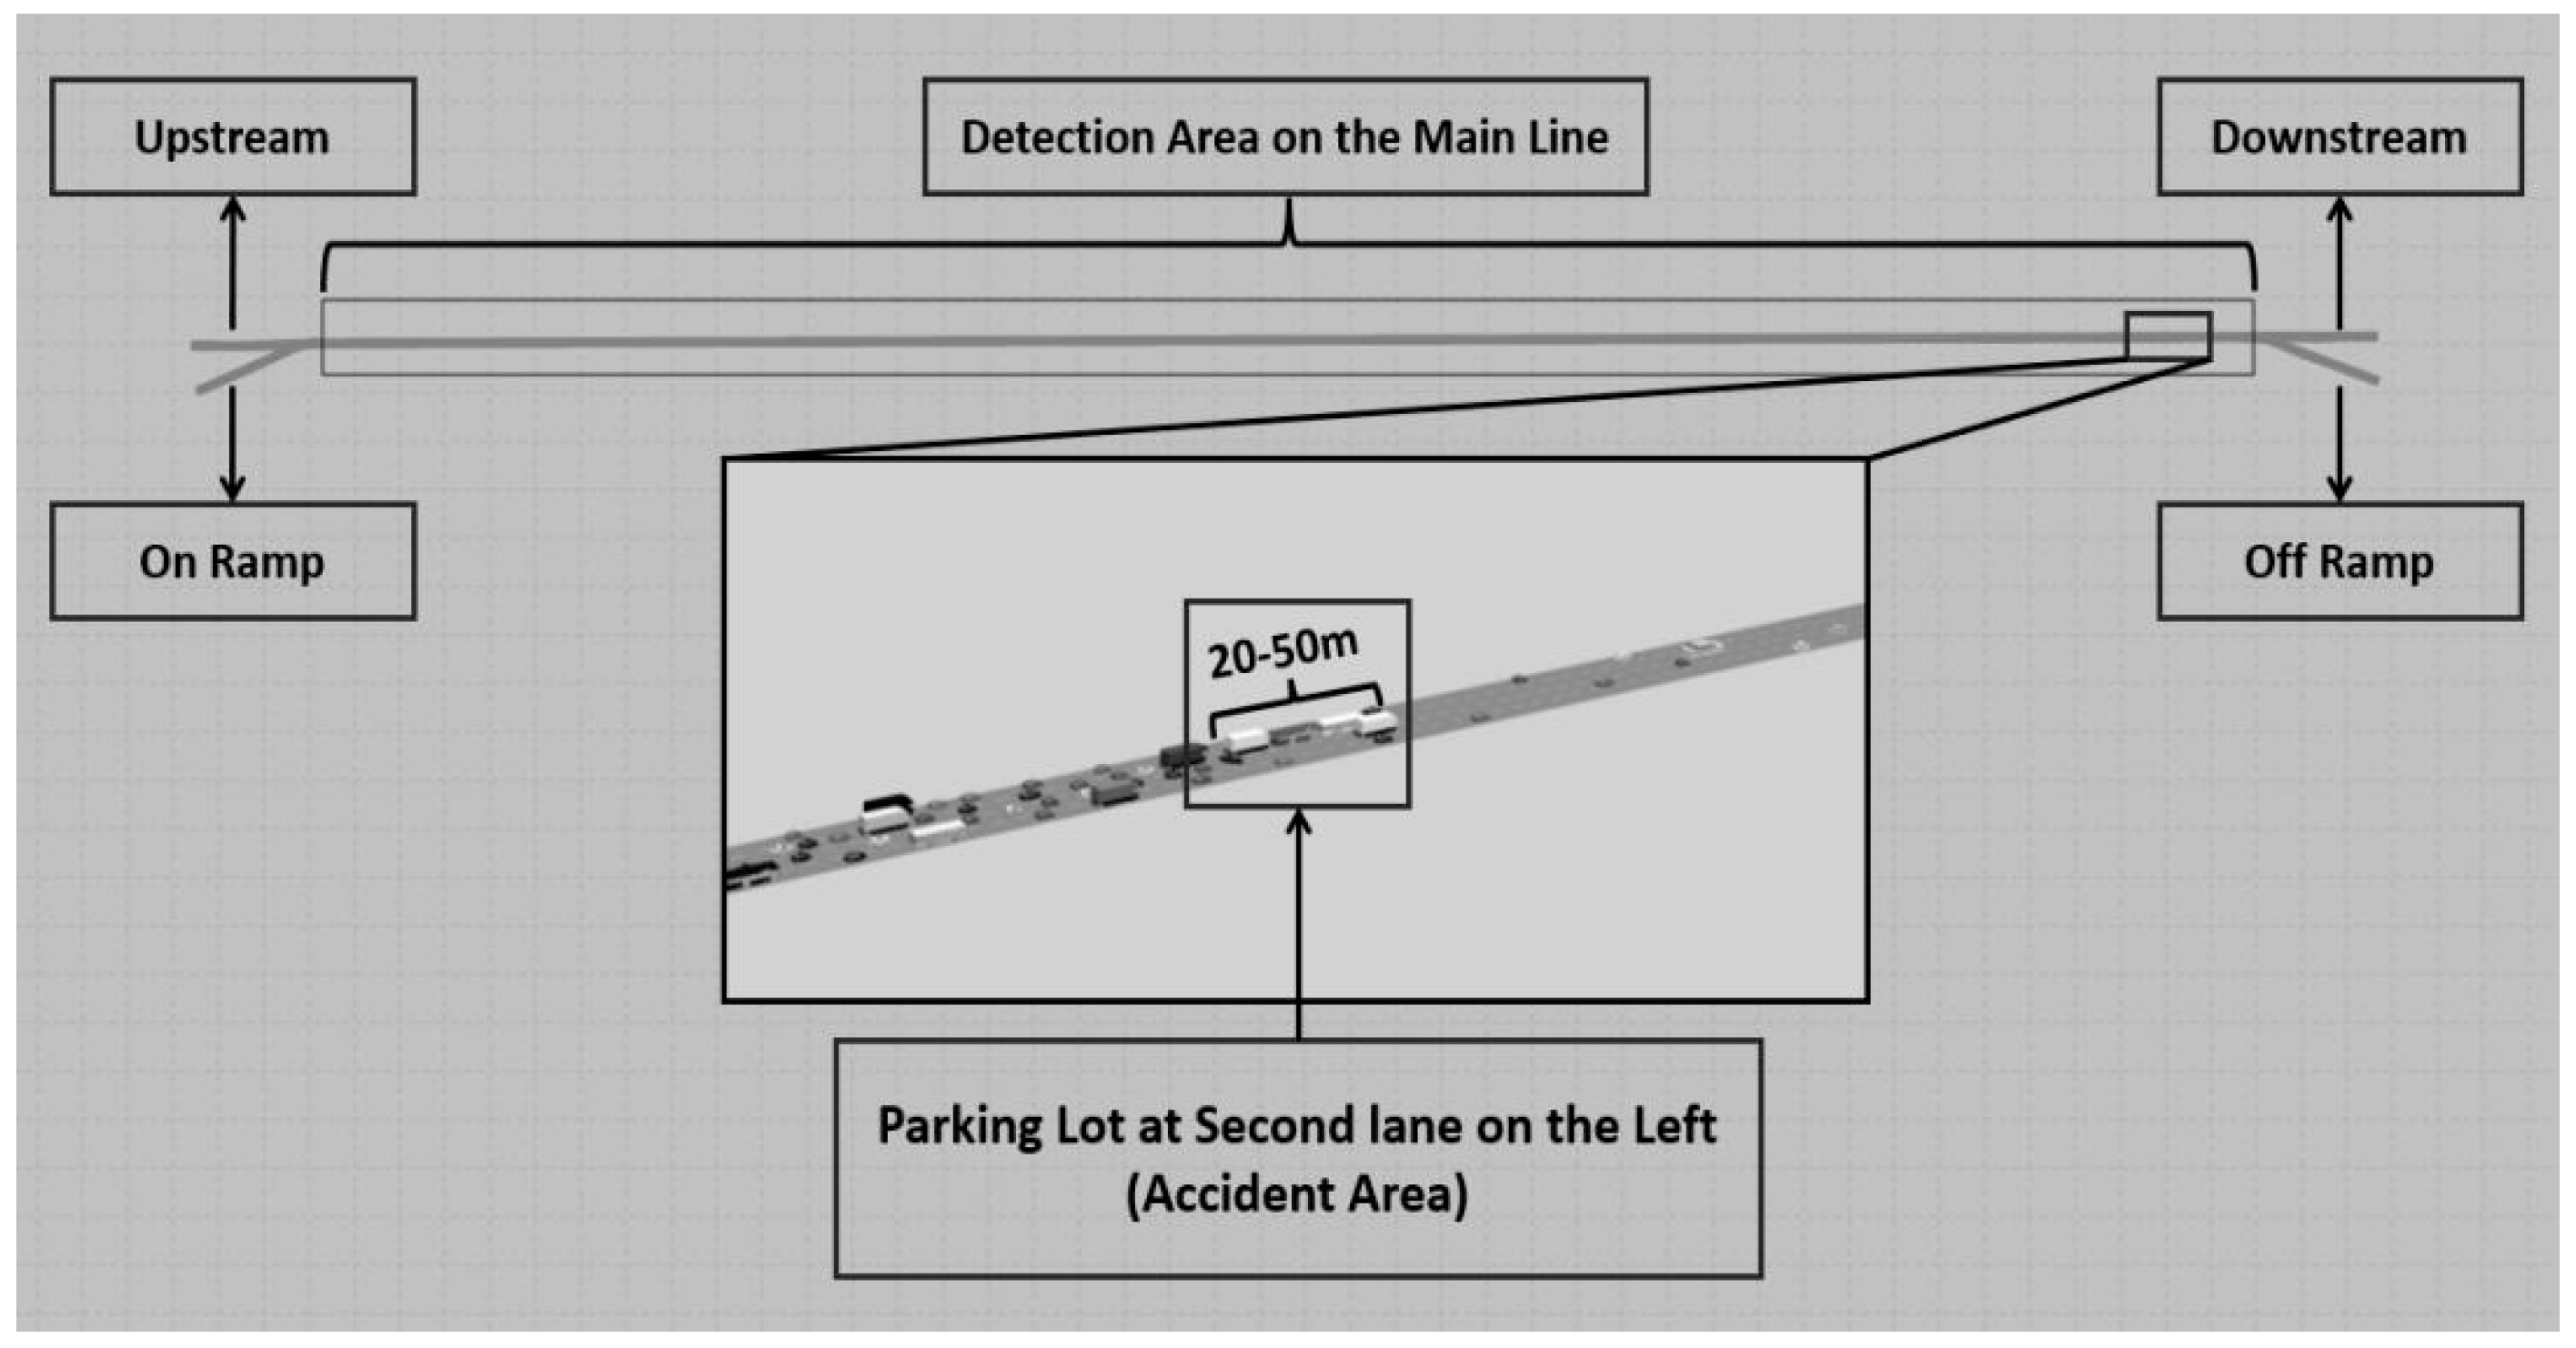
Figure 4.
Scatterplot of speed in the lane where the accident happened (car: truck =9:1) (four Lanes).
Figure 4.
Scatterplot of speed in the lane where the accident happened (car: truck =9:1) (four Lanes).
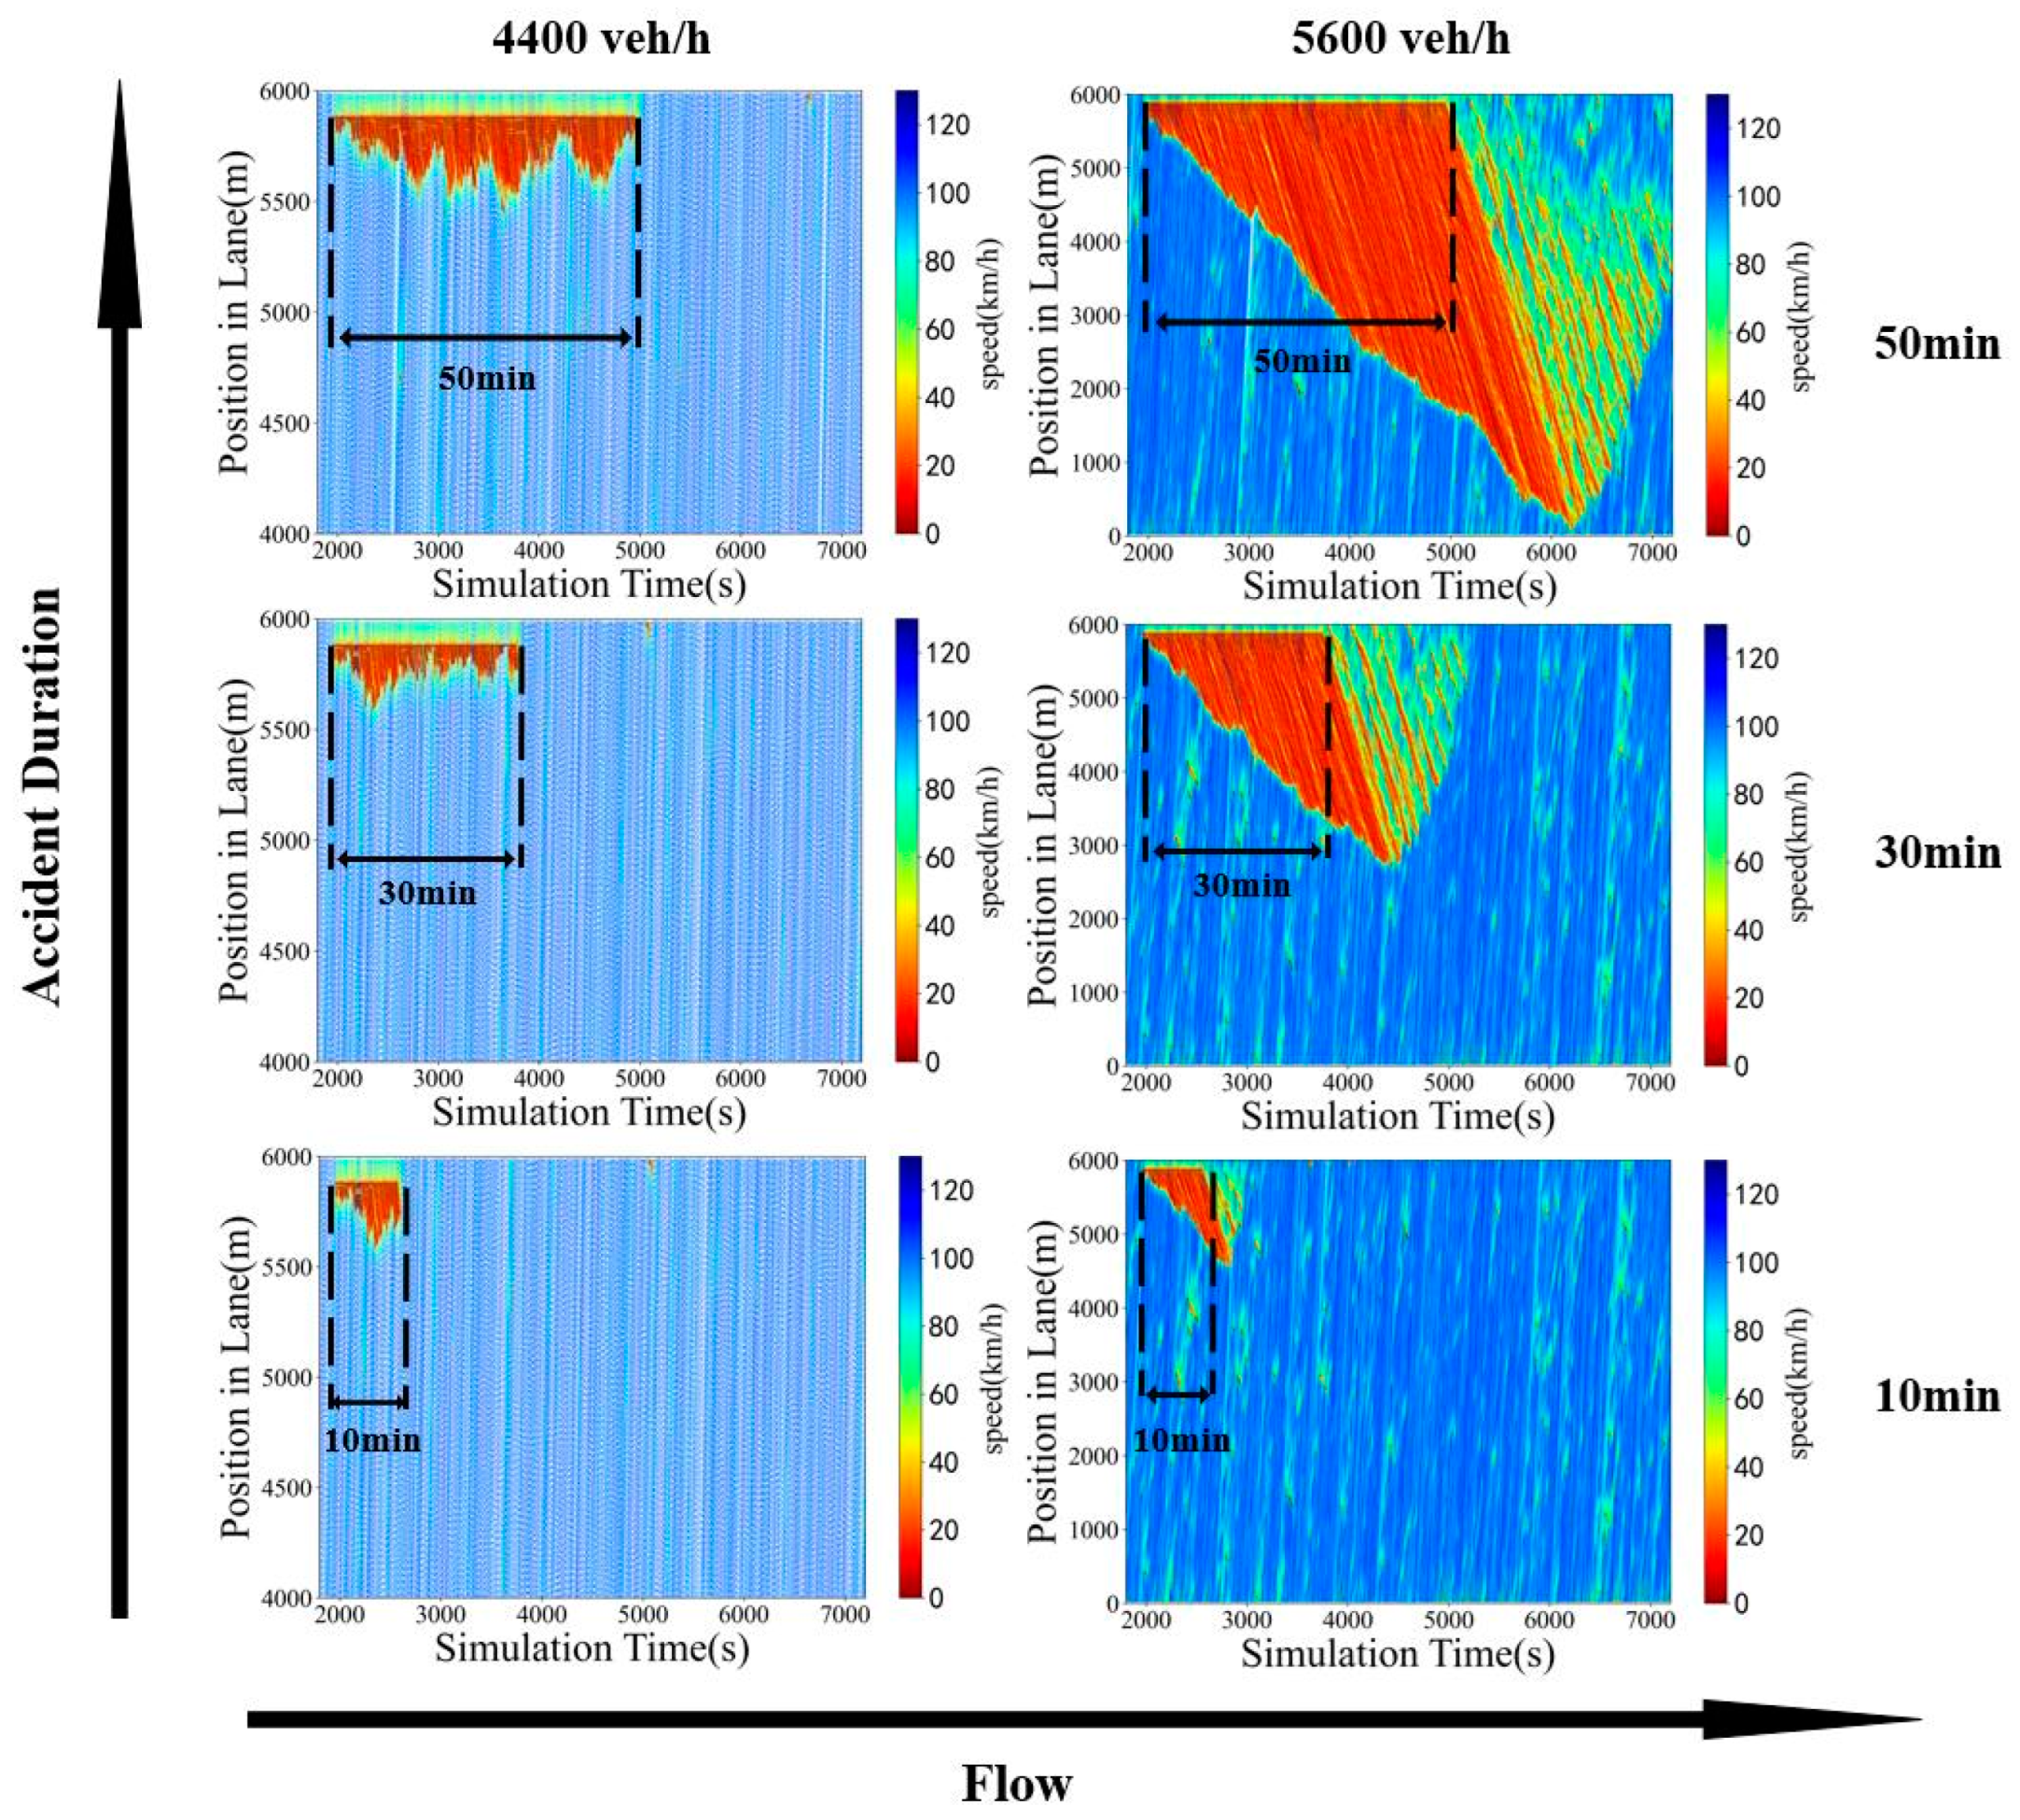
Figure 5.
Carbon emission factor pool construction process.
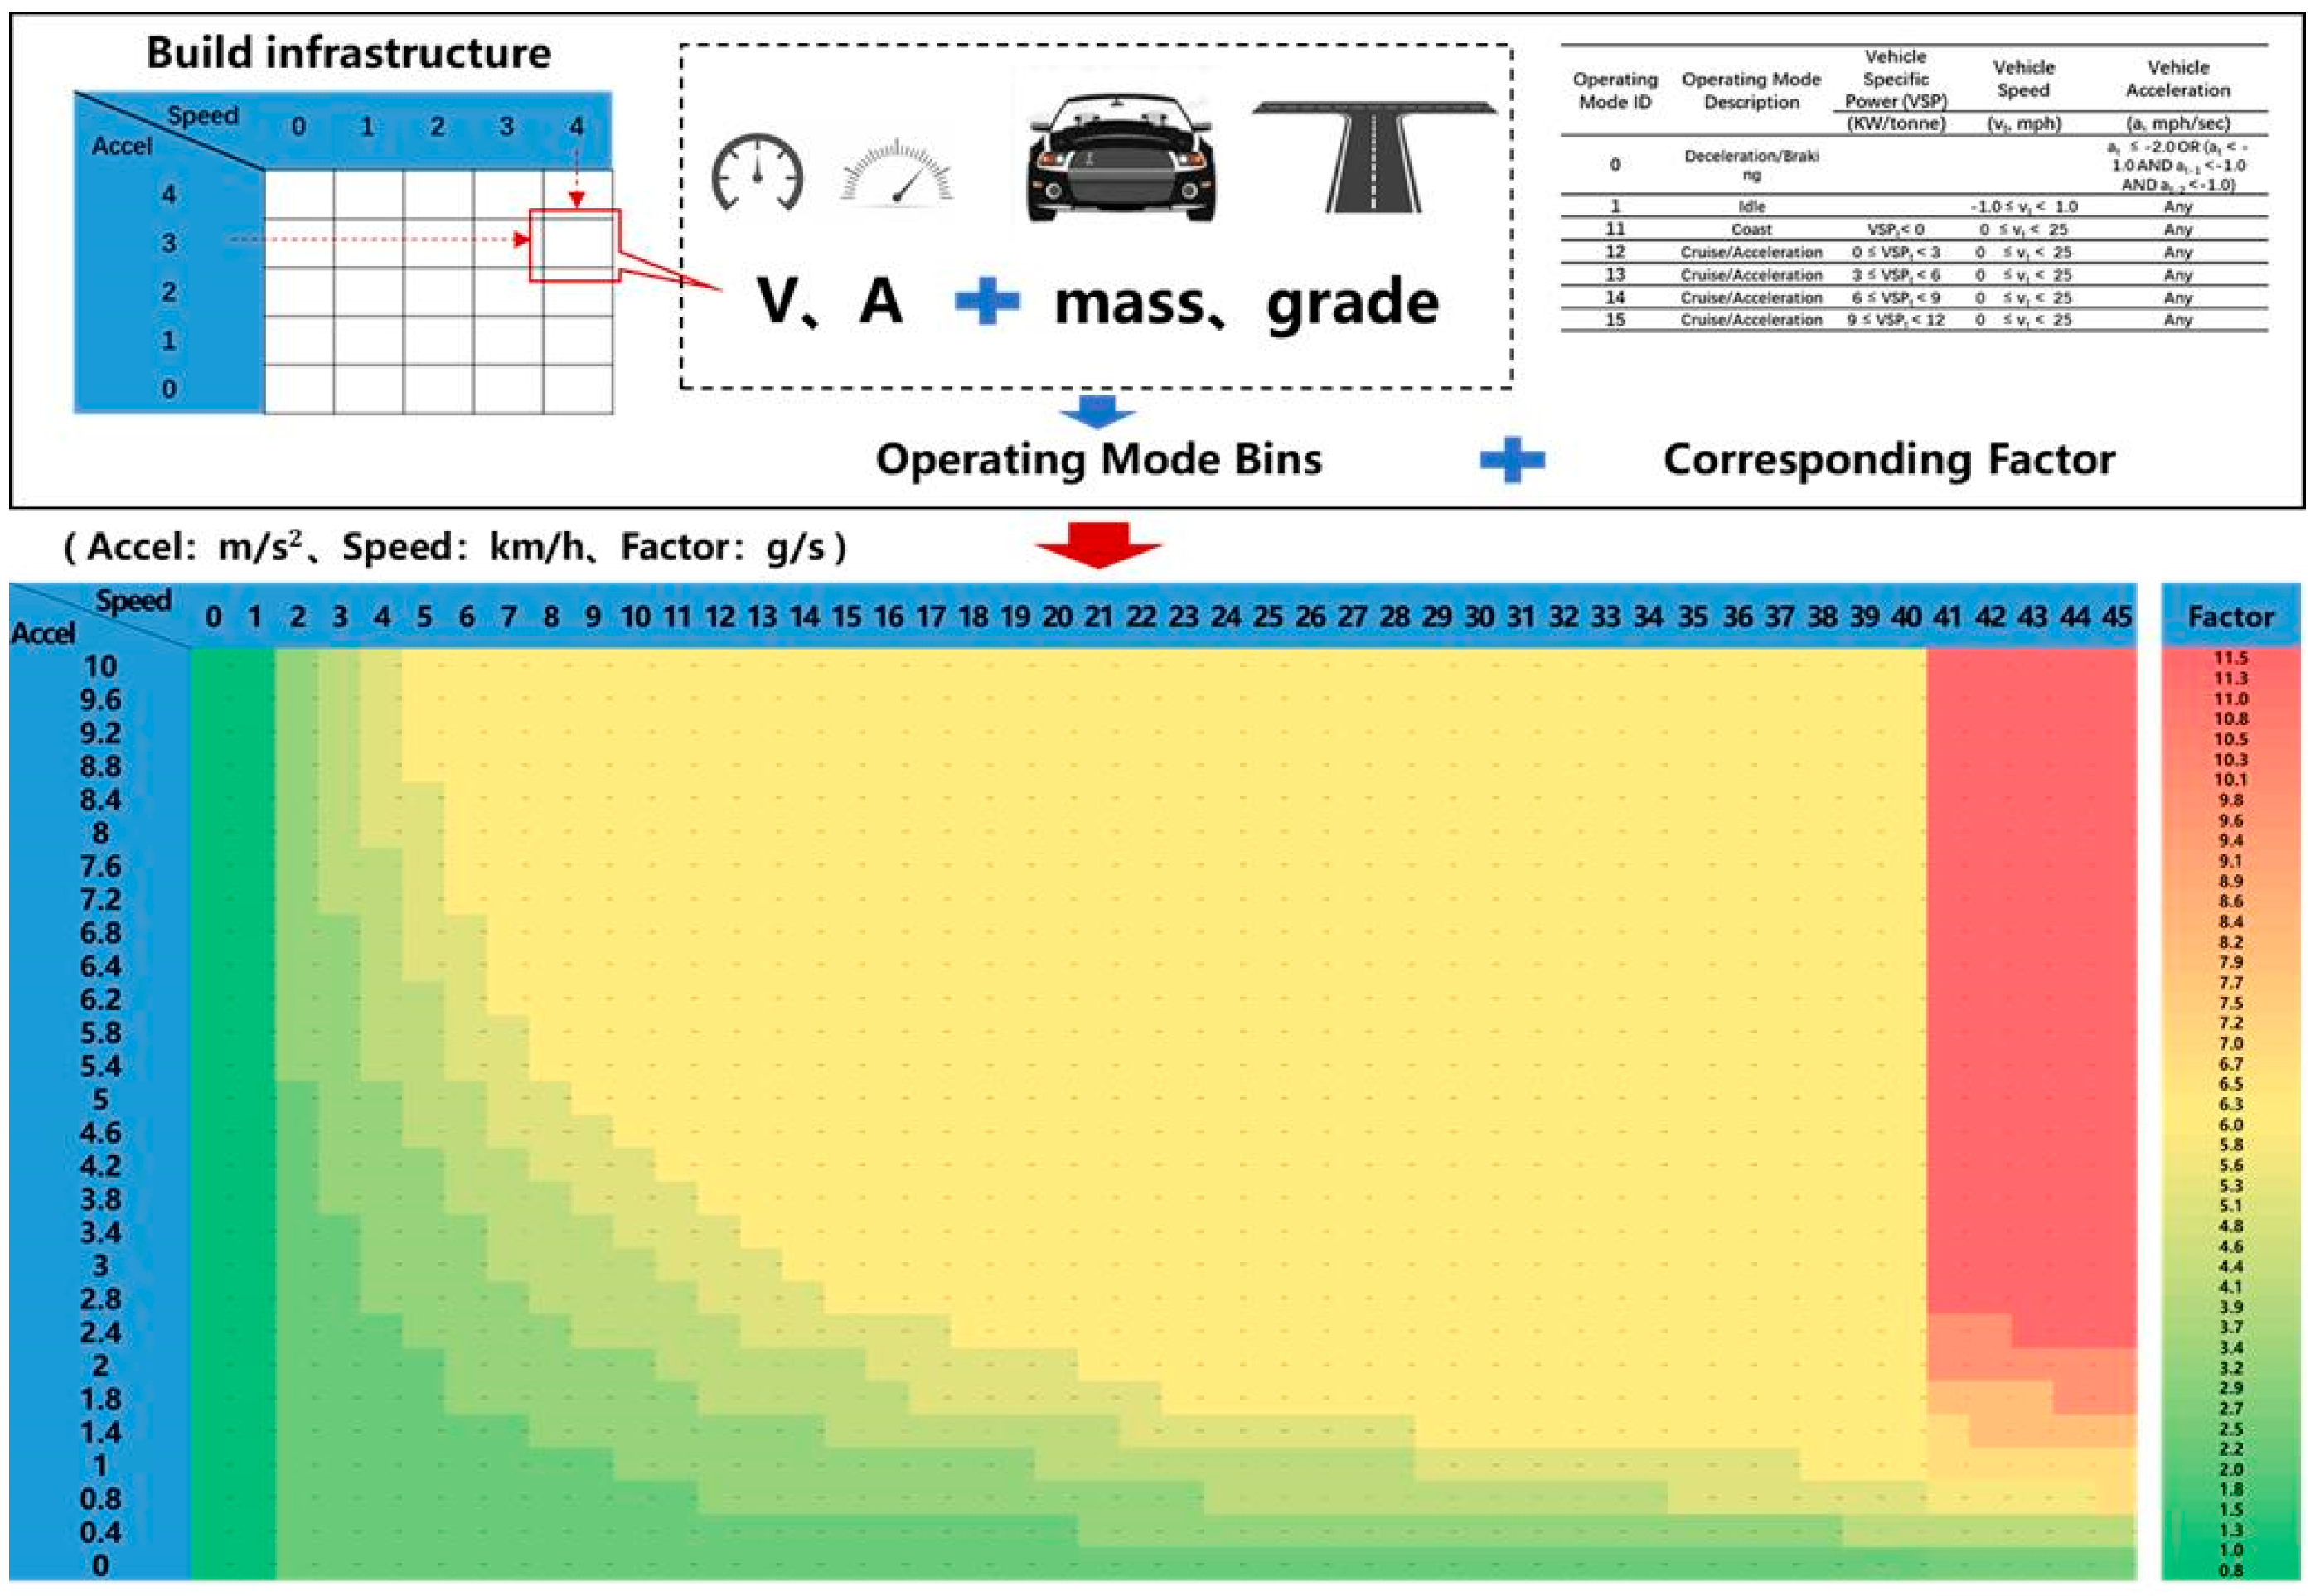
Figure 6.
Speed-Acceleration distribution (simulated data volume) (car: truck =9:1) (four lanes).

Figure 7.
The calculation process of fleet carbon emissions.
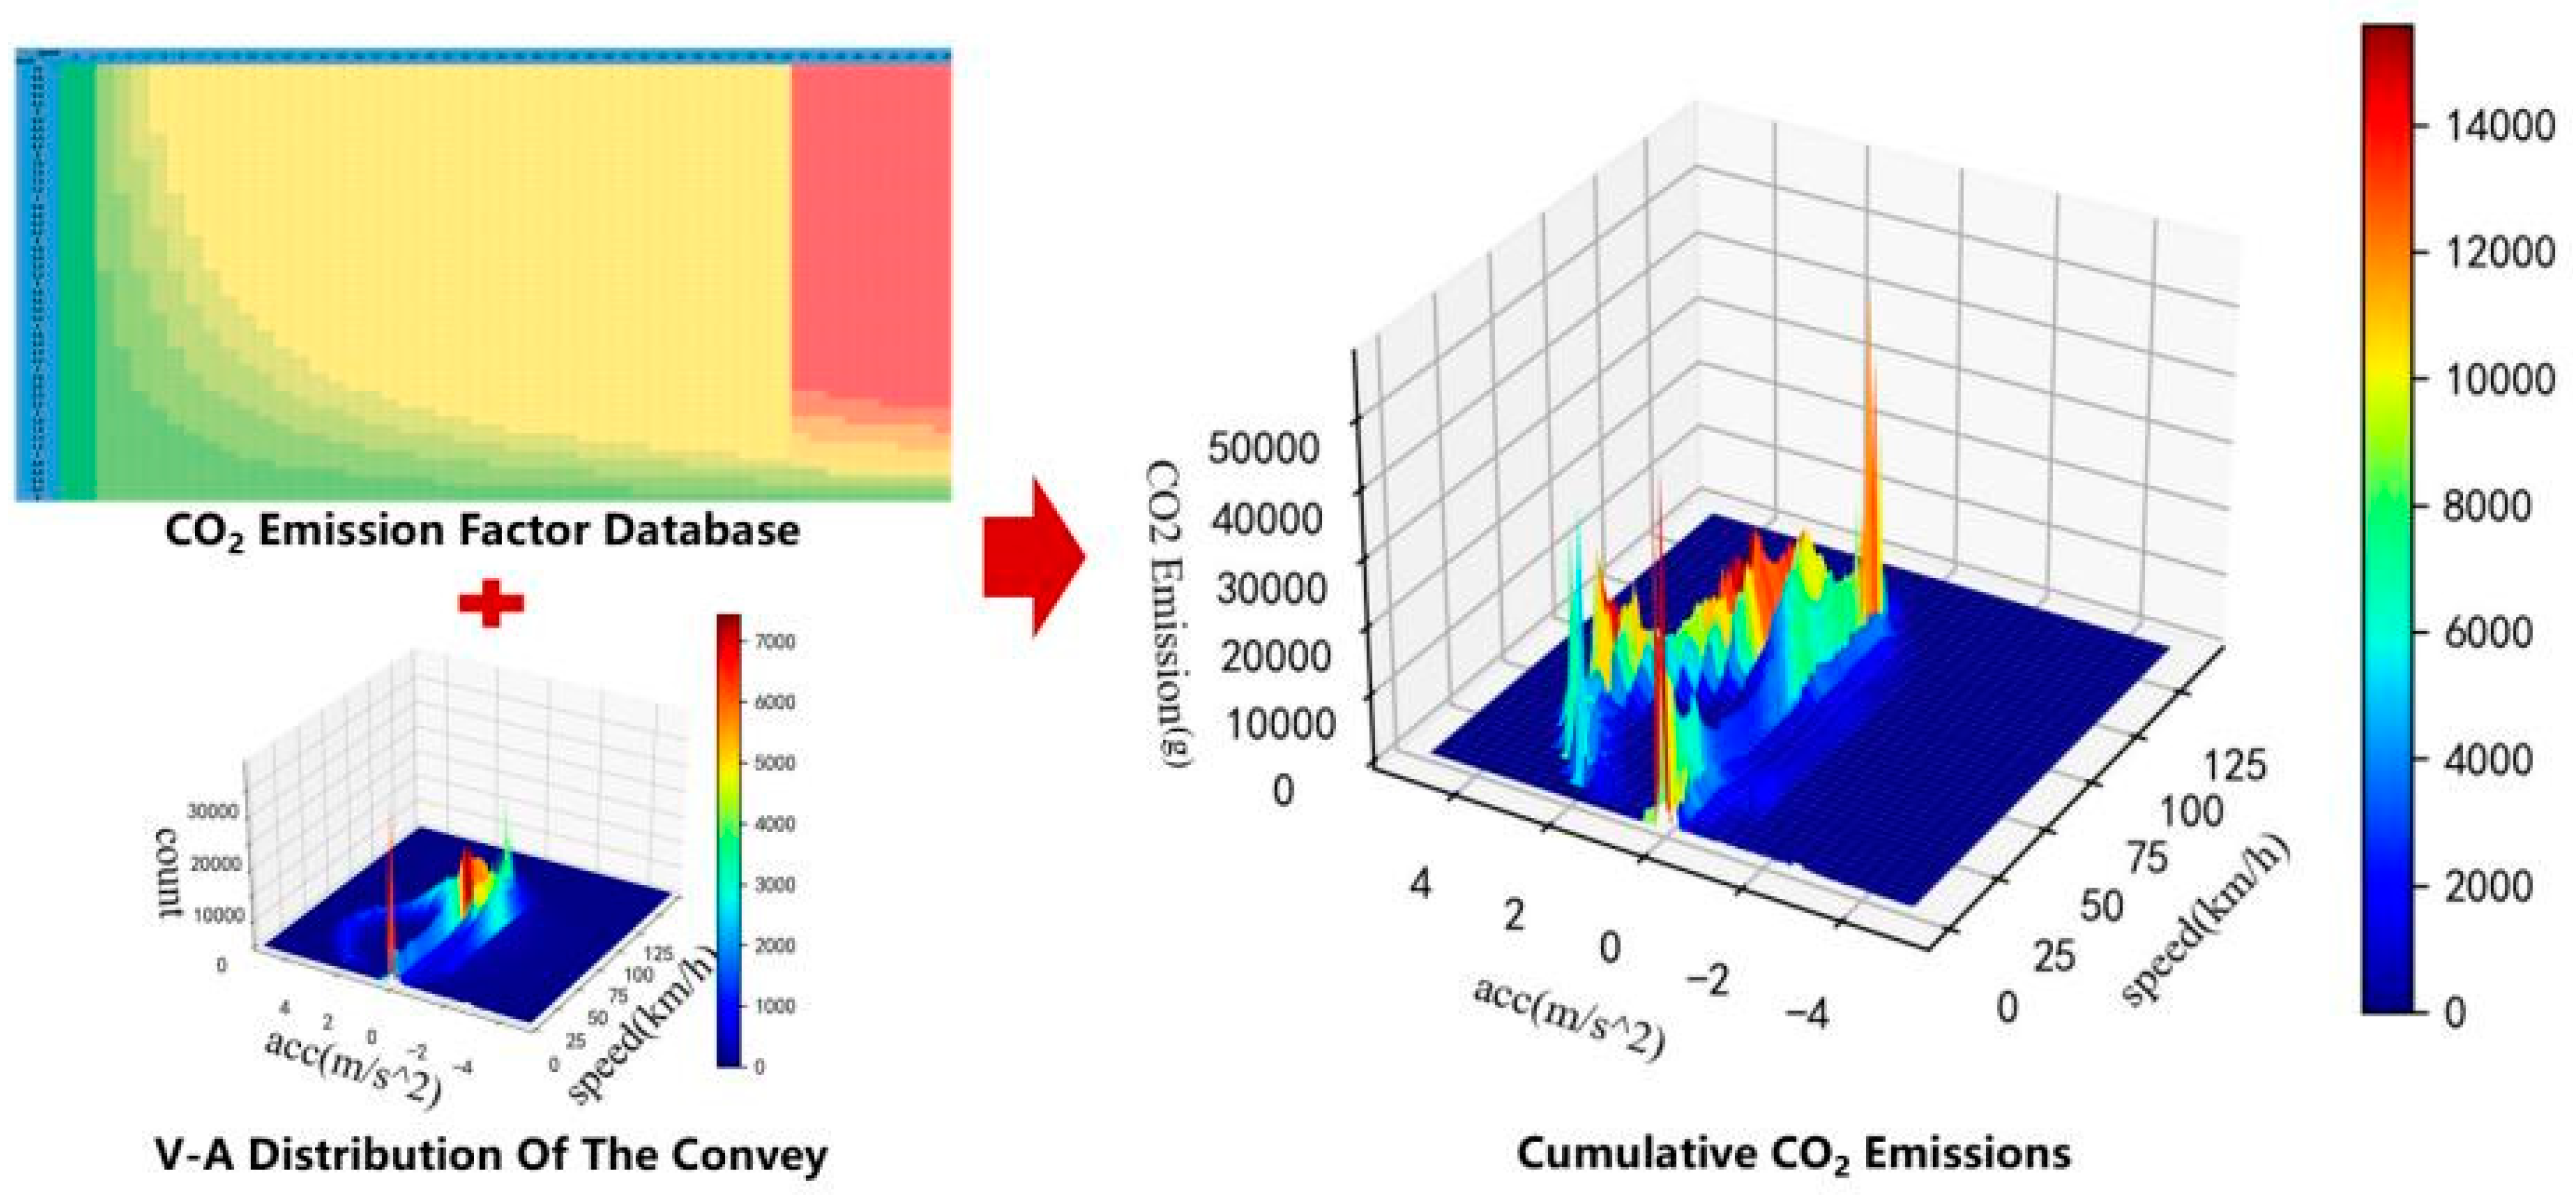
Figure 8.
Speed and acceleration distribution of CO2 emission (car: truck =9:1) (four lanes).
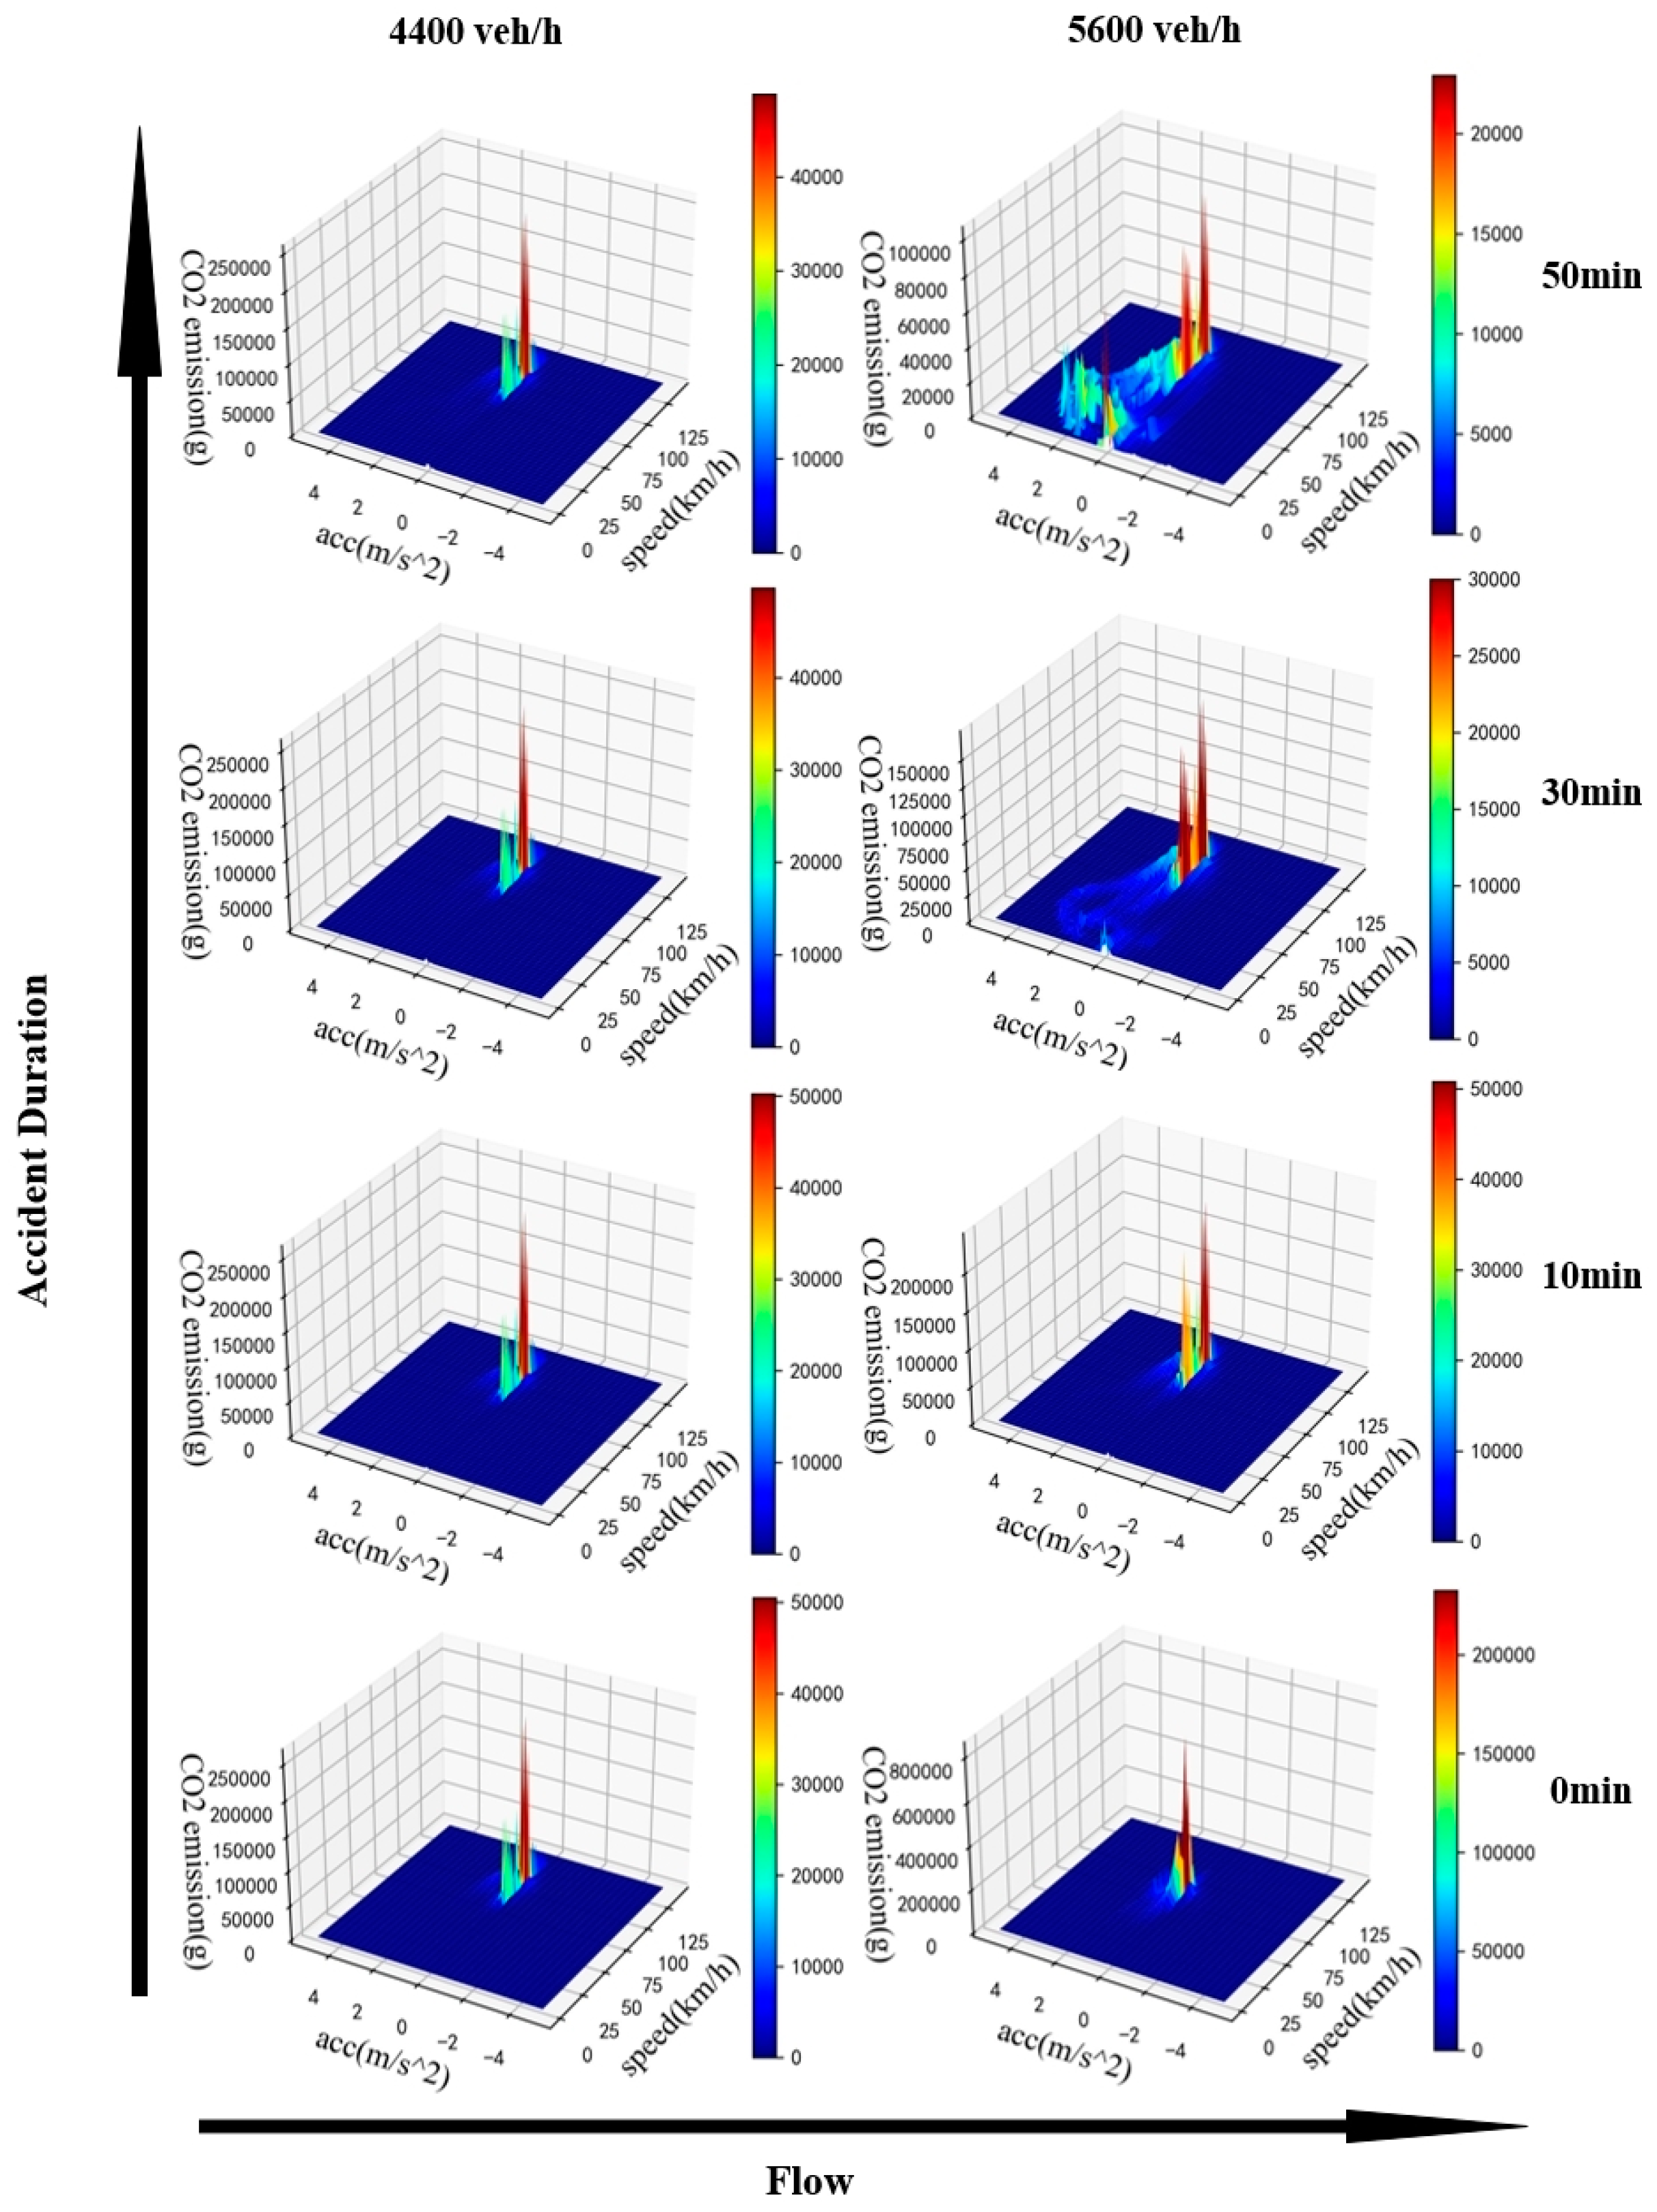
Figure 9.
The nonlinear data features of a particular scenario as an example (four lanes).
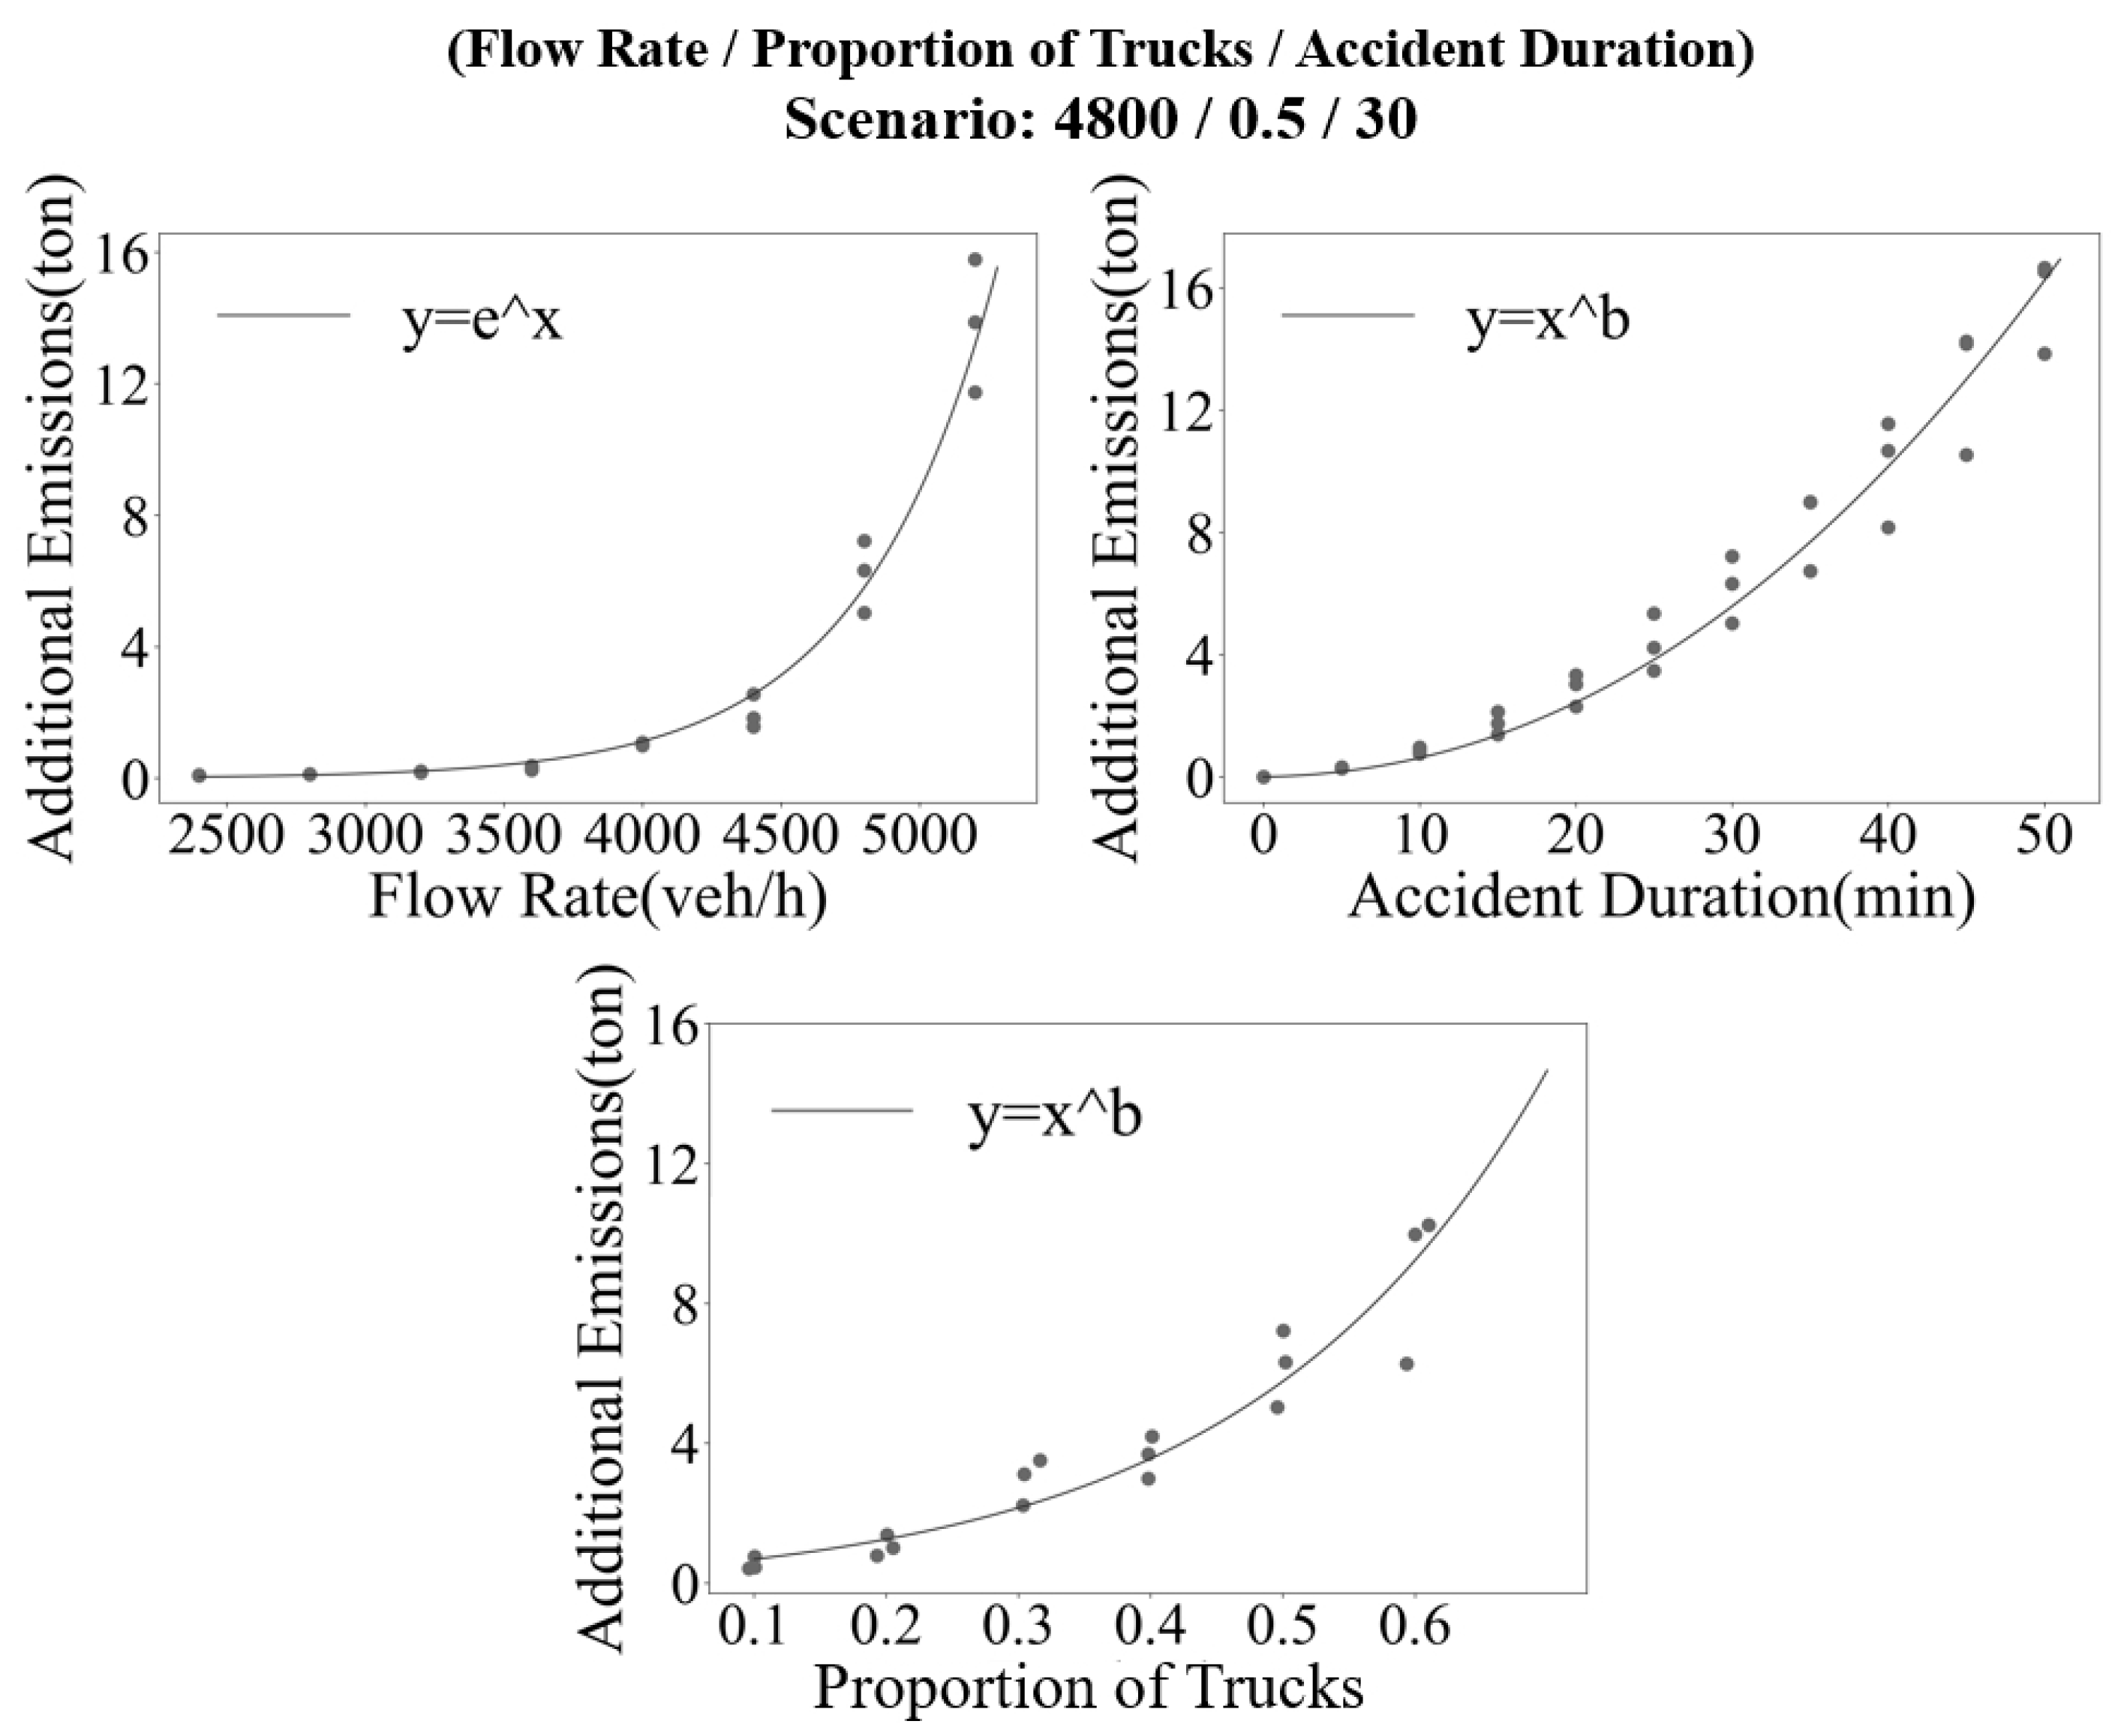
Figure 10.
The interaction between predictors of a particular scenario as an example (four lanes).
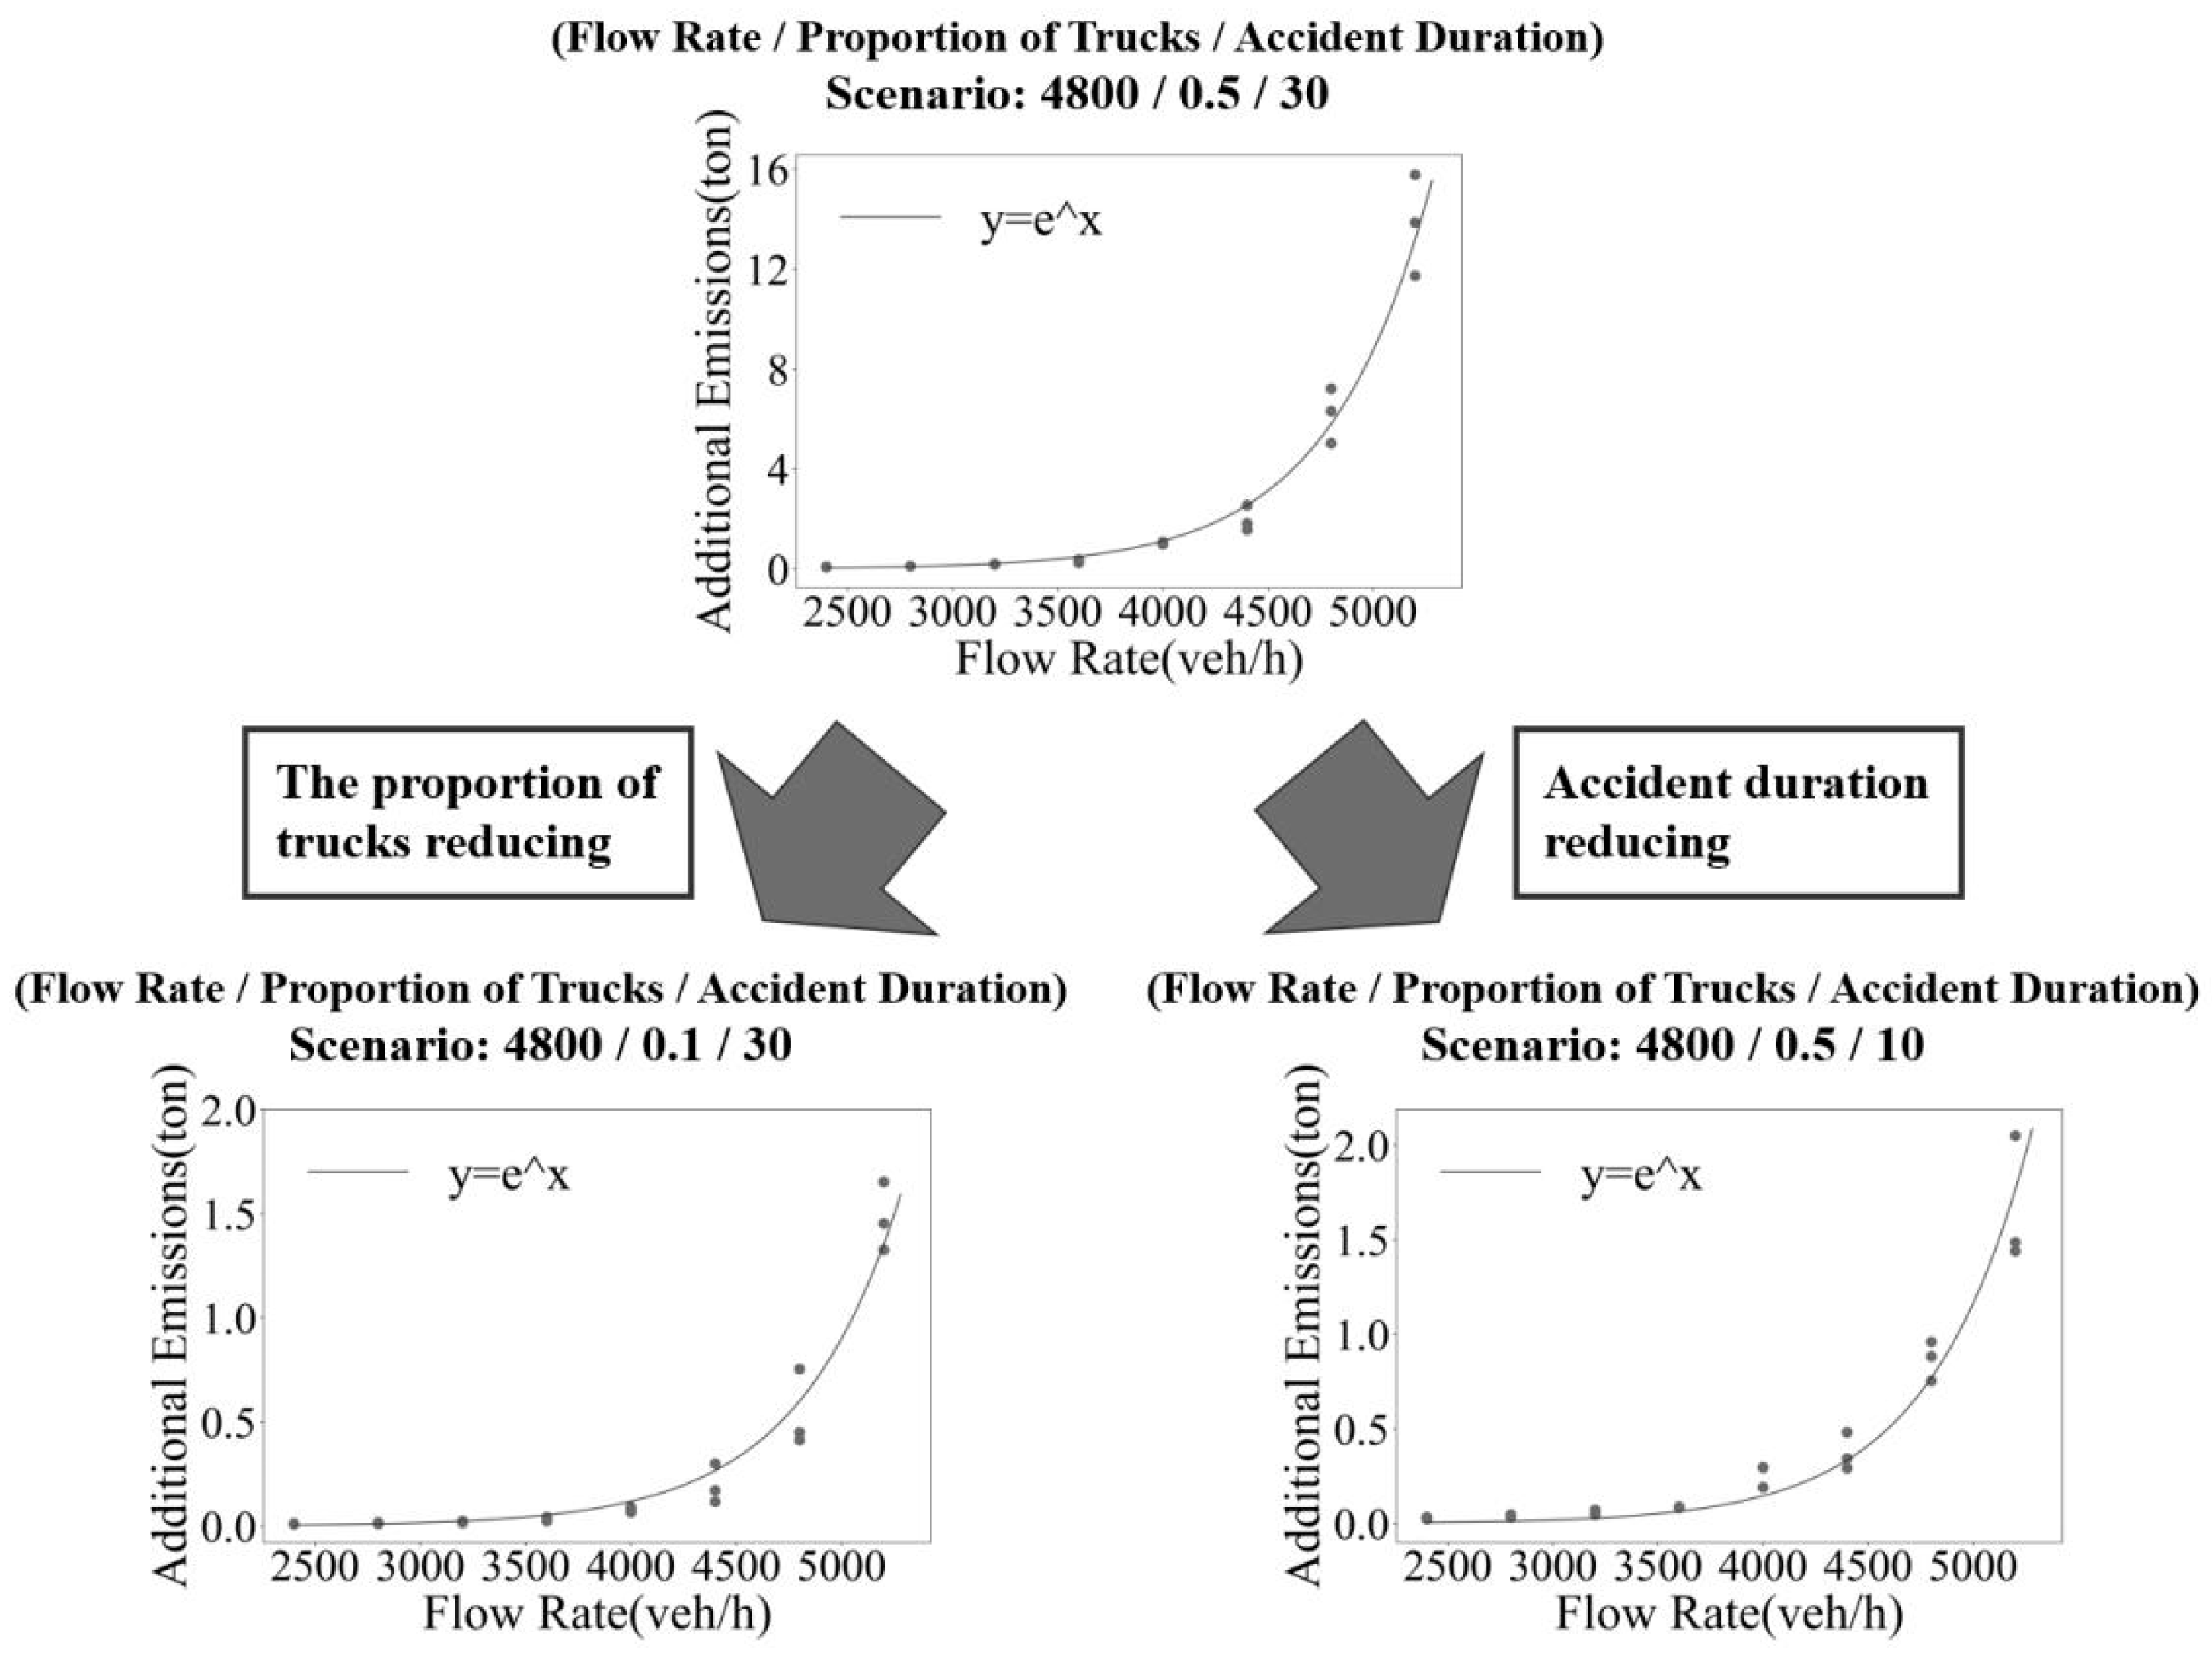
Figure 11.
Scatterplot of model-predicted values vs simulated emission values for each scenario.
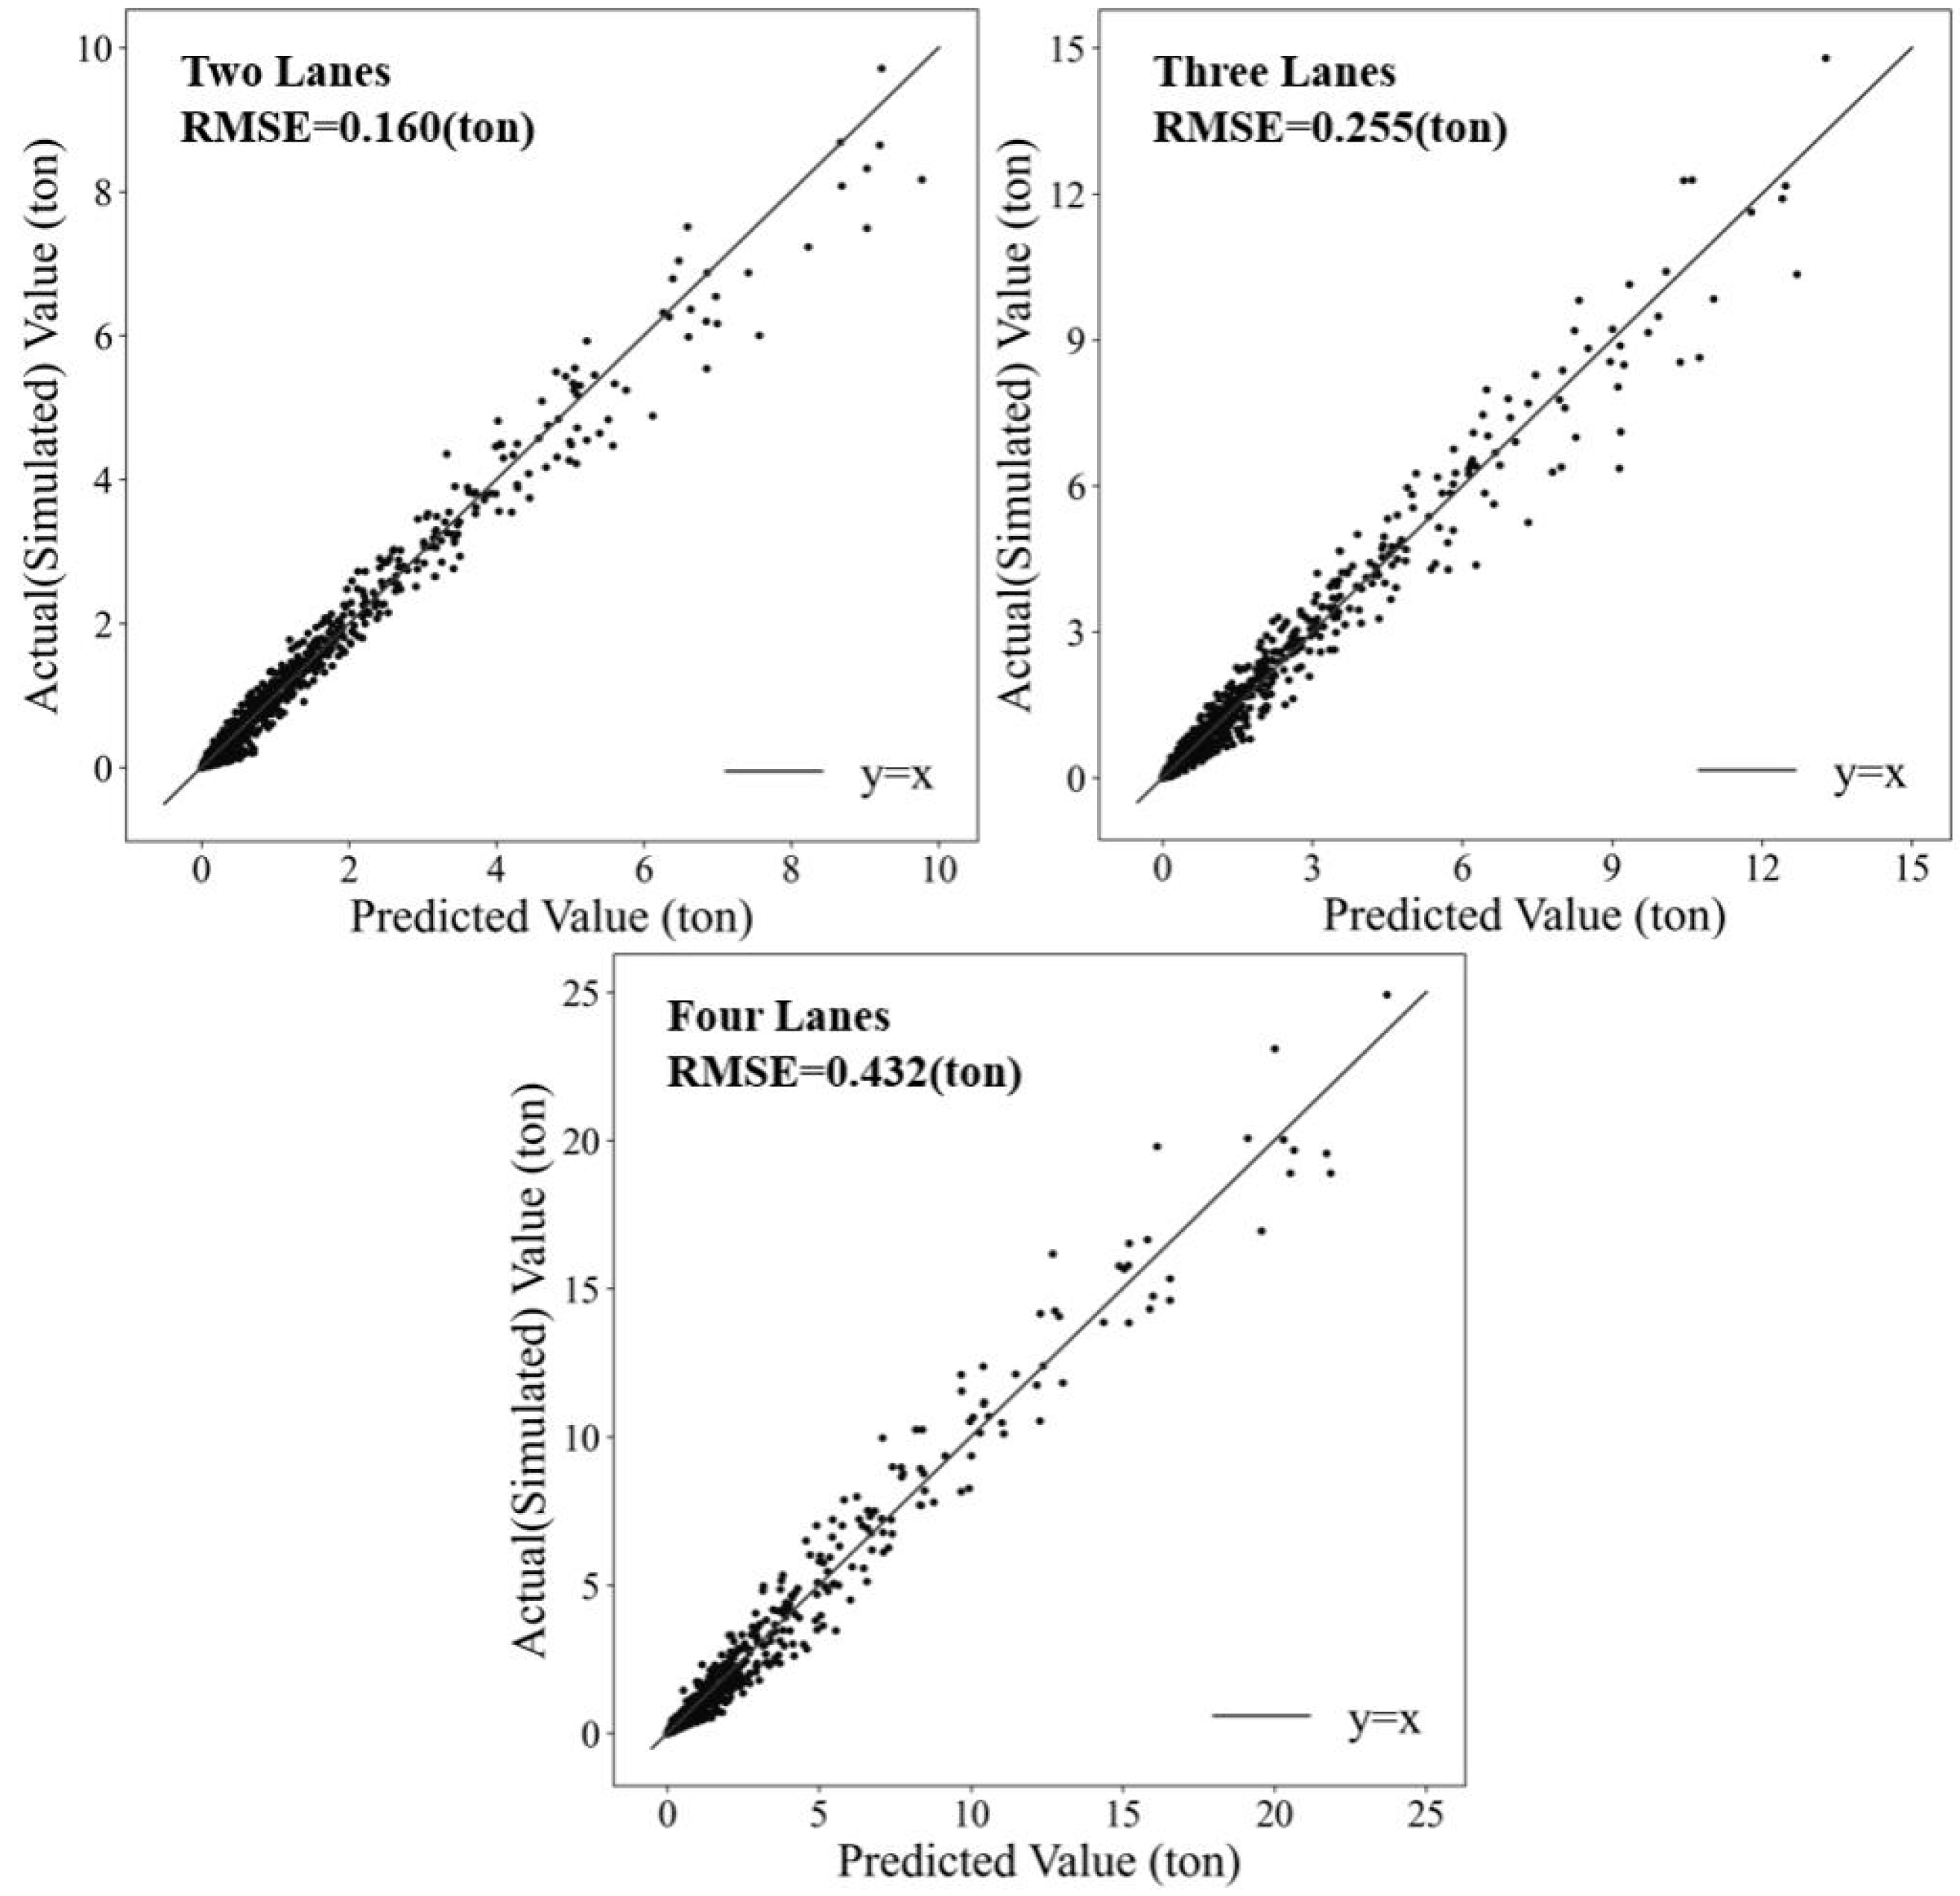
Figure 12.
Scatterplot of model-predicted values vs simulated emission values for each scenario (test data).
Figure 12.
Scatterplot of model-predicted values vs simulated emission values for each scenario (test data).
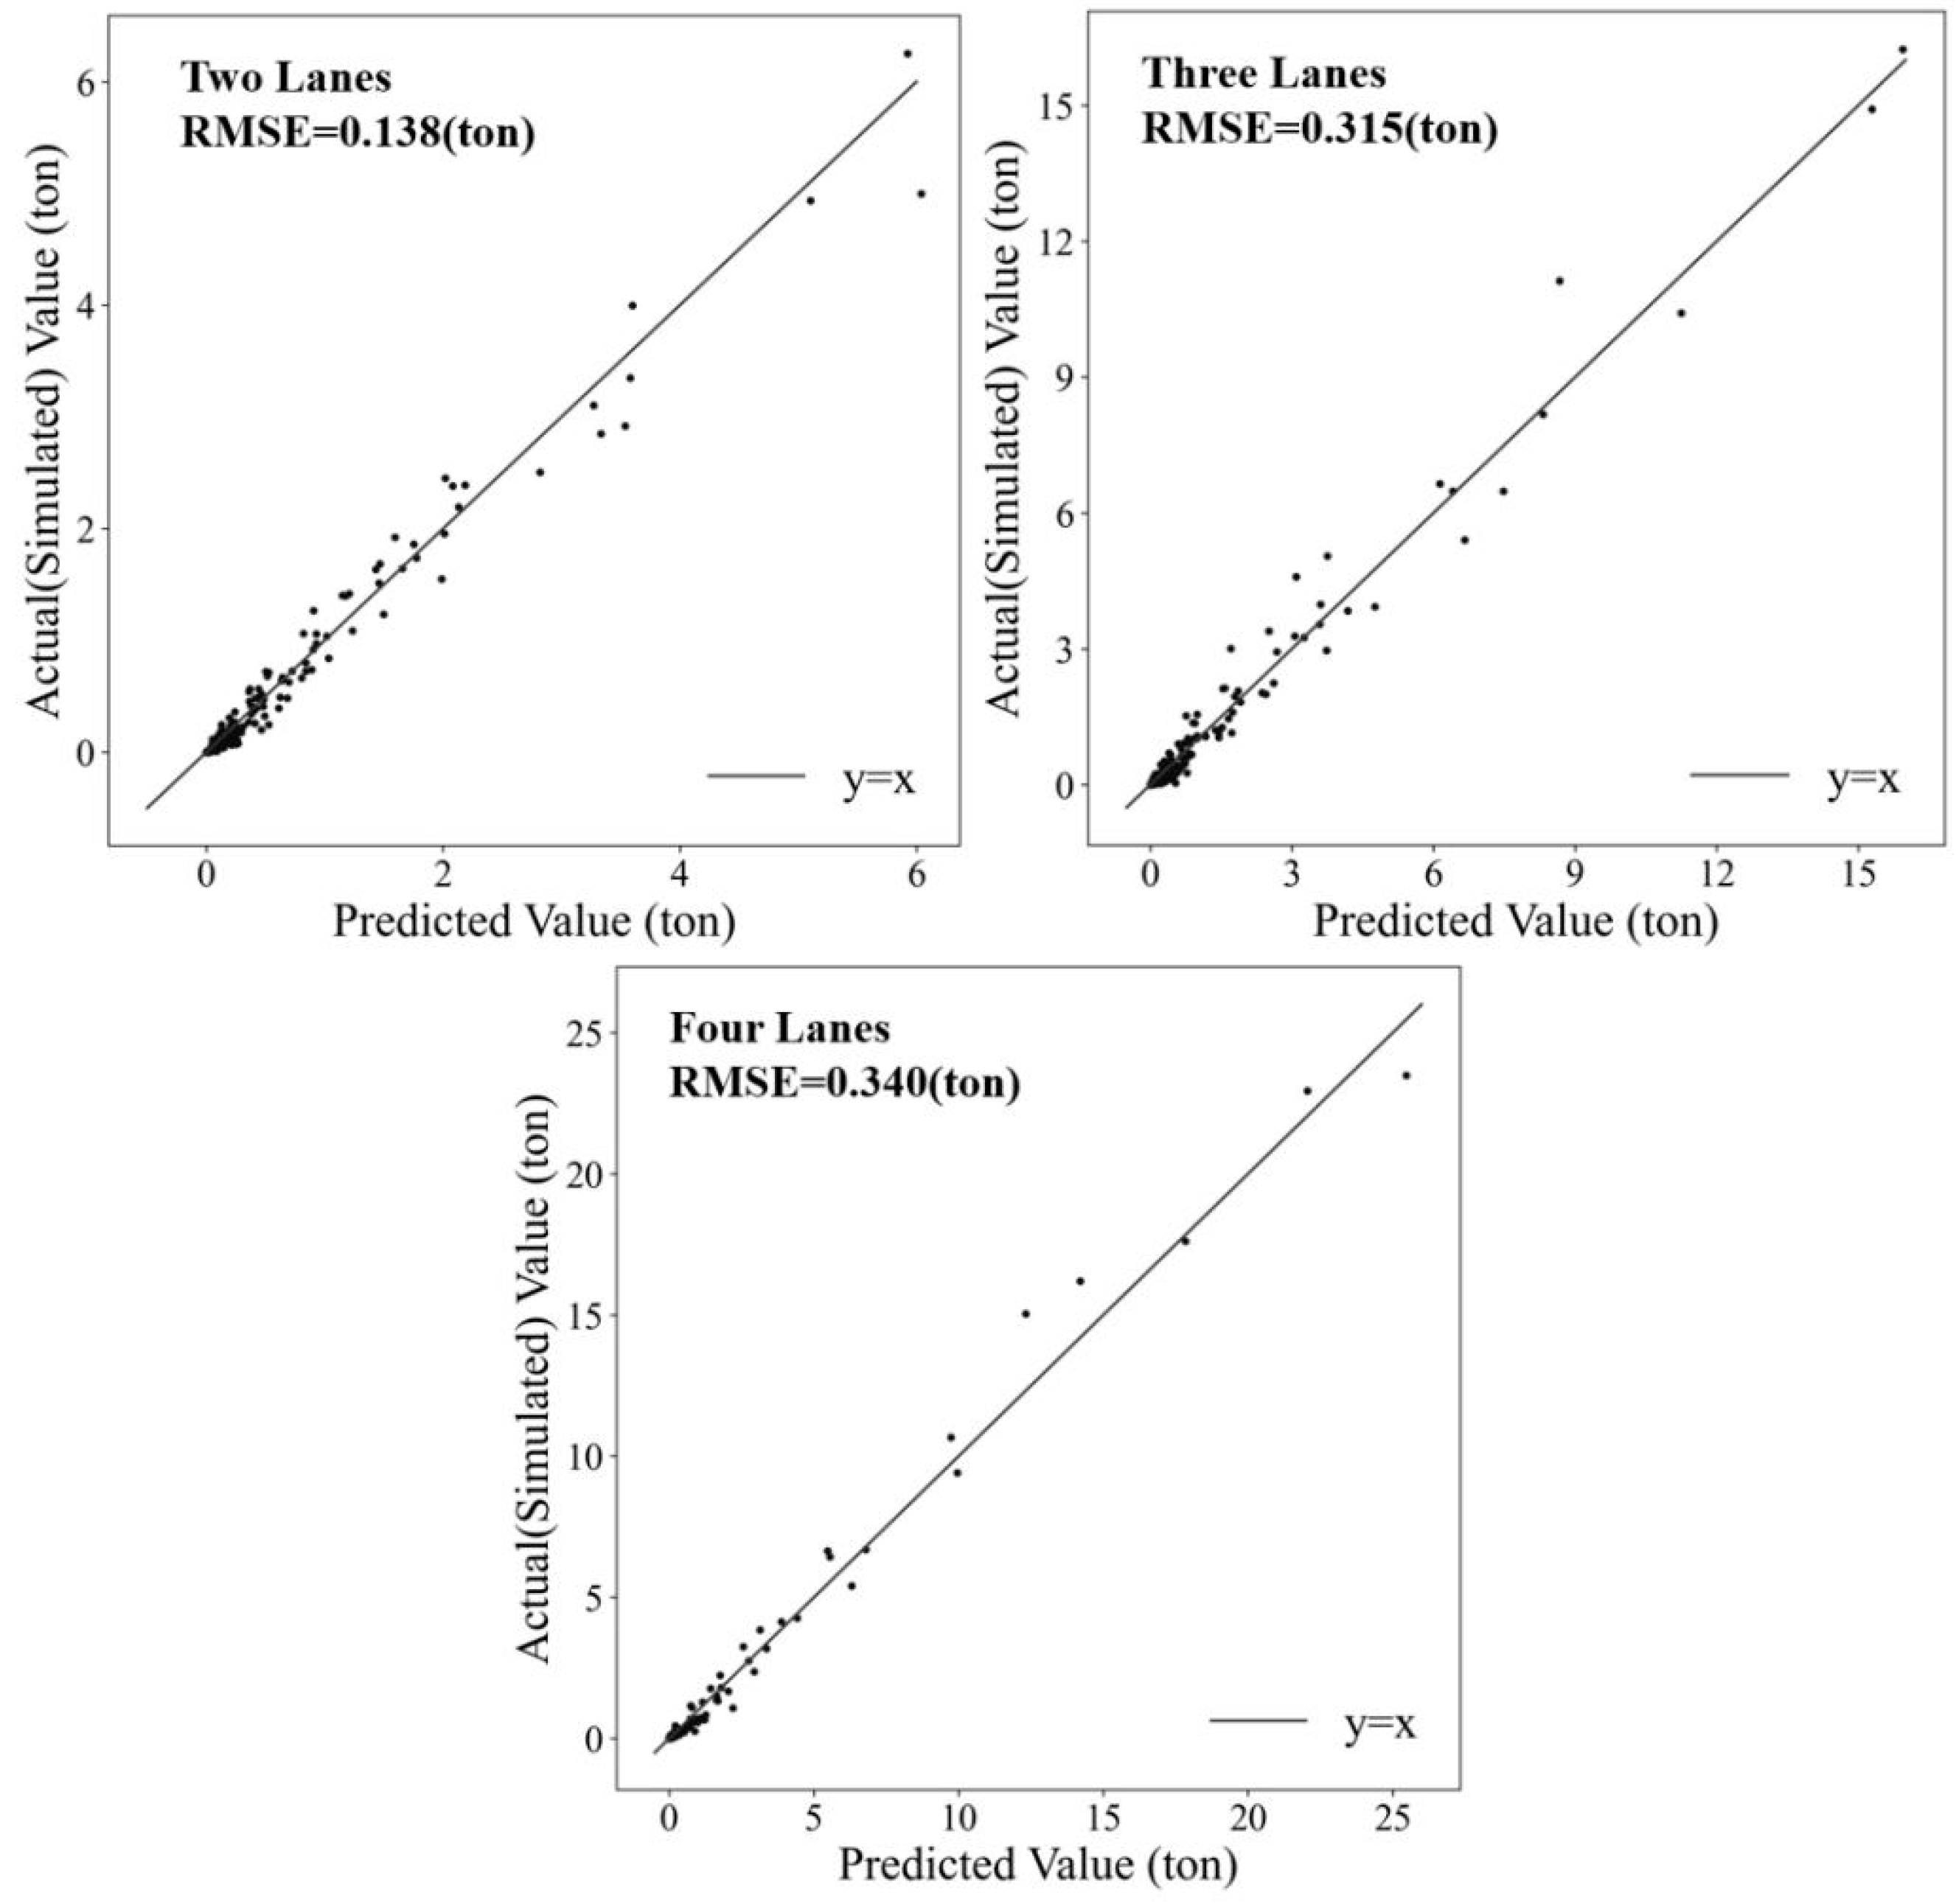
Table 1.
Simulation scenarios.
| Scenarios | Flow Rate (veh/h) | Accident duration (min) | Car-truck ratio | Number of random seeds per case | Number of simulation (times) |
|---|---|---|---|---|---|
| Two lanes | 800-2000 (interval 400) | 0-50 (interval 5) | 4:6, 5:5, …, 9:1 | 5 | 1320 |
| Three lanes | 1600-4000 (interval 400) | 0-50 (interval 5) | 4:6, 5:5, …, 9:1 | 5 | 2310 |
| Four lanes | 2400-6400 (interval 400) | 0-50 (interval 5) | 4:6, 5:5, …, 9:1 | 3 | 2178 |
| The total number of simulation (times) | 5808 | ||||
Table 3.
The results of each model.
| Two-lane | Three-lane | Four-lane | |||||||
|---|---|---|---|---|---|---|---|---|---|
| Coeff* | Std-E* | P* | Coeff* | Std-E* | P* | Coeff* | Std-E* | P* | |
| a | 4.150e-5 | 8.1e-6 | 4e-7 | 1.628e-6 | 2.7e-7 | 2e-9 | 9.645e-7 | 1.7e-7 | 2e-8 |
| b0 | 2.378 | 4.7e-2 | <2e-16 | 2.364 | 2.9e-2 | <2e-16 | 1.948 | 2.2e-2 | <2e-16 |
| b1 | 1.324 | 4.2e-2 | <2e-16 | 1.837 | 3.7e-2 | <2e-16 | 2.049 | 3.6e-2 | <2e-16 |
| b2 | 2.155 | 3.6e-2 | <2e-16 | 2.211 | 2.4e-2 | <2e-16 | 2.085 | 2.5e-2 | <2e-16 |
| c | 4.290e-5 | 2.9e-5 | 0.133 | 5.275e-5 | 3.6e-5 | 0.147 | 9.711e-7 | 1.3e-6 | 0.446 |
| d0 | 2.327 | 1.8e-1 | <2e-16 | 1.815 | 1.4e-1 | <2e-16 | 1.921 | 2.0e-1 | <2e-16 |
| d1 | 1.440 | 1.2e-1 | <2e-16 | 8.027e-1 | 1e-1 | 3e-15 | 1.020 | 1.6e-1 | 3e-10 |
| ad-R2* | 0.9750 | 0.9694 | 0.9767 | ||||||
| RMSE | 0.16 (ton) | 0.255 (ton) | 0.432 (ton) | ||||||
| Notes*: Coeff: Coefficient Std-E: Standard Error P: p-Value of t test ad-R2: adjusted R2 | |||||||||
Table 4.
Simulation scenarios of model validating.
| Scenarios | Flow Rate (veh/h) | Accident duration (min) | Car-truck ratio | Number of random seeds per case | Simulation frequency (times) |
|---|---|---|---|---|---|
| Two lanes | 600-1800 (interval 400) | 0-40 (interval 10) | 4:6, 6:4, …, 10:0 | 3 | 240 |
| Three lanes | 2000-3500 (interval 500) | 0-40 (interval 10) | 4:6, 6:4, …, 10:0 | 3 | 240 |
| Four lanes | 2000-5000 (interval 1000) | 0-50 (interval 10) | 4:6, 6:4, …, 10:0 | 3 | 240 |
| The total of simulation frequency (times) | 720 | ||||
Disclaimer/Publisher’s Note: The statements, opinions and data contained in all publications are solely those of the individual author(s) and contributor(s) and not of MDPI and/or the editor(s). MDPI and/or the editor(s) disclaim responsibility for any injury to people or property resulting from any ideas, methods, instructions or products referred to in the content. |
© 2024 by the authors. Licensee MDPI, Basel, Switzerland. This article is an open access article distributed under the terms and conditions of the Creative Commons Attribution (CC BY) license (http://creativecommons.org/licenses/by/4.0/).
Copyright: This open access article is published under a Creative Commons CC BY 4.0 license, which permit the free download, distribution, and reuse, provided that the author and preprint are cited in any reuse.


