
Submitted:
14 January 2024
Posted:
15 January 2024
You are already at the latest version
Abstract
Background and objectives: Effective management for chronic diseases, hereditary and rare diseases and Thalassaemia in particular constitutes an important indicator for the quality of healthcare systems. We aimed at assessing healthcare services in different countries by using publicly available health indicators and by surveying Thalassaemia patients and their caregivers. Materials and Methods: We reviewed official worldwide databases from the WHO, World Bank, and scientific resources and also used a structured patient tailored self-completed questionnaire to survey Thalassaemia patients and their caregivers in 2023. Results: A total of 2,082 participants were surveyed (mean age 27 years, males 42%). About 1 in 4 respondents had less than high school education, while 24% had a bachelor degree. About a third of respondents were married and had either full- or part-time employment. The vast majority (~80%) had initiated transfusion therapy between 1 – 4 years of age. Only 42% reported no delays in receiving blood transfusion, while 47% reported occasional delays and 8% serious delays. About half of patients reported being very satisfied (11%) or satisfied (38%) with the quality of provided services, while 1 in 3 patients reported being unsatisfied or very unsatisfied, and their access to treatment was difficult or very difficult due to traveling expenses and high cost of treatment. Conclusion: Important improvements in the care of Thalassaemia patients have been documented during the past decades. Nevertheless, our recent survey reveals many unmet needs where additional focus is required through national healthcare systems in order to address them effectively and achieve satisfactory patient outcomes.
Keywords:
Epidemiology
; Thalassaemia
; Questionnaire
; Health Services
; ITHACA
; International survey
1. Introduction
Health can be represented on both the individual and population level. On the individual level, health is either the sum of many separate indicators weighted in an appropriate way, or a summary measure that reflects the manifestations of the individual indicators on the physical, mental and social level. However, global debate remains on the suitable approach to weigh the various individual indicators on health. Summary measures such as years of potential life lost, disability adjusted life years (DALYs), or disability adjusted life expectancies (DALEs), may be reasonable approximations of individual indicators, although their limitations have been recognized [1].
Moreover, the term whole health has recently emerged, as an evolving concept discussed for decades under a range of different definitions. Whole health is more than a state of wellness, and it is more than the absence of disease. Indeed, it is about a whole state of well-being that encompasses physical, behavioral, spiritual, and socioeconomic well-being based on the philosophy of an individual-, family-, and community-centeredness within a broader framework of healthcare systems [2]. In parallel, public health, as an inclusive term, exhibits contested boundaries difficult to define in widely accepted terms. Public health is not merely the sum of the health of individuals as it also entails a consideration of the nature of the distribution of health throughout the society [1]. A widely accepted definition presents public health as a summary of all evidence-based efforts employed by the society to protect and promote health and well-being, prevent disease and disability, prolong life expectancy and enhance quality of life for the population as a whole. In short, public health entails all we do in a society that has a direct or indirect effect on the health of the population within the two main focused areas of prevention and management. In particular, public health not only defines the healthcare services provided to the population but also justifies the needs for disease-specific management for different segments of the spectrum of disease distribution in the society [3,4].
Therefore, providing healthcare services to the population constitutes a central part of public health. Thus, the structure, extend, funding and delivery of healthcare services to the population become a pivotal sector under the greater umbrella of public health. Within the realm of healthcare services, chronic diseases deserve particular attention since they have a significant impact on the health of individuals and populations alike, requiring the devotion of extensive societal resources [5]. The significance of chronic diseases lies mainly on the various healthcare services needed by the population and the financial cost required by countries due to their costly management, which impose a major and growing burden on health and development. A particular subgroup of this wide category of chronic diseases is represented by hereditary and rare diseases of which Thalassaemia is a major challenge in Europe and many countries around the world [6,7,8].
Thalassaemia, a treatable disorder today, that can be well-managed with blood transfusions and chelation therapy, represents an important chronic-genetic disorder, the effective management of which reflects to a great extend, the quality of healthcare services provided to the population from different perspectives, namely prevention, control and management [9]. Furthermore, transfusion and chelation therapy are accompanied by a number of additional interventions and specialized services to prevent potential complications and satisfy the multitude of such patients’ clinical, social and overall healthcare needs [10]. These often include medical monitoring, clinical and laboratory tests, imaging modalities, and specialized consultations on the basis of published international guidelines and many other health evaluations [11]. The cost of Thalassaemia patients’ support and follow-up is significant and in several countries is incorporated into the national healthcare budget to support individuals and their families. Auxiliary healthcare services (home care nursing, physiotherapy, occupational therapy, social workers support etc.) also play an important role in the care of chronic conditions in general and Thalassaemia patients in particular [12].
Pioneer countries in providing ideal services to Thalassaemia patients include those which have developed disease-specific national programs that promote, amongst others, the development of reference centers that allow for health professionals to come together to provide the very best treatment and care for Thalassaemia patients. This support is often covered exclusively by the national healthcare systems safeguarding patients from the financial burden of such a complicated and expensive care. Reference centers are expected to provide comprehensive and expert-based diagnostic and treatment services. Considering that many Thalassaemia patients around the world are managed in peripheral / rural centers with limited resources, the need for expert networking and tele-consultations has become imperative [13]. Centers of excellence are also able to devote resources to conduct relevant research and improve diagnosis, health management and development of new treatments along with educating and supporting patients and their families on a regular basis.
Appropriate healthcare indicators are readily available and reliable tools that provide timely information particularly on the health status of the population as a whole and its particular segments, and can be used to establish public health priorities, mobilize funds, monitor the performance of particular actions and programs, and inform policy decision making [3,14]. Moreover, such indicators are considered an effective and interpretable tool to assess and compare the quality and quantity of healthcare services within and between populations and countries in real time and over specific time periods either for the population as a whole and for specific patient groups [15,16]. In addition, common health indicators, including mortality rates, morbidity rates, life expectancy and DALYs, can be used to assess the burden of disease and provide early warning of emerging health threats as well as assess the effectiveness of healthcare services provided along with associated policies implemented in the society. Furthermore, healthcare services are also assessed through patient-centered surveys that provide valuable insight into the gaps and limitations of provided services to those in need [17,18].
Based on the above described hierarchical scalable framework moving from health to public health to chronic diseases to healthcare services provided to support hereditary and rare diseases with a particular focus on Thalassaemia patients, our international collaborative assessment aimed at summarizing a number of officially-selected individual and population health indicators from several different countries from all continents in order to assess the quality and quantity of healthcare services provided to Thalassaemia patients. Furthermore, in the context of the study, we also aimed at evaluating healthcare services for Thalassaemia management from a patients’ and caregivers’ experience using a tailored designed self-completed questionnaire.
2. Materials and Methods
The project was implemented in 2023 as commissioned by the Thalassaemia International Federation (TIF) to the Open University of Cyprus, School of Economics and Management, Healthcare Management Program. It comprised of two complementary parts. The first part included a comprehensive international healthcare management report finalized through a detailed review of official worldwide databases from different international organizations and scientific resources using readily available health indicators. The second part included the design, development and implementation of a survey to assess the quality of Thalassaemia patients’ management from a clients’ perspective through an internationally self-completed questionnaire distributed in 2023.
2.1. The International Healthcare Management Report:
This work aimed at collecting a number of healthcare indicators regarding the different healthcare services provided to the general population and Thalassaemia patients in particular from a number of different countries around the world. The list of countries included in the first international report is presented in Supplement I. Data regarding public health indicators from countries distributed in five (5) continents were collected from official international sources such as the World Health Organization (WHO) [19], the World Bank [20], PubMed, and the Web of Science. In summary, the following parameters and public health indicators were considered: population, gross domestic product (GDP), world bank income rank, expected Thalassaemia births per 1000 live births, universal health coverage, chronic diseases/non-communicable diseases, crude birth rates, current health expenditure (% of GDP), government expenditure on education (% of GDP), poverty, life expectancy at birth, infant mortality rate, crude death rate, cause of death by communicable diseases and maternal, prenatal and nutrition conditions, healthy life years, diabetes prevalence, prevalence of tobacco use, prevalence of obesity, alcohol consumption, and per capita coverage of social insurance programs.
2.2. The International Thalassaemia Collaborative Assessment Patient survey:
The survey involved the meticulous design and development of a data collection instrument (a structured anonymous questionnaire) which evolved following repeated rounds of review by faculty at the Open University of Cyprus, Healthcare Management Program along with a research fellow hired in the context of the project, as well as the medical consultant of the Thalassaemia International Federation and TIF’s research officers.
2.2.1. Data collection instrument:
The questionnaire used in the survey is presented in Supplement II in the English language. The international assessment was facilitated by a survey questionnaire that was designed as a tailored flexible instrument targeting Thalassaemia patients and/or their caregivers. The development phase of the questionnaire included a collaborative design process. A formidable team from both the Open University of Cyprus and the Thalassaemia International Federation worked cooperatively to develop the different sections of the survey tool, which was ultimately approved by the TIF Executive Director, who spearheaded this creative iterative process. The questionnaire comprised of three (3) different sections. The first included demographic and other characteristics of Thalassaemia patients, while the second section focused on different medical parameters. The third and final extensive section included several questions on the quality and quantity of services received by Thalassaemia patients along with information on the financial aspects of services and patients’ satisfaction.
2.2.2. Survey translation, informed consent and deployment:
To ensure global inclusivity, the survey was then meticulously translated into twenty five (25) different languages, ranging from Albanian to Visayas, including Arabic, Chinese, Farsi (Persian), French, German, Greek, Hindi, Indonesian, Italian, Khmer, Lao, Malay, Nepali, Sinhala, Spanish, Tagalog, Turkish, Urdu, and Vietnamese. A list of countries along with the survey language used is presented in Supplement III. Prior to participant engagement, a transparent and comprehensive informed consent disclaimer was presented. This disclaimer clearly outlined the eligibility criteria for respondents, emphasizing the intended audience of individuals with Thalassaemia aged 15 or older, or parents/caregivers of patients under 15 years of age. The distribution of the Thalassaemia survey was implemented via online and paper-based approaches to many different countries around the world. Survey Monkey was purposefully chosen as the survey deployment platform due to its accessibility and user-friendly interface. The project was implemented based on a written agreement and approval by the Thalassaemia International Federation Executive Office and the Dean’s office of the Open University of Cyprus.
The survey's explicit purpose was to assess healthcare services provided from around the world in order to contribute to the TIF's mission of advocating for universal and comprehensive management services for all. The project’s goals were clearly communicated to prospective survey participants who were also assured of the confidentiality and anonymity of their provided information, fostering trust and openness in their responses. TIF strategically leveraged its extensive network and longstanding presence in the field of global Thalassaemia in order to facilitate the distribution of the survey at the national level. This approach was grounded on experiences gained from previous surveys conducted in 2014, 2017, and 2022. Therefore, we emphasized personal contact with peers as a more effective means of soliciting responses than traditional email outreach. Delegates were meticulously trained to employ the right approach in collecting data from eligible individuals. This tailored strategy was implemented for each language and country, fostering a nuanced and culturally sensitive approach to survey engagement.
2.2.3. Data Management – Statistical Analyses
A strategic decision aimed at maximizing respondent participation by offering an intuitive and straightforward experience. The Survey Monkey platform's versatility allowed for the survey to be available in various languages, promoting inclusivity across linguistic and cultural backgrounds. Data collected were readily downloadable into an electronic database which was used for statistical analyses. This deliberate choice aligned with the overarching goal of achieving high response rates and ensuring a diverse range of patients’ perspectives.
The survey was conducted between June and September 2023 and utilized specialized software to ensure secure and high-quality data collection. Where applicable, local TIF contacts facilitated the transfer of responses from hard copies to the online data collection tool, with a notable collection of 300 hard copies from Bangladesh sent to TIF electronically. Meticulous care was then taken to integrate hard copy responses into the online Survey Monkey platform. A TIF skilled officer was entrusted with transferring paper-based responses in order to maintain accuracy, compatibility and fidelity. The data collected from hard copies were downloaded in a codified format and seamlessly integrated with the online responses, ensuring consistency and uniformity of the overall project dataset.
Post-collection data were downloaded from Survey Monkey in both full text and codified formats. A research associate of the Open University of Cyprus and collaborator of TIF was responsible for data management and statistical analyses. The goal was to transform the opinions and experiences of patients and families into tangible insights and interpretable results for public and policymaker consumption, thereby informing TIF's strategic positioning and policy making. Statistical analyses were performed with the “R” open-source statistical software.
3. Results
In summarizing the healthcare management report, we used publicly available official web-based databases on different population health indicators for the general population and Thalassaemia patients in particular. In order to assess the quality and quantity of healthcare services provided by different countries around the world, we have tabulated a total of forty-eight (48) different health indicators.
In Table 1 we present basic public health and healthcare indicators collected that exert a significant impact and/or reflect on the health services provided by each country. We present collected information on country population, infant mortality, life expectancy, country GDP, government expenditure on health, government expenditure on education, world bank income rank, and expected Thalassaemia births. We evaluated a total of 48 countries from all continents. Population in millions in the survey countries ranged from 0.5 (Maldives) to 1417 (India), while documented infant mortality was seen from 2 (Singapore) to 53 (Pakistan). Life expectancy ranged from 64 years of age (Yemen) to 84 (Singapore, Italy, Spain, and Switzerland). The current health expenditure in the different countries as a percentage of gross domestic product ranged from 2.4% (Brunei) to 18.8% (USA). A total of 42% of countries were ranked by the World Bank as high income, 27% were ranked as upper/medium income and 31% were ranked as low/medium income. Finally, the expected Thalassaemia births per 1,000 live births ranged from 0.001 (Honduras) to 8.9 (Maldives).
In the context of the international collaborative assessment survey, we have received responses from a total of 2,082 participants, both Thalassaemia patients and caregivers who participated in the global survey, 500 of whom were from European Union countries. We have included information from across 48 countries around the globe. In Figure 1 we present the geographical distribution of survey participants in our international survey from across the globe and different continents based on the number of participants from each country.
In Table 2 we are presenting the descriptive distribution of demographic and other characteristics of the participants as derived from the survey and the frequencies of their answers to questions in relation to medical information and the quality of services provided to Thalassaemia patients. The mean age of respondents was 27 years of age, about 70% were patient respondents and the rest were caregivers and 42% were males. About 1 in 4 respondents had less than high school education and another 24% had a bachelor degree. A third of respondents were married and a similar percentage had either full- or part-time employment. The vast majority of respondents (~80%) had initiated transfusion therapy at age 1 – 4 years of age and about half of them (47%) are being transfused when their haemoglobin levels are between 8 – 9 mg/dl. Only about 42% reported that they have no delays in receiving blood transfusion on time while 47% reported occasional delays and 8% reported transfusion delays that may put them at risk of severe anemia.
In Table 2 we also present information on clinical parameters of Thalassaemia patient management. Blood filtration is being done at bedside for 1 in every 4 patient, while chelation therapy was initiated at age 5 or older for 1 in every 3 Thalassaemia patients. Chelation therapy was reported being given regularly to 71% of the international sample of Thalassaemia patients, while 8.5% does not receive chelation therapy even today. A similar percentage, 71% reported that their ferritin level in being examined every 3 to 4 months, while 13% reported that their ferritin level is being checked either every year or never. Additional information is also provided about the ferritin levels themselves, cardiac iron measurements by T2* and liver iron concentrations.
Overall, about half of patients reported being very satisfied (11%) or satisfied (38%) with the quality of provided services, while 1 in 3 patients reported being unsatisfied or very unsatisfied with the quality of medical services. In parallel, 1 in 3 patients reported their access to treatment was difficult or very difficult due to high cost of the treatment itself and high cost of traveling to medical centers for treatment. Finally, about half of patients (>55%) reported that they are losing more than 10 days per year from school or work in order to attend treatment sessions.
4. Discussion
To our knowledge, this is one of the first international surveys of Thalassaemia patients and their caregivers, conducted in 2023, in order to capture the extend as well as the quality and quantity of healthcare services from different countries from all continents provided to this specific patient population. In the current report, we describe the basic findings of this international assessment and present the results of the extensive survey in a descriptive form.
Overall, the majority of Thalassaemia patients around the world is receiving good quality care including timely blood transfusions [21], chelation therapy [22], adequate disease-specific medical monitoring, appropriate imaging and about half of them report being satisfied or very satisfied with medical management [23]. Nevertheless, based on our findings, a sizeable percentage of the study participants, are lacking comprehensive services, are facing difficulties in accessing guideline-based recommended care, face barriers to receive timely care due to financial difficulties and are not satisfied with the level of healthcare services they enjoy.
The Thalassaemia International Federation (TIF), as an international federation of 200 national patient support organisations from over 60 countries around the world is strategically involved in supporting the development and implementation of national control and prevention programs, and promoting optimal management for patients with haemoglobin (Hb) disorders. TIF’s ultimate goal is focused on securing equal access to quality health care services for all patients with Haemoglobin disorders around the world [24]. The current research findings, commissioned by TIF in collaboration with the Open University of Cyprus, is an attempt to globally map the status of Thalassaemia patients with respect to their personal and social characteristics as well as the quality and quantity of clinical management and associated healthcare services provided by different countries on a global level.
TIF collaborates with different agencies and organizations of the European Union and WHO headquarters and regional offices, promoting public health and disease-specific policies for rare and hereditary blood disorders in general and Thalassaemia in particular. Furthermore, TIF works closely with clinical specialists in different medical disciplines to enhance the quality of provided medical services around the world to Thalassaemia patients. In addition, TIF is actively cooperating with universities and academic centers to support and promote scientific research, associated conferences and scientific publications in advancing knowledge in the field of Thalassaemia prevention, control, and clinical management. Specifically, TIF’s medical advisors and international experts updated the third publication on clinical management of both α and β Thalassaemia syndromes [25], which has set a comprehensive quality standard that should be followed to achieve the best possible outcomes among Thalassaemia patients. Furthermore, the organization is also active in Europe, supporting the inclusion and promotion of Hb disorders into the communities of every EU country member, which until recent years, were either considered rare and hence addressed in the context or rare disease recommendations, or amongst the migrant population and hence their needs left quite unaddressed. EU funded projects (the third Health and the EU4Health Program - Thalia project) has greatly supported TIF in advocating and recommending policies for effectively addressing this hereditary disorder [26]. Finally, a highlighted focus of TIF activities relates to the support of patients’ rights for cross border health care in Europe and the promotion of establishment of reference centers and networking across the globe.
Based on the findings of our study, we conclude that several past improvements in the management of Thalassaemia patients are benefitting many patients around the world even in low-income countries. At the same time, a sizeable percentage of Thalassaemia patients are experiencing difficulties in receiving standard treatment modalities as well as laboratory and imaging examinations required to monitor their overall health, treatment and potential complications. Our recent survey reveals areas that require additional focus from the clinical and public health community as well as from policy makers around the world. The patients’ view and satisfaction or anxiety concerning the services offered are rarely known or taken into consideration. This survey is an initial analysis of global patient opinions on these important aspects of their medical and overall care.
The project’s strength is related to the presentation of Thalassaemia patients’ perspectives with respect to the services received from different countries around the world. Due to the difficulties in globally accessing Thalassaemia patients, we have used a convenient sample process. Nevertheless, the large number of countries included in our survey as well as the diversity of country settings used in collecting patients’ and caregivers’ questionnaires provides a fair representation of the overall Thalassaemia patient population. In addition, although some countries had very few participants, the cumulative sample findings provide an informative picture of patients’ perspectives. Finally, the large amount of information collected in the survey does not allow us to analyze the results in detail in the present report.
Challenges in addressing timely quality treatment (as recommended by international experts and TIF’s guidelines), particularly including access to adequate blood, delays in receiving blood transfusion therapy, concerns on the quality and safety of blood, methods of appropriate processing of blood, access to chelation therapy and accurate and reliable monitoring of iron load, access to specialized centers and health care professionals with expertise in the field, stigmatization and its impact on the professional and personal lives of Thalassaemia patients are a few of the difficulties faced by patients and their caregivers in many different countries. Although in the Western world, knowledge and expertise are considerably in place, the rarity of the disease on many occasions creates challenges in the establishment of disease-specific national strategies and policies and intense migration flow have intensified such gaps. All in all, considerable efforts on behalf of the WHO, the Regional and national authorities, the health care professionals and the patients and their families are required to improve existing and develop new disease-specific policies for effectively addressing the above shortcomings.
5. Conclusions
The findings of the current survey, albeit demonstrating improvements compared to TIF’s survey conducted in 2018 in many areas of medical and social management, they are documenting significantly fewer benefits mainly in the area of prevention. Besides, the reality is that multiple gaps, challenges and weaknesses are observed regarding disease-specific services and policies that threaten the health, quality of life and social integration of patients with this disorder. The above summary observations are mainly seen, but not confined, in the developing part of the world, as captured by the patients themselves.
Supplementary Materials
The following supporting information can be downloaded at the website of this paper posted on Preprints.org.
Author Contributions
Conceptualization, M.A., E.S.S. and A.E.; Methodology, E.C.E., E.S.S., M.A. and A.E.; Software, D.A.; Validation, E.S.S. and A.E.; Formal Analysis, D.A.; Investigation, E.C.E.; Resources, A.E.; Data Curation, D.A.; Writing – Original Draft Preparation, E.C.E. and E.S.S.; Writing – Review & Editing, All Authors; Visualization, A.E.; Supervision, A.E.; Project Administration, M.A.; Funding Acquisition, A.E.
Funding
This work was supported by internal funds from the Thalassaemia International Federation.
Institutional Review Board Statement
Not applicable.
Informed Consent Statement
Not applicable.
Data Availability Statement
Data are available upon formal request.
Acknowledgements
The authors would like to acknowledge TIF’s officers for their instrumental and continuous support for the implementation and completion of this project.
Conflicts of Interest
The authors declare that they have no conflict of interest with respect to the current manuscript.
References
- Starfield, B. Basic concepts in population health and health care. J Epidemiol Community Health 2001, 55(7), 452-454. [CrossRef]
- Meisnere, M.; South-Paul, J.; Krist, A.H. National Academies of Sciences, Engineering, and Medicine; Health and Medicine Division; Board on Health Care Services; Committee on Transforming Health Care to Create Whole Health: Strategies to Assess, Scale, and Spread the Whole Person Approach to Health; Achieving Whole Health: A New Approach for Veterans and the Nation. Washington (DC): National Academies Press (US), 15 February 2023. [CrossRef]
- Altare, C.; Weiss, W.; Ramadan, M.; Tappis, H.; Spiegel, P.B. Measuring results of humanitarian action: adapting public health indicators to different contexts. Confl Health 2022, 16(1), 54. Published 2022 Oct 14. [CrossRef]
- B. Modell and M. Darlison, “Global epidemiology of haemoglobin disorders and derived service indicators,” Bulletin of the World Health Organization, 2008, vol. 86,no. 6, pp. 480–487.
- WHO (World Health Organization). Noncommunicable diseases. Available online: https://www.who.int/westernpacific/health-topics/noncommunicable-diseases#tab=tab_1 (accessed on 16 December 2023).
- B. Modell, M. Darlison, H. Birgens et al., “Epidemiology of haemoglobin disorders in Europe: an overview,” Scandinavian Journal of Clinical and Laboratory Investigation, 2007, vol. 67, no. 1, pp. 39–69. [CrossRef]
- M. Angastiniotis and B. Modell, “Global epidemiology of hemoglobin disorders,” Annals of the New York Academy of Sciences, 1998, vol. 850, pp. 251–269.
- Modell’s Haemoglobinopathologist’s Almanac, Global epidemiology of haemoglobin disorders (thalassaemias and sickle cell disorders). Available online: http://www.modell-almanac.net/ (accessed on 16 December 2023).
- CDC (Center for Disease Control and Prevention). Healthy Leaving with Thalassemia. Available online: https://www.cdc.gov/ncbddd/thalassemia/living.html (accessed on 14 December 2023).
- Thuret, I.; Pondarré, C.; Loundou, A.; Steschenko, D.; Girot, R.; Bachir, D.; Rose, C.; Barlogis, V.; Donadieu, J.; de Montalembert, M.; Hagege, I.; Pegourie, B.; Berger, C.; Micheau, M.; Bernaudin, F.; Leblanc, T.; Lutz, L.; Galactéros, F.; Siméoni, M. C.; Badens, C. Complications and treatment of patients with β-thalassemia in France: results of the National Registry. Haematologica 2010, 95(5), 724–729. [Google Scholar] [CrossRef]
- Cappellini, M.D., Farmakis, D., Porter, J. Taher, A. et al., Guidelines for the Management of Transfusion Dependent Thalassaemia, Thalassaemia International Federation, Nicosia, Cyprus, 4th edition, 2024 (https://thalassaemia.org.cy/el/publications/tif-publications/guidelines-for-the-management-of-transfusion-dependent-thalassaemia-4th-edition-2021-v2/).
- Xuemei Zhen, Jing Ming, Runqi Zhang, Shuo Zhang, Jing Xie, Baoguo Liu, Zijing Wang, Xiaojie Sun, Lizheng Shi. Economic burden of adult patients with β-thalassaemia major in mainland China. Orphanet J Rare Dis. 2023 Aug 29;18(1):252. [CrossRef]
- Bin Hashim Halim-Fikri, Carsten W Lederer, et al. Global Globin Network Consensus Paper: Classification and Stratified Roadmaps for Improved Thalassaemia Care and Prevention in 32 Countries. J Pers Med. 2022 Mar 31;12(4):552. [CrossRef]
- Xenya Kantaris, Mark Shevlin, John Porter, Lynn Myers. Development of the Thalassaemia Adult Life Index (ThALI). Health Qual Life Outcomes. 2020 Jun 12;18(1):180. [CrossRef]
- Bauer, G.; Davies, J.K.; Pelikan, J.; Group, E.T.W. The EUHPID Health Development Model for the classification of public health indicators. Health Promot Int 2006, 21, 153–159. [Google Scholar] [CrossRef]
- Murray, C.J.L.; Lopez, A.D. Global mortality, disability, and the contribution of risk factors: global Burden of Disease Study. Lancet, 1997; 349, 1436–1442. [Google Scholar] [CrossRef]
- T. H. Tulchinsky and E. A. Varavikova, "Measuring, Monitoring, and Evaluating the Health of a Population," The New Public Health, 2014 pp. 91-147, 2014. [CrossRef]
- GBD 2016 DALYs and HALE Collaborators, "Global, regional, and national disability-adjusted life-years (DALYs) for 333 diseases and injuries and healthy life expectancy (HALE) for 195 countries and territories, 1990-2016: a systematic analysis for the Global Burden of Disease Study 2016," Lancet, 2017 vol. 390, no. 10106, p. e38, 2017.
- World Health Organization. https://www.who.int/data/gho/data/indicators. Accessed 2023.
- The World Bank. https://data.worldbank.org/indicator. Accessed 2023.
- Farrukh T Shah, Farzana Sayani, Sara Trompeter, Emma Drasar, Antonio Piga. Challenges of blood transfusions in β-thalassemia. Βlood Rev. 2019 Sep:37:100588. [CrossRef]
- Sheila A Fisher, Susan J Brunskill, Carolyn Doree, Onima Chowdhury, Sarah Gooding, David J Roberts. Oral deferiprone for iron chelation in people with thalassaemia. Cochrane Database Syst Rev. 2013 Aug 21:(8):CD004839. [CrossRef]
- Antonis Kattamis, Ersi Voskaridou, et al. Real-world complication burden and disease management paradigms in transfusion-related β-thalassaemia in Greece: Results from ULYSSES, an epidemiological, multicentre, retrospective cross-sectional study. EJHaem. 2023 May 23;4(3):569-581. [CrossRef]
- Thalassaemia International Federation. https://thalassaemia.org.cy/el/home-new-2/.
- Dimitrios Farmakis, John Porter, Ali Taher, Maria Domenica Cappellini, Michael Angastiniotis, and Androulla Eleftheriou, for the 2021 TIF Guidelines Taskforce. 2021 Thalassaemia International Federation Guidelines for the Management of Transfusion-dependent Thalassemia. Hemasphere. 2022 Aug; 6(8): e732. Published online 2022 Jul 29. [CrossRef]
- Thalassaemia International Federation. The THALassaemia In Action (THALIA) project. https://thalassaemia.org.cy/el/news/tif-news/thalassaemia-in-action-the-thalia-project-2/.
Figure 1.
Geographical distribution of participants in the TIF’s International Thalassaemia Collaborative Assessment survey created using the ggplot2 package in “R”. Circle radius represents the number of survey participants from each country.
Figure 1.
Geographical distribution of participants in the TIF’s International Thalassaemia Collaborative Assessment survey created using the ggplot2 package in “R”. Circle radius represents the number of survey participants from each country.
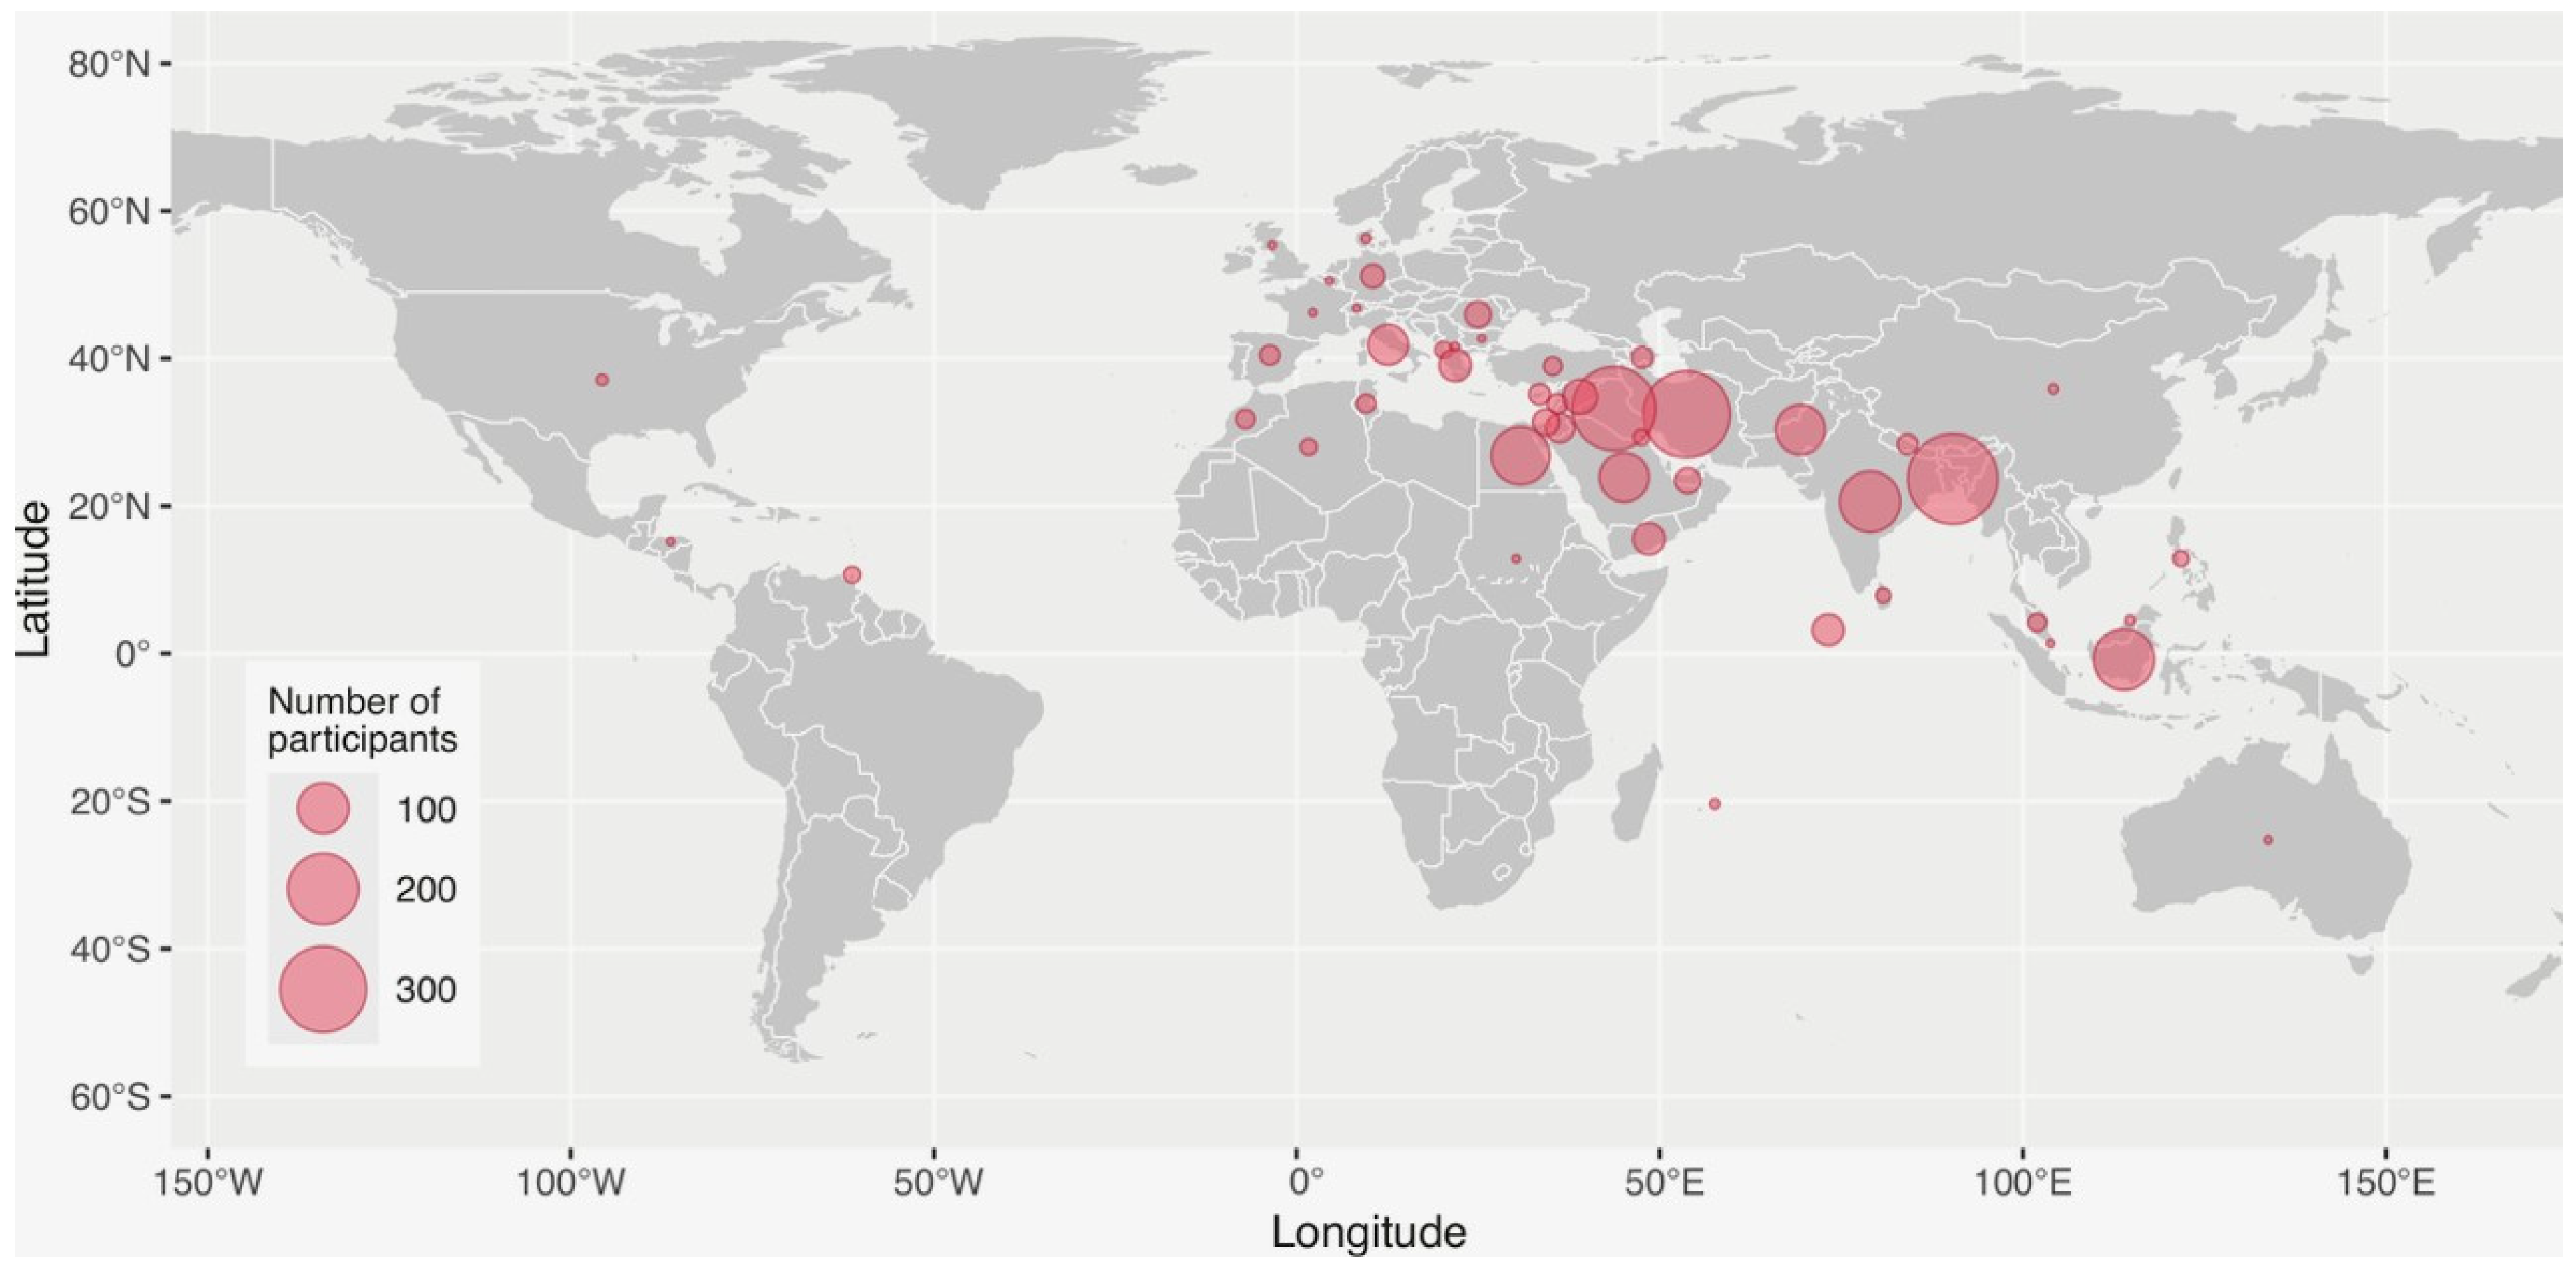

Table 1.
Basic Health Indicators.
| A/A | Country |
Population (millions) |
Infant mortality rate (per 1000 live births) | Life expectancy |
GDP (current US$) (billions) |
GDP per capita (current US$) | Government expenditure on education, total (% of GDP) | Current health expenditure (% of GDP) | World Bank income rank | Expected Thal. Births / 1000 live births (est from carrier rate) |
| EUROPE | ||||||||||
| 1. | Albania | 2.8 | 8.41 | 78 | 18.9 | 6,803 | 3.1 | 6.66 | Upper/mid income | 0.625/1000 |
| 2. | Belgium | 11.3 | 3.0 | 82.46 | 579 | 51166 | 6.2 | 11.6 | High income | 0.002/1000 |
| 3. | Bulgaria | 6.7 | 5 | 72.8 | 89 | 13773 | 4.5 | 8.52 | High income | 0.152/1000 |
| 4. | Cyprus | 1.26 | 2 | 82 | 28.4 | 31284 | 5.6 | 8.1 | High income | 4.9/1000 |
| 5. | Denmark | 5.9 | 3 | 82 | 395 | 68037 | 6 | 10.58 | High income | 0 |
| 6. | France | 64.7 | 3 | 83.35 | 278.3 | 40964 | 5.2 | 12.21 | High income | 0.0016/1000 |
| 7. | Germany | 83.3 | 3 | 82.18 | 407.2 | 51073 | 4.5 | 12.81 | High income | 0.0017/1000 |
| 8. | Greece | 10.3 | 3 | 82 | 219 | 20732 | 4.1 | 9.51 | High income | 1.64/1000 |
| 9. | Italy | 58.8 | 2 | 84.2 | 201 | 34158 | 4.1 | 9.45 | High income | 0.462/1000 |
| 10. | Romania | 19.9 | 5 | 75.14 | 301 | 15892 | 3.3 | 6.27 | High income | 0.025/1000 |
| 11. | North Macedonia | 2.1 | 4.65 | 75 | 13.6 | 6,591 | 3.3 | 7.89 | Upper/mid income | 0.169/1000 |
| 12. | Spain | 47.5 | 3 | 84.0 | 139.8 | 29350 | 4.6 | 10.71 | High income | 0.067/1000 |
| 13. | Switzerland | 8.8 | 3 | 84.4 | 808 | 93525 | 5.0 | 11.8 | High income | 0.004/1000 |
| 14. | Turkey | 85.8 | 8 | 78.7 | 906 | 10616 | 2.8 | 4.62 | Upper/mid income | 0.121/1000 |
| 15. | United Kingdom | 67.7 | 4 | 82.3 | 307 | 45850 | 5.3 | 11.94 | High Income | 0.0018/1000 |
| MIDDLE EAST | ||||||||||
| 16. | Yemen | 34.4 | 47 | 64.5 | nd | 702 | nd | 4.25 | Low/mid income | 0.484/1000 |
| 17 | Jordan | 11.3 | 12.56 | 75 | 47.5 | 4,204 | 3.2 | 7.47 | Upper/mid income | 0.306/1000 |
| 18. | Kuwait | 4.3 | 7.48 | 79 | 184.6 | 43,233 | 6.6 | 6.31 | High income | 0.121/1000 |
| 19. | Saudi Arabia | 36.4 | 5.75 | 78 | 1,108.1 | 30,436 | 7.8 | 5.54 | High income | 0.171/1000 |
| 20. | Lebanon | 5.5 | 7.05 | 76 | 23.1 | 4,136 | 1.7 | 7.95 | Upper/mid income | 0.132/1000 |
| 21. | Syria | 23.2 | nd | 76.3 | nd | 537 | nd | 3.0 | Low/mid income | 0.625 |
| 22. | Palestine (West Bank and Gaza) | 5.0 | 13 (world bank 2021) |
74.3 | 19.1 | 3,789 | 5.3 | - | Low/mid income | 0.4/1000 |
| 23. | United Arab Emirates | 9.4 | 5.45 | 80.4 | 507.5 | 53,757 | 3.9 | 5.67 | High income | 0.23/1000 |
| AFRICA | ||||||||||
| 24. | Algeria | 44.9 | 19.16 | 77.3 | 191.9 | 4,273 | 7.0 | 6.32 | Low/mid income | 0.1/1000 |
| 25. | Egypt | 111.0 | 16.23 | 70 | 476.7 | 4,295 | 2.5 | 4.36 | Low/mid income | 0.7/1000 |
| 26. | Mauritius | 1.3 | 15.31 | 75.7 | 12.9 | 10,216 | 4.9 | 6.66 | Upper/mid income | 0.37/1000 |
| 27. | Morocco | 37.5 | 15.42 | 74 | 134.2 | 3,527 | 6.8 | 5.99 | Low/mid income | 0.07/1000 |
| 28. | Tunisia | 12.4 | 14.03 | 76.9 | 46.7 | 3,776 | 7.3 | 6.34 | Low/mid income | 0.122/1000 |
| 29. | Sudan | 48.1 | 39 | 66.1 | 51.66 | 1.0 | 3.0 | Low/mid income | 0.38/1000 | |
| ASIA | ||||||||||
| 30 | Azerbaijan | 10.2 | 16.61 | 73.6 | 78.7 | 7,736 | 4.3 | 4.61 | Upper/mid income | 0.344/1000 |
| 31.. | Bangladesh | 171.2 | 22.91 | 73.9 | 460.2 | 2,688 | 2.1 | 2.63 | Low/mid income | 2.1/1000 |
| 32. | Brunei Darussalam | 0.45 | 10 | 74.5 | 16.7 | 37153 | 4.4 | 2.39 | High income | 0.47/1000 |
| 33. | China | 1,412.2 | 5.05 | 78 | 17,963.2 | 12,720 | 3.6 | 5.59 | Upper/mid income | 0.283/1000 (South only) |
| 34. | India | 1,417.2 | 25.49 | 67 | 3,385.1 | 2,388 | 4.5 | 2.96 | Low/mid income | 0.58/1000 |
| 35. | Indonesia | 275.5 | 18.88 | 68 | 1,319.1 | 4,788 | 3.5 | 3.41 | Low/mid income | 2.13/1000 |
| 36. | Iran | 88.6 | 10.87 | 76.9 | 388.5 | 4,387 | 3.6 | 5.34 | Upper/mid income | 0.576/100 |
| 37. | Iraq | 44.5 | 20.75 | 70 | 264.2 | 5,937 | 4.7 | 5.08 | Upper/mid income | 0.576/1000 |
| 38. | Malaysia | 33.9 | 6.46 | 75 | 406.3 | 11,971 | 3.9 | 4.12 | Upper/mid income | 0.377/1000 |
| 39. | Maldives | 0.52 | 5.10 | 81 | 6.2 | 11,817 | 5.8 | 11.35 | Upper/mid income | 8.9/1000 |
| 40. | Nepal | 30.5 | 22.82 | 68 | 40.8 | 1,336 | 4.2 | 5.17 | Low/mid income | 1.28/1000 |
| 41. | Pakistan | 235.8 | 52.78 | 66 | 376.5 | 1,596 | 2.4 | 2.95 | Low/mid income | 0.99/1000 |
| 42. | Philippines | 115.6 | 20.47 | 69 | 404.3 | 3,498 | 3.7 | 5.61 | Low/mid income | 0.024/1000 |
| 43. | Sri Lanka | 22.2 | 5.77 | 76 | 74.4 | 3,354 | 1.9 | 4.07 | Low/mid income | 0.18/1000 |
| 44. | Singapore | 6.0 | 2 | 84.27 | 467 | 82808 | 2.4 | 6.0 | High Income | 0.2/1000 |
| AMERICA | ||||||||||
| 45. | Honduras | 10.6 | 14 | 73.7 | 31.7 | 3040 | 5.4 | 9.1 | Low/mid income | 0.001/1000 |
| 46. | USA | 338.3 | 5 | 79.7 | 254.63 | 76399 | 5.4 | 18.82 | High Income | 0.004/1000 |
| 47. | Trinidad &Tobago | 1.5 | 14.60 | 73 | 27.9 | 18,222 | 4.1 | 7.31 | High income | 0.306/1000 |
| 48. | Australia | 26.4 | 3 | 83.73 | 362 | 64491 | 5.6 | 10.65 | High Income | 0.012/1000 |
Table 2.
Demographics, medical information and quality of services information derived from TIF’s International Survey of Thalassaemia Patients and their Caregivers.
Table 2.
Demographics, medical information and quality of services information derived from TIF’s International Survey of Thalassaemia Patients and their Caregivers.
| Study population | |
| n | 2082 |
| Age (in years) | |
| Mean, (SD) | 26.9 (12.6) |
| Missing (n, %) | 275 (13.3%) |
| Patient/Parent | |
| Patient (n, %) | 1465 (70.7%) |
| Parent (n, %) | 582 (28.1%) |
| Missing (n, %) | 24 (1.2%) |
| What is your gender? | |
| Male (n, %) | 877 (42.3%) |
| Female (n, %) | 1087 (52.5%) |
| Missing (n, %) | 107 (5.2%) |
| Which of the following categories best describes your employment status? | |
| Employed, working full-time (n, %) | 489 (23.6%) |
| Employed, working part-time (n, %) | 188 (9.1%) |
| Not employed, looking for work (n, %) | 528 (25.5%) |
| Not employed, NOT looking for work (n, %) | 517 (25.0%) |
| Retired (n, %) | 69 (3.3%) |
| Disabled, not able to work (n, %) | 232 (11.2%) |
| Missing (n, %) | 48 (2.3%) |
| Which of the following best describes your current relationship status | |
| Married (n, %) | 705 (34.0%) |
| Widowed (n, %) | 28 (1.4%) |
| Divorced (n, %) | 23 (1.1%) |
| Separated (n, %) | 24 (1.2%) |
| Cohabiting (n, %) | 664 (32.1%) |
| Single, never married (n, %) | 532 (25.7%) |
| Prefer not to answer (n, %) | 53 (2.6%) |
| Missing (n, %) | 42 (2.0%) |
| What is the highest level of school you have completed or the highest degree you have received? | |
| Less than high school degree | 478 (23.1%) |
| High school degree or equivalent (e.g., GED) | 456 (22.0%) |
| Some college but no degree | 161 (7.8%) |
| Bachelor degree | 497 (24.0%) |
| Master degree | 158 (7.6%) |
| Doctoral degree | 21 (1.0%) |
| Trade School | 35 (1.7%) |
| Missing (n, %) | 265 (12.8%) |
| If you are a patient, what is your diagnosis? If you are a parent, what is the diagnosis of your child? | |
| Other (n, %) | 274 (13.2%) |
| Beta Thalassaemia major (n, %) | 1510 (72.9%) |
| Beta Thalassaemia intermedia (n, %) | 250 (12.1%) |
| HbH disease (n, %) | 11 (0.5%) |
| Missing (n, %) | 26 (1.3%) |
| At what age did you start transfusion therapy? | |
| 1-4 years old (n, %) | 1647 (79.5%) |
| 5-6 years old (n, %) | 156 (7.5%) |
| 7-8 years old (n, %) | 61 (2.9%) |
| 9-10 years old (n, %) | 33 (1.6%) |
| Later (n, %) | 100 (4.8%) |
| I am not transfusion dependent (n, %) | 49 (2.4%) |
| Missing (n, %) | 25 (1.2%) |
| How is your current transfusion regime? | |
| I am not transfused (n, %) | 91 (4.4%) |
| I am regularly transfused (n, %) | 1779 (85.9%) |
| I am occasionally transfused (n, %) | 179 (8.6%) |
| Missing (n, %) | 22 (1.1%) |
| If regularly transfused, what is the usual Hb level pre-transfusion? | |
| Less than 7mg/dl (n, %) | 492 (23.8%) |
| 8-9mg/dl (n, %) | 970 (46.8%) |
| 10-11mg/dl (n, %) | 339 (16.4%) |
| Over 11mg/dl (n, %) | 165 (8.0%) |
| Missing (n, %) | 105 (5.1%) |
| Are blood supplies adequate at the centre you are transfused or are there delays in transfusion? | |
| No delays | 877 (42.3%) |
| Occasional delays | 973 (47.0%) |
| Delays are frequent so my Hb falls very low | 172 (8.3%) |
| Missing (n, %) | 49 (2.4%) |
| What kind of blood filtration is available at the clinic? | |
| Pre-storage | 367 (17.7%) |
| Bedside | 534 (25.8%) |
| None | 253 (12.2%) |
| I don't know | 855 (41.3%) |
| Missing (n, %) | 62 (3.0%) |
| At what age did you start receiving iron chelation therapy? | |
| 1-4 years old (n, %) | 885 (42.7%) |
| 5-6 years old (n, %) | 370 (17.9%) |
| 7-8 years old (n, %) | 196 (9.5%) |
| 9-10 years old (n, %) | 176 (8.5%) |
| Later (n, %) | 359 (17.3%) |
| Missing (n, %) | 85 (4.1%) |
| What chelation drugs do you use? | |
| Desferrioxamine (Desferal) | 469 (22.6%) |
| Deferiprone (Ferriprox / L1) | 274 (13.2%) |
| Deferasirox (Exjade) | 694 (33.5%) |
| Combination | 506 (24.4%) |
| Missing (n, %) | 128 (6.2%) |
| How often do you receive chelation? | |
| I take it regularly as prescribed | 1470 (71.0%) |
| I do not take it regularly | 372 (18.0%) |
| I don't receive iron chelation therapy | 176 (8.5%) |
| Missing (n, %) | 53 (2.6%) |
| How available are iron chelation drugs to you and at what dose? | |
| I always receive the chelation drugs in the quantity that I need them (at the right dose, continuous availability) | 1243 (60.0%) |
| I receive a lower dose of chelation drugs than prescribed because of there isn't enough quantity (poor supplies) | 377 (18.2%) |
| I receive chelation drugs but not all the time because of interruptions in supply | 328 (15.8%) |
| Missing (n, %) | 123 (5.9%) |
| How often is your ferritin level measured? | |
| Every month | 161 (7.8%) |
| Every two months | 110 (5.3%) |
| Every three months | 646 (31.2%) |
| Every six months | 819 (39.5%) |
| Every twelve months | 194 (9.4%) |
| Never | 86 (4.2%) |
| Missing (n, %) | 55 (2.7%) |
| Your current ferritin level is: | |
| <500ng/ml | 213 (10.3%) |
| 501-1000ng/ml | 325 (15.7%) |
| 1001-2000ng/ml | 446 (21.5%) |
| 2001-4000ng/ml | 444 (21.4%) |
| >4001ng/ml | 362 (17.5%) |
| I don't know | 236 (11.4%) |
| Missing (n, %) | 45 (2.2%) |
| How often is cardiac iron measured by T2*? | |
| Twice a year | 131 (6.3%) |
| Annually/ Every year | 429 (20.7%) |
| Every 2 years | 175 (8.5%) |
| Rarely | 359 (17.3%) |
| Never | 909 (43.9%) |
| Missing (n, %) | 68 (3.3%) |
| What is your latest T2* level? | |
| Under 6ms | 345 (16.7%) |
| 7-10ms | 357 (17.2%) |
| 11-20ms | 166 (8.0%) |
| Over 20ms | 211 (10.2%) |
| Missing (n, %) | 992 (47.9%) |
| How is your liver iron measured? | |
| Liver biopsy | 67 (3.2%) |
| MRI | 701 (33.8%) |
| Not measured at all | 1195 (57.7%) |
| Missing (n, %) | 108 (5.2%) |
| What is your latest Liver Iron Concentration? | |
| Less than 7 mg/kg of dry weight | 132 (6.4%) |
| 8-15 mg/kg of dry weight | 89 (4.3%) |
| Above 16 mg/kg of dry weight | 49 (2.4%) |
| I am not sure | 330 (15.9%) |
| I don't know | 1355 (65.4%) |
| Missing (n, %) | 116 (5.6%) |
| If paying out of pocket, which services are you paying for? (Tick all that apply) | |
| Transfusion | 718 |
| Chelation pumps | 308 |
| Chelation drugs | 822 |
| Lab tests | 1064 |
| MRI | 525 |
| Hospitalisation | 513 |
| Multidisciplinary Care* | 603 |
| None answer (n, %) | 377 (18.2%) |
| Who pays for your treatment? (Tick all that apply) | |
| Myself/my family | 1245 |
| Health insurance (private): mine | 194 |
| Health insurance (private): my employer's | 97 |
| State-provided free healthcare | 563 |
| State-provided, partly free | 335 |
| Other | 317 |
| None answer (n, %) | 58 (2.8%) |
| What specialist(s) do you visit, in addition to your main treating doctor? | |
| Heart specialist | 776 |
| Endocrinologist | 572 |
| Diabetologist (If separate from endocrinologist) | 225 |
| Psychologist | 142 |
| Liver specialist | 368 |
| Nephrologist | 182 |
| None answer (n, %) | 785 (37.9%) |
| Where are you transfused? | |
| Haematology ward | 518 |
| Children’s ward | 181 |
| Transfusion centres | 1238 |
| Other | 219 |
| None answer (n, %) | 62 (3.0%) |
| Are you satisfied with the quality and type of services you are receiving? | |
| Very unsatisfied (n, %) | 288 (13.9%) |
| Unsatisfied (n, %) | 340 (16.4%) |
| Neutral (n, %) | 412 (19.9%) |
| Satisfied (n, %) | 783 (37.8%) |
| Very satisfied (n, %) | 220 (10.6%) |
| Missing (n, %) | 28 (1.4%) |
| How would you rate access to your treatment? | |
| Very difficult (n, %) | 289 (14.0%) |
| Difficult (n, %) | 471 (22.7%) |
| Neutral (n, %) | 604 (29.2%) |
| Easy (n, %) | 549 (26.5%) |
| Very easy (n, %) | 121 (5.8%) |
| Missing (n, %) | 37 (1.8%) |
| If your answer to the previous question was "Very difficult" or "Difficult" please indicate why: | |
| High cost of travel to treating center | 322 (15.5%) |
| High cost of treatment | 348 (16.8%) |
| High cost of both travel to the treating centre and treatment | 358 (17.3%) |
| Missing (n, %) | 1043 (50.4%) |
| How many days per year do you lose from education or work because of having to attend treatment for thalassaemia? | |
| None | 383 (18.5%) |
| 1-5 days | 296 (14.3%) |
| 6-10 days | 111 (5.4%) |
| 11-15 days | 387 (18.7%) |
| 16 or more days | 778 (37.6%) |
| Missing (n, %) | 116 (5.6%) |
Disclaimer/Publisher’s Note: The statements, opinions and data contained in all publications are solely those of the individual author(s) and contributor(s) and not of MDPI and/or the editor(s). MDPI and/or the editor(s) disclaim responsibility for any injury to people or property resulting from any ideas, methods, instructions or products referred to in the content. |
© 2024 by the authors. Licensee MDPI, Basel, Switzerland. This article is an open access article distributed under the terms and conditions of the Creative Commons Attribution (CC BY) license (http://creativecommons.org/licenses/by/4.0/).
Copyright: This open access article is published under a Creative Commons CC BY 4.0 license, which permit the free download, distribution, and reuse, provided that the author and preprint are cited in any reuse.


