Submitted:
05 January 2024
Posted:
10 January 2024
You are already at the latest version
Abstract
Evolutionary Machine Learning (EML) has demonstrated its effectiveness in modeling various real-world application domains, including the dynamics of diseases and the creation of predictive models across diverse fields. However, the challenge of data imbalance adversely impacts the performance of EML models. While strategies involving misclassification costs or cost-sensitive learning exist to address this issue, their integration into EML has yet to be thoroughly explored. This paper aims to fill this gap by investigating the application of cost-sensitive EML for intelligent health risk prediction. More specifically, this paper delves into the utilization of cost-sensitive genetic programming (CSGP) and cost-sensitive genetic algorithms (CSGA), which are among the most widely used algorithms in the EML category. The study entails training CSGP and CSGA to predict the early onset of three chronic conditions (hypertension, diabetes, and fatty acid-related disorders) through the development of an EML model. Subsequently, the model's performance is evaluated through standard fitness functions such as sensitivity, specificity, and F1-score. From the experimental results, EML models demonstrate promising results in identifying the occurrence of chronic diseases. Further optimization of the cost-sensitive EML model holds the potential for enhanced outcomes in modeling medical problems.
Keywords:
Cost-sensitive learning
; Evolutionary computation
; Chronic diseases prediction: Classification
; Machine learning
1. Introduction
In the present day, people encounter a range of diseases influenced by current environmental conditions and their lifestyle choices. The early identification and prediction of these ailments are crucial for averting their severity. Manual disease identification by doctors is often challenging, emphasizing the need for accurate methods. Predictive models have been developed to assist medical professionals and patients in decision-making processes related to disease screening, diagnosis, early intervention, and prevention [1,2]. These models contribute to patient risk stratification and facilitate lifestyle modifications [3,4]. Broadly categorized as assessing the likelihood of a specific disease, classifying diseases, detecting or identifying disease cases, serving diagnostic or prognostic purposes, predicting responses, or assessing the risk of recurrence, these models play a significant role in healthcare [5,6,7,8]. This study specifically aims to construct a predictive model for the detection of chronic diseases.
The prevalence of chronic diseases is escalating, posing a growing healthcare burden as patients grapple with diverse symptoms and require lifelong treatment. Prominent chronic illnesses encompass diabetes, strokes, cardiovascular disease, high blood pressure, and cancer. Research indicates a rapid increase in the total economic cost of diabetes, heart disease, and hypertension, combining direct healthcare expenses with productivity losses [9], making them the leading causes of global mortality. Given their asymptomatic nature, current medical interventions and vaccines are insufficient in fully preventing chronic conditions. The swift growth of the ageing population contributes to the enduring prevalence of chronic conditions like diabetes, hypertension, and cancer. Lifestyle factors like smoking, physical inactivity, dietary habits, and excessive alcohol consumption contribute to the onset of chronic diseases.
Consequently, there is a pressing need to identify these contributing factors and implement corrective measures accurately. Timely detection of chronic conditions enables preventive interventions and effective early-stage treatment. The application of evolutionary machine learning (EML) has proven instrumental in predicting chronic diseases at an early stage. This study aims to develop EML models for diagnosing and predicting chronic disease conditions, providing valuable support to healthcare communities [10]. Evolutionary computation methods draw inspiration from nature and address optimization problems through a stochastic process. These approaches provide a dependable and efficient means to tackle intricate challenges in various fields, including agriculture, manufacturing, finance, and healthcare. In healthcare, EML techniques play a crucial role in various applications, such as gene sequence analysis, gene mapping, structure prediction, and DNA examination for biomarker identification [11]. Additionally, EML demonstrates encouraging outcomes in critical areas like drug discovery and materials design, particularly in scenarios where the exploration space is virtually boundless. Genetic algorithms (GAs) and genetic programming (GP) are commonly utilized algorithms in EML classification tasks. Both approaches employ genetic operators such as crossover and mutation to generate novel individuals progressively. These algorithms draw inspiration from nature and find applications in optimization and search problems. The primary distinction between Genetic Algorithms (GAs) and Genetic Programming (GP) lies in their representation: GAs employ a fixed-length bit string, whereas GP can accommodate more adaptable structures like trees and graphs with variable sizes.
Until now, diverse variants of ELM have gained prominence in classification and regression tasks [12,13]. However, existing ELM-based prediction methods, like other machine learning methods, typically aim to reduce error rates across all misclassifications uniformly. This assumption may not hold in various practical situations, especially in disease classification systems, where different errors can lead to varying levels of loss. For example, misidentifying a patient with a disease as a healthy individual could result in significant consequences. The resampling methods, such as under-sampling and over-sampling, are popular approaches for dealing with an imbalanced data problem [14]. However, both approaches can cause either the loss of important information or the addition of irrelevant classification data that can affect the prediction accuracy for minority examples in the imbalanced dataset [15,16]. Recognizing the importance of varying losses in EML prediction systems, a recent focus is on developing cost-sensitive classification tasks. Thus, this study focuses on developing cost-sensitive EML to alleviate the imbalanced problem in chronic disease classification. The main highlights of this work are outlined as follows:
- This paper proposed the application of cost-sensitive EML (GP and GA) for intelligent health risk prediction using three chronic disease datasets.
- We investigate how well the existing cost-sensitive learning approaches in machine learning perform when applied within the context of GP and GA.
- We used GP to perform optimal feature extraction automatically, discovering relationships among variables and generating interpretable models in the form of a tree-like structure. This underscores GP's significant superiority over conventional machine learning algorithms, a characteristic shared with GA.
- Our experimental results highlighted that both GP and GA successfully performed automatic health risk prediction with high efficiency and excellent performance.
2. Methods
2.1. Model Development
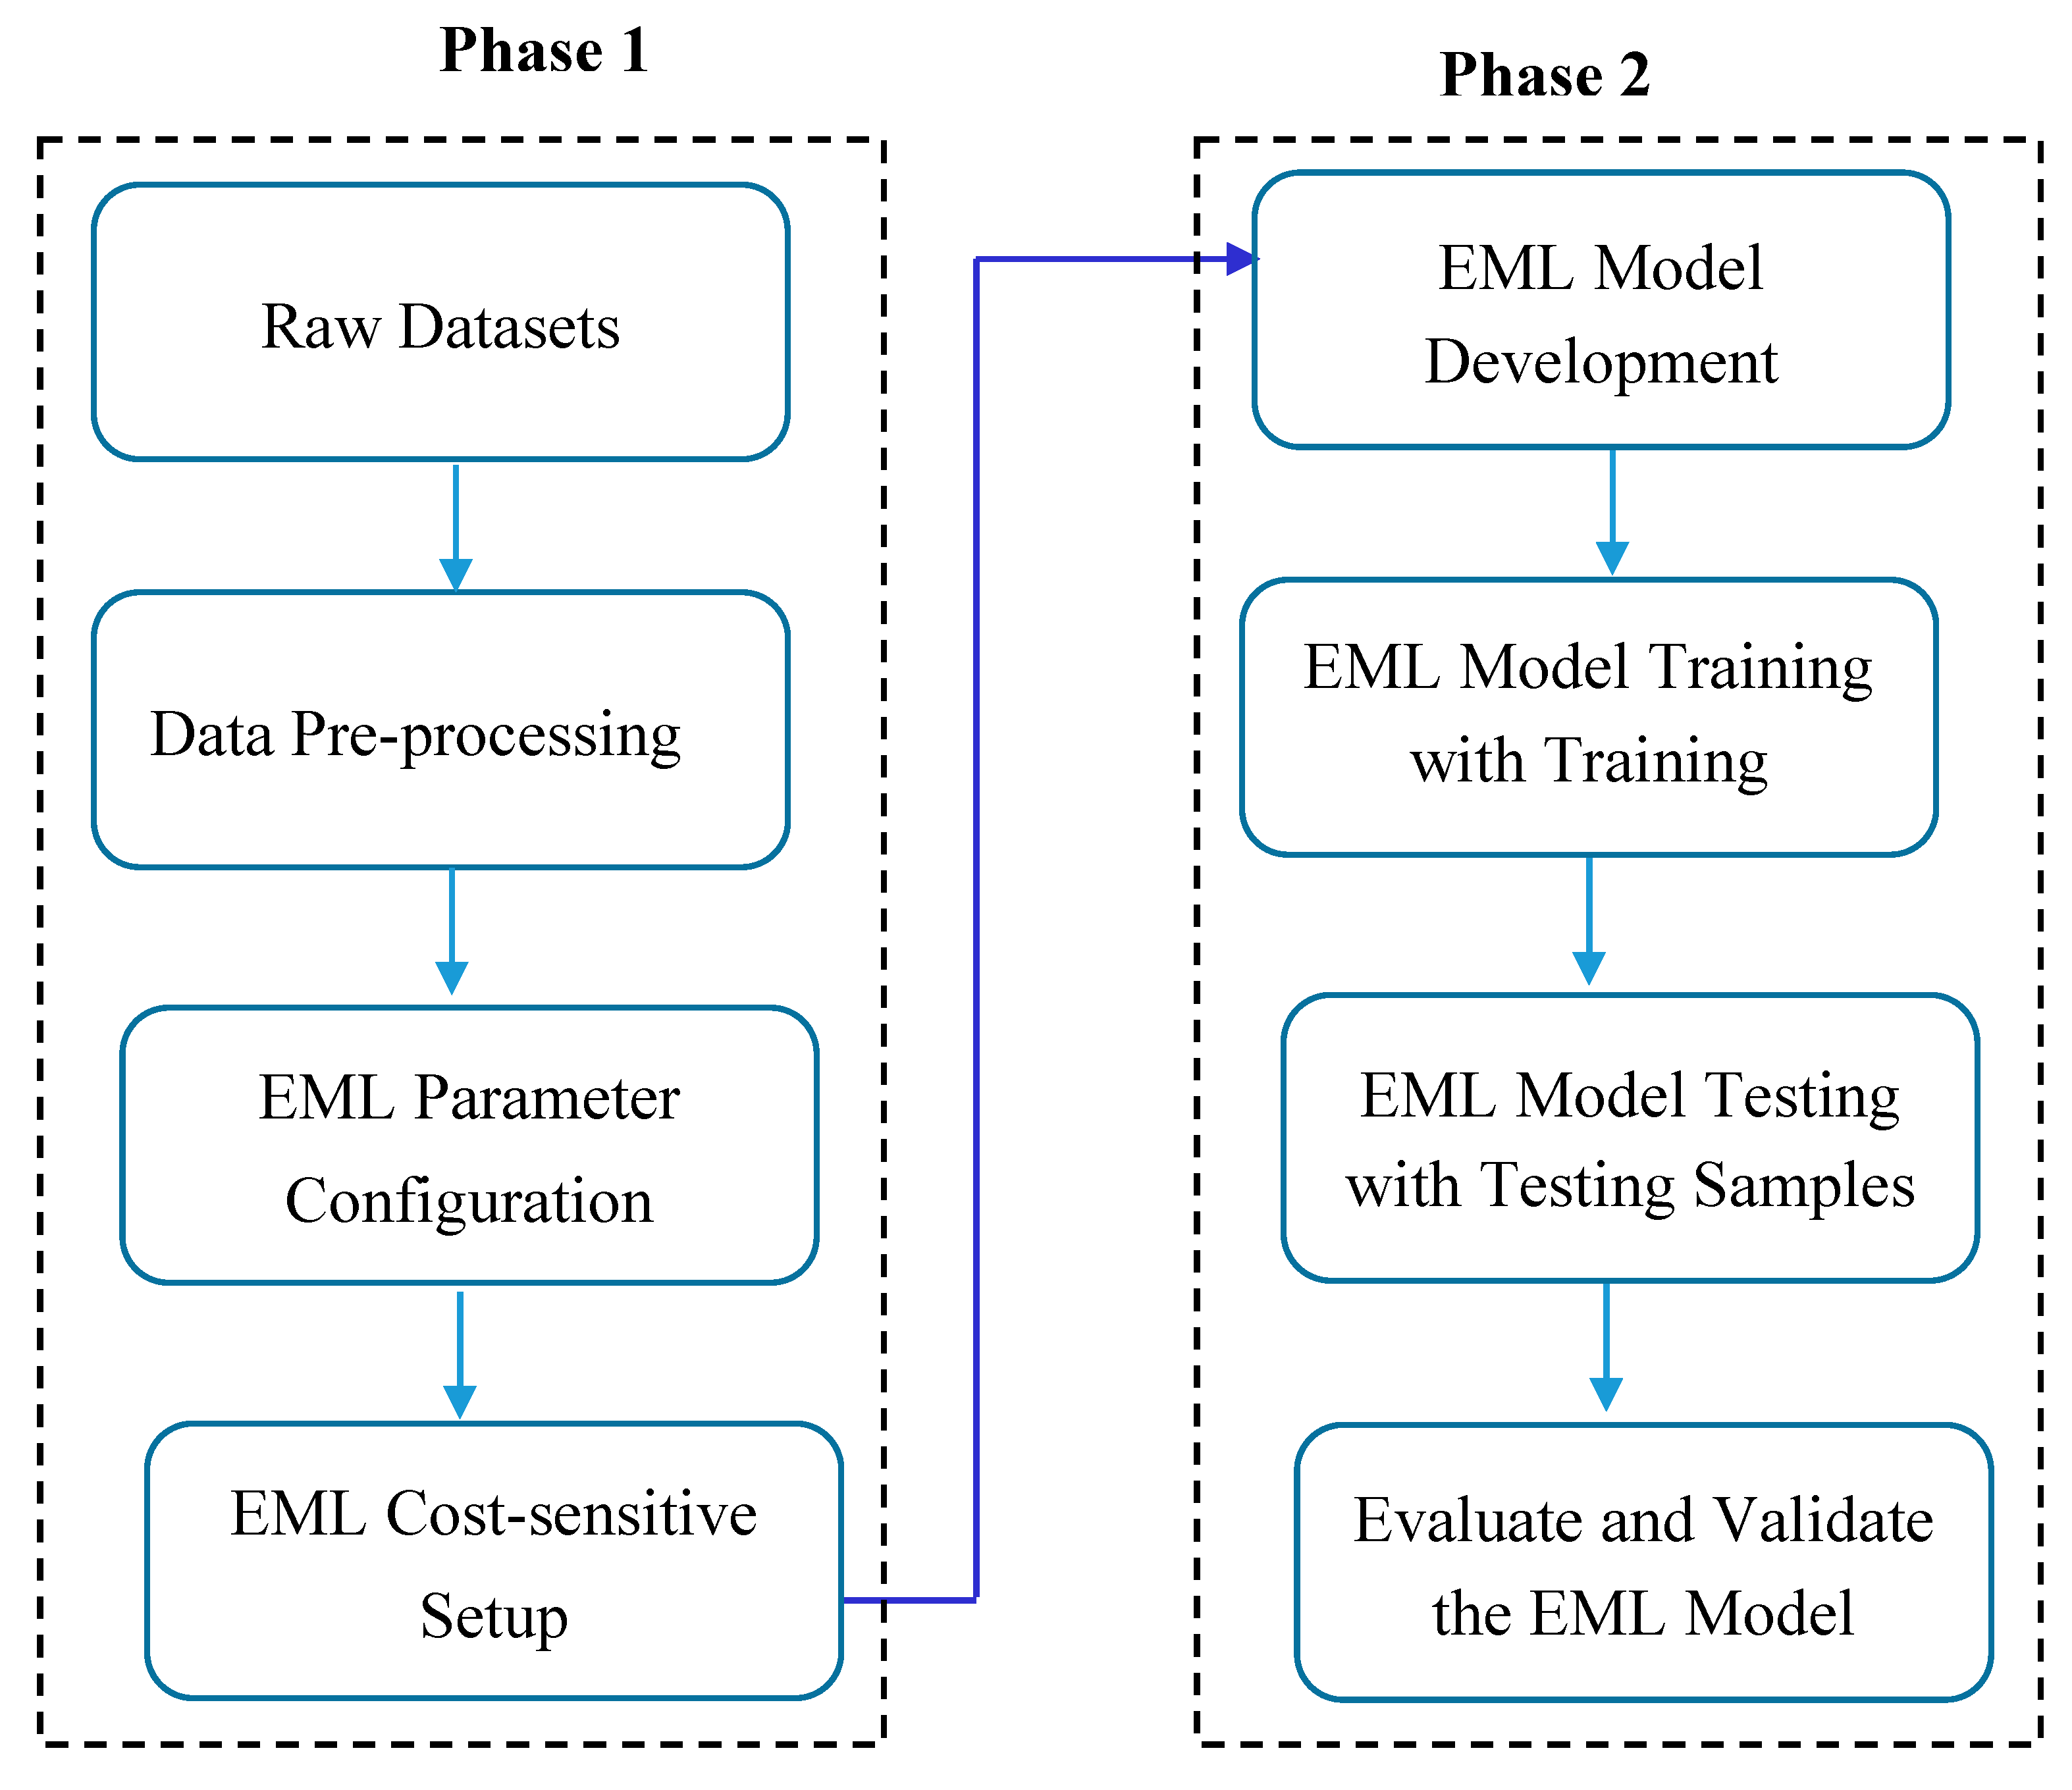
The model development process follows an approach that is comprised of a combination of two phases. Initially, we performed data pre-processing, which included data cleaning, handling outliers, feature selection, configuration of parameters, and cost-sensitive learning. The second phase includes the development of an EML model that can make predictions on the pre-processed dataset. Specifically, both GP and GA models were built and trained for predicting chronic diseases. This stage encompasses both the learning and evaluation phases. The learning phase is specifically crafted to enhance the evolutionary algorithms for the three chronic disease datasets. This involves training GP/GA with the training datasets and testing GP with distinct test datasets. Ultimately, the fitness of the evolved model is assessed using a suitable metric.
Figure 1.
Model development process.
2.2. Datasets
The chronic disease datasets used in this study include hypertension, diabetes, and fatty liver, which have been located at https://github.com/adane04/Datasets/tree/main. Diabetes comprises 57967 physical examination records with 63 features where the value of one class '0' is treated as no sign of diabetes (normal or negative class), and the value of another class '1' is treated as a sign of diabetes (positive or have the disease). The class distributions contain 94 % negative class and 6% positive class, showing that the data is imbalanced. Similarly, hypertension and fatty liver datasets contain 57967 physical examination records with 63 variables with an unequal frequency between the negative and positive classes. Each dataset contains one class variable that represents the target outcome. The dataset has been used in various applications and research papers, such as [17,18].
3. Evolutionary Machine Learning
Artificial Intelligence (AI) includes a diverse set of techniques aimed at creating systems within computers capable of emulating various aspects of human intelligence, including thinking, behaviour, and perception. Within the realm of AI, evolutionary computation (EC) constitutes a specialized sub-field that incorporates a range of nature-inspired algorithms. These algorithms operate on populations of candidate solutions (individuals) and iteratively evolve toward optimal or favourable solutions. By leveraging the simultaneous evolution of multiple solutions, EC techniques are recognized for their effectiveness in global search tasks. In recent times, researchers have integrated EC approaches into various stages of the machine learning process, such as pre-processing, learning, and postprocessing, to overcome the limitations of conventional methods. These innovative and hybrid methodologies are collectively referred to as Evolutionary Machine Learning (EML) [19]. Evolutionary algorithms, a key component of EML, apply principles reminiscent of Darwinian natural selection to search for optimal solutions. Genetic Algorithms (GAs) and Genetic Programming (GP) stand out as widely employed algorithms within the evolutionary computation category.
GAs were the first evolutionary computation technique employed for the development of classification rules. GA functions as an optimizer influenced by the principles of natural evolution, with proposed solutions adapting over successive iterations to approach the optimal outcome [20]. The evolutionary process mirrors natural selection, with steps analogous to those seen in nature. For instance, two solutions form a pair, referred to as parents, and their combination results in a new solution known as a child. In alignment with evolutionary terminology, each proposed solution in the genetic algorithm is termed a chromosome. These chromosomes denote specific points within the search area, comprising a constant number of genes. The enhancement of chromosomes occurs in each generation through the reproductive process of matching and combining existing chromosomes.
Unlike GA, where individuals are represented using vectors, GP is an integral component of evolutionary algorithms, employing heuristic search principles inspired by natural evolution for optimal solution discovery through parameter optimization [21]. GP represents a domain-independent methodology that breeds a population of computer programs genetically to address problem-solving [22]. Functioning as a search and optimization algorithm, GP iteratively transforms a program population into a new generation using genetic operators, with the primary ones being crossover, mutation, and reproduction [23]. Crossover combines subtrees from parents, generating new programs; mutation substitutes a subtree with a randomly generated tree, and reproduction duplicates an individual to form a new population.
Both approaches utilize genetic operators such as crossover and mutation to foster the emergence of novel individuals. Nonetheless, their primary distinctions reside in their representation; GAs are depicted as a list of actions and values, typically formatted as a string or vector, whereas GP is described as a tree structure with more flexible representations.
Figure 2.
GP main stages in the search process.

3.1. Cost-Sensitive EML
Many EML algorithms typically assume a balanced setting for misclassification costs, treating false negatives and false positives equally [24]. However, this assumption does not hold in many real-world domains, particularly in the medical field. In medical datasets, the prevalence of healthy individuals often outweighs that of unhealthy ones, leading to imbalanced class distributions [25,26,27]. For instance, misclassifying a medical condition like cancer is more critical than a false alarm, as delayed diagnosis and treatment could result in the loss of life for patients. Similarly, in our dataset on chronic diseases, a significant majority of patients—approximately 23%, 6%, and 36% for hypertension, diabetes, and fatty liver, respectively—are labelled as negative. EML-based classifiers applied to this dataset exhibit notably low sensitivity in the minority class, leading to increased misclassification of patients from the underrepresented group compared to the majority class.
EML employs a search strategy to find the optimal fitness value for a program by utilizing a fitness function. This function assesses the proposed solution's quality, serving as a pivotal factor in controlling the EML process. To achieve an optimal solution for a given problem, a well-suited fitness function is essential. Traditionally, accuracy is commonly employed as the fitness function for solving classification problems in EML. However, when the problem data exhibits an imbalanced class distribution, relying solely on accuracy becomes inadequate. Maximizing accuracy in such cases often results in categorizing everything as the majority class, leading to unsatisfactory outcomes. To address bias and overfitting associated with imbalanced data, a practical approach is cost-sensitive learning. This technique involves assigning a higher cost for predicting a specific class and imposing penalties (higher costs) on the classifier for any misclassification of that class. A cost matrix, akin to the confusion matrix, outlines the costs associated with misclassification in a specific scenario. This matrix assigns a greater cost to misclassifications compared to correct classifications. The cost matrix, outlined in Table 1, illustrates the costs associated with false negatives (FN) and false positives (FP), denoted as C(-, +) and C(+, -), respectively. The notation '+' is used to represent minority classes, while '-' denotes majority classes. The cost of misclassifying an instance from 'class i' as 'class j' is denoted as C(i, j), with C(i, i) representing the cost of correct classification (zero cost).
In this matrix, assigning a person with diseases as healthy incurs a penalty denoted as C(-,+), while classifying a healthy individual as having the disease results in a penalty cost represented by C(+,-). By assigning higher cost values, emphasis is given to specific classes, aiding in the development of a classifier for imbalanced datasets. This approach contributes to training the classifier to recognize classes with fewer instances, mitigating the risk of overfitting. This study employs a cost-sensitive Ensemble Machine Learning (EML) approach utilizing Genetic Programming (GP) and Genetic Algorithms (GA) to construct a predictive model. The objective is to minimize expected misclassification costs and errors through a fitness function, represented by equation 1. The fitness function aims to select a classifier with the lowest misclassification cost (total cost).
where FP represents the overall count of false positives, while FN stands for the total number of false negatives. FP is the number of instances that were classified as having the diseases, and actually, they have not. FN is the number of instances that have diseases but were classified as not having the disease.
3.1. EC for Feature Selection
One of the most important features of EC is the interpretability of the generated models since the results are often human-friendly and provide an explicit mathematical formula as its output. EC can give an insight into the most important variables using an embedded automatic feature selection mechanism. In the course of EML’s evolutionary cycle, features that have more impact on the performance of the models will survive and keep appearing in the classification models, while the less relevant ones will decay in the models until they disappear. In GP, the significance of each feature is determined by assessing the frequency of feature references across all models generated throughout the iterations of GP. The steps to articulate the relative importance of a specific feature are outlined as follows [28]:
- Let F is a set of input features where
- The frequency of with respect to a given model M generated during the GP evolutionary process can be defined as RefCount(, M), which is the number of references to in M.
- Thus, the frequency of with respect to a population P can be defined as:
- The relative frequency of variable in a population P is the number of references of variable divided by the number of all variable references as given in this equation.
In the diagnosis of chronic diseases, it is crucial to pinpoint the most significant features within the data. This helps identify the key risk factors associated with the disease and analyze their potential impact on the patient. In addition, from the GP perspective, identifying these relevant features helps in building a fast classifier that can label the new data based on a few inputs.
4. Experimental settings
This section establishes an experimental setup for the proposed approach, aiming to showcase its performance using three imbalanced chronic disease datasets. To evaluate the generated CSGP and CSGA models, several experiments were performed by splitting the datasets into training and testing. Taking into account that the data is imbalanced, stratified sampling is applied in splitting the data in order to preserve the ratio of each class in the training and testing parts. The proportions are 75% and 25% for the training and testing, respectively, where the training set is employed to train the EML model, encompassing both input data and the corresponding expected output, and the testing set includes only input data that is being used to assess how well the models were trained and to estimate model properties.
4.1. EML Parameter Setup
In EML models, setting the control parameters is an important first step to manipulate data and to obtain better results. For this, a systematic experimentation process was conducted to tune the parameters of GP and GA using different population sizes (i.e., 100, 330, 500, and 1000). For mutation and crossover rates, the models were experimented at 2%, 5%, 10%, and 15% for mutation, and 85%, 90%, and 95% for crossover.
Because EML models exhibit a stochastic nature, several experiments were executed, each utilizing a distinct random number of generator seeds. The tournament selection has been employed as the selection mechanism, and the maximum tree depth has been set to its default value. It is noteworthy that both GP and GA require additional control parameters. In this experiment, the best performance was obtained with the parameter values listed in Table 2.
4.2. Performance Evaluation
In the context of EML, the fitness function establishes a metric for evaluating the precision of a solution. This is achieved by assessing the agreement between the predicted class labels and the corresponding actual class labels. The EML models were evaluated using common statistical parameters such as sensitivity, specificity, accuracy, and F1-score, which are based on the true positives, true negatives, false positives, and false negatives. Sensitivity (true positive rate) is the ratio of the proportions of positive chronic cases that are accurately predicted divided by the total number of actual positive chronic cases. Specificity (true negative rate) is calculated as the number of negative chronic predictions divided by the total number of actual negative chronic cases. The accuracy is computed by dividing the total count of correct predictions by the overall size of the dataset. A biased classier, which has very poor accuracy on the minority class but high majority class accuracy, can also have a high overall accuracy due to the influence of majority class learning instances. Measuring the individual classification accuracy of the minority and majority classes separately using sensitivity and specificity can avoid this learning bias when evaluating model performance in unbalanced class scenarios. The F1-score is used as the harmonic mean of precision and recall [29,30]. It provides the most reliable evaluation of the model’s prediction performance while considering the worst-case prediction scenario for a classifier. The F1 score proves to be a valuable and widely employed metric for assessing performance in classification tasks, especially when dealing with imbalanced data.
5. Results and Discussions
When examining EML for classification, a crucial factor is understanding the count of correctly classified samples and those classified erroneously.
In CSGP, this task is handled by evaluating the quality of the generated model using sensitivity and specificity. The quality of GP is generally called the fitness of a solution candidate. The fitness of the proposed CSGP model was tested using different penalty cost matrices starting from 3 until 11 by representing the penalty cost matrices using the expressions [1:x], [1:x+2], . . ., 1: x+n]. These costs are increased by a step of 2 and come from extensive experiments with different penalty costs, where choosing n=11 was the last penalty cost because sensitivity values increase significantly with higher costs. The results of the CSGP with five different cost matrices on the diabetes dataset are compared using sensitivity and specificity as fitness functions, as shown in Fig.3. The figure shows how the sensitivity of CSGP increases with the different penalty cost matrices, where [1:1] represents the performance of the original data classification. The increase in sensitivity values reflects the high detection of subjects with chronic diseases but also the high misclassification of the normal subjects.
Figure 3.
The performance of CSGP on the diabetes dataset at various penalty costs.
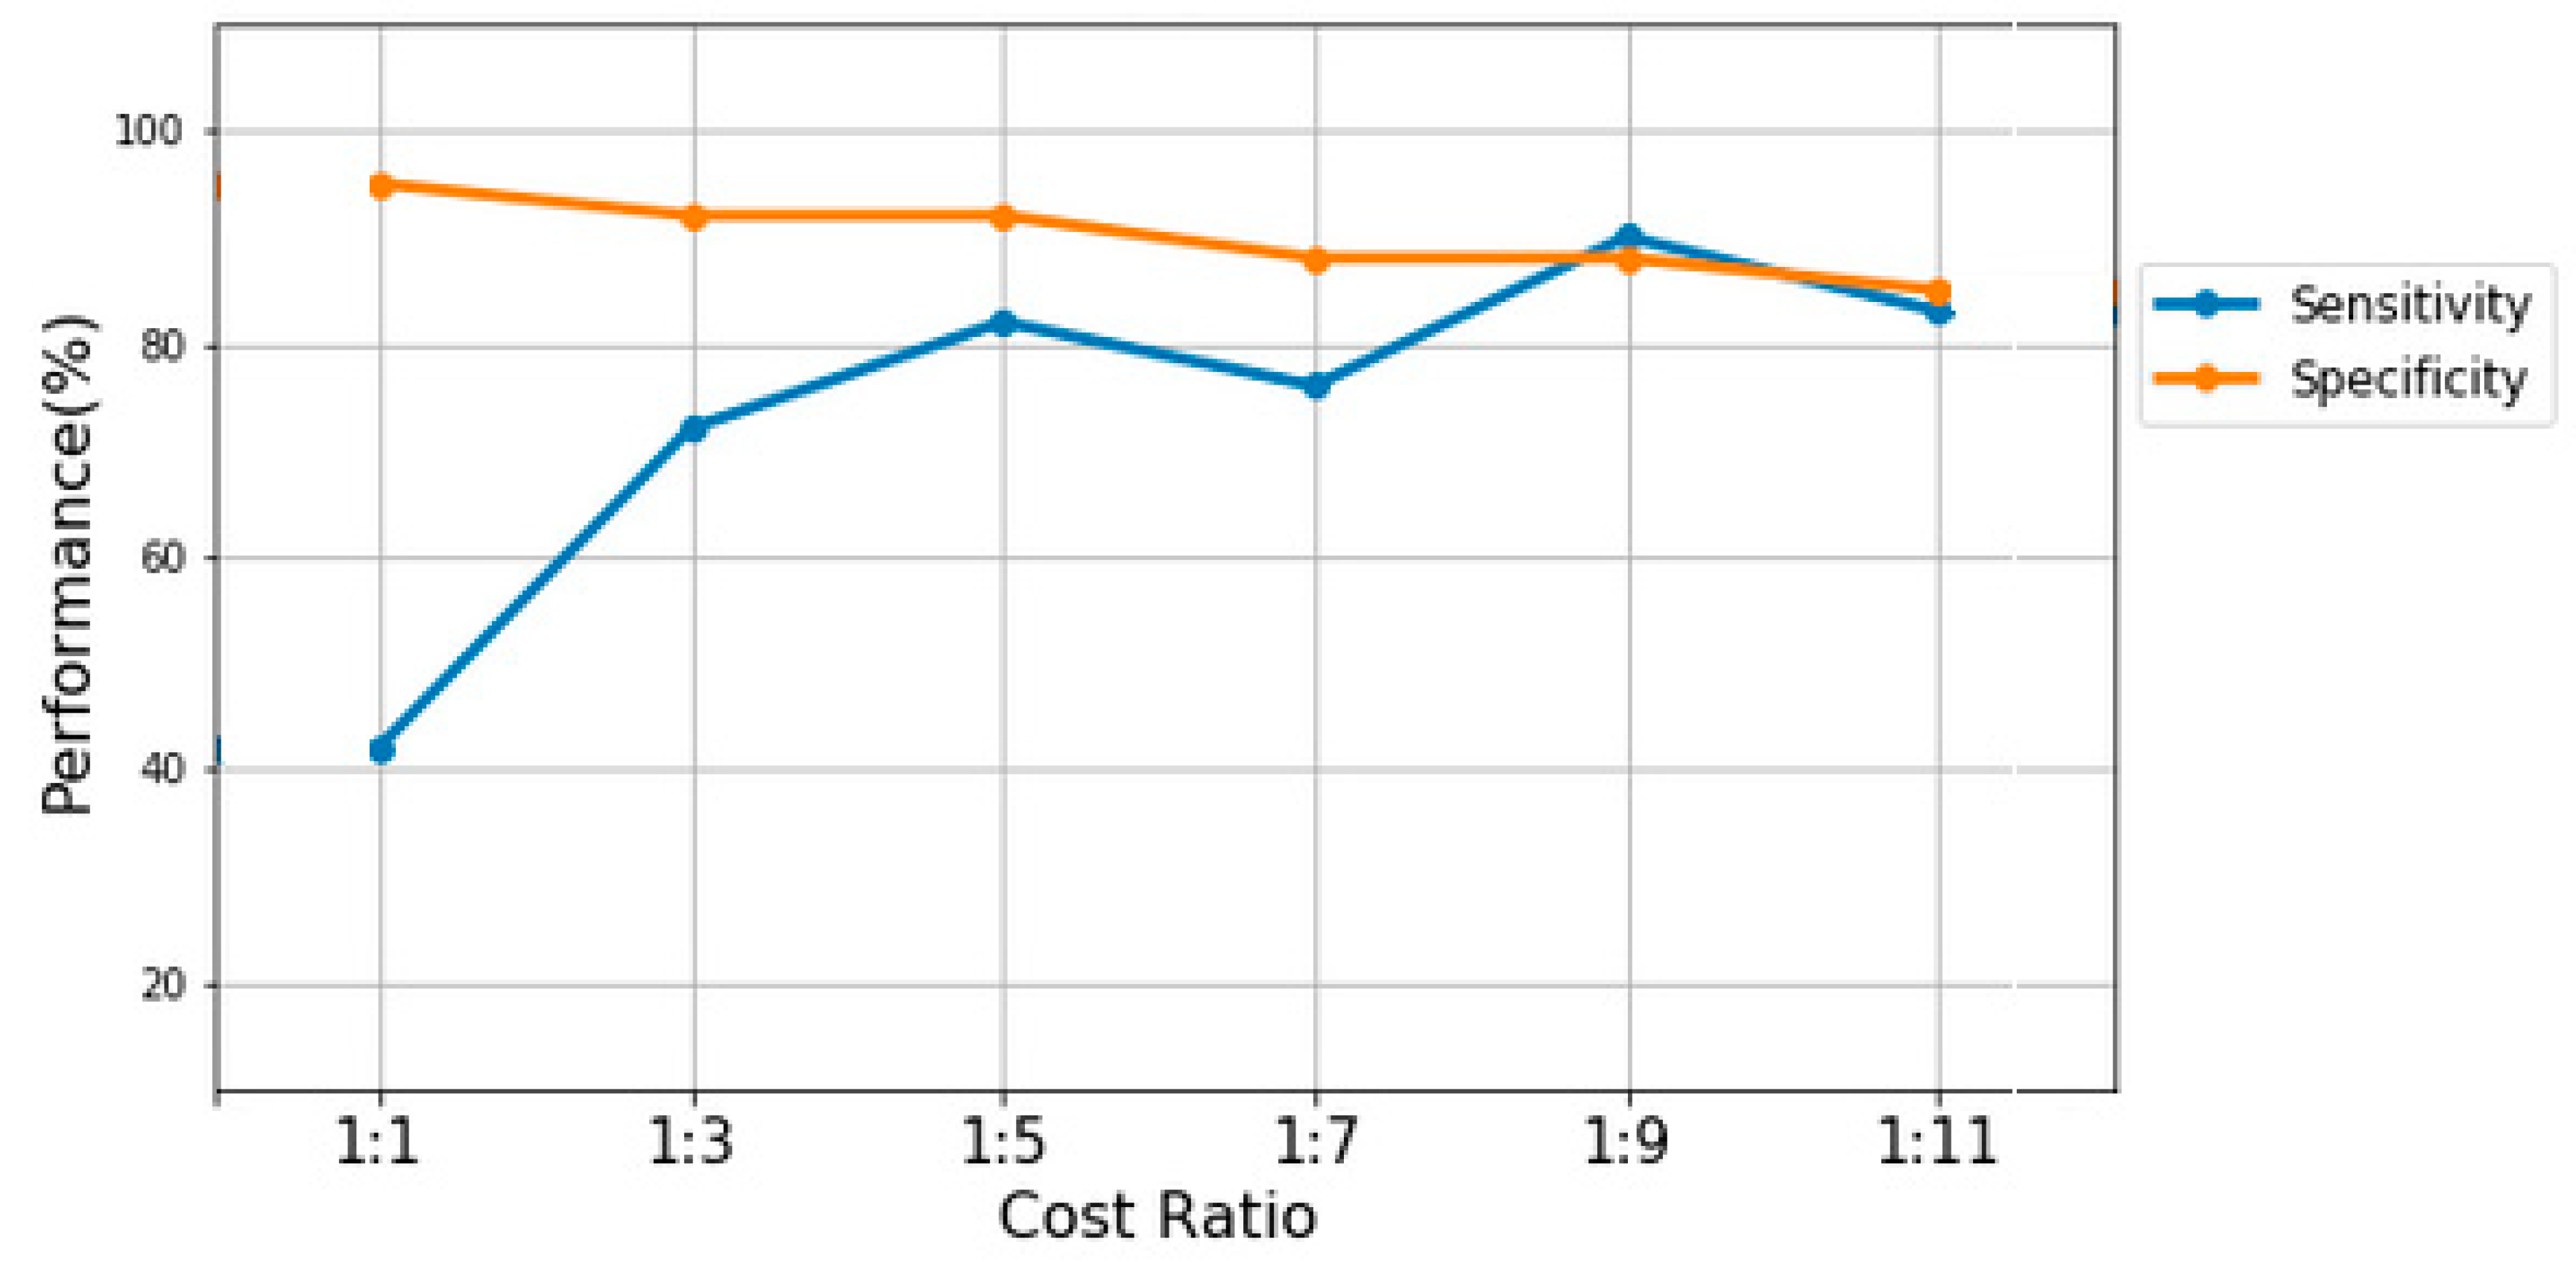
It is clear from the figure that the sensitivity fitness function detects more diabetic patients with higher penalty costs, while specificity relatively drops down when CSGP uses higher penalty costs. The sensitivity values start at 40% for the [1:1] penalty cost matrix and reach 90% with the [1:9] penalty cost matrix. Then, it falls down to reach 83% with [1:11] penalty cost matrix. Similarly, on other datasets (i.e., hypertension and fatty liver), the performance of CSGP achieved the highest score using higher penalty costs. Table 4 shows the performance of CSGP and CSGA in terms of accuracy, precision, sensitivity, specificity, and F1 score using the best cost matrix selected for each chronic disease dataset.
In the context of CSGA, the amalgamation of misclassification cost and feature extraction cost is considered for cost-sensitive learning. The fitness function is formulated by considering both the misclassification error and the cost associated with feature extraction.
As shown in Fig. 3, CSGP, using the cost penalty matrix of [1:9], achieved the highest performance on diabetes data with a sensitivity value equal to 0.90, an accuracy value equal to 0.93, and an F1-score value of 0.94. However, it achieved the lowest specificity of 0.76. On hypertension and fatty liver datasets, the best performance was found using the cost matrix [1:5] and [1:11], respectively. In addition, the population dynamics of CSGP across generations are also evaluated based on mean squared error (MSE). The MSE is a measure that quantifies the average of the squared variances between predicted values and actual values. It is computed using the formula:
Here, y represents the actual value, represents the predicted value, and n denotes the total number of instances.
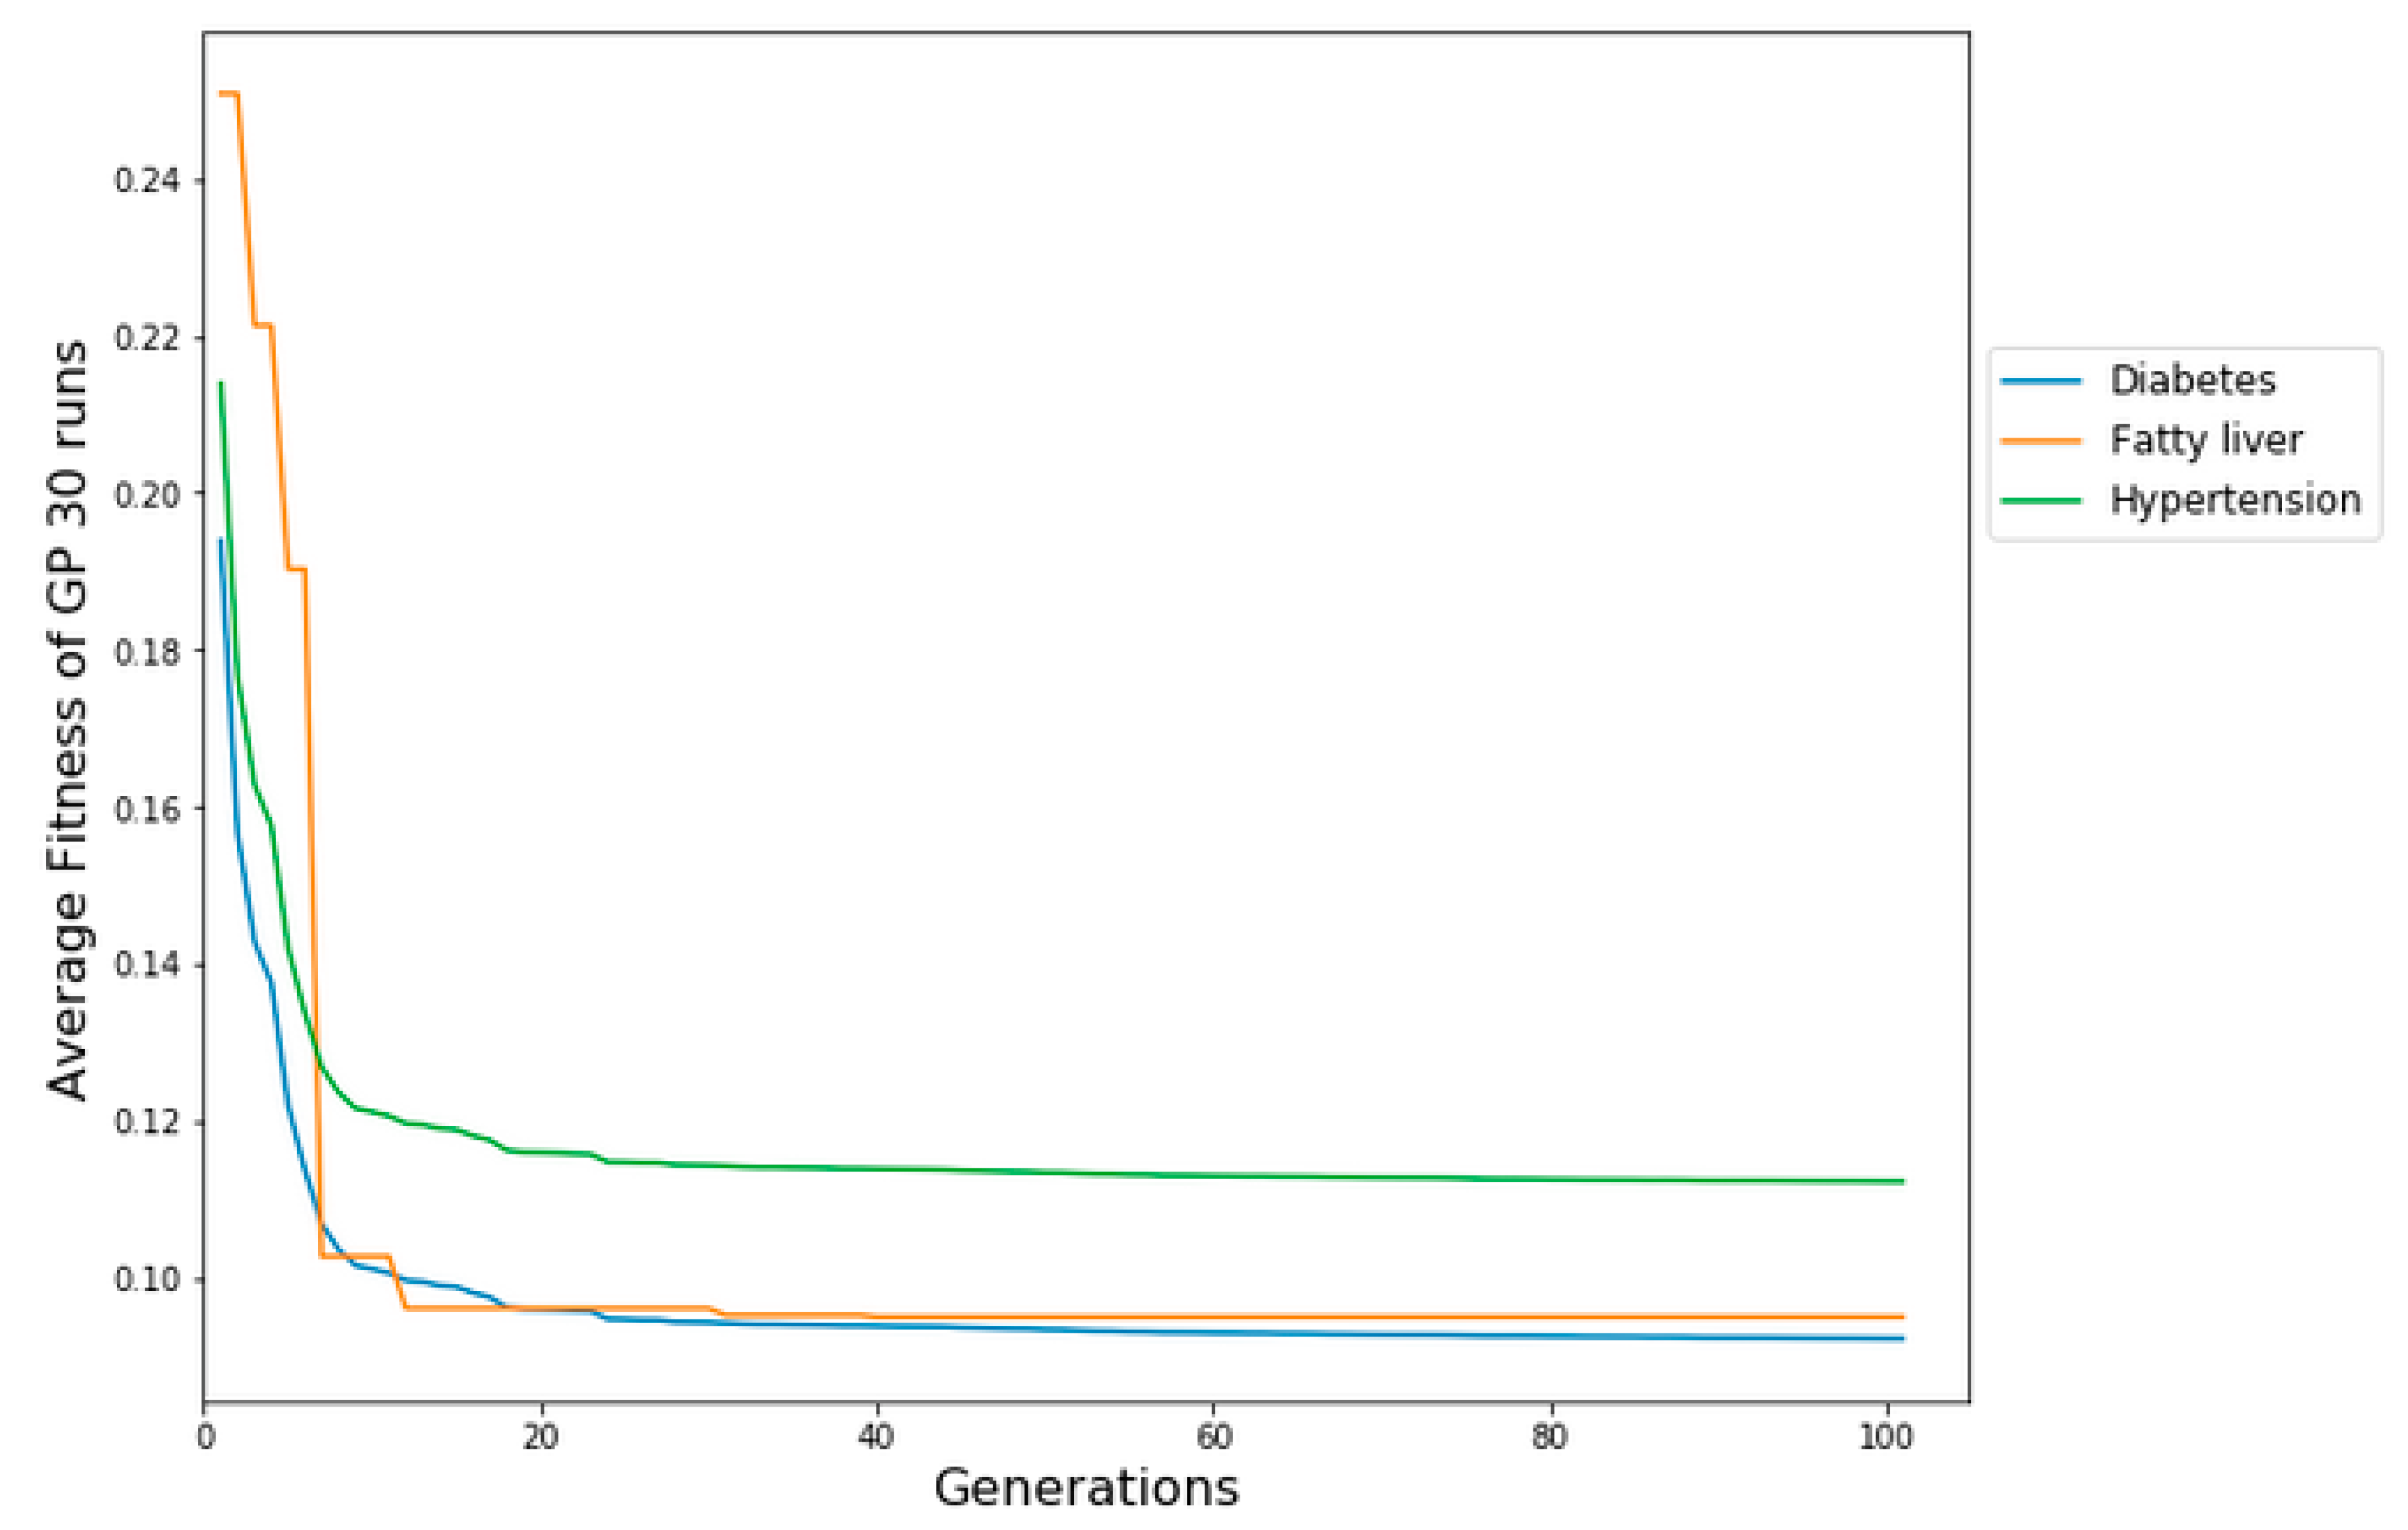
By employing MSE on the chosen cost matrix, the average fitness of the optimal solution for each generation is determined, utilizing results accumulated from 30 runs of GP. Fig.4 shows the median MSE on the three chronic disease datasets (diabetes, fatty liver, and hypertension) at each generation over the 30 runs. The median fitness refers to the average of the fitness scores across the entire population. The evolution of the error in average fitness reveals the ability of CSGP to learn the relationship between variables. There is a constant decrease in the test error across generations, indicating that no overfitting is occurring. It is also observed that CSGP produced lower error rates on diabetes and relatively higher error rates on fatty liver data. The final model produced by GP includes the best features selected during the evolutionary process. These variables are the most frequent variables that were the most relevant for the prediction of chronic diseases. The final simplified prediction model generated by CSGP is a binary parse tree representing the classification model. CSGP has the ability to construct decision trees with the goal of reducing not just the anticipated count of errors but also the expected costs associated with misclassification, achieved through the implementation of fitness functions.
Figure 4.
CSGP evolution plots on diabetes, fatty liver, and hypertension datasets using MSE.
6. Conclusions
This paper is an investigation of evolutionary machine learning (EML) to solve chronic disease prediction problems as an optimized classification problem using GP and GA. In CSGP, various penalty costs were used for prediction errors ranging from 3 to 11 with a step of 2, and each is represented as a penalty cost matrix. After configuring the different cost matrixes for the CSGP algorithm on three different chronic disease datasets, several experiments with 30 runs were conducted by adjusting the parameters. The results of CSGP were compared with CSGA, where each model was evaluated with the well-known fitness functions, including accuracy, sensitivity, specificity, precision, and mean squared error. The results showed that the CSGP achieved comparable performance with CSGA in terms of accuracy and F1-score on diabetes, while CSGA outperformed CSGP on hypertension datasets. The performance of the model obtained by both CSGP and CSGA demonstrated superior performance in distinguishing positive cases from negative cases of chronic diseases. From the results, it is evident that EML models demonstrated substantial potential as a means for the automated creation of clinical prediction models, serving diagnostic and prognostic purposes. Overall, the results are encouraging, and further studies can be investigated to extend the findings on other medical problems using cost-sensitive evolutionary algorithms.
References
- A. Tarekegn, F. Ricceri, G. Costa, E. Ferracin, M. Giacobini, Predictive modeling for frailty conditions in Elderly People: Machine learning approaches, JMIR Med. Informatics. (2020). [CrossRef]
- A. Tarekegn, F. Ricceri, G. Costa, E. Ferracin, M. Giacobini, Detection of Frailty Using Genetic Programming: The Case of Older People in Piedmont, Italy, in: Lect. Notes Comput. Sci. (Including Subser. Lect. Notes Artif. Intell. Lect. Notes Bioinformatics), 2020. [CrossRef]
- F.E. Harrell, Multivariable Modeling Strategies, in: 2015. [CrossRef]
- A.N. Tarekegn, M. Ullah, F.A. Cheikh, M. Sajjad, Enhancing Human Activity Recognition Through Sensor Fusion And Hybrid Deep Learning Model, in: 2023 IEEE Int. Conf. Acoust. Speech, Signal Process. Work., IEEE, 2023: pp. 1–5. [CrossRef]
- M.E. Shipe, S.A. Deppen, F. Farjah, E.L. Grogan, Developing prediction models for clinical use using logistic regression: An overview, J. Thorac. Dis. (2019). [CrossRef]
- A.N. Tarekegn, Localized Knowledge based System for Human Disease Diagnosis, Int. J. Inf. Technol. Comput. Sci. (2016). [CrossRef]
- A. Nega, A. Kumlachew, Data Mining Based Hybrid Intelligent System for Medical Application, Int. J. Inf. Eng. Electron. Bus. (2017). [CrossRef]
- A. Nega, Localized hybrid reasoning system for TB disease diagnosis, in: IEEE AFRICON Conf., 2015. [CrossRef]
- C. Hajat, E. Stein, The global burden of multiple chronic conditions: A narrative review, Prev. Med. Reports. (2018). [CrossRef]
- T.H.H. Aldhyani, A.S. Alshebami, M.Y. Alzahrani, Soft Clustering for Enhancing the Diagnosis of Chronic Diseases over Machine Learning Algorithms, J. Healthc. Eng. (2020). [CrossRef]
- H. Al-Sahaf, Y. Bi, Q. Chen, A. Lensen, Y. Mei, Y. Sun, B. Tran, B. Xue, M. Zhang, A survey on evolutionary machine learning, J. R. Soc. New Zeal. (2019). [CrossRef]
- A.N. Tarekegn, T.A. Alemu, A.K. Tegegne, A cluster-genetic programming approach for detecting pulmonary tuberculosis, Ethiop. J. Sci. Technol. (2021). [CrossRef]
- A. Nega Tarekegn, F. Alaya Cheikh, M. Sajjad, M. Ullah, Towards Detecting Freezing of Gait Events Using Wearable Sensors and Genetic Programming, in: 2023: pp. 274–285. [CrossRef]
- A.N. Tarekegn, M. Giacobini, K. Michalak, A review of methods for imbalanced multi-label classification, Pattern Recognit. 118 (2021) 107965. [CrossRef]
- M. Galar, A. Fernandez, E. Barrenechea, H. Bustince, F. Herrera, A Review on Ensembles for the Class Imbalance Problem: Bagging-, Boosting-, and Hybrid-Based Approaches, IEEE Trans. Syst. Man, Cybern. Part C (Applications Rev. 42 (2012) 463–484. [CrossRef]
- J. Burez, D. Van den Poel, Handling class imbalance in customer churn prediction, Expert Syst. Appl. 36 (2009) 4626–4636. [CrossRef]
- A.N. Tarekegn, K. Michalak, M. Giacobini, Cross-Validation Approach to Evaluate Clustering Algorithms: An Experimental Study Using Multi-Label Datasets, SN Comput. Sci. 1 (2020) 1–9. [CrossRef]
- A. Maxwell, R. Li, B. Yang, H. Weng, A. Ou, H. Hong, Z. Zhou, P. Gong, C. Zhang, Deep learning architectures for multi-label classification of intelligent health risk prediction, BMC Bioinformatics. (2017). [CrossRef]
- A. Telikani, A. Tahmassebi, W. Banzhaf, A.H. Gandomi, Evolutionary Machine Learning: A Survey, ACM Comput. Surv. (2022). [CrossRef]
- S. Katoch, S.S. Chauhan, V. Kumar, A review on genetic algorithm: past, present, and future, Multimed. Tools Appl. (2021). [CrossRef]
- A. Lissovoi, P.S. Oliveto, On the Time and Space Complexity of Genetic Programming for Evolving Boolean Conjunctions, J. Artif. Intell. Res. 66 (2019) 655–689. [CrossRef]
- U.-M. O’Reilly, Genetic programming, in: Proc. Fourteenth Int. Conf. Genet. Evol. Comput. Conf. Companion - GECCO Companion ’12, ACM Press, New York, New York, USA, 2012: p. 693. [CrossRef]
- S. Nguyen, M. Zhang, M. Johnston, K.C. Tan, Genetic Programming for Job Shop Scheduling, in: Stud. Comput. Intell., 2019: pp. 143–167. [CrossRef]
- N. Thai-Nghe, Z. Gantner, L. Schmidt-Thieme, Cost-sensitive learning methods for imbalanced data, in: Proc. Int. Jt. Conf. Neural Networks, 2010. [CrossRef]
- P. Yildirim, Chronic Kidney Disease Prediction on Imbalanced Data by Multilayer Perceptron: Chronic Kidney Disease Prediction, in: Proc. - Int. Comput. Softw. Appl. Conf., 2017. [CrossRef]
- G. Liu, Y. Yang, B. Li, Fuzzy rule-based oversampling technique for imbalanced and incomplete data learning, Knowledge-Based Syst. (2018). [CrossRef]
- A.N. Tarekegn, M. Sajjad, F.A. Cheikh, M. Ullah, K. Muhammad, Efficient Human Gait Activity Recognition Based on Sensor Fusion and Intelligent Stacking Framework, IEEE Sens. J. 23 (2023) 28355–28369. [CrossRef]
- N. Al-Madi, H. Faris, R. Abukhurma, Cost-sensitive genetic programming for churn prediction and identification of the influencing factors in telecommunication market, Int. J. Adv. Sci. Technol. (2018).
- I.H. Witten, E. Frank, M.A. Hall, C.J. Pal, Data Mining: Practical Machine Learning Tools and Techniques, Elsevier, 2011. [CrossRef]
- J. Han, M. Kamber, J. Pei, Data Mining: Concepts and Techniques, 2012. [CrossRef]

Table 1.
Cost Matrix.
| Predicted class | |||
| Disease | No disease | ||
| Actual class | Disease | ||
| No disease | |||
Table 2.
GP and GA control parameter settings.
| Parameter | Values for GP | Values for GA |
|---|---|---|
| Population size | 1000 | 500 |
| Maximum number of generations | 100 | 100 |
| Crossover probability | 0.90 | 0.8 |
| Mutation probability | 0.15 | 0.05 |
| Selection method | Tournament selection | Ranking Selection |
| Termination Condition | Max generation | Max generation |
| Initialization | Ramped half and half | Random initialization |
| Genetic operators | Crossover, Mutation | Crossover, Mutation |
| Elite number | 1 | 2 |
Table 4.
Performance of CSGP and CSGA using various metrics on three datasets.
| EML Model | Datasets | Accuracy | precision | sensitivity | specificity | F1-score |
| CSGP | Diabetes | 0.93 | 0.76 | 0.90 | 0.88 | 0.94 |
| Hypertension | 0.75 | 0.80 | 0.78 | 0.74 | 0.76 | |
| Fatty liver | 0.89 | 0.93 | 0.92 | 0.76 | 0.92 | |
| CSGA | Diabetes | 0.93 | 0.94 | 0.93 | - | 0.93 |
| Hypertension | 0.88 | 0.88 | 0.88 | - | 0.88 | |
| Fatty liver | 0.92 | 0.92 | 0.92 | - | 0.92 |
Disclaimer/Publisher’s Note: The statements, opinions and data contained in all publications are solely those of the individual author(s) and contributor(s) and not of MDPI and/or the editor(s). MDPI and/or the editor(s) disclaim responsibility for any injury to people or property resulting from any ideas, methods, instructions or products referred to in the content. |
© 2024 by the authors. Licensee MDPI, Basel, Switzerland. This article is an open access article distributed under the terms and conditions of the Creative Commons Attribution (CC BY) license (http://creativecommons.org/licenses/by/4.0/).
Copyright: This open access article is published under a Creative Commons CC BY 4.0 license, which permit the free download, distribution, and reuse, provided that the author and preprint are cited in any reuse.


