
Submitted:
08 January 2024
Posted:
10 January 2024
You are already at the latest version
Preprints on COVID-19 and SARS-CoV-2
Abstract
On February 24, 2022 Russia started the full-scale invasion of Ukraine, which created an unprecedented number of refugees. To estimate the influence of this humanitarian disaster on the COVID-19 pandemic dynamics, the averaged daily numbers of cases and reproduction numbers in Ukraine, the UK, Poland, Germany, the Republic of Moldova, and in the whole world were calculated for the period February-April 2022. The registered numbers of cases were compared with ones calculated with the use of the generalized SIR-model and corresponding parameter identification procedure for the previous epidemic waves in Ukraine, Poland, Germany, and the world. Since before February 24, 2022 the estimation of the number of infectious persons per capita in Ukraine 3.6 times exceeded the global figure, the increase of the number the new cases and the pandemic duration was expected. In March 2022 the increase of the averaged number of new cases in the UK, Germany, and worldwide was visible. A simple formula to estimate the effective reproduction number based on the smoothed accumulated numbers of cases is proposed. The results of calculations agree with the figures presented by John Hopkins University and demonstrate a short-term growth of the reproduction number in the UK, Poland, Germany, Moldova, and worldwide in March 2022.
Keywords:
COVID-19 pandemic
; epidemic waves
; epidemic dynamics in Ukraine
; Poland
; Germany
; Moldova
; the UK
; global pandemic dynamic
; mathematical modeling of infection diseases
; SIR model
; parameter identification
; reproduction number
; statistical methods
1. Introduction
Russia's full-scale criminal war in Ukraine has caused a real humanitarian catastrophe, the scale of which deserves appropriate assessment and punishment. As of March 23, 2022, more than 3.5 million Ukrainians have been forced to flee their homes and seek refuge abroad [1]. Such mass migration can lead to a significant increase in the numbers of COVID-19 cases [2,3] and in the reproduction rates.
In this paper we will try to reveal these trends by comparing the averaged numbers of new cases in the UK, Poland, Germany, the Republic of Moldova, and the world registered after February 24, 2022. In addition, simple formulae for the reproduction number will be proposed and used for calculations and comparisons with the values available in [4]. The relationships predicted for the previous epidemic waves with the use of a generalized SIR-model and a corresponding parameter identification procedure [5,6] will be applied to identify the changes in the pandemic dynamics after February 24, 2022. In particular, results of SIR simulations for the 14th epidemic wave in Ukraine [7], 7th global pandemic wave [7], 4th wave in Poland [8] and 5th wave in Germany [8] will be used for comparison.
2. Data, Smoothing Procedure, and Generalized SIR Model
We will use the data set regarding the accumulated numbers of laboratory-confirmed COVID-19 cases Vj in Ukraine, the UK, Poland, Germany, the Republic of Moldova and the whole world from the COVID-19 Data Repository by the Center for Systems Science and Engineering (CSSE) at Johns Hopkins University (JHU), [4] (see Table 1, Table 2, Table 3, Table 4, Table 5 and Table 6, where the figures corresponding to the version available on April 13, 2022 are listed). It must be noted the JHU figures for Ukraine [4] are approximately 3% higher than the values reported by Ukrainian national sources [9,10]. Due to the war, the figures for Ukraine have not been updated long time after February 24, 2022 (see Table 1). The corresponding moments of time tj (measured in days) are shown in Table 1, Table 2, Table 3 and Table 4 for the period of November 2021 to April 2022.
The JHU periodically update its data sets for the previous moments of time [4]. Here we will use the version of JHU file, corresponding to April 13, 2022 (for numbers of COVID-19 cases accumulated in the UK correspond to the version available on July 13, 2022). It must be noted that the data sets presented in Table 2 and Table 4, which are slightly different from the previous versions used in [8]. The reproduction numbers will be shown according to the JHU datasets available on September 9, 2022.
The generalized SIR-model relates the numbers of susceptible S(t), infectious I(t) and removed persons R(t) versus time t for a particular epidemic wave i, [5,6]. The exact solution of the set of non-linear differential equations uses the function , corresponding to the number of victims or the cumulative laboratory-confirmed number of cases [5,6]. Its derivative dV/dt yields the estimation of the average daily number of new cases. The exact solution presented in [5,6] depends on parameters listed in Table 7. One of them can be treated as the average time of spreading infection during i-th epidemic wave:
3. Effective Reproduction Number
The effective reproduction number Rt(t) shows the average number of people infected by one person, [11,12,13,14,15,16,17]. Due to the mass migration after February 24, 2022, the increase in the Rt values can be expected. For the COVID-19 pandemic, Robert Koch Institut (RKI) recommends using the generation time of 4 days and to calculate the reproduction number as “the ratio of new infections in two consecutive time periods each consisting of 4 days”, [13]. In terms of the accumulated numbers of cases Vj , the RKI formula can be written as follows:
The mean UK household generation time was estimated as 3.2 days for the Delta variant and 4.5 days for than the Alpha variant [18]. The values (see eq. 1) calculated in [5,6,7,8] for different waves of the COVID-19 pandemic can be also used to estimate the reproduction rates in different countries. In particular, during the first epidemic wave in UK, the value was estimated as 3.03, [5]. The information about serial intervals (the periods between symptom onset moments of time in infector–infectee pairs, [18,19]) can be also useful for estimations of the reproduction numbers. Thus, formula (4) can be generalized as follows:
where, corresponds to the values from formula (1), generation time or serial intervals, calculated in [18,19]. To minimize the influence of random daily numbers of cases, the smoothed values (according to formula (2)) are recommended. Smoothed values and can be calculated using a linear (or other) interpolation of numbers.
The generalized SIR model and corresponding identification procedures of its parameters identification allow estimating the reproduction numbers with the use of the formula, [20]:
where i corresponds to the number of the epidemic wave. Optimal values of parameters Ni and for different waves of the COVID-19 pandemic in Ukraine, Poland, Germany and the world are listed in Table 7. For successful SIR simulations, it is enough to have information about the accumulated numbers of cases during 14 days [5,6,7,8,20]. Thus, the reproduction number can be calculated with the use of this number of observations. Calculations with the use of formula (5) need approximately the same volume of information.
The Kalman filter was used in [15] to reduce random pulsations in the daily numbers of cases. Corresponding reproduction rates are calculated and listed by JHU [4] for almost every country and region. For the summer COVID-19 epidemic wave in Japan, a good agreement between the method proposed in [15] and calculations with the use of eq. (6) was demonstrated in [20]. In this study we will compare the corresponding Rt(t) values (version of JHU file available on September 9, 2022) for Ukraine, the UK, Poland, Germany, Moldova, and the whole world with the results of calculations based on formulae (4)-(6).
4. Results and Discussion
The optimal values of parameters of the generalized SIR model and other characteristics of the 14th pandemic wave in Ukraine [7], the 4th wave in Poland [8], the 5th wave in Germany [8] and the 7th wave in the whole world [7] are listed in Table 7. Corresponding SIR curves are shown in Figure 1 and Figure 2. The laboratory confirmed accumulated numbers of COVID-19 cases Vj (Table 1, Table 2, Table 3, Table 4, Table 5 and Table 6) are shown by “stars” and “circles” (data used for SIR simulations). “Crosses” represent the averaged daily numbers of new COVID-19 cases calculated with the use of the Vj values and eq. (3).

Table 5.
Cumulative numbers of laboratory-confirmed Covid-19 cases in the Republic of Moldova for the period of November 1, 2021 to April 12, 2022 according to JHU report on April 13, 2022, [4].
Table 5.
Cumulative numbers of laboratory-confirmed Covid-19 cases in the Republic of Moldova for the period of November 1, 2021 to April 12, 2022 according to JHU report on April 13, 2022, [4].
| Day in corres-ponding month of 2021 and 2022 | Number of cases in November 2021, Vj |
Number of cases in December 2021, Vj |
Number of cases in January 2022, Vj |
Number of cases in February 2022, Vj |
Number of cases in March 2022, Vj |
Number of cases in April 2022, Vj |
|---|---|---|---|---|---|---|
| 1 | 339114 | 364433 | 376434 | 445046 | 502386 | 513757 |
| 2 | 340188 | 365165 | 376602 | 449840 | 502956 | 514014 |
| 3 | 341675 | 365713 | 376844 | 455095 | 503690 | 514199 |
| 4 | 343261 | 366162 | 377496 | 460307 | 504307 | 514222 |
| 5 | 344563 | 366256 | 378202 | 464234 | 504875 | 514428 |
| 6 | 345517 | 366751 | 378904 | 467271 | 505393 | 514650 |
| 7 | 345964 | 367339 | 379572 | 468782 | 505644 | 514882 |
| 8 | 347105 | 367948 | 379901 | 471524 | 505996 | 515121 |
| 9 | 348588 | 368497 | 380290 | 474548 | 506222 | 515312 |
| 10 | 349568 | 369013 | 380985 | 477419 | 506681 | 515445 |
| 11 | 350697 | 369402 | 382124 | 480289 | 507028 | 515488 |
| 12 | 351940 | 369659 | 383544 | 482842 | 507599 | 515649 |
| 13 | 352670 | 370003 | 385047 | 484516 | 507994 | |
| 14 | 352822 | 370459 | 386905 | 485563 | 508235 | |
| 15 | 353778 | 370951 | 387920 | 487283 | 508578 | |
| 16 | 354755 | 371410 | 388959 | 488899 | 508917 | |
| 17 | 355646 | 371850 | 390742 | 490751 | 509367 | |
| 18 | 356448 | 372154 | 393423 | 492604 | 509834 | |
| 19 | 357211 | 372200 | 396678 | 494219 | 510206 | |
| 20 | 357831 | 372429 | 400585 | 495184 | 510460 | |
| 21 | 358202 | 372983 | 404556 | 495415 | 510700 | |
| 22 | 358857 | 373373 | 407003 | 496976 | 510973 | |
| 23 | 359401 | 373752 | 409397 | 497946 | 511231 | |
| 24 | 360261 | 374120 | 412231 | 499015 | 511662 | |
| 25 | 361116 | 374349 | 417369 | 500144 | 512047 | |
| 26 | 361828 | 374526 | 423568 | 500812 | 512386 | |
| 27 | 362326 | 374763 | 428934 | 501312 | 512602 | |
| 28 | 362433 | 375065 | 434549 | 501800 | 512638 | |
| 29 | 363110 | 375358 | 438249 | - | 512942 | |
| 30 | 363774 | 375780 | 438249 | - | 513146 | |
| 31 | - | 376155 | 440698 | - | 513442 |
Table 6.
Cumulative numbers of laboratory-confirmed Covid-19 cases in the UK for the period of November 1, 2021 to April 30, 2022 according to JHU report on December 11, 2023, [4].
Table 6.
Cumulative numbers of laboratory-confirmed Covid-19 cases in the UK for the period of November 1, 2021 to April 30, 2022 according to JHU report on December 11, 2023, [4].
| Day in corres-ponding month of 2021 and 2022 | Number of cases in November 2021, Vj |
Number of cases in December 2021, Vj |
Number of cases in January 2022, Vj |
Number of cases in February 2022, Vj |
Number of cases in March 2022, Vj |
Number of cases in April 2022, Vj |
|---|---|---|---|---|---|---|
| 1 | 9266373 | 10476077 | 13678283 | 17515752 | 18987410 | 21209728 |
| 2 | 9301187 | 10531772 | 13866850 | 17620803 | 19032059 | 21264519 |
| 3 | 9346296 | 10586592 | 13985125 | 17714752 | 19076854 | 21311981 |
| 4 | 9384315 | 10636911 | 14166193 | 17803170 | 19123033 | 21349573 |
| 5 | 9420301 | 10682578 | 14396094 | 17879814 | 19166794 | 21391752 |
| 6 | 9453963 | 10721362 | 14671741 | 17943078 | 19208202 | 21445479 |
| 7 | 9484281 | 10762413 | 14893915 | 17995383 | 19246961 | 21494580 |
| 8 | 9511717 | 10822107 | 15066895 | 18055935 | 19295987 | 21539330 |
| 9 | 9542303 | 10878365 | 15187182 | 18132418 | 19364507 | 21578039 |
| 10 | 9586429 | 10937192 | 15280797 | 18202079 | 19434619 | 21611027 |
| 11 | 9628675 | 10994187 | 15376587 | 18266418 | 19508150 | 21638912 |
| 12 | 9671617 | 11046679 | 15509546 | 18318711 | 19578660 | 21669864 |
| 13 | 9712616 | 11095273 | 15624791 | 18363270 | 19645690 | 21707235 |
| 14 | 9750379 | 11148431 | 15728010 | 18400799 | 19707768 | 21741006 |
| 15 | 9783264 | 11235600 | 15824422 | 18442554 | 19783507 | 21772691 |
| 16 | 9818796 | 11338388 | 15910747 | 18497299 | 19883341 | 21799330 |
| 17 | 9869744 | 11451091 | 15988697 | 18549801 | 19977049 | 21820947 |
| 18 | 9916174 | 11557146 | 16086794 | 18601373 | 20068800 | 21840872 |
| 19 | 9962069 | 11653043 | 16218308 | 18646089 | 20151653 | 21861016 |
| 20 | 10006131 | 11741926 | 16337165 | 18679330 | 20226938 | 21886239 |
| 21 | 10045737 | 11831059 | 16448925 | 18713977 | 20294355 | 21912011 |
| 22 | 10081072 | 11965025 | 16549249 | 18751697 | 20375409 | 21933468 |
| 23 | 10118322 | 12115318 | 16640979 | 18796829 | 20484695 | 21951932 |
| 24 | 10169055 | 12276878 | 16722712 | 18836017 | 20583790 | 21967635 |
| 25 | 10217252 | 12437511 | 16825077 | 18872493 | 20677975 | 21980845 |
| 26 | 10264024 | 12574779 | 16952441 | 18903124 | 20760880 | 21995560 |
| 27 | 10307449 | 12645142 | 17065643 | 18930961 | 20833310 | 22012669 |
| 28 | 10346779 | 12761429 | 17174311 | 18956050 | 20894766 | 22027229 |
| 29 | 10380082 | 12956440 | 17270512 | - | 20963102 | 22040284 |
| 30 | 10419788 | 13168909 | 17354538 | - | 21055959 | 22051892 |
| 31 | - | 13441707 | 17428050 | - | 21136085 | - |
Table 7.
Optimal values of parameters and other characteristics of the COVID-19 pandemic waves in Ukraine, Poland, Germany, and the world .
Table 7.
Optimal values of parameters and other characteristics of the COVID-19 pandemic waves in Ukraine, Poland, Germany, and the world .
| Characteristics | 14th epidemic wave in Ukraine, i=14, [7] |
4th epidemic wave in Poland, i=4, [8] |
5th epidemic wave in Germany, i=5, [8] |
7th epidemic wave in the whole world, i=7, [7] |
|---|---|---|---|---|
| Time period taken for calculations, Tci | January 22 – February 4, 2022 |
November 22 – December 5, 2021 |
November 22 – December 5, 2021 |
January 22 – February 4, 2022 |
| Ii | 64,676.7037685832 | 182,880.050730977 | 175,036.042911984 | 11,190,879.9375884 |
| Ri | 3,956,648.86765999 | 3,181,514.23498331 | 5,301,466.81423087 | 337,916,505.348126 |
| Ni | 5,678,291.86675200 | 5,410,976 | 10,300,000 | 815,388,678.72 |
| 1,064,719.47680477 | 1,574,583.94143908 | 4,370,737.14176735 | 453,226,448.070179 | |
| 1.7392861614679e-7 |
5.96394337877141e-08 | 6.8098348012594e-08 | 6.51375439773073e-10 | |
| 0.185185185185185 | 0.0939072947186539 | 0.297639978951643 | 0.295220576928501 | |
| 5.4 | 10.6488 | 3.35976371024561 | 3.38729776360470 | |
| ri | 0.998361163644707 | 0.998395644300319 | 0.996581480894305 | 0.999439451877399 |
| 552,746 | 854,850 | 3,186,419 | 359,119,917 | |
| 5,125,546 | 4,556,126 | 7,113,581 | 456,268,762 | |
| Final day of the epidemic wave | December 2023 | September 2025 | April 2023 | April 2085 ? |
Figure 1.
The omicron waves and further pandemic dynamics in Ukraine and in the whole world.
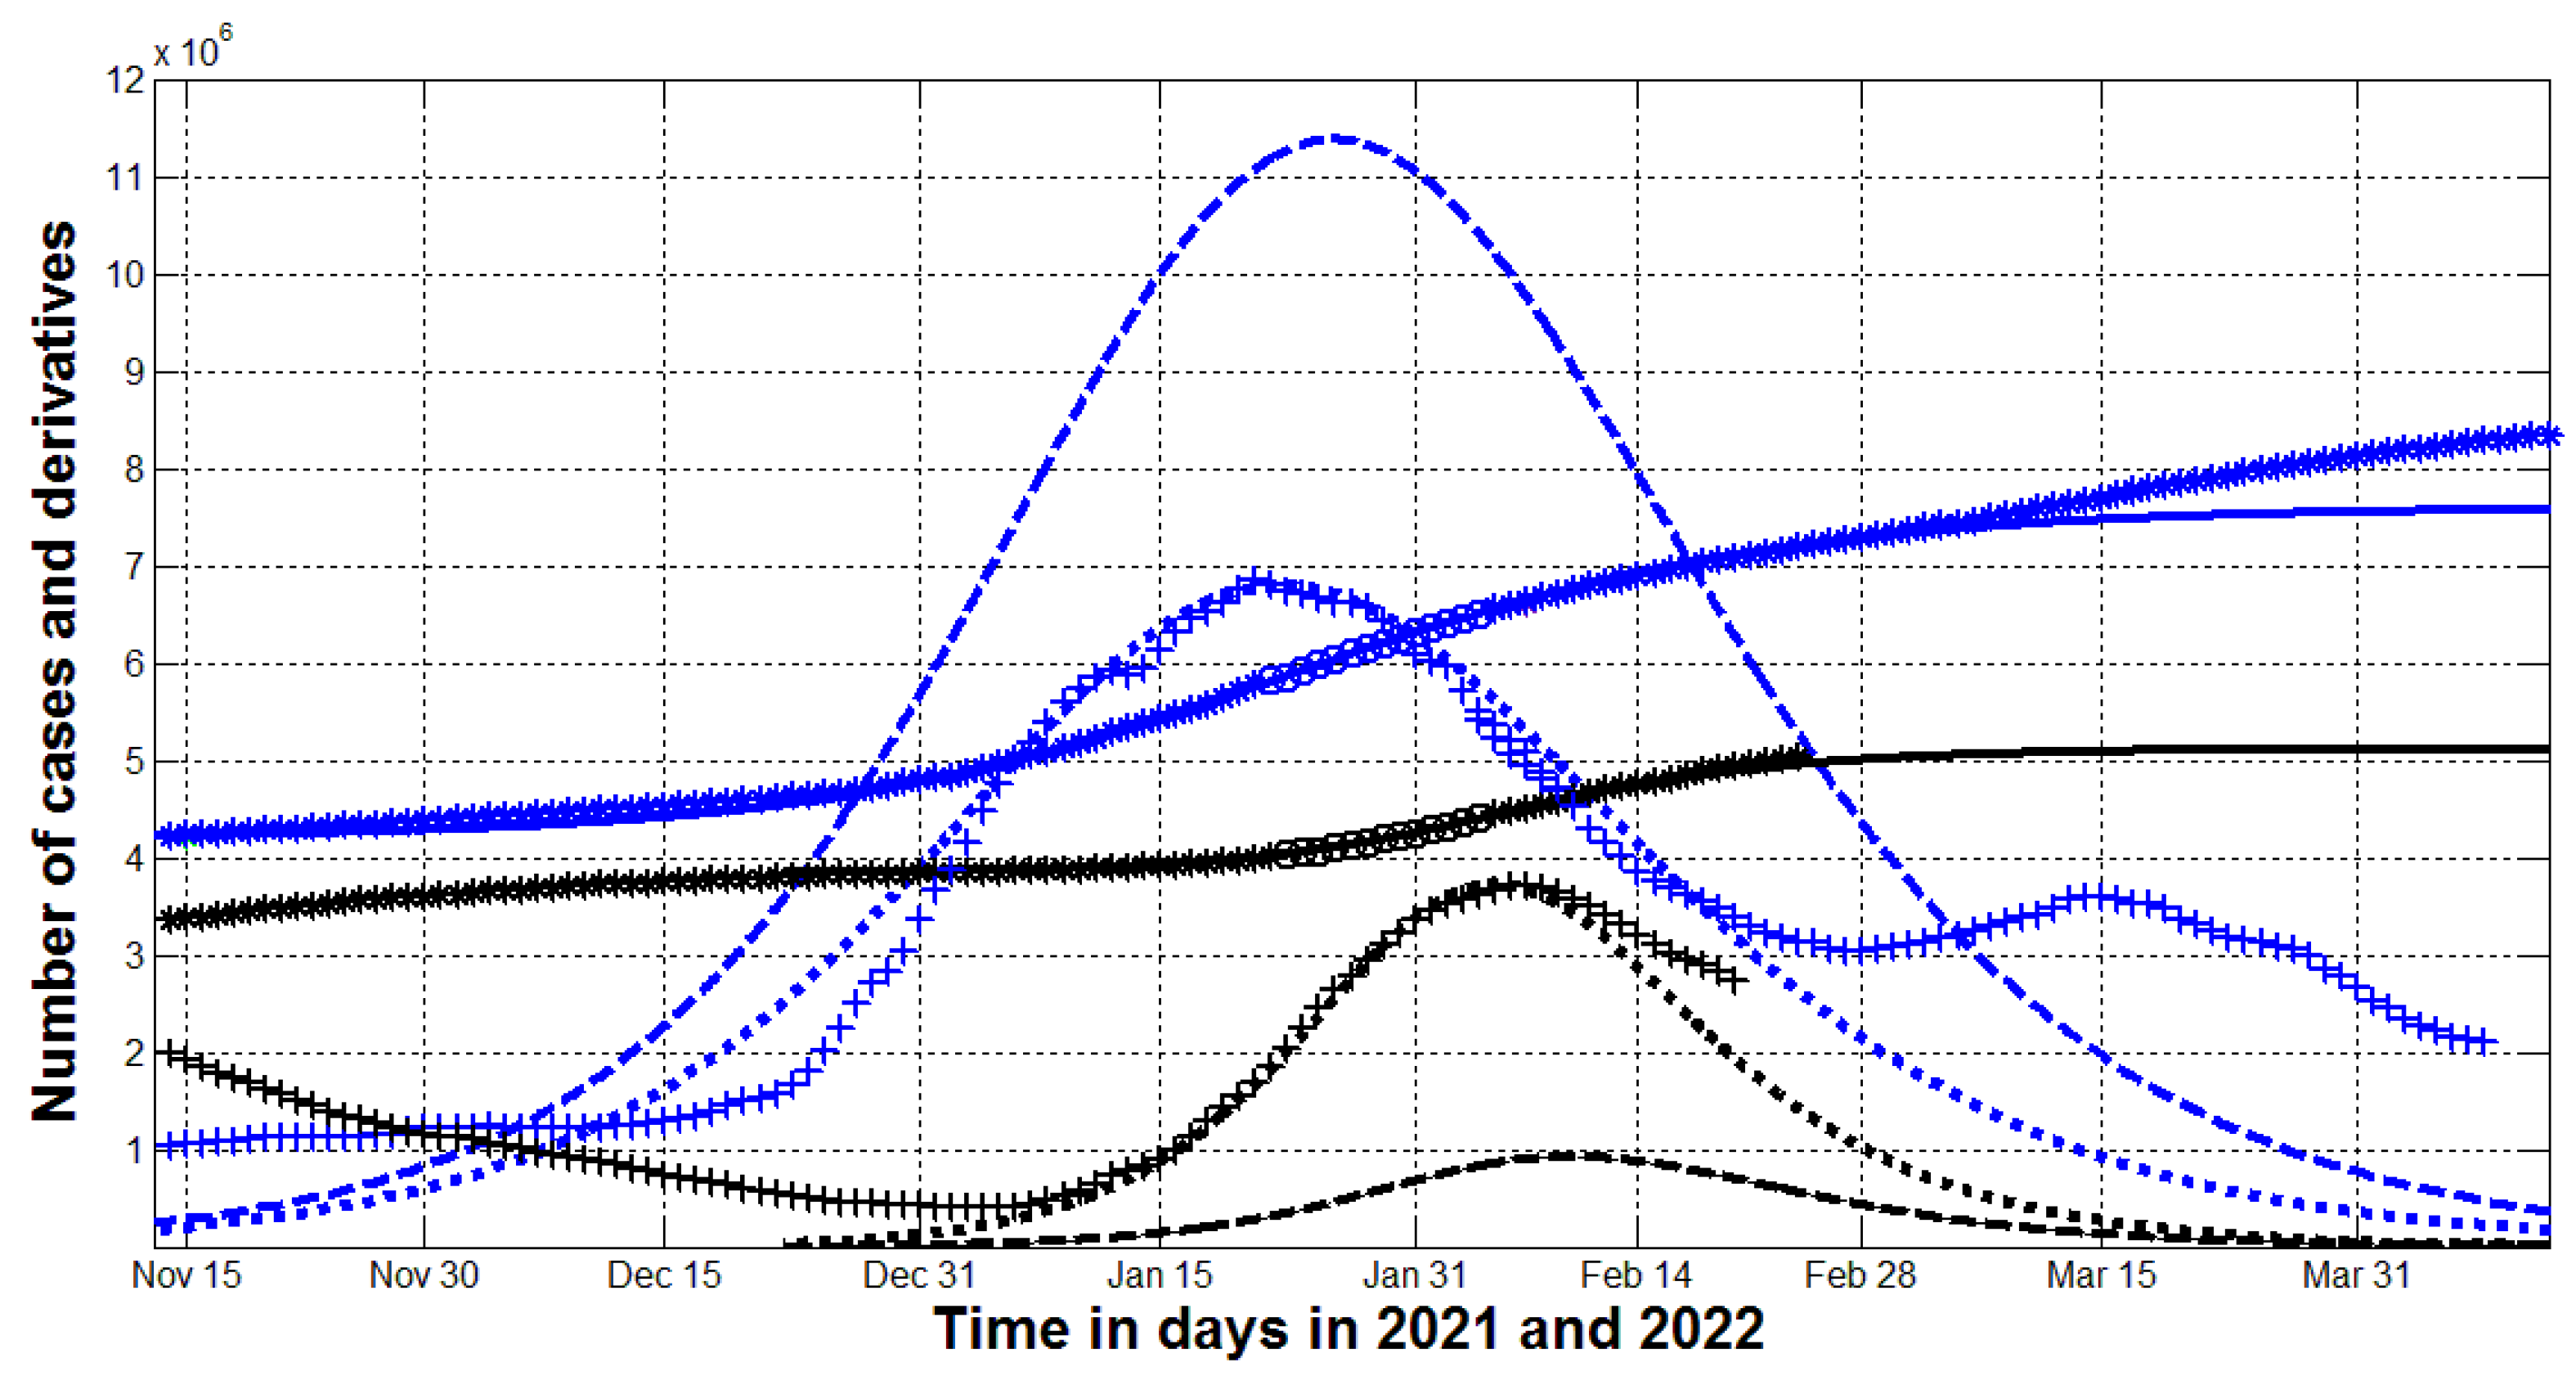
Figure 2.
The COVID-19 pandemic waves in Poland (red) and Germany (black) in 2021 and 2022.
The results of SIR simulations of the 14th wave in Ukraine are shown by black lines. Blue lines represent the 7th pandemic wave in the world. Numbers of victims V(t)=I(t)+R(t) – solid lines (for the world divided by 60); numbers of infected and spreading I(t) (multiplied by 5 for Ukraine) – dashed; derivatives dV/dt, multiplied by 100 for Ukraine and by 2 for the world) – dotted. “Circles” correspond to the accumulated numbers of cases registered during the periods taken for SIR simulations (for the world divided by 60). “Stars” corresponds to Vj values beyond these time periods (for the world divided by 60). “Crosses” show the numerical first derivative multiplied by 100 for Ukraine and by 2 for the world. Black markers correspond to Ukraine ([7], Table 1), blue - for the world ([7], Table 2).
“Stars” and “crosses” in Figure 1 illustrate that before the full-scale invasion, which started on February 24, 2022, the accumulated number of cases (“stars”) and the averaged daily numbers of new cases (“crosses”) followed the corresponding theoretical solid and dotted lines. In March 2022, the real global dynamics started to deviate form the theoretical blue solid and dotted curves. In particular, the saturation level of the 7th pandemic wave =456,268,762 (see the last column of Table 7) was exceeded. The increase in the global daily numbers of new cases (see blue “crosses”) in March 2022 can be explained by the mass migration from Ukraine. As of March 23, 2022, more than 3.5 million Ukrainians were forced to flee abroad [1].
To estimate the possible impact of this humanitarian disaster, let us calculate the probability of meeting an infectious person in Ukraine with the use of simple formula, [5,20]:
where Npop is the volume of population. As of February 24, 2022 the numbers of people spreading the infection I(t) were around 100,000 in Ukraine and 5 million in the whole world (see dashed lines in Figure 1). Since before the war, the population of Ukraine was 178 times less than the global figure, the probability of meeting an infected person in Ukraine was 3.6 times higher (according to eq. (7)). It means that forced mass emigration of Ukrainians could cause an increase in the number of new cases in the world. Blue “crosses” in Figure 1 illustrate this fact. It is worth noting that after March 15, 2022 the growth stopped, which can be explained by a decrease in the flow of refugees.
Let us consider the situation in the Poland, which has accepted more than 2 million Ukrainian refugees [1]. In March 2022, the decline in the number of new cases slowed down (see red “crosses” in Figure 2). The number of new cases in Poland stopped to decrease in March 20221. This fact demonstrates the influence of the mass migration from Ukraine. The relatively small impact on the Polish epidemic dynamics can be explained by the approximately same probability of meeting an infectious Polish and Ukrainian person.
The results of SIR simulations of the 4th wave in Poland and the 5th wave in Germany are shown by red and black lines, respectively, [8]. Numbers of victims V(t)=I(t)+R(t) – solid lines; numbers of infected and spreading I(t) multiplied by 10 – dashed; derivatives dV/dt (multiplied by 100) – dotted. “Circles” correspond to the accumulated numbers of cases registered during the period taken for SIR simulations. “Stars” correspond to Vj values beyond this time period. “Crosses” show the averaged daily number of new cases calculated with the use of eq. (3) and datasets presented in Table 3, Table 4 (multiplied by 100).
Unfortunately, we have results of SIR simulations only for the 4th wave in Poland (shown by red lines in Figure 2, [8]). In January 2022, a new Omicron wave started in this country and the daily numbers of new cases (red “crosses” in Figure2) became much higher than the theoretical estimation for the previous wave (the red dotted line). The maximum values of I(t) were approximately 200,000 both for Ukraine and Poland (see the black dashed line in Figure1 and the red dashed line in Figure2). Since the populations of these countries are also close, we can expect the close values for the probabilities of meeting of an infectious person (according to eq. (7)). Thus, the huge number of Ukrainian refuges did not significantly change the epidemic dynamics in Poland.
In early 2022, when a new powerful epidemic wave began in Germany, the number of infected in this country was about 4 times less than in Poland (compare black and red dashed lines in Figure 2). Taking into account the difference in population size, one can expect about eight times less chance of meeting an infectious person in Germany. Therefore, refugees from Ukraine could significantly increase the number of new cases in Germany in March 2022. Black “crosses” in Figure 2 illustrate this fact.
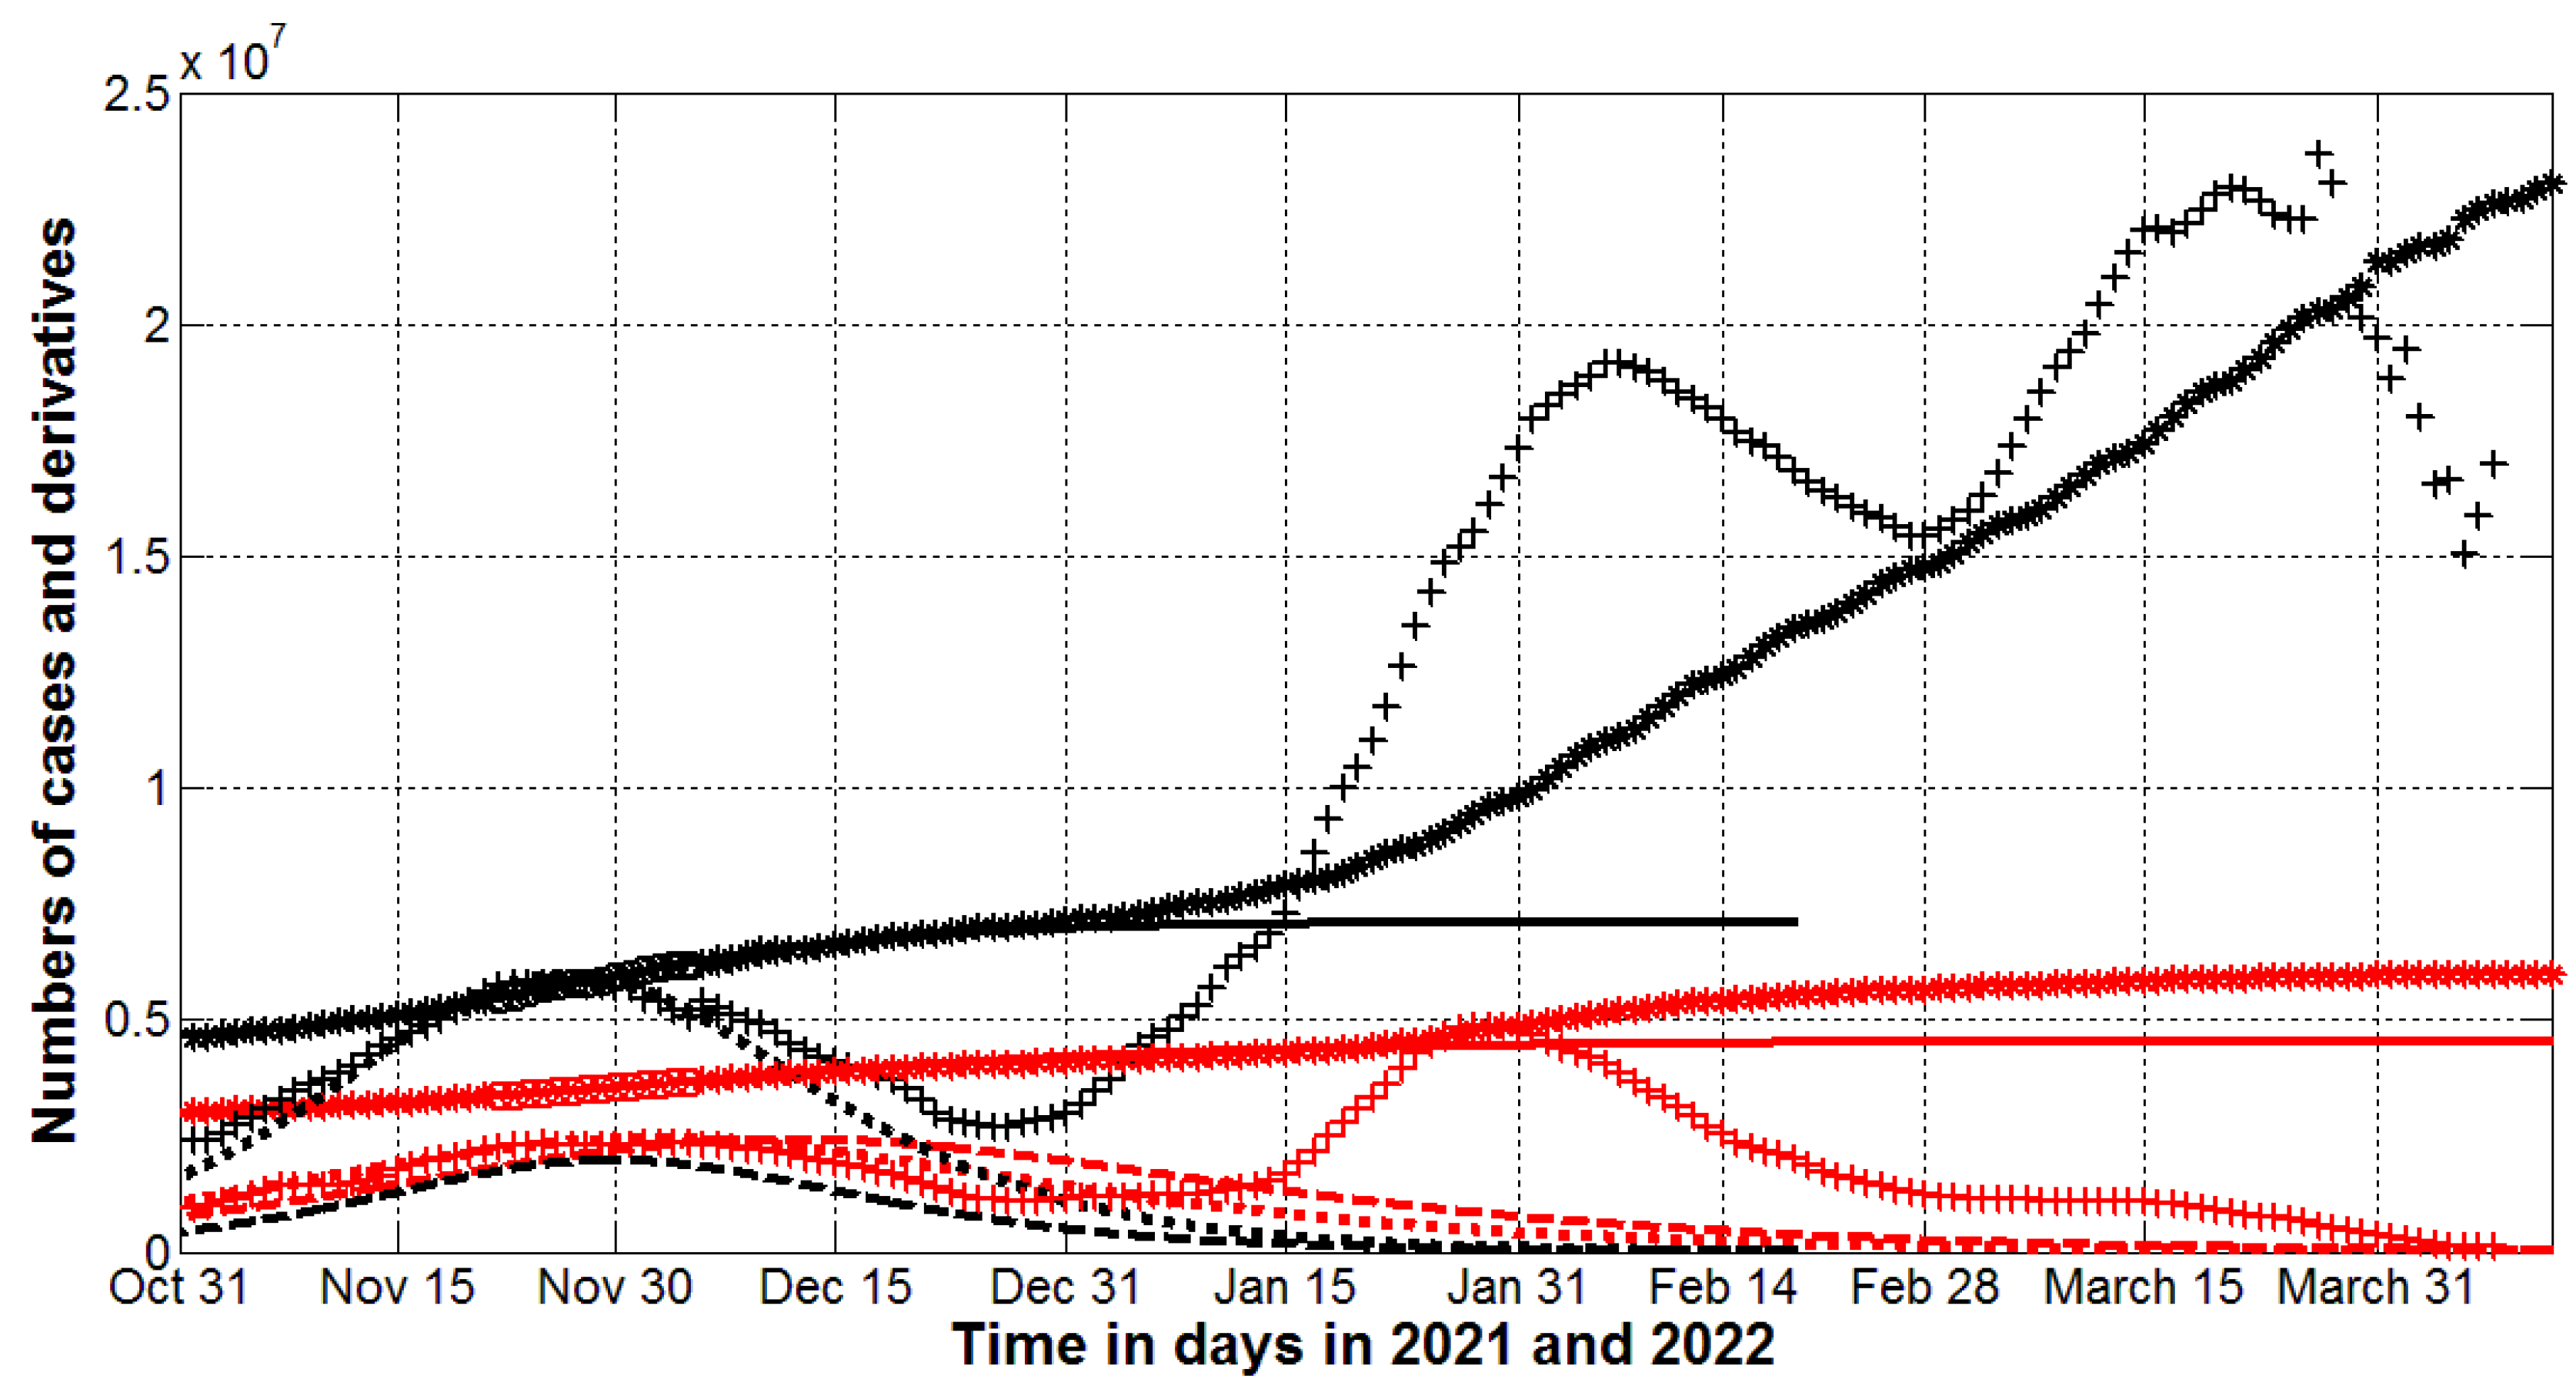
“Stars” represent accumulated numbers of laboratory confirmed cases Vj listed in Table 5 and Table 6 (multiplied by 10 for Moldova). “Crosses” show the averaged daily number of new cases DVi (calculated with the use of eq. (3) and JHU datasets listed in Table 5 and Table 6; multiplied by 100 for the UK and by 1000 for Moldova).
Figure 3 illustrates the COVID-19 pandemic dynamics in the UK and the Republic of Moldova. We can see almost no increase in the numbers of new cases in Moldova (blue “crosses”) after the beginning of the Russian invasion (February 24, 2022). Only some stabilization in the decreasing trend is visible in March 2022. Probably it relates to characteristics of the pandemic dynamics in Ukraine and Moldova (similar as in the case of Poland). In the UK, the increase in the averaged daily numbers of new cases DVi (see eq. (3)) is visible after February 24, 2022 (red “crosses”).
Figure 4 represents the dependences Rt(t) for different countries and in the whole world. Solid lines represent the results of calculations with the use of eq. (5). The value = 4 days was used in all cases. Red “dots” illustrate the results of calculations for Poland with the use of formula (4). It can be seen that the use of unsmoothed accumulated numbers of cases in (4) leads to very random values of the reproduction number. Eq. (4) yields similar results for other countries and the whole world (not shown in Figure 4). The dashed lines in Figure 4 represent the JHU datasets for the reproduction rate. The results of calculations with the use of formula (5) are rather close to the JHU values.
Eq. (6) show that the reproduction number decreases monotonously during fixed epidemic wave. For example, as of January 22, 2022 the corresponding values were 1.56 for Ukraine and 1.03 for the world (parameters listed in Table 7 and formula (6) allow calculating these figures). Without changing the epidemic parameters, as of April 30, 2022 these values should monotonically approach 0.52 for Ukraine and 0.79 for the world. The blue line in Figure 4 demonstrates slight deviation from the values calculated for Ukraine. Magenta lines show that the global reproduction number increased after February 24, 2022 and was higher than the critical value 1.0 in March 2022. The increasing trends in Poland, Germany, the UK, and Moldova started immediately after February 24, 2022 (see red, black, green and yellows lines in Figure 4). Thus, the changes in COVID-19 pandemic dynamics are evident and could be caused by the huge numbers of Ukrainian refuges.
Solid lines represent the results of calculations with the use of eq. (5) and = 4 days, dashed ones – JHU datasets. Red “dots” show the results of calculations for Poland with the use of formula (4).
5. Conclusions
Smoothed values of the accumulated numbers of cases were used to estimate the average daily numbers of new COVID-19 cases and the effective reproduction numbers for Ukraine, the UK, Poland, Germany, Moldova and the whole world in February, March and April of 2022. The registered numbers of cases were compared with ones calculated with the use of the generalized SIR-model and corresponding parameter identification procedure for the previous epidemic waves in Ukraine, Poland, Germany, and the world. In March 2022 the increase of the averaged number of new cases in the UK, Germany, and worldwide is visible. A simple formula to estimate the effective reproduction number based on the smoothed accumulated numbers of cases was proposed. The results of calculations agree with the figures presented by John Hopkins University and demonstrate a short-term growth of the reproduction number in the UK, Poland, Germany, Moldova, and worldwide in March 2022. The biggest pandemic dynamic disturbances were observed in the UK and Germany, where at the beginning of the full-scale Russian aggression, the number of infectious persons per capita was probably much lower than in Ukraine.
Acknowledgments
The study was supported by the Solidarity Satellite Programme of Isaac Newton Institute for Mathematical Sciences, Cambridge, UK. The authors are grateful to Professor Robin Thompson, Professor Matt Keeling, and Oleksii Rodionov for their support and providing very useful information.
References
- Available online: https://www.ukrinform.ua/rubric-ato/3436732-kilkist-bizenciv-z-ukraini-perevisila-35-miljona-oon.html.
- Nesteruk I. Impact of the Russian invasion of Ukraine on the COVID-19 pandemic dynamics. MedRxiv. Posted March 30, 2022. [CrossRef]
- Chumachenko D, Chumachenko T.Impact of war on the dynamics of COVID-19 in Ukraine. BMJ Global Health 2022, 7, e009173. [CrossRef] [PubMed]
- COVID-19 Data Repository by the Center for Systems Science and Engineering (CSSE) at Johns Hopkins University (JHU). Available online: https://github.com/owid/covid-19-data/tree/master/public/data.
- Nesteruk, I. COVID-19 pandemic dynamics. Springer Nature, 2021; Available online: https://link.springer.com/book/10.1007/978-981-33-6416-5. [CrossRef]
- Nesteruk, I. Visible and real sizes of new COVID-19 pandemic waves in Ukraine Innov Biosyst Bioeng. 2021. vol. 5. no. 2. pp. 85–96. Available online: http://ibb.kpi.ua/article/view/230487. [CrossRef]
- Nesteruk, I. Epidemic waves caused by SARS-CoV-2 omicron (B.1.1.529) and pessimistic forecasts of the COVID-19 pandemic duration. March 2022. MedComm 3(1). [CrossRef]
- Nesteruk, I. Final sizes and durations of new COVID-19 pandemic waves in Poland and Germany predicted by generalized SIR model. Prepint. MedRxiv. December 2021. [CrossRef]
- Coronavirus in Ukraine - Statistics - Map of infections, graphs [Internet]. Index.minfin.com.ua. 2021. Available online: https://index.minfin.com.ua/ua/reference/coronavirus/ukraine/.
- Cabinet of Ministers of Ukraine – Home [Internet]. Available online: https://www.kmu.gov.ua/.
- Available online: https://en.wikipedia.org/wiki/Basic_reproduction_number.
- Available online: https://www.r-bloggers.com/2020/04/effective-reproduction-number-estimation/.
- an der Heiden, M., and O. Hamouda. 2020. “Schätzung Der Aktuel-Len Entwicklung Der Sars-Cov-2-Epidemie in Deutsch-Land – Nowcasting.” Epid Bull 17: 10–15. [CrossRef]
- Cori, Anne, Neil M. Ferguson, Christophe Fraser, and Simon Cauchemez. 2013. “A New Framework and Software to Estimate Time-Varying Reproduction Numbers During Epidemics.” American Journal of Epidemiology 178 (9): 1505–12. [CrossRef]
- Arroyo-Marioli F, Bullano F, Kucinskas S, Rondón-Moreno C (2021) Tracking R of COVID-19: A new real-time estimation using the Kalman filter. PLoS ONE 16(1): e0244474. [CrossRef]
- R.N. Thompson, J.E. Stockwin, R.D. van Gaalen, J.A. Polonsky, Z.N. Kamvar, P.A. Demarsh, E. Dahlqwist, S. Li, E. Miguel, T. Jombart, J. Lessler, S. Cauchemez, A. Cori, Improved inference of time-varying reproduction numbers during infectious disease outbreaks. Epidemics, 2019; 29, 100356ISSN 1755-4365.
- . [CrossRef]
- I Ogi-Gittins, WS Hart, J Song, RK Nash, J Polonsky, A Cori, EM Hill, RN Thompson. A simulation-based approach for estimating the time-dependent reproduction number from temporally aggregated disease incidence time series data. medRxiv 2023.09.13.23295471. [CrossRef]
- William S Hart, Elizabeth Miller, Nick J Andrews, Pauline Waight, Philip K Maini, Sebastian Funk, Robin N Thompson. Generation time of the alpha and delta SARS-CoV-2 variants: an epidemiological analysis. Lancet. Infectious diseases. Volume 22, ISSUE 5, P603-610, May 01, 2022. [CrossRef]
- Nishiura, Hiroshi, Natalie M. Linton, and Andrei R. Akhmetzhanov. 2020. “Serial Interval of Novel Coronavirus (COVID-19) Infections.” International Journal of Infectious Diseases 93 (April): 284–86. [CrossRef]
- Igor Nesteruk. Improvement of the software for modeling the dynamics of epidemics and developing a user-friendly interface. Infectious Disease Modelling, Volume 8, Issue 3, 2023,Pages 806-821,ISSN 2468-0427. [CrossRef]
Figure 3.
The COVID-19 pandemic waves in the UK (red) and the Republic of Moldova (blue) in 2021 and 2022.
Figure 3.
The COVID-19 pandemic waves in the UK (red) and the Republic of Moldova (blue) in 2021 and 2022.
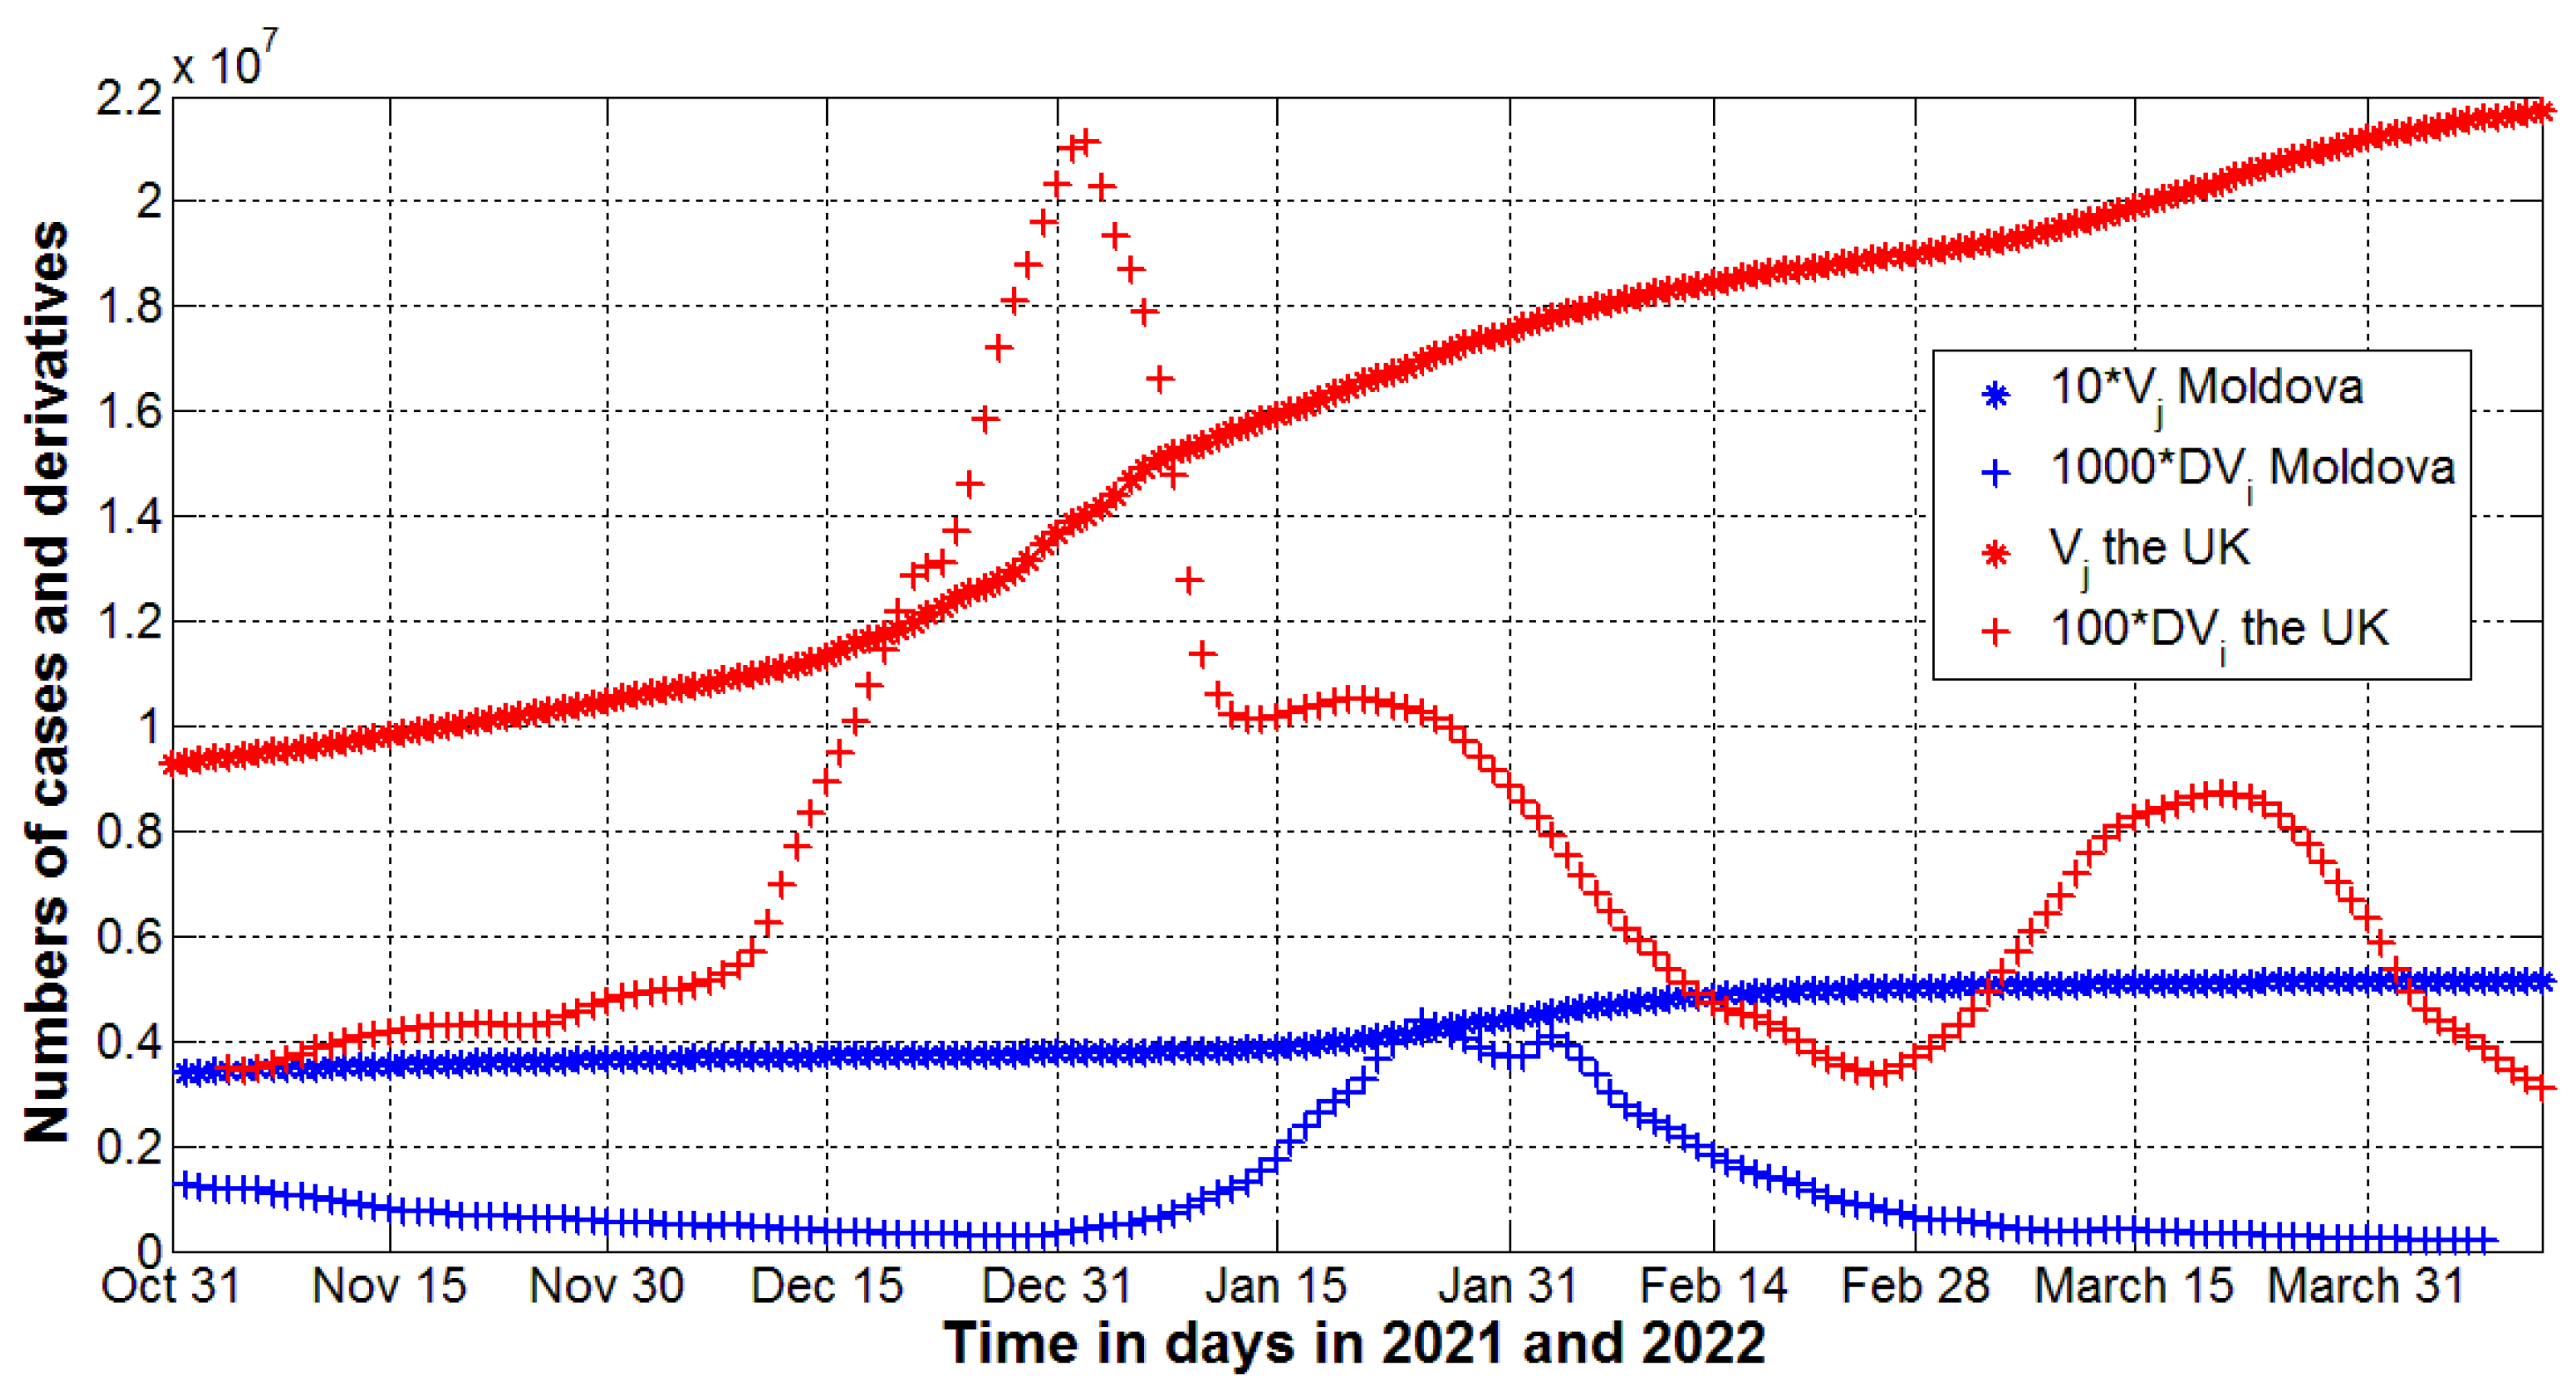
Figure 4.
The effective reproduction numbers of the COVID-19 pandemic in different countries and worldwide for the period from February 1 to April 30, 2022.
Figure 4.
The effective reproduction numbers of the COVID-19 pandemic in different countries and worldwide for the period from February 1 to April 30, 2022.
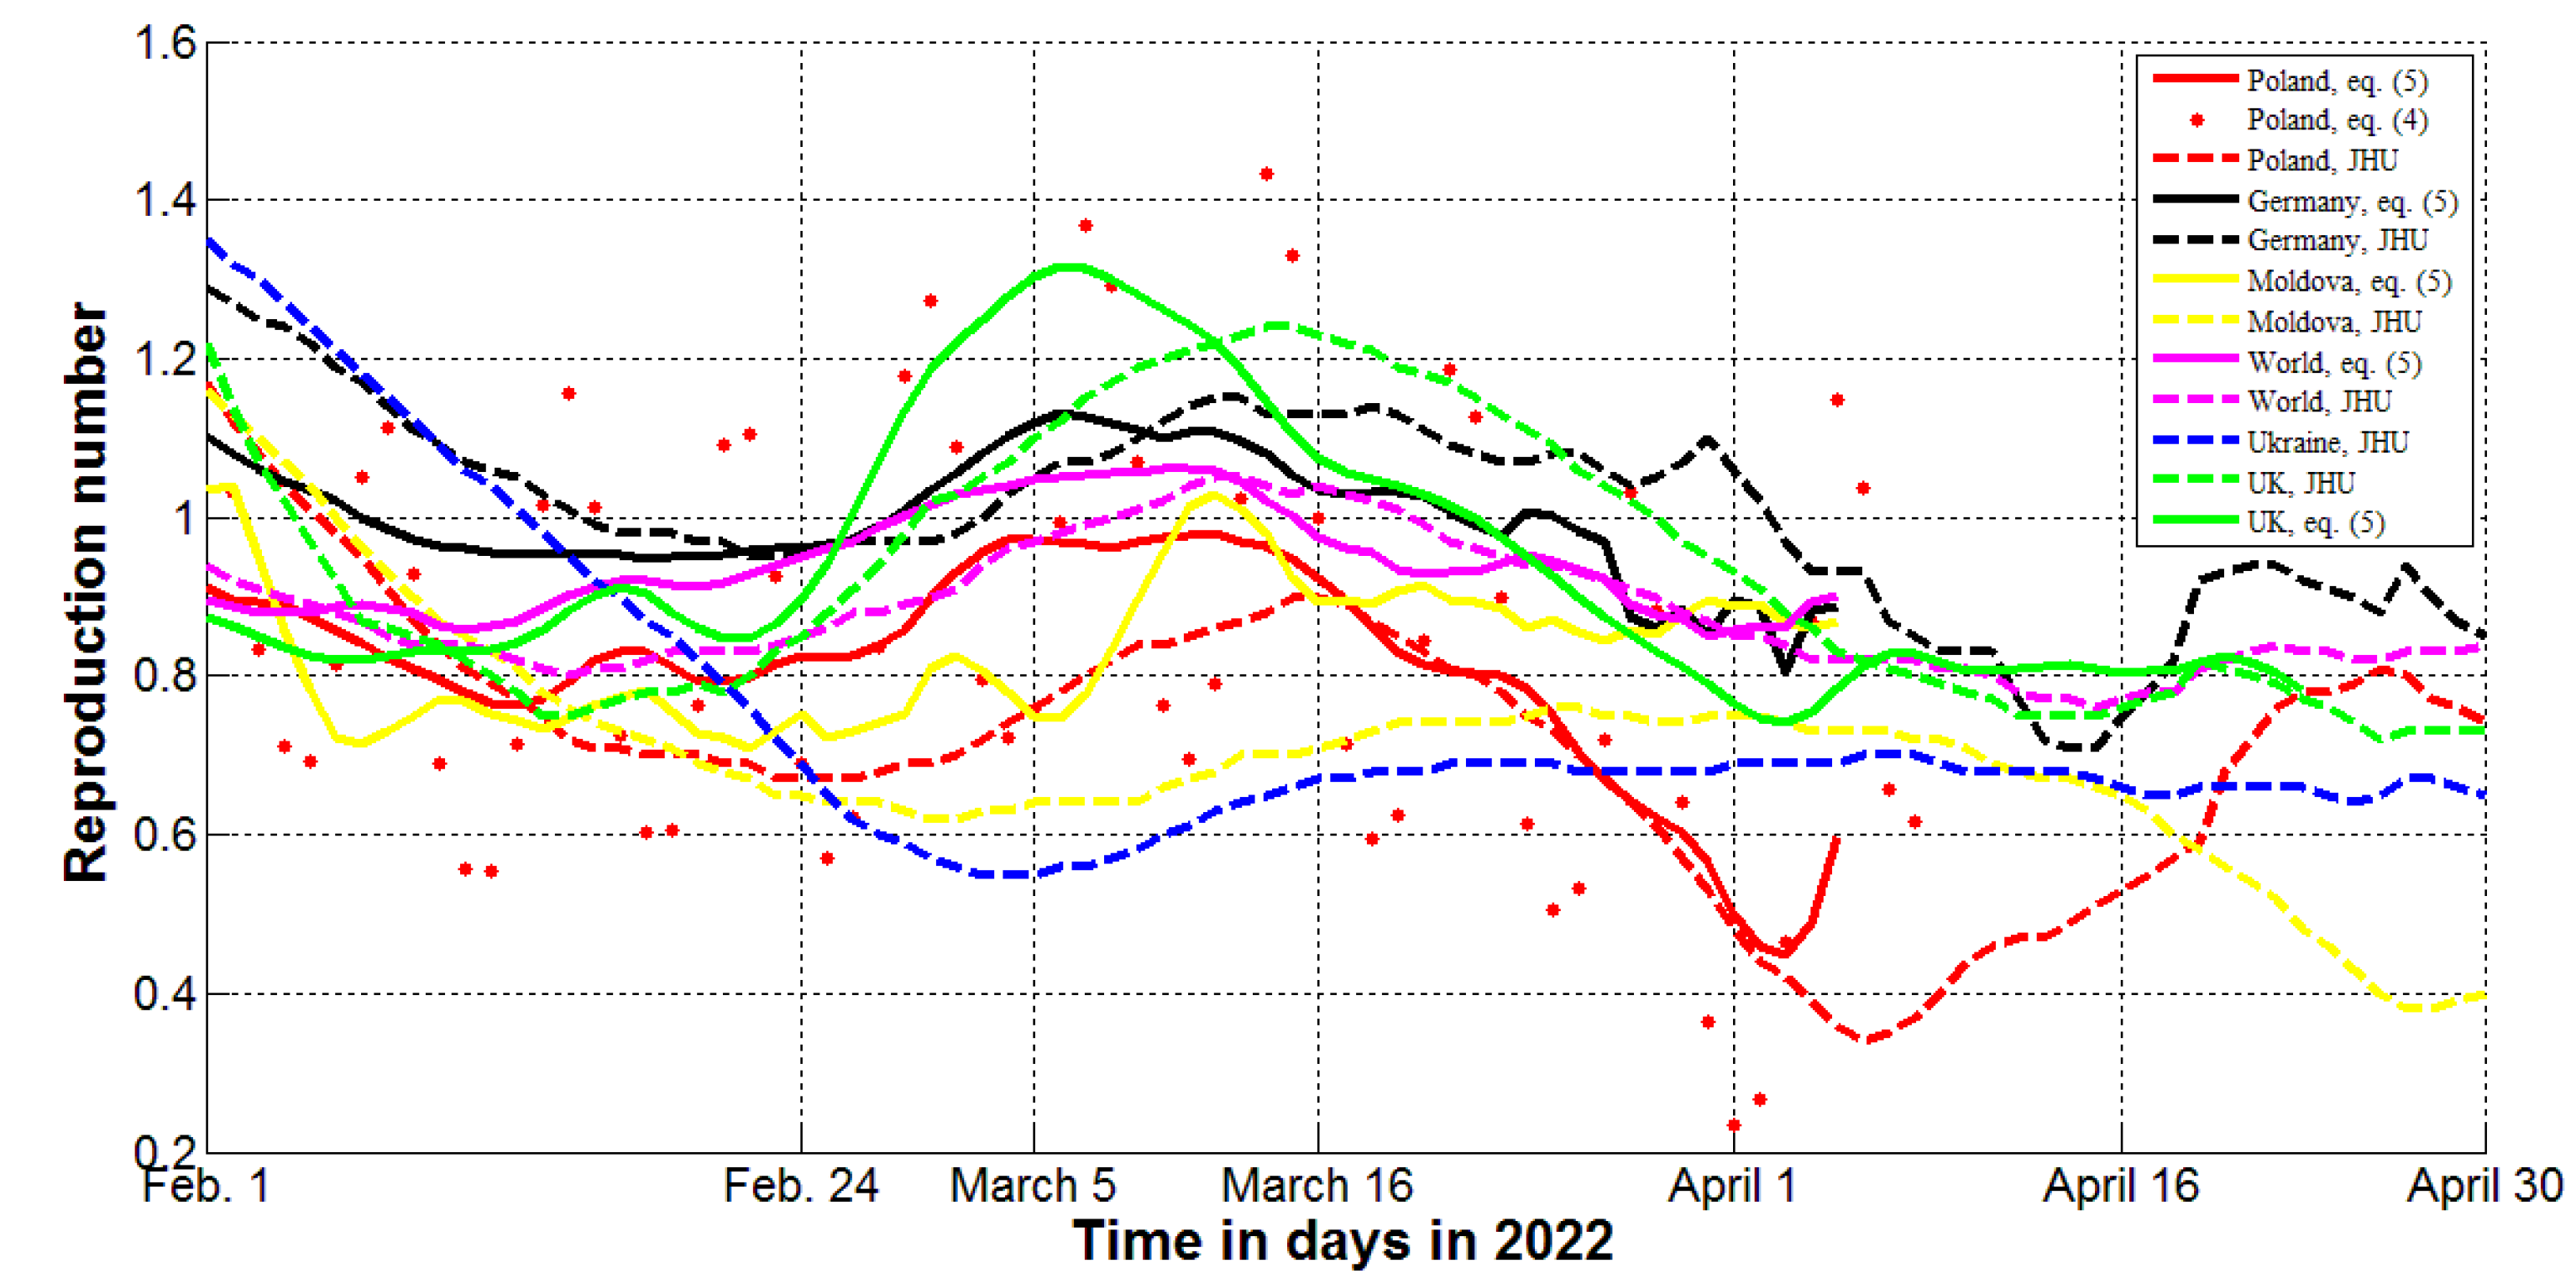
Table 1.
Cumulative numbers of laboratory-confirmed Covid-19 cases in Ukraine for the period of November 1, 2021 to February 24, 2022 according to JHU report on April 13, 2022, [4].
Table 1.
Cumulative numbers of laboratory-confirmed Covid-19 cases in Ukraine for the period of November 1, 2021 to February 24, 2022 according to JHU report on April 13, 2022, [4].
| Day in corres-ponding month of 2021 and 2022 | Number of cases in November 2021, Vj |
Number of cases in December 2021, Vj |
Number of cases in January 2022, Vj |
Number of cases in February 2022, Vj |
|---|---|---|---|---|
| 1 | 3073125 | 3619223 | 3852397 | 4287117 |
| 2 | 3093661 | 3633386 | 3854405 | 4323009 |
| 3 | 3118140 | 3647777 | 3856359 | 4363754 |
| 4 | 3146617 | 3661583 | 3858248 | 4408776 |
| 5 | 3174223 | 3668794 | 3862959 | 4452612 |
| 6 | 3200411 | 3673839 | 3869728 | 4481918 |
| 7 | 3218967 | 3683044 | 3877032 | 4506669 |
| 8 | 3233178 | 3692939 | 3880371 | 4542568 |
| 9 | 3253327 | 3705823 | 3883316 | 4582137 |
| 10 | 3277772 | 3717640 | 3885416 | 4625614 |
| 11 | 3303694 | 3728246 | 3890974 | 4668581 |
| 12 | 3328934 | 3733967 | 3898240 | 4708604 |
| 13 | 3353694 | 3738390 | 3908469 | 4735258 |
| 14 | 3369387 | 3746106 | 3919151 | 4753922 |
| 15 | 3381399 | 3754567 | 3929950 | 4785138 |
| 16 | 3398913 | 3764485 | 3936582 | 4818112 |
| 17 | 3418792 | 3773700 | 3941923 | 4853339 |
| 18 | 3440602 | 3781506 | 3950774 | 4890332 |
| 19 | 3461873 | 3785395 | 3963917 | 4923680 |
| 20 | 3481347 | 3788209 | 3982738 | 4943428 |
| 21 | 3493203 | 3794490 | 4003280 | 4959461 |
| 22 | 3501815 | 3801079 | 4026198 | 4986161 |
| 23 | 3515641 | 3808612 | 4042152 | 5012980 |
| 24 | 3530969 | 3815440 | 4055643 | 5040518 |
| 25 | 3548842 | 3820891 | 4075351 | No data |
| 26 | 3565644 | 3823879 | 4100292 | No data |
| 27 | 3580671 | 3825917 | 4133396 | No data |
| 28 | 3588916 | 3828336 | 4168560 | No data |
| 29 | 3595410 | 3833952 | 4206731 | No data |
| 30 | 3606622 | 3840041 | 4232143 | No data |
| 31 | - | 3847226 | 4255206 | No data |
Table 2.
Cumulative numbers of laboratory-confirmed Covid-19 cases in the world for the period of November 1, 2021 to April 12, 2022 according to JHU report on April 13, 2022, [4].
Table 2.
Cumulative numbers of laboratory-confirmed Covid-19 cases in the world for the period of November 1, 2021 to April 12, 2022 according to JHU report on April 13, 2022, [4].
| Day in corres-ponding month of 2021 and 2022 | Number of cases in November 2021, Vj |
Number of cases in December 2021, Vj |
Number of cases in January 2022, Vj |
Number of cases in February 2022, Vj |
Number of cases in March 2022, Vj |
Number of cases in April 2022, Vj |
|---|---|---|---|---|---|---|
| 1 | 247862074 | 263807528 | 289927623 | 382057655 | 438638152 | 489570107 |
| 2 | 248266150 | 264513551 | 290847589 | 385246182 | 440298642 | 490615023 |
| 3 | 248790581 | 265242947 | 293206749 | 388418808 | 442054923 | 491403738 |
| 4 | 249310490 | 265778142 | 295706744 | 391363495 | 443808766 | 492308878 |
| 5 | 249834773 | 266237498 | 298280821 | 393663274 | 445278431 | 493667646 |
| 6 | 250272210 | 266836489 | 300938774 | 395535273 | 446490779 | 495121230 |
| 7 | 250632969 | 267476824 | 303882579 | 398131340 | 447913616 | 496337008 |
| 8 | 251103998 | 268189875 | 306061605 | 400756040 | 449664409 | 497530264 |
| 9 | 251571331 | 268887169 | 308097605 | 403194717 | 451503752 | 498298585 |
| 10 | 252148459 | 269580734 | 311285781 | 405974555 | 453364661 | 498866902 |
| 11 | 252669280 | 270101373 | 314317623 | 408396208 | 455215091 | 499842091 |
| 12 | 253267145 | 270557090 | 317770589 | 410315599 | 456963450 | 500878952 |
| 13 | 253708184 | 271167762 | 320952544 | 411833078 | 458244773 | |
| 14 | 254086682 | 271805943 | 324268400 | 413532555 | 459874155 | |
| 15 | 254613141 | 272545359 | 326765265 | 415412111 | 461676661 | |
| 16 | 255118609 | 273288038 | 328943173 | 417649604 | 463900108 | |
| 17 | 255737422 | 274055576 | 331604331 | 419706593 | 465953017 | |
| 18 | 256358930 | 274625828 | 335364892 | 421685829 | 467866738 | |
| 19 | 256975072 | 275138218 | 339453918 | 423314385 | 469575841 | |
| 20 | 257475402 | 275874759 | 343159424 | 424639646 | 470645978 | |
| 21 | 257896061 | 276631163 | 346995120 | 426035583 | 472116618 | |
| 22 | 258497626 | 277541705 | 349784219 | 427747662 | 474092054 | |
| 23 | 259087921 | 278548452 | 352240761 | 429674701 | 475864692 | |
| 24 | 259748956 | 279440261 | 355663188 | 431442819 | 477616071 | |
| 25 | 260347371 | 280142385 | 359314204 | 433079615 | 479457172 | |
| 26 | 260957671 | 280722452 | 362976531 | 434508761 | 480813689 | |
| 27 | 261441136 | 281990658 | 366732889 | 435655616 | 481725638 | |
| 28 | 261871606 | 283317208 | 370352923 | 437014406 | 483218323 | |
| 29 | 262502486 | 285013613 | 373093920 | - | 484967067 | |
| 30 | 263102705 | 286956097 | 375410506 | - | 486559347 | |
| 31 | - | 288702042 | 378897181 | - | 488405398 |
Table 3.
Cumulative numbers of laboratory-confirmed Covid-19 cases in Poland for the period of November 1, 2021 to April 12, 2022 according to JHU report on April 13, 2022, [4].
Table 3.
Cumulative numbers of laboratory-confirmed Covid-19 cases in Poland for the period of November 1, 2021 to April 12, 2022 according to JHU report on April 13, 2022, [4].
| Day in corres-ponding month of 2021 and 2022 | Number of cases in November 2021, Vj |
Number of cases in December 2021, Vj |
Number of cases in January 2022, Vj |
Number of cases in February 2022, Vj |
Number of cases in March 2022, Vj |
Number of cases in April 2022, Vj |
|---|---|---|---|---|---|---|
| 1 | 3030151 | 3569137 | 4120248 | 4925270 | 5680034 | 5966970 |
| 2 | 3034668 | 3596491 | 4127428 | 4981321 | 5694767 | 5969071 |
| 3 | 3045102 | 3623452 | 4133851 | 5035796 | 5708827 | 5969621 |
| 4 | 3060613 | 3649027 | 4145518 | 5083332 | 5721316 | 5970114 |
| 5 | 3076518 | 3671421 | 4162715 | 5129080 | 5734041 | 5971998 |
| 6 | 3091713 | 3684671 | 4179292 | 5163780 | 5741739 | 5973557 |
| 7 | 3104220 | 3704040 | 4191193 | 5188184 | 5747322 | 5975040 |
| 8 | 3111534 | 3732589 | 4202090 | 5223507 | 5760498 | 5976364 |
| 9 | 3125179 | 3760048 | 4213197 | 5270363 | 5774938 | 5977773 |
| 10 | 3143725 | 3785036 | 4220984 | 5312450 | 5788363 | 5978215 |
| 11 | 3162804 | 3808798 | 4232386 | 5348224 | 5799996 | 5978596 |
| 12 | 3175769 | 3828248 | 4248559 | 5379551 | 5811109 | 5980220 |
| 13 | 3190067 | 3839625 | 4265433 | 5401615 | 5818687 | |
| 14 | 3204515 | 3857085 | 4281482 | 5415088 | 5823982 | |
| 15 | 3214023 | 3881349 | 4298375 | 5437343 | 5836672 | |
| 16 | 3230634 | 3903445 | 4313036 | 5466198 | 5851147 | |
| 17 | 3254875 | 3923472 | 4323482 | 5495432 | 5863414 | |
| 18 | 3279787 | 3942864 | 4343130 | 5519411 | 5875072 | |
| 19 | 3303046 | 3958840 | 4373718 | 5540302 | 5885446 | |
| 20 | 3326464 | 3968450 | 4406553 | 5553989 | 5891140 | |
| 21 | 3345388 | 3982257 | 4443217 | 5563446 | 5895304 | |
| 22 | 3357763 | 4000270 | 4484095 | 5582217 | 5905463 | |
| 23 | 3377698 | 4017420 | 4518218 | 5602680 | 5915888 | |
| 24 | 3406129 | 4032796 | 4547315 | 5620946 | 5924876 | |
| 25 | 3434272 | 4043585 | 4584360 | 5637646 | 5933107 | |
| 26 | 3461066 | 4049838 | 4637776 | 5651596 | 5939735 | |
| 27 | 3487254 | 4054865 | 4695435 | 5660493 | 5943227 | |
| 28 | 3507828 | 4064715 | 4752700 | 5667054 | 5945594 | |
| 29 | 3520961 | 4080282 | 4804390 | - | 5952200 | |
| 30 | 3540061 | 4094608 | 4852677 | - | 5957940 | |
| 31 | - | 4108215 | 4886154 | - | 5962931 |
Table 4.
Cumulative numbers of laboratory-confirmed Covid-19 cases in Germany for the period of November 1, 2021 to April 12, 2022 according to JHU report on April 13, 2022, [4].
Table 4.
Cumulative numbers of laboratory-confirmed Covid-19 cases in Germany for the period of November 1, 2021 to April 12, 2022 according to JHU report on April 13, 2022, [4].
| Day in corres-ponding month of 2021 and 2022 | Number of cases in November 2021, Vj |
Number of cases in December 2021, Vj |
Number of cases in January 2022, Vj |
Number of cases in February 2022, Vj |
Number of cases in March 2022, Vj |
Number of cases in April 2022, Vj |
|---|---|---|---|---|---|---|
| 1 | 4607208 | 5903999 | 7176814 | 9978146 | 14867218 | 21357039 |
| 2 | 4618021 | 5977208 | 7189329 | 10186644 | 15053624 | 21553495 |
| 3 | 4638419 | 6051560 | 7207847 | 10422764 | 15264297 | 21668677 |
| 4 | 4672368 | 6116070 | 7238408 | 10671602 | 15481890 | 21668677 |
| 5 | 4709488 | 6158125 | 7297320 | 10889417 | 15674100 | 21849074 |
| 6 | 4743490 | 6185961 | 7361660 | 11022590 | 15790989 | 22265788 |
| 7 | 4767033 | 6222020 | 7417995 | 11117857 | 15869417 | 22441051 |
| 8 | 4782546 | 6291621 | 7473884 | 11287428 | 16026216 | 22591726 |
| 9 | 4804378 | 6362232 | 7510436 | 11521678 | 16242070 | 22647197 |
| 10 | 4844054 | 6423520 | 7535691 | 11769540 | 16504822 | 22677986 |
| 11 | 4894250 | 6477217 | 7581381 | 12009712 | 16757658 | 22878428 |
| 12 | 4942890 | 6509863 | 7661811 | 12219501 | 16994744 | 23017079 |
| 13 | 4987971 | 6531606 | 7743228 | 12344661 | 17141351 | |
| 14 | 5021469 | 6562429 | 7835451 | 12421126 | 17233729 | |
| 15 | 5045076 | 6613730 | 7913473 | 12580343 | 17432617 | |
| 16 | 5077124 | 6670407 | 7965977 | 12800315 | 17695210 | |
| 17 | 5129950 | 6721375 | 8000122 | 13035941 | 17990141 | |
| 18 | 5195321 | 6764188 | 8074527 | 13255989 | 18287986 | |
| 19 | 5248291 | 6793536 | 8186850 | 13445094 | 18548225 | |
| 20 | 5312215 | 6809622 | 8320386 | 13563126 | 18680017 | |
| 21 | 5354942 | 6833050 | 8460546 | 13636993 | 18772331 | |
| 22 | 5385585 | 6878709 | 8596007 | 13762895 | 18994411 | |
| 23 | 5430911 | 6923636 | 8681447 | 13971947 | 19278143 | |
| 24 | 5497795 | 6959067 | 8744840 | 14188269 | 19596530 | |
| 25 | 5573756 | 6981281 | 8871795 | 14399012 | 19893028 | |
| 26 | 5650170 | 6991381 | 9035795 | 14574845 | 20145054 | |
| 27 | 5717295 | 7005289 | 9238931 | 14682758 | 20256278 | |
| 28 | 5761696 | 7026369 | 9429079 | 14745107 | 20323779 | |
| 29 | 5791060 | 7066412 | 9618245 | - | 20561131 | |
| 30 | 5836813 | 7109182 | 9737215 | - | 20829608 | |
| 31 | - | 7150422 | 9815533 | - | 21357095 |
Disclaimer/Publisher’s Note: The statements, opinions and data contained in all publications are solely those of the individual author(s) and contributor(s) and not of MDPI and/or the editor(s). MDPI and/or the editor(s) disclaim responsibility for any injury to people or property resulting from any ideas, methods, instructions or products referred to in the content. |
© 2024 by the authors. Licensee MDPI, Basel, Switzerland. This article is an open access article distributed under the terms and conditions of the Creative Commons Attribution (CC BY) license (http://creativecommons.org/licenses/by/4.0/).
Copyright: This open access article is published under a Creative Commons CC BY 4.0 license, which permit the free download, distribution, and reuse, provided that the author and preprint are cited in any reuse.


