Submitted:
05 January 2024
Posted:
08 January 2024
You are already at the latest version
Abstract
The study presents the evaluation of integrating Extended Reality applications in situ to foster visitors' experience at the Tomato Industrial Museum "D. Nomikos". This paper firstly provides an outline of the methodological, technological, and museological approaches undertaken to integrate XR in a quest to enhance visitors’ meaningful engagement with the industrial heritage-related exhibition. Storytelling and narration are key elements of the museums’ museological design [1] through audio tours and interactive AR-based visualization of the machinery’s role as well as internal function. This paper presents and discusses the evaluation findings. We adopted the User Experience Questionnaire method as the main vehicle for gathering quantitative data and analyzing the results with the use of corresponding metrics and benchmarks embedded in this evaluation tool. Moreover, we conducted semi-structured interviews and combined the qualitative data accrued in the form of accounts, suggestions, and remarks to reach more rich and dependable conclusions. This paper aims to offer both an instance of practice to the research community and a broader discussion of the challenges and prospects connected to the quest of employing emerging technologies and assessing their impact on visitors’ museum experience.
Keywords:
Digital Heritage
; eXtended Reality
; Experimental Museology
; Industrial Museum
1. Introduction
Museums increasingly adopt contemporary methods and ways of communication for heritage management and the spread of cultural information. The development of Information and Communication Technologies (ICT) in cultural documentation and promotion provides valuable help mainly to the problem of data organization, meaning-making, and the enhancement of the museum experience. ICT is used to support heritage research and to provide education and entertainment. The advancements in technology provide museums with a wide range of available solutions that dramatically enhance users’ ability to enjoy more interactive, appealing as well as inclusive museum experiences, especially to audiences who are using smart devices in their everyday lives as means of communicating and gaining access to information [2,3,4]. Moreover, the last decades ICT allowed the contextualisation and linking of cultural heritage datasets via innovative methods and tools, and they are making it possible to stimulate archaeological research using open content and linked data. ICTs are used to enrich, transform, and enhance the heritage experience, have enabled a dynamic and effective communication of cultural organizations with their audiences, and made it more attractive with the use of PDAs, mobile phones, QR codes, and RFID tags. In relation to the immediate user experience on site, sophisticated applications that employ emerging technologies such as eXtended Reality (XR) interactive systems offer advanced possibilities for enhancing visitors’ engagement with Museum exhibitions. This paper discusses the employment of such technologies in a specific heritage site, namely the D. Nomikos Tomato Industrial Museum in Santorini. The museum offers interactive narrations that inform visitors about the historical background of the site and demonstrations of the machinery functions. Its main scope is to present a flashback to the Past and the cultivation, processing, and production procedure of small-fruited tomatoes, included interactive visualization of the exhibits’ interior. The Museum communicates content as well as contextual knowledge through a combination of audio tours and XR applications that provide multimodal material. The main concept that underpins the museological approach of the integration of diverse technologies at the specific Museum is to combine the strengths of viewing the actual, physical exhibits with the digital support of XR, thereby combining real-world with virtual elements in a holistic experience. The main aim of this paper is to present and discuss the evaluation process, the findings, and the analysis thereof as a means to provide insights to stakeholders and academics in the digital heritage field. We also gathered qualitative data through focus group discussions in the form of semi-structured interviews with visitors that provided more insights into the ways we can further improve relevant approaches in the future. In our analysis, we incorporate a comparative and synthesizing approach in the sense that we draw conclusions through a parallel investigation of the results that lead to a holistic synthesis of the diverse data we have gathered via these two main research methods.
2. Background and related work
2.1. Related case studies
The development of the key museological concepts for the employment of XR to foster User Experience (UX) in the permanent exhibition of the D. Nomikos Museum in Santorini was informed by pertinent cases of Industrial museums in similar settings. The main examples of XR-based approaches comprise the Mastic Museum on Chios Island, which is also related to food processing and is located on a Greek island [5]. In both cases, albeit to a different degree, virtual humans play an essential role chiefly through the provision of narrative or as guides, to enhance visitors’ engagement through interactive, multimodal communication [4]. In both instances, virtual humans are dressed as workers of the time, and in the case of Nomikos Museum, they provide narrations through tablets mounted on static tripod bases.
Quite interestingly, another use case is also located on a Greek island, namely, Syros, and relates to the use of interactive projection on a wall that visitors engage with to elicit information by touching it, once again, an industrial heritage site. Nevertheless, the technological and museological choices are different given, amongst other factors, the fact that in Syros, there is a single exhibit (the first electric car that entered production back in the 70s). Therefore, as opposed to Chios Mastic and Santorini Tomato Museums, there was no production line or workers to be represented. As Gkiti et al. [6] note, storytelling and XR were also pivotal aspects of their approach. They call i-Wall the central element, the matrix, and the locus of the ICT-supported interactive experience. At the same time, an actual car is exhibited next to it in an inspiring combination of digital resources and actual objects working in synergy rather than competing for attention, a challenge that was also addressed in our research and ICT implementation, albeit through different solutions and configurations.
2.2. Integration of XR in D. Nomikos Museum
The thematic context in which the technologies employed in the Tomato Industrial Museum exhibition can be summarized as follows: the visitor learns about the processing machines from 1890, old tools, and through audiovisual material with videotaped stories of people who used to work in the factory, learns about the production procedure. More specifically, the use of technologies aims at (a) rendering the internal parts and function of the machine visible (i.e., with the use of animated cross sections); (b) show the "transformations" of the product through the concatenation of industrial processes and sequential operation of machines, and highlight the qualities of the end product; (c) foreground the workers’ role in the procedures and also the human perspective with regard to the experience of working and cooperating with others in the specific factory.
The museological underpinnings of the exhibition scenario and design had to face two serious challenges: firstly, how to combine static machinery along with screens/viewing devices in a way that new technologies will enhance the exhibits rather than distract from them, and secondly, how to engage visitors with an old industrial process and make them connect to the life in the factory as it unfolded in a bygone era. The first problem was addressed by installing rather discreet devices and placing them in a way that encourages a parallel viewing of screens and exhibits audiovisual resources referred to each time. The second issue of how to engage people who may not feel compelled to connect to a 19th-century line of production or the respective workers’ experience has been addressed through a combination of foregrounding the human element, e.g., through first-person narratives, with the animated representation of machines internal function, that allow for otherwise strange machines to become more understandable in terms of their role and thus generate more interest. The main issue in this respect and concerning the specific museum is the fact that, quite literally, the exhibits are almost self-referential, i.e., the machinery comprising the line of production, as opposed to a cultural artefact of artwork, do not seem to generate tangible allusions, connections, interpretations, or personal effects easily. In a way, exhibits only 'talk' about themselves and their position or role in the specific production procedure as purely practical items. One question that arises at this point is how to turn this practicality and orientation toward a result into an element that may be exploited to foster interest in the exhibits with the help of new technologies. A quick answer is to engage viewers and users of XR applications in tasks or gamified procedures, creating a challenge for them to undertake practical tasks as virtual handlers of such machinery.
Furthermore, new technologies allow for the inclusion of a considerable amount of information that may be interactively accessed but could not be satisfactorily included by conventional means. Such technologies, thus next to an exhibit, give an active role to the visitor, who chooses the level of information they wish to gain. Moreover, the appeal of user-friendly and exciting in their own right, interactive visuals can complement an otherwise mundane series of ancient machines for some visitors and foster the museum experience through a contrapuntal presentation of old next to new technologies that synergize to generate a meaningful engagement with the past. The inclusion of screen-based means is also foreseen as a measure to address the sensibilities of a generation that relies heavily on devices such as smartphones to gather information, gain insights and connect to a heritage site.
Designing visitors’ path with ICT applications was related to the approaches adopted to complement and enhance the visitors' experience and engagement with three key production phases and the corresponding machinery enlivened in differing ways with the presence of digital humans, thereby adding an element of empathy through narrations and visual representations of workers in original attire of the decades in which the factory functioned. Correlating the goals of the audio tour with XR technologies is based on a conscious effort to put these two ways of enhancing visitors' museum experience in synergy; thus, the choices made regarding digital applications were made bearing in mind that these two different but symbiotically related strands of communicating information and engaging the viewers, should mutually foster each other. The goals of applying the script are to clarify the primary stages of the production chain, i.e., the process of washing/sorting the tomato, the dehydration/condensation of the pulp, and finally, its pasteurization and packaging.
2.3. Design of evaluation methodology
The evaluation process was based on questionnaires filled out by visitors who were asked to assess their experience in relation to the effect that new technologies embedded into the exhibition had on their museum experience. After a review of existing questionnaires, we deemed more apposite to use one that is not as generic as the System Usability Scale/SUS [7] (not to be confused with the Slater-Usoh-Steed Questionnaire whose acronym is also SUS and is presented below that was developed by Usoh et al. [8], and that could capture more qualitative aspects of the users’ experience. At the same time, we opted for a method that is not time consuming or taxing to avoid unnecessary fatigue that may ensue for the visitors.
More specifically, during the design phase of the evaluation process that is more suitable for the specific exhibition and the technologies embedded in it, we surveyed assessment methods in the fields of XR-based experiences with emphasis on the culture and heritage domain as well as tools that mostly relate to digital applications that are either commercial products or can be described as more generic/general purpose as the SUS mentioned above. We surveyed XR specific UX questionnaires that were exceptionally interesting as such, however they gravitated towards immersive or fully immersive experiences, hence they were deemed incongruent with the scope of the specific evaluation. Such methods include the Presence Questionnaire developed by Witmer & Singer (1998) that uses a 7 steps Likert Scale as the Figure 1 below illustrates.
Nevertheless, the sense of Presence is a key element for Virtual Environments (VE), which Lee [9] ‘tentatively’ defines as “a psychological state in which the virtuality of experience is unnoticed” or according to Witmer & Singer [10] is the subjective experience of being in one place or environment, even when one is physically situated in another, does not fully apply in the Tomato Industrial Museum exhibition design as it stands. Therefore, as a methodological approach is not commensurate with the type of mainly augmented reality and audio tour-based experience that may benefit from XR but do so by offering a coexistence of digital tools with the actual exhibits in their physical form and in an actual brick-and-mortar museum space. We nevertheless see fit to include a brief outline of the existing methodologies in the field and delineate the reasoning behind finally choosing the User Experience Questionnaire (UEQ) developed by Laugwitz et al. [11]. that is presented in detail in the following section, over other more specified (or, conversely, generic models). Schwind et al. [12] identified that Witmer & Singer [10] are by far the most cited authors that present a questionnaire on Presence in XR environments. Likewise, Grassini and Laumann [13] who provide a thorough Systematic Review on published research measuring Presence, surveyed 20 papers and, according to their findings, Witmer and Singer Presence Questionnaires (PQ) are used more frequently than any other measuring approach.
Grassini and Laumann [13] offer a comprehensive outline of the issues and trends related to researchers’ efforts to measure presence in XR environments: The PQ questionnaire emphasizes the “involvement” and “immersion” characteristics of the simulated environment, while the Slater-Usoh-Steed Questionnaire (SUS) and the Igroup Presence Questionnaire (IPQ) [14] are focused on the sense of “being there” (i.e., the sense that the experienced VE may be part of the reality). The MEC-SPQ questionnaire [15] analyzes what is called “spatial presence”. Moreover, although MPS (Multimodal Presence Scale) [16] offers some very interesting aspects, it is hinged on spatial attributes and parameters of the experience in VE, as well as on one’s own sense of body/avatar as ‘real’ in a VE. Furthermore, Social presence is vital in MPS, but does so following Lee’s (2004) conceptualization of presence in VEs.
Moreover, a more pertinent evaluation method is described in a recent publication by Hammady et al. [17] that focuses on an MR museum experience, while at the same time provides a comprehensive survey of related methods. This publication introduces a useful theoretical scheme and related methodological approach for evaluating a museum related XR experience.
Although the Role of the Guide (virtual human) is central in this diagrammatic scheme, even if deducted, the theoretical scheme remains relevant and methodologically valid for the present research in D. Nomikos Museum, as the remaining key elements still interrelate and underpin users’ Intention to Use. The main strengths of this methodological approach that it may well inform the present evaluation process, as it can serve as a framework that may help in interpreting (or, to an extent, coding) responses in interviewees’ answers. Adopting the structure of (tens of questions presented in [17]) in questionnaires would result in adding questions that would overlap with those of the UEQ and protract the questioning procedures disproportionally in comparison with expected benefits. However, it was deemed beneficial to adapt these key interest areas as guiding or reference points for better making sense of qualitative data that emerge from discussions. More specifically, the terms presented by the authors [17] are the following: Enjoyment, Immersion, Multimedia and UI, Storytelling (where applicable), Usefulness, Ease of use, Interaction, overall satisfaction phrases, and last but not least, the willingness of future use.
In a few words, the framework that is referred to at this point provides a basis to foster further the procedure of analyzing the outcomes of interviews/focus groups discussions and, in parallel conditions, the prompting questions such as ‘what did you like the most’ in a way that will encourage responses that address/include the abovementioned topics/areas (that also serve a codes). The theoretical scheme also will inform the structuring of these areas within the process of reaching conclusions and inferring meaningful suggestions as the intention of future use, for example, is shown to be the combined outcome of the other factors named above. In a nutshell, it is based on the UEQ approach and, moreover, draws on the framework developed by Hammady et al. [17] with regard to the open-ended questions in focus groups, thereby facilitating analysis, gaining pertinent insights, and reaching more informed conclusions.
Other XR-related publications/research were also investigated, e.g., the case of Gonz et al., [18] that use an adapted version of the Improved Museum Experience Scale (IMES), developed by Othman [19]. This Questionnaire focuses on investigating four areas:
- Engagement with the exhibit (in the case of [18], a painting)
- Knowledge/ Learning gained from understanding and information discoveries
- Meaningful Experience from the interaction with the painting
- Emotional Connection with the context and content of the painting
This helpful approach, although seemingly pertinent, was deemed to be both hinged on the affective and meaning-making potential of an artwork (main exhibit) and, therefore, incommensurate with the scope of an industrial heritage exhibition and contradictory to the UEQ that requires strict adherence to the exact set of questions in order to yield analyzable results.
Last but not least, another widely cited and used approach in XR-related experiences is that of the Slater-Usoh-Steed Questionnaire (SUS) developed by Usoh et al. [20]. This approach, according to [20] was developed over several studies by Slater and colleagues and most recently used in Slater et al. [21] and Usoh et al. [20]. This questionnaire is based on several questions that are all variations on one of three themes: the sense of being in the VE, the extent to which the VE becomes the dominant reality, and the extent to which the VE is remembered as a ‘place’. As this questionnaire focuses on the sense of space, it is deemed less helpful for our study. Furthermore, usability was measured using the System Usability Scale (SUS) [22], which is an accredited and widely used questionnaire for measuring system usability. This quite generic yet useful evaluation tool can help assess user acceptance of the system.
What transpires at this point is that while there is a profusion of quantitative evaluation methods specifically developed to capture aspects of the user experience in an immersive VE, there is a caveat about questionnaires that are designed to assess the complex interrelation of augmented reality apps within physical galleries and used in tandem with actual artefacts/exhibitions.
After due consideration, the core method employed in the evaluation process is a thorough, yet relatively succinct questionnaire that measures user experience (User Experience or UX) in relation to interactive digital interfaces; namely, the User Experience Questionnaire (UEQ) developed by Laugwitz et al. [11]. Apart from the fact that as a method aims to capture both objective and subjective aspects of user experience, it also distinguishes itself as a valuable and highly dependable tool that can streamline the analysis process given that it embeds specifically developed benchmarks and several checks and balances to avoid (statistical) inconsistencies, by filtering out diverging results through a complex mechanism. Compared to most of the pertinent questionnaires, its distinctive characteristic is that it measures user experience based on different scales which correspond to specific areas of interest, thus allowing for gaining more focused insights. The UEQ comprises 26 questions, divided into six (6) scales as follows:
- attractiveness,
- efficiency,
- perspicuity,
- dependability,
- stimulation,
- innovation.
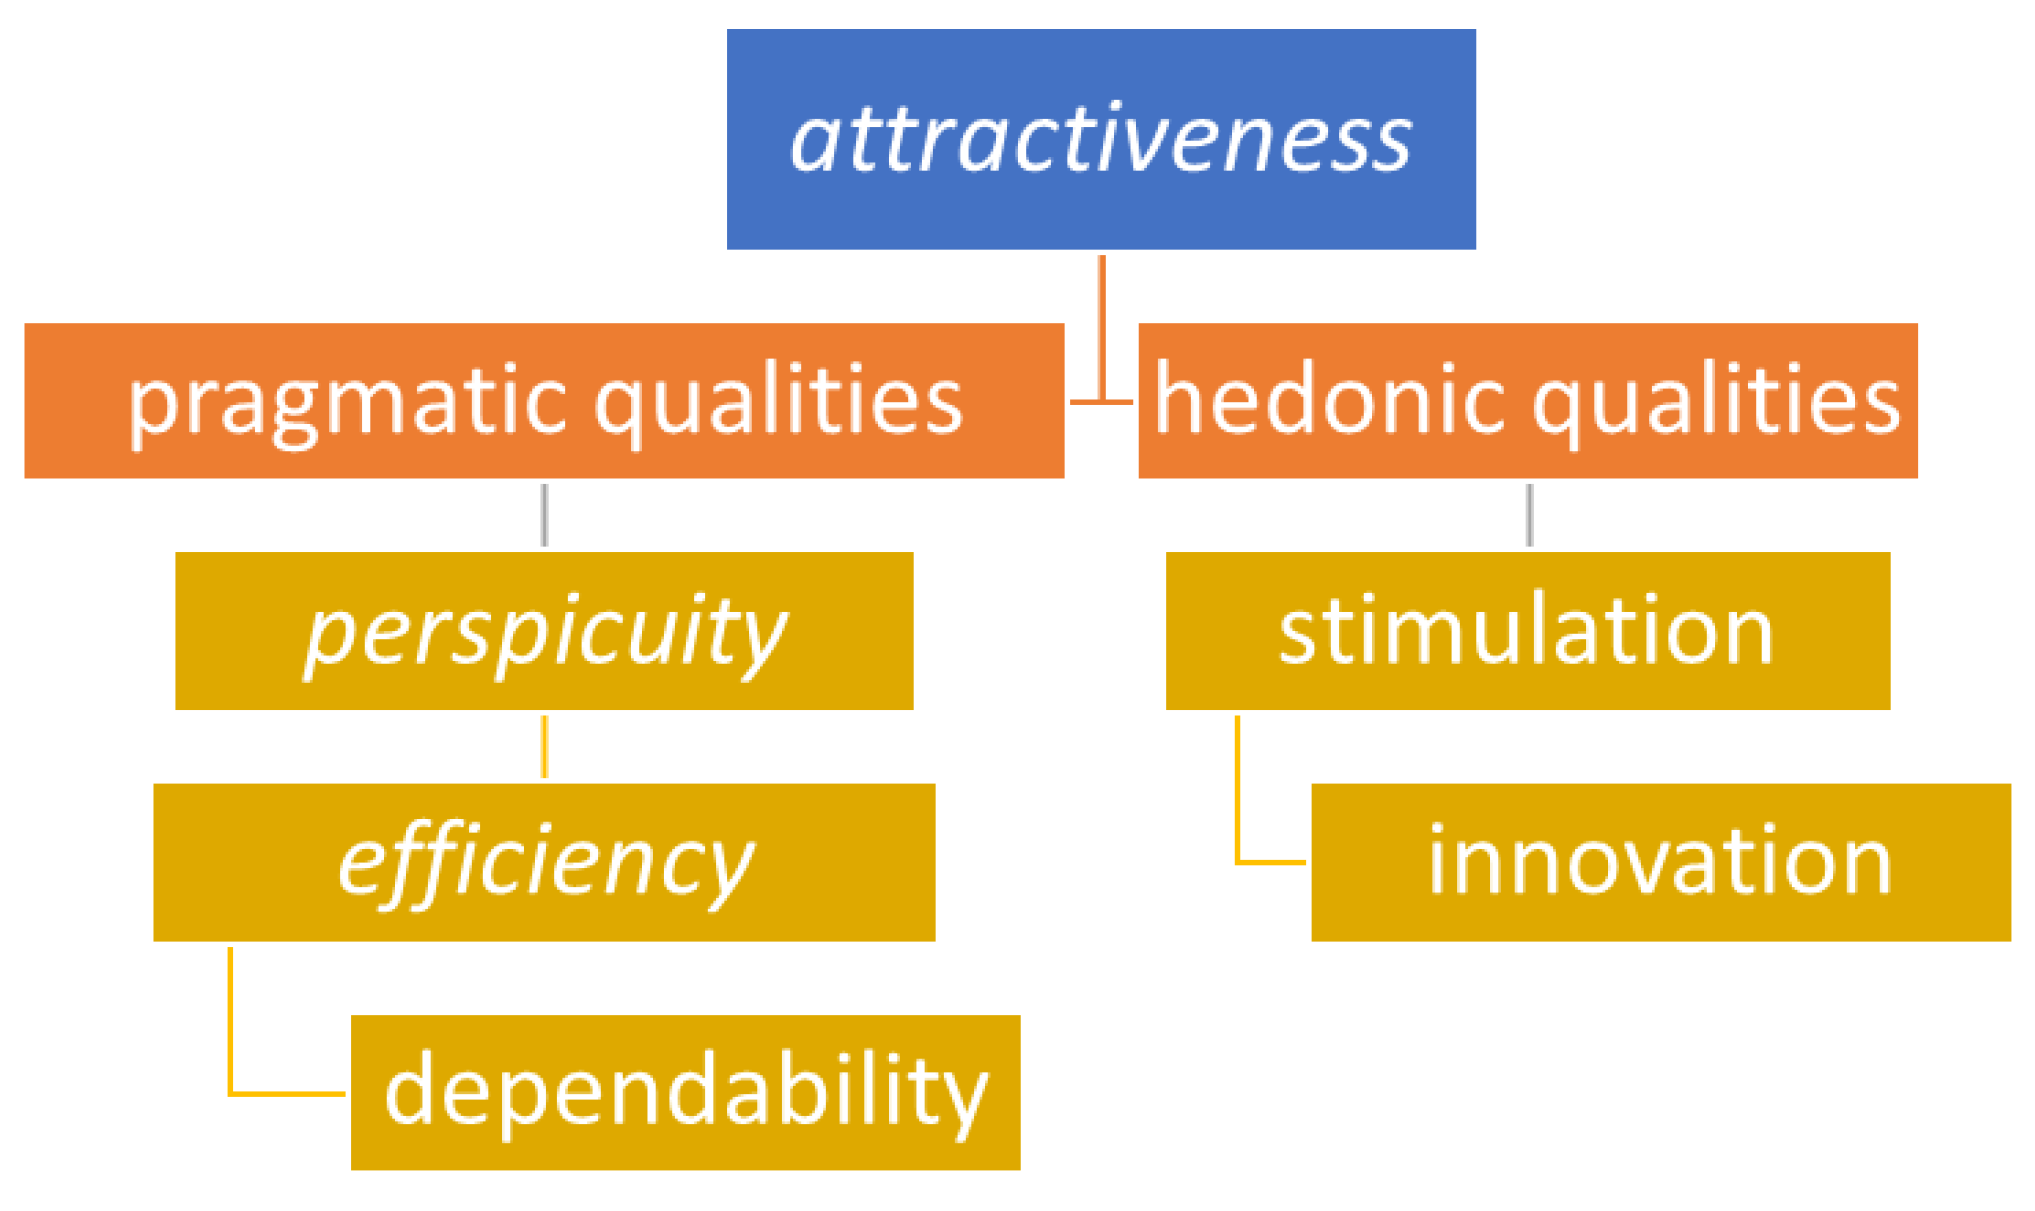
These scales belong to two broader fields: the first field concerns pragmatic or practical qualities (pragmatic qualities), which are related to efficiency (ease of use), perspicuity that, in fact, relates to the ease of getting used to the system, and dependability (degree of control). These, in broad terms, could be seen as objective aspects of the assessed application.
The second field concerns the so-called hedonic qualities. These, by and large, subjective qualities include the scale of stimulation, i.e., how exciting and motivating the use of the application is, and that of innovation, which concerns how creative, inventive and innovative the digital interaction environment is.
The two broad areas of pragmatic and subjective/hedonic qualities (the latter related to the satisfaction offered by an interactive environment) affect the overall degree of attractiveness, i.e., (a) the overall impression it leaves and (b) how much it is liked by users (attractiveness scale), which is mainly about how creative, inventive, and innovative the digital interaction environment is.
The creators of UEQ freely offer at the site manuals, related questionnaires, and spreadsheets for data analysis. In these excels, the response data input automatically produces results in relation to how the resulting average values are characterized (excellent, good, above, or below average, and poor) for each scale, based on special benchmarks that the researchers have developed [23]. This flexible method can be applied in different evaluation scenarios [24] and was seen as very appropriate and useful for the specific evaluation process described in this paper, given the existence of special benchmarks according to the area of use.
Figure 2.
Rendering of the scale structure of the UEQ.
A key strength of this method, apart from the fact that it distinguishes and incorporates pragmatic and so-called hedonic qualities, which are both crucial factors, especially for a heritage-related museum environment, is that UEQ produces, as mentioned, automatically a description of the ensuing results (based on benchmarks that accrue from hundreds of cases of UEQ employment). This will add to the validity and accuracy of the second phase results. The following Figure 3 (adapted from the UEQ handbook) provides a helpful overview of the correspondence between scales and questions.
Last but not least, the UEQ will be complemented by other methods, i.e., semi-structured interviews with visitors thereby gathering more in-depth qualitative data that can be used in tandem with the findings from questionnaires. More specifically we conducted a limited number of interviews with visitors who accepted the invitation to offer more details about their opinions verbally.
3. Materials and Methods
3.1. Apparatus and visual content
The process is rendered with a mixture of actual humans dressed as workers who were correlated with digitally produced representations of the specific machine, which could be described as follows: tomato juice boils in the cauldron (bolla) under a vacuum to condense and become a pulp. When the process is complete, the worker opens a valve, and the pellet falls into a cart below, as shown in the illustration below (Figure 4).
The ways in which modelling and producing the digital imagery strongly relate to the next and final stage in which a more thorough description of the AR employed is offered. The evaluated AR application focus is on illustrating how the pasteurisation-filling machine works (making visible its "invisible" parts) and, at the same time, involving visitors as users of a meaningful AR experience. Finally, the correlation between the natural-museum environment and the virtual environment of the application was carried out so that the virtual pasteurisation machine coincided with the real one. The following objectives were set for the implementation of the application concerning the thermal filling machine:
(a) basic overview of the elements that comprise the machine,
(b) indicative representation of the operation of the machine in successive stages,
(c) creation of an engaging scenario that motivates the user and indicates the essential required functions without complicating them with a large amount of mechanical information,
(d) configuring an easy-to-use and, at the same time, entertaining control interface,
(e) enrichment with moving elements and sound effects that arouse interest and facilitate the understanding of the subject, and
(f) configuration of the circular game process with reward elements on completion of steps. The virtual machine is presented on a tablet situated in situ so that the machine's virtual model is superimposed on the real/physical one. The workflow of the machine function (Figure 5) is as follows:
The following two screenshots (Figure 6) present various stages of the AR application with which visitors interact (for a detailed account of the AR app integration in this exhibition see Sylaiou at al. 2023 [26]). The AR app is on a pad mounted on a stable base in front of the specific exhibit. The black background in the actual imagery seen by users on site is ‘filled’ by the actual surroundings of the exhibits in the museum space.
It is a sequential, task-orientated, and interactive application that involves indicative sounds and movement that introduce the machine's primary function. This may indirectly engage them on a more personal level with the bygone era of this 19th industrial site by identifying to an extent with the people living and working back then in this location, as visitors will undertake their roles through interactive applications on the same site. As an overall comment, one additional element that is envisaged to add to the affective potential and the technologies' ability to engage visitors is the addition of digital narratives (dialogues of factory workers), bringing to life aspects of how it was to work in this industry.
Moreover, storytelling, as well as AR visualizations of the production line and workers’ duties, are based on a mixture of different technologies, devices, and degrees of interactivity as if they form an analogy to the differing stages of labor in the factory, which correspond to specific types and conditions of work. Different production stages and machinery invited differing approaches, i.e., AR was deemed more appropriate for rendering otherwise unseeable parts and process, as they were concealed in large machines, as opposed to, e.g., the selection/washing process that lends itself as an opportunity to offer narrations through workers’ dialogues.
3.2. Participants
One hundred and one (121) Participants filled out the User Experience Questionnaires (UEQ) described above, after their visit in the D. Nomikos Museum. They were both from Greece and abroad and there was a gender balance amongst the responders as the numbers were almost equal (63 men, 58 women). Participants were, for the most part, tourists, mainly from Europe and the US, as the evaluation took place within the summer period. Moreover, five (5) interviews took place with thirteen (13) responders (three pairs, one group of three people and one of four). Gender balance was observed in this case as well and the participants were seven (7) men and six (6) women, mainly from abroad (eleven tourists/ foreigners and two Greeks). Interviewees for the most part declared that they had prior experience in pertinent XR applications (e.g., in culture/heritage sites).
3.3. Experimental procedure
The participants were informed about the evaluation process/research and were kindly invited to participate. They were handed the UEQs immediately after completing their museum visit, which included a combination of the audio tour and, most importantly, XR application on tablets that were mounted on tripods in front of the most salient exhibit (selected machine that was the most prominent and crucial in the production line).
Participants that agreed to be interviewed after being informed about the assessment procedure were guided to a specific space where the semi-structured interviews were held. They were asked about their overall experience in the museum, as well as encouraged to make comments about possible ways to improve aspects of the design of the exhibition with emphasis on the employment of XR technology. Lastly, interviewees were asked about their prior experience in pertinent application, especially in similar settings. The interviews lasted about seven to twelve minutes, depending on the number of responders as well as the length of the answers.
3.4. Research questions
The main research questions can be summarized as follows: (1) How effective is the inclusion of XR technology for audience engagements with artefacts and contextual information? (2) What is the added value that XR technologies offer to the user experience and what improvements can be made in this respect? In order to address these questions, we employed an innovative method in terms of its ability to provide accurate and dependable results with the use of specific benchmarks, namely the User Experience Questionnaire (UEQ). The first question is addressed by the responses to the questionnaires, while the second is mainly through the interviews and the correlation of the findings from the two methods.
4. Results
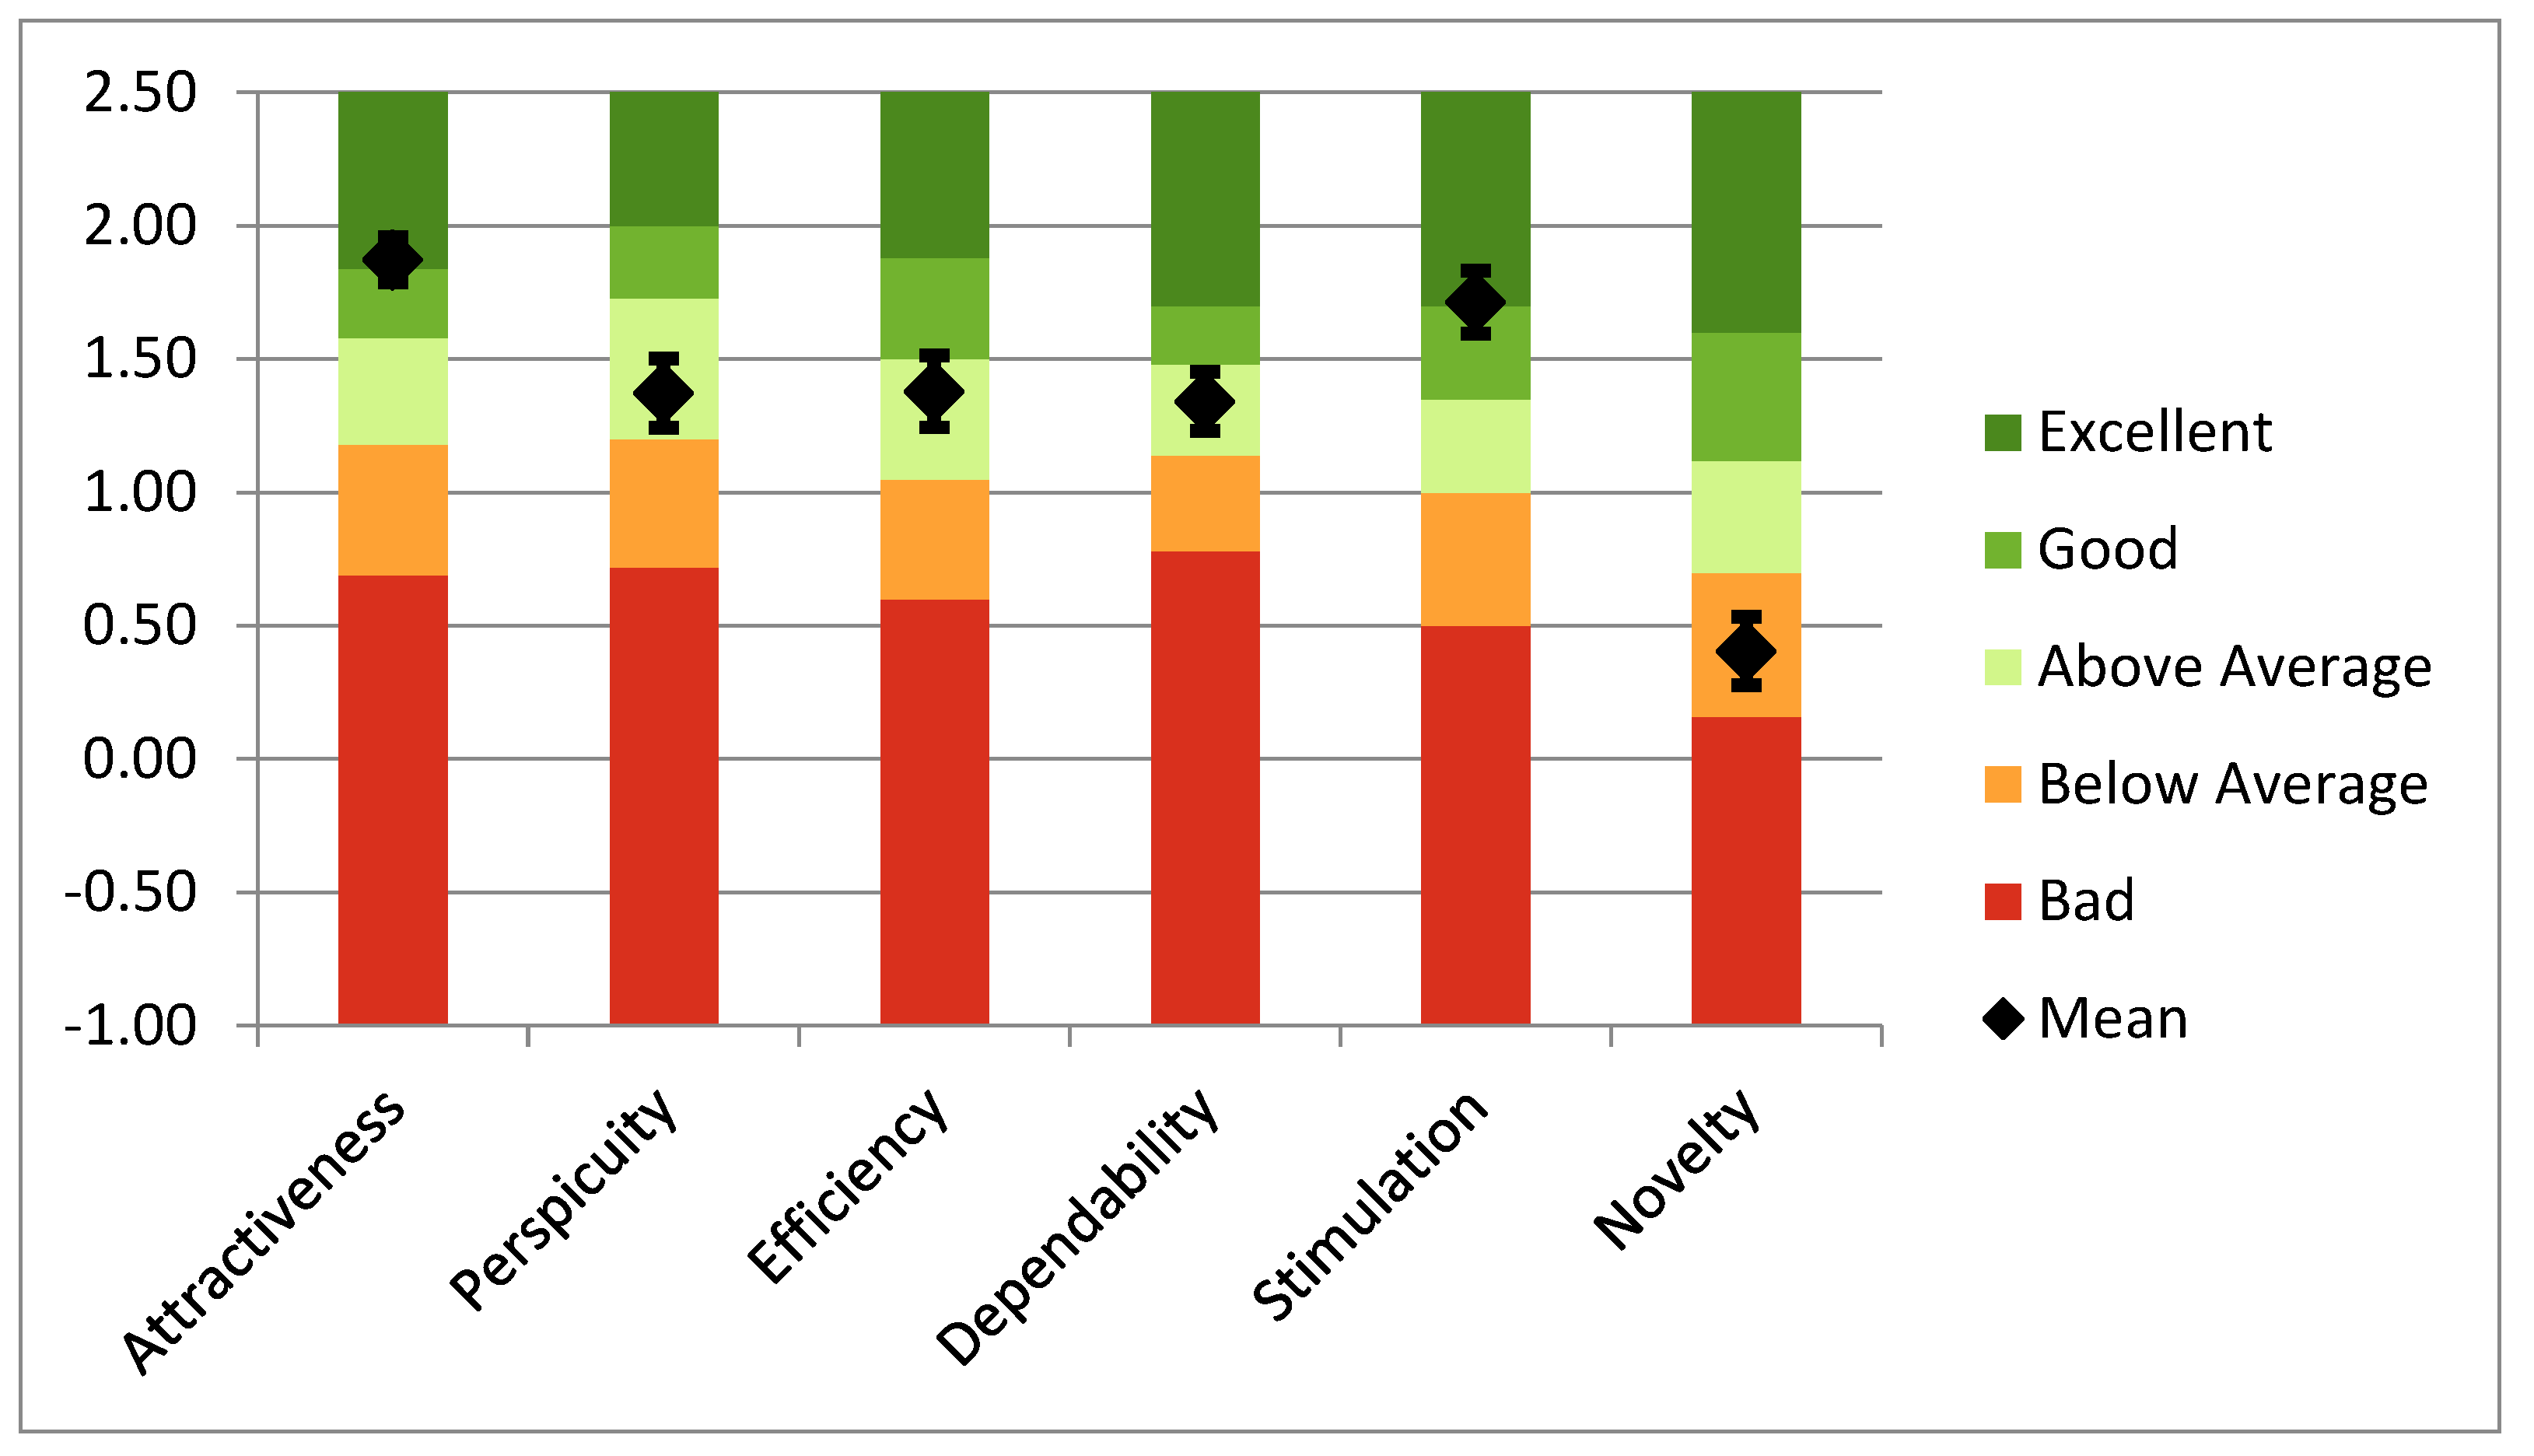
The findings, as the chart below illustrates, offer an overview of the actual results from a number of one hundred twenty-one (121) participants in relation to given benchmarks. The initial findings indicate that overall attractiveness and stimulation were (marginally) above the ‘excellent’ benchmark, Perspicuity, Efficiency and Dependability (the three constituent scales of the Pragmatic Qualities) were well above average, while the Novelty scale was conversely, well below the average mark.
Figure 7.
Results in relation to UEQ benchmarks.
The following Table 1 provides the actual numeric values of the findings along with a brief description of the classification of results (‘Interpretation’) in terms of where the outcomes stand in relation to the existing pool of assessments registered by the UEQ authors.
The following Table 1 provides the actual numeric values of the findings along with a brief description of the classification of results (‘Interpretation’) in terms of where the outcomes stand in relation to the existing pool of assessments registered by the UEQ authors.
What can be seen immediately is that while the evaluation showed that the application(s) embedded in the exhibition were accepted almost with enthusiasm in relation to their attractiveness and ability to stimulate, the pragmatic qualities (i.e., perspicuity, efficiency, dependability) faired reasonably well, and above average. At the same time, the scale of innovation received some more reserved assessment. In other words, attractiveness, which is seen as the most salient and important metric, received excellent evaluation responses, the pragmatic aspect went very well, and the hedonic qualities appear to receive (and yield) widely diverging results. Hedonic qualities, which are quite key for a culture/heritage related user experience, appear to split into a very high acceptance in relation to Stimulation, and a mediocre one, in relation to Novelty/Innovation.
Upon closer inspection, the scale of Novelty/ Innovation is comprised of a set of four questions (in fact pairs of opposites) that dictate the overall result (shown in the graph/chart below in gold-ochre colour). One immediately notices that the very last of the questions (and one of four constitutive questions for the specific scale) have yielded considerably (and to an extent surprisingly) negative results. In fact, this is the only question from the entire questionnaire in which responders (heavily) gravitated toward the negative end of the spectrum.
Figure 8.
Mean value per item.
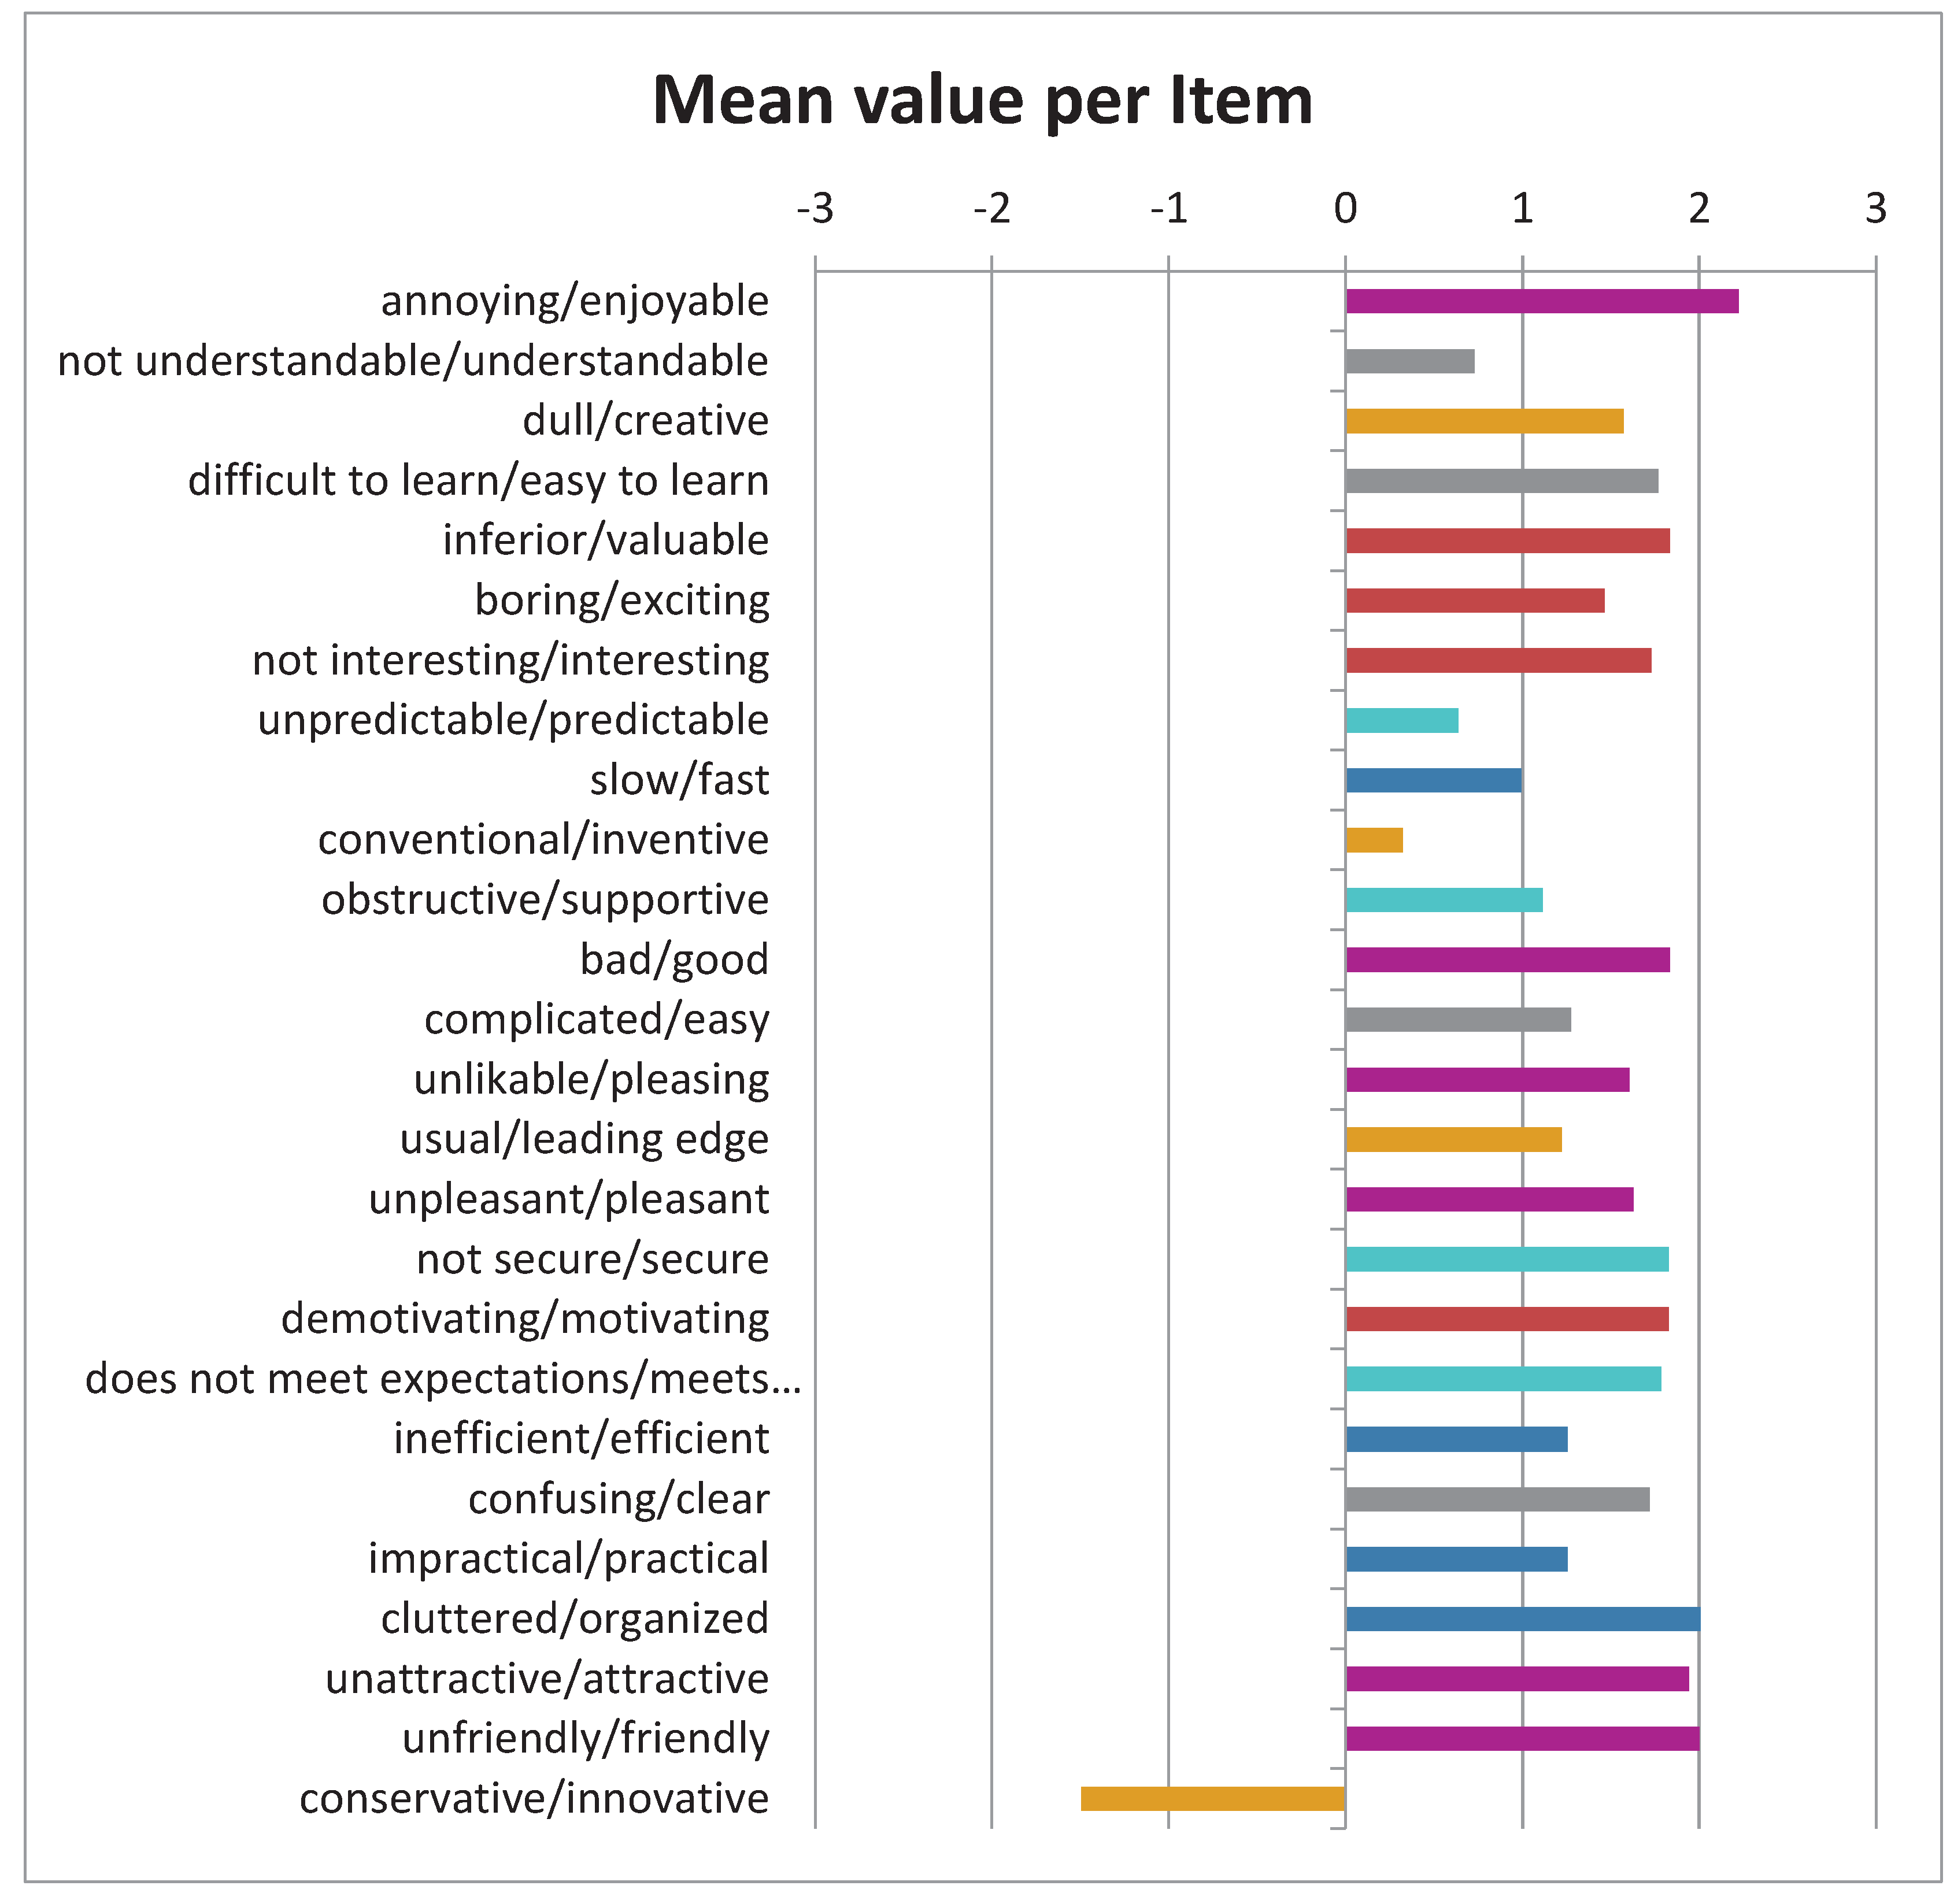
While the fact that another question (in the middle part of the chart), namely the one regarding ‘conventional/inventive’ binary opposites, is towards the middle point (and thus contributes to the overall mediocre level of the evaluation in relation to this scale), corroborates the rather low acceptance of the application(s) in this respect, another two questions yielded positive responses, albeit they regarded fairly similar aspects. We investigated possible statistical inconsistencies and thereby filtered out about 10 percent of the responses in accordance with the proposed guidelines, but the results remained virtually the same (thus, we deemed it unnecessary to add these charts as well as they would clutter the article with unwarranted visuals/charts that diverge insignificantly.
6. Discussion and conclusions
6.1. Analysis and discussion of quantitative findings
The fact that most responders deemed the employment of application(s) conservative rather than innovative according to their selection in the provided Likert scale may be regarded not as an indictment in relation to the technology or the format of the application (as backward) but rather as a sense that the actual content of the repetitive visuals and the rendering of the human actors and machinery function were rather conservative in their approach, perhaps not offering any novel representational visualization, and remaining in the safe zone of a generic and conventional depiction. This reading of the finding is bolstered by the abovementioned ‘conventional/inventive’, which gave mediocre results not unlike the ‘unpredictable/predictable’ pair that, albeit it belongs to a different scale, and regards the Dependability (e.g., User friendliness) of the system, it could well be interpreted by responders as a question that relates to the overall feel of the application in terms of how surprising it may be judged from the discrepancy with the other three questions of the specific scale.
However, there is a more humble and pragmatic possibility that may have well influenced this seeming abnormality in the results: the very last question was preceded by a number of questions that presented on the right-hand side of the questionnaire the negative answer, while the last item of the questionnaire had the positive answer in the same column. A fatigue related factor may have been a contributing element in swaying this very last UEQ item so heavily in the negative side. In any case, novelty has not been a strong point of the usage of new technologies, which while it appears almost an irony on closer inspection this fact reveals that nowadays ubiquitous extended reality applications need to invest in more inventive and innovative approaches as in their own right cannot guarantee either a surprise element or a fascination that translates into engagement solely on the grounds of their (hitherto perceived as) cutting edge technologies. In fact, the rapid encroachment of emerging technologies in all aspects of everyday lives, especially with regard to the younger generations, means that more should be done in order to eschew the label of conservative; the focus is on how media and resources are depicted within the framework of new technologies, that are increasingly perceived as mainstream, rather than expecting a positive reaction by virtue of simply employing emerging technologies that as things stands as rather established and thus part of the new normal already. This being said, in a cultural heritage site that regards industrial production lines of a bygone era, a conservative feel about how processes are represented and depicted, as well as how information is communicated, might not be out of place, especially if one takes into consideration that the tablets and corresponding applications were deployed in front and thus in conjunction with that actual old machinery. Therefore, a futuristic or unconventional representational approach might have been anywhere from unfitting to obtrusive or distracting, bearing in mind the fact that the actual exhibits should remain the protagonists of the museum visitor overall experience, and drawing too much attention could have been almost a counterproductive factor.
The greatest anomaly in terms of the results is, in fact, the coexistence of excellent responses in terms of attractiveness and stimulation that are not exceptionally bolstered by the pragmatic, useability-related underpinnings of the application(s), at the same time that novelty was deemed leaving a lot to be desired, at the first look. It may well be that bearing in mind this discrepancy and seeming inconsistency (or at least paradox), one may infer that the degree of novelty/innovation in the specific exhibition was not a yardstick, or a necessary condition, a sine qua non, for delivering a stimulating, and gratifying experience, as to put it simply, if novelty was a decisive factor, stimulation and attractiveness in the given museum context would have been affected (if not plunged) as well. However, on the flip side, it also appears that the overall positive reception of the exhibition museological design and concept behind the integration of XR, could have benefited if more groundbreaking or at least, daring approaches had been adopted, but as said, the broad picture is one of a very good reception. The findings indicate that in the era of new technological innovations, to be truly a step ahead necessitates risk-taking and the adoption of a more unconventional approach in relation to the contents and representational conventions in the multimodal resources that frame and foster user experience in the museums today, and in the foreseeable future.
6.2. Qualitative data input and conclusions
The above discussion may appear gravitating a tad too much towards deciphering a specific divergence from the canon of a positive evaluation result. However, in reality, it is an effort to use findings in their richness and apparent incongruities as valuable data from which to infer broader lessons for future research as well as practice-related directions. In this respect, the interviews held were also illuminating as the five sets of responders (in pairs or in small groups of three or four) underlined the positive impact of a combination of augmented reality, narratives and resources provided, which all jointly elevated the perceived experience and degree of engagement. One common theme was the mentioning of interactivity and enhancement of the experience through fostering understanding of factual procedure-related elements of the production line and corresponding machines, as well as the increased empathy with a rural community that was closely knitted with the local factory (mainly through the embedded narratives). So, the positive impact on visitors engagement pivoted around the enhanced ability to relate to the human factor and the workers, and on the other hand, with making more accessible the otherwise alien and strange machinery exhibited by visualizing the internal processing functions that are not possible to perceive without multimodal resources that support visitors so that they can grasp what the exhibits’ role was in the manufacturing process. Several comments about possible improvements gravitated around an increase in the number of machines covered by the augmented reality application, and enhanced visualization of additional processes so that a more comprehensive understanding of the procedure could be gained.
Moreover, the issues of rendering more aptly the scale of business, intensity and volume of the labour as well as actual produce were deemed as an area for improvement, something that is characteristic of the fact that most comments about possible improvements address the rather limited amount of XR/AR employment in relation to the number of exhibits, the extend of functions describes/rendered and in one instance the amount of guidance provided to users, e.g., through special markings on the floor that may improve visitors orientation and position with a view to maximizing the impact of the existing resources provided. Therefore, the responders, who, for the most part, had considerable prior experience from pertinent museum applications, were overall positive about the employment of technologies in the specific exhibition and the improvements had more to do with amplifying what they deemed a rather reticent employment of applications/digital resources. This, in conjunction with the UEQ results, appears to suggest that a bolder approach, both in terms of scope, scale as well as content and representational conventions, would further foster the user experience and the ability of the museum to engage meaningfully an increasingly demanding, and new media savvy audience. Last but not least, this evaluation-related paper shows that there is ample scope in developing more specific quantitative, questionnaire-based methods that can evaluate in a more nuanced way the intricacies of combining Augmented Reality with physical exhibits in situ, something that can inspire future research that can focus on developing tailor-made and adapted methods that will be more pertinent to uses of XR within brick-and-mortar museum spaces.
Author Contributions
Conceptualization, S.S., P.D. and C.F.; methodology, S.S., P.D. and C.F.; validation, S.S., P.D. and C.F.; formal analysis, S.S. and C.F.; investigation, E.V. and V.N.; resources, S.S., P.D. and C.F.; data collection, E.V. and V.N.; writing—original draft preparation, S.S., P.D. and C.F.; writing—review and editing, S.S., P.D. and C.F.; visualization, S.S., P.D. and C.F.; supervision, C.F.; project administration, C.F.; funding acquisition, C.F. All authors have read and agreed to the published version of the manuscript.
Funding
This research has been co-financed by the European Regional Development Fund of the European Union and Greek national funds through the Operational Program Competitiveness, Entrepreneurship and Innovation, under the call RESEARCH – CREATE – INNOVATE [project code: T2EDK-01392].
References
- Sylaiou, S.; Dafiotis, P. Storytelling in Virtual Museums: Engaging a Multitude of Voices. In Visual Computing for Cultural Heritage. Springer International Publishing, 2020, pp. 369–388. [CrossRef]
- Margetis, G.; Apostolakis, K.C.; Ntoa, S.; Papagiannakis, G.; Stephanidis, C. XReality Museums: Unifying the Virtual and Real World Towards Realistic Virtual Museums. Applied Sciences 2021, 11, 338. [Google Scholar] [CrossRef]
- Partarakis, N.; Zabulis, X.; Foukarakis, M.; Moutsaki, M.; Zidianakis, E.; Patakos, A.; Adami, I.; Kaplanidi, D.; Ringas, C.; Tasiopoulou, E. Supporting Sign Language Narrations in the Museum. Heritage 2022, 5, 1–20. [Google Scholar] [CrossRef]
- Sylaiou, S.; Fidas, C. Supporting People with Visual Impairments in Cultural Heritage: Survey and Future Research Directions. Int. J. of Human–Computer Interaction 2022, 1–16. [CrossRef]
- Karuzaki, E.; Partarakis, N.; Patsiouras, N.; Zidianakis, E.; Katzourakis, A.; Pattakos, A.; Kaplanidi, D.; Baka, E.; Cadi, N.; Magnenat-Thalmann, N.; et al. Realistic Virtual Humans for Cultural Heritage Applications. Heritage 2021, 4, 4148–4171. [Google Scholar] [CrossRef]
- Gkiti, C.; Varia, E.; Zikoudi, C.; Kirmanidou, A.; Kyriakati, I.; Vosinakis, S.; Gavalas, D.; Stavrakis, M.; Koutsabasis, P. (2018). i-Wall: A Low-Cost Interactive Wall for Enhancing Visitor Experience and Promoting Industrial Heritage in Museums. In Digital Heritage. Progress in Cultural Heritage: Documentation, Preservation, and Protection, pp. 90–100. Springer International Publishing. [CrossRef]
- Brooke, J. SUS-A quick and dirty usability scale. In Usability Evaluation in Industry; Jordan, P.W., Thomas, B., Weerdmeester, B.A., McClelland, I.L., Eds.; 1996; pp. 189–194. [Google Scholar]
- Usoh, M.; Catena, E.; Arman, S.; Slater, M. Using Presence Questionnaires in Reality. Presence: Teleoperators and Virtual Environments. 2000, 9. [CrossRef]
- Lee, K. M. Presence, Explicated. Communication Theory 2004, 14, 27–50. [Google Scholar] [CrossRef]
- Witmer, B.G.; Singer, M.J. Measuring presence in virtual environments: A presence questionnaire. Presence: Teleoperators and Virtual Environments 1998, 7(3), 225-240. The factor structure of the Presence Questionnaire. Presence, 14(3) 298-312.
- Laugwitz, B.; Schrepp, M.; Held, T. Construction and evaluation of a user experience questionnaire. In: Holzinger, A. (Ed.): HCI and Usability for Education and Work, 4th Symposium of the Workgroup Human-Computer Interaction and Usability Engineering of the Austrian Computer Society, USAB 2008, LNCS 5298, pp. 63-76.
- Schwind, V.; Knierim, P.; Haas, N.; Henze, N. Using Presence Questionnaires in Virtual Reality. In Proceedings of the 2019 CHI Conference on Human Factors in Computing Systems - CHI 2019. [CrossRef]
- Grassini, S.; Laumann, K. Questionnaire Measures and Physiological Correlates of Presence: A Systematic Review. Frontiers in Psychology 2020, 11. [Google Scholar] [CrossRef] [PubMed]
- Schubert, T.; Friedmann, F.; Regenbrecht, H. The Experience of presence: factor analytic insights. Presence Teleop. Virtual Environ. 2001, 10, 266–281. [Google Scholar] [CrossRef]
- Vorderer, P.; Hartmann, T.; Klimmt, C. Explaining the enjoyment of playing video games: the role of competition. In Proceedings of the Second International Conference on Entertainment Computing 2003, Pittsburgh, PA: Carnegie Mellon University, 1–9.
- Makransky, G.; Lilleholt, L.; Aaby, A. Development and validation of the Multimodal Presence Scale for virtual reality environments: A confirmatory factor analysis and item response theory approach. Computers in Human Behavior 2017, 72, 276–285. [Google Scholar] [CrossRef]
- Hammady, R.; Ma, M.; AL-Kalha, Z.; Strathearn, C. A framework for constructing and evaluating the role of MR as a holographic virtual guide in museums. Virtual Reality 2021. [Google Scholar] [CrossRef]
- Gong, Z.; Wang, R.; Xia, G. Augmented Reality (AR) as a Tool for Engaging Museum Experience: A Case Study on Chinese Art Pieces. Digital. 2022, 2, 33–45. [Google Scholar] [CrossRef]
- Othman, M.K. (Measuring Visitors’ Experiences with Mobile Guide Technology in Cultural Spaces. Ph.D. Thesis, University of York, York, UK, 2012. [Google Scholar]
- Usoh, M.; Catena, E.; Arman, S.; Slater, M. Using Presence Questionnaires in Reality. Presence: Teleoperators and Virtual Environments 2000. 9. [CrossRef]
- Slater, M.; Steed, A.; McCarthy, J.; Maringelli, F. The influence of body movement on subjective presence in virtual environments. Human Factors 1998, 40, 469–477. [Google Scholar] [CrossRef] [PubMed]
- Brooke, J. SUS-A quick and dirty usability scale. In Usability Evaluation in Industry; Jordan, P.W., Thomas, B., Weerdmeester, B.A., McClelland, I.L., Eds.; 1996; pp. 189–194. [Google Scholar]
- Schrepp, M.; Hinderks, A.; Thomaschewski, J. Construction of a Benchmark for the User Experience Questionnaire (UEQ). Int. J. of Interactive Multimedia and Artificial Intelligence 2017, 4, 40. [Google Scholar] [CrossRef]
- Schrepp, M.; Hinderks, A.; Thomaschewski, J. Applying the User Experience Questionnaire (UEQ) in Different Evaluation Scenarios. In: Marcus, A. (Ed.): Design, User Experience, and Usability. Theories, Methods, and Tools for Designing the User Experience. Lecture Notes in Computer Science, 2014, Volume 8517, pp. 383-392, Springer International Publishing.
- Sylaiou, S.; Gkagka, E.; Fidas, C.; Vlachou, E.; Lampropoulos, G.; Plytas, A.; Nomikou, V. Use of XR technologies for fostering visitors’ experience and inclusion at industrial museums. In Proceedings of the 2nd International Conference of the ACM Greek SIGCHI Chapter. CHIGREECE 2023: 2nd International Conference of the ACM Greek SIGCHI Chapter. ACM. [CrossRef]
Figure 1.
Likert scale in Presence Questionnaire.
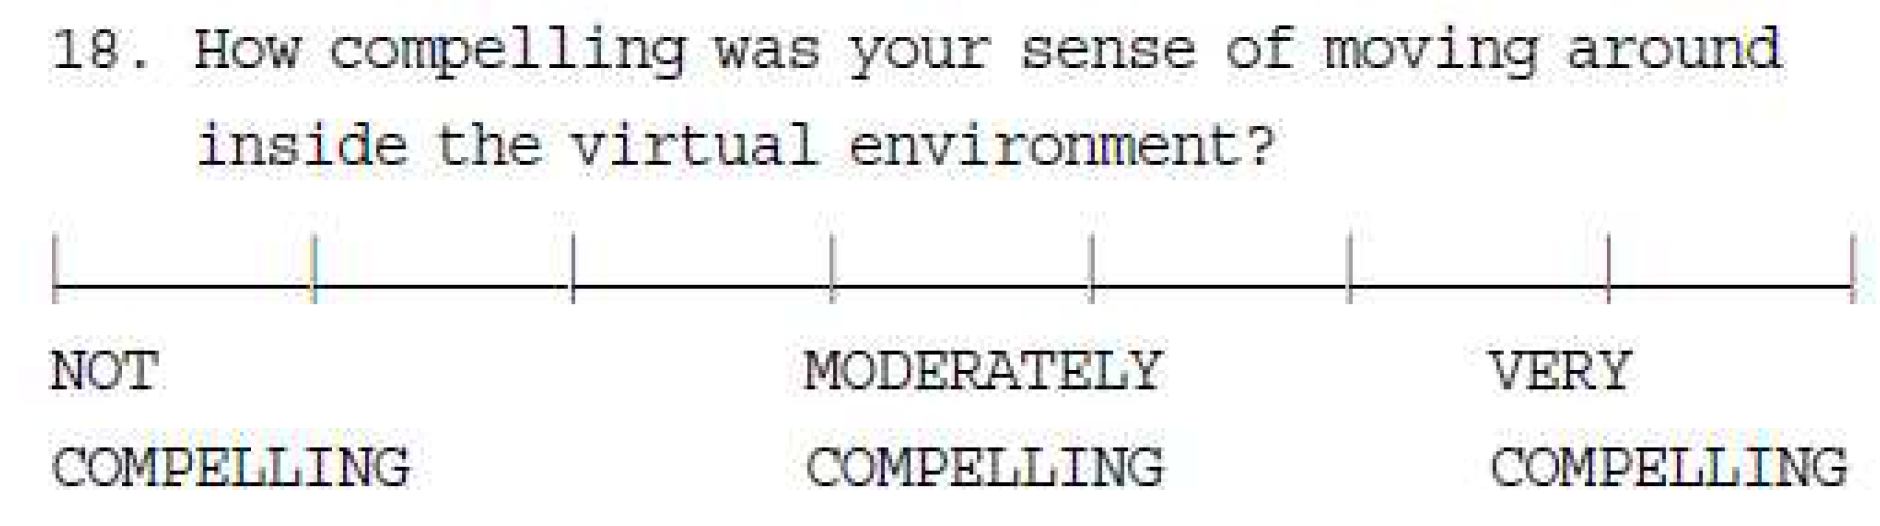
Figure 3.
Overview of the correspondence between scales and questions.
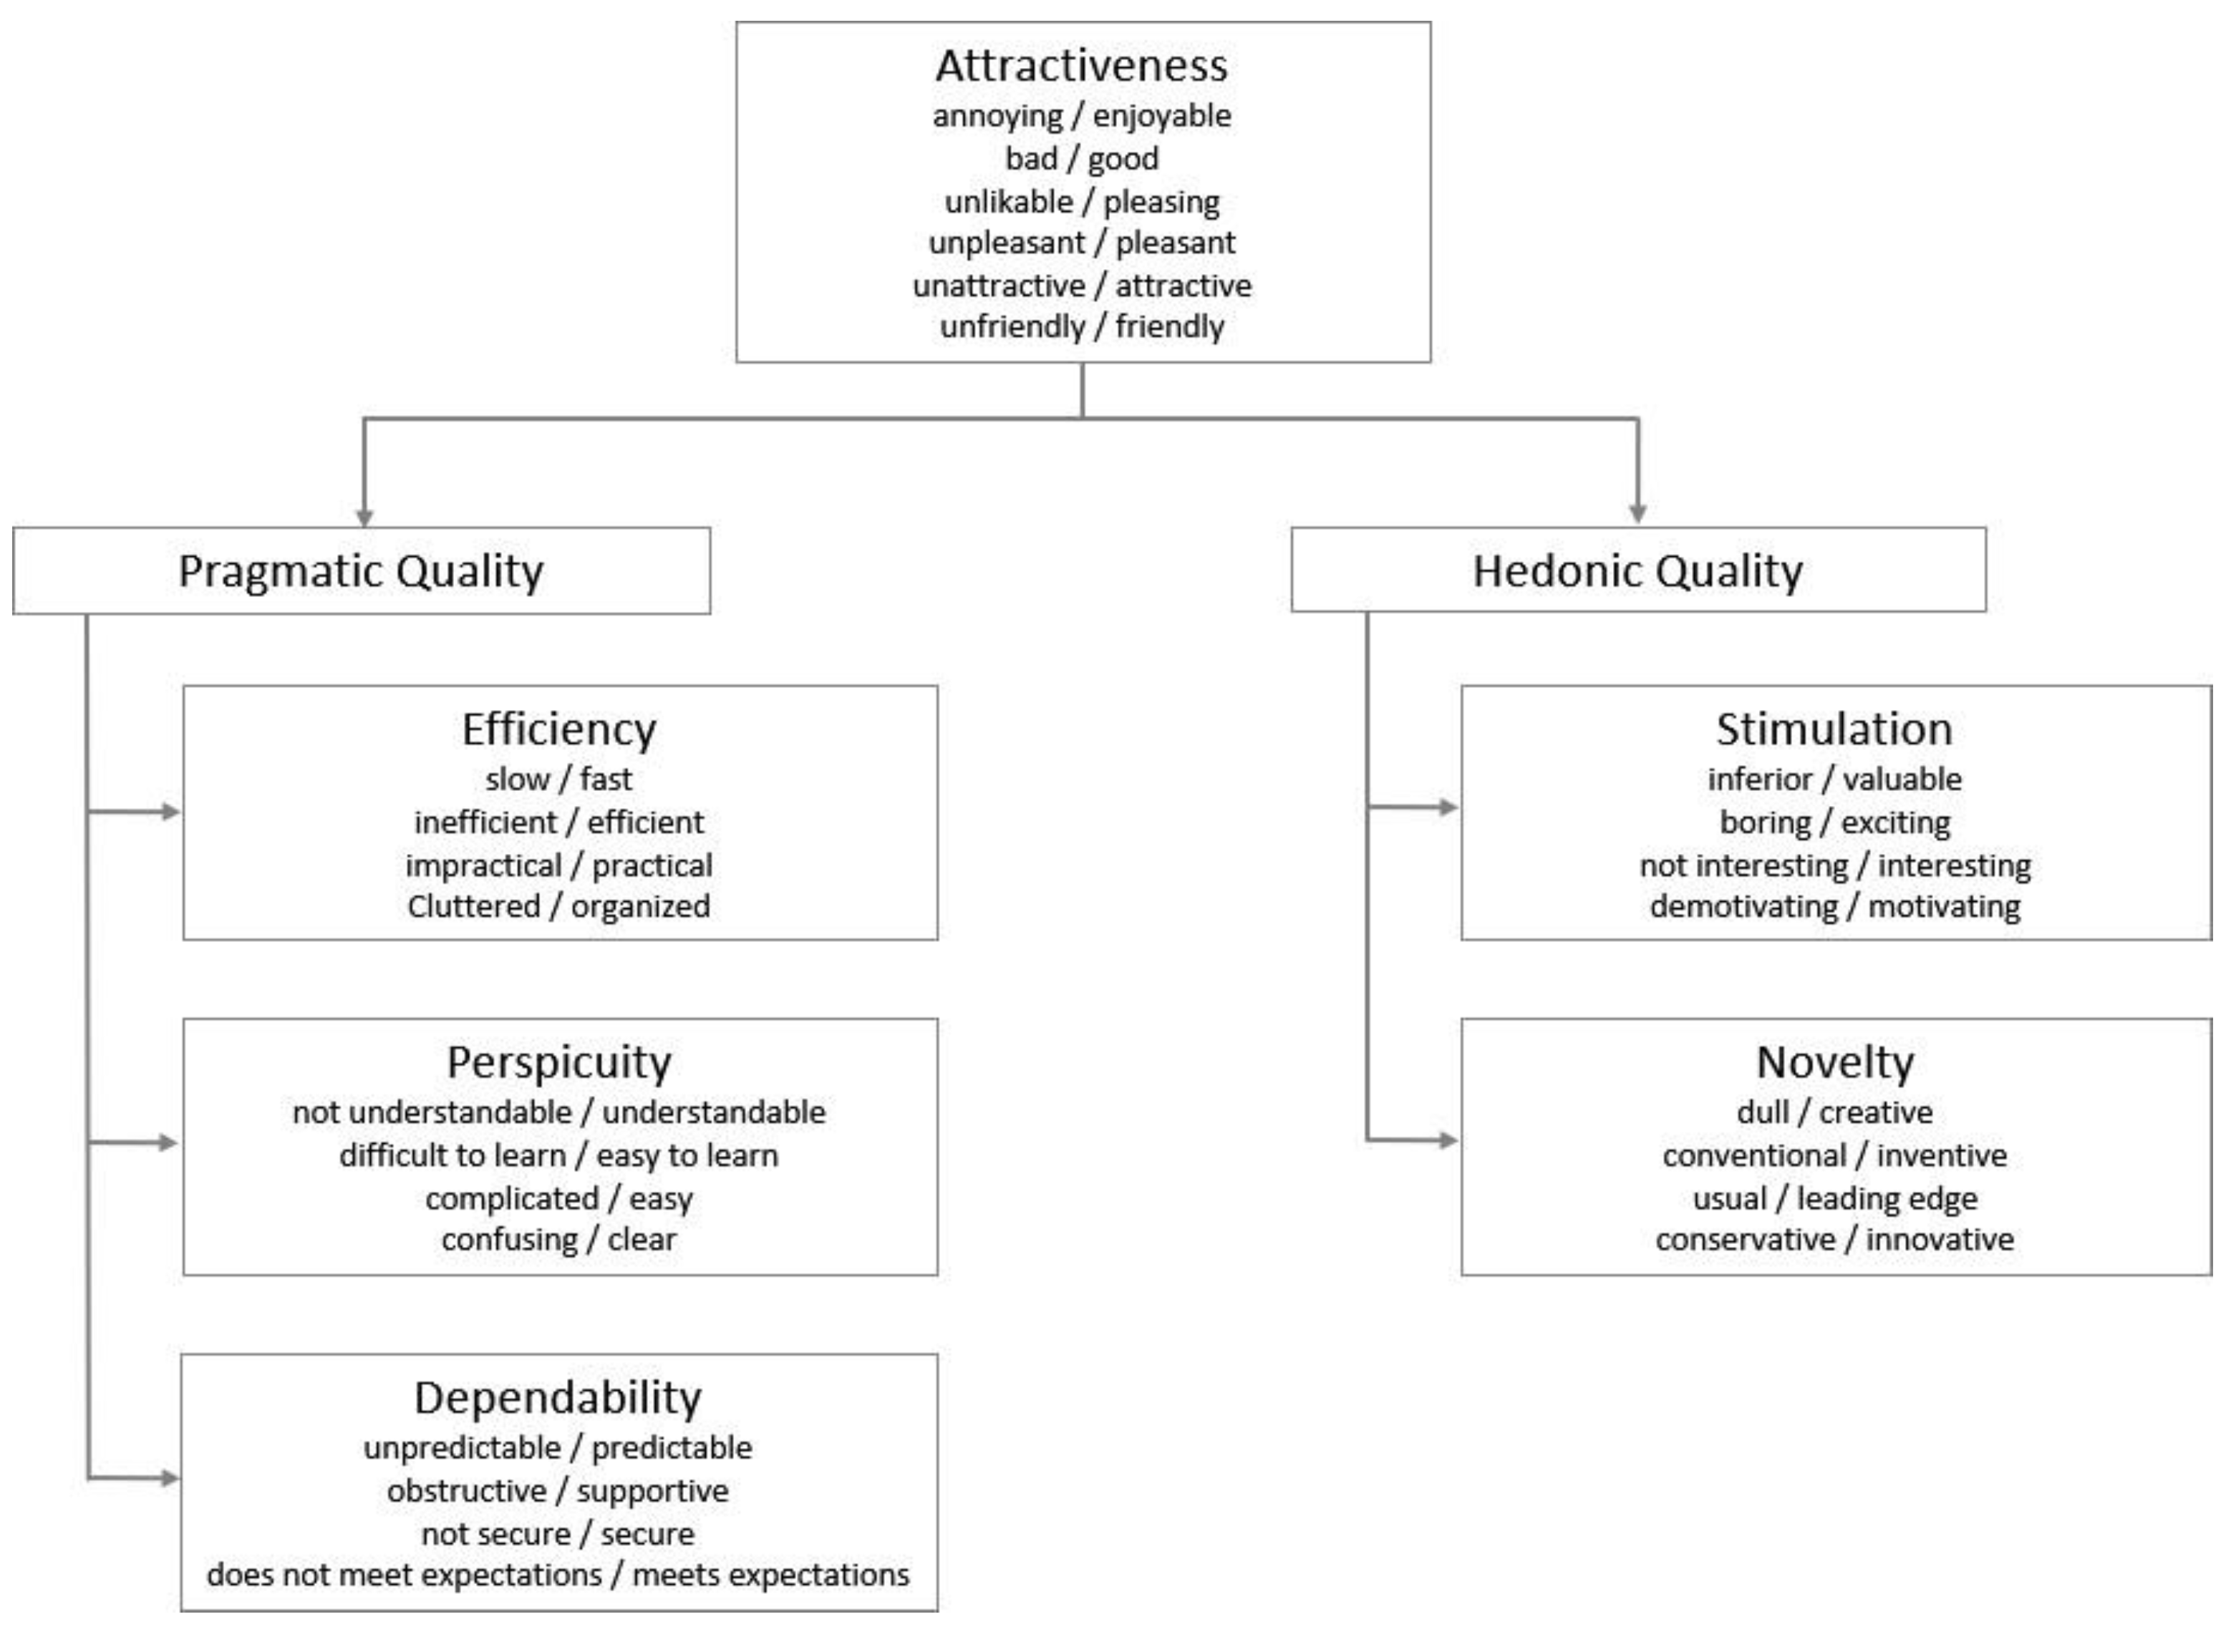
Figure 4.
The worker opens a valve, and the pellet falls into a cart.
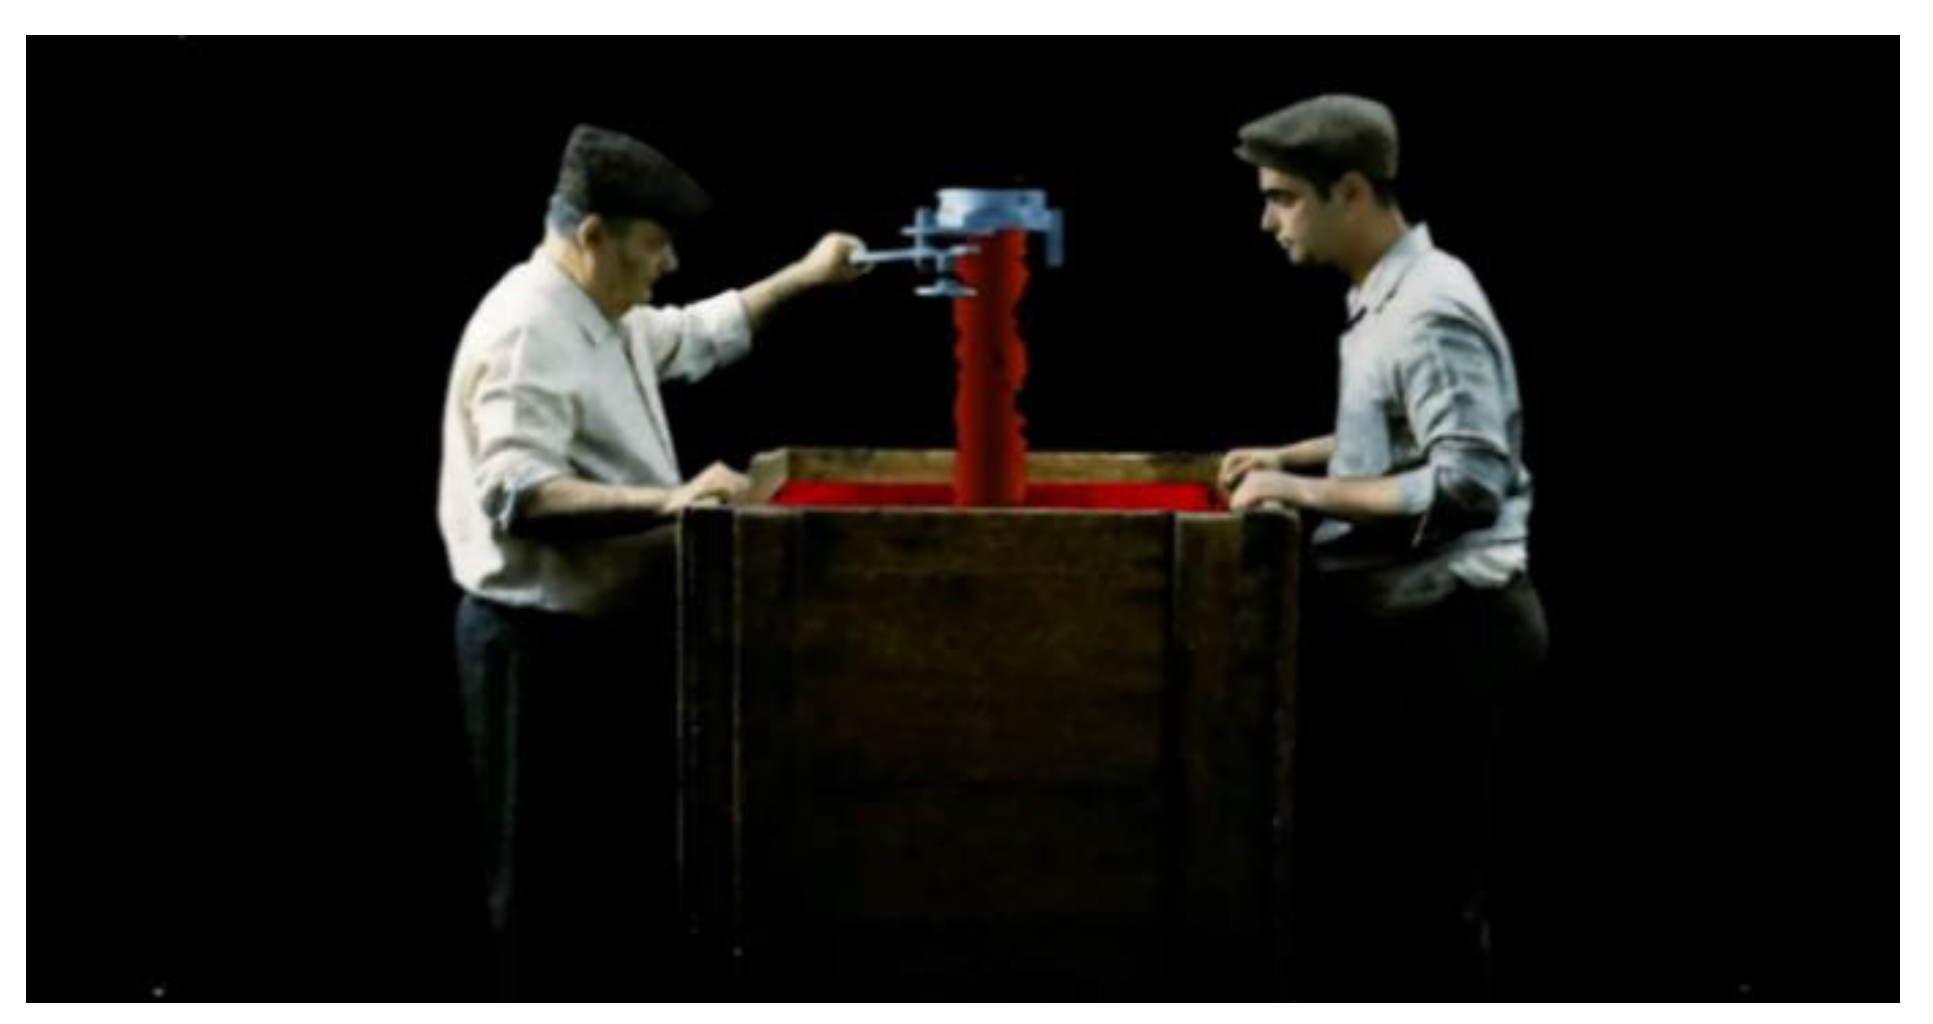
Figure 5.
Function of the pasteurization-filling machine.
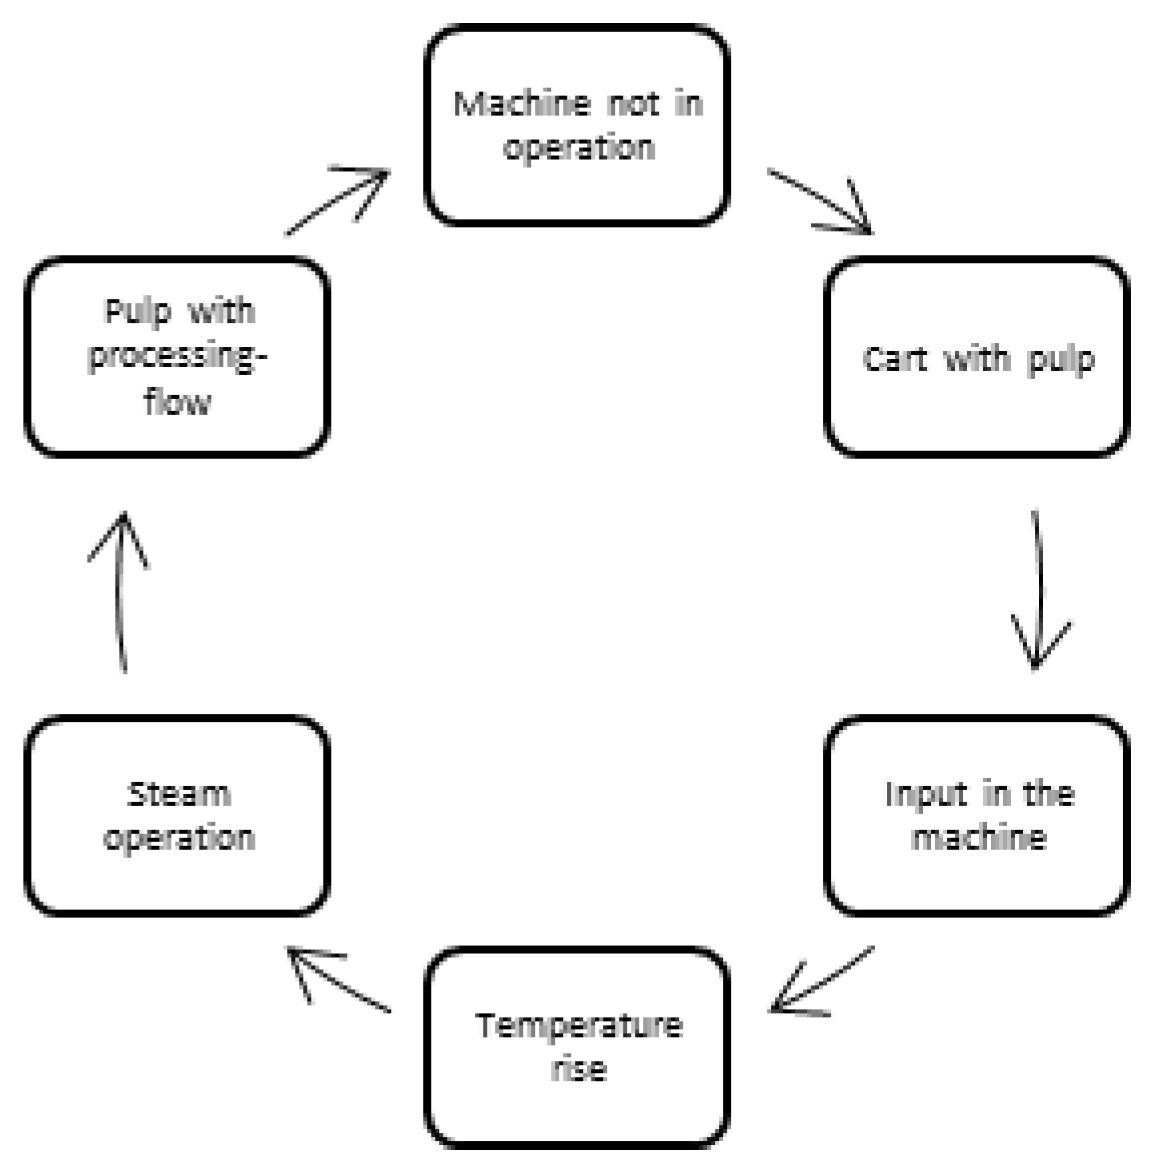
Figure 6.
(a) Steam flows through the machine and (b) Tomatopaste flow through the filling nozzles.
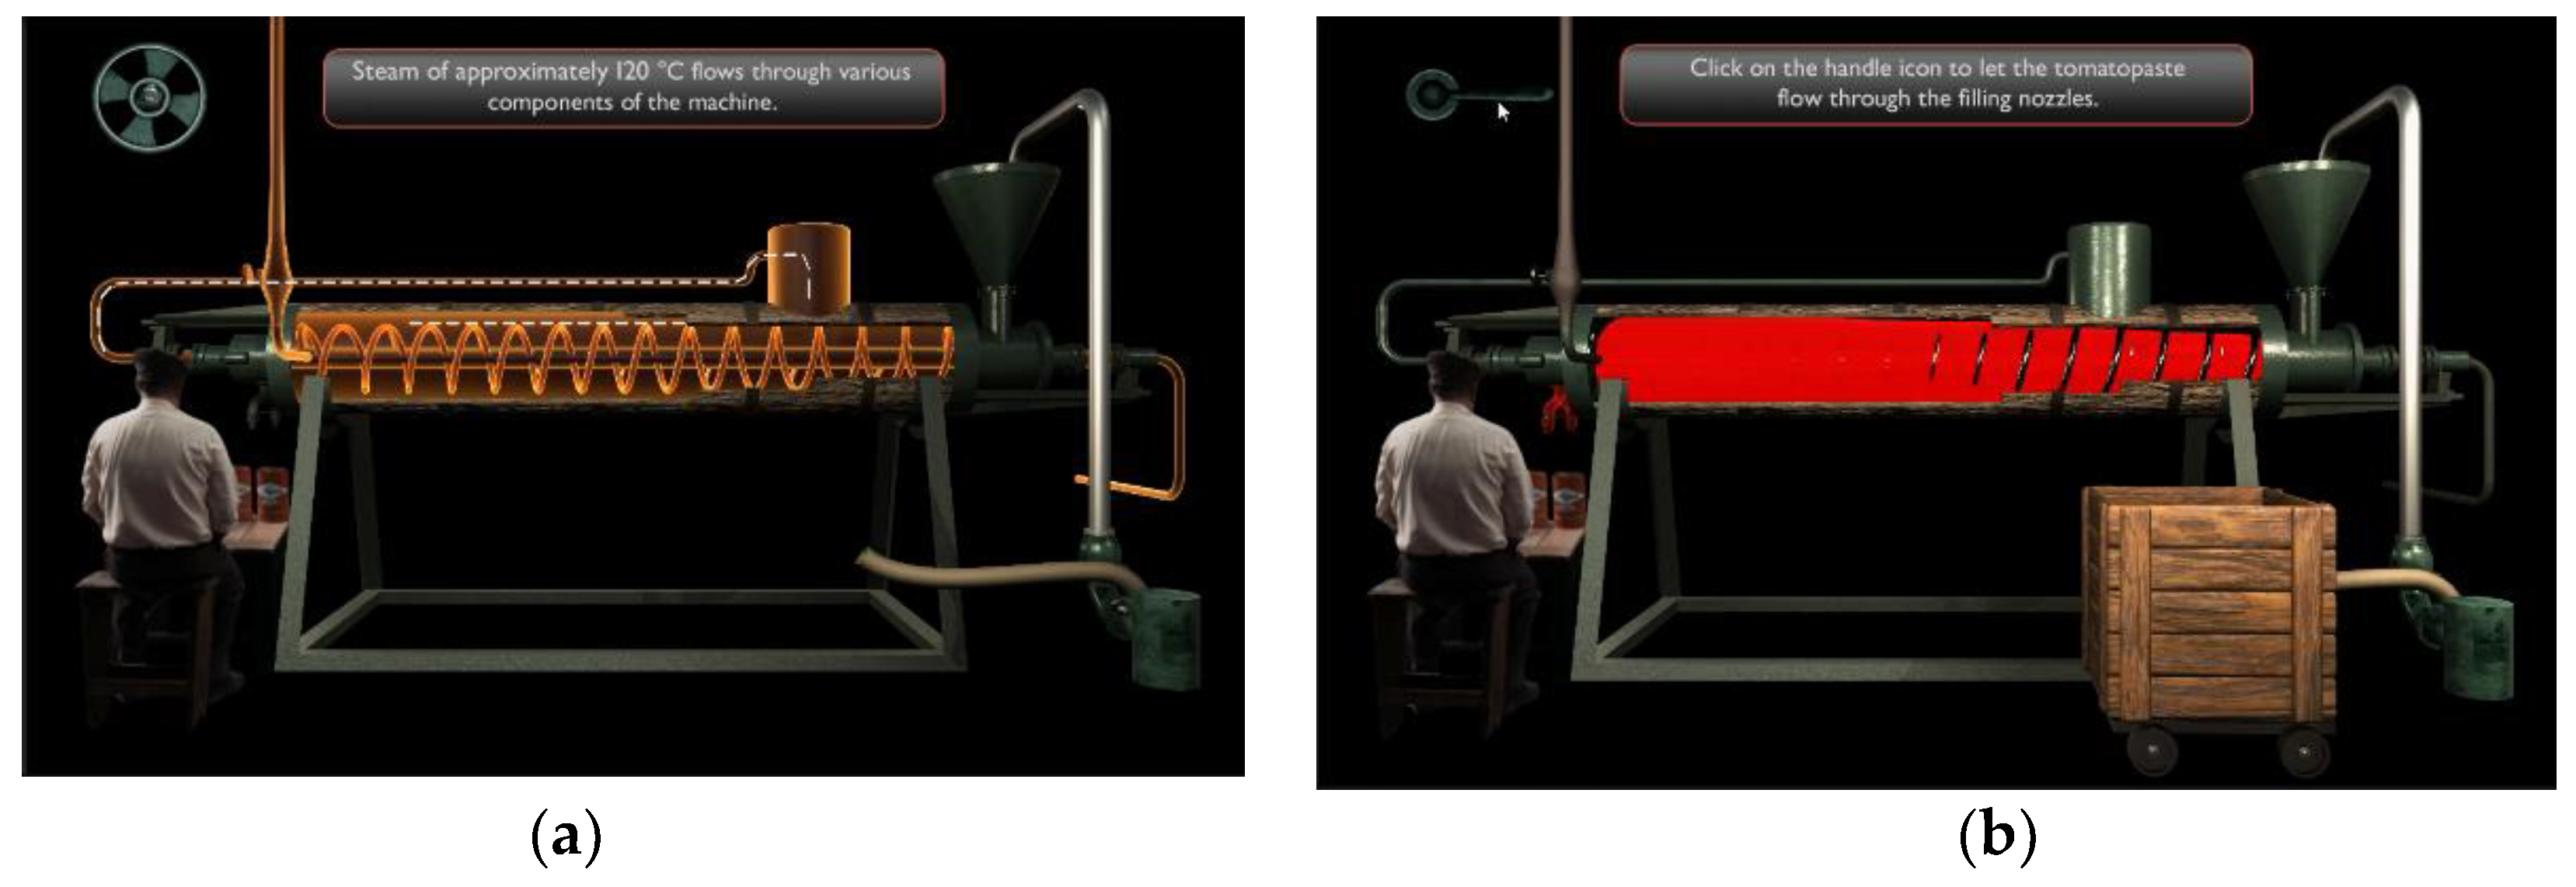

Table 1.
Numeric values, benchmark results and interpretation per scale.
| Scale | Mean | Comparison to benchmark | Interpretation |
|---|---|---|---|
| Attractiveness | 1,87 | Excellent | In the range of the 10% best results |
| Perspicuity | 1,37 | Above Average | 25% of results better, 50% of results worse |
| Efficiency | 1,38 | Above Average | 25% of results better, 50% of results worse |
| Dependability | 1,34 | Above Average | 25% of results better, 50% of results worse |
| Stimulation | 1,71 | Excellent | In the range of the 10% best results |
| Novelty | 0,40 | Below Average | 50% of results better, 25% of results worse |
Disclaimer/Publisher’s Note: The statements, opinions and data contained in all publications are solely those of the individual author(s) and contributor(s) and not of MDPI and/or the editor(s). MDPI and/or the editor(s) disclaim responsibility for any injury to people or property resulting from any ideas, methods, instructions or products referred to in the content. |
© 2024 by the authors. Licensee MDPI, Basel, Switzerland. This article is an open access article distributed under the terms and conditions of the Creative Commons Attribution (CC BY) license (http://creativecommons.org/licenses/by/4.0/).
Copyright: This open access article is published under a Creative Commons CC BY 4.0 license, which permit the free download, distribution, and reuse, provided that the author and preprint are cited in any reuse.


