

Submitted:
05 January 2024
Posted:
08 January 2024
You are already at the latest version
Abstract
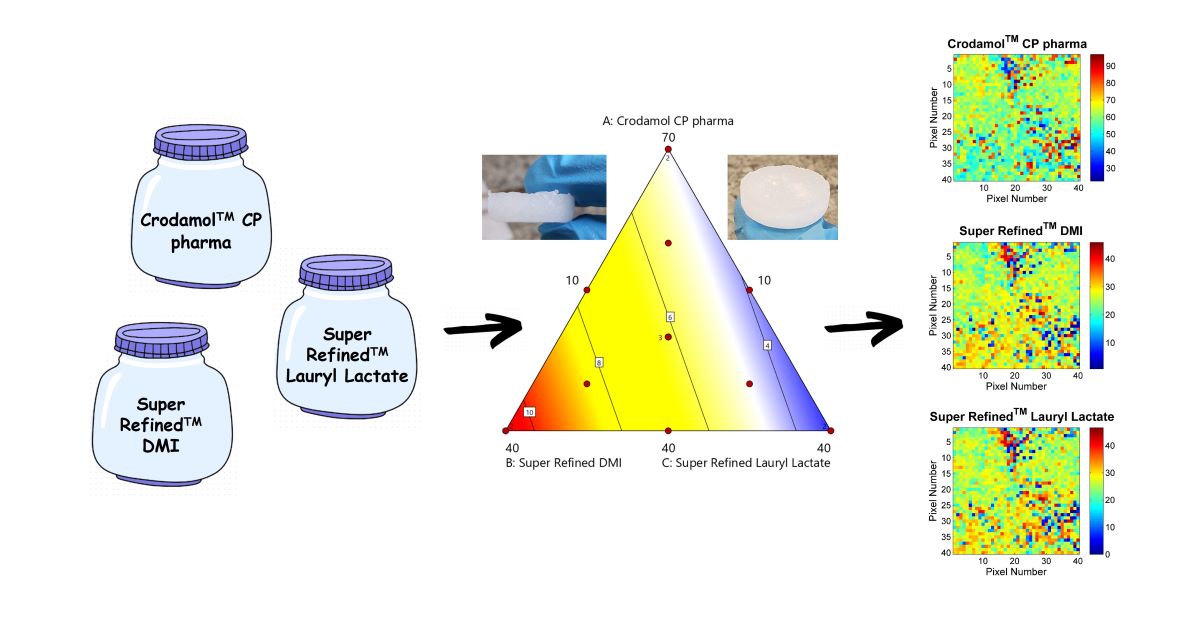
In the study, a lipid mixture was developed and optimized using a broad range of excipients of different po-larities. Initially, the excipients were classified according to their behavior in water. Then binary mixtures were prepared using cetyl palmitate (Crodamol™ CP pharma) as the solid lipid. The miscibility between the excipients was evaluated using Raman chemical images obtained by classical least squares (CLS). Based on the results, the excipients Crodamol™ CP pharma (cetyl palmitate, hydrophobic), Super Refined™ DMI (di-methyl isosorbide; hydrophilic) and Super Refined™ Lauryl Lactate (medium polarity) were chosen to com-pose the lipid core. The ideal proportion of these excipients was determined using a Mixture Design and the standard deviation of image histograms as responses. The main goal was to develop a versatile lipid core for ‘brick-dust type of drugs’. After statistical evaluation of the DOE results, the final composition was deter-mined and drugs with different logP (0 to 10) and physiochemical characteristics were evaluated in the opti-mized mixture. The drugs butamben, tacrolimus, atorvastatin calcium and resveratrol presented a homoge-neous distribution in the optimized lipid core, indicating that the core has indeed the capability to be used in NLC formulations of such type of drugs.
Keywords:
Nanostructured Lipid Carriers
; Raman Mapping
; Design of Experiments
; Classical Least Squares
1. Introduction
Raman spectroscopy is an analytical technique based on the scattering of electromagnetic radiation (monochromatic) in the visible or near infrared region (VIS-NIR) [1]. In Raman spectroscopy, the majority of the photons are scattered with the same energy as the incident radiation and this does not provide any information about the sample. However, few photons scatter with different energy allowing to obtain information about sample composition [1].
Raman spectroscopy has some advantages in relation to other techniques, for example, none or a few preparation steps and generation of a large volume of informative data with few analyses [1]. In this situation, is necessary to statistical methods capable of extracting and interpreting this large amount of data quickly and efficiently. Therefore, Chemometrics has become a powerful tool for data processing in industry and universities [2]. Among the areas of Chemometrics, Design of Experiments (DoE) have been highlighted for the ability to identify and quantify the most influential variables. In DoE, the levels of factors are combined to generate a predefined set of experiments. This multivariate approach is very important to maximize information collection, observe interactions between factors and determine the best overall conditions [3,4].
Based on the type of variables and objectives of the study, is possible to use different types of DoE. Full factorial designs (2k, k number of factors) are indicated when the variables are statistically independent. However, in a study with many variables, a fractional design (2k-p, being k number of factors and p=1.2.3..) is indicated due to the reduced number of experiments [3,4]. For a data set that presents curvature in the response surface, the use of quadratic models, generated by optimization designs, for example, central composite (CCD) and Box-Benken is indicated [3,4]. A pharmaceutical formulation is a mixture of active pharmaceutical ingredient (API) with various excipients. In this situation, the variables are not independent and the properties of the mixture are determined by the proportions between the components [4]. Therefore, to find the best composition, is recommended to use mixture designs.
The low water solubility of many active pharmaceutical ingredients (API) is a limiting factor in the development and optimization of several drug products since the drug must be solubilized to be transported across the cell membrane. This difficulty is more prominent in the development of formulations of drugs classified as 'Class II brick' powder-type drugs (lipophilic, but soluble in organic solvents).
Lipid formulations (LF) composed of oils (lipophilic), surfactants and solvents (hydrophilic) have awakened the interest of the pharmaceutical industry due to advances in the development of lipid and semi-solid formulations [5,6]. In this scenario, initially formulations based on a mixture of lipids named solid lipid nanoparticles (SLNs) were proposed [7,8]. In a SLNs, the lipid core is formed by a one or more solid lipids, in which the drug is solubilized. After that, a surfactant is then added in an aqueous phase under stirring. Even though SLNs have some advantages over other formulations, for example, greater in vivo stability and no need for the use of organic solvents, the low amount of drug incorporated into SLNs impaired its use in many applications [7,8]. Due to these limitations, nanostructured lipid carriers (NLCs) were developed as a new generation of nanoparticles [9,10,11].
During the preparation of NLCs, a liquid lipid is incorporated into the solid lipid, solubilizing the drug, making it more stable in relation to crystallization and allowing the uptake of a larger amounts of drug [10]. The liquid lipid is normally lipophilic, therefore uncapable of solubilizing ‘Class II brick dust’ type of drugs. On the other hand, a more hydrophilic excipient won’t be miscible with the solid lipid in the core. Therefore, there is a demand for the development of new NLC formulations for 'Class II brick dust’ type of drugs, taking into account the solubilization of the drug in the liquid excipient and its miscibility with the solid lipid simultaneously, a very challenging task.
NLC are normally prepared under heating until a visually homogenous mixture is obtained. Nevertheless, miscibility problems can arise after cooling, which can lead to further lack of uniformity and phase separation. This is especially important when mixing semi-solid lipophilic and medium polarity or hydrophilic excipients, as carried out in this work. Chemical images based on spectroscopic techniques (for example, NIR, MIR and Raman) are important tools to assess the homogeneity of mixtures [12,13,14] and are capable of indicating heterogeneities in a microscopic level allowing to foresee stability issues. Besides the assessment of the distribution of the excipients and drugs [15,16,17], chemical images based on vibrational spectroscopy have also been used in pharmaceutical area to identify adulterations [18], identify and discriminate polymorphisms in drugs [19,20,21], among other applications.
To obtain a chemical map, the sample surface is divided several pixels and then spectra are collected, pixel by pixel, generating a hyperspectral data cube (MxNxλ). The first and second dimensions (M and N) correspond to spatial coordinates while the third contains the spectral profile (λ). After unfolding the data cube in a matrix (MNxλ), is possible to extract information for the construction of chemical images using univariate or multivariate (chemometric) methods [22,23].
Several chemometric methods can be used to generate chemical images [1,24]. Among the curve resolution methods, the most used are multivariate curve resolution by alternating least squares (MCR-ALS) [25,26,27] and classical least squares (CLS) [23,28]. Both methods follow the Equation (1), where the sample spectra matrix is decomposed as the product of a concentration matrix (C), pure spectra (S) and residues (E):
In CLS, when the profiles of the pure spectra are known, is possible to estimate their concentrations in a mixture, assuming that the mixture spectral profile is the weighted sum of pure spectra, the weighting factors are their corresponding concentrations. CLS can be successfully used when the pure spectra are available and no interactions among the components is expected [25].
To interpret chemical image results and assess the homogeneity of the mixture, several authors use the parameters provided by the histogram of predicted concentrations, for example mean, standard deviation (STD), asymmetry and kurtosis. However, these parameters describe the dispersion of concentration values, but do not indicate the spatial distribution of pixels in the chemical image. Therefore, only the standard deviation is not sufficient to evaluate homogeneity, since similar STD values may be associated with completely different images. In this situation, Sacré and co-authors proposed a new criterion named Distributional Homogeneity Index (DHI) [28].
This new parameter is based on the merge of neighboring pixels to form a macropixel (2x2, 3x3, ...) whose concentration value is the average of the values of the grouped pixels [29]. Macropixels move across the image, from the upper to the lower side, line to line, left to right, column to column and from the average values obtained for each macropixel the standard deviation is calculated. Finally, the deviation values are plotted against the macropixel size, generating a homogeneity curve [30]. In the next step, pixels from the original map are randomized and a new homogeneity curve is constructed. After finding the area under the curve for both cases, the DHI value is obtained by dividing the area of the original map and the randomized map. The higher the value for DHI, the lower the homogeneity of the mixture.
The aim of the study was to develop and optimize a versatile NLC core especially for ‘brick dust type of drugs’. The homogeneity of the mixtures of different excipients with cetyl palmitate (solid lipid) was evaluated using chemical images (CLS) and the ideal composition was determined using a mixture design.
2. Materials and Methods
2.1. Excipients
Crodamol™ CP pharma (INCI name: Cetyl palmitate), Super Refined™ Soybean Oil (INCI name: Glycine soja oil), Super Refined™ Sesame Oil (INCI name: Sesamum indicum seed oil), Super Refined™ Oleic Acid (INCI name: Oleic acid), Super Refined™ GTCC (INCI name: Caprylic/capric triglyceride), Croduret™ 40 (INCI name: PEG-40 hydrogenated castor oil), Super Refined™ Lauryl Lactate (INCI name: Lauryl Lactate), Super Refined™ PEG 400 (INCI name: Polyethylene Glycol 400), Super Refined™ Propylene Glycol (INCI name: Propylene Glycol), Super Refined™ DMI (INCI name: Dimethyl isosorbide), Crodasol™ HS HP (INCI name: PEG 660 12-Hydroxystearate), Super Refined™ GMCC (INCI name: Glyceryl Caprylate/Caprate), Super Refined™ PGMC (INCI name: Propylene Glycol dicaprylate/dicaprate). All excipients were donated by Croda do Brazil (Campinas, SP, Brazil). All other chemicals and solvents were of analytical grade.
2.2. Solubility tests
In this test, 1.0 mL of each excipient was added to 60.0 mL of distilled water in a beaker. After agitation, the mixture was allowed to rest for 48 hours. After this period, the excipients were classified as hydrophobic, hydrophilic and of medium polarity.
2.3. Tablet preparation
The excipients used were Super Refined™ Soybean Oil, Super Refined™ Sesame Oil, Super Refined™ Oleic Acid, Super Refined™ GMCC, Super Refined™ GTCC, Super Refined™ DMI, Super Refined™ Lauryl Lactate, Super Refined™ PEG 400, Super Refined™ PGMC, Super Refined™ Propylene Glycol, Croduret™ 40 and Crodasol™ HS HP. The proportion between Crodamol™ CP pharma and excipients in the binary mixtures is 3:1, 1:1 and 1:3.
To prepare the tablets for Raman analysis, a mass of solid lipid (Crodamol™ CP pharma PF 54ºC) was weighed and melted using a heating plate at 65ºC. Then, a mass of each of the excipients was added under stirring. The total mass of tablet was fixed at 3.0 grams. After observing a homogeneous aspect, the mixture was transferred to a metal lid lined with a piece of aluminum foil. After 24 hours, the solid mixture was removed from the metal lid in the form of a tablet. An authentic replication of each tablet was prepared.
2.4. Raman Spectra
Raman spectra were collected using a full confocal Raman microscope XploRA-ONE (Horiba, USA) with a two-dimensional CCD detector (-60ºC TE air cooled, 1024×256 pixel sensor), 785 nm laser (100-120 mW) and a 10x objective. The spectral region used was 1800-200 cm-1 with a spectral resolution of 7.5 cm-1. Raman spectra were collected using 1 accumulation with a 3 s exposure time. A central region of the tablet was delimited by 40x40 points (total area of 16 mm2). The distance between two consecutives mapping measurements was fixed at 100 µm. In total, 1600 spectra were collected for each map. The total mapping time was 90 minutes.
2.5. Chemical Maps
In the collection of spectra, a cube of hyperspectral data with dimensions MxNxλ, with M and N corresponding to spatial information and λ to spectral information was generated. The first step was to transfer the data from the equipment software (LabSpec6, Horiba) to the MATLAB workspace (Mathworks, Natick, Massachusetts, USA, v. 8.3, 2014). Then the data cube was unfolded into a two-dimensional array of dimensions MNxλ. In the spectra pre-processing step, the asymmetric least squares algorithm was used (AsLS, λ=105 and p=0.001) [31], cosmic peaks were removed using the algorithm developed by Sabin et al. (k=11) [32] and the spectra were normalized by the unitary length vector. Chemical maps were generated using the Classical Least Squares (CLS) using PLS-Toolbox (Eigenvector Research, Manson, Washington, EUA, v. 8.6.2).
2.6. Design of Experiments (DoE)
A mixture design was developed and evaluated by Design Expert® version 11 (Stat-Ease Inc., Minneapolis, MN, USA). The sum of excipients was set to 90% (10% was set aside for the drug). The excipients Crodamol™ CP pharma, Super Refined™ Lauryl Lactate and Super Refined™ DMI were chosen as the independent variables in this step. The composition of the mixtures was determined by a Simplex Centroid mixture design with duplicates at the vertices and three central points. In total, 15 experiments were made.
The range of Crodamol™ CP pharma (lipid solid; X1), Super Refined™ Lauryl Lactate (medium polarity, liquid lipid; X2), and Super Refined™ DMI (hydrophilic excipient; X3) were set to 40-70 (% w/w), 10-40 (% w/w) and 10-40 (% w/w), respectively (Table 1).
2.7. Evaluation of the optimized mixture profile using different drugs
As a prove of concept, the following drugs with different partition coefficients (0 < log P < 10) were added to the optimized mixture of excipients (Table S1): caffeine, acetaminophen, butamben, tacrolimus, atorvastatin calcium, resveratrol and coenzyme Q10. These drugs varied from very hydrophilic to very lipophilic and included “brick-dust type” of drugs. All material presented analytical grade of purity (> 99%). Authentic replication of the tablets were prepared following the methodology described in item 2.3.
3. Results and Discussion
3.1. Solubility test
The initial part of the study was to classify the excipients according to their behavior in water (hydrophilic, hydrophobic and medium polarity). In total, 13 excipients were evaluated. The solubility test was made by adding near 10 mL of each excipient to a beaker of distilled water. After leaving the mixture to rest, excipients were classified according to their behavior as hydrophobic, medium polarity or hydrophilic (Table S2).
For those excipients that presented partial miscibility in water, there was a subdivision because some presented of oil-in-water characteristics (Super Refined™ PGMC and Super Refined™ Lauryl Lactate) while others presented turbidity in the solution (Super Refined™ GMCC). Super Refined™ Lauryl Lactate presented an intermediate behavior, therefore it was interesting to be studied for a robust NLC core.
3.2. Chemical maps of binary mixtures
In the first step, tablets were prepared from binary mixtures between Crodamol™ CP pharma (solid lipid) and excipients with different characteristics (hydrophilic, hydrophobic and medium polarity) as observed in the solubility test. During the tablet preparation step, only the excipients Crodasol™ HS HP, Croduret™ 40, Super Refined™ Propylene Glycol and Super Refined™ PEG 400 presented a visual indication of immiscibility.
After preparing the binary mixtures of the excipients, the chemical images and histograms generated were used to investigate the microscopic miscibility. The histograms provided information about the miscibility from the agreement or deviation from the Gaussian format. If the excipient is well distributed, is possible to observe a sharp Gaussian profile with a defined mean value and a small standard deviation. In order to generate chemical images using CLS, is essential to obtain the spectral profile of the excipients. The Raman spectra of all excipients is presented in Figure S1.
The oily excipients evaluated were the Super Refined™ Sesame Oil, Super Refined™ Soybean Oil, Super Refined™ Crodamol GTCC and Super Refined™ Oleic Acid. The chemical images of the mixtures for the excipients in proportion 1:1 are presented in Figure 1. The replicates for the other proportions are present in Figures S2–S6.
According to the chemical maps and histograms, a good miscibility between Crodamol™ CP pharma and the excipients Super Refined™ Sesame Oil, Super Refined™ Soybean Oil, Super Refined™ Crodamol GTCC and Super Refined™ Oleic Acid was observed in all evaluated proportions. Therefore, Crodamol™ CP pharma can be mixed with any of these excipients in any proportion and this result can be explained based on the oily properties of these excipients.
The next excipients evaluated were Super Refined™ GMCC and Super Refined™ PGMC. In the solubility test, Super Refined™ GMCC presented turbidity in water and Super Refined™ PGMC formed oil droplets on the surface of the water was observed. The chemical images of the mixtures for these excipients are in Figure 2. The other replicates are presented in Figure S7.
According to the histograms and images, adequate miscibility was achieved in all proportions, with a slight increase in homogeneity with the increase of liquid excipients.
The next excipients evaluated were Super Refined™ Lauryl Lactate and Super Refined™ DMI. The chemical images of the mixtures of these excipients are presented in Figure 3. The other replication is presented in Figure S8.
According to the STD of histograms, adequate miscibility of Super Refined™ Lauryl Lactate (Figure 3A–C) in Crodamol™ CP pharma was achieved in all proportions, with a slight increase in homogeneity with the decrease of the liquid excipient. Observing the distribution of pixels in the chemical image, the 1:1 w/w ratio provided the best miscibility between the excipients. From the solubility test Super Refined™ Lauryl Lactate presented oily characteristics, however, it also presented an interaction with water, therefore it was classified as medium polarity excipient and it was expected to be miscible with Crodamol™ CP pharma in some proportions.
From the chemical maps and histograms, Super Refined™ DMI (Figure 3D–F) was not fully miscible in Crodamol™ CP pharma in any proportion, even though phase separation did not occur. Based on the solubility test, it was observed that Super Refined™ DMI was a very hydrophilic excipient, which explains the lack of miscibility with Crodamol™ CP pharma. Nevertheless, a mixing test of Super Refined™ Lauryl Lactate and Super Refined™ DMI (both liquids, therefore chemical images were nor required) indicated that they were miscible in all proportions. This information will be used later on to justify the selection of the excipients for the lipid core.
Finally, for the mixtures involving the hydrophilic excipients Super Refined™ Propylene Glycol and Super Refined™ PEG 400 with Crodamol™ CP pharma, it was not possible to obtain a tablet in any of the evaluated proportions, due to the formation of two phases in the beaker (Figure S9.A,B). Crodamol™ CP pharma remaining solid in the upper part while the other excipient remained liquid in the lower part. This fact can be explained based on the large difference of polarity of the excipients.
For the excipients Crodasol™ HS HP and Croduret™ 40 it possible to prepare a tablet, however, it was suspected that two phases were formed in the tablet, in all proportions analyzed (Figure S9.C,D). To confirm this observation, chemical maps of the upper and lower side in the 50/50 (% w/w) mixture of each excipient were made. The chemical maps and histograms of the CLS for excipients are presented in Figure 4. The other replicate is presented in Figure S10.
Based on the images, it can be seen that the tablet was formed by two parts, where Crodamol™ CP pharma was located in the upper part and Crodasol™ HS HP/Croduret™ 40 in the lower part. From the results, it was possible to conclude that Crodasol™ HS HP, Croduret™ 40, Super Refined™ Propylene Glycol and Super Refined™ PEG 400 were not miscible with Crodamol™ CP pharma in any of the analyzed proportions.
A lot of information was obtained from the solubility tests and chemical images. A brief summary is provided below.
- The excipients that presented a hydrophobic profile (Super Refined™ Sesame Oil, Super Refined™ Oleic Acid, Super Refined™ Soybean Oil and Super Refined™ GTCC) were miscible in all proportions evaluated.
- The excipients Super Refined™ Propylene Glycol and Super Refined™ PEG 400, hydrophilic excipients, we not miscible with Crodamol™ CP pharma and therefore did not form a tablet in any proportion.
- Crodasol™ HS HP and Croduret™ 40 allowed the preparation of a tablet, however, sing chemical images was possible to prove the excipients were in different phases (upper/lower sides of the tablets).
- The excipient Super Refined™ DMI was the only hydrophilic excipient that formed a tablet, however the histogram has shown a broad distribution of concentrations.
- Within the group of excipients classified as medium polarity, all excipients provided suitable miscibility with Crodamol™ CP pharma, with small variations in different concentrations. The best overall proportion was 1:1 (Gaussian profile) in all cases.
Super Refined™ Lauryl Lactate is a medium polarity excipient not widely exploited in the formulation development of NLCs and considering its miscibility with Crodamol™ CP pharma, it was selected to the next steps. Moreover, as the purpose of the study is to prepare a NLCs that is receptive to ‘brick dust type’ of drugs, it was used in association with Super Refined™ DMI, a hydrophilic excipient capable of solubilizing such type of drugs and the only hydrophilic excipient that was miscible to some extend with Crodamol™ CP pharma (no phase separation was observed). Even though Crodamol™ CP pharma and Super Refined™ DMI are not fully miscible, it is expected that Super Refined™ Lauryl Lactate acts as the bridge, serving as a mutual affinity excipient. It should be highlighed that the miscibility of Super Refined™ Lauryl Lactate and Super Refined™ DMI (both liquid) was evaluated in a bequer, in the proportions 1:3, 1:1 and 3:1 (v/v) and they were completely miscible.
3.3. Development of an optimized mixture
After defining the NLCs core components, the best composition among the excipients in the mixture was determined using a mixture design. The proportions of each excipient in the mixtures, the order of execution of the experiments and the design responses (standard deviation of histograms) are presented in Table 2.
After preparing the tablets, Raman spectra were collected in a region of 40x40 points in an area of 16 mm2. The chemical images and histograms with the values of STD, DHI and kurtosis of the mixtures are presented in Figures S11–S25. Information on the models and the statistical parameters obtained from the analysis of variance (ANOVA) for all responses are presented in Table 3.
Due to the limitations of using STD to evaluate the homogeneity of a mixture, the DHI parameter was proposed [28]. In practice, DHI indicates the degree of heterogeneity of a chemical image, because the DHI value increases as the homogeneity of the distribution map decreases. Therefore, the two parameters can be considered complementary, because the STD evaluates the dispersion of pixel concentration values (constitutional homogeneity) while DHI evaluates the way in which these pixels are distributed in the chemical image (distributional homogeneity) [29].
The responses used in mixture design were only the STD values, because the models built using the DHI values, in the analyzed range, did not present significant regression. (Figure 5 DHI) This is evident when observing the DHI values (Figure 5 DHI, point A,B,C) for the mixtures with the most different proportions in mixture design. In this situation, a minimal variation was observed between DHI values harmed the construction of models for this parameter. This information was observed for all three responses.
To evaluate this parameter in mixture design, it would be necessary to modify the analyzed range of the three independent variables. The values for STD, DHI value and kurtosis for each excipient present in all prepared mixtures were organized in a mixture triangle (Figure 5). The values described for points A, B and C were obtained by calculating the average of the replicates.
3.3.1. Response Y1: STD Crodamol™ CP pharma
The first response evaluated was STD of Crodamol™ CP pharma. Based on ANOVA, there was no significant regression, therefore the mean represent the data well. This is evident when observing the STD values (Figure 5. STD) for Y1 at points A, B and C. The other responses (Y2 and Y3), a significant variation was observed between the STD values. This indicates that in the analyzed range, 40-70 (% w/w), Y1 had no significant variation in standard deviation, i.e., the width of the histograms was similar. Therefore, any concentration of Crodamol™ CP pharma within this range can be selected considering the homogeneity of the formulation.
3.3.2. Response Y2: STD Super Refined™ DMI
The next response evaluated was STD for Super Refined™ DMI. For this response, the linear model was suggested (coefficient of determination R2 of 0.87). Based on ANOVA, the regression was significant and there was no lack of fit of the model (Figure 5. STD for Y2). The model equation (Equation 2) that relates the independent variables to the response is:
The plots of residuals for the model are presented in Figure S26.A,B,C. In the Normal plot graph (Figure S26.A), it was observed that the points lie on the normal line, indicating that the residuals follow a normal distribution (normality).
In the residuals versus predicted graph (Figure S26.B), it was possible to observe that the points are randomly distributed, indicating that the residuals for this response are homoscedastic. In the residuals vs run plot (Figure S26.C), it was observed that the points followed a random order as functions of experiment, meaning they are independent. From the graphs, the model residuals followed a normal distribution, were homoscedastic and independent.
3.3.3. Response Y3: STD Super Refined™ Lauryl Lactate, Y3
The next response evaluated was STD Super Refined™ Lauryl Lactate. The linear model was also suggested. Based on ANOVA, the regression was significant, the R2 of 0.72 was due to higher random variation (quadratic fit would not improve the results), and there was no lack of fit of the model (Figure 5 STD for Y3). The model equation (Equation 3) that relates the independent variables to the response is:
The plots of residuals for the model are presented in Figure S26.D,E,F. In the same way as the first response, the residuals followed a Normal distribution, were homoscedastic and independent.
3.4. Surface and contour graphs
In a contour graph, is possible to observe the variation of the response in relation to the composition of the mixture. The model equation provides the predicted value and it is associated to a color. The maximum values are found in the red region and the minimum values in the blue region. The surface graph is obtained after adding the z axis to the contour graph (2D). No significant regression was obtained for the Y1 response. Therefore, the contour and surface graph was not generated.
The contour and the surface graph for Y2 (Figure 6A–C) a smaller standard deviation was obtained in the mixtures where the excipients Crodamol™ CP pharma and Super Refined™ Lauryl Lactate were in greater proportion and Super Refined™ DMI in a smaller proportion. For Y3 (Figure 6D–F), a smaller standard deviation was obtained in the mixtures where the excipients Crodamol™ CP pharma and Super Refined™ DMI were in greater proportion and Super Refined™ Lauryl Lactate in a smaller proportion. In the surface graph for Y2 and Y3, the experimental points were next the surface, indicating that the proposed linear model was appropriate for both responses.
Finally, the actual vs predicted graph (Figure 6C,F) for Y2 and Y3 indicates that the experimental points have a good agreement to the linear model proposed by the software for both models.
It was observed the contour plots for Y2 and Y3 presented opposite profiles. This information may be related the difference in polarity between Super Refined™ DMI and Super Refined™ Lauril Lactate and the miscibility of these excipients with Crodamol™ CP pharma, both in the mixture. Furthermore, the profile observed in the contour plots, numerically, can be understood after analyzing the values for STD. Fixing the percentage of Crodamol™ CP pharma in the mixture (Figure 5 STD), for Y2, the STD values decreased with the change between points B, F and C, in that order.
In the same sequence, for Y3, an opposite behavior was observed. Therefore, mixtures with a high percentage of Super Refined™ DMI and low Super Refined™ Lauryl Lactate and vice versa did not present an adequate homogeneous distribution due to the higher STD values (Crodamol™ CP pharma fixed at 40 (% w/w)). The same information can be observed when analyzing the values for the kurtosis.
For Y2, an increase in the value of kurtosis between points B, F and C, in that order, indicates a change from a wider to a thinner histogram. This profile is in agreement with the results obtained previously, since a thinner histogram indicates a low value for STD. For Y3, a similar behavior was observed, but in the opposite sequence of points (point C, F and B, in that order).
Due to the opposite behavior observed for Y2 and Y3, the probable ideal miscibility will be achieved using a mixture with Super Refined™ Lauryl Lactate/Super Refined™ DMI in a 1:1 ratio. This observation is in accordance with the DHI parameter, because the mixture with the lowest value for this parameter, i.e., the mixture that presented the most homogeneous chemical image was precisely in the 1:1 ratio.
Another approach to select the best composition would be using the desirability functions [33]. This approach was proposed by Derringer and R. Suich in 1980 as a tool for optimization of multiple responses. Initially, an individual desirability function (di) is assigned to each response, ranging from 0 to 1 (ex: maximization/minimization/find a rage, reach a target). Then they are combined in a global desirability function (D), obtained by the geometric mean of the n individual desirability functions (Eq 4.). Then, the goal is to find the set of independent variables to maximize D.
The responses used in mixture design were the standard deviations provided by the histogram obtained using the CLS, thereby the objective was to minimize them (except for Crodamol™ CP pharma which was not considered in the calculations. The range used for the responses and the criteria used to generate the graph for desirability are described in Table 4. The graph for desirability is presented in Figure 7.
According to the desirability graphs, to minimize the responses (STD) it is more appropriate to work in the central part of the mixture triangle. Therefore, the chemical maps and histograms for points A, F, G, H, I and J were compared (Figure 8) and presented similar homogeneous distribution of the compounds. Therefore, Point F with lower amount of Crodamol™ CP (40 % w/w), Super Refined™ DMI and Super Refined™ Lauryl Lactate in the proportion of 1:1 (25 % w/w: 25 % w/w) was selected to allow possible higher amounts of drug to be solubilized.
3.5. Incorporation of different drugs into the lipid core
After determining the ideal proportion of excipients, the optimized mixture was evaluated using drugs with different LogP and physicochemical characteristics: caffeine (A, logP = - 0.07), acetaminophen (B, log P = 0.91), butamben (C, log P = 2.87), resveratrol (D, log P = 3.10), tacrolimus (E, log P = 3.30), atorvastatin calcium (F, logP = 6,36) and coenzyme Q10 (G, log P = 10.00). In the CLS method, chemical maps are generated using the pure spectra of the mixture components. Therefore, the Raman spectra of the excipients and drugs were collected and are presented in Figure S27. After obtaining the pure profiles, mixtures with the drugs were prepared in the form of tablets and the surface of the tablets were mapped (Figure 9). The whole set of chemical images and histograms of both replicates for caffeine (Figure S28), acetaminophen (Figure S29), butamben (Figure S30), resveratrol (Figure S31), tacrolimus (Figure S32), atorvastatin calcium (Figure S33) and coenzyme Q10 (Figure S34) are available in the supplemental material.
Among the drugs analyzed, caffeine (LogP = -0.07, Figure 9A) and acetaminophen (LogP = 0.91, Figure 9B) presented the greatest hydrophilic character. Based on the chemical images of both drugs, is possible to observe a heterogeneous distribution on the surface of the tablet. Furthermore, the wide histogram with an undefined mean value indicates the same information, i.e., the drugs were not distributed homogeneously. In the present study, the two drugs were used only as proof of concept, since they are not formulated as NLCs.
The next drug evaluated was butamben (LogP = 2.87, Figure 9C). From the chemical maps and the format of the histograms, a homogeneous distribution was observed. The drugs evaluated in the sequence were resveratrol (LogP = 3.1, Figure 9D), tacrolimus (LogP = 3.3, Figure 9E) and atorvastatin calcium (LogP = 6.36, Figure 9F). Although the chemical image presents a heterogeneous distribution, a small standard deviation (STD) may indicate a uniform distribution of the drug (constitutive homogeneity). This can be represented visually in a fine histogram with a defined average value. Therefore, from the histograms generated, is possible to infer that the drugs were distributed homogeneously, therefore, they are promising candidates to be incorporated in a NLC.
The last drug evaluated was coenzyme Q10 (LogP = 10.0, Figure 9G). The chemical images of the drug presented a very heterogeneous distribution. The format of the histograms also pointed out to the same information, i.e., that the drug was not distributed uniformly.
Finally, the average values of the parameters obtained in the chemical maps and histograms (STD, kurtosis and DHI) were calculated and are presented in Table S3. Next, graphs were generated by plotting logP values against mean STD and DHI values (Figure S35). The logP versus STD plot (Figure S35.A) presented a “U” shaped profile, indicating that constitutional homogeneity improved (decrease in STD values) with an increase in logP. Furthermore, drugs at the extremes of the logP range had the highest values for STD (acetaminophen, caffeine and coenzyme Q10).
According to the profile observed in the graph (Figure S35.B), a proportional relationship was observed between logP and DHI, indicating that the distributional homogeneity worsened (increase in the DHI value) with the increase in the hydrophobic character of the drug (increase in logP value). It should be interesting to highlight that that for the drugs caffeine and acetaminophen, the DHI values were low due to due to the principle of macro pixels calculations; therefore a joint observation of STD and DHI is recommended.
Therefore, neither very hydrophilic drugs (acetaminophen, caffeine) nor very hydrophobic drugs (coenzyme Q10) were fully miscible in the proposed mixture. Therefore, drugs that presented intermediate values for logP were more promising to be incorporated into NLC preparations from the lipid core optimized in the present study.
4. Conclusion
The exploratory step at the beginning of the study was important to understand the behavior of excipients in water, allowing to classify them as hydrophilic, hydrophobic and medium polarity. The insertion of a medium polarity excipient into the lipid core proved to be an innovative strategy in finding solutions to NLC formulations. Therefore, the core developed in the study demonstrated the potential to receive drugs classified as 'Class II brick' powder-type drugs (lipophilic, but soluble in organic solvents).
Design of Experiment (DoE) and chemical imaging were essential tools to achieve the ideal composition of the mixture to compose the lipid core of NLCs: Crodamol™ CP pharma (40 (% w/w)), Super Refined™ DMI (25 (% w/w)) and Super Refined™ Lauryl Lactate (25 (% w/w)). Among the drugs analyzed, butamben, tacrolimus, atorvastatin and resveratrol presented a suitable distribution in the mixture. It was demonstrated that the proposed mixture is not suitable for neither too hydrophilic nor too hydrophilic drugs, as expected.
Supplementary Materials
The following supporting information can be downloaded at the website of this paper posted on Preprints.org. Table S1. Classification of excipients according to behavior in water; Figure S1. Raman spectrum of pure excipients that were classified as medium polarity, hydrophilic and hydrophobic; Figure S2. Chemical maps (replicate 2) obtained from mixture between Crodamol™ CP pharma with Super Refined™ Oleic Acid (A), Super Refined™ GTCC (B), Super Refined™ Sesame Oil (C), Super Refined™ Soybean Oil (D) (all in the 1:1 w/w ratio); Figure S3. Chemical maps (replicate 1) obtained from mixture between Crodamol™ CP pharma with Super Refined™ Oleic Acid (A), Super Refined™ GTCC (B), Super Refined™ Sesame Oil (C), Super Refined™ Soybean Oil (D) (all in the 1:3 w/w ratio); Figure S4. Chemical maps (replicate 2) obtained from mixture between Crodamol™ CP pharma with Super Refined™ Oleic Acid (A), Super Refined™ GTCC (B), Super Refined™ Sesame Oil (C), Super Refined™ Soybean Oil (D) (all in the 1:3 w/w ratio); Figure S5. Chemical maps (replicate 1) obtained from mixture between Crodamol™ CP pharma with Super Refined™ Oleic Acid (A), Super Refined™ GTCC (B), Super Refined™ Sesame Oil (C), Super Refined™ Soybean Oil (D) (all in the 3:1 w/w ratio); Figure S6. Chemical maps (replicate 2) obtained from mixture between Crodamol™ CP pharma with Super Refined™ Oleic Acid (A), Super Refined™ GTCC (B), Super Refined™ Sesame Oil (C), Super Refined™ Soybean Oil (D) (all in the 3:1 w/w ratio); Figure S7. Chemical maps (replicate 2) obtained from mixture between Crodamol™ CP pharma with Super Refined™ GMCC (1:3 w/w ratio (A), 1:1 (B), 3:1 (C)) and Super Refined™ PGMC (1:3 w/w ratio (D), 1:1 (E), 3:1 (F)); Figure S8. Chemical maps (replicate 2) obtained from mixture between Crodamol™ CP pharma with Super Refined™ Lauryl Lactate (1:3 w/w ratio (A), 1:1(B), 3:1(C)) and Super Refined™ DMI (1:3 w/w ratio (D), 1:1(E), 3:1(F)); Figure S9. Preparation of tablets for excipients Super Refined™ PEG 400 (A), Super Refined™ Propylene Glycol (B), Crodasol™ HS HP (C), Croduret™ 40 (D) in proportions 1:1, 1:3 and 3:1; Figure S10. Chemical maps (replicate 2) obtained from upper/lower side of Crodamol™ CP pharma/ Crodasol™ HS HP (A,B) and Crodamol™ CP pharma / Croduret™ 40 (C, D) (all in the 1:1 w/w ratio); Figure S11. Chemical maps obtained from mixture design, Crodamol™ CP pharma (70 (% w/w)), Super Refined™ DMI (10 (% w/w)) and Super Refined™ Lauryl Lactate (10 (% w/w)), replicate 1, point A; Figure S12. Chemical maps obtained from mixture design, Crodamol™ CP pharma (70 (% w/w)), Super Refined™ DMI (10 (% w/w)) and Super Refined™ Lauryl Lactate (10 (% w/w)), replicate 2, point A; Figure S13. Chemical maps obtained from mixture design, Crodamol™ CP pharma (40 (% w/w)), Super Refined™ DMI (40 (% w/w)) and Super Refined™ Lauryl Lactate (10 (% w/w)), replicate 1, point B; Figure S14. Chemical maps obtained from mixture design, Crodamol™ CP pharma (40 (% w/w)), Super Refined™ DMI (40 (% w/w)) and Super Refined™ Lauryl Lactate (10 (% w/w)), replicate 2, point B; Figure S15. Chemical maps obtained from mixture design, Crodamol™ CP pharma (40 (% w/w)), Super Refined™ DMI (10 (% w/w)) and Super Refined™ Lauryl Lactate (40 (% w/w)), replicate 1, point C; Figure S16. Chemical maps obtained from mixture design, Crodamol™ CP pharma (40 (% w/w)), Super Refined™ DMI (10 (% w/w)) and Super Refined™ Lauryl Lactate (40 (% w/w)), replicate 2, point C; Figure S17. Chemical maps obtained from mixture design, Crodamol™ CP pharma (55 (% w/w)), Super Refined™ DMI (25 (% w/w)) and Super Refined™ Lauryl Lactate (10 (% w/w)), point D; Figure S18. Chemical maps obtained from mixture design, Crodamol™ CP pharma (55 (% w/w)), Super Refined™ DMI (10 (% w/w)) and Super Refined™ Lauryl Lactate (25 (% w/w)), point E; Figure S19. Chemical maps obtained from mixture design, Crodamol™ CP pharma (40 (% w/w)), Super Refined™ DMI (25 (% w/w)) and Super Refined™ Lauryl Lactate (25 (% w/w)), point F; Figure S20. Chemical maps obtained from mixture design, Crodamol™ CP pharma (60 (% w/w)), Super Refined™ DMI (15 (% w/w)) and Super Refined™ Lauryl Lactate (15 (% w/w)), point G; Figure S21. Chemical maps obtained from mixture design, Crodamol™ CP pharma (45 (% w/w)), Super Refined™ DMI (30 (% w/w)) and Super Refined™ Lauryl Lactate (15 (% w/w)), point H; Figure S22. Chemical maps obtained from mixture design, Crodamol™ CP pharma (45 (% w/w)), Super Refined™ DMI (15 (% w/w)) and Super Refined™ Lauryl Lactate (30 (% w/w)), point I; Figure S23. Chemical maps obtained from mixture design, Crodamol™ CP pharma (50 (% w/w)), Super Refined™ DMI (20 (% w/w)) and Super Refined™ Lauryl Lactate (20 (% w/w)), replicate 1, point J; Figure S24. Chemical maps obtained from mixture design, Crodamol™ CP pharma (50 (% w/w)), Super Refined™ DMI (20 (% w/w)) and Super Refined™ Lauryl Lactate (20 (% w/w)), replicate 2, point J; Figure S25. Chemical maps obtained from mixture design, Crodamol™ CP pharma (50 (% w/w)), Super Refined™ DMI (20 (% w/w)) and Super Refined™ Lauryl Lactate (20 (% w/w)), replicate 3, point J; Figure S26. Contour, surface graph and real vs. predicted for responses Y2 (A, B and C) e Y3 (D, E and F); Table S2. Drugs and (% w/w) used in the preparation of tablets; Figure S27. Raman spectrum of pure excipients and drugs were used in the study;Figure S28. Chemical maps of the mixtures with the excipients Crodamol™ CP pharma (40 (% w/w)), SR™ DMI (25 (% w/w)) and SR™ Lauryl Lactate (25 (% w/w)) with the drug Caffeine - replicate 1 (A) and 2 (B); Figure S29. Chemical maps of the mixtures with the excipients Crodamol™ CP pharma (40 (% w/w)), SR™ DMI (25 (% w/w)) and SR™ Lauryl Lactate (25 (% w/w)) with the drug Acetaminophen- replicate 1 (A) and 2 (B); Figure S30. Chemical maps of the mixtures with the excipients Crodamol™ CP pharma (40 (% w/w)), SR™ DMI (25 (% w/w)) and SR™ Lauryl Lactate (25 (% w/w)) with the drug Butamben - replicate 1 (A) and 2 (B); Figure S31. Chemical maps of the mixtures with the excipients Crodamol™ CP pharma (40 (% w/w)), SR™ DMI (25 (% w/w)) and SR™ Lauryl Lactate (25 (% w/w)) with the drug Resveratrol - replicate 1 (A) and 2 (B); Figure S32. Chemical maps of the mixtures with the excipients Crodamol™ CP pharma (40 (% w/w)), SR™ DMI (25 (% w/w)) and SR™ Lauryl Lactate (25 (% w/w)) with the drug Tacrolimus - replicate 1 (A) and 2 (B); Figure S33. Chemical maps of the mixtures with the excipients Crodamol™ CP pharma (40 (% w/w)), SR™ DMI (25 (% w/w)) and SR™ Lauryl Lactate (25 (% w/w)) with the drug Atorvastatin Calcium- replicate 1 (A) and 2 (B); Figure S34. Chemical maps of the mixtures with the excipients Crodamol™ CP pharma (40 (% w/w)), SR™ DMI (25 (% w/w)) and SR™ Lauryl Lactate (25 (% w/w)) with the drug Coenzyme Q10 - replicate 1 (A) and 2 (B); Table S3. Drugs and (% w/w) used in the preparation of tablets; Figure S35. Graph of LogP against (a) STD values and (b) DHI values for the evaluated drugs.
Author Contributions
Conceptualization, C.A.R. and M.C.B.; methodology, C.A.R.; software, C.A.R.; validation, C.A.R.; formal analysis, C.A.R. and M.C.B.; investigation, C.A.R.; resources, M.C.B. and R.O.; data curation, C.A.R. and M.C.B.; writing—original draft preparation, C.A.R.; writing—review and editing, C.A.R., M.C.B. and R.O.; visualization, C.A.R., M.C.B. and R.O.; supervision, M.C.B..; project administration, M.C.B. and R.O.; funding acquisition, M.C.B. and R.O. All authors have read and agreed to the published version of the manuscript.
Funding
The authors acknowledge the research funding agencies: CAPES (C.A.R. PhD scholarship, Financing Code 001), CNPq/FAPESP through the INCT Bioanalytics and Croda through project 5795 Chemistry Institute / Lipid Formulations).
Institutional Review Board Statement
Not applicable.
Informed Consent Statement
Not applicable.
Data Availability Statement
The data used in this study are available to interested by contacting the author M.C.B. (marciacb@unicamp.br).
Conflicts of Interest
The authors declare there is no conflict of interest, personal or financial origin, that could have appeared to influence the work reported in this paper.
References
- Smith, G.P.S.; McGoverin, C.M.; Fraser, S.J.; Gordon, K.C. Raman imaging of drug delivery systems. Adv. Drug Deliv. R. 2015, 89, 21–41. [Google Scholar] [CrossRef] [PubMed]
- Mohammadreza, K. (Ed.) Current applications of Chemometrics, Nova Science Publishers: NY, United States, 2015, pp. 1–295.
- Box, G.E.P.; Hunter, W.G.; Hunter, J.S. Statistics for Experimenteres: Design, Innovation and Discovery, 2nd ed., John Wiley & Sons: New Jersey, United States, 2005; pp. 1–672.
- Neto, B.B.; Scarminio, I.S.; Bruns, R.E. Como fazer experimentos, 3rd ed., Bookman: Campinas, Brazil, 2007, pp. 1–414.
- Cole, E.T.; Cadé, D.; Benameur, H. Challenges and opportunities in the encapsulation of liquid and semi-solid formulations into capsules for oral administration. Adv. Drug Deliv. Rev. 2008, 60, 747–756. [Google Scholar] [CrossRef] [PubMed]
- Pouton, C.W. Formulation of poorly water-soluble drugs for oral administration: physicochemical and physiological issues and the lipid formulation classification system, Eur. J. Pharm. Sci. 2006, 29, 278–287. [Google Scholar] [CrossRef] [PubMed]
- Müller, R.H.; Mäde, K.; Gohla, S. Solid lipid nanoparticles (SLN) for controlled drug delivery-a review of the state of the art. Eur. J. Pharm. Bio. 2000, 50, 161–77. [Google Scholar] [CrossRef] [PubMed]
- Müller, R.H.; Shegokar, R.; Keck, C.M. 20 years of lipid nanoparticles (SLN and NLC): present state of development and industrialapplications. Curr. Drug. Discov. Technol. 2011, 8, 207–27. [Google Scholar] [CrossRef] [PubMed]
- Beloqui, A.; Solinís, M.A.; Rodríguez-Gascón, A.; Almeida, A.J.; Préat, V. Nanostructured lipid carriers: Promising drug delivery systems for future clinics. Nanomedicine: Nanotechnology, Bio. Med. 2016, 12, 143–161. [Google Scholar] [CrossRef] [PubMed]
- Subramaniam, B.; Siddik, Z.H.; Nagoor, N.H. Optimization of nanostructured lipid carriers: understanding the types, designs, and parameters in the process of formulations. J Nano. Res. 2020, 22, 141. [Google Scholar] [CrossRef]
- Viegas, C.; Patrício, A.B.; Prata, J.M.; Nadhman, A.; Chintamaneni, P.K.; Fonte, P. Solid Lipid Nanoparticles vs. Nanostructured Lipid Carriers: A Comparative Review. Phar. 2023, 15, 1593. [Google Scholar] [CrossRef] [PubMed]
- Ewing, A.V.; Kazarian, S.G. Recent advances in the applications of vibrationals pectroscopic imaging and mapping to pharmaceutical formulations. Spectro. Acta Part A Mol. Bio. Spec. 2018, 197, 10–29. [Google Scholar] [CrossRef]
- Mitsutake, H.; Silva, G.H.R.; De Paula, E.; Breitkreitz, M.C. When it is too much: Identifying butamben excess on the surface of pharmaceutical preformulation samples by Raman mapping. J. Pharm. Bio. Anal. 2023, 235, 115644. [Google Scholar] [CrossRef]
- Mitsutake, H.; Neves, M.G.; Rutledge, D.N.; Poppi, R.J.; Breitkreitz, M.C. Extraction of information about structural changes in a semisolid pharmaceutical formulation from near-infrared and Raman images by multivariate curve resolution? alternating least squares and ComDim. J. Chem. 2020, 34, 1–16. [Google Scholar] [CrossRef]
- Amigo, J.M.; Ravn, C. Direct quantification and distribution assessment of major and minor components in pharmaceutical tablets by NIR-chemical imaging. Eur. J. Phar. Sci. 2009, 37, 76–82. [Google Scholar] [CrossRef] [PubMed]
- Alexandrino, G.L.; Poppi, R.J. NIR imaging spectroscopy for quantification of constituents in polymers thin films loaded with paracetamol. Anal. Chim. Acta. 2013, 765, 37–44. [Google Scholar] [CrossRef]
- Mitsutake, H.; Silva, G.H.R.; Ribeiro, L.; De Paula, Eneida; Poppi, R.J.; Rutledge, D.; Breitkreitz, M.C. Raman Imaging and Chemometrics Evaluation of Natural and Synthetic Beeswaxes as Matrices for Nanostructured Lipid Carriers Development. J. Anal. Chem. (BrJAC) 2021, 8, 116–130. [Google Scholar] [CrossRef]
- Sacré, P.-Y.; Deconinck, E.; Saerens, L.; De Beer, T.; Courselle, P.; Vancauwenberghe, R.; Chiap, P.; Crommen, J.; De Beer, J.O. Detection of counterfeit Viagra by Raman microspectroscopy imaging and multivariate analysis. J. Phar. Bio. Anal. 2011, 56, 454–461. [Google Scholar] [CrossRef]
- Rocha, W.F.C.; Sabin, G.P.; Marco, P.H.; Poppi, R.J. Quantitative analysis of piroxicam polymorphs pharmaceutical mixtures by hyperspectral imaging and chemometrics. Chem. Intel. Lab. Syst. 2011, 106, 198–204. [Google Scholar] [CrossRef]
- Furuyama, N.; Hasegawa, S.; Hamaura, T.; Yada, S.; Nakagami, H.; Yonemochi, E.; Terada, K. Evaluation of solid dispersions on a molecular level by the Raman mapping technique. Int. J. Pharm. 2008, 361, 12–18. [Google Scholar] [CrossRef]
- Mitsutake, H.; Ribeiro, L.N.M.; Silva, G.H.R.; Castro, S.R.; Paula, E.; Poppi, R.J.; Breitkreitz, M.C. Evaluation of miscibility and polymorphism of synthetic and natural lipids for nanostructured lipid carrier (NLC) formulations by Raman mapping and multivariate curve resolution (MCR). Eur. J. Pharm. Sci. 2019, 51–59. [Google Scholar] [CrossRef]
- Sacré, P.-Y.; Bleye, C.; Chavez, P.-F.; Netchacovitch, L.; Hubert, Ph.; Ziemons, E. Data processing of vibrational chemical imaging for Pharmaceutical applications. J. Pharm. Biomed. Anal. 2014, 101, 123–140. [Google Scholar] [CrossRef] [PubMed]
- Breitkreitz, M.C.; Sabin, G.P.; Polla, G.; Poppi, R.J. Characterization of semi-solid Self-Emulsifying Drug Delivery Systems (SEDDS) of atorvastatin calcium by Raman image spectroscopy and chemometrics. J. Pharm. Bio. Analy. 2013, 73, 3–12. [Google Scholar] [CrossRef] [PubMed]
- Amigo, J.M.; Cruz, J.; Bautista, M.; Maspoch, S.; Coello, J.; Blanco, M. Study of Pharmaceutical samples by NIR chemical-image and multivariate analysis. Trends Anal. Chem. 2008, 27, 696–713. [Google Scholar] [CrossRef]
- De Juan, A.; Tauler, R. Multivariate Curve Resolution (MCR) from 2000: progress in concepts and applications. Crit. Rev. Anal. Chem. 2006, 36, 163–176. [Google Scholar] [CrossRef]
- Vajna, B.; Farkas, I.; Farkas, A.; Pataki, H.; Nagy, Z. Characterization of drug-cylodextrin formulations using Raman mapping and multivariate curve resolution. J. Pharm. Biomed. Anal. 2011, 56, 38–44. [Google Scholar] [CrossRef] [PubMed]
- Silva, V.H.; Soares-Sobrinho, J.L.; Pereira, C.F.; Rinnan, A. Evaluation of chemometric approaches for polymorphs quantification in tablets using near-infrared hyperspectral images. Eur. J. Phar. Bio. 2019, 134, 20–28. [Google Scholar] [CrossRef] [PubMed]
- Sacré, P.-Y.; Lebrun, P.; Chavez, P.F.; Bleye, C.; Netchacovitch, L.; Rozet, E.; Klinkenberg, R.; Streel, B.; Hubert, P.; Ziemons, E. A new criterion to assess distributional homogeneity in hyperspectral images of solid pharmaceutical dosage forms. Analy. Chim. Acta. 2014, 818, 7–14. [Google Scholar] [CrossRef] [PubMed]
- Hamad, M.L.; Ellison, C.D.; Khan, M.A.; Lyon, R.C. Drug product characterization by macropixel analysis of chemical images. J. Phar. Sci. 2007, 96, 3390–3401. [Google Scholar] [CrossRef] [PubMed]
- Ravn, C.; Skibsted, E.; Rasmus Bro, R. Near-infrared chemical imaging (NIR-CI) on pharmaceutical solid dosage forms-comparing common calibration approaches. J. Pharm. Bio. Anal. 2008, 48, 554–561. [Google Scholar] [CrossRef] [PubMed]
- Eilers, P.H.C. Parametric Time Warping. Anal. Chem. 2004, 76, 404–411. [Google Scholar] [CrossRef]
- Sabin, G.P.; Souza, A.M.; Breitkreitz, M.C.; Poppi, R.J. Desenvolvimento de um algoritmo para identificacão e correcão de spikes em espectroscopia Raman de imagem, Quimica Nova 2012, 35, 612–615. [CrossRef]
- Derringer, G.; Suich, R. Simultaneous Optimization of Several Response Variables. J. Qual. Tech. 1980, 12, 214–219. [Google Scholar] [CrossRef]
Figure 1.
Chemical maps (replicate 1) obtained from the mixture of Crodamol™ CP pharma with Super Refined™ Oleic Acid (A), Super Refined™ GTCC (B), Super Refined™ Sesame Oil (C), Super Refined™ Soybean Oil (D) (all in the 1:1 w/w ratio).
Figure 1.
Chemical maps (replicate 1) obtained from the mixture of Crodamol™ CP pharma with Super Refined™ Oleic Acid (A), Super Refined™ GTCC (B), Super Refined™ Sesame Oil (C), Super Refined™ Soybean Oil (D) (all in the 1:1 w/w ratio).
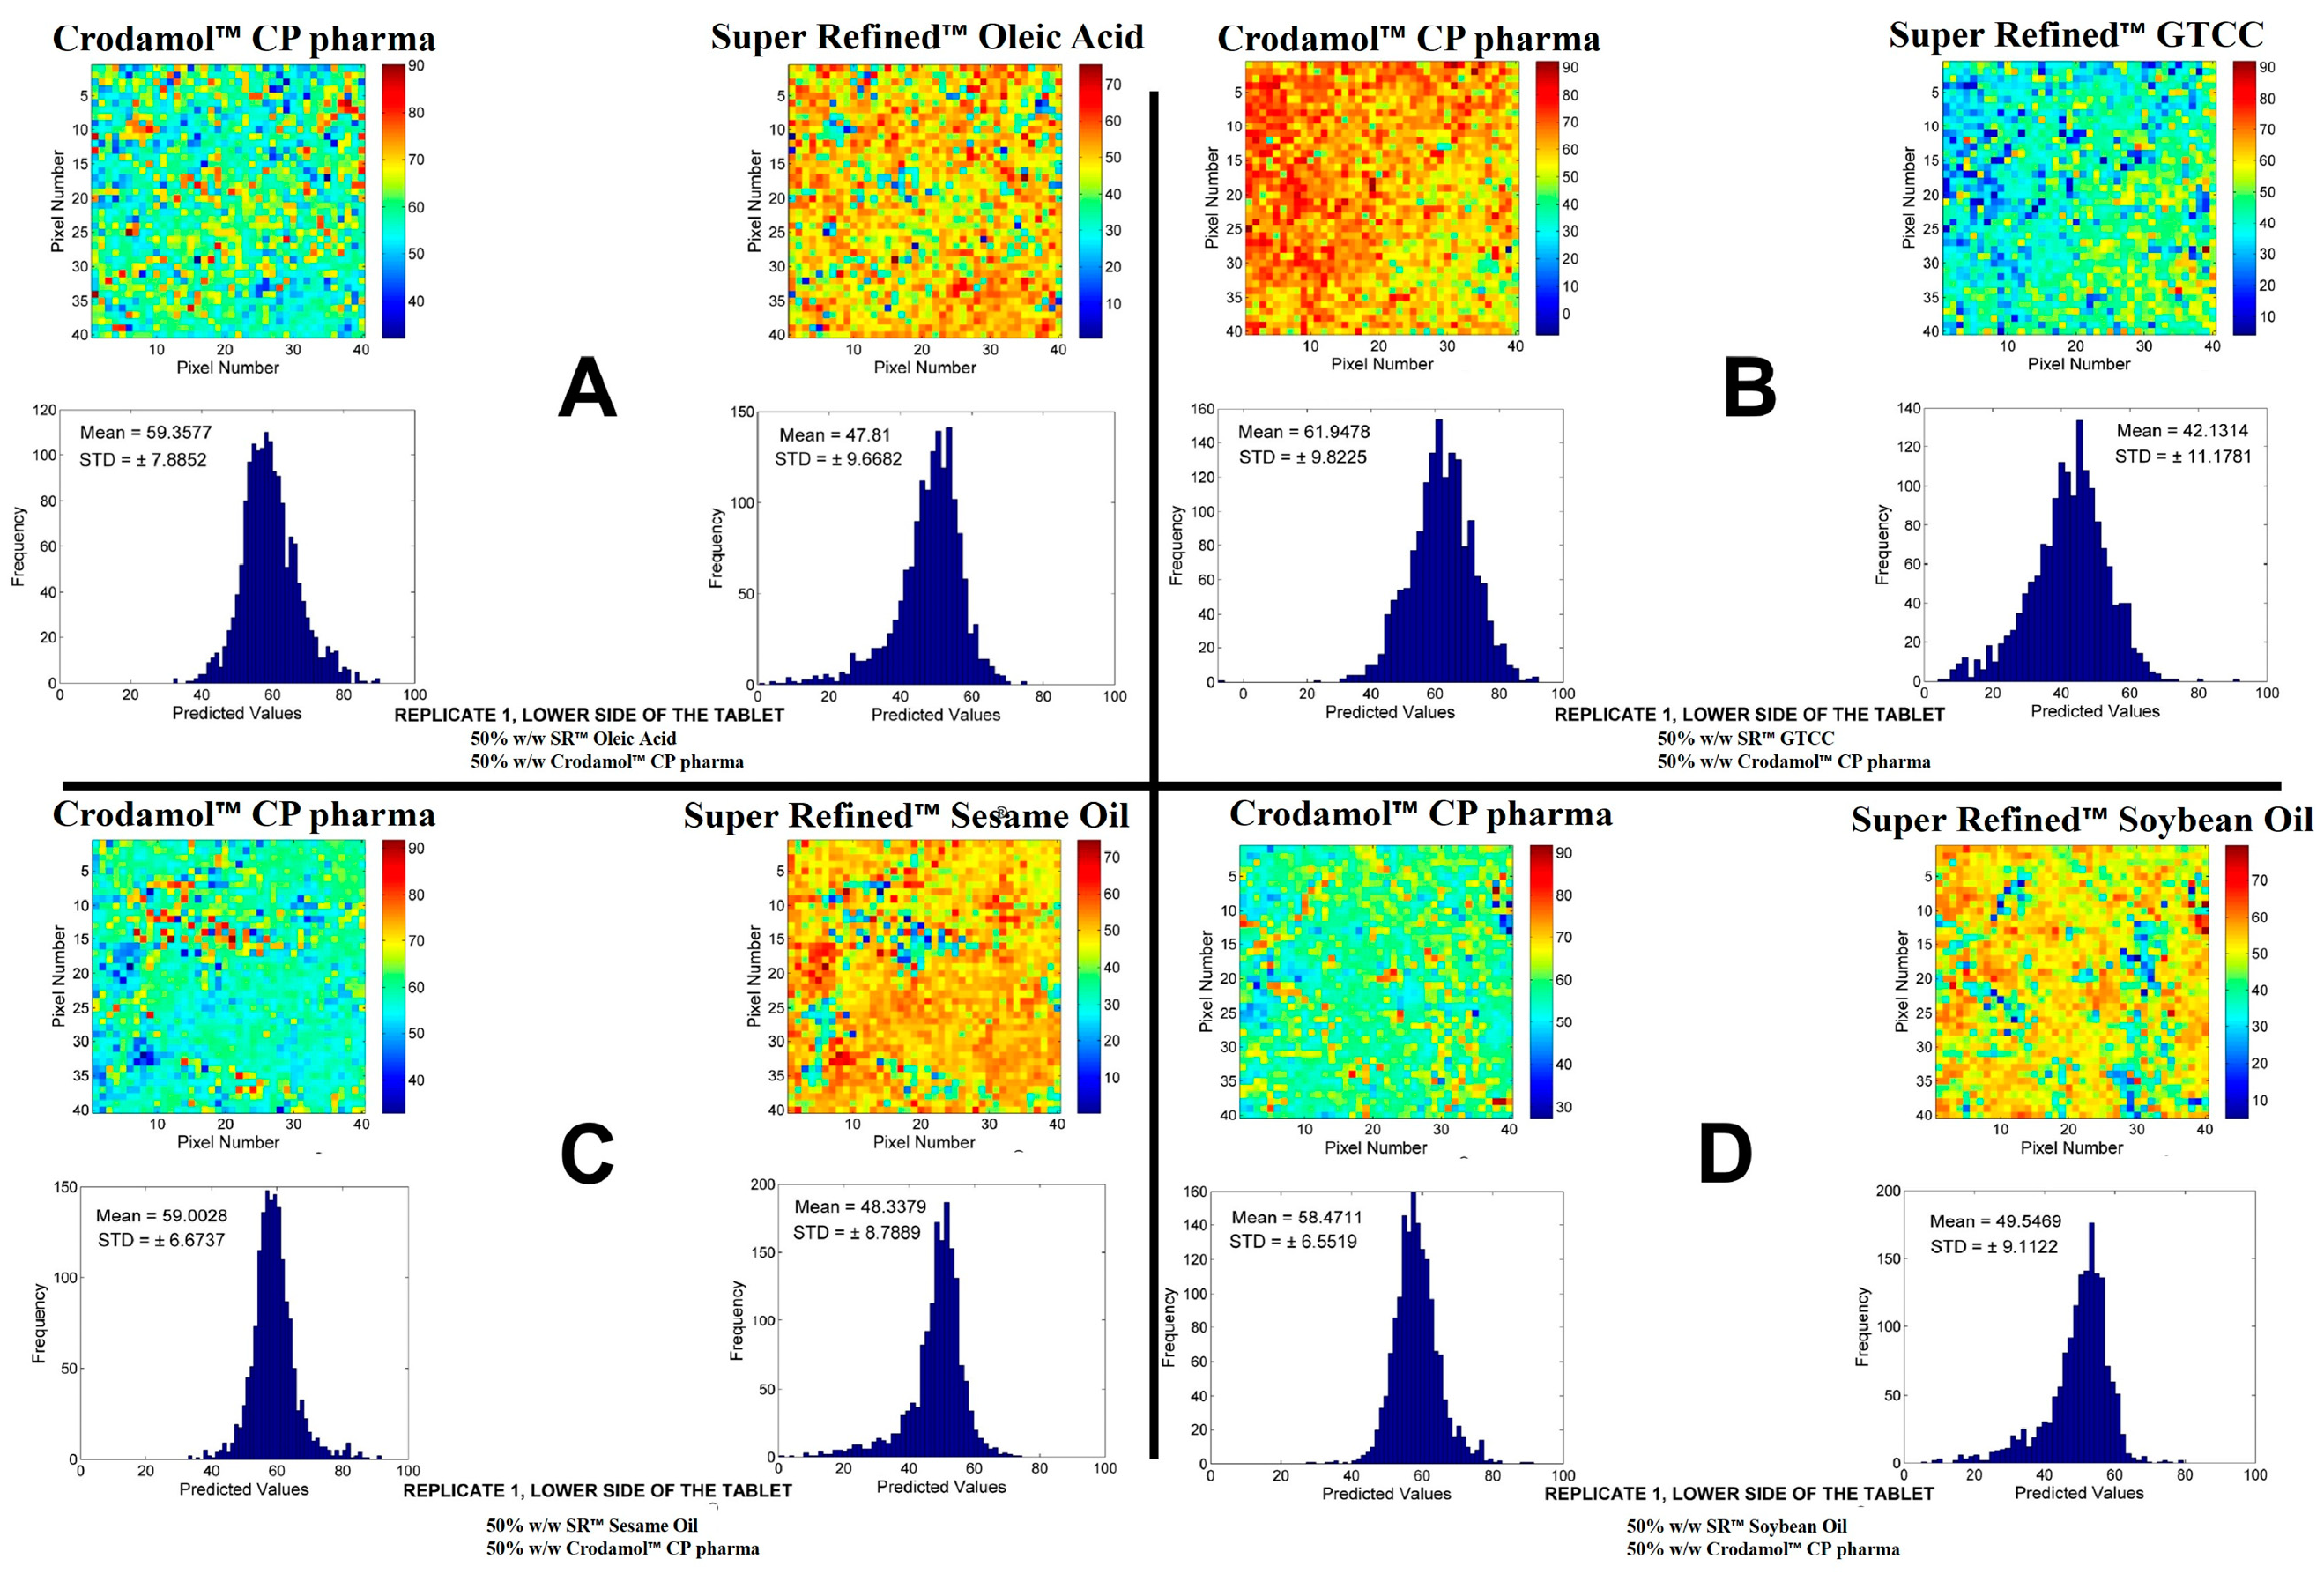
Figure 2.
Chemical maps (replicate 1) obtained from the mixture of Crodamol™ CP pharma with Super Refined™ GMCC (1:3 w/w ratio (A), 1:1 (B), 3:1 (C)) and Super Refined™ PGMC (1:3 w/w ratio (D), 1:1 (E), 3:1 (F)).
Figure 2.
Chemical maps (replicate 1) obtained from the mixture of Crodamol™ CP pharma with Super Refined™ GMCC (1:3 w/w ratio (A), 1:1 (B), 3:1 (C)) and Super Refined™ PGMC (1:3 w/w ratio (D), 1:1 (E), 3:1 (F)).
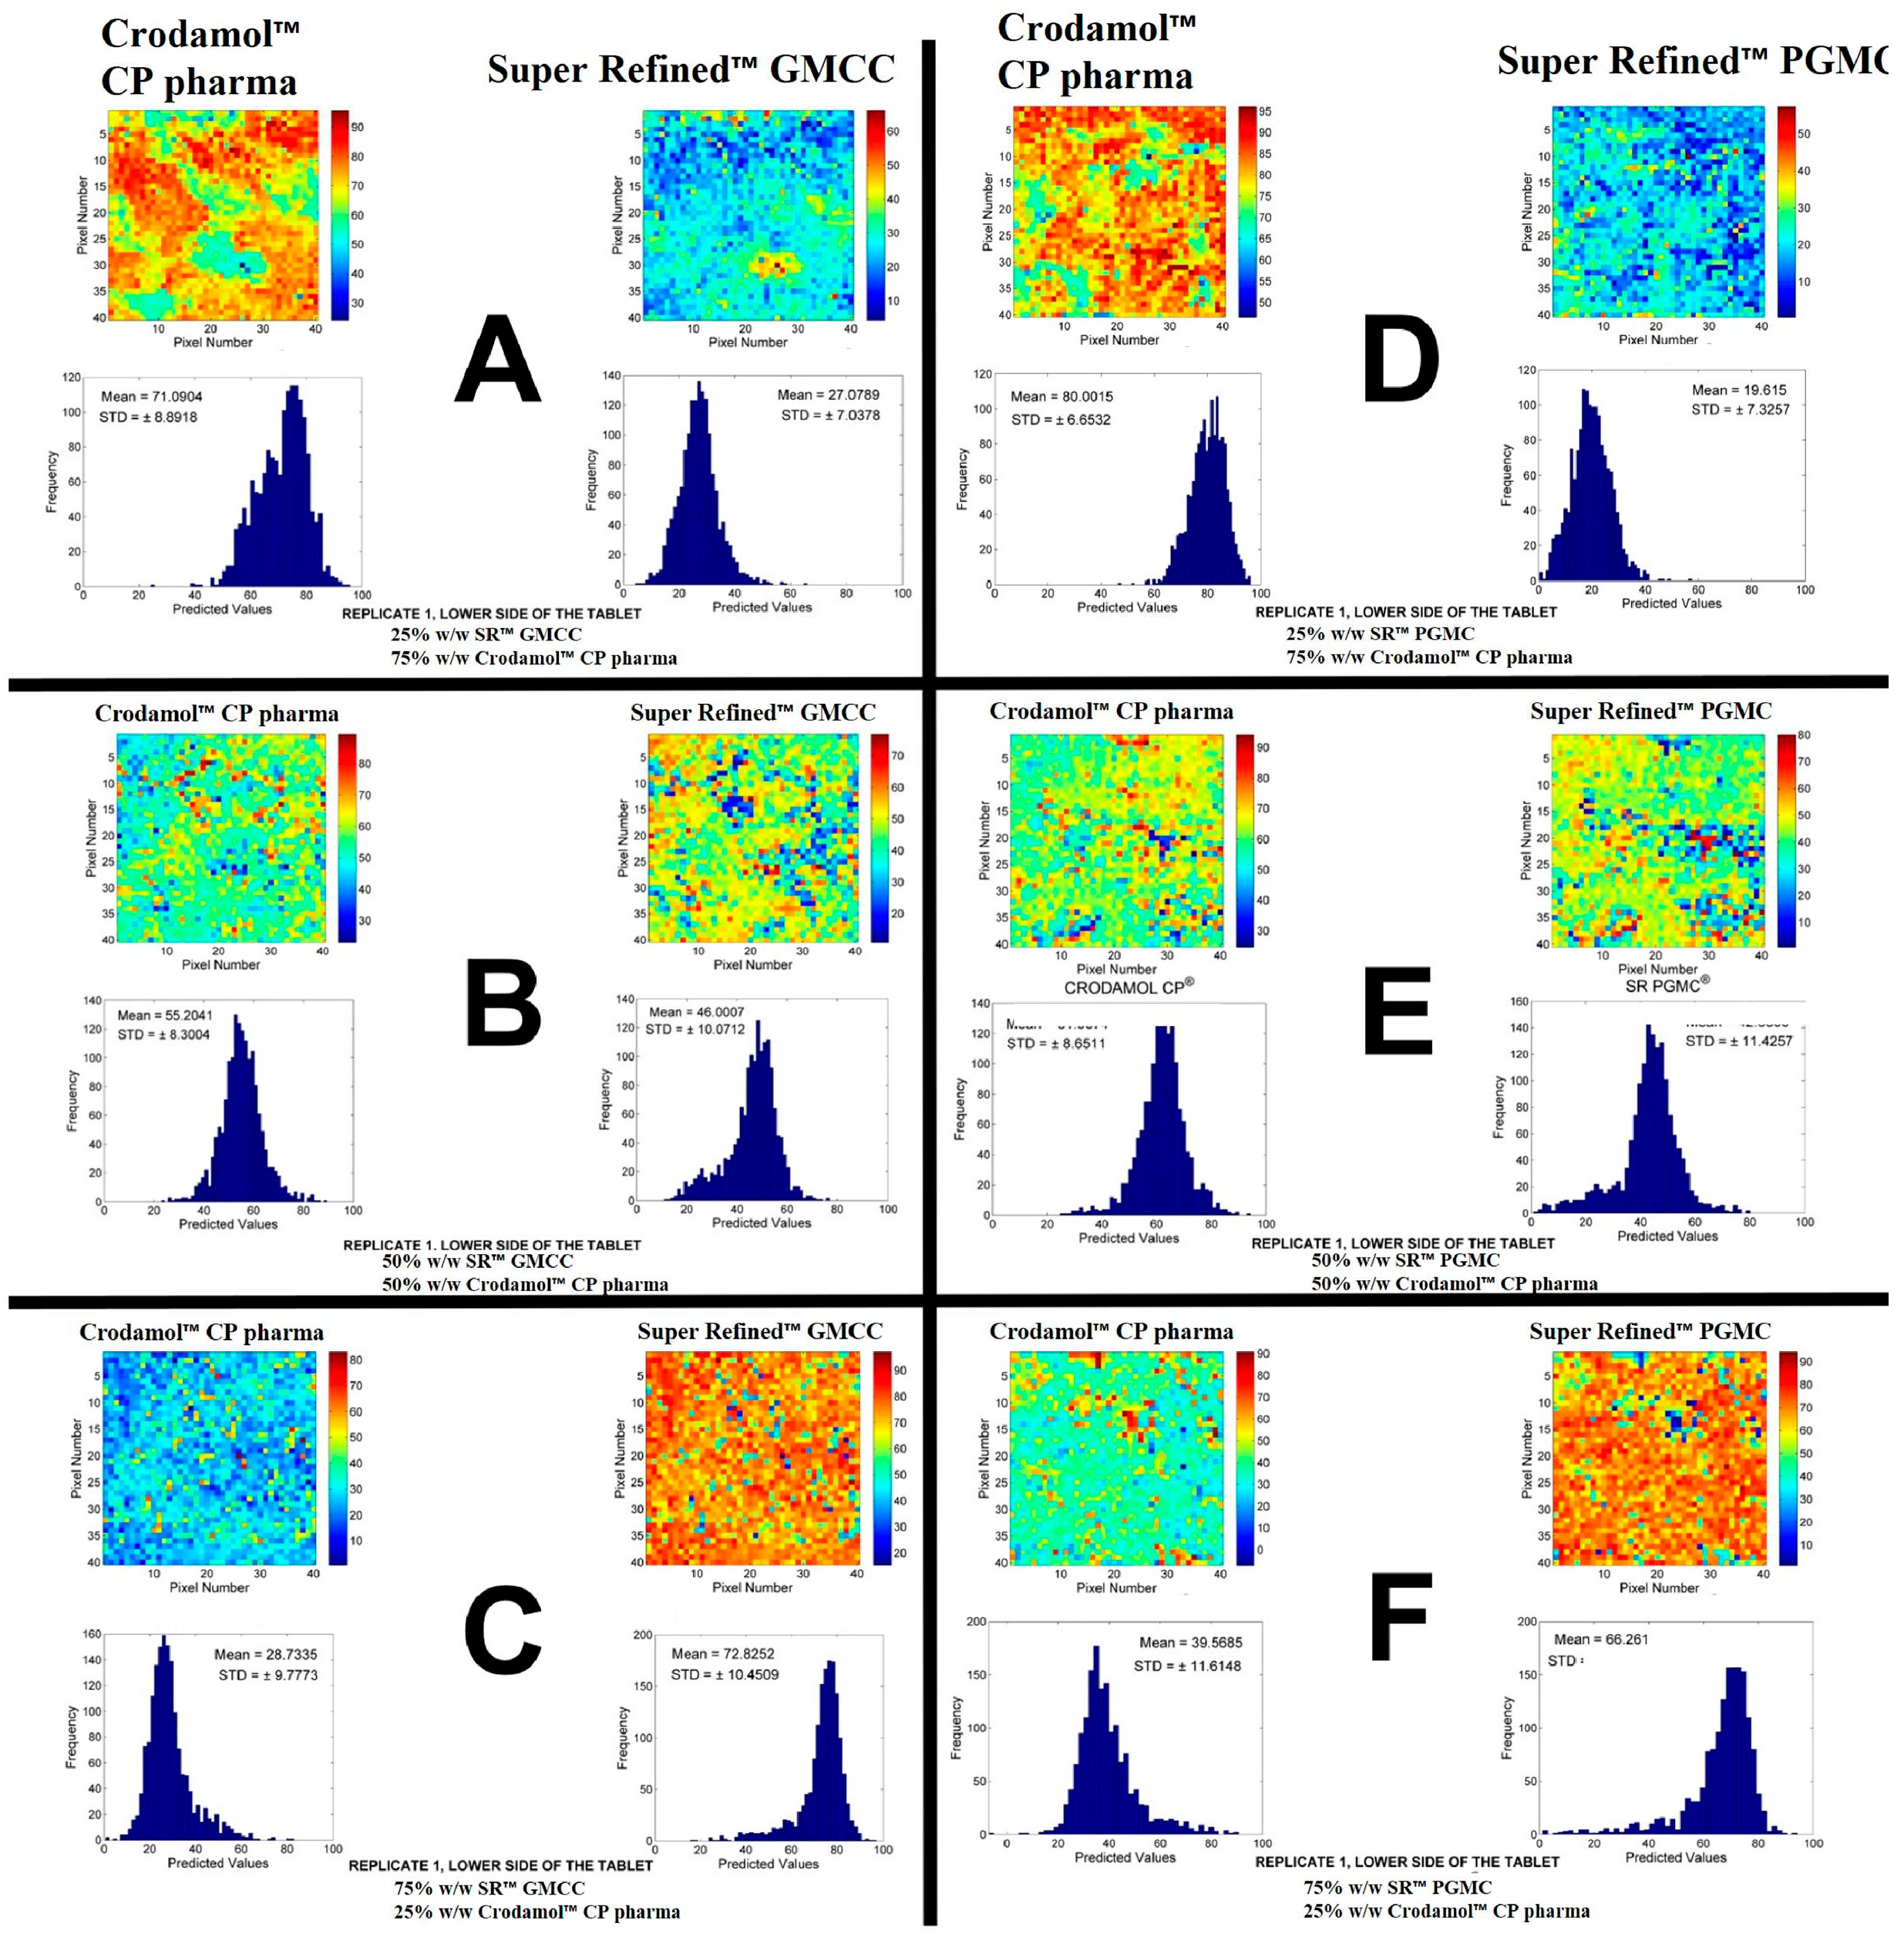
Figure 3.
Chemical maps (replicate 1) obtained from the mixture of Crodamol™ CP pharma with Super Refined™ Lauryl Lactate (1:3 w/w ratio (A), 1:1(B), 3:1(C)) and Super Refined™ DMI (1:3 w/w ratio (D), 1:1(E), 3:1(F)).
Figure 3.
Chemical maps (replicate 1) obtained from the mixture of Crodamol™ CP pharma with Super Refined™ Lauryl Lactate (1:3 w/w ratio (A), 1:1(B), 3:1(C)) and Super Refined™ DMI (1:3 w/w ratio (D), 1:1(E), 3:1(F)).
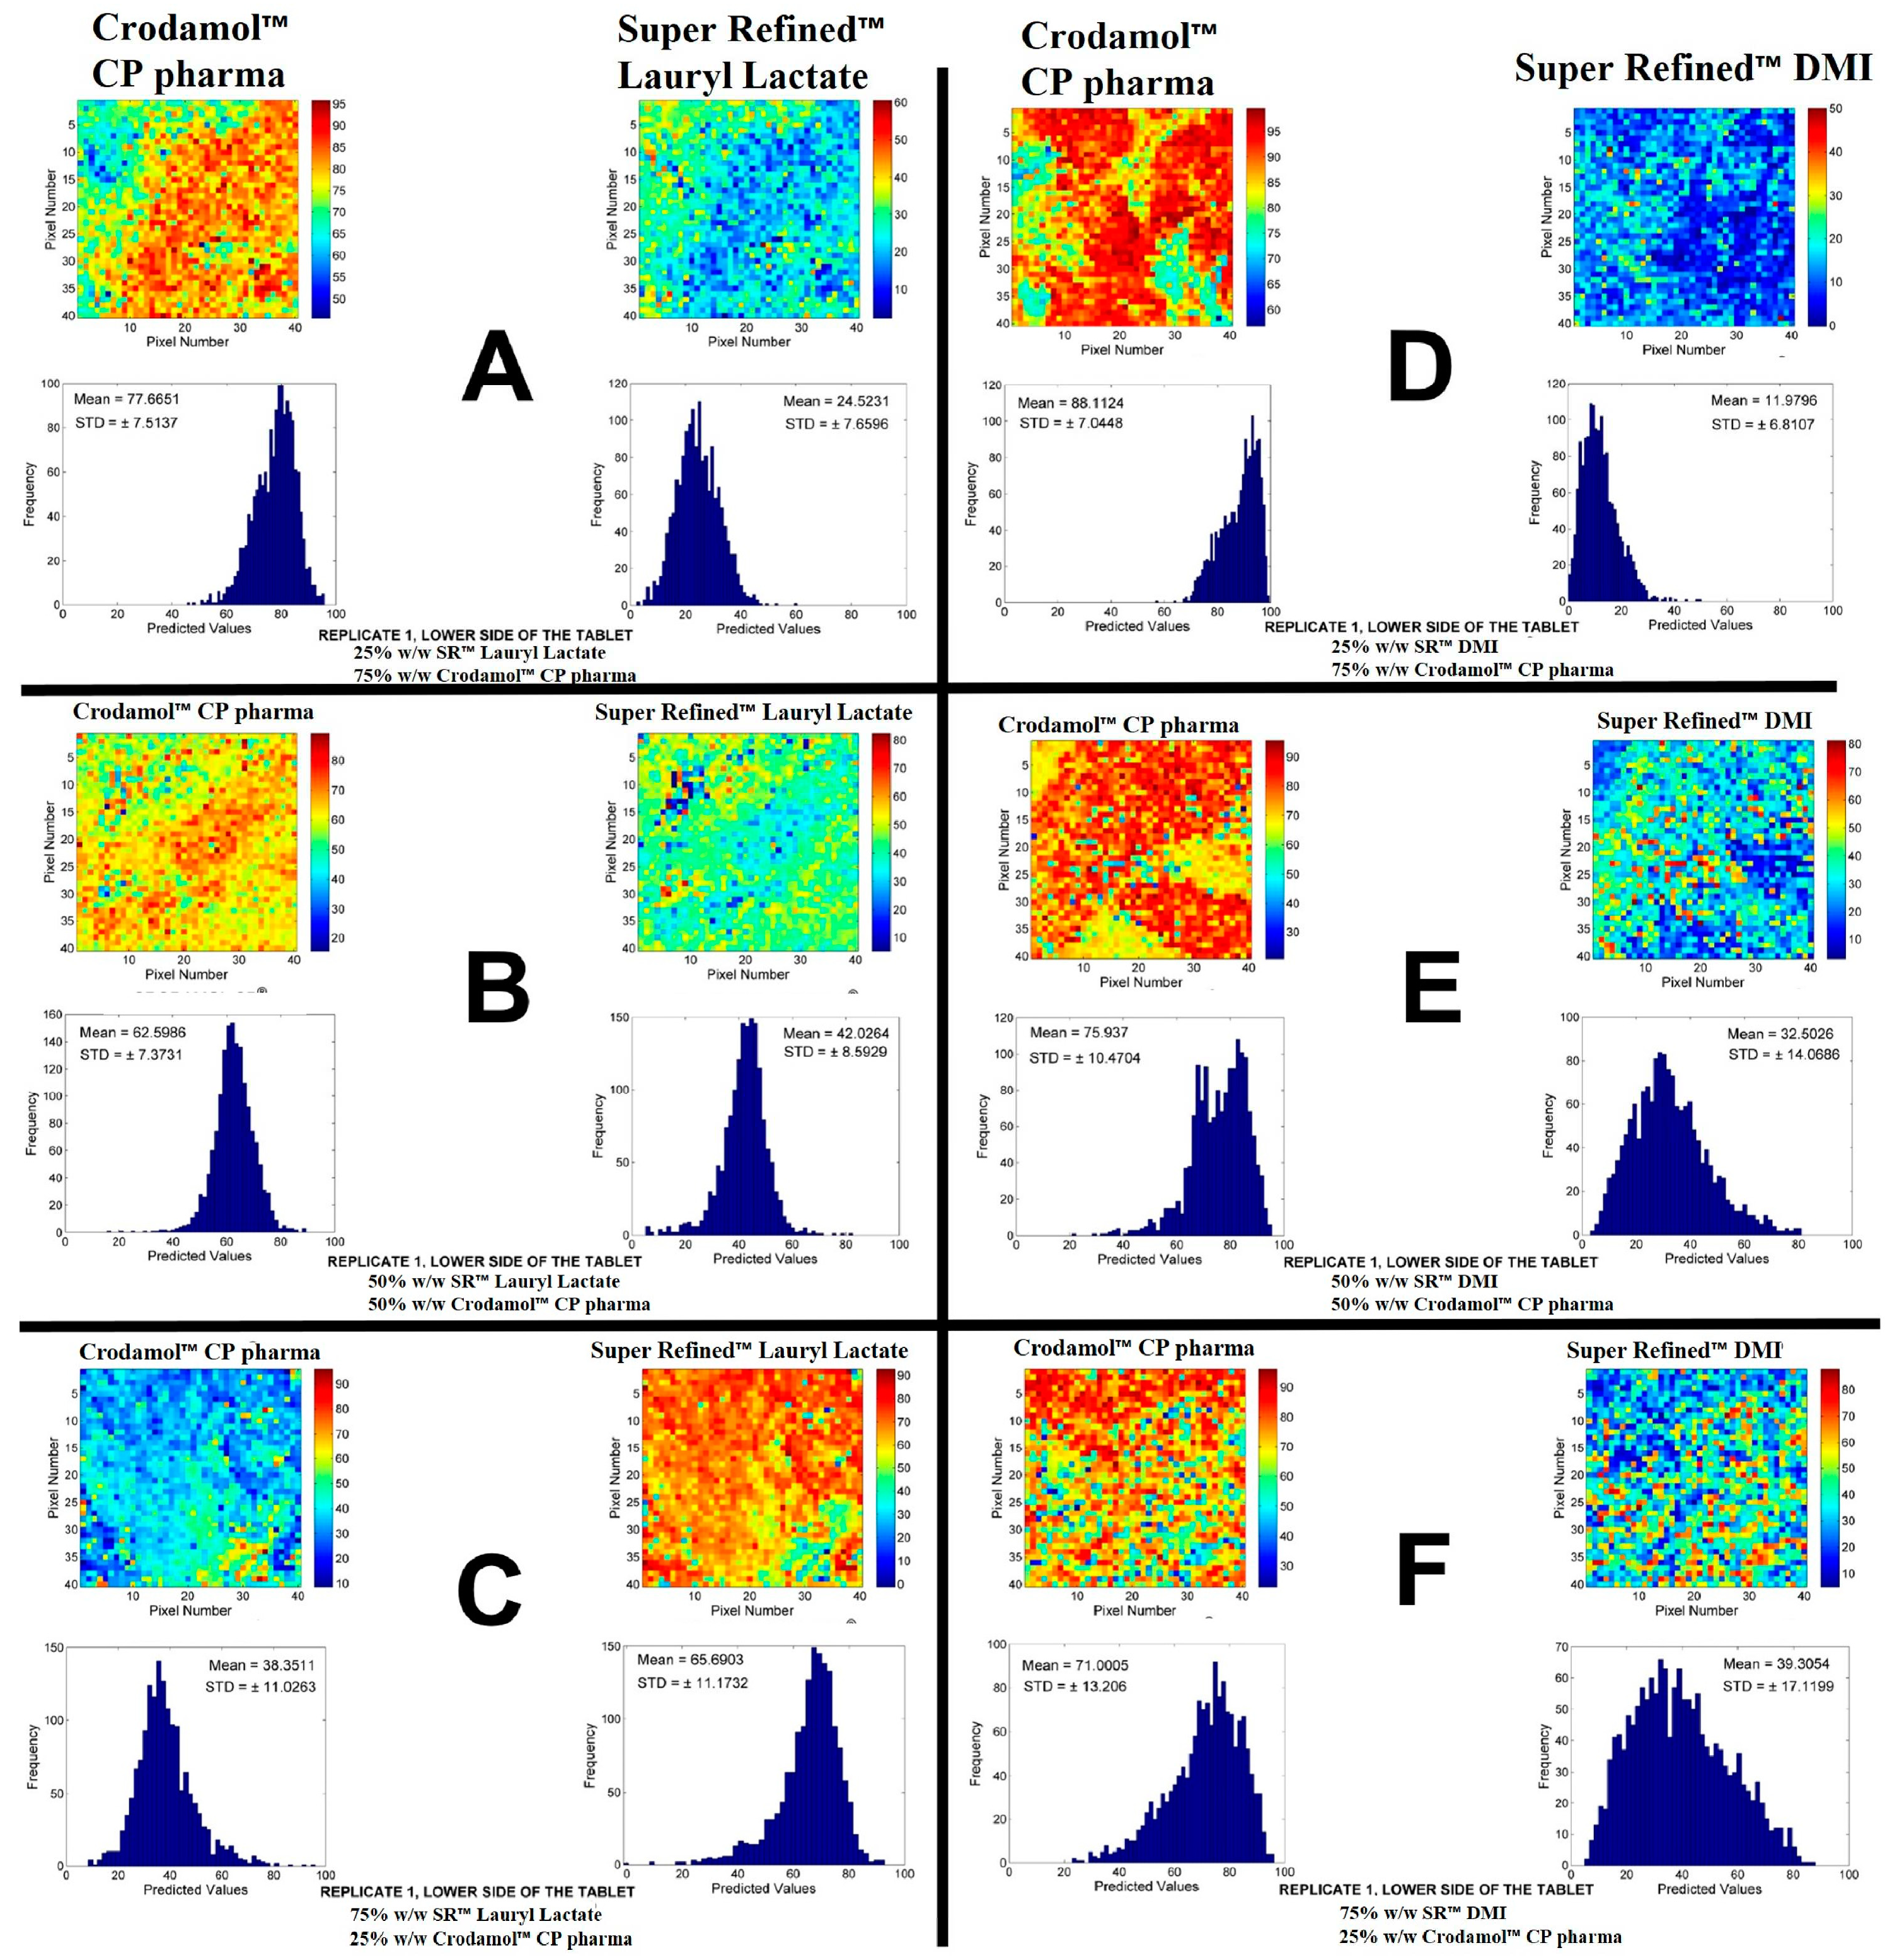
Figure 4.
Chemical maps (replicate 1) obtained from upper/lower side of Crodamol™ CP pharma/ Crodasol™ HS HP (A,B) and Crodamol™ CP pharma /Croduret™ 40(C, D) (all in the 1:1 w/w ratio).
Figure 4.
Chemical maps (replicate 1) obtained from upper/lower side of Crodamol™ CP pharma/ Crodasol™ HS HP (A,B) and Crodamol™ CP pharma /Croduret™ 40(C, D) (all in the 1:1 w/w ratio).
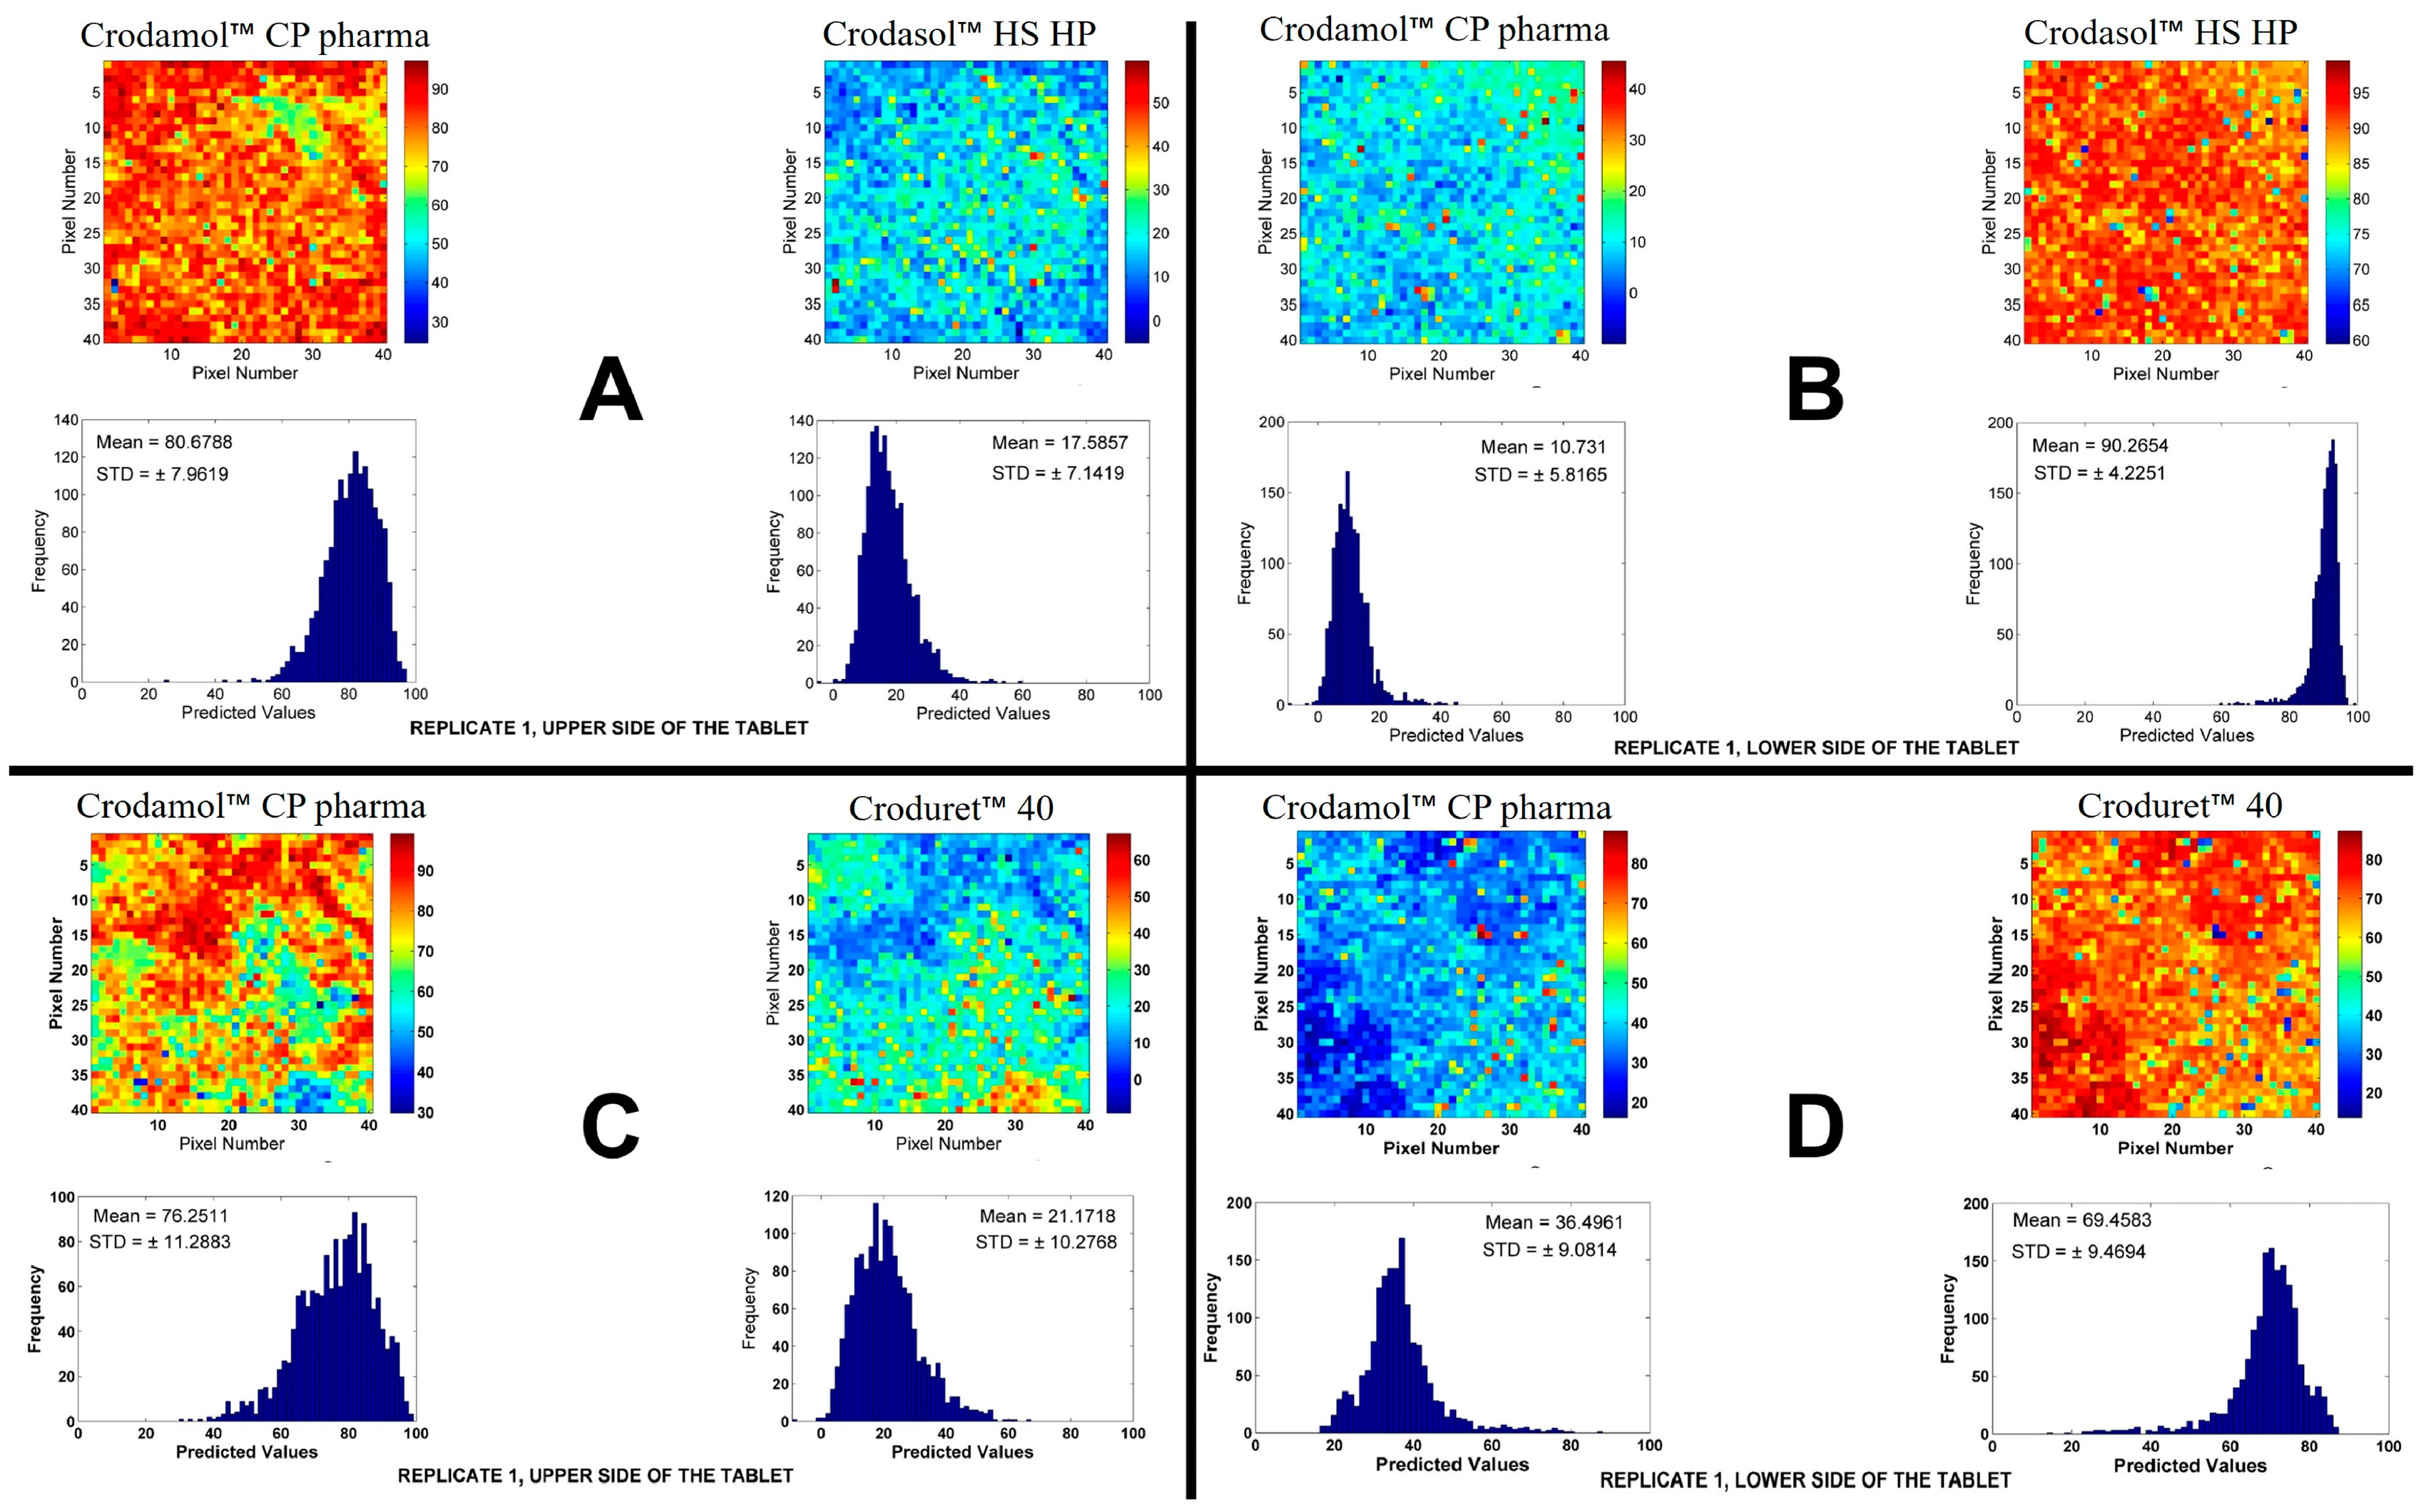
Figure 5.
The values for STD, DHI value and kurtosis for each excipient in all prepared mixtures.
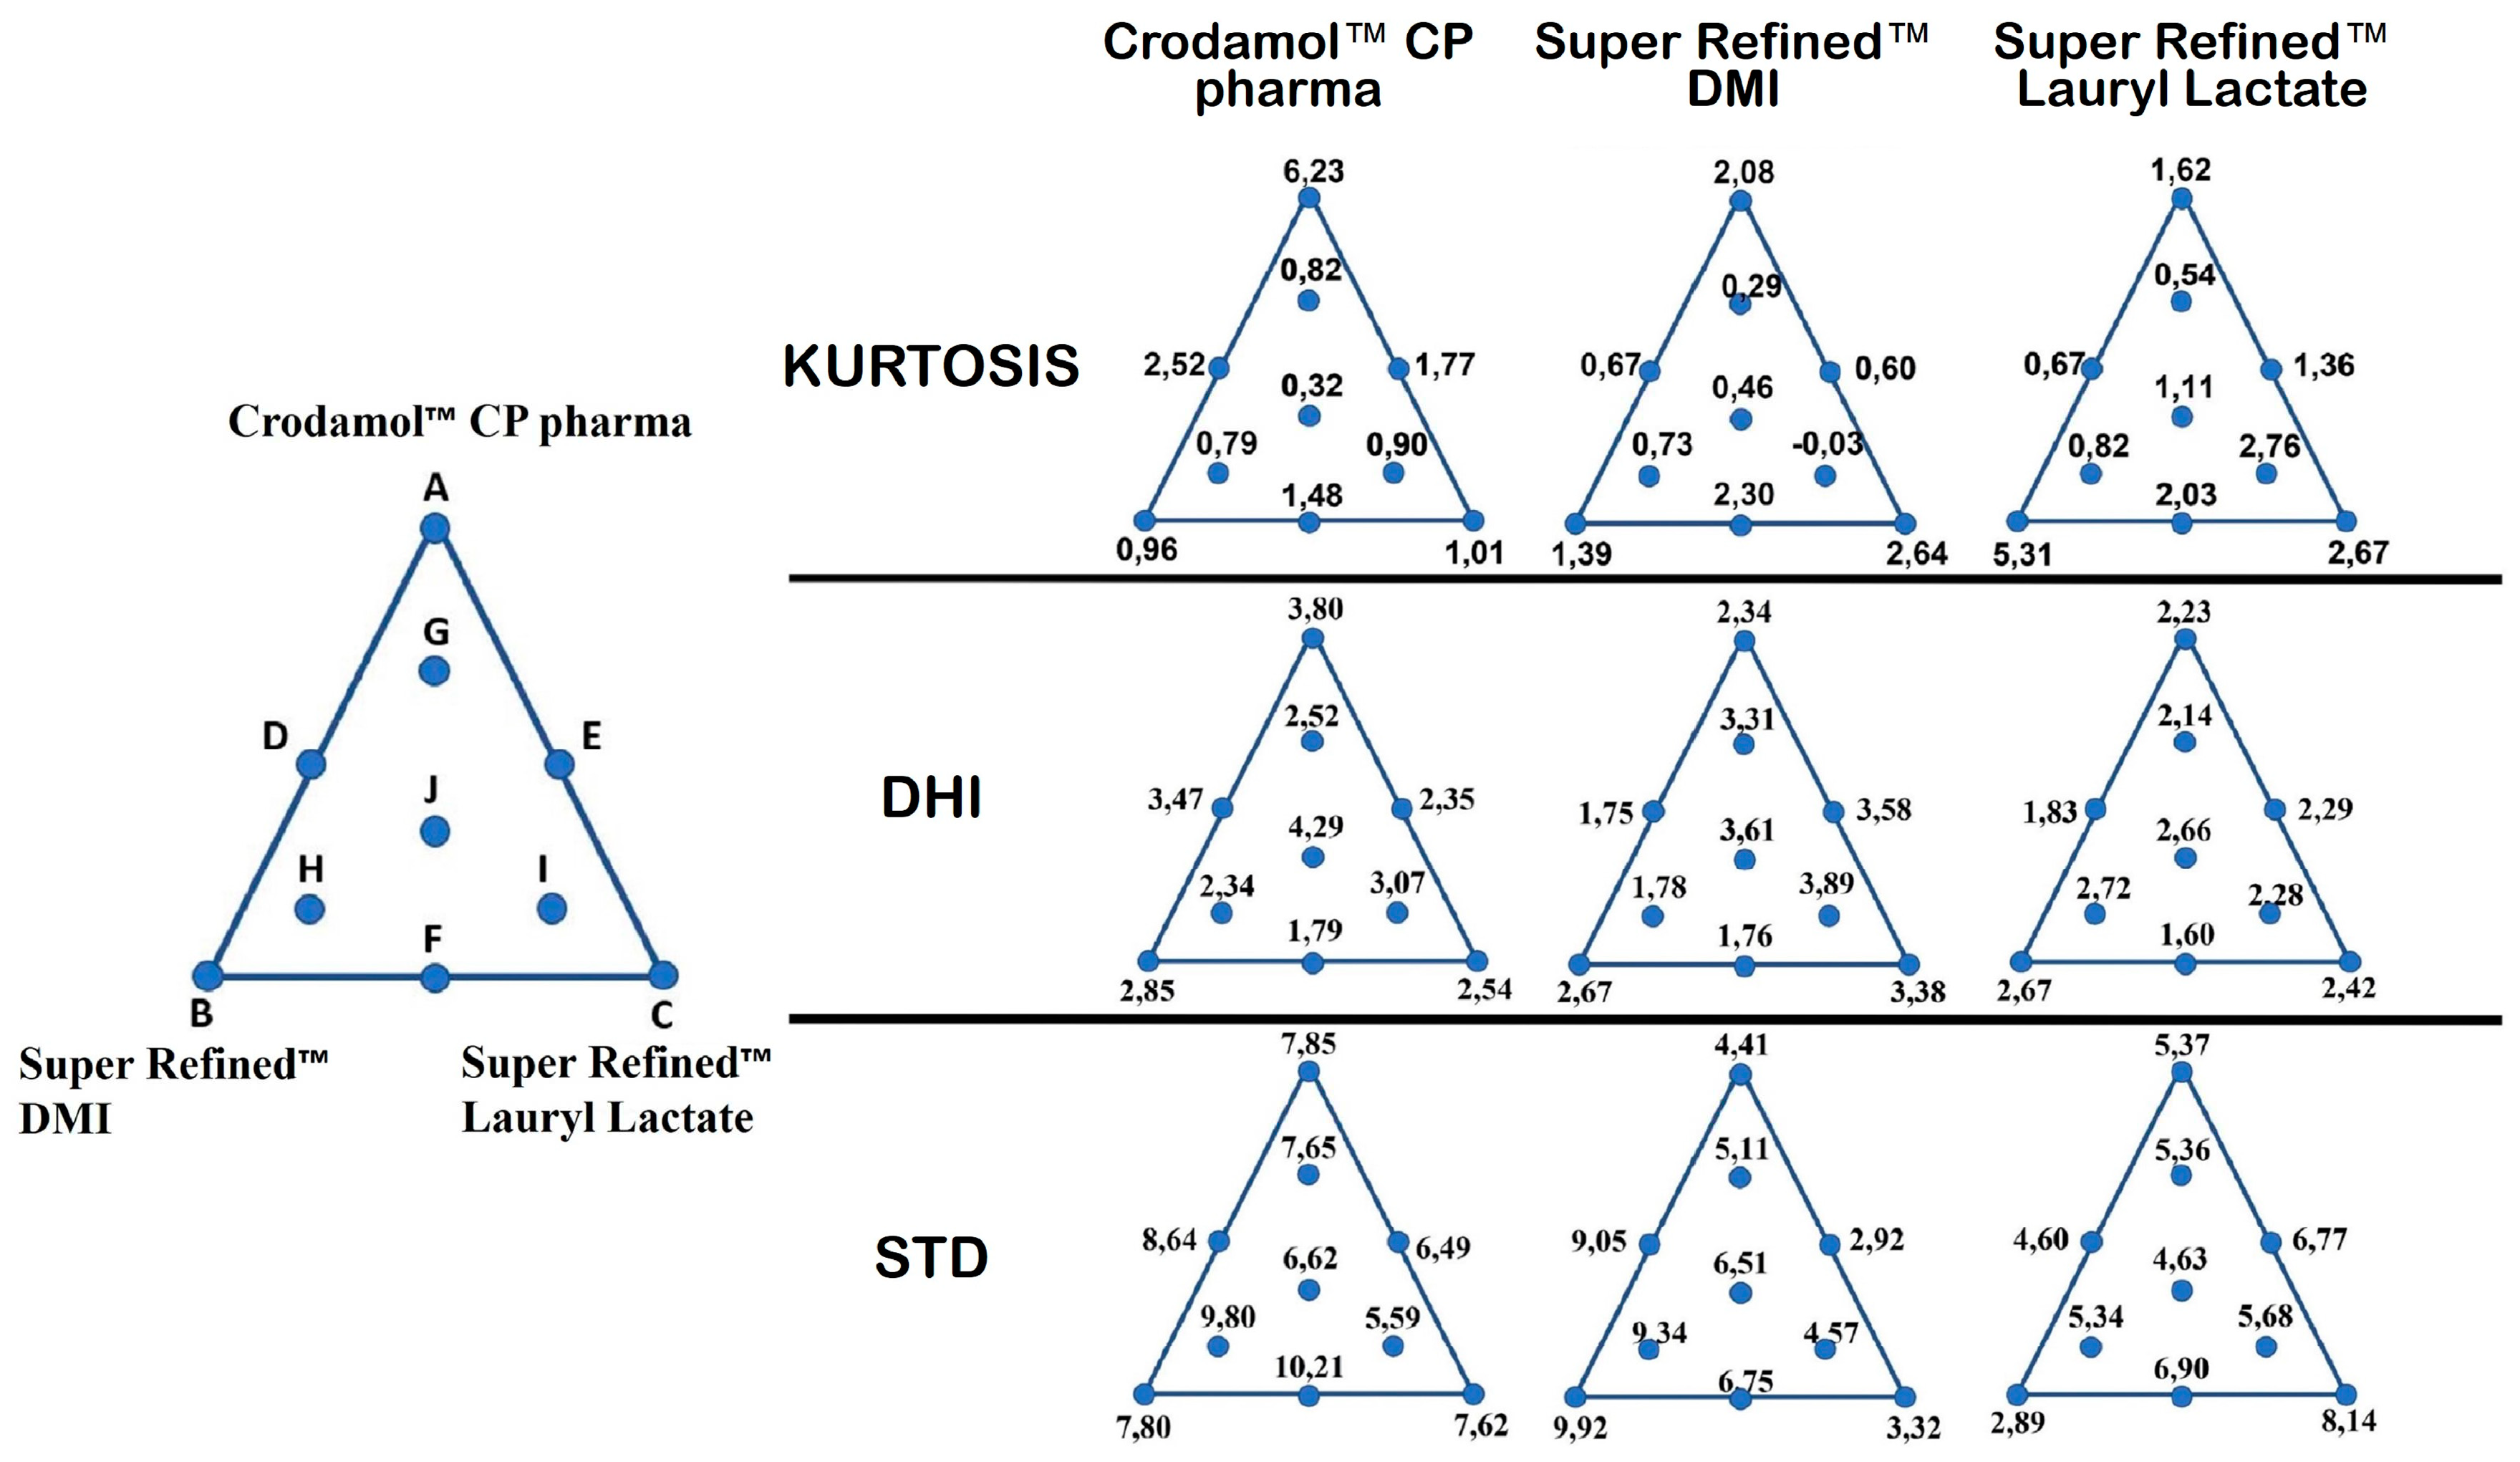
Figure 6.
Contour, surface graph and real against predicted for responses Y2 (A, B and C) e Y3 (D, E and F).
Figure 6.
Contour, surface graph and real against predicted for responses Y2 (A, B and C) e Y3 (D, E and F).
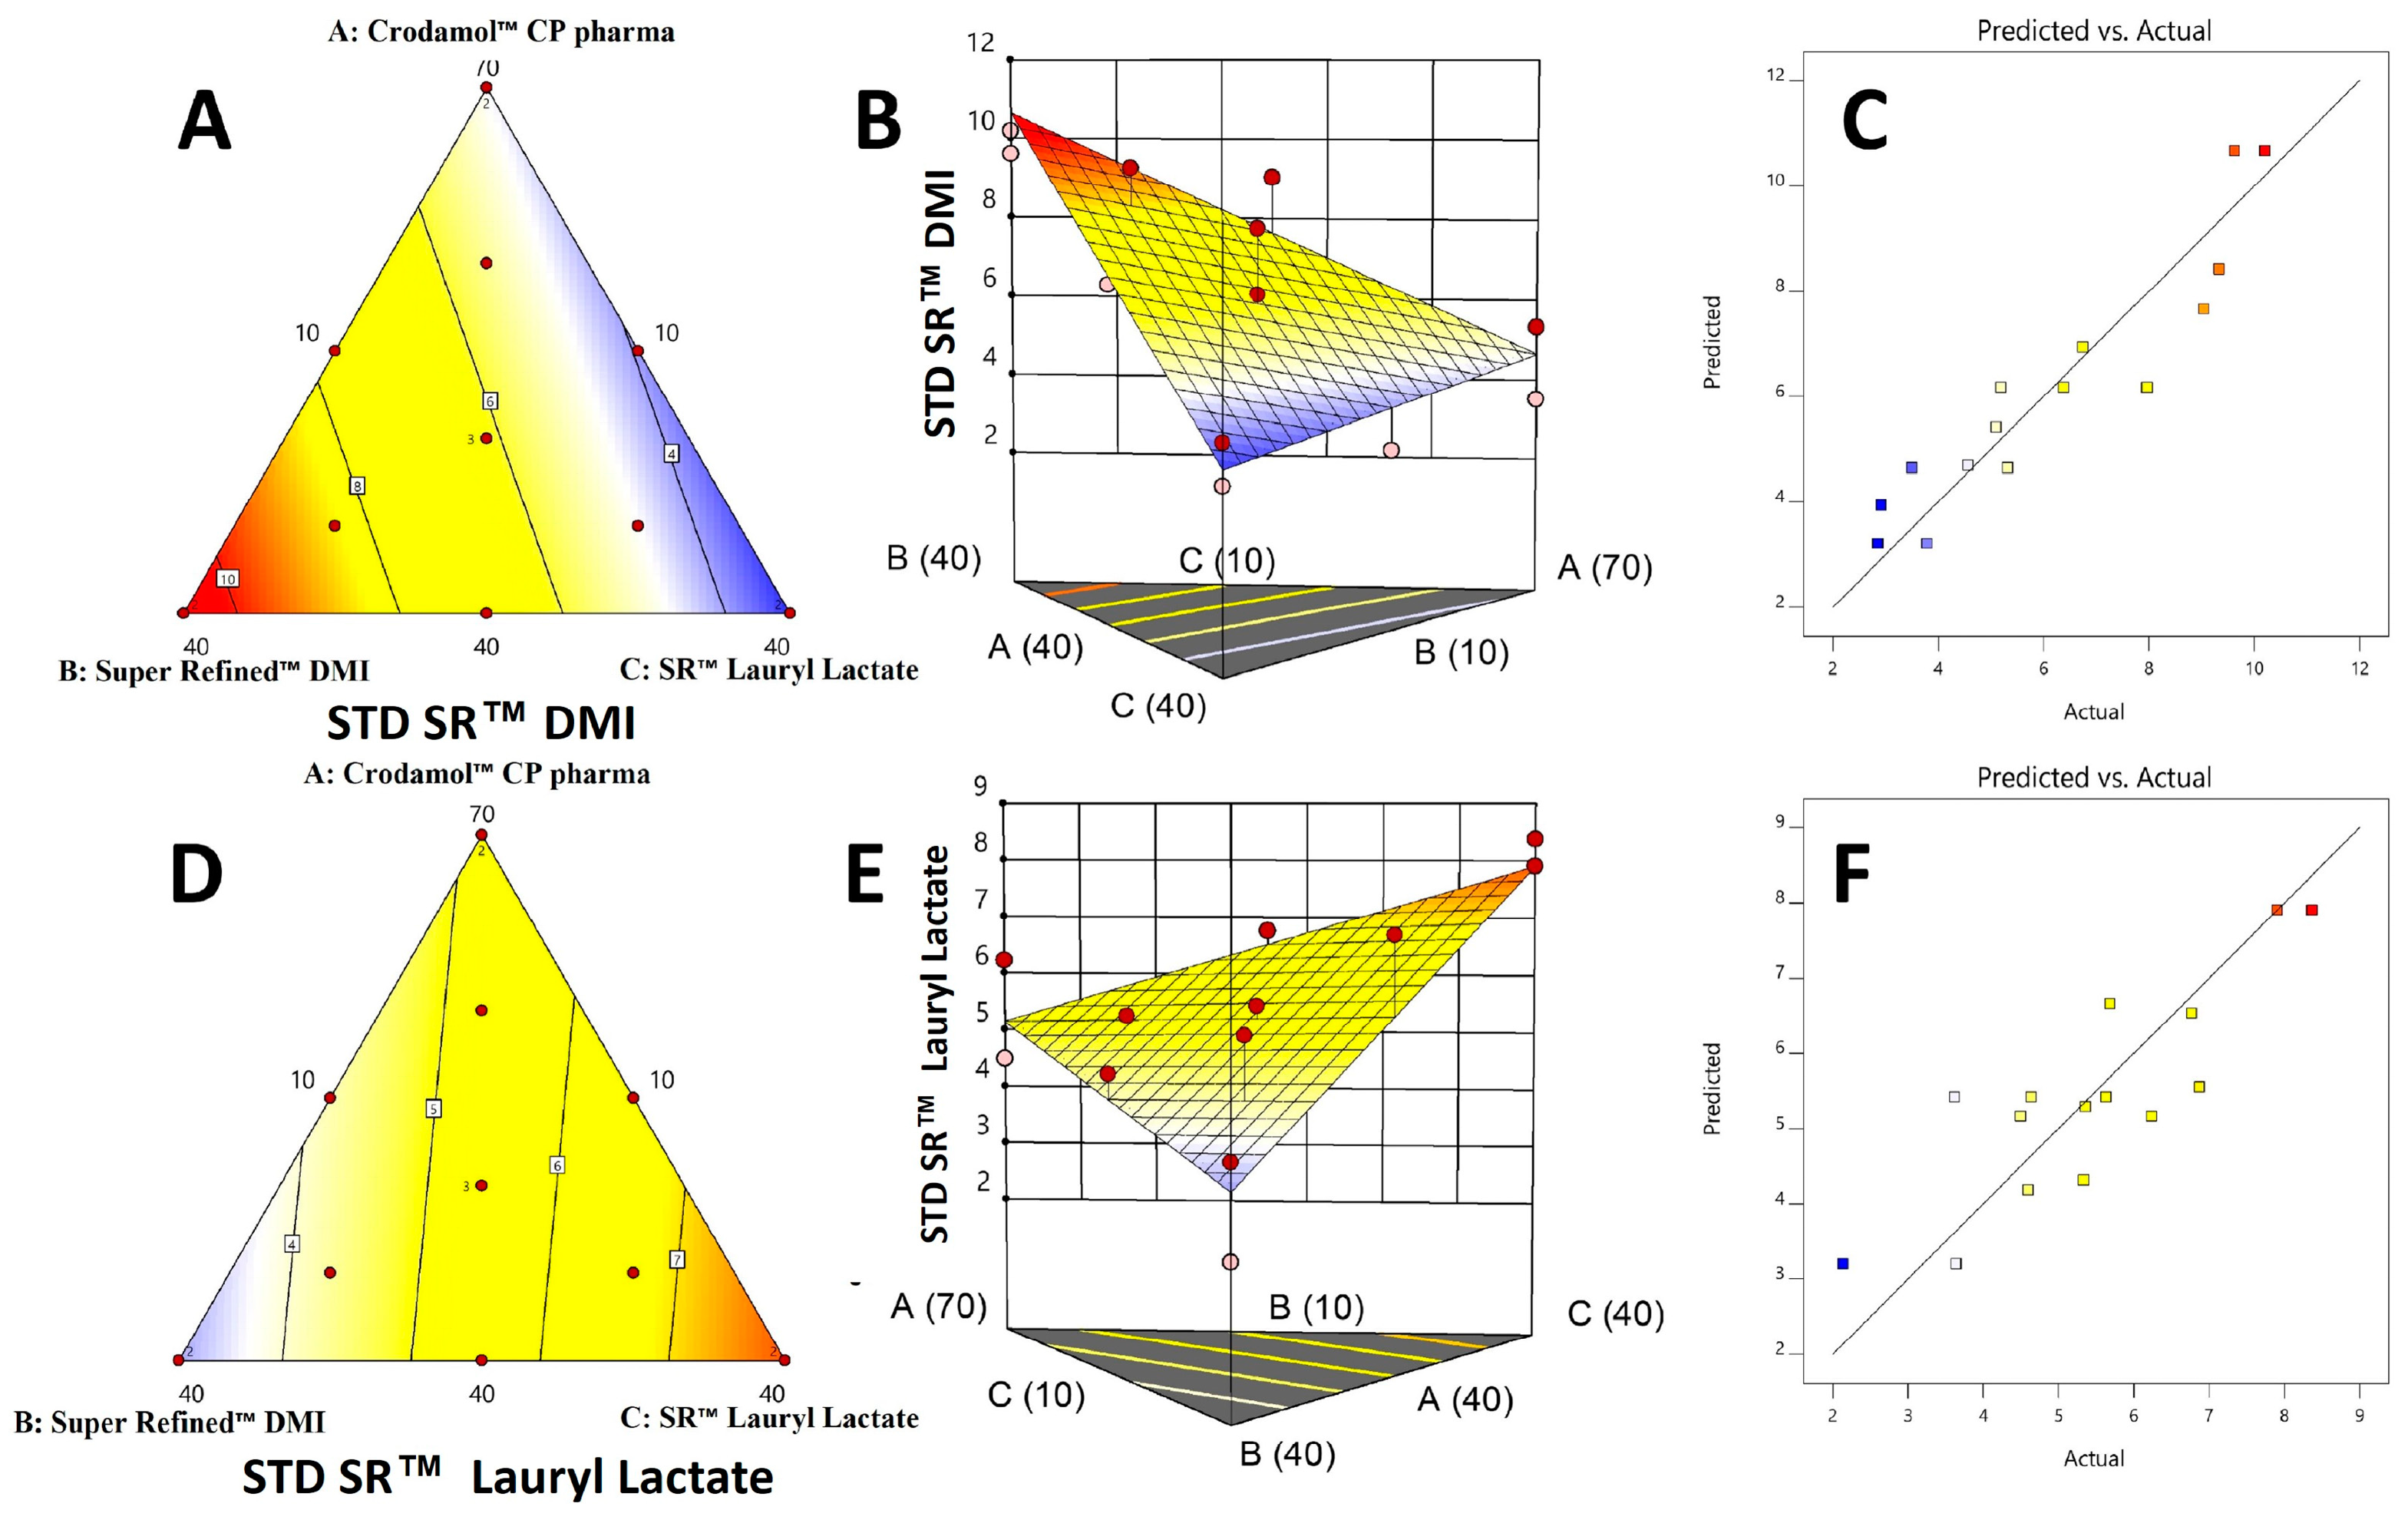
Figure 7.
Global desirability graphs: (A) Crodamol™ CP pharma, (B) Super Refined™ DMI and (C) Super Refined™ Lauryl Lactate.
Figure 7.
Global desirability graphs: (A) Crodamol™ CP pharma, (B) Super Refined™ DMI and (C) Super Refined™ Lauryl Lactate.
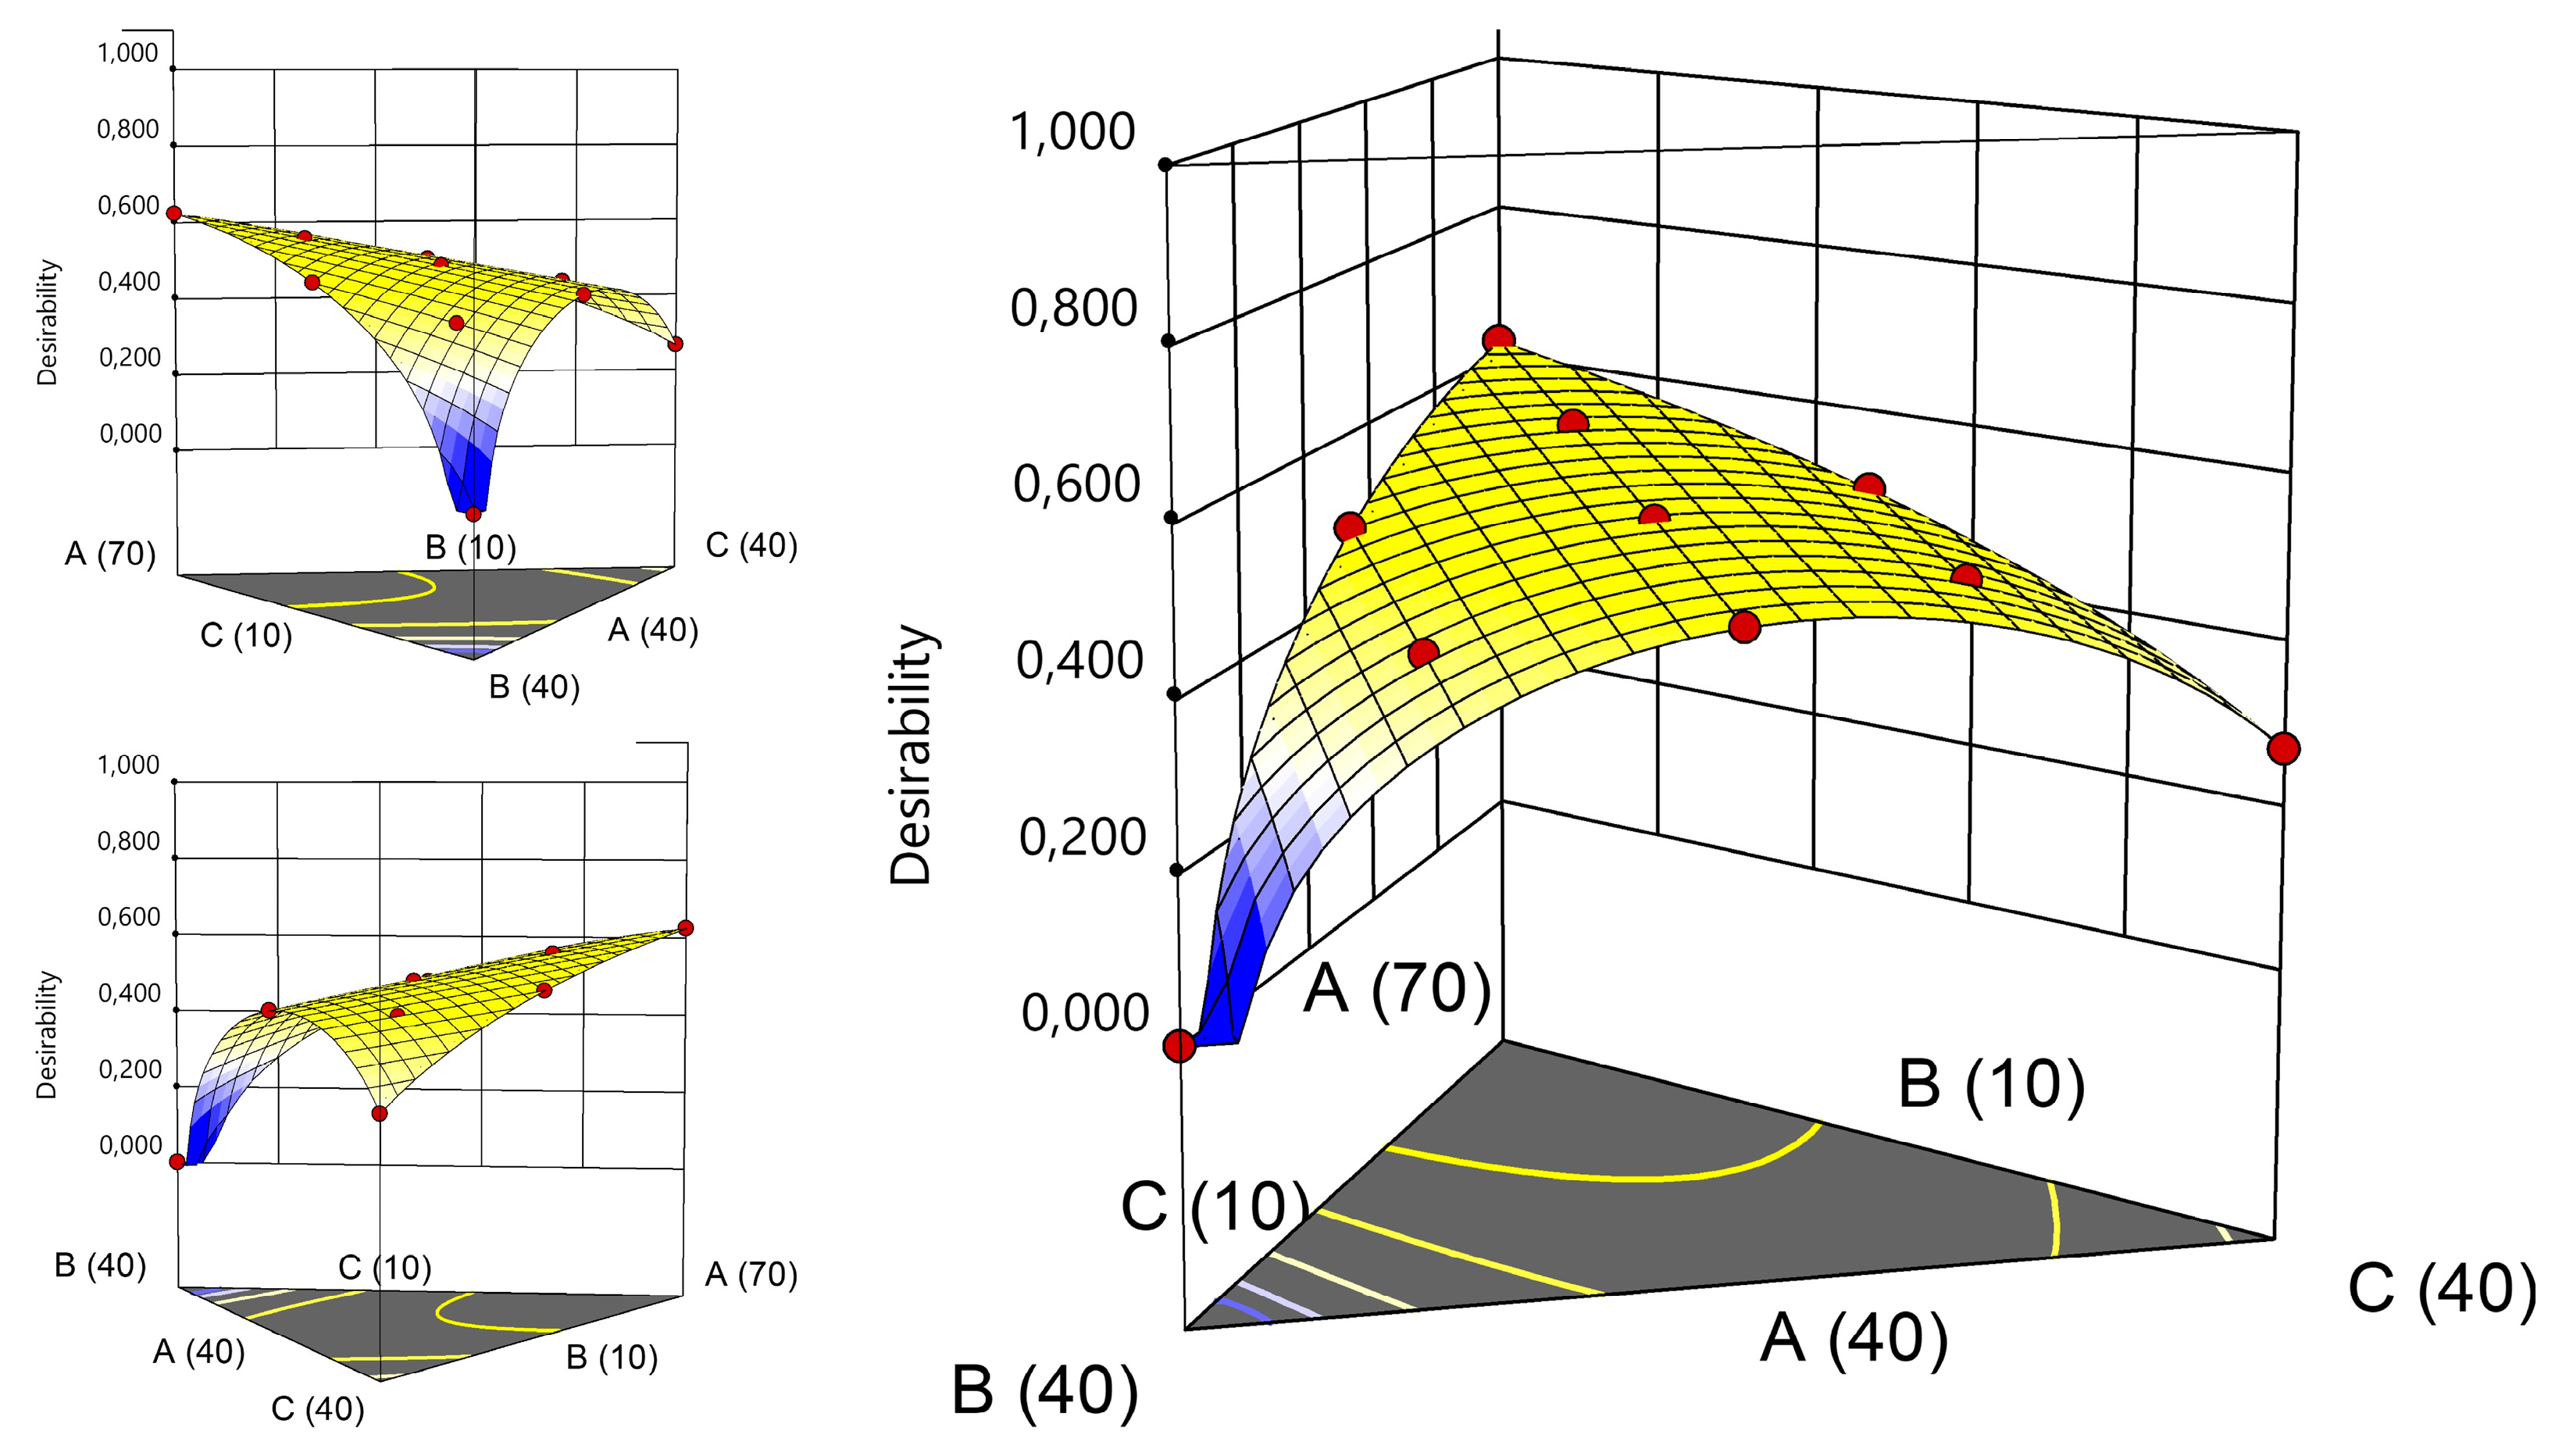
Figure 8.
Chemical maps and histograms for the mixture design points A, F, G, H, I and J.
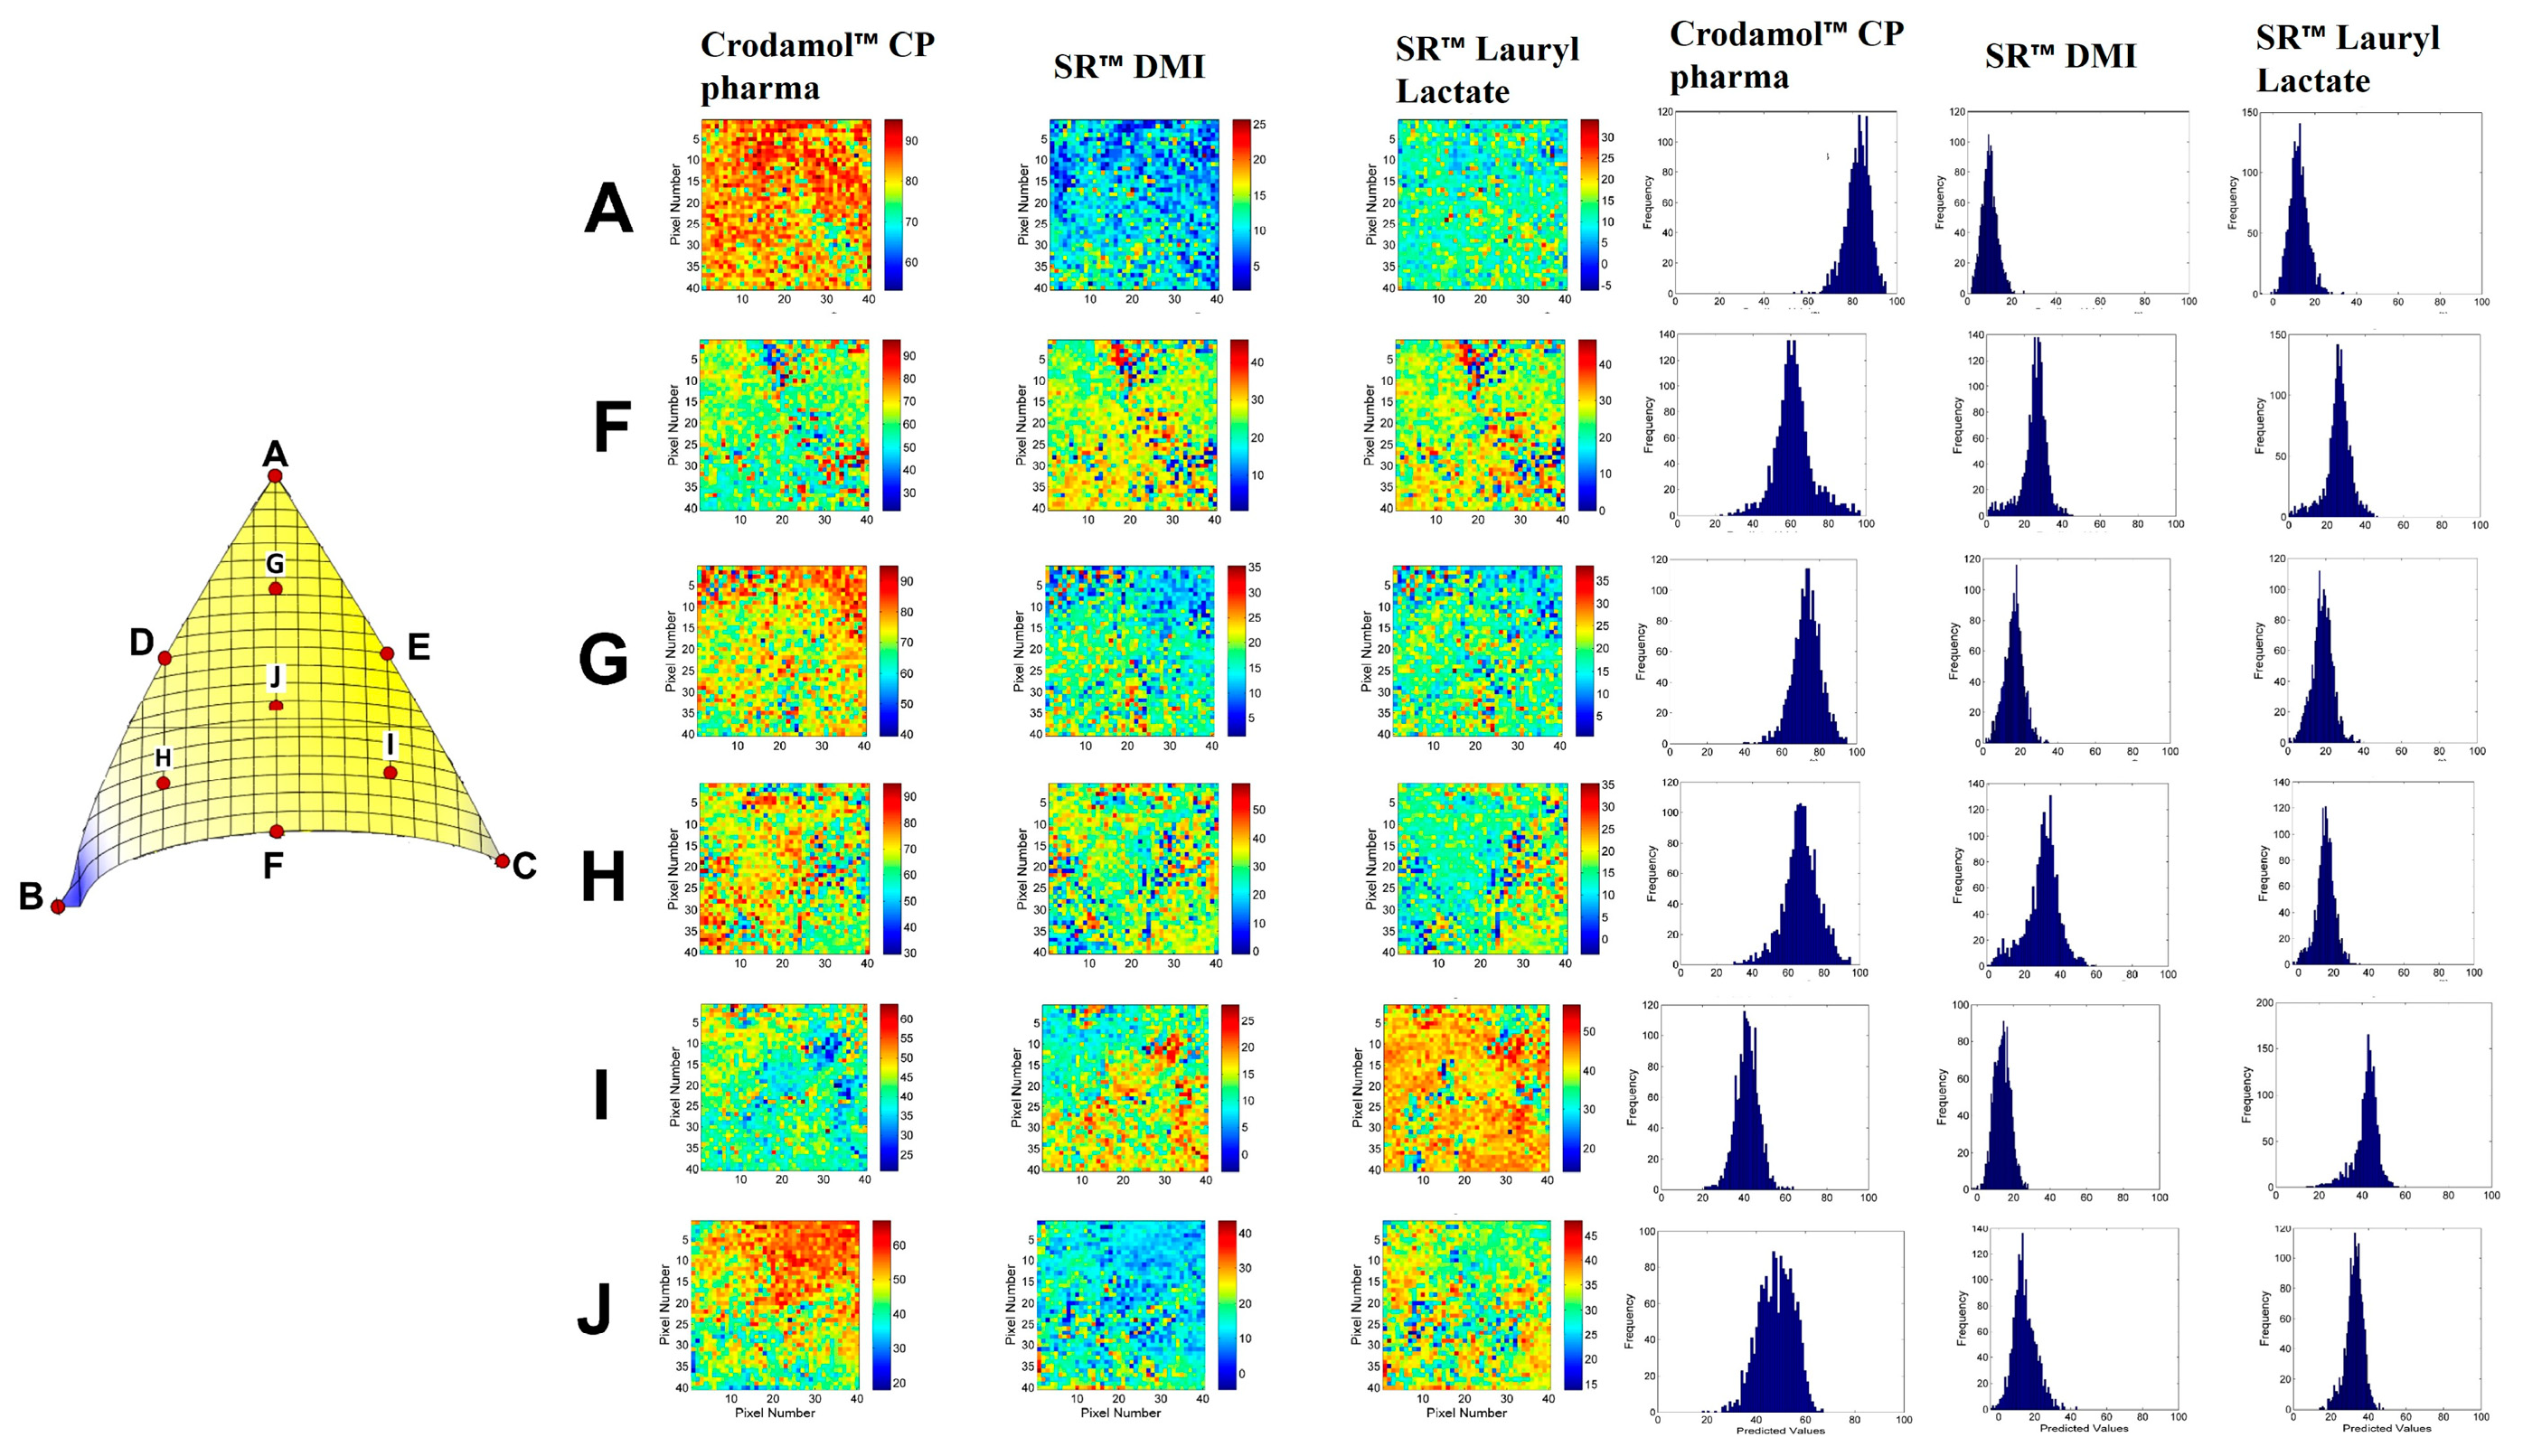
Figure 9.
Chemical maps of the mixtures with the excipients Crodamol™ CP pharma (40 (% w/w)), Super Refined™ DMI (25 (% w/w)) and Super Refined™ Lauryl Lactate (25 (% w/w)) with the drugs caffeine (A), acetaminophen (B), butamben (C), resveratrol (D), tacrolimus (E), atorvastatin calcium (F) and coenzyme Q10 (G).
Figure 9.
Chemical maps of the mixtures with the excipients Crodamol™ CP pharma (40 (% w/w)), Super Refined™ DMI (25 (% w/w)) and Super Refined™ Lauryl Lactate (25 (% w/w)) with the drugs caffeine (A), acetaminophen (B), butamben (C), resveratrol (D), tacrolimus (E), atorvastatin calcium (F) and coenzyme Q10 (G).
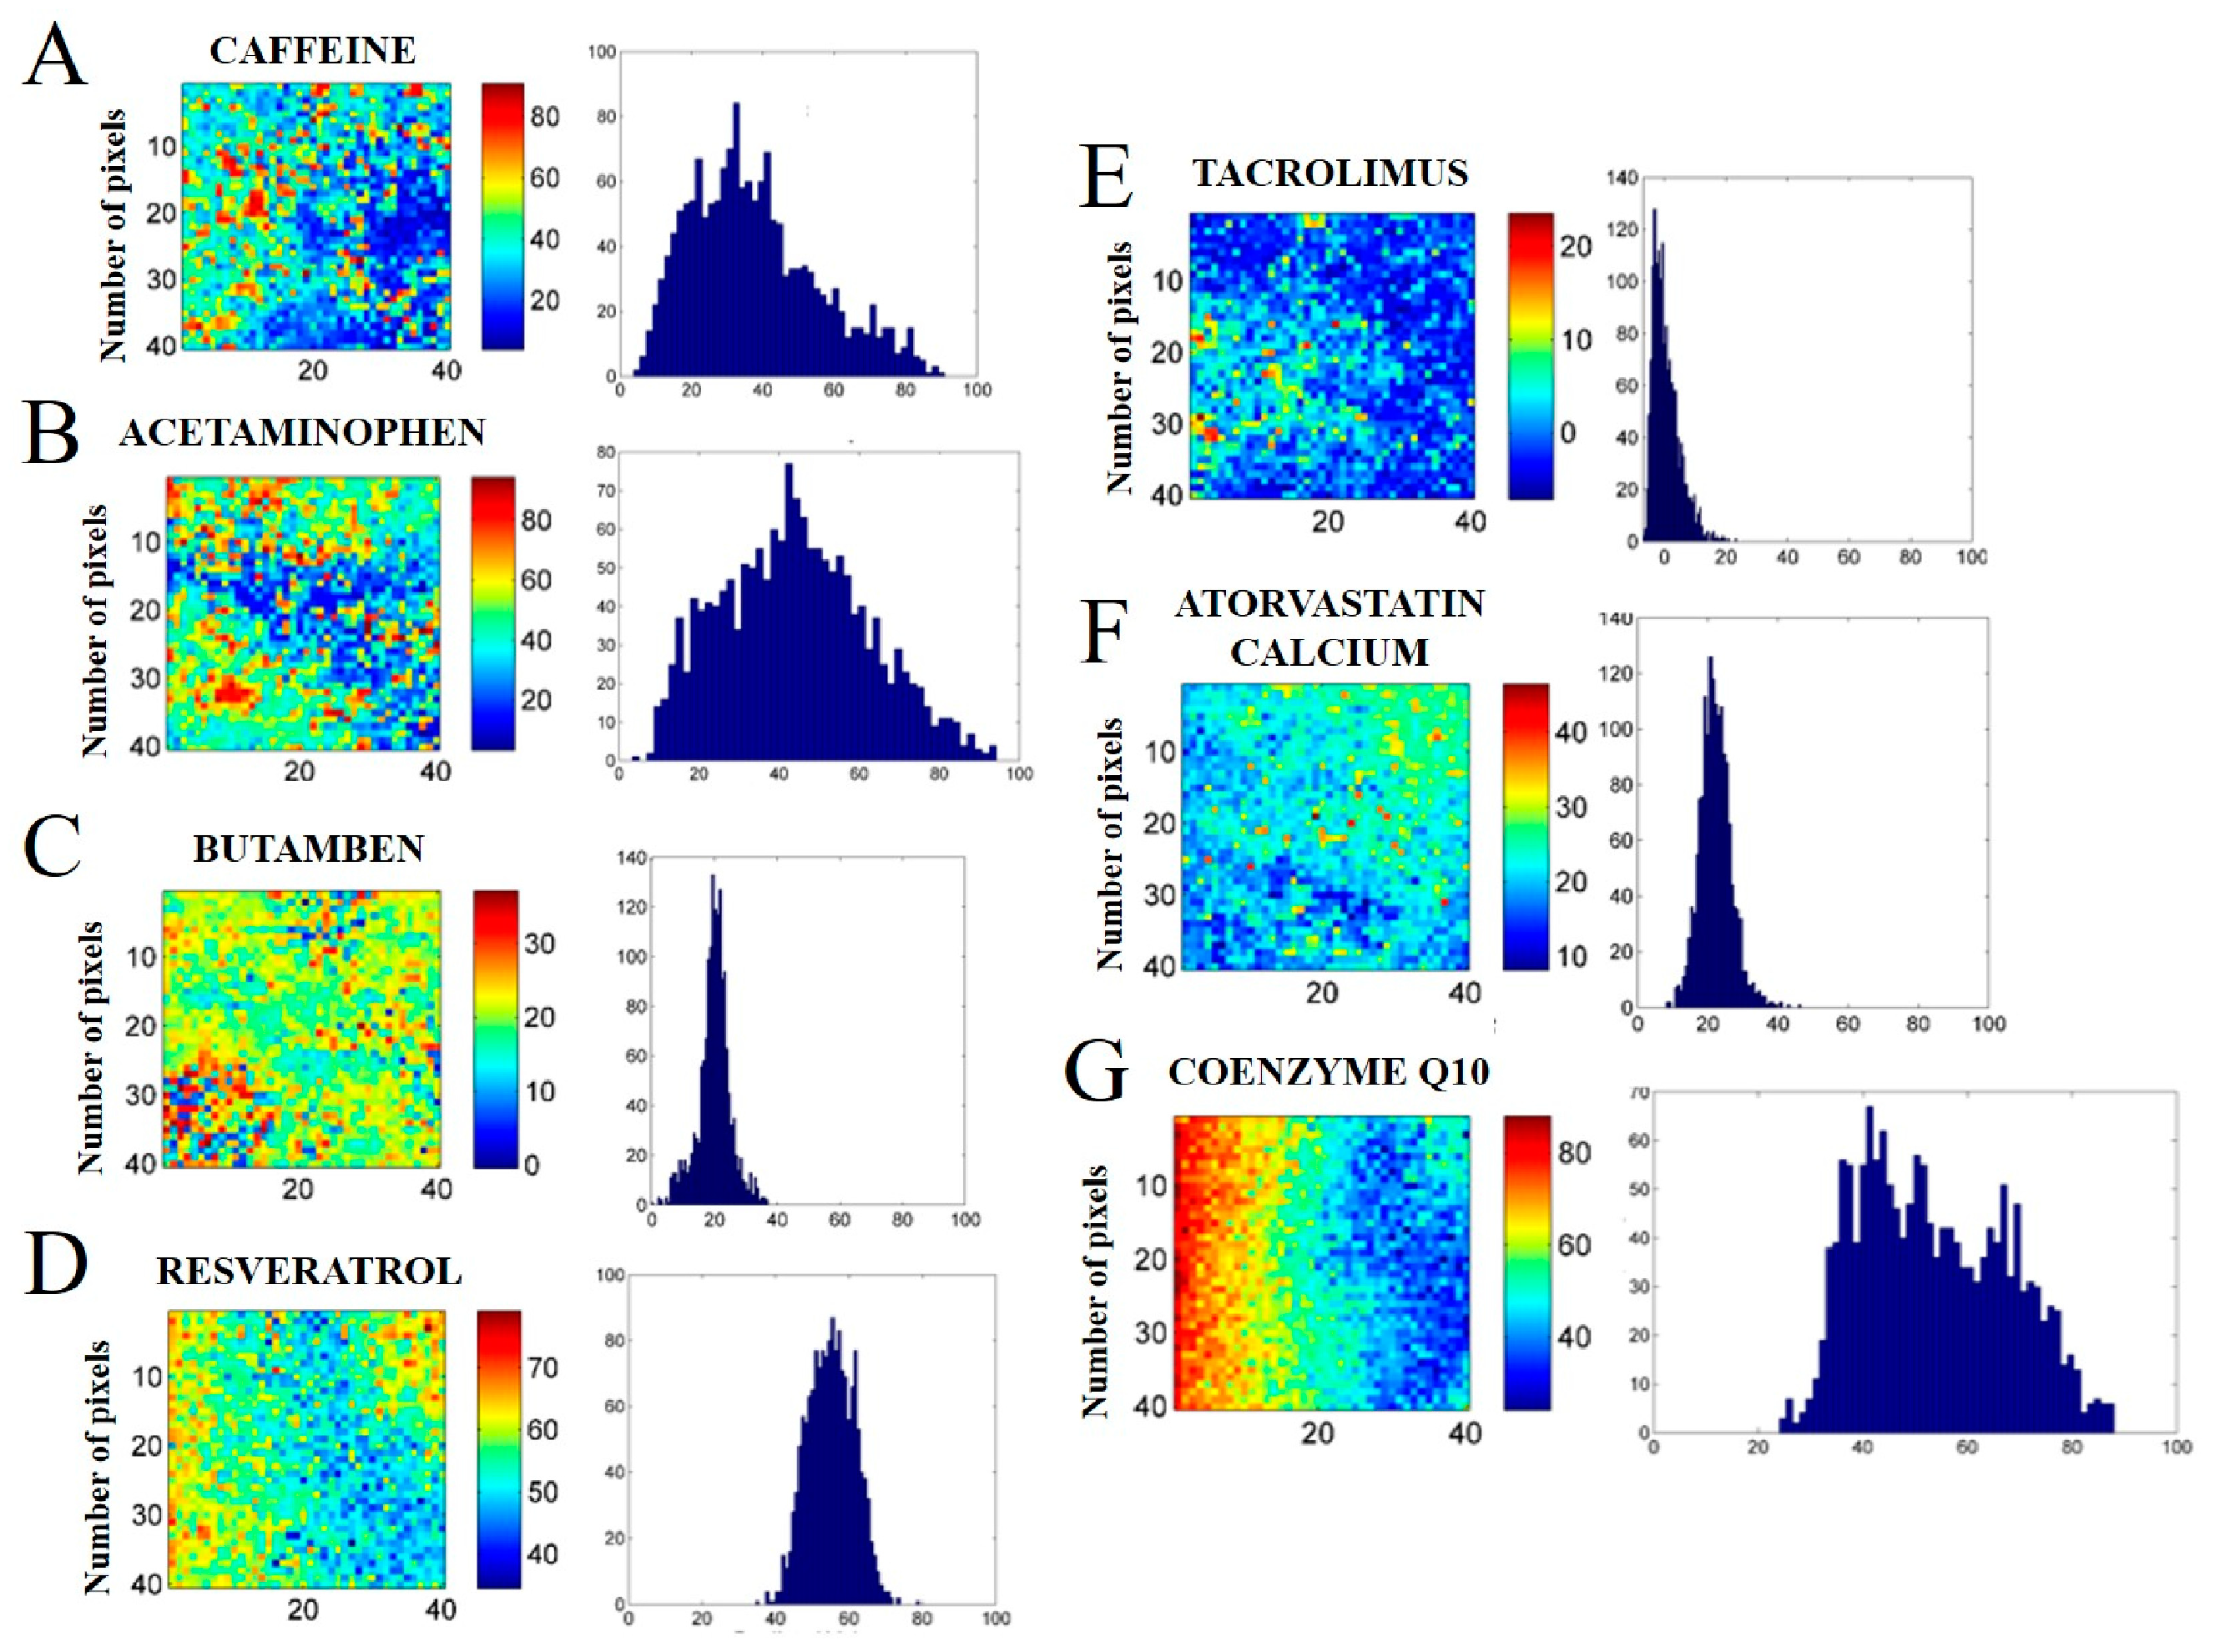

Table 1.
Variables used in the mixture design.
| Independent Variables | Range (% w/w) | |
| Minimum | Maximum | |
| X1: Lipid solid (Crodamol™ CP pharma) | 40 | 70 |
| X2: Liquid lipid (Super Refined™ DMI) | 10 | 40 |
| X3: Hydrophilic excipient (Super Refined™ Lauryl Lactate) |
10 | 40 |
| Dependent variables: CLS standard deviation |
Target | |
| Y1: STD Crodamol™ CP pharma | Minimize | |
| Y2: STD Super Refined™ DMI | Minimize | |
| Y3: STD Super Refined™ Lauryl Lactate | Minimize | |
Table 2.
Mixture Design with proportions between excipients in the mixture and standard deviation responses for each excipient.
Table 2.
Mixture Design with proportions between excipients in the mixture and standard deviation responses for each excipient.
| Independent variables | Dependent variables (Responses) | ||||||
|---|---|---|---|---|---|---|---|
| Point | Ord. | Crodamol™ CP pharma (X1, % w/w) |
Super Refined™ DMI (X2, % w/w) |
Super Refined™ Lauryl Lactate (X3, % w/w) |
STD Crodamol™ CP pharma (Y1) |
STD Super Refined™ DMI (Y2) |
STD Super Refined™ Lauryl Lactate (Y3) |
| A (REP. 1) | 3 | 70 | 10 | 10 | 10.2399 | 5.3213 | 6.2387 |
| B (REP. 1) | 15 | 40 | 40 | 10 | 9.7734 | 10.2075 | 3.6419 |
| C (REP. 1) | 10 | 40 | 10 | 40 | 8.2503 | 2.8535 | 8.3707 |
| D | 14 | 55 | 25 | 10 | 8.6425 | 9.049 | 4.5951 |
| E | 8 | 55 | 10 | 25 | 6.4922 | 2.9182 | 6.7683 |
| F | 2 | 40 | 25 | 25 | 10.2123 | 6.7501 | 6.8751 |
| G | 6 | 60 | 15 | 15 | 7.6515 | 5.106 | 5.3594 |
| H | 11 | 45 | 30 | 15 | 9.8017 | 9.3369 | 5.3381 |
| I | 1 | 45 | 15 | 30 | 5.5927 | 4.5703 | 5.6872 |
| J (REP. 1) | 5 | 50 | 20 | 20 | 5.2051 | 5.1883 | 3.6223 |
| A (REP. 2) | 4 | 70 | 10 | 10 | 5.4646 | 3.5034 | 4.4966 |
| B (REP. 2) | 7 | 40 | 40 | 10 | 5.8229 | 9.6252 | 2.1367 |
| C (REP. 2) | 9 | 40 | 10 | 40 | 6.9807 | 3.791 | 7.9058 |
| J (REP. 2) | 12 | 50 | 20 | 20 | 7.209 | 6.3858 | 4.6373 |
| J (REP. 3) | 13 | 50 | 20 | 20 | 7.4431 | 7.9701 | 5.6311 |
Table 3.
Analysis of variance (ANOVA) for the evaluated responses.
| Response | Model | Sequential p-value | SD | R2 | Adjusted R2 | Predicted R2 | |
|---|---|---|---|---|---|---|---|
| Y1 | Mean | <0.0001 | |||||
| Y2 | Linear | <0.0001 | 0.988 | 0.870 | 0.848 | 0.799 | |
| Y3 | Linear | 0.000518 | 0.959 | 0.717 | 0.669 | 0.567 | |
| Response | Source | Sum of Squares | df | Mean square | F-value | P-value, prob > F | Remark |
| Y1 | Model | 0 | 0 | ||||
| Residual | 44.1 | 14 | 3.15 | ||||
| Lack of Fit | 21.1 | 9 | 2.34 | 0.508 | 0.822 | Not significant | |
| Pure Error | 23 | 5 | 4.61 | ||||
| Corrected total | 44.1 | 14 | |||||
| Y2 | Model | 78.2 | 2 | 39.1 | 40.1 | <0.0001 | Significant |
| Residual | 11.7 | 12 | 0.975 | ||||
| Lack of Fit | 5.55 | 7 | 0.793 | 0.644 | 0.712 | Not significant | |
| Pure Error | 6.16 | 5 | 1.23 | ||||
| Corrected total | 89.9 | 14 | |||||
| Y3 | Model | 27.9 | 2 | 14 | 15.2 | 0.000518 | Significant |
| Residual | 11 | 12 | 0.919 | ||||
| Lack of Fit | 6.26 | 7 | 0.894 | 0.936 | 0.549 | Not significant | |
| Pure Error | 4.78 | 5 | 0.955 | ||||
| Corrected total | 38.9 | 14 |
Note: df, degrees of freedom, SD (standard deviation).
Table 4.
Criteria used in the global desirability function.
| STD | Lower | Upper | Criteria |
| Y1 | 5.2051 | 10.2399 | None |
| Y2 | 2.8535 | 10.2075 | Minimize |
| Y3 | 2.1367 | 8.3707 | Minimize |
Disclaimer/Publisher’s Note: The statements, opinions and data contained in all publications are solely those of the individual author(s) and contributor(s) and not of MDPI and/or the editor(s). MDPI and/or the editor(s) disclaim responsibility for any injury to people or property resulting from any ideas, methods, instructions or products referred to in the content. |
© 2024 by the authors. Licensee MDPI, Basel, Switzerland. This article is an open access article distributed under the terms and conditions of the Creative Commons Attribution (CC BY) license (http://creativecommons.org/licenses/by/4.0/).
Copyright: This open access article is published under a Creative Commons CC BY 4.0 license, which permit the free download, distribution, and reuse, provided that the author and preprint are cited in any reuse.