1. Introduction
Accurate positioning for mobile robots is a key challenge in achieving the autonomous navigation of mobile robots in unknown environments. Especially in mountainous navigation, due to the lack of reliable Global Navigation Satellite System (GNSS) [
1,
2], this problem has become more complex and has attracted widespread attention from scholars.
Simultaneous Localization and Mapping (SLAM) [
3,
4,
5,
6,
7] technology is used by researchers to address this issue. In SLAM technology, the most commonly used methods are based on vision [
8,
9,
10] and LiDAR. Lidar SLAM performs well in environments with rich features, but is prone to generating errors when features are missing, limiting its application in changing environments. In contrast, the visual SLAM algorithm [
11,
12,
13] utilizes continuous images to estimate camera motion; it is cost-effective and able to present environmental details, resulting in higher accuracy in robot localization and mapping in changing environments and helping mobile robots to complete tasks in a wider range of spaces. However, after long-term or long-distance operations, visual SLAM may experience error accumulation issues. Therefore, in the absence of GNSS signals and in complex environmental conditions, relying solely on a certain positioning method makes it difficult to obtain positioning results with high robustness and precision. To address these issues, many scholars have adopted multi-sensor fusion methods, enabling mobile robots to perform autonomous navigation more robustly in complex environments and achieve high-precision positioning results [
14,
15].
Ultra-wide-band (UWB) positioning is an active positioning method with high bandwidths and strong penetration abilities, which can provide absolute position services in environments where GNSS cannot determine positioning [
16]. However, in complex environments, UWB is susceptible to factors such as reflection and non-line-of-sight (NLOS) conditions, leading to a decrease in positioning accuracy. Multiple fusion localization methods have been proposed in the existing literature to address the challenge of UWB localization. Among these studies, [
17] proposes enhancing the indoor navigation of unmanned aerial vehicles by improving UWB positioning through SLAM, which can improve the positioning accuracy of UWB with a 90% quantile error of 20.5 cm to 13.9 cm, achieving effective navigation of unmanned aerial vehicles in the environment. However, this method uses weighted fusion, which cannot cope with complex indoor environments and does not solve the problem of accumulated errors caused by long-term visual SLAM operations. In addition, another study [
18] adopts the fusion method of the UWB, odometer, and RGB-D, which controls the positioning error to within 10 cm and the deviation angle error to within 1°, effectively solving the problem of tracking failure during SLAM in RGB-D cameras, but this approach does not consider the impact of the non-line-of-sight error of UWB. In [
19], UWB positioning data and camera fusion were used to determine the position of indoor moving objects and solve the problem of scale blur, achieving a positioning accuracy of 0.2 m. Although these methods have improved the accuracy issue to some extent, due to the use of loosely coupled fusion methods, UWB data cannot be directly used for image matching. Therefore, researchers continue to explore methods of multi-sensor fusion to further improve the accuracy and reliability of UWB positioning in complex environments.
Given the current low accuracy of single positioning methods and the issue of loose coupling in combining these methods, as well as the potential for richer and more accurate location information through the integration of SLAM algorithms with UWB positioning, this paper tightly integrates UWB's global absolute coordinates with visual SLAM's relative displacement increments. In environments with obstacles and outdoor scenarios, this algorithm performs exceptionally well, exhibiting higher stability and robustness when compared to traditional methods, ultimately achieving high-precision positioning.
The main contributions of this work can be summarized as follows:
- (1)
The Extended Kalman Filter (EKF) [
20,
21,
22] algorithm is used to tightly couple UWB and visual SLAM data. This method models all motion and measurement information simultaneously, making it easier to reach the optimal model and improving positioning accuracy in various complex environments.
- (2)
ORB-SLAM2 [
23] and UWB complement each other effectively. ORB-SLAM2, with its advantages in unstructured and dimly lit environments, reduces the impact of UWB's non-line-of-sight errors. Meanwhile, UWB data efficiently compensates for cumulative errors resulting from prolonged SLAM operations, further enhancing positioning accuracy.
- (3)
Estimation error divergence is effectively suppressed. This paper introduces the Sage-Husa noise estimator and threshold determination mechanism in addition to the traditional EKF to control the divergence of estimation errors, thus optimizing filter performance.
2. Principles of the Visual and UWB Localization Algorithms
2.1. Principles of the Visual SLAM Localization Algorithm
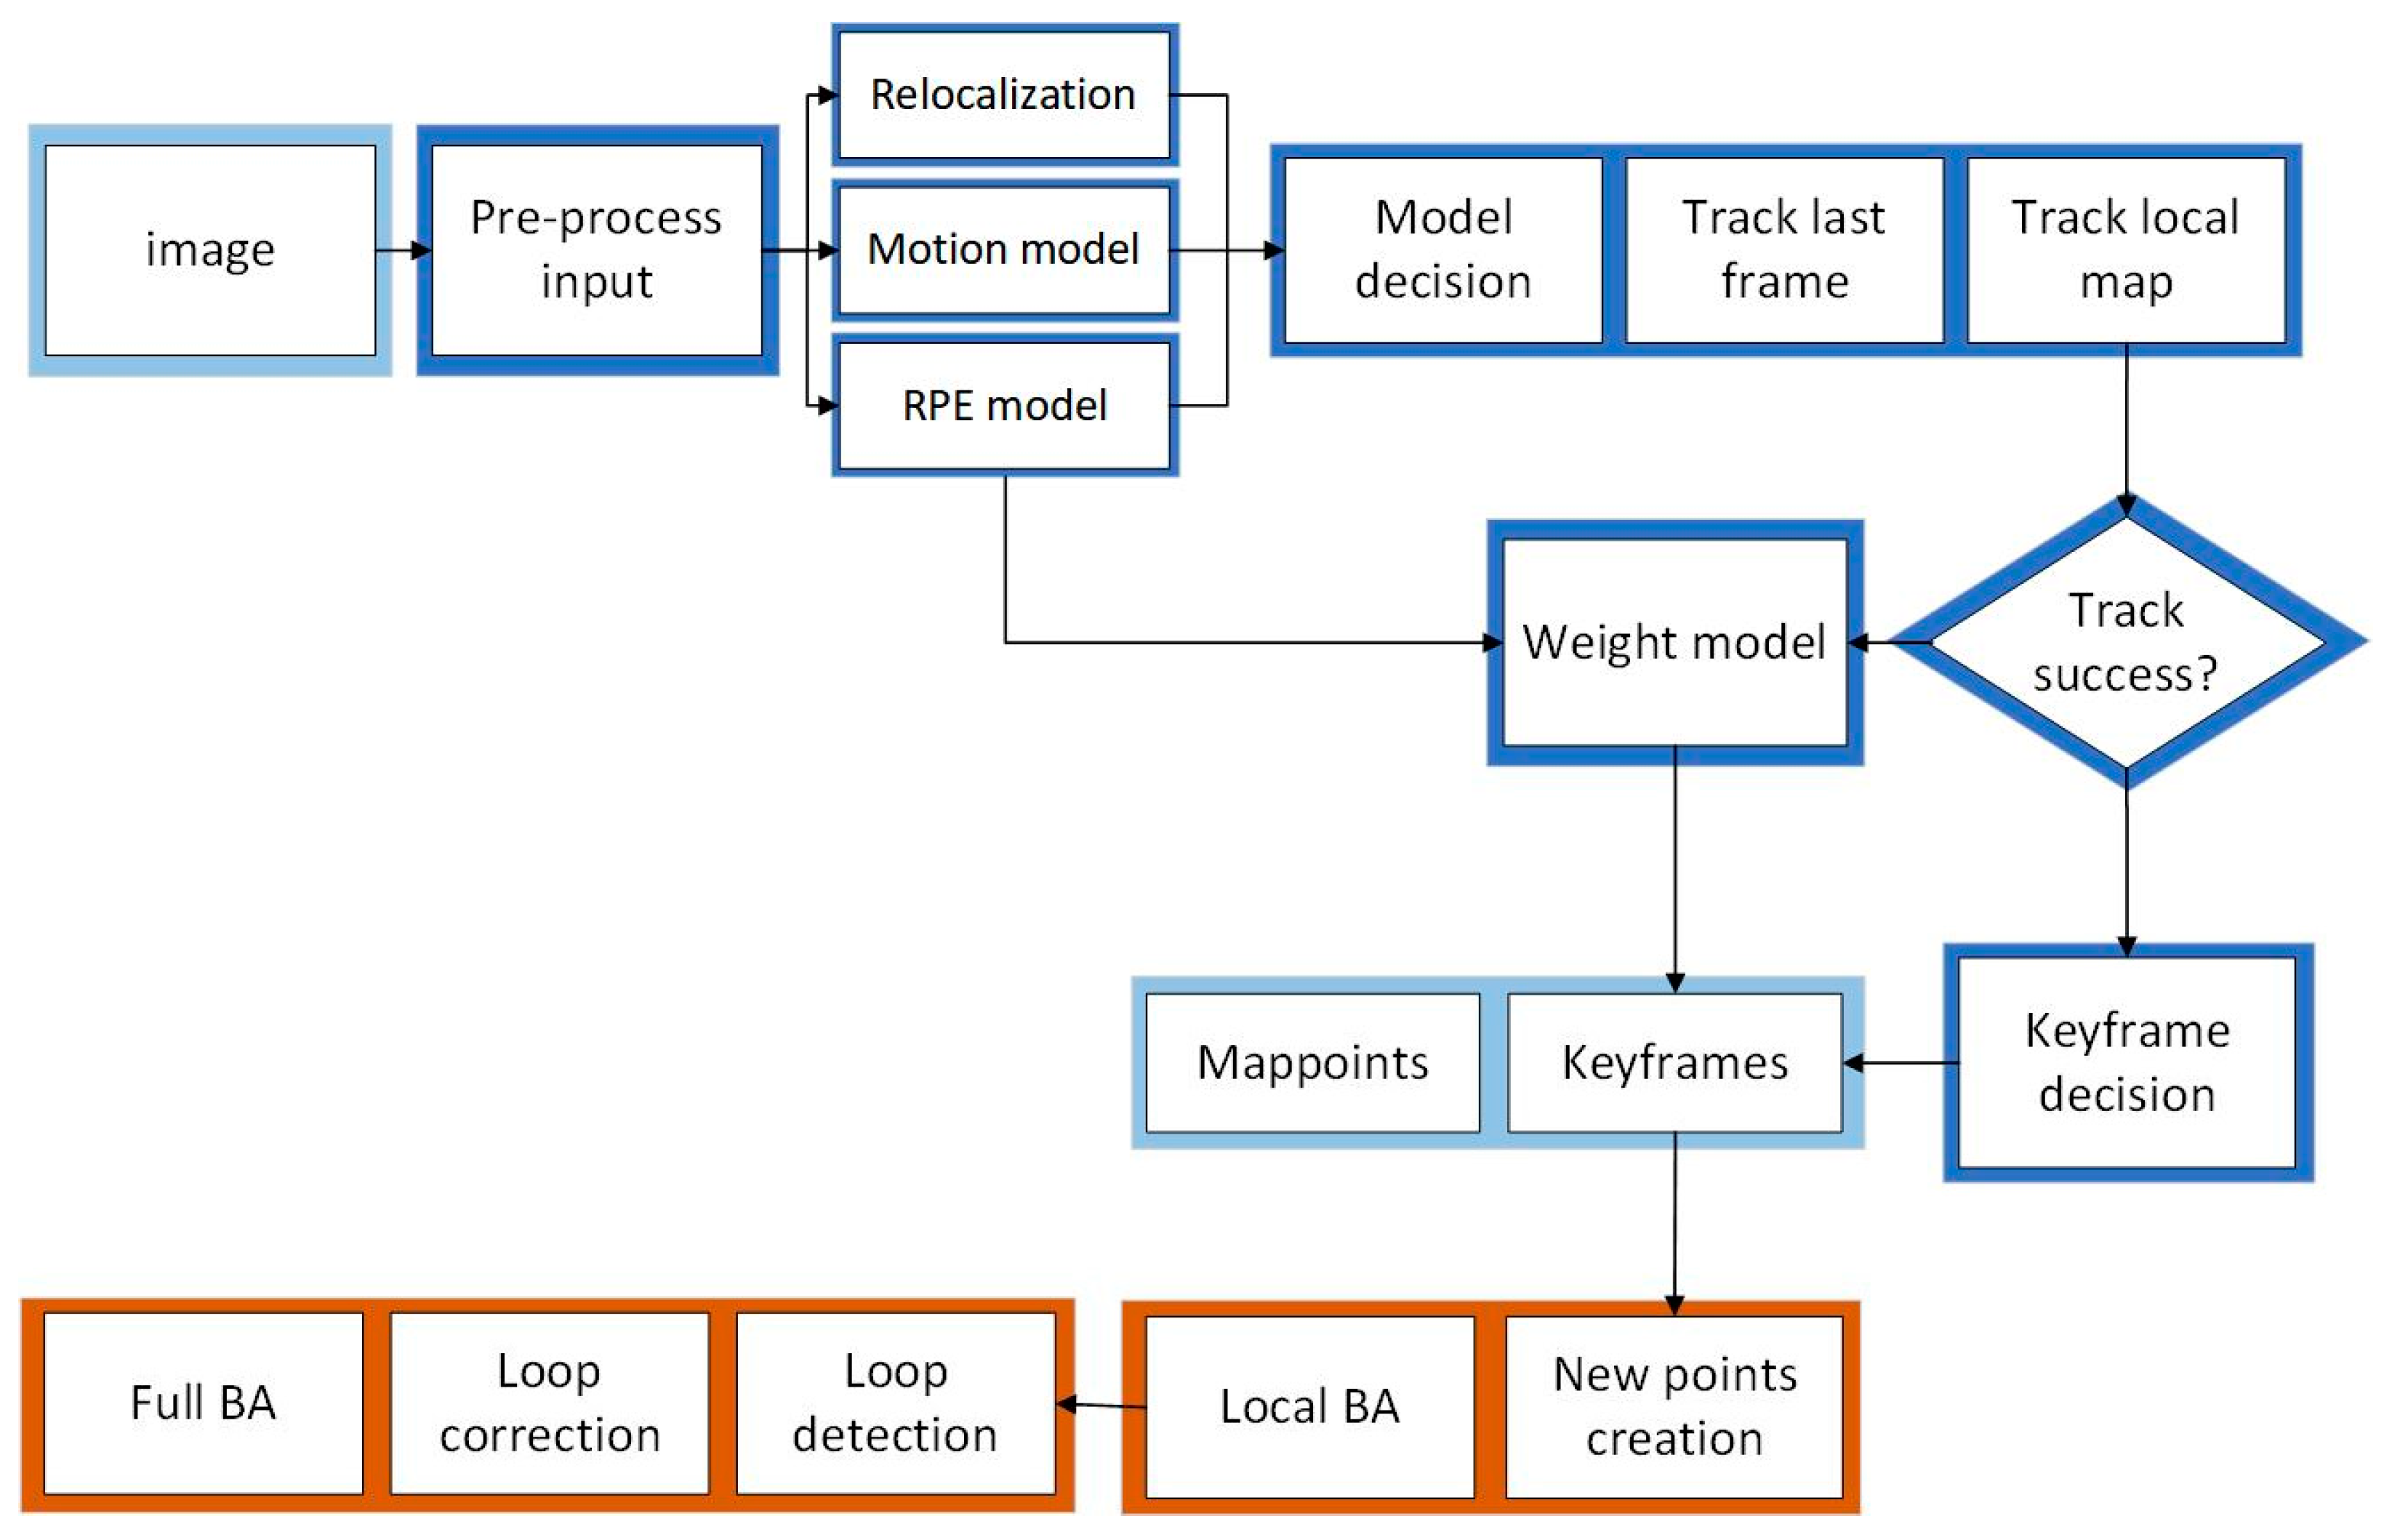
The ORB-SLAM2 algorithm is used for visual positioning, and the front-end visual odometer is based on the “Oriented FAST” key points and the BRIEF descriptor, with the aim of achieving feature point extraction and matching [
24,
25]. The back end is based on a nonlinear optimized BA visual SLAM system. It divides the traditional visual SLAM algorithm into three threads: position tracking, local mapping, and loop closing. The flowchart of the algorithm is shown in
Figure 1. In the RGB-D mode, the tracking thread is responsible for real-time pose localization, tracking, and optimization processing based on the provided feature point depth information. The local mapping thread creates new map points through the obtained keyframes and removes points outside the map. The pose of the keyframes is locally optimized via BA, and redundant keyframes and map points are deleted. The closed-loop detection thread uses a mathematical model to evaluate the similarity of adjacent keyframes and determine the closed-loop situation of keyframes, which helps to reduce the cumulative drift of trajectories. This article selects an RGB-D camera as the image input source. Compared to monocular and binocular cameras, the RGB-D camera can simultaneously capture color images and corresponding depth maps. Not only can it solve the problem of scale uncertainty in monocular vision, but it can also eliminate the tedious steps of calculating the parallax between left and right cameras in binocular vision, reduce computer computation, and ensure real-time requirements.
2.2. Principle of the Ultra-Wide-Band (UWB) Positioning Algorithm
The ultra-wide band is a wireless carrier communication technology [
26,
27,
28] that uses nanosecond non-sinusoidal narrow pulses to transmit data, occupying a wide spectral range. Due to its simple system structure, high transmission rate, and low functionality, it is widely used in positioning technology.
The commonly used positioning methods for UWB technology include TOA (time of arrival), TDOA (time difference of arrival), TWR (time of flight ranging), etc. [
29,
30]. The principle of TOA positioning is to calculate the distance of signal propagation by measuring the propagation time of the signal from the transmitting source to the receiver. It uses multiple receivers (anchors or base stations) to simultaneously measure the arrival time of the signal and calculate the position of the target via multilateral positioning algorithms (such as triangulation). The TDOA positioning principle is based on using the difference in the signal arrival time to calculate the target position. In TDOA positioning, at least three receivers are required for measurement. By measuring the time difference between signals reaching different receivers, the position of the target relative to these receivers can be calculated. The principle of TWR positioning is to calculate distance based on the flight time of the signal. TWR calculates the distance of signal propagation by measuring the flight time from the transmitter to the receiver, combined with the propagation speed. Multiple TWR measurements can be used for multilateral positioning and calculating target positions [
31,
32,
33].
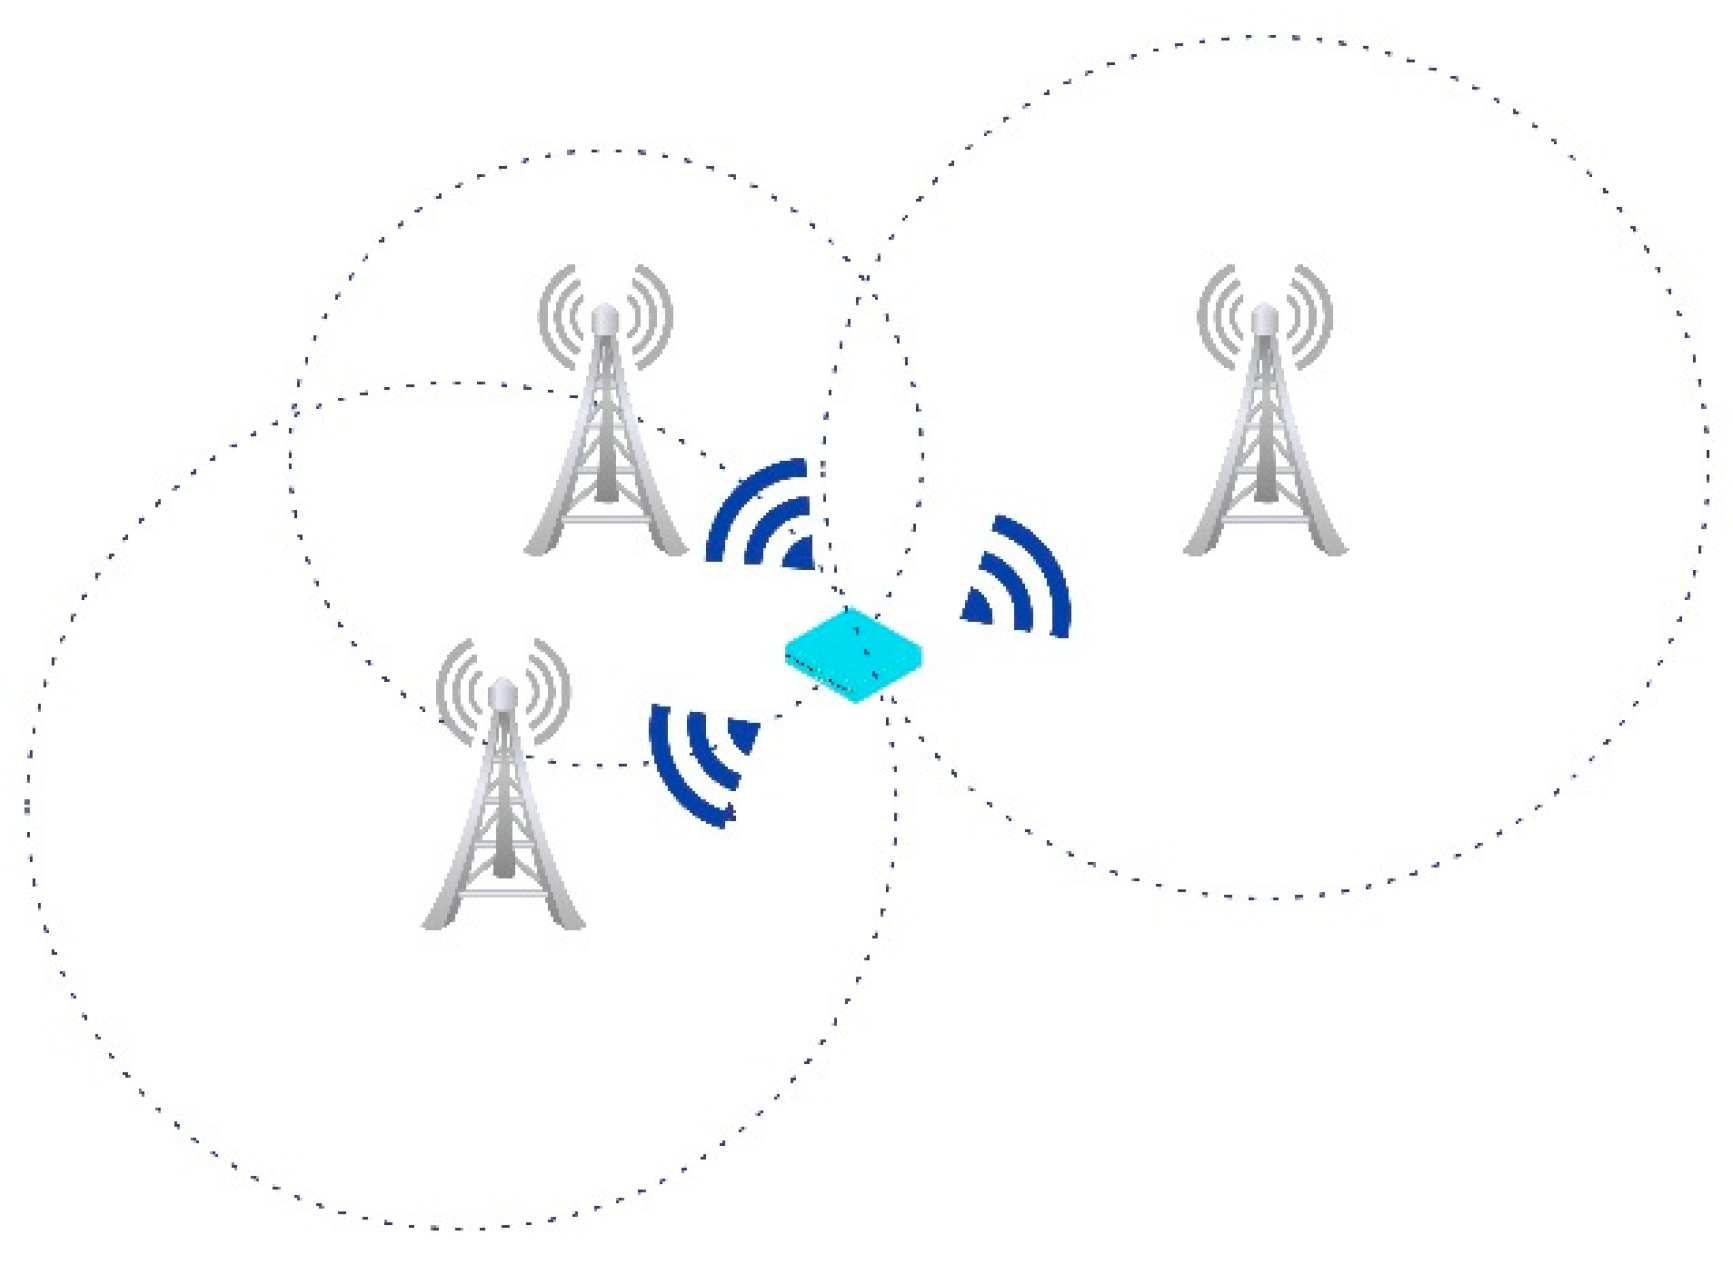
In our experiments, TOA positioning was selected. Unlike other positioning methods, TOA does not require advanced hardware or complex signal processing algorithms, and it is relatively easy to implement. It has high accuracy and a relatively simple implementation method. Moreover, TOA positioning is based on time measurement, and its measurement accuracy can reach the sub-nanosecond level or better. Therefore, it has high positioning accuracy and a good ability to suppress multipath effects. The schematic diagram is as follows:
Assuming the target generates a signal at time
and, at time
, reaches the receiver. The propagation time of the signal from the transmitting source to the receiver
(TOA) can be expressed as:
The distance
of signal propagation is as follows:
where
represents the propagation speed of the signal (usually approximately the speed of light).
In this way, by measuring the time of arrival (TOA) and signal propagation speed of the signal, the distance of signal propagation can be calculated, thereby achieving target positioning. In practical applications, multiple receivers (anchors or base stations) are usually used to calculate the position of the target through multilateral positioning algorithms (such as triangular positioning algorithms), as shown in
Figure 2.
When installing and deploying base stations 1, 2, and 3, their positions are fixed and known. For base stations 1 (
,
), 2 (
,
), and 3 (
,
), the coordinates of the required positioning labels are
,
). The unique intersection point is calculated using three circular equations, as shown in Equation (3):
where
is the speed of light, and
,
, and
represent the time to reach the three base stations. Solvable
(
,
) coordinates are given.
3. Fusion Localization Algorithm
3.1. Time Synchronization and First Coordinate System
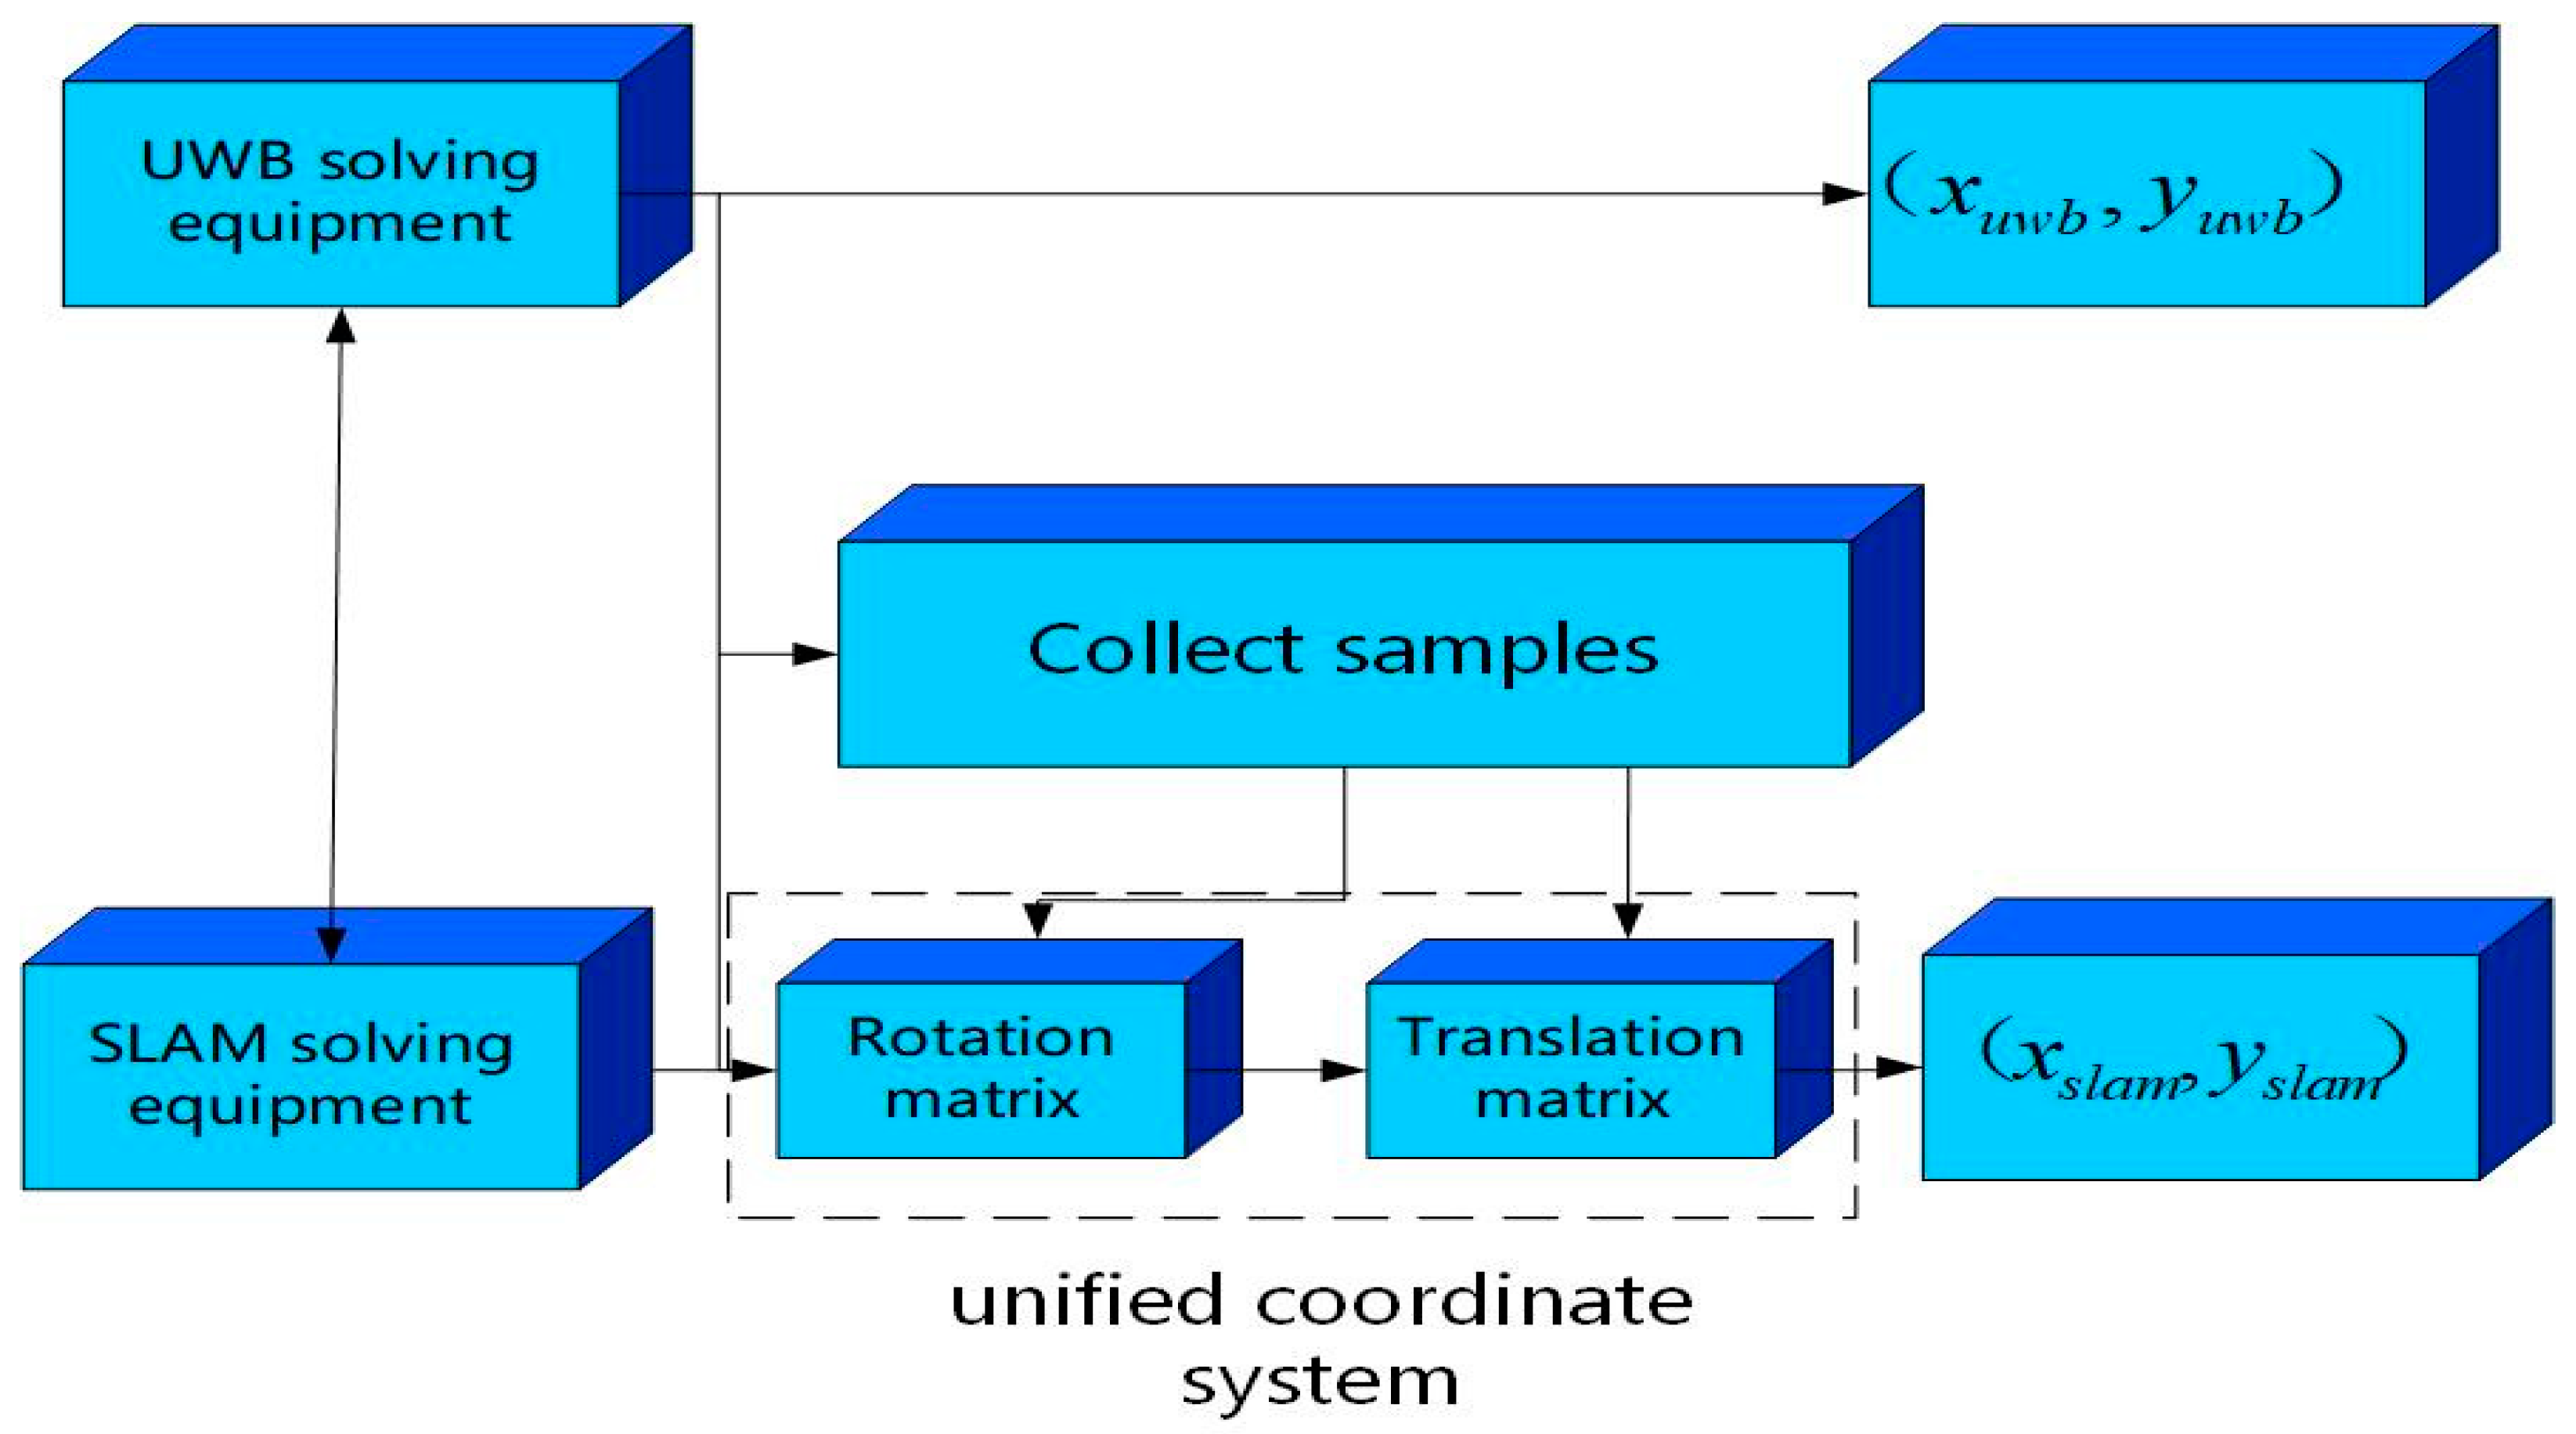
As shown in
Figure 3, before conducting data fusion, it is necessary to consider the time synchronization and coordinate system of one of the two positioning methods. Therefore, a preprocessing stage is designed to take place before the experiment, which is divided into two parts: the first part involves the time synchronization of the solution devices of the two positioning methods and adds time labels to the output data of SLAM and UWB; the second part converts the camera coordinate system of ORB-SLAM2 into UWB coordinates through coordinate system transformation.
To obtain the rotation and offset matrix from the camera coordinate system of ORB-SLAM2 to the UWB coordinate system, it is necessary to collect a certain number of UWB and SLAM data under the same trajectory after time synchronization. Under this trajectory, the coordinate dataset of UWB is , and the coordinate dataset of SLAM is . The iterative method is used to obtain the point sets of the two datasets that are close in time. The new datasets and are obtained, and the rotation matrixand horizontal shift matrix from the camera coordinate system to the UWB coordinate system are assumed to be .
The following formula is used:
The centroids of
and
are calculated separately, using
and
:
Decentralizing the dataset yields:
Using the singular value decomposition method [
34] to solve the rotation matrix r and the translation matrix
, the following equation can be derived:
3.2. KF-Based Data Preprocessing
Due to the presence of noise and errors in the process of propagating UWB signals, resulting in inaccurate measurement values, it is necessary to perform filtering processing on UWB data before data fusion. The Kalman filter predicts and corrects the system state through recursion, resulting in more accurate state estimations and effectively handling noise and uncertainty standards. The position velocity (PV) model is used in this article:
In the equation
,
represents the system state transition matrix,
represents the system update rate of 10 Hz, and
represents the system measurement matrix,
.
represents the current process noise and measurement noise,
,
:
In the experiment, the value in the process noise () was 0.01, and the value of in the measurement noise (R) was [0.018, 0.015] (this value is calculated based on experimental measurement results).
The equation system for the time update stage in KF includes the predicted state
and predicted covariance
:
here,
and
represent the optimal state estimation and error covariance matrix for the instantaneous
moment, respectively, and
is the covariance matrix for the instantaneous
process noise. Then, Kalman gain
is:
The predicted covariance
and Kalman gain
are positively correlated, with the observed noise
and Kalman gain
showing a negative correlation. The above equation indicates that
is used to adjust the weight of observations in state estimation; that is, when
is small, the system relies more on observations, and, when R is large, the system relies more on prior predictions. Based on the above expression, the update status expression can be obtained as:
where
is the estimated state value of the current time
, which is the predicted state value.
is the observed value at the current time
, which is the actual value measured by the sensor.
is the state covariance matrix of the current time
, representing the uncertainty of state estimation. This article verifies the importance of one-dimensional filtering in tightly coupled localization through UWB preprocessing experiments.
3.3. Data Fusion Algorithm Based on EKF
In the tightly coupled visual ORB-SLAM2/UWB combination localization, UWB suppresses the cumulative error generated by visual SLAM localization over time, while visual SLAM localization also reduces the impact of non-line-of-sight errors during UWB localization. The ORB-SLAM2/UWB combined positioning method constitutes a nonlinear system, so this article uses the EKF algorithm to handle nonlinear problems.
In general, the nonlinear motion state equation and measurement equation are, respectively:
where
represents the state vector;
represents the observation vector;
represents process noise;
represents measurement noise;
represents the state function; and
represents the observation function.
In the combined positioning method used in this article, UWB and visual ORB-SLAM2 data are fused through time synchronization and coordinate system 1, as detailed in 3.1, to obtain the position and speed updates of the combined system. The model is as follows:
where
is the sampling interval time of the combined system;
represents the plane position of the combined system at the k-th moment;
is the velocity of the combined positioning in the x-axis and y-axis directions at the k-th moment, and
represents the acceleration in the x-axis and y-axis directions at the k-th moment, respectively. Using the position and velocity errors of the combined system as the state vector of the visual ORB-SLAM2 combined system, the state equation of the combined system is obtained by organizing Equation (3) as follows:
where
,
is process noise.
is the state shift matrix.
Like the KF algorithm, the main process of the EKF algorithm includes state updates and measurement updates. State updates include state prediction and error covariance prediction. The details are as follows:
where
、
is the prediction of the state vector and error covariance of the combined system at the k-th moment, and
is the covariance matrix of process noise.
The difference between the position information of the visual ORB-SLAM2/UWB after spatial transformation and the position information calculated via UWB positioning is used as the measurement information of the combined system. The measurement equation for the combined system is:
where
;
is the measurement transfer matrix;
is the measurement noise; and
is the plane coordinate of the visual solution. The measurement update includes calculating the Kalman gain
, the state vector
at moment
and the error covariance
:
where
represents the identity matrix and
is the covariance matrix of observation noise. Based on the state equation and measurement equation, the positioning information of the combined system is obtained via EKF for state and measurement updates.
3.4. Measurement Noise Estimation and Threshold Judgment
Due to the traditional EKF requiring measurement noise to follow a Gaussian distribution of zero mean on the noise assumption , , where should be related to the system prediction model, is mainly related to sensor measurement data. In practical scenarios such as SLAM and UWB positioning, the measurement noise may not fully conform to the Gaussian distribution, and may be affected by the environment, resulting in increased or even divergent estimation errors. Therefore, this article introduces the Sage Husa noise estimator and threshold judgment mechanism based on traditional EKF to optimize the performance of the filter.
The Sage Husa noise estimator is an adaptive noise estimation technique that continuously adjusts the intensity of measurement noise. In each iteration, by analyzing the measurement data, the actual measurement noise intensity is estimated and applied to the noise model in EKF to more accurately reflect the actual measurement error. The threshold judgment mechanism analyzes the estimated values of the filter output to determine whether there is significant deviation from the actual position of the measurement data, preventing these abnormal data from interfering with the filter estimation, and thus achieving the optimization of the filter.
When
is fixed, the Sage Husa algorithm is used to estimate the covariance of system measurement noise. For the
measurement, first, the measurement residual is calculated:
where
is the actual measurement value,
is the state observation matrix, and
is the prior state prediction value. Then, the covariance
[
35] of the measurement noise is estimated using the following formula:
where
is the
-th estimated measurement noise covariance matrix,
is the adaptive weight, and
.
is the forgetting factor, ranging from 0.95 to 0.99, representing the estimated weight before forgetting. The specific value can be obtained through experiments.
To eliminate abnormal measurement data, before fusion, the measured values are compared with the estimated values of the state vector, and the difference between the two is subtracted from the pre-set threshold. If the threshold is exceeded, the previous state estimation is used instead.
After combining the threshold judgment, Equation (15) in EKF is modified to:
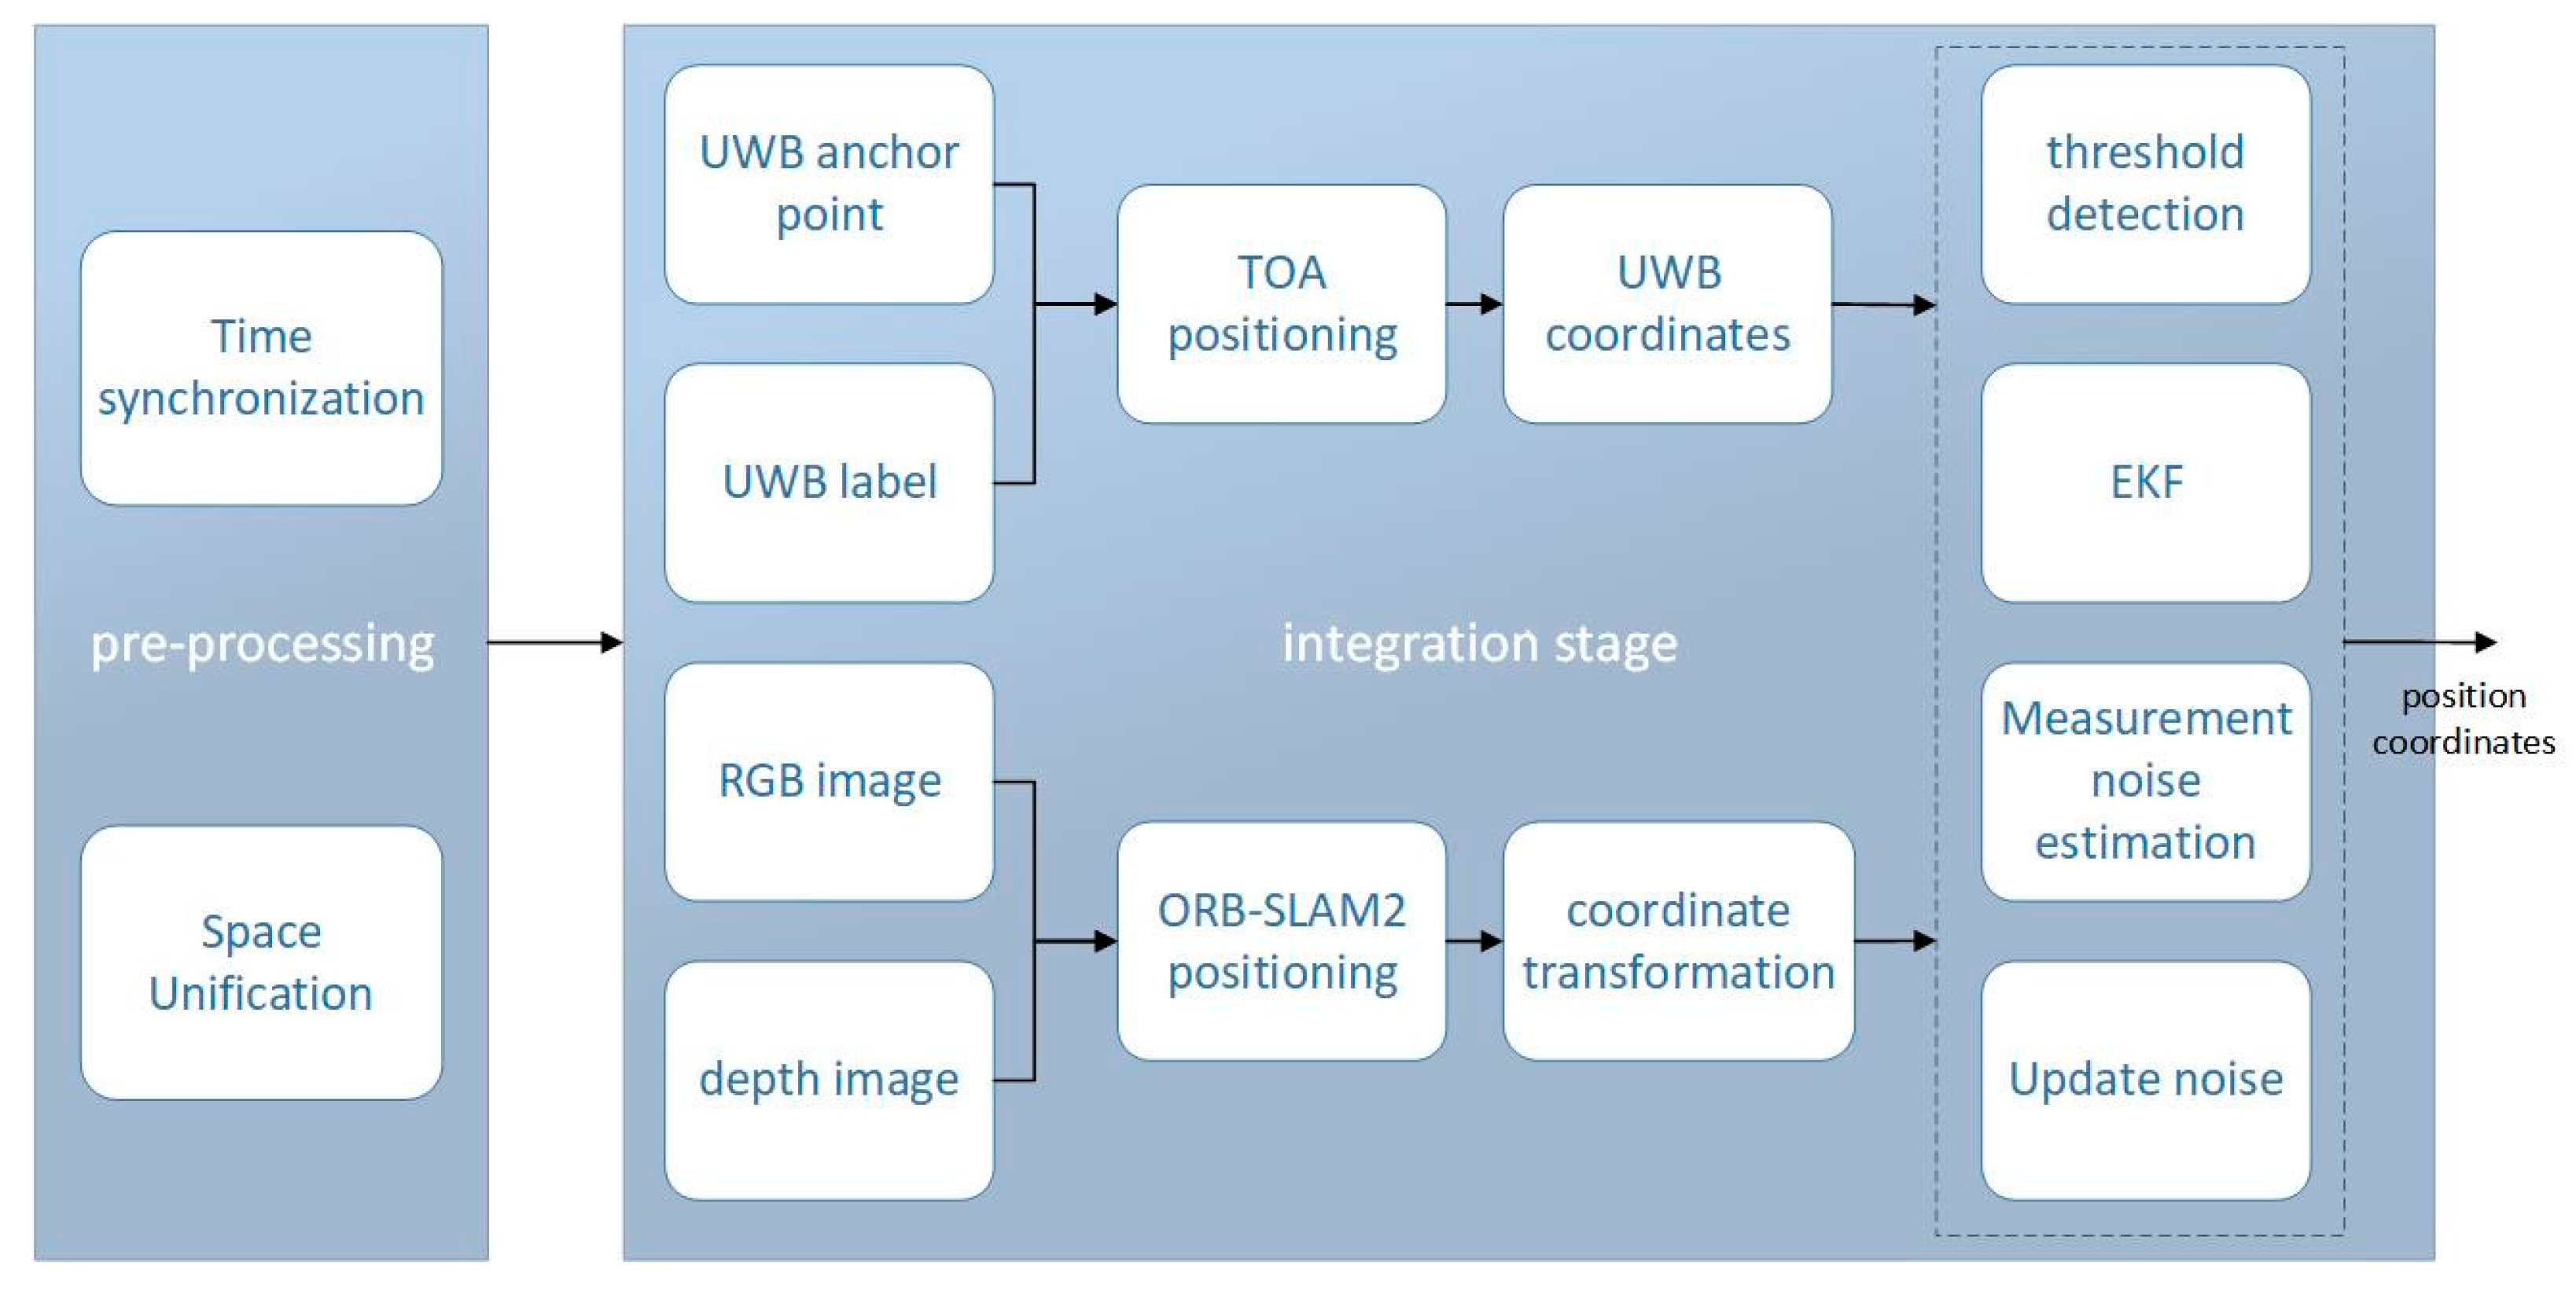
where the threshold is the pre-selected threshold. The main steps of the final fusion localization algorithm are shown in
Figure 4.
According to the flowchart, first, Kalman filtering is performed on the UWB range values to obtain more accurate and stable estimates; then, the UWB measurement data are fused with visual ORB-SLAM2 using an extended Kalman filtering framework. The measurement equation in EKF is dynamically adjusted based on the results for the measurement noise and threshold to obtain the optimal positioning estimation for the current state. Due to the continuity of localization, the optimal estimation of the current state is fed back to the Kalman filter range value of the next state, and the noise is estimated and adjusted again, continuously updating to suppress the divergence of the EFK results and improve the accuracy of the localization system.
4. Testing and Analysis
4.1. Construction of the Visual/UWB Platform
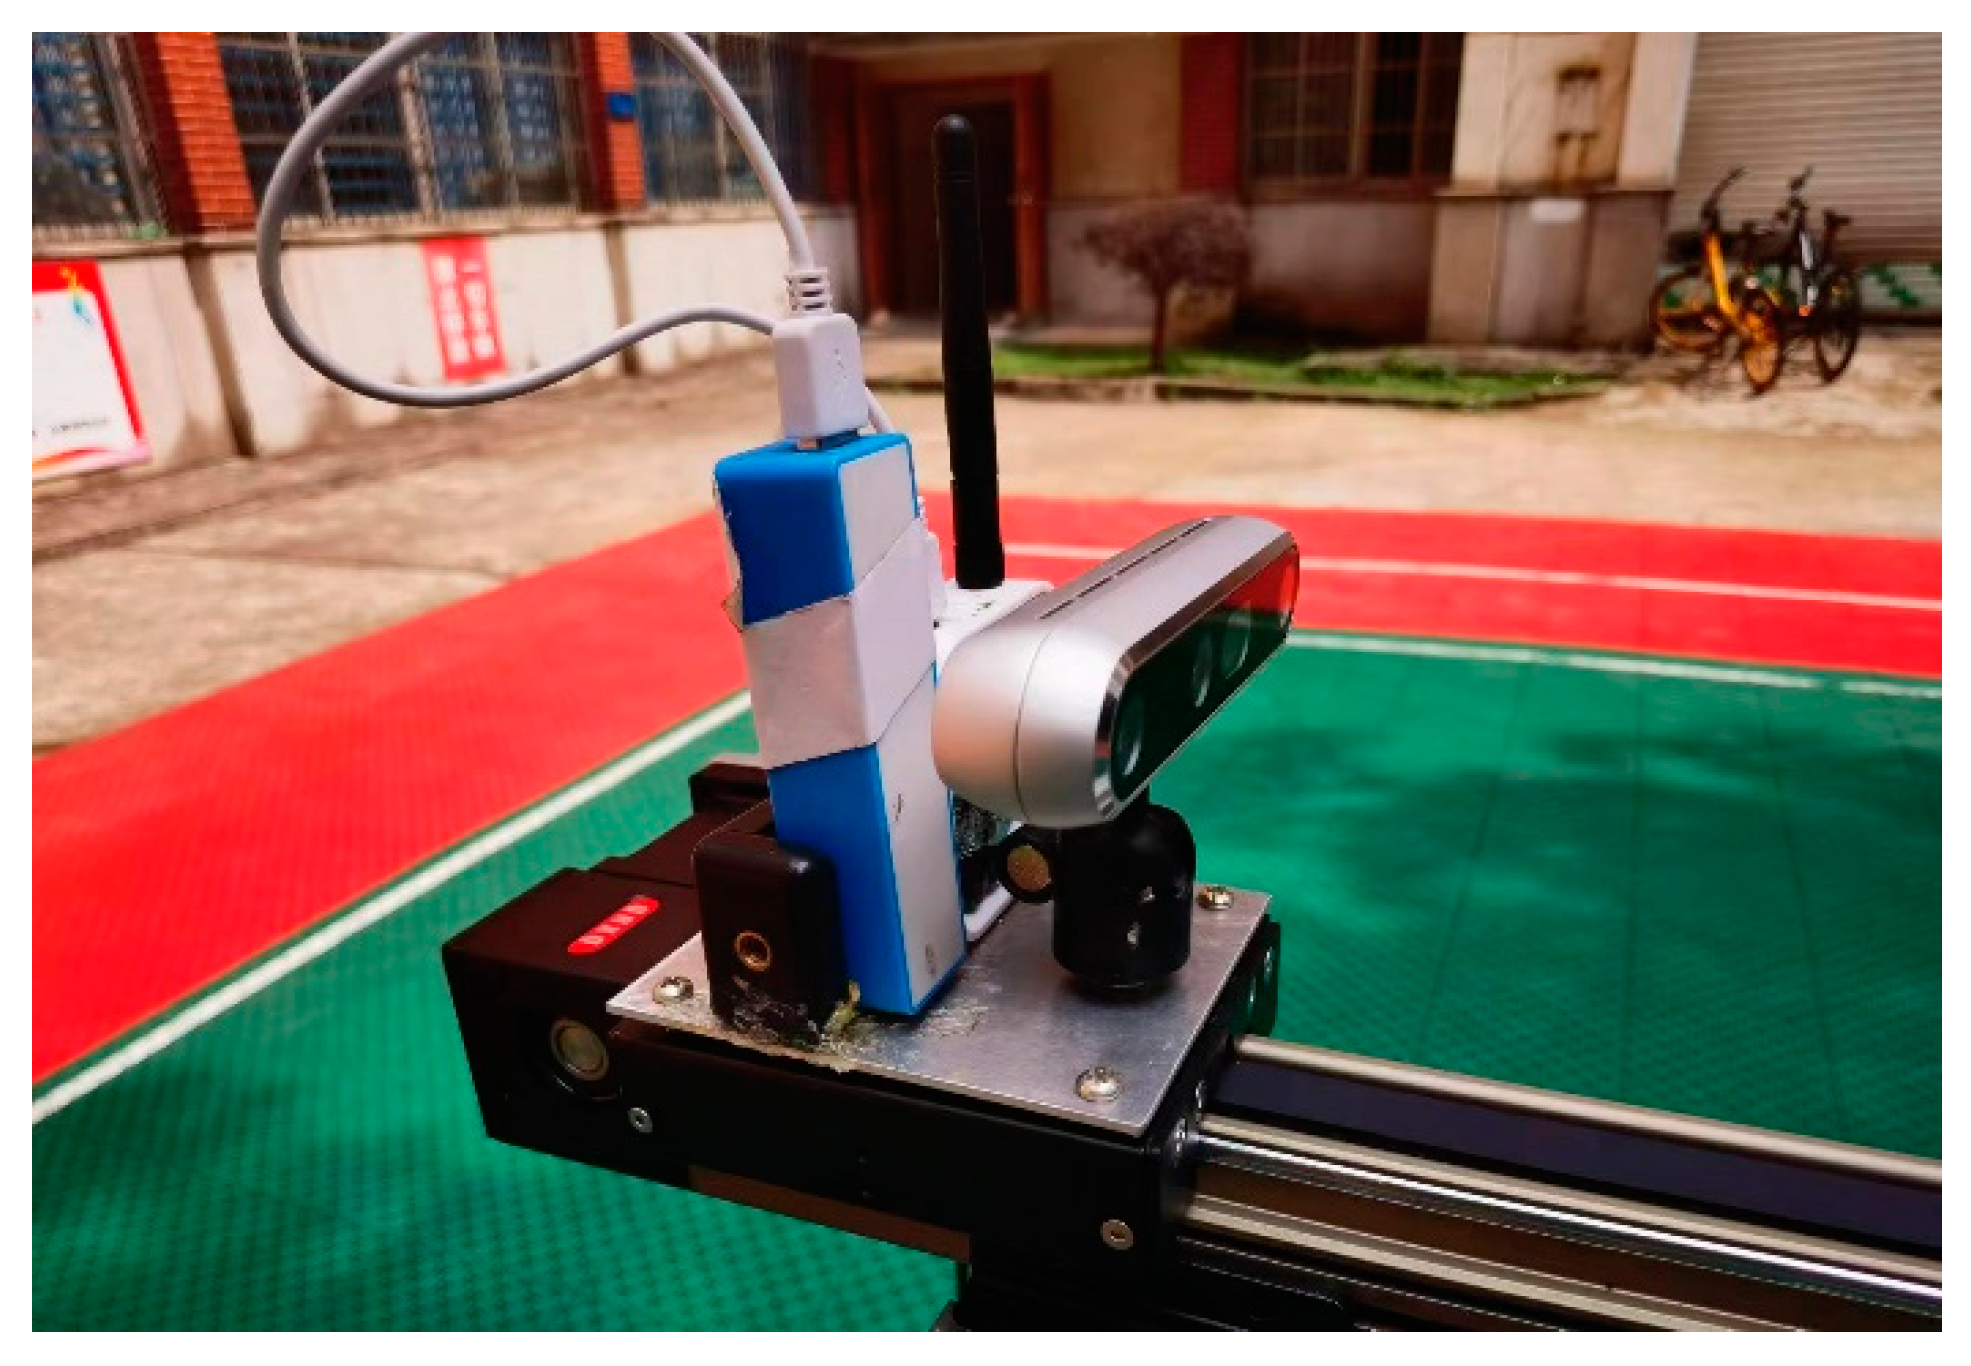
The camera used on the mobile positioning platform is Intel’s Realsense-D455 model camera, with a resolution of 1280 pixels by 720 pixels. The sampling frequency is set to 10 Hz. The UWB used is Decawave’s DW1000 communication and ranging module, with a bandwidth of 3.5–6.5 GHz and a data sampling frequency of 10 Hz. In order to accurately obtain the system error of each anchor point of the UWB, a mobile calibration platform was constructed in this experiment, as shown in
Figure 5. The platform consists of three main parts: aluminum profile chassis, a control box, and a synchronous belt. Both the UWB and the camera are fixed on the moving slider of the synchronous belt of the mobile calibration platform. By controlling the synchronous belt via the control box, the speed, acceleration, and spatial coordinate values of the two sensors can be accurately obtained. Time tags are added to the data collected via UWB positioning and the camera, ensuring that these time tags are consistent with the system time of the computer. Data are collected from both sensors on the laptop at the same time.
4.2. Correction of UWB Positioning System
The TOA (time of arrival) algorithm used in this article usually includes two stages: a ranging stage and a localization stage. Due to environmental and other external factors, there may be some errors in the distance measured via UWB positioning. Therefore, in order to accurately obtain the measurement error of UWB and improve subsequent positioning accuracy, this section of the experiment collected distance information of four UWB anchor points working simultaneously.
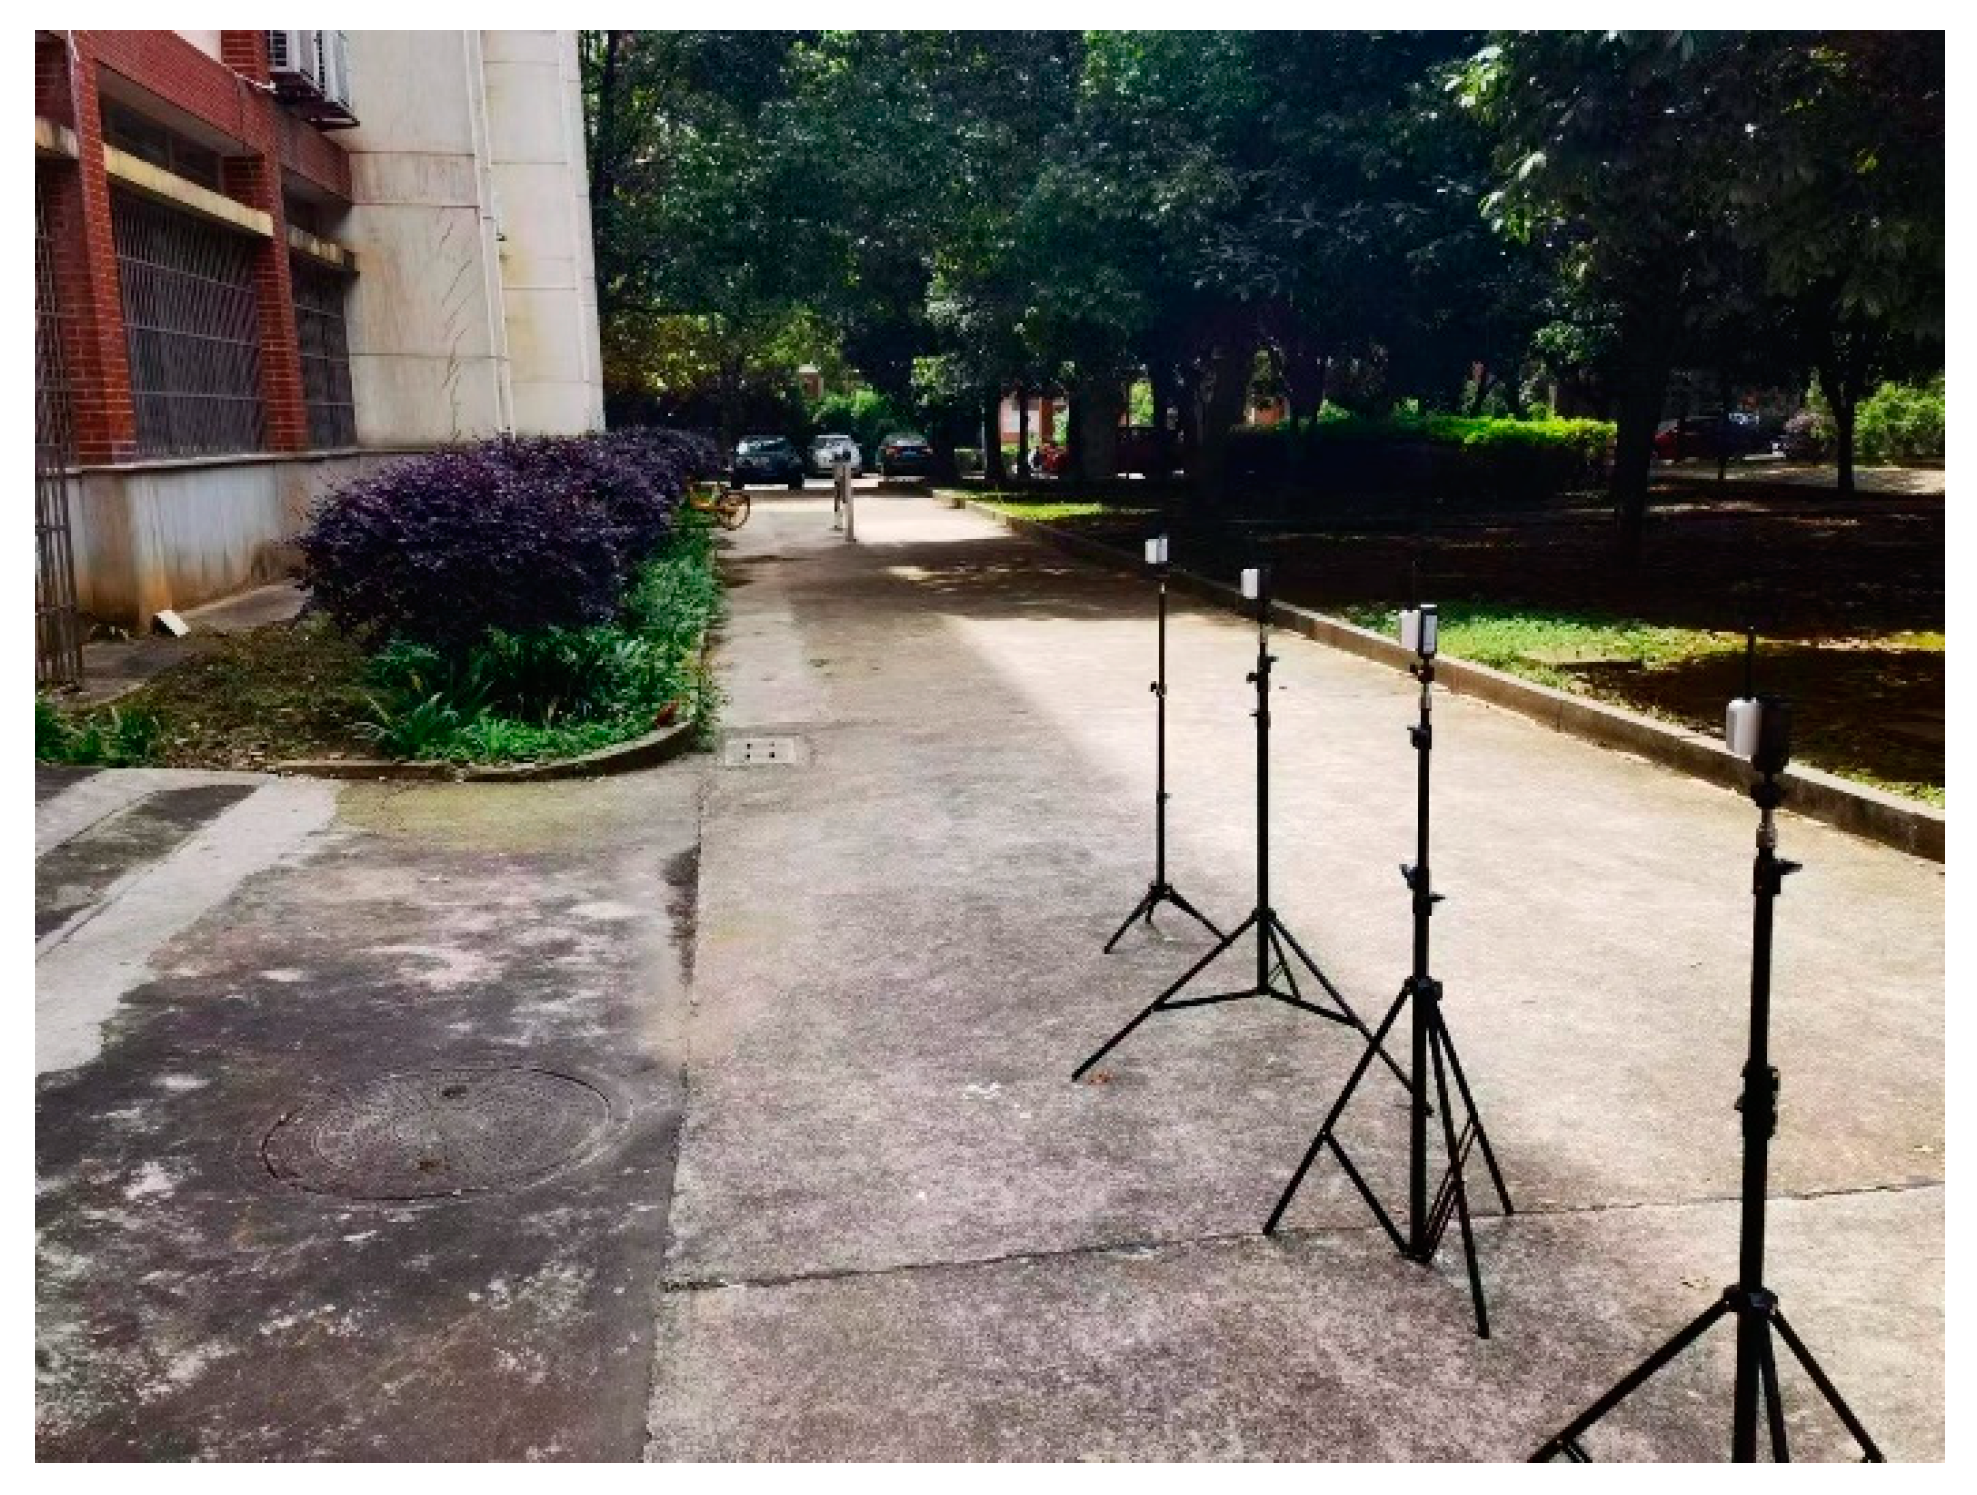
First, four UWB anchor points are fixed within the flat area of the large scene, as shown in the
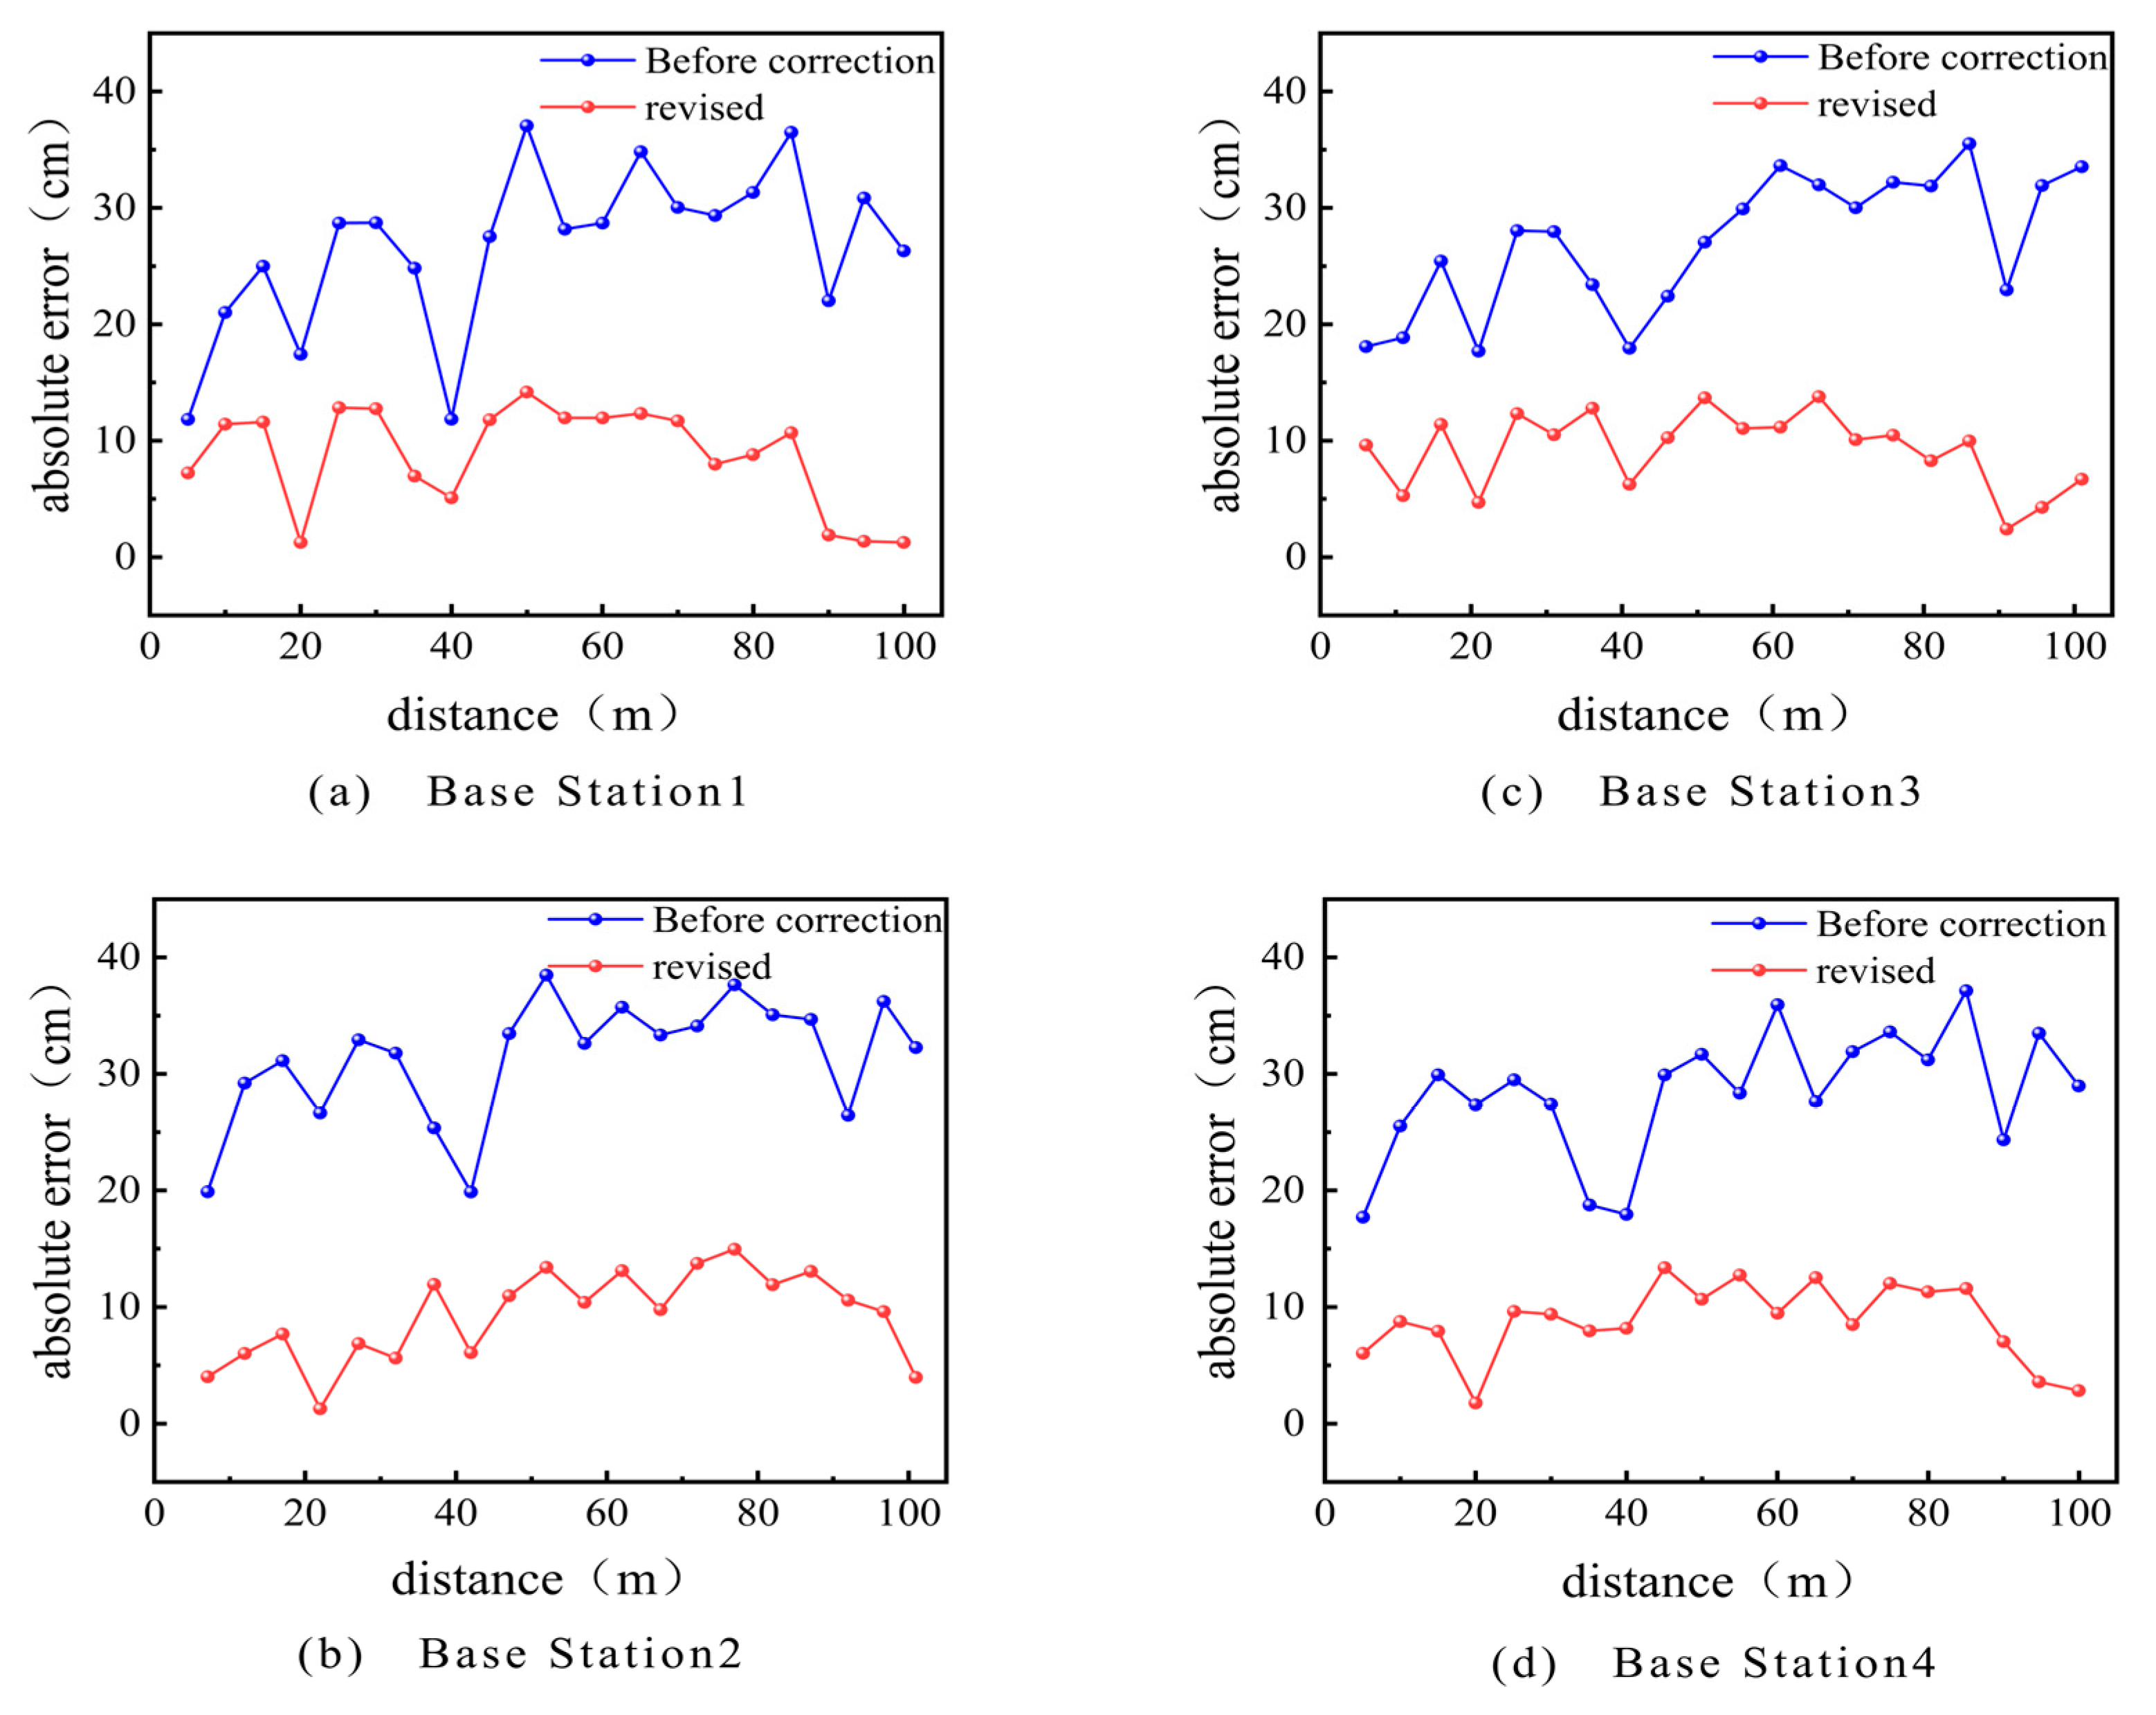
Figure 6. The label and anchor are kept at the same height. The target labels are placed at different positions and distances within the range of 0–100 m for the distance measurement, with 20 groups every 5 m. Data are collected for 2 min for each group, including 400 measurement data. The measurement data of a laser rangefinder with a measurement accuracy of 0.001 m as a reference value are compared with the collected measurement data.
Figure 7 shows the relationship between the absolute error and distance of each anchor point, both before and after correction. As shown in
Figure 7, there is a difference in the absolute error between the measured values of each anchor point at the same true distance and the environment, which is caused by hardware factors. Moreover, the measurement error of each anchor point fluctuates between 0.010 and 0.040 m at different distances. This indicates that there are certain systematic and random errors in UWB distance measurement.
The system error remains relatively stable throughout the entire measurement system process. In order to eliminate the impact of the system error on the positioning results, the system is calibrated by collecting reference point data at a known distance, establishing a system error compensation model, and applying it to distance measurement. The corrected absolute error is shown by the blue line in
Figure 7. A comparison of measurement error data before and after correction is shown in the
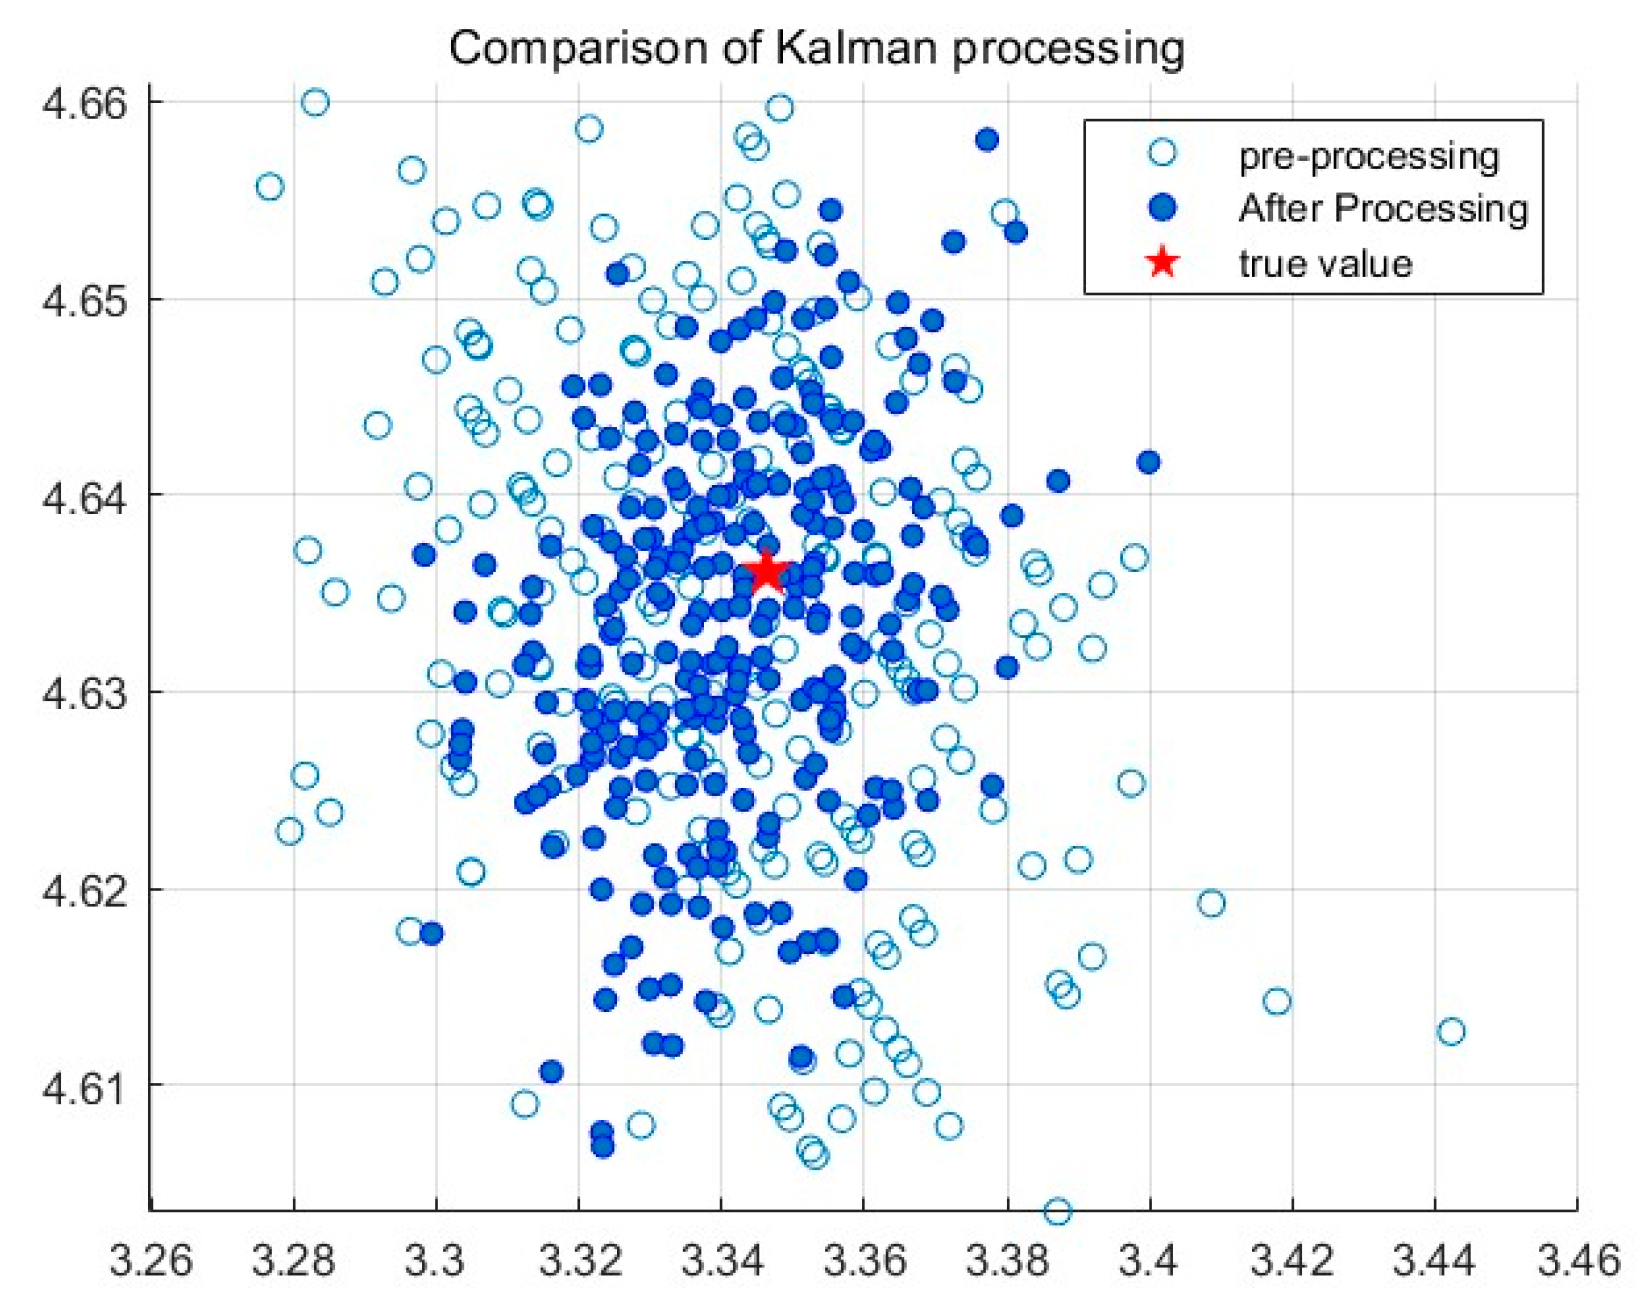
Table 1. The random error is processed using a Kalman filter, the results before and after processing are shown in
Figure 8.
The analysis shows that the average measurement error after correction has decreased by 5.9 cm and the standard deviation has decreased by 0.08 compared to the values before correction. This indicates that this pre-experiment effectively improved the performance of the UWB positioning system, making its distance measurement more accurate and stable.
By conducting the pre-experiments described in this section, we obtained distance error compensation models for UWB during the positioning process. These models can be used in subsequent positioning experiments to reflect the distance measurement noise of UWB. This is very helpful for the design and performance evaluation of subsequent localization algorithms.
4.3. Outdoor Positioning Test and Analysis
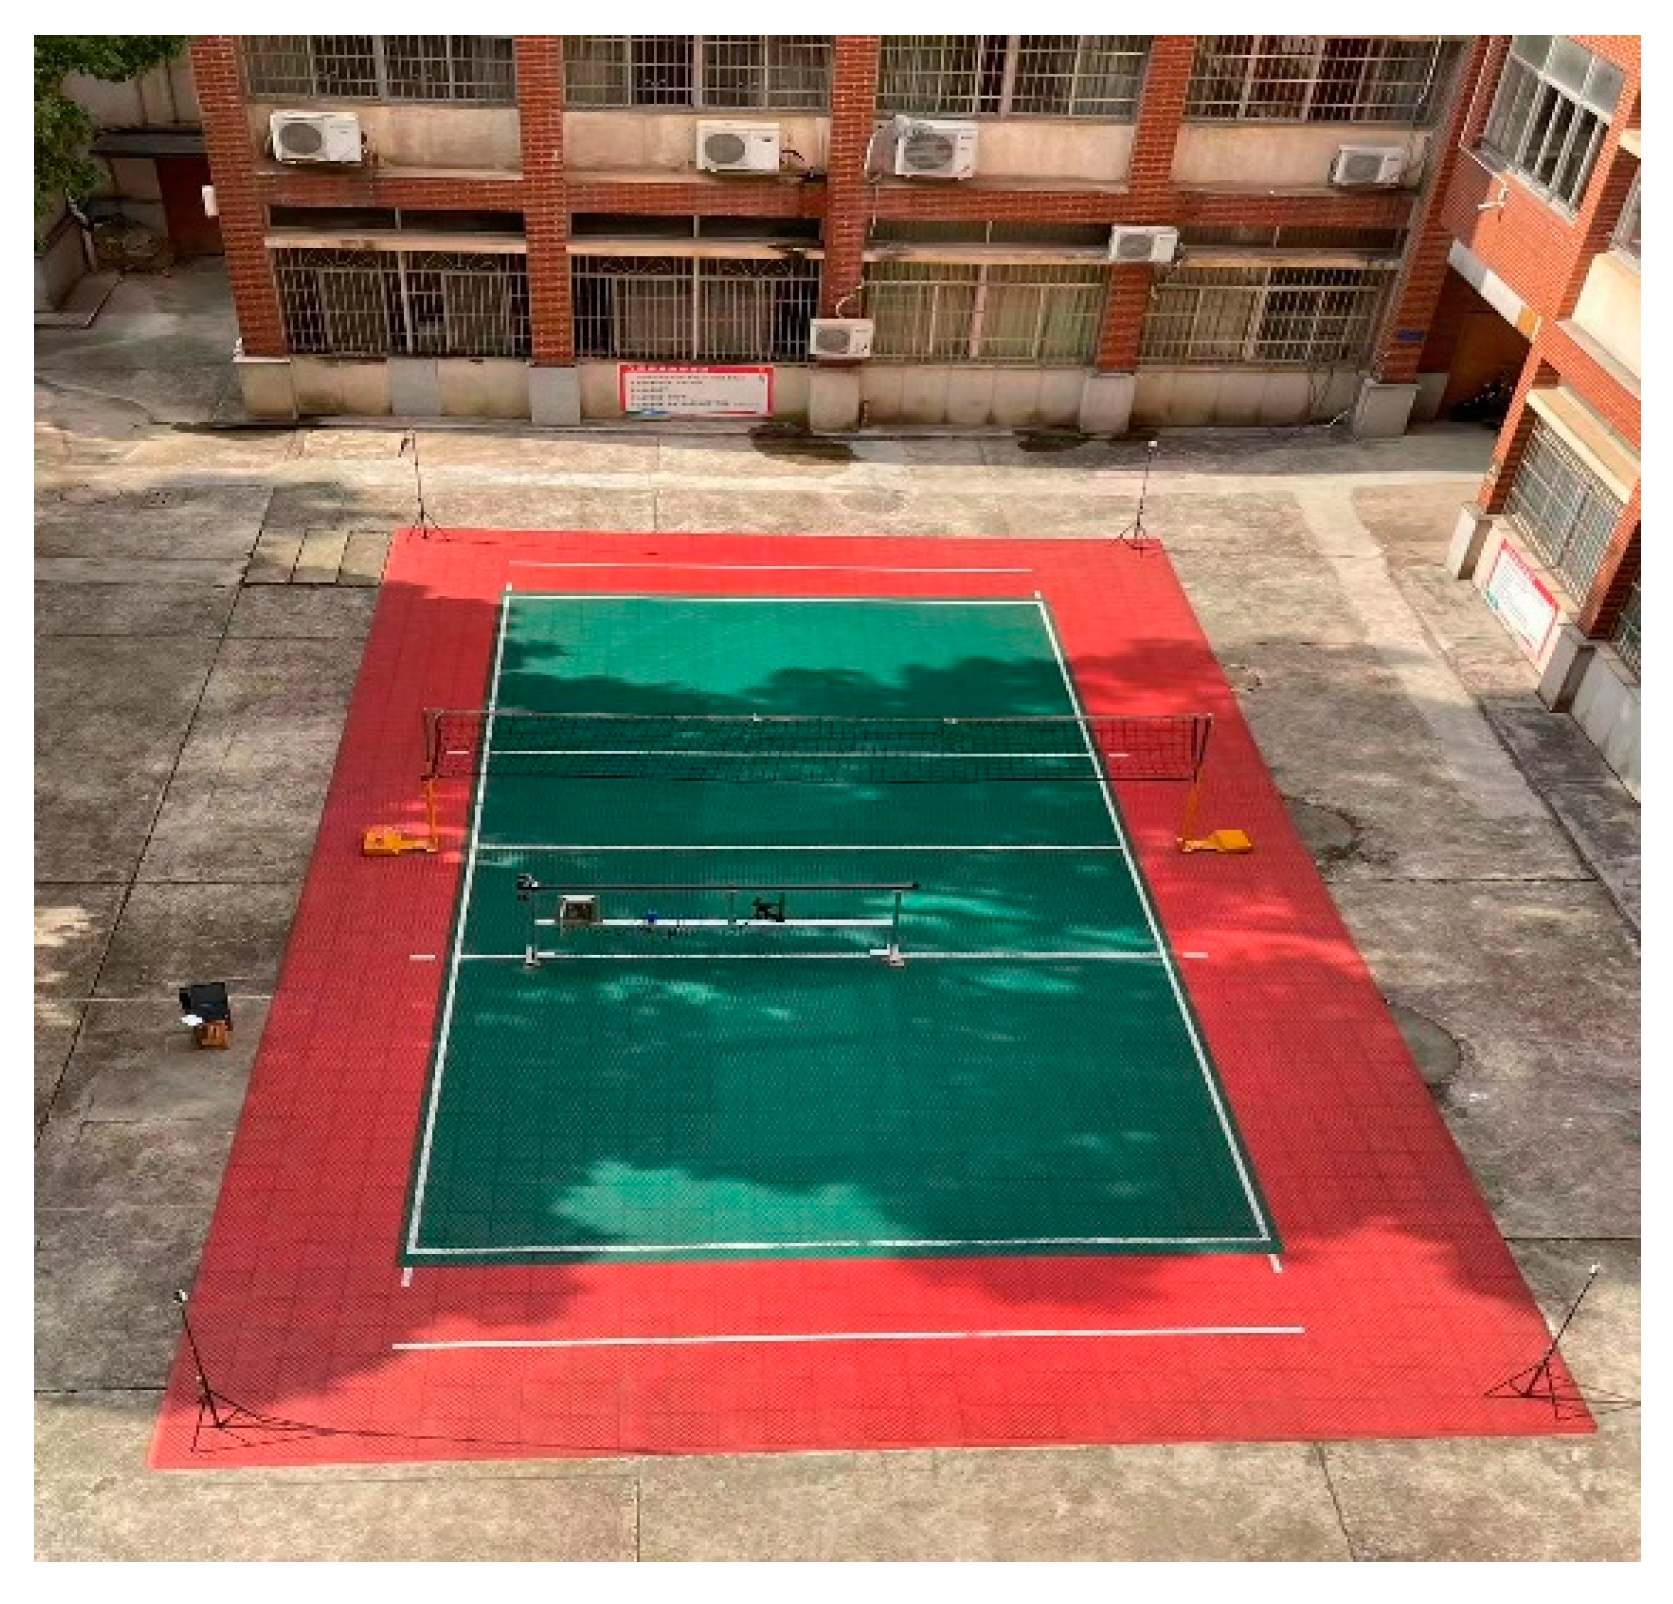
Conduct small-scale field positioning experiments on the volleyball field outside the teaching building, this experiment aims to compare the performance of different positioning methods. The length and width of the volleyball court are 16 and 9 m, respectively, and the experimental time is selected as noon, as there is sufficient lighting. We conduct a combined positioning experiment using four UWB modules, a self-made mobile positioning platform, an Intel real sense depth camera, and a Xiaomi laptop. The four modules are respectively arranged as base stations in the four corners of the volleyball field. The coordinates of the four UWB reference stations were obtained in advance using a total station and a laser rangefinder. Environment and layout of the experiment is shown in
Figure 9. The moving distance of the mobile positioning platform is 3 meters, and the linear speed of the conveyor belt is 0.105 m/s. The platform carries UWB mobile tags and the camera run at a constant speed along a fixed trajectory. In the non-line-of sight experiment, a researcher will stand at a distance of 0.5 meters from the tag, obstructing the transmission of information between the anchor and the tag.
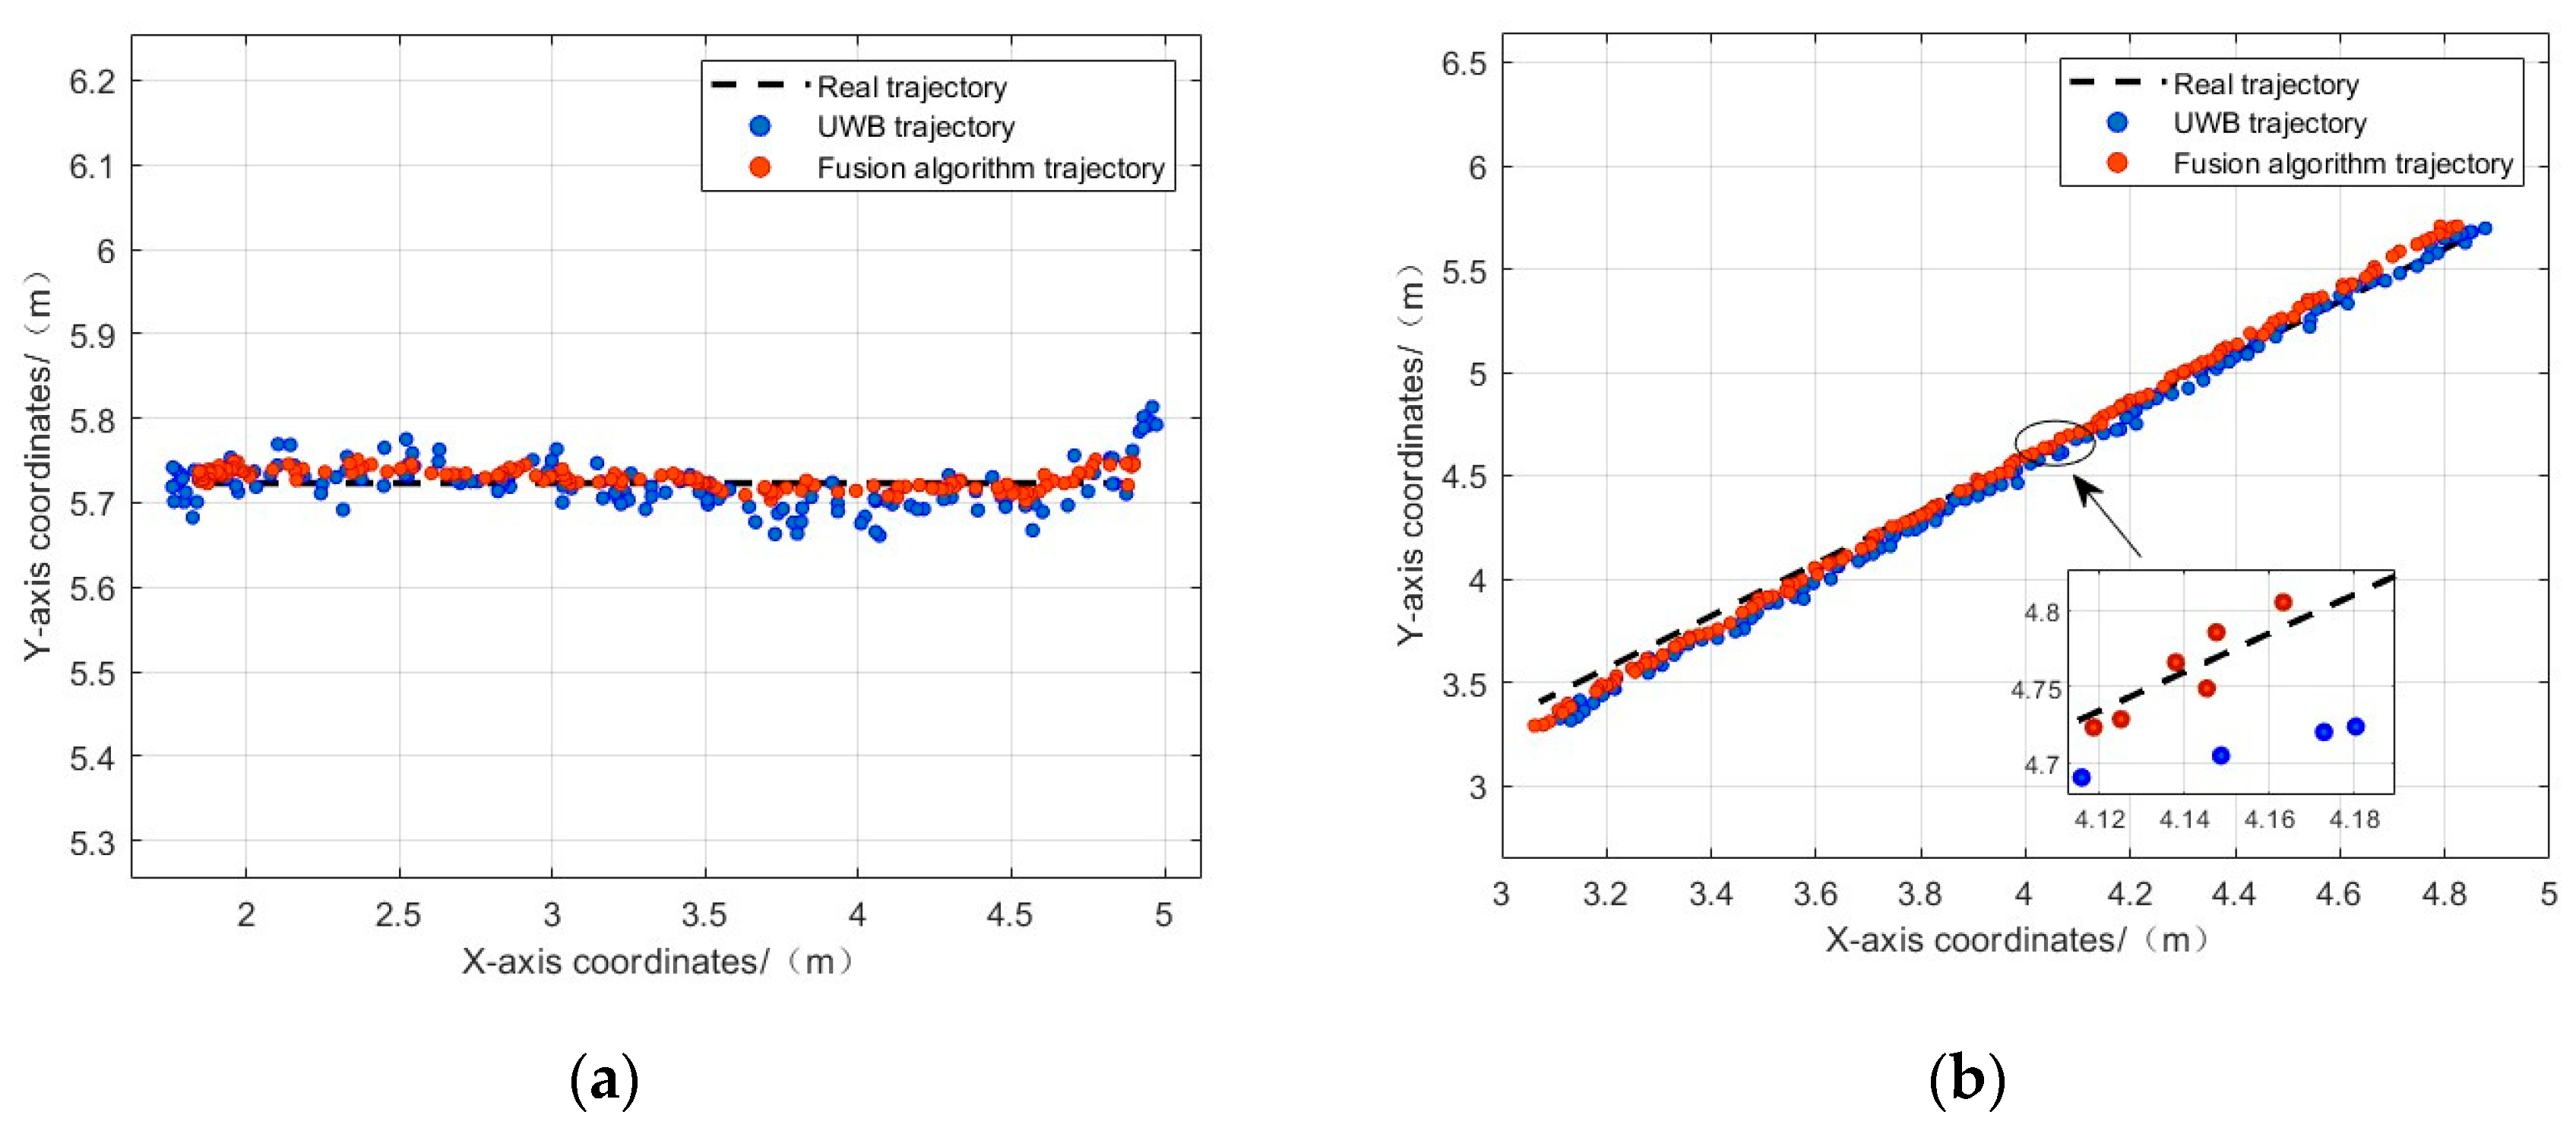
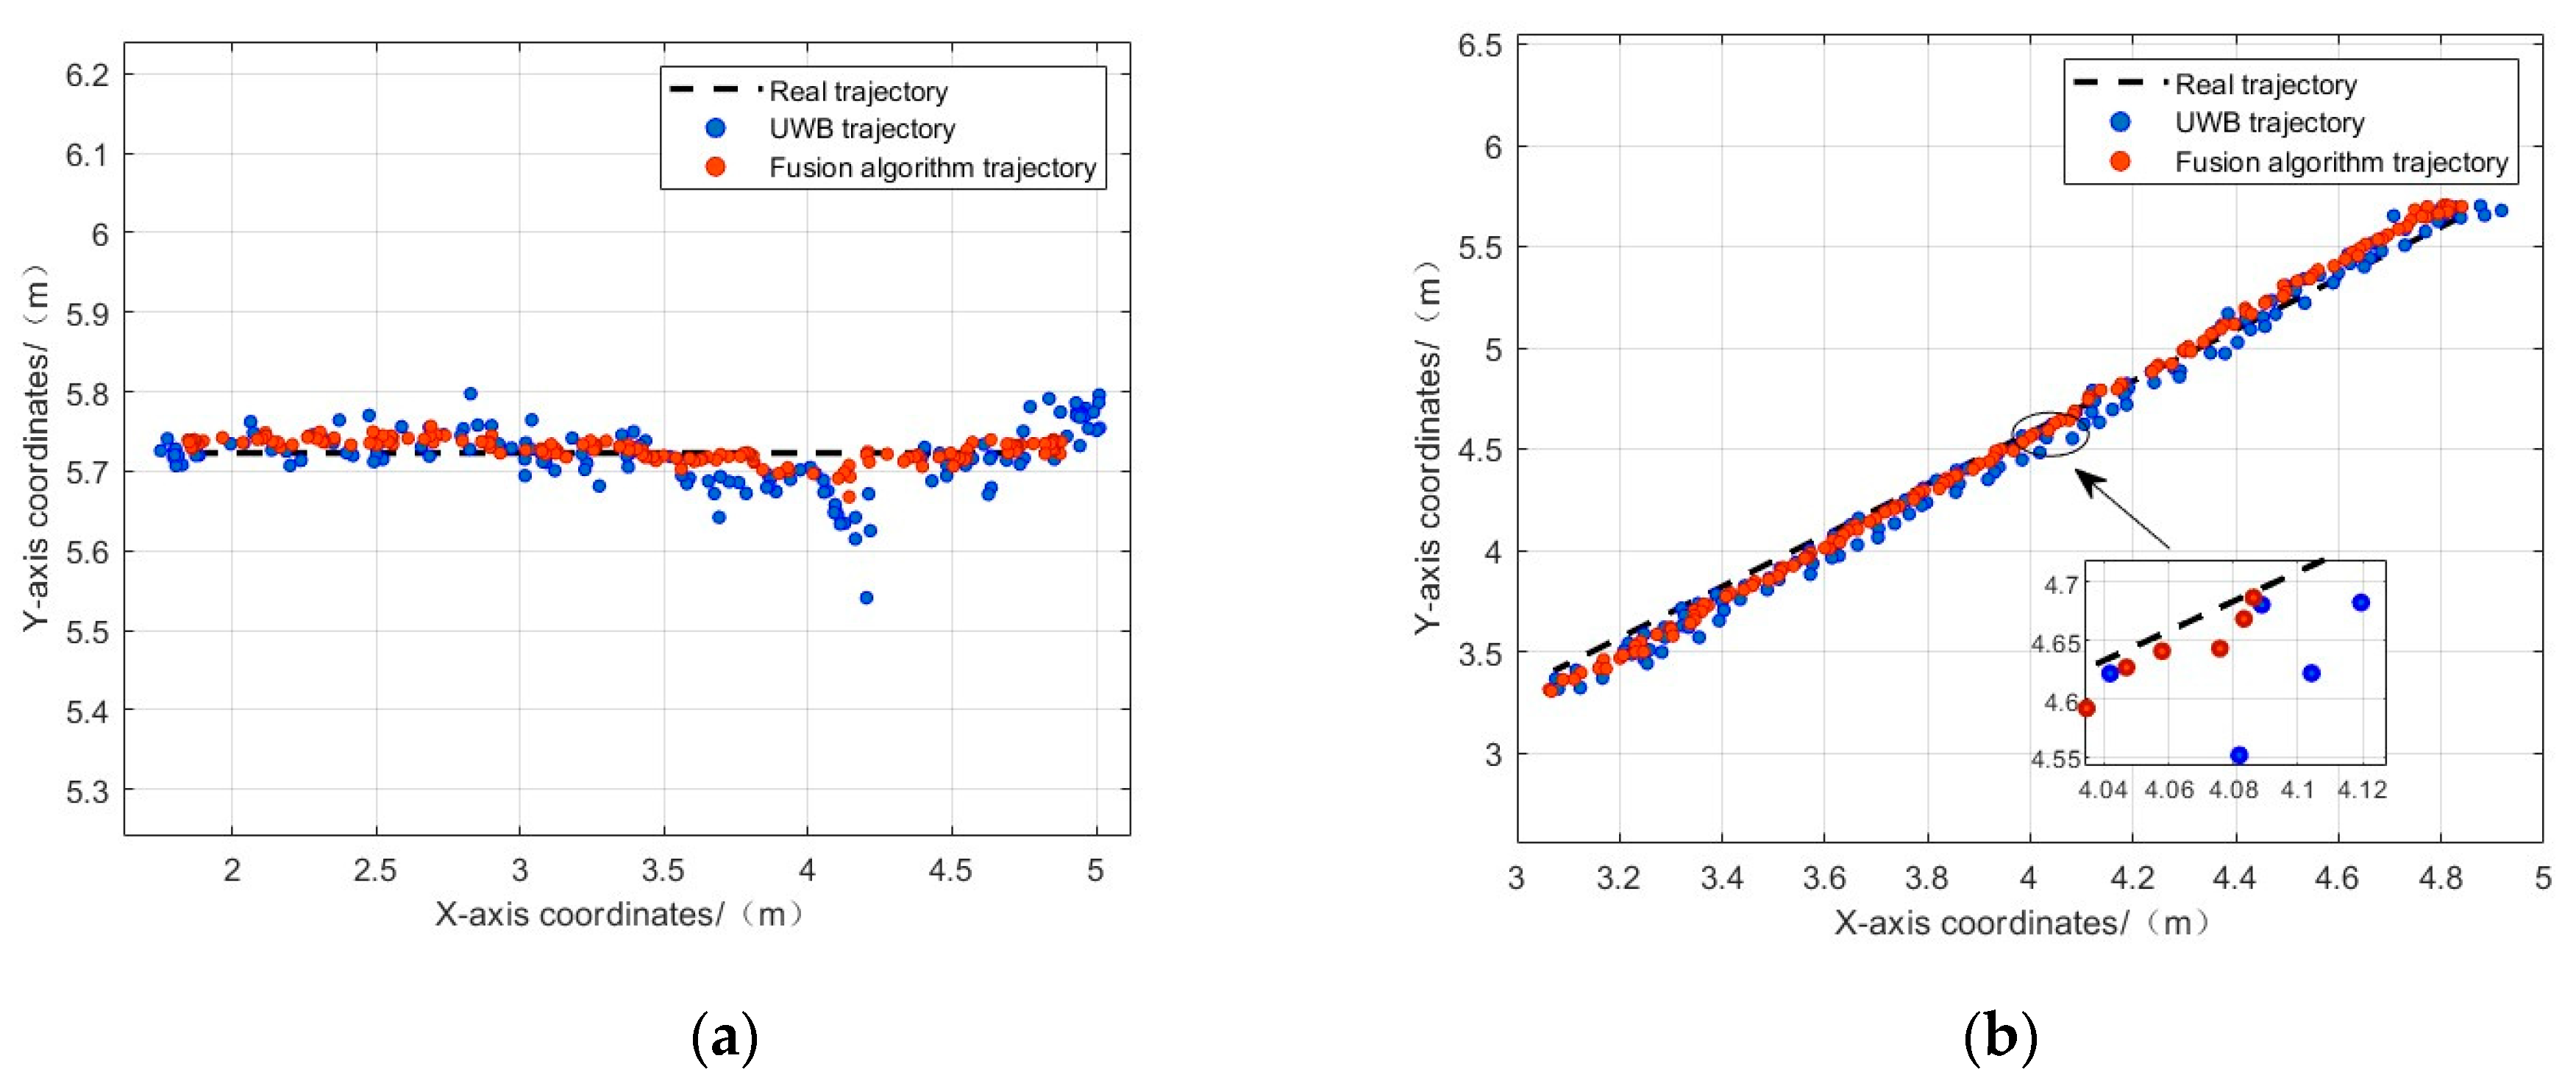
Figure 10 and
Table 2 provide a comparison of errors between single sensors and the fusion positioning algorithm in line-of-sight conditions. The analysis reveals that UWB delivers high positioning accuracy, achieving centimeter-level precision in line-of-sight conditions. However, due to the influence of random errors in the UWB system, positioning results still exhibit significant drift. The fusion algorithm proposed in this article demonstrates better robustness compared to single methods, and its trajectory aligns more closely with the actual trajectory, showing no significant drift errors. In this experiment, the fusion algorithm has an average positioning accuracy error of 0.058 m, which is 0.030 m and 0.027 m higher than the average error of the first two single methods, respectively.
When non-line-of-sight situations, such as occlusions, occur in the scene, it's evident that the positioning results of UWB experience significant jumps. The drift caused by accumulated errors is more pronounced compared to normal line-of-sight conditions, with a maximum error of up to 20 centimeters. The combined positioning method yields excellent results, effectively overcoming significant jumps and error accumulation, maintaining closer alignment with the fixed trajectory, and displaying strong reliability. The average positioning error is 0.081 m.
5. Conclusions
This article introduces a fusion localization algorithm that combines Visual Simultaneous Localization and Mapping (SLAM) technology with Ultra-Wideband (UWB) technology to address the issues of low accuracy and poor stability in single localization methods for mobile robots. The algorithm enhances the stability of the fusion positioning system in complex environments by adding a measurement noise estimator and threshold detection to the traditional Extended Kalman Filtering (EKF). Experimental results indicate that its positioning accuracy surpasses that of single methods, whether it be visual SLAM or UWB positioning. Furthermore, in cases where UWB is affected by Non-Line-of-Sight (NLOS) conditions, this algorithm demonstrates a more stable localization compared to traditional approaches. In summary, this fusion localization algorithm in the article can simultaneously meet the requirements of indoor mobile robots for positioning accuracy and stability.
However, due to various limitations, there are still aspects in the designed positioning system that can be further explored. The article outlines the following aspects for reference:
(a) The article overlooks the small spatial offset generated by the UWB label device on the mobile platform in the design. It uses the ranging value obtained from the UWB sensor directly as the distance between the camera and the UWB anchor point. This may introduce errors between the calculated position and the actual position, which can impact algorithm accuracy. Addressing this issue in the future could provide greater flexibility for the mechanical setup of the system. Additionally, over time, UWB anchor degradation may occur, and this should be carefully monitored to ensure the accuracy of the obtained position.
(b) The experiments in the article are conducted in a small field, leading to fewer accumulated errors. While the errors caused by the sensor itself are considered during data modeling, the impact of accumulated errors is closely related to the experimental site and the system's operation time. Therefore, the results obtained in different environments may vary.
Future research will address these limitations to make the study more comprehensive.
Author Contributions
Conceptualization, P.J., W.H., and C.H.; methodology, P.J.; software, C.H.; validation, C.H., T.W., K.L., J.J., and T.G.; formal analysis, P.J.; investigation, C.H.; resources, T.W. and C.H.; data curation, P.J. and C.H.; writing—original draft preparation, C.H.; writing—review and editing, P.J., W.H., and C.H.; visualization, P.J.; supervision, P.J. and W.H.; project administration, W.H.; funding acquisition, P.J. and W.H. All authors have read and agreed to the published version of the manuscript.
Funding
This work was supported by the Key R&D project of Hunan Province (grant number 2023NK2010), a sub-project of the National Key R&D Plan (grant number 2022YFD2002001) and the Chenzhou National Sustainable Development Agenda Innovation Demonstration Zone Construction Project (grant number 2022sfq20).
Conflicts of Interest
The authors declare no conflicts of interest.
References
- Zhang, X.; Zuo, X.; Li, P.; Yuming, P.A.N. Convergence Time and Positioning Accuracy Comparison between BDS and GPS Precise Point Positioning. Acta Geod. Cartogr. Sin. 2015, 44, 250–256. [Google Scholar]
- Zhai, K.; Xu, J.; Ye, T. GPS/BD2 Dual-System Positioning Algorithm Analysis and Test. Microellectronics Comput. 2013, 30, 130–133. [Google Scholar]
- Tao, C.; Gao, Z.; Yan, J.; Li, C.; Cui, G. Indoor 3D Semantic Robot VSLAM Based on Mask Regional Convolutional Neural Network. IEEE Access 2020, 8, 52906–52916. [Google Scholar] [CrossRef]
- Khairuddin, A.R.; Talib, M.S.; Haron, H. Review on simultaneous localization and mapping (SLAM). In Proceedings of the 2015 IEEE International Conference on Control System, Computing and Engineering (ICCSCE), Penang, Malaysia, 27–29 November 2015; pp. 85–90. [Google Scholar]
- Singh, G.; Wu, M.; Lam, S.K. Fusing Semantics and Motion State Detection for Robust Visual SLAM. In Proceedings of the 2020 IEEE Winter Conference on Applications of Computer Vision (WACV), Snowmass, CO, USA, 1–5 March 2020; pp. 2753–2762. [Google Scholar]
- Dong, W.; Roy, P.; Isler, V. Semantic mapping for orchard environments by merging two-sides reconstructions of tree rows. J. Field Robot. 2020, 37, 97–121. [Google Scholar] [CrossRef]
- Fan, Y.; Feng, Z.; Mannan, A.; Khan, T.U.; Shen, C.; Saeed, S. Estimating Tree Position, Diameter at Breast Height, and Tree Height in Real-Time Using a Mobile Phone with RGB-D SLAM. Remote Sens. 2018, 10, 1845. [Google Scholar] [CrossRef]
- Hu, W.; Jiang, P.; Xiao, F.; Jin, S.; Luo, Y.; Liu, Q.; Long, L.; Shi, Y. Identifying rice seedling bands based on slope virtualization clustering. Comput. Electron. Agric. 2020, 175, 105470. [Google Scholar] [CrossRef]
- Zhou, J.; Hu, W.; Zou, A.; Zhai, S.; Liu, T.; Yang, W.; Jiang, P. Lightweight Detection Algorithm of Kiwifruit Based on Improved YOLOX-S. Agriculture 2022, 12, 993. [Google Scholar] [CrossRef]
- Zhou, J.; Jiang, P.; Zou, A.; Chen, X.; Hu, W. Ship Target Detection Algorithm Based on Improved YOLOv5. J. Mar. Sci. Eng. 2021, 9, 908. [Google Scholar] [CrossRef]
- Hirschmuller, H. Accurate and efficient stereo processing by semi-global matching and mutual information. In Proceedings of the 2005 IEEE Computer Society Conference on Computer Vision and Pattern Recognition (CVPR'05), San Diego, CA, USA, 20–25 June 2005; pp. 807–814. [Google Scholar]
- Nellithimaru, A.K.; Kantor, G.A. ROLS: Robust Object-Level SLAM for Grape Counting. In Proceedings of the 2019 IEEE/CVF Conference on Computer Vision and Pattern Recognition Workshops (CVPRW), Long Beach, CA, USA, 16–17 June 2019; pp. 2648–2656. [Google Scholar]
- Di, K.; Wan, W.; Zhao, H.; Liu, Z.; Wang, R.; Zhang, F. Progress and Applications of Visual SLAM. Acta Geod. Cartogr. Sin. 2018, 47, 770–779. [Google Scholar]
- Chen, Z.; Xu, A.; Sui, X.; etc. Algorithm of indoor UWB/LiDAR combined positioning. J. Navig. Position. 2019, 7, 38–42. [Google Scholar]
- Yang, D.; Zhen, J.; Sui, X. Indoor positioning method combining UWB/LiDAR. Sci. Surv. Mapp. 2019, 44, 72–78. [Google Scholar]
- Zou, A.; Hu, W.; Luo, Y.; Jiang, P. An Improved UWB/IMU Tightly Coupled Positioning Algorithm Study. Sensors 2023, 23, 5918. [Google Scholar] [CrossRef] [PubMed]
- Tiemann, J.; Ramsey, A.; Wietfeld, C. Enhanced UAV Indoor Navigation through SLAM-Augmented UWB Localization. In Proceedings of the 2018 IEEE International Conference on Communications Workshops (ICC Workshops), Kansas City, MO, USA, 20–24 May 2018; pp. 1–6. [Google Scholar]
- Wang, W.; Huang, P.; Yang, Z. Indoor Positioning Method Based on UWB Odometer and RGB-D Fusion. Comput. Sci. 2020, 47, 334–338. [Google Scholar]
- Qiao, Z.; Xu, A.; Sui, X.; etc. An integrated indoor positioning method using ORB-SLAM/UWB. J. Navig. Position. 2018, 6, 29–34. [Google Scholar]
- Wang, Y.; Chang, X.; Zhang, J. Hybrid Moving Object Localization with EKF Based on Measurement Techniques of UWB and ZigBee. J. Appl. Sci. 2019, 37, 815–824. [Google Scholar]
- Zhu, S.; Jiang, J. Research on the Application of Extended Kalman Filter Algorithm in Navigation. Autom. Appl. 2019, 11, 53–54. [Google Scholar]
- Liu, C.; Wang, D.; Yu, T.; Lin, P.; Zhong, T.; Li, J. Research on combined location method of dual rail inspection vehicle based on extended Kalman filter. J. Railw. Sci. Eng. 2020, 17, 2649–2655. [Google Scholar]
- Mur-Artal, R.; Tardos, J.D. ORB-SLAM2: An Open-Source SLAM System for Monocular, Stereo, and RGBD Cameras. IEEE Trans. Robot. 2017, 33, 1255–1262. [Google Scholar] [CrossRef]
- Rublee, E.; Rabaud, V.; Konolige, K.; Bradski, G. ORB: An efficient alternative to SIFT or SURF. In Proceedings of the 2011 International Conference on Computer Vision, Barcelona, Spain, 6–13 November 2011; pp. 2564–2571. [Google Scholar]
- Galvez-Lopez, D.; Tardos, J.D. Bags of Binary Words for Fast Place Recognition in Image Sequences. IEEE Trans. Robot. 2012, 28, 1188–1197. [Google Scholar] [CrossRef]
- Alarifi, A.; Al-Salman, A.; Alsaleh, M.; Alnafessah, A.; Al-Hadhrami, S.; Al-Ammar, M.A.; Al-Khalifa, H.S. Ultra Wideband Indoor Positioning Technologies: Analysis and Recent Advances. Sensors 2016, 16, 707. [Google Scholar] [CrossRef]
- Rahman, M.; Haider, A.; Naghshvarianjahromi, M. A Systematic Methodology for the Time-Domain Ringing Reduction in UWB Band-Notched Antennas. IEEE Antennas Wirel. Propag. Lett. 2020, 19, 482–486. [Google Scholar] [CrossRef]
- Wang, B.; Song, H.; Rhee, W.; Wang, Z. Overview of ultra-wideband transceivers-system architectures and applications. Tsinghua Sci. Technol. 2022, 27, 481–494. [Google Scholar] [CrossRef]
- Shen, G.; Zetik, R.; Thoma, R.S. Performance comparison of TOA and TDOA based location estimation algorithms in LOS environment. In Proceedings of the 2008 5th Workshop on Positioning, Navigation and Communication, Hannover, Germany, 27 March 2008; pp. 71–78. [Google Scholar]
- De Angelis, G.; Moschitta, A.; Carbone, P. Positioning Techniques in Indoor Environments Based on Stochastic Modeling of UWB Round-Trip-Time Measurements. IEEE. Trans. Intell. Transp. Syst. 2016, 17, 2272–2281. [Google Scholar] [CrossRef]
- Oguz-Ekim, P. TDOA based localization and its application to the initialization of LiDAR based autonomous robots. Robot. Auton. Syst. 2020, 131, 103590. [Google Scholar] [CrossRef]
- Gao, S.; Zhang, S.; Wang, G.; Li, Y. Robust Second-Order Cone Relaxation for TW-TOA-Based Localization with Clock Imperfection. IEEE Signal Process. Lett. 2016, 23, 1047–1051. [Google Scholar] [CrossRef]
- Cazzorla, A.; De Angelis, G.; Moschitta, A.; Dionigi, M.; Alimenti, F.; Carbone, P. A 5.6-GHz UWB Position Measurement System. IEEE Trans. Instrum. Meas. 2013, 62, 675–683. [Google Scholar] [CrossRef]
- Wang, M.; Zhang, S. Spatial Data Registration in Theodolite Measuring System Based on SVD Method. J. Geomat. 2016, 41, 31–33. [Google Scholar]
- Liu, S.; Yu, Y.; Luo, W.; etc. Estimation of State of Charge for Lithium Battery Based on Adaptive Unscented Kalman Filter. Control Eng. China 2017, 24, 1611–1616. [Google Scholar]
|
Disclaimer/Publisher’s Note: The statements, opinions and data contained in all publications are solely those of the individual author(s) and contributor(s) and not of MDPI and/or the editor(s). MDPI and/or the editor(s) disclaim responsibility for any injury to people or property resulting from any ideas, methods, instructions or products referred to in the content. |
© 2024 by the authors. Licensee MDPI, Basel, Switzerland. This article is an open access article distributed under the terms and conditions of the Creative Commons Attribution (CC BY) license (http://creativecommons.org/licenses/by/4.0/).
