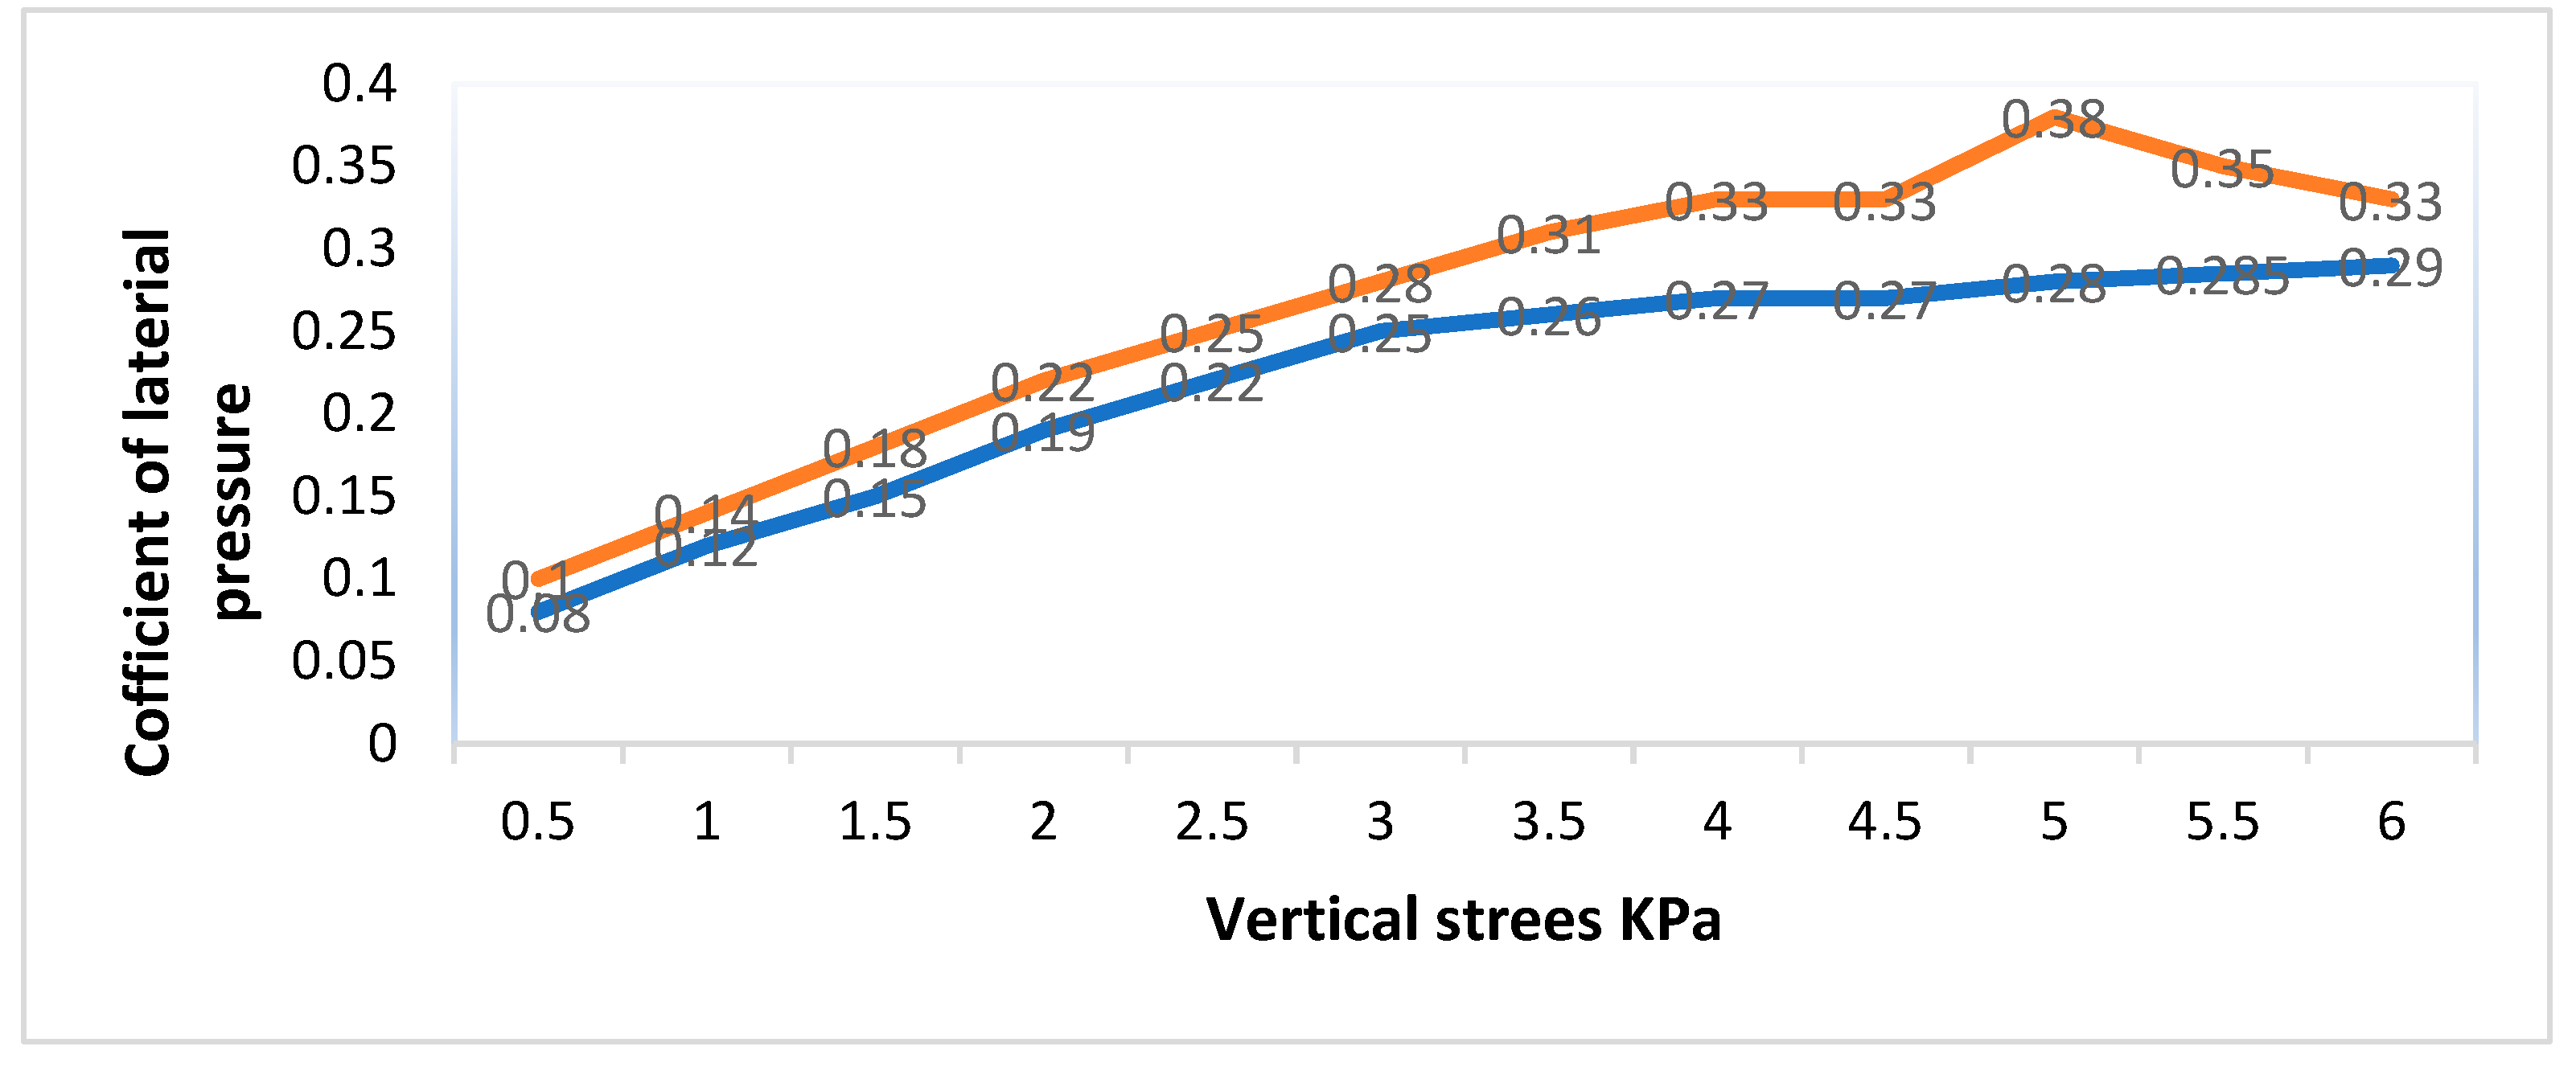
Figure 1.
The maximum coefficient of lateral soil pressure of sand (1 mm) with reinforcement and without reinforcement.
Figure 1.
The maximum coefficient of lateral soil pressure of sand (1 mm) with reinforcement and without reinforcement.
1. Introduction
Previous studies have identified several difficult and complex problems that occur during road construction and maintenance (Watson, J. P., highway construction and maintenance) particularly in areas where long roads are built. One of the most significant problems is the lack of stable soil for various reasons, e.g., a high moisture content (Smith 2006), for which many solutions have been applied (Zhu et al. 2019; Sweeney, 1875–1914). However, the surface must be robust and rigid.
Various studies have tested the effectiveness of using piles filled with widely available and inexpensive materials, such as sand and aggregates of different sizes. This increases the durability of road foundations to fortify weak soils such as those in the sea, rivers, swamps, and lakes, which are saturated with water or have a high degree of salinity (Ayyad and Ahmad 2021). Lateral earth pressure is the pressure exerted by the soil in the horizontal direction. It is important because it affects the consolidation behaviour and strength of the soil and is incorporated into the design of geotechnical engineering structures, such as retaining walls, basements, tunnels, deep foundations, and braced excavations. The earth pressure problem dates back to the beginning of the 18th century. Gautier (1717) listed five areas requiring research, one of which was the dimensions of the gravity retaining walls required to hold back the soil. However, the first main contribution to the field of earth pressure was made several decades later by Coulomb (1776), who considered a rigid mass of soil sliding on a shear surface. Rankine (1856) extended the earth pressure theory by deriving a solution for a complete soil mass in a state of failure, as opposed to Coulomb’s solution, which considered a soil mass bounded by a single failure surface. Originally, Rankine’s theory was applied only to cohesion less soils. However, Bell (1915) subsequently applied this theory to cover soils possessing both cohesion and friction. The foundation soil receives surface shear stress from the lateral earth pressures within an embankment’s fill, which may significantly affect the foundation’s bearing capacity and the embankment’s stability (Practical Guide to Green Technology for Ground Engineering, 2011). The addition of basal reinforcement can reduce the lateral deformations of soft foundations while reducing some or all of the earth pressure within the embankment. In some cases, basal reinforcement can be used to induce shear stresses that increase the bearing capacity. A reinforced embankment design typically considers the soil carrying capacity, overall stability of the embankment, pullout/anchorage capability of the base reinforcement, and deformations of the embankment (Leroueil and Rowe 2001).
In the present study, the coefficients of lateral pressure in piles filled with different materials (sand and granite grains) used to reinforce road layers were compared with reinforcement added in various other ways. The ratio of the horizontal effective stress to the vertical effective stress, which is known as the coefficient of lateral earth pressure (Medina et al. 2018), expresses the natural state of the soil. Therefore, accurately determining its value is common practice in engineering.
2. Materials and Methods
Several experiments were conducted in the laboratory to evaluate the effects of stresses on the foundation with and without pile reinforcement. Soil experiments were conducted in three cases—the use of sand (1 mm) in the piles, the use of granite grains (2 mm) in the piles, and the use of granite grains (3 mm) in the piles—with different forms of reinforcement. The reinforcement was installed securely using metal sheets inside the piles in different ways. The first method involved placing one plate in the middle of the sample and dividing the sample into two equal parts (h/2), and the second method involved placing two plates and dividing the sample into three equal parts (h/3). The third method involved placing three plates, dividing the sample into four equal parts (h/4); the fourth method involved placing four plates, dividing the sample into five equal parts (h/5); and the fifth method involved placing five plates, dividing the sample into six equal parts (h/6). Suitable measuring devices were installed to monitor the behavior of the reinforced piles during the test, including stress gauges and calibrated load cells, and the accuracy of the devices was checked before proceeding. The test device was prepared in a laboratory and included a reaction framework or robust reaction points to simulate the loads and boundary conditions to which the piles were exposed. The setup was confirmed to be stable and capable of applying the desired forces or displacements to the piles during testing. Loads were applied to the piles in a controlled manner using a piston to press the soil with the gradual addition of different loads, with continuous monitoring of the responses of the piles. Data were collected from the installed devices throughout the testing process. Stress and load measurements were recorded, and the accuracy of the data was confirmed. The collected data were analyzed to evaluate the performance and behavior of the reinforced piles. The experimental results were compared. The experiments indicated the changes in the vertical and horizontal pressures, as well as the coefficient of lateral pressure, which were measured using a stabilometer. The following parameters were used in the experiments: P represents the applied load (kg); the arm length was 10 cm; the sample area was пD²∕4 = 3.14 × (5.65)2/4 = 25 cm2, V = P × 10/25 represents the vertical pressure; ϬH represents the horizontal pressure; K = ϬH/ϬV is the coefficient of lateral soil pressure; the box area was 58 × 130 × 22 cm2; loamy soil was placed in layers and then stacked according to the specifications by the piston with beating; moisture content was (W%) =15.2% ; the liquid limit (LL) was 27.5%; the optimum moisture content (Wopt) was 13%; the coefficient of moisture KW was 1.2; and the compaction factor was 0.95.
a. First Case
A sample was used with piles filled with sand. Loads of 1.25 kg, 2.50 kg, 3.75 kg, 5.00 kg, 6.75 kg, 7.50 kg, 8.75 kg, 10.00 kg, 11.25 kg, 12.50 kg, 13.75 kg, and 15.00 kg were placed on the sample respectively with the change of reinforcement each time. Readings were taken and calculations done.
The results are presented in (
Table 1) below:
As shown in
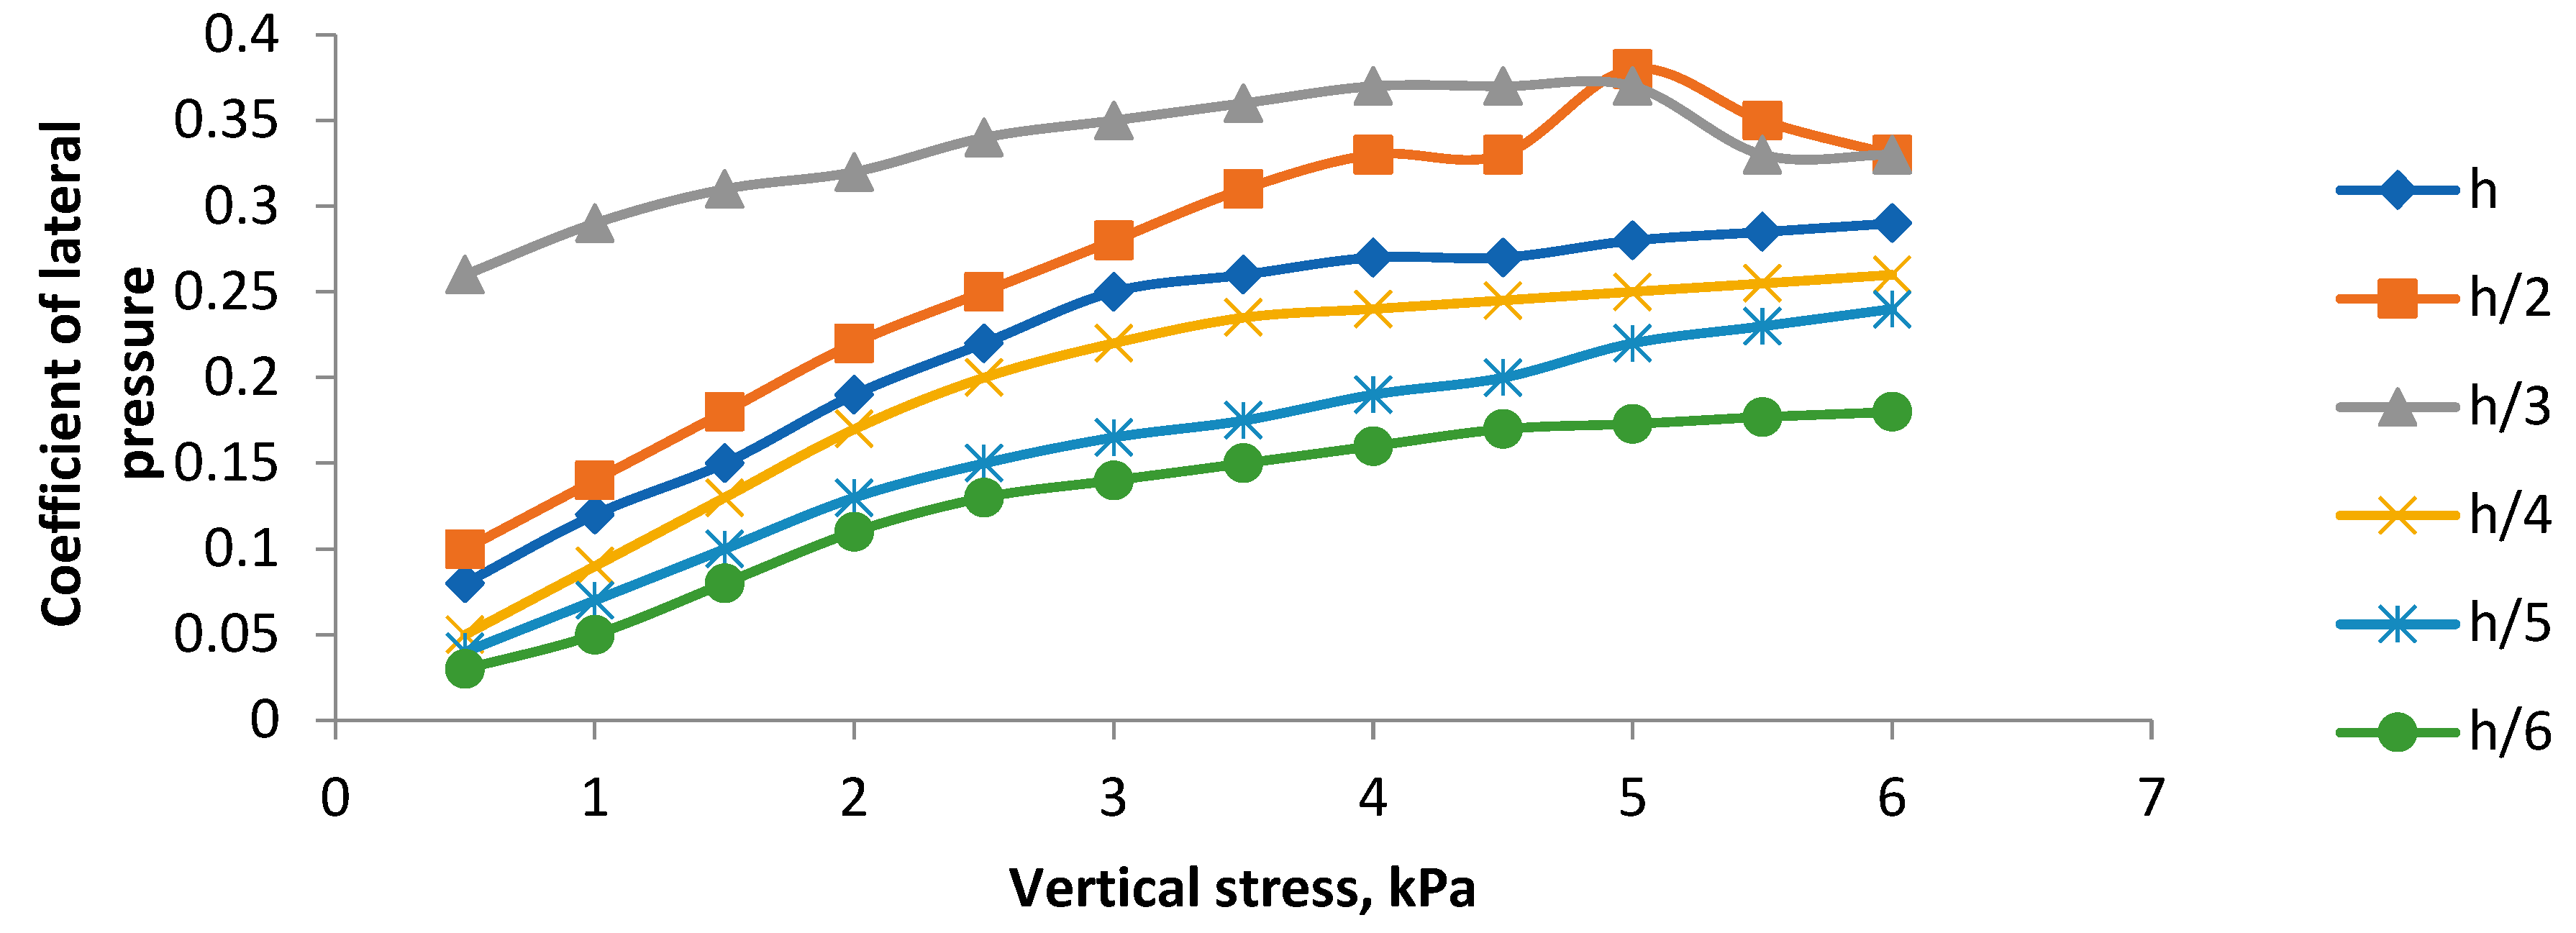
Table 1 and
Figure 2, a direct relationship was observed between the load and coefficient of lateral pressure for h/2 and h/3 when the load increased from 1.25 to 12.5 kg. For h, h/4, h/5, and h/6, there was a direct relationship between the load and coefficient of lateral pressure when the load increased from 1.25 to 15.00 kg. The maximum coefficient of lateral pressure (0.38) occurred when the reinforced sand pile was divided into two parts (h/2) and the load was 12.5 kg. The maximum value when the pile was unreinforced (h) was 0.29, and the load was 13.5 kg.
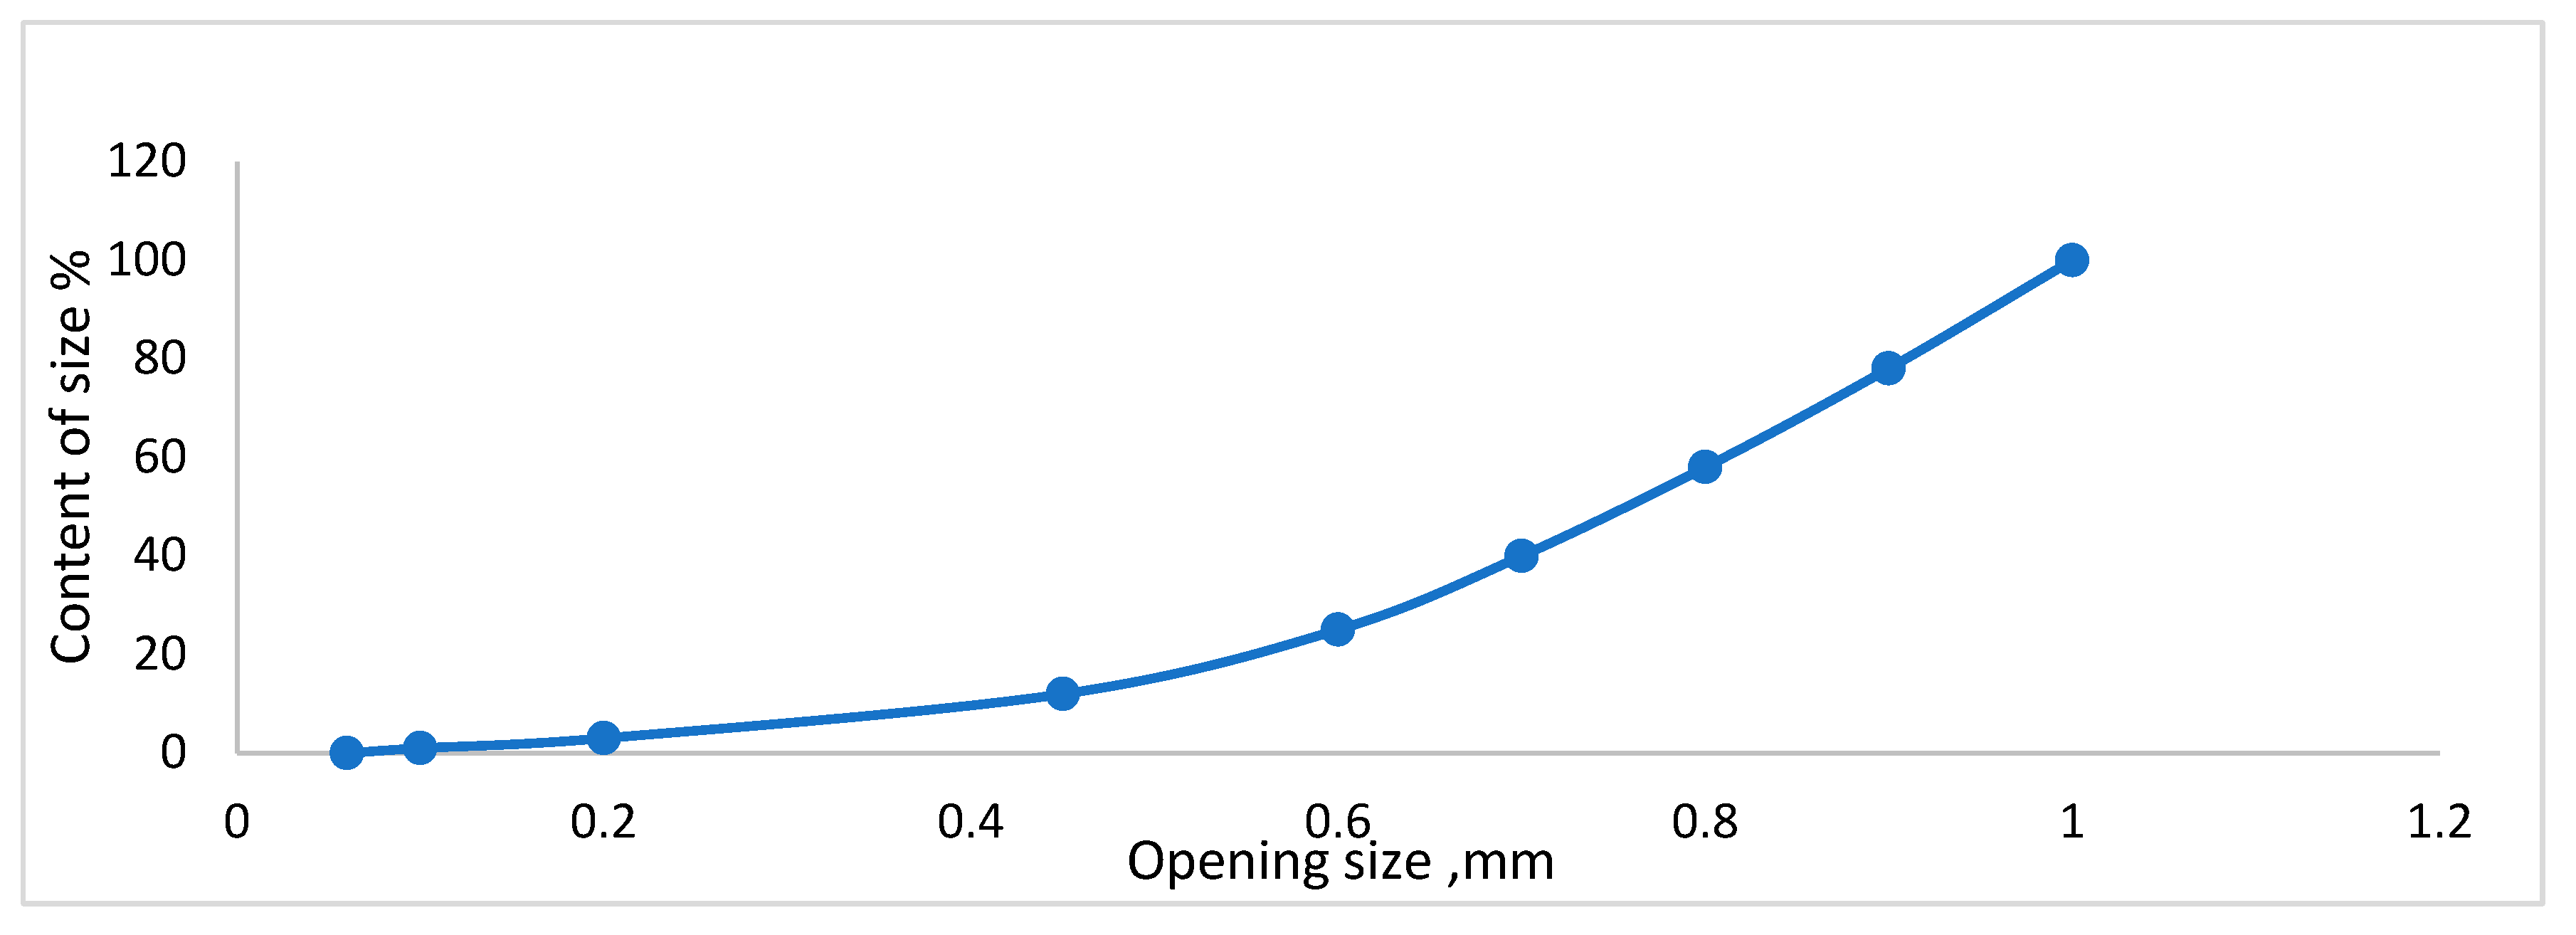
The particle size distribution curve of granular content of sand (1 mm) is shown in a schematic diagram in
Figure 3.
b. Second Case
Piles filled with granite grains (2 mm) were used as samples. Loads of 1.25, 2.50, 3.75, 5.00, 6.75, 7.50, 8.75, 10.00, 11.25, 12.50, 13.75, and 15.00 kg were placed on the sample, and this was repeated when the reinforcement changed
.The results are presented in
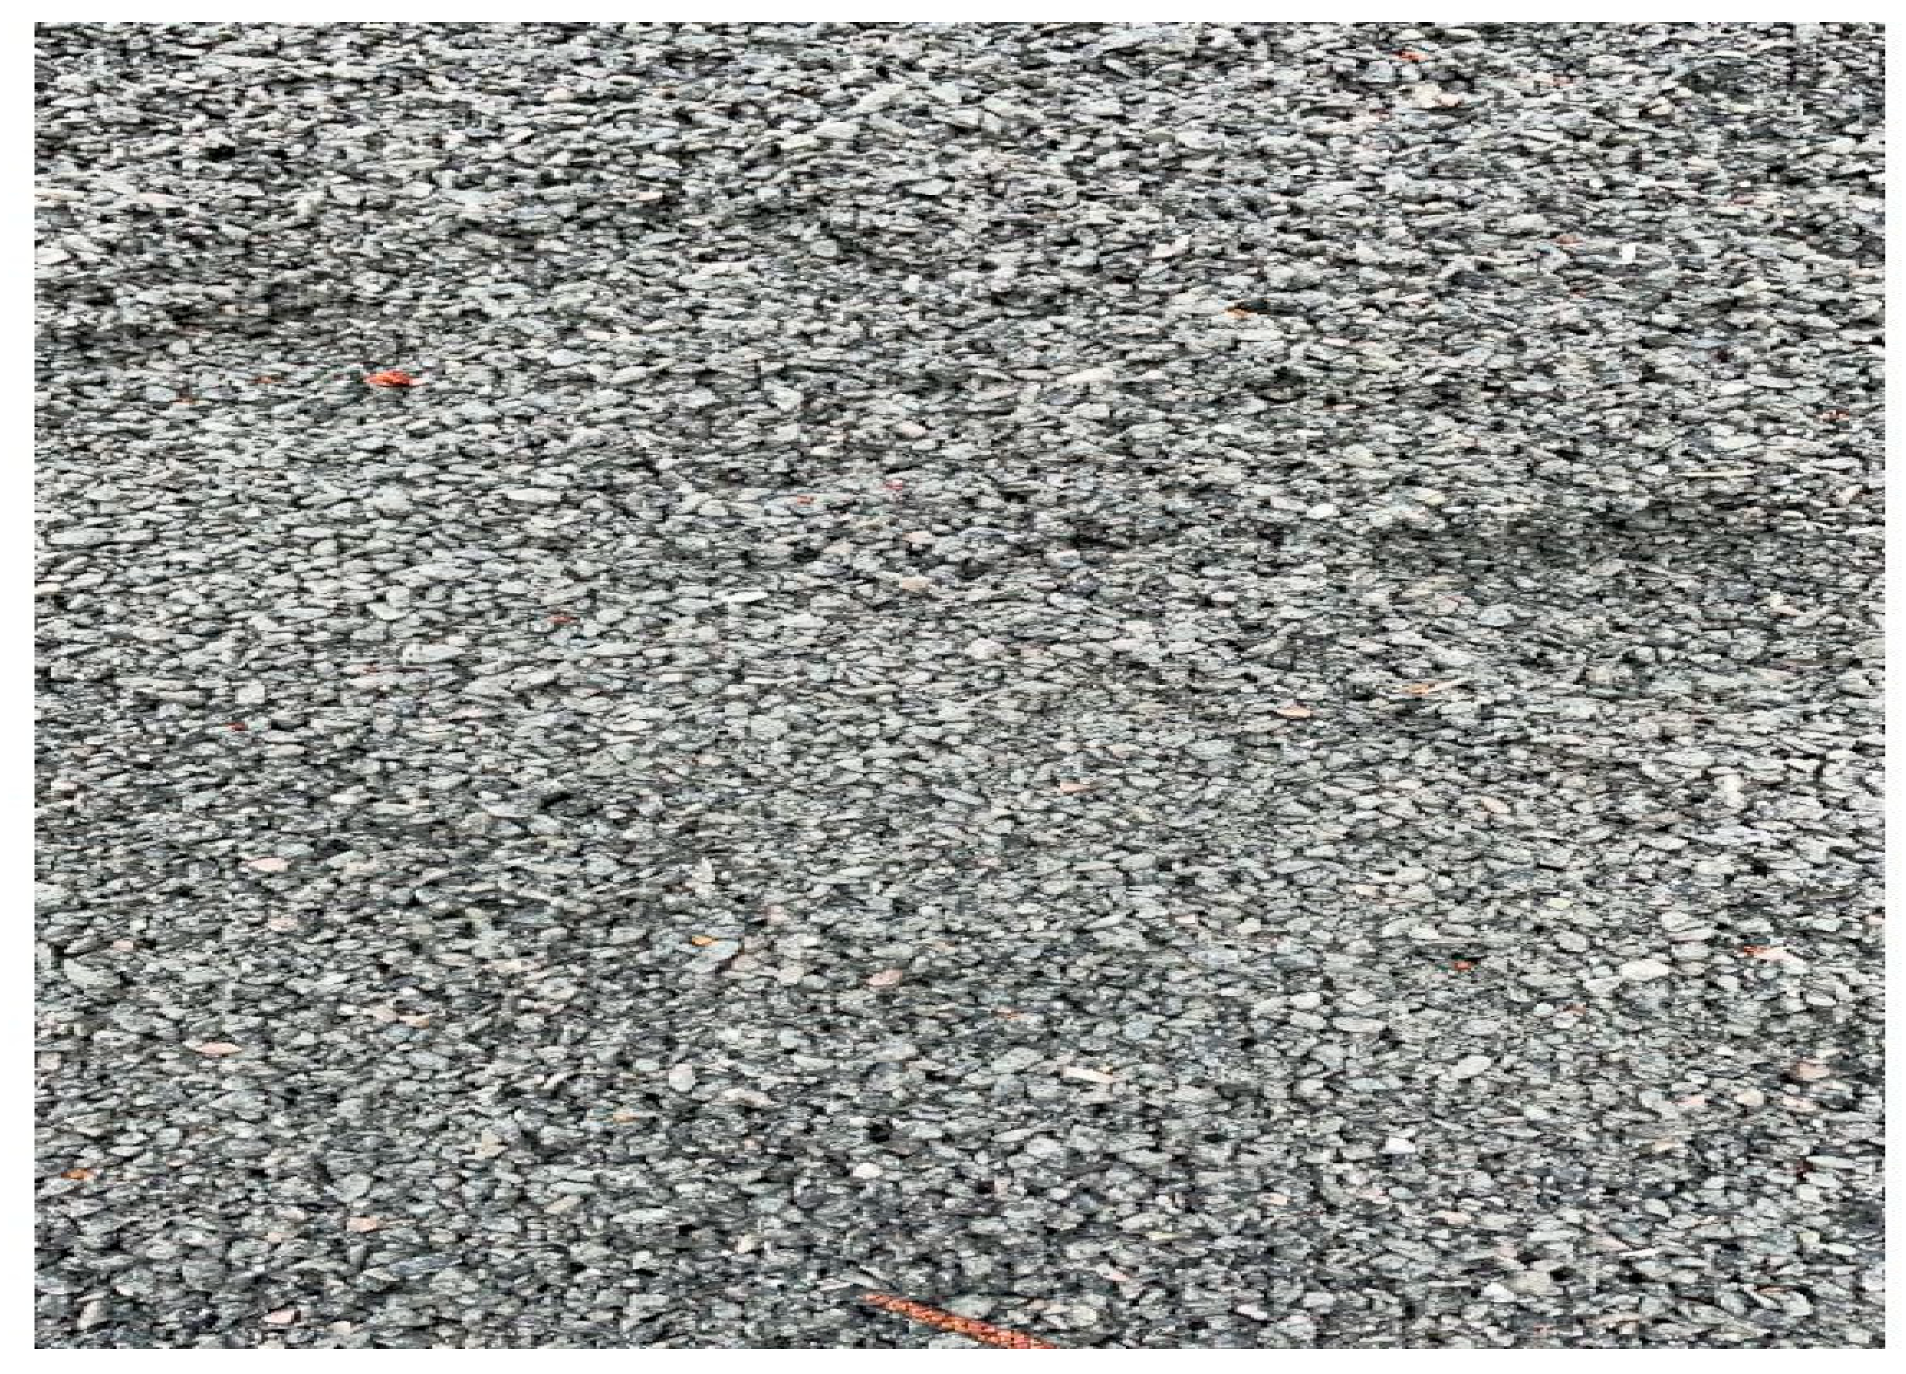
Table 2 and the sample of grained granite is shown in
Figure 4.
As shown in
Table 2 and
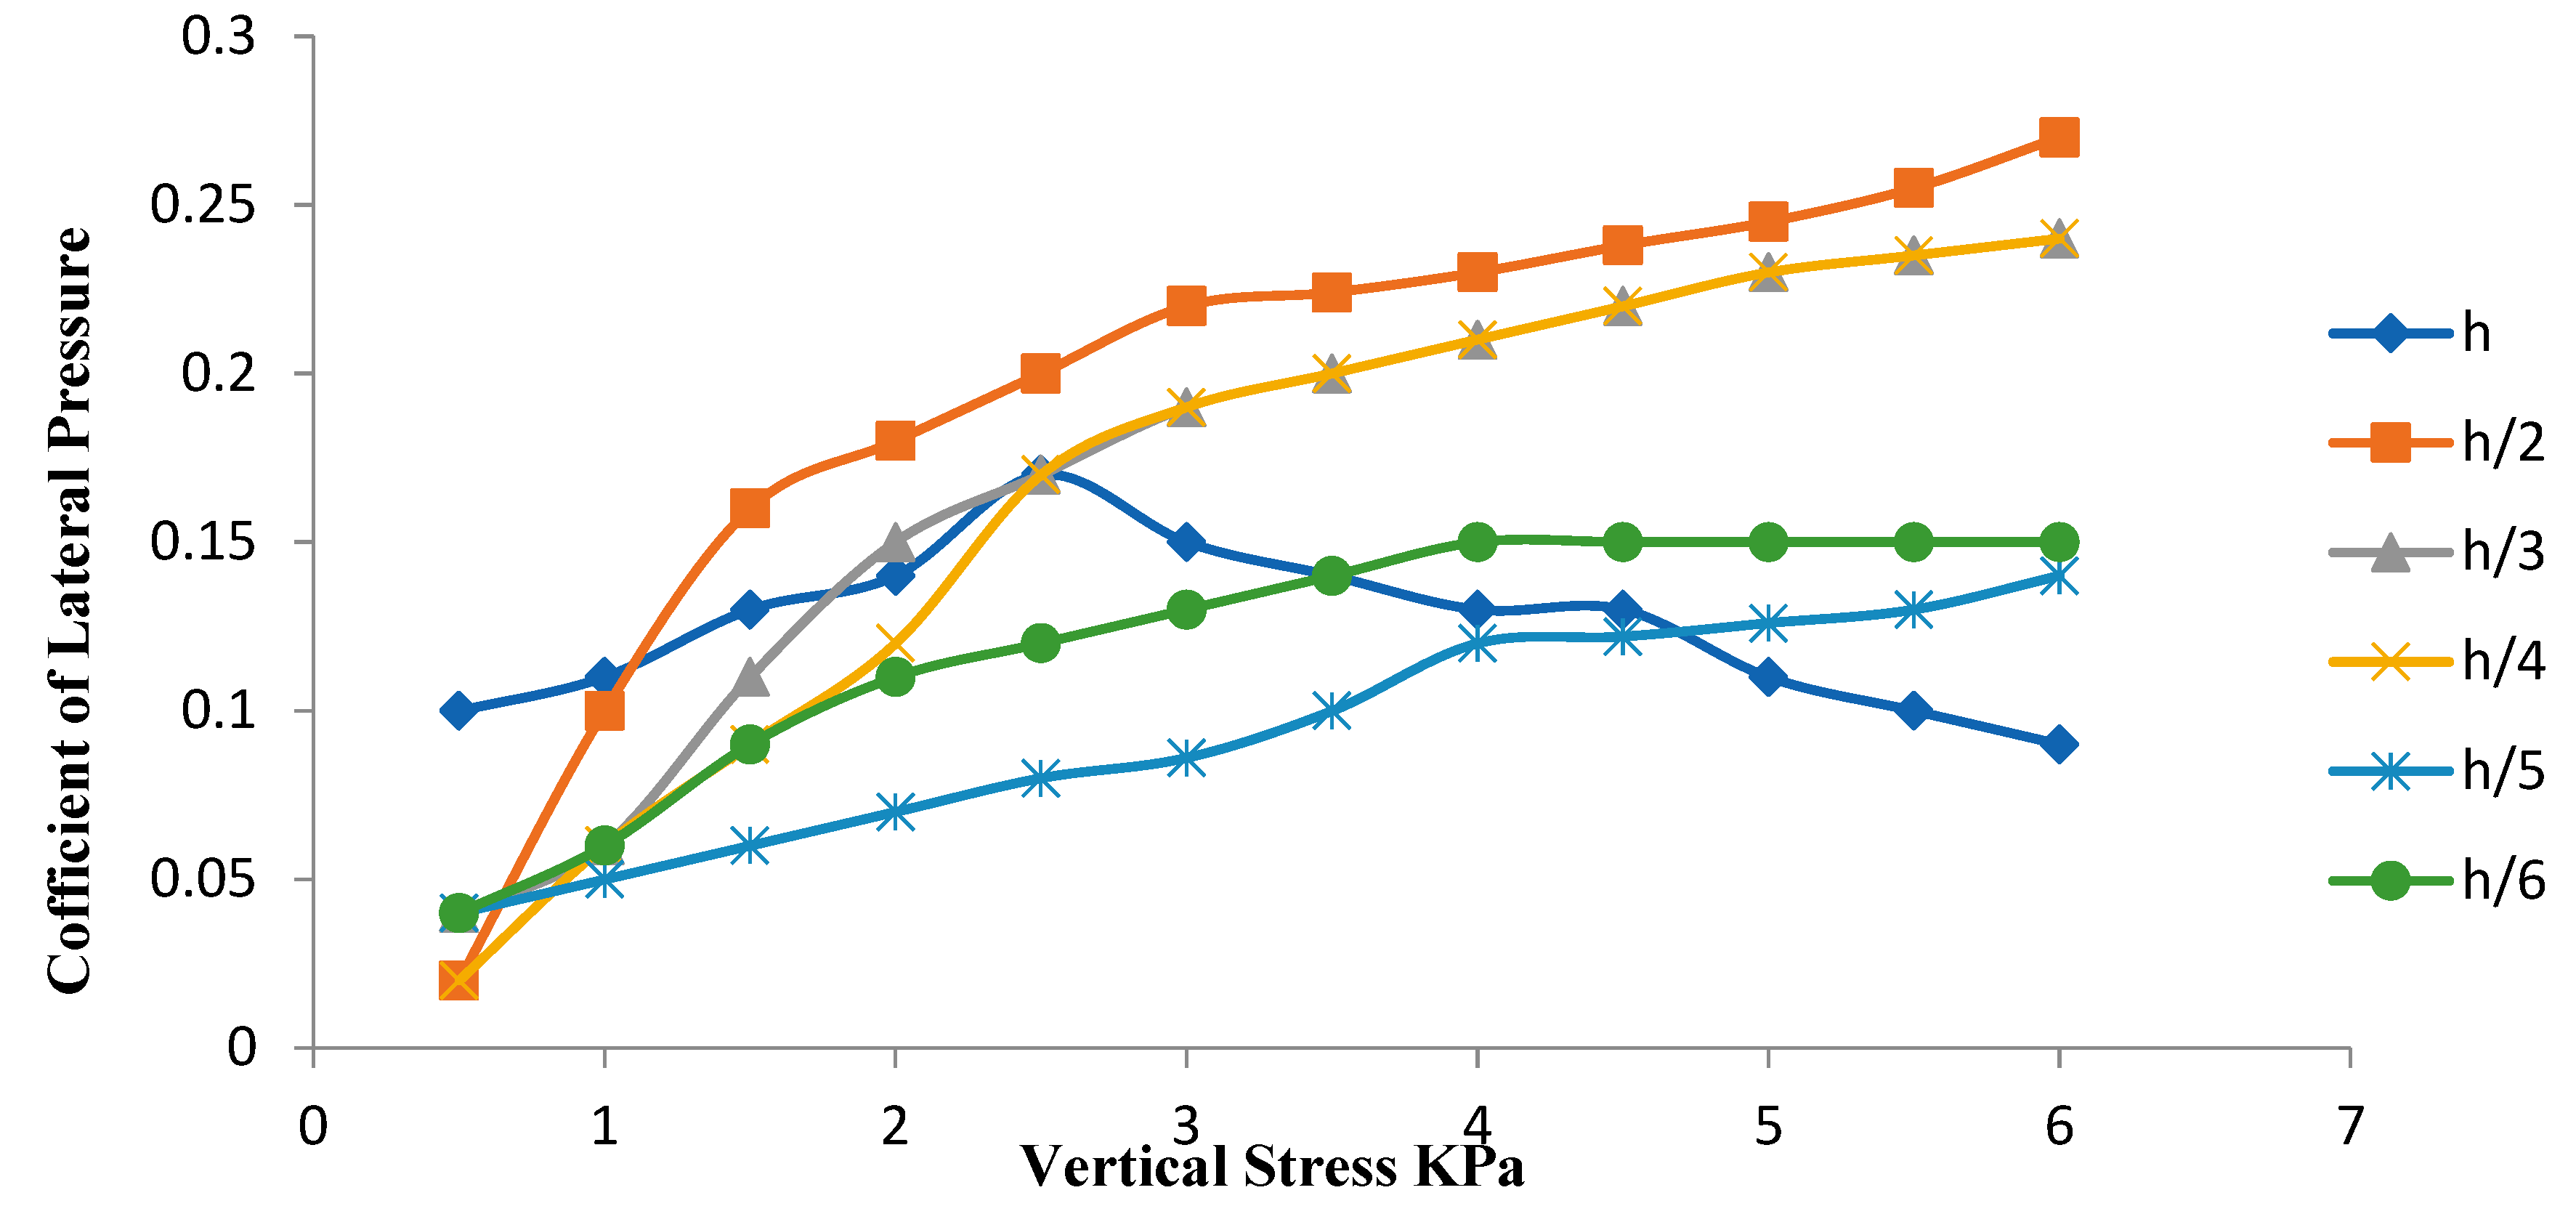
Figure 5, for h/2, h/3, h/4, h/5, and h/6, the load and coefficient of lateral pressure had a direct relationship when the load increased from 1.25 to 15.00 kg. The maximum coefficient of lateral pressure (0.27) occurred when the reinforced granite grain (2 mm) pile was divided into two parts (h/2) and the load was 15.00 kg. The maximum value when the pile was unreinforced (h) was 0.17, and the load was 6.25 kg.
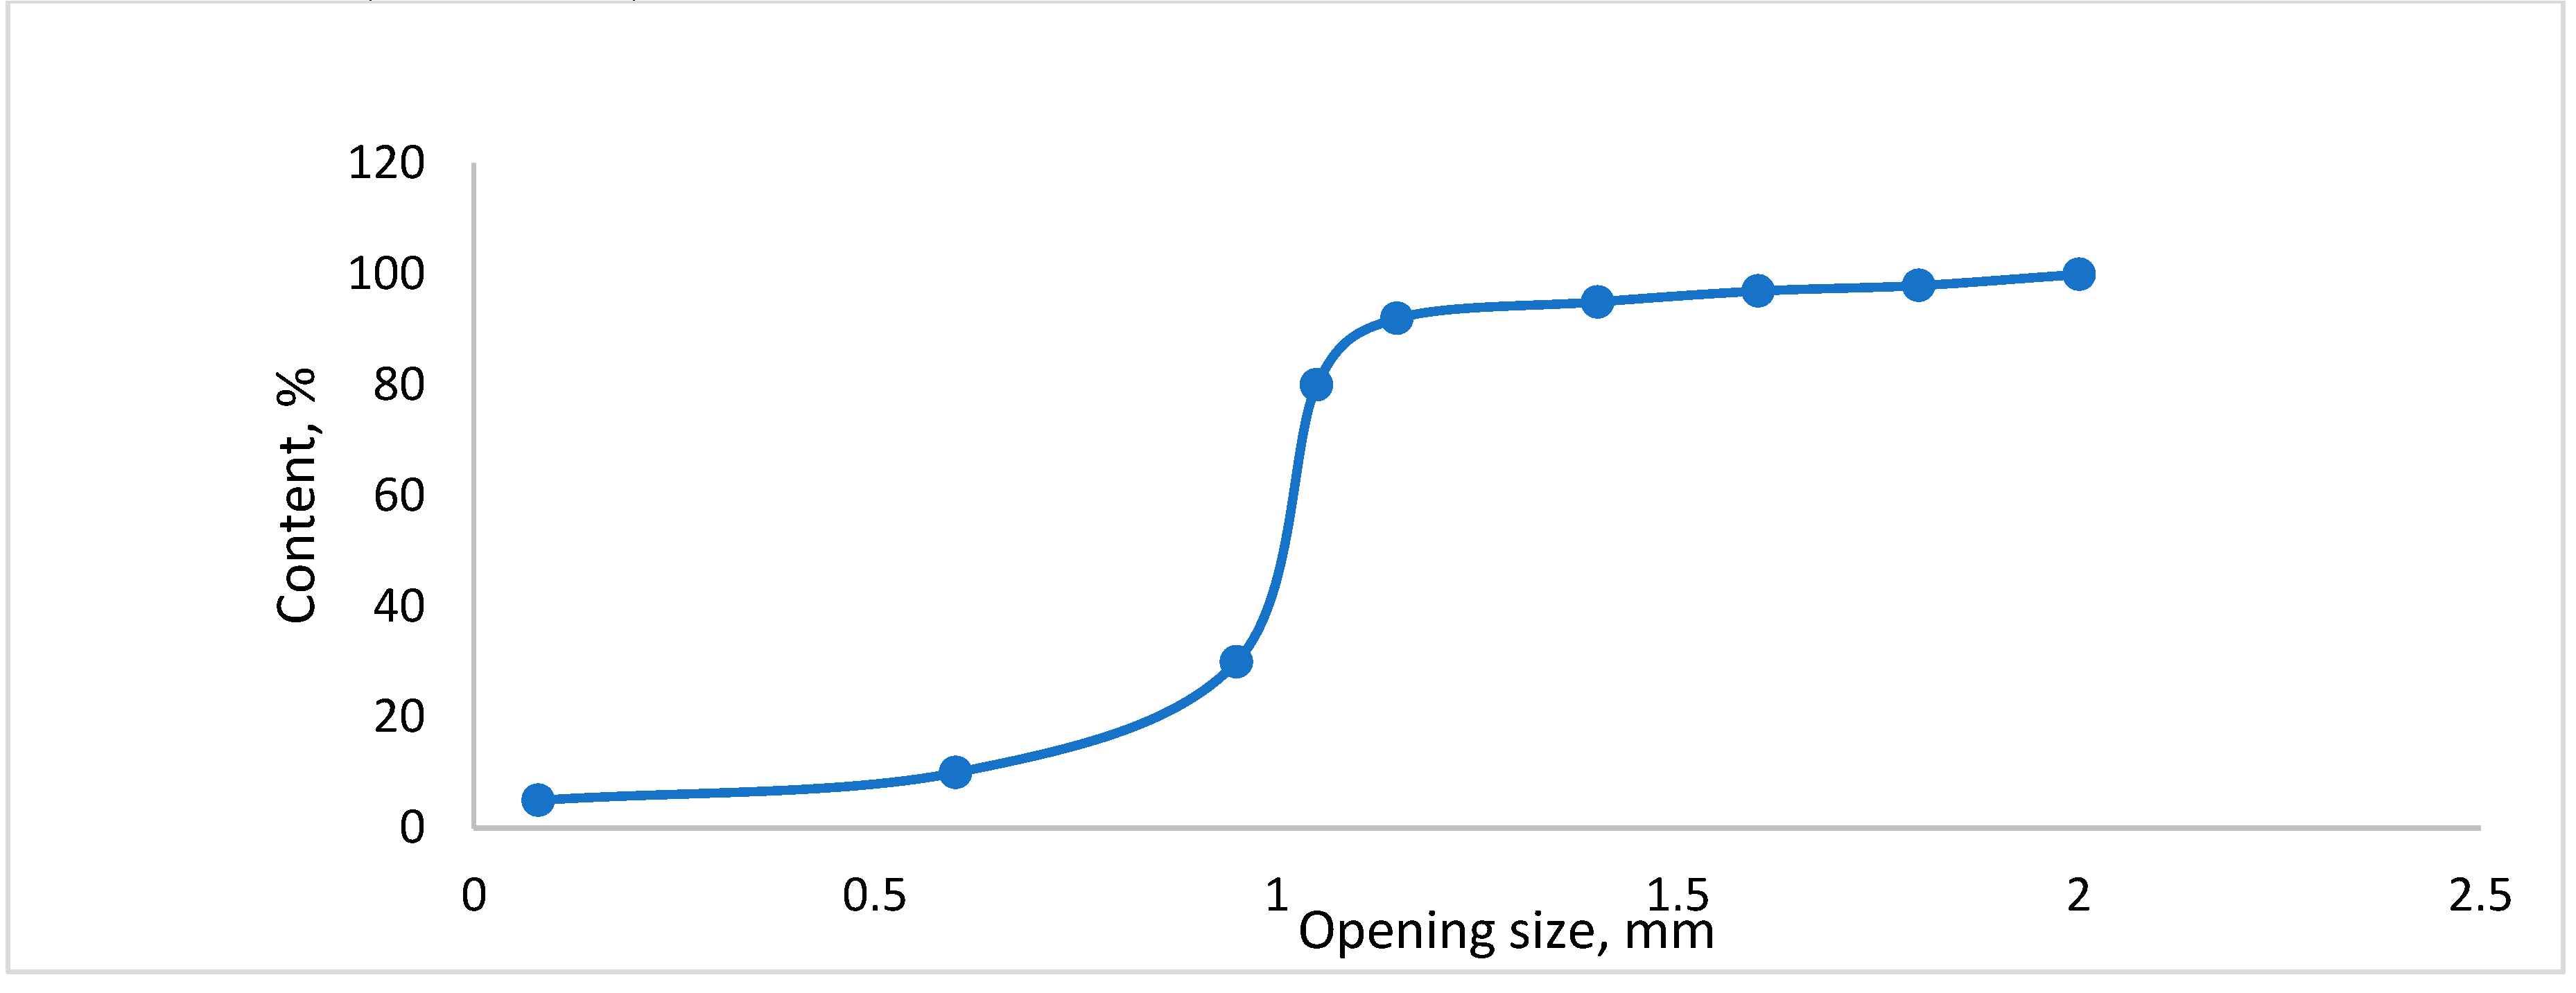
The particle size distribution curve of granular content of granite grains (2 mm) is shown in a schematic diagram in
Figure 6.
c. Third Case
Piles filled with granite grains (3 mm) were used as samples. Loads of 1.25, 2.50, 3.75, 5.00, 6.75, 7.50, 8.75, 10.00, 11.25, 12.50, 13.75, and 15.00 kg were placed on the sample, and this was repeated when the reinforcement changed. The results are presented in
Table 3.
As shown in
Table 3 and
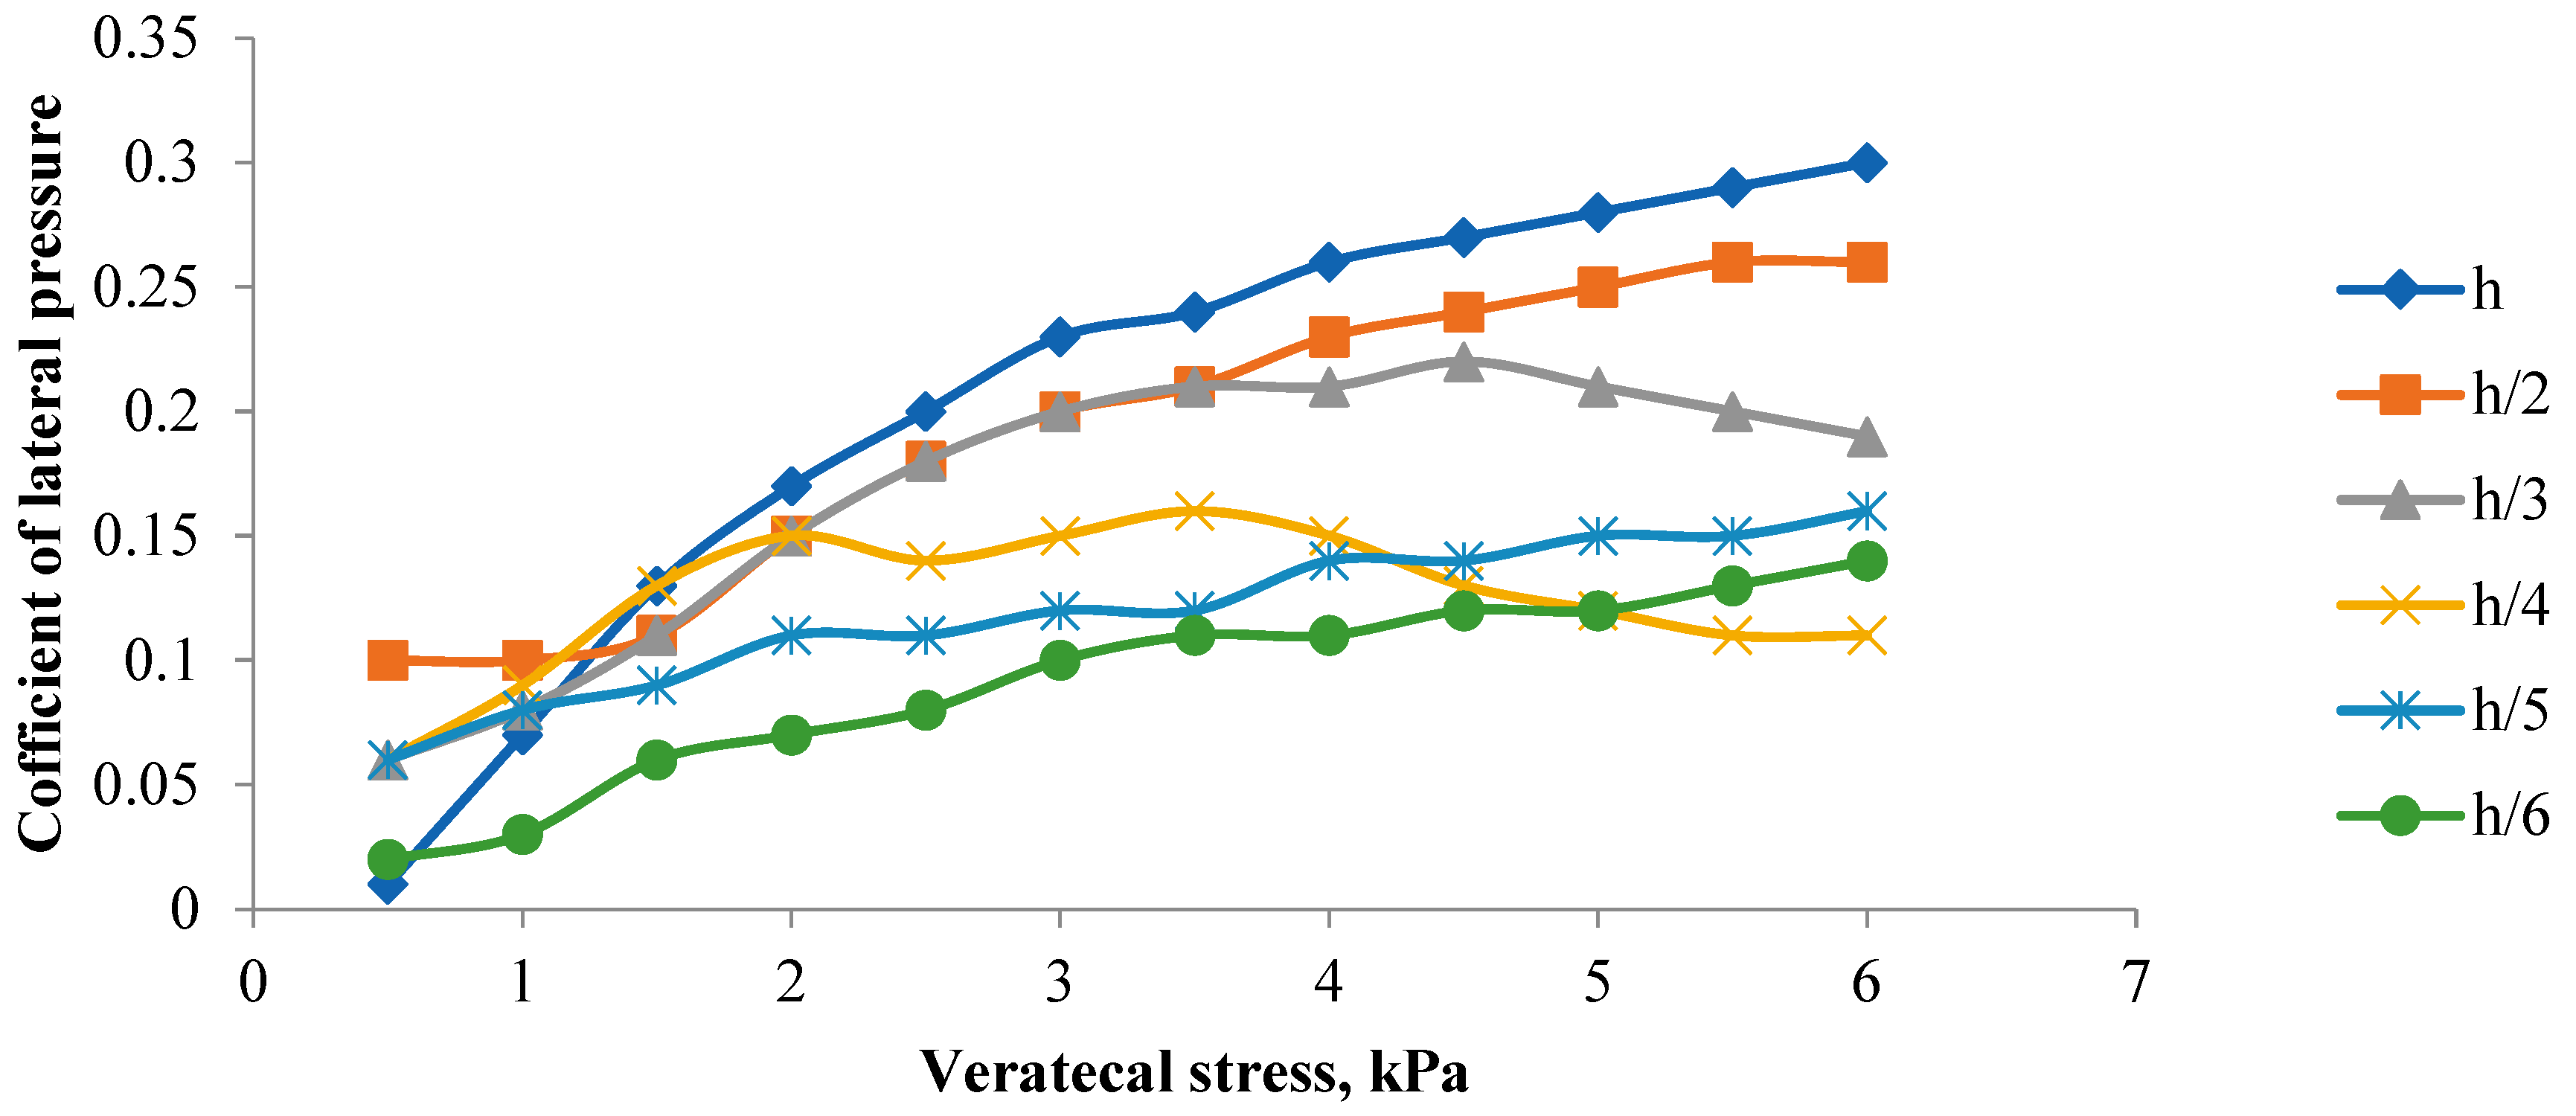
Figure 7, for h, h/2, h/5, and h/6, there was a direct relationship between the load and coefficient of lateral pressure when the load increased from 1.25 to 15.00 kg. For h/3, there was a direct relationship between the load and coefficient of lateral pressure when the load increased from 1.25 to 11.25 kg. For h/4, there was a direct relationship between the load and coefficient of lateral pressure when the load increased from 1.25 to 8.75 kg.
The maximum coefficient of lateral pressure (0.26) occurred when the reinforced grain (3 mm) pile was divided into two parts (h/2) and the load was 15.00 kg. The maximum value when the pile was unreinforced (h) was 0.30, and the load was 15.00 kg.
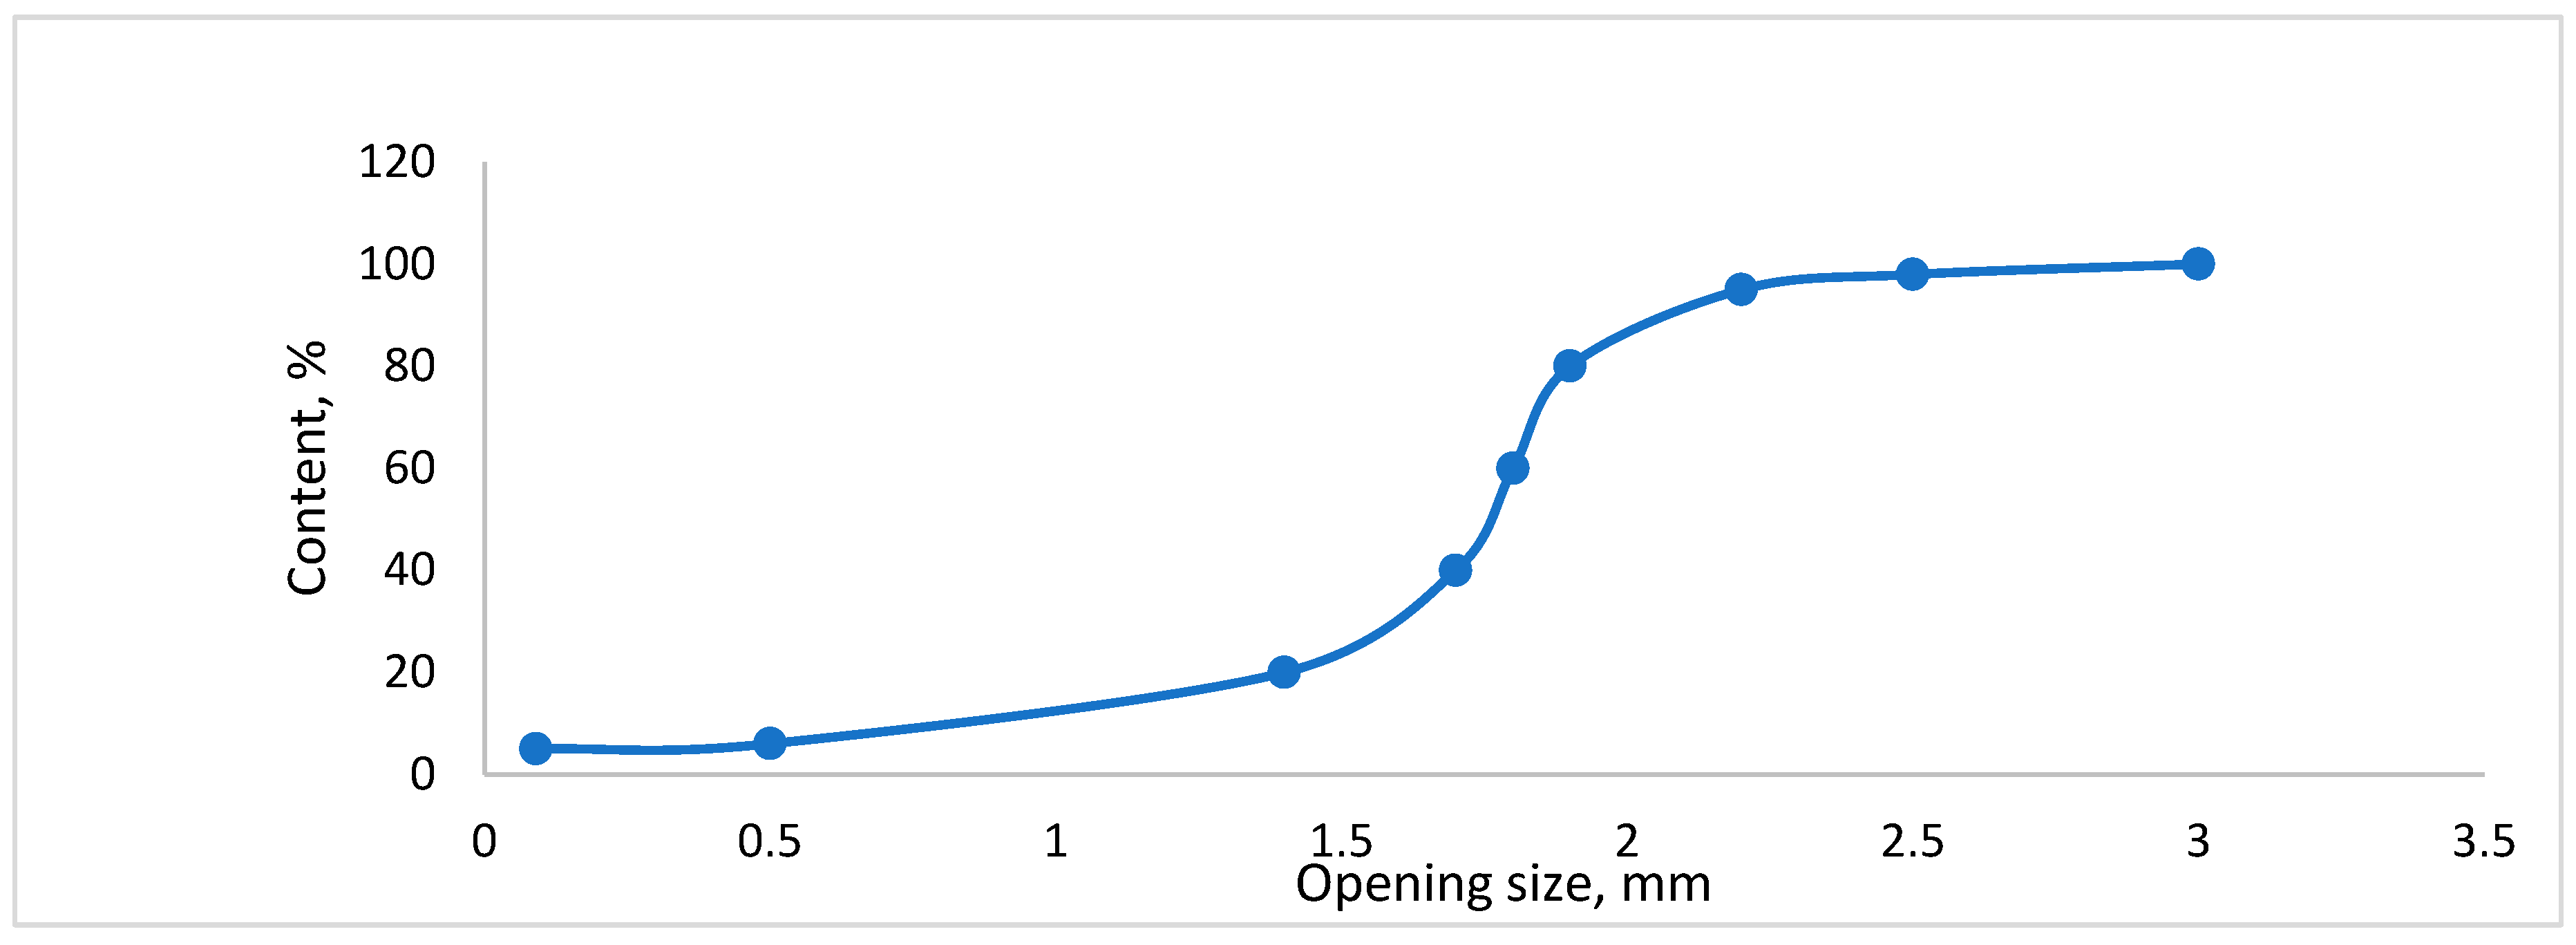
The particle size distribution curve of granular content of granite grains (3 mm) is shown in a schematic diagram in
Figure 8.
3. Results
When sand was used, a direct relationship was observed between the load and coefficient of lateral pressure, with or without reinforcement. When 2-mm granite grains were used, there was a direct relationship only in the case of reinforcement because the coefficient of lateral pressure in the case without reinforcement (h) increases directly with an increase in the load until it reaches the highest value (0.17) with a weight of 6.25 kg. Then, it begins to decrease gradually until it reaches its lowest value (0.09). However, when 3-mm granite grains are used, the relationship is only direct in the case of h/2, h/5, or h/6 reinforcement or without reinforcement (h). When sand was used, the coefficient of lateral soil pressure without reinforcement (h) was always higher than those for h/4, h/5, and h/6, whereas it was lower than those for h/2 and h/3. When 3-mm granite grains were used, the lateral soil pressure coefficient in the case without reinforcement (h) was always higher than those in all the cases with reinforcement (h/2, h/3, h/4, h/5, and h/6). The highest value of the coefficient of lateral pressure (0.38) for all the materials and reinforcement methods applied was observed when sand was used at a load of 12.5 kg and h/2 reinforcement.
4. Discussion
In general, to increase the lateral pressure coefficient, 1-mm sand can be used with or without reinforcement. When granite grains of 3 mm were used, we obtained a higher value for the coefficient of lateral pressure without reinforcement than that with reinforcement; thus, reinforcement is not required. When using 2-mm granite granules with reinforcement, regardless of the ratio, we obtained a higher value for the coefficient of lateral pressure compared with the case of using unreinforced granules. The highest value for the lateral pressure coefficient can be obtained when sand is reinforced and divided into two parts (h/2).
Funding
The authors received no financial support for the research, authorship, and/or publication of this article.
Acknowledgments
The authors are grateful for the support provided by the Amman Arab University while the study was conducted at the College of Engineering.
Conflicts of Interest
The author declares no competing interest.
References
- Ayyad, S. M. and Ahmad, O. A. (2021), ISSN 1230-2945 Issue 1, Archives of Civil Engineering, LXVII, 527–538.
- Bell, A. L. (1915) ‘The lateral pressure and resistance of clay and the supporting power of clay foundations’, Minutes of the Proceedings of the Institution of Civil Engineers, 199, 233–272. [CrossRef]
- Coulomb, C. A. (1776) ‘Essay on an application of the rules of maximis and minimis to some problems of statics relating to architecture’, Memoirs of the Royal Academy by Various Scholars, 7.
- Gautier, H. (1717) Dissertation on the thickness of bridge abutments, on the width of piers, on the span of voussoirs, on the effort and gravity of arches at different lowerings, and on masonry profiles Which Must Support Pavements.
- Mwasha, A. (2011) Practical Guide to Green Technology for Ground Engineering, Smithers Information Limited, ISBN: 9781847355317, 1847355315.
- Leroueil, S. and Rowe, R. K. (2001) ‘Embankments over soft soil and peat’, in Rowe, R. K. (ed.) Geotechnical and geoenvironmental engineering handbook. Boston: Springer.
- Medina, J., Sau, N., and Acuña, Q. (2018) ‘Lateral earth pressure coefficient and lateral earth pressure against retaining walls’. Journal of Geological Resource and Engineering 2018, 6, 251–260.
- Rankine, W. (1856) ‘On the stability of loose earth’, Philosophical Transactions of the Royal Society of London, 147.
- Senate. Committee on Indian Affairs (2007) Transportation issues in Indian country: hearing before the United States. Congress, p. 98.
- Smith, I. (2006) Elements of soil mechanics.
- Sweeney, S. (2015) 1875–1914 Financing India's imperial railways.
- Watson, J. P. (1994) Longman scientific & technical, highway construction and maintenance, Longman Scientific & Technical, ISBN :9780582234123,0582234123.
- Zhu, H., Wu, Z., Chen, M., and Zhao, Y. (2019) Controlling Differential Settlement of Highway Soft Soil Subgrade, pp.3-29, ISBN: 978-981-13-0722-5.
|
Disclaimer/Publisher’s Note: The statements, opinions and data contained in all publications are solely those of the individual author(s) and contributor(s) and not of MDPI and/or the editor(s). MDPI and/or the editor(s) disclaim responsibility for any injury to people or property resulting from any ideas, methods, instructions or products referred to in the content. |
© 2023 by the authors. Licensee MDPI, Basel, Switzerland. This article is an open access article distributed under the terms and conditions of the Creative Commons Attribution (CC BY) license (http://creativecommons.org/licenses/by/4.0/).
