
Submitted:
26 December 2023
Posted:
27 December 2023
You are already at the latest version
Abstract
In recent years, wireless power transfer (WPT) has progressed rapidly in both theory and commercialization abroad. However, existing research into WPT coil design for low-power devices is limited. This paper investigates coil structure using printed circuit board (PCB) for magnetic resonant coupling WPT to address this gap. Specifically, the impacts of key geometric parameters on the coil quality factor and coupling coefficient are analysed through models and simulations. Equivalent PCB coils were formed for mutual inductance models, and four basic compensation circuits were analysed. The impacts of changes in coil thickness, line width, turn spacing, and number of turns on the quality factor of PCB coils were analysed with a fixed outer diameter of the coil. In this paper, to mitigate the coil offset while retaining PCB manufacturing simplicity for practical uses, a dual layer PCB coil structure is proposed. The structure optimizated PCB coil could offer remarkable improvements in the WPT system for low power electronic devices.
Keywords:
wireless power transfer
; coil structure
; coupling coefficient
; strong coupling coefficient
; electromagnetic simulation
1. Introduction
The surging demand for ubiquitous electricity is catalyzing innovations in wireless power transfer (WPT) to overcome the constraints of wired charging interfaces, such as frequent plugging and unplugging of charging ports and ageing of wire connections[1]. While WPT commercialization for low-power electronic devices, such as toothbrushes, mobile phones, electric bicycles, etc, is accelerating, efficiency and universality remain limiting factors restricting its broader adoption [2,3,4,5].
WPT coils have two typical solutions, namely the spatial spiral and the planar spiral structure. Although planar geometries pose inherent efficiency challenges relative to spatial coils, it achieve better size and weight reductions through PCB integration. Figure 1 shows two types of coil structures.
The skin effect of enamelled wire is more pronounced under high-frequency conditions[6]. The skin effect refers to the uneven distribution of current inside a conductor when an alternating current or alternating electromagnetic field is present[7]. The current is concentrated in a thin layer on the surface of the conductor; the closer it is to the surface of the conductor, the higher the current density, and the smaller the actual current inside the conductor[8]. As a result, the resistance of the conductor is higher, increasing its loss power[9].
Under high-frequency conditions, the proximity effect of the Leeds line is more pronounced. The proximity effect refers to the uneven distribution of current on the cross-section of a conductor when subjected to high AC voltage.
2. Analysis of the Compensation Network and Coil Parameters
The structure of the wireless power transmission system is depicted in Figure 2. A represents a DC power supply. B is the inverter circuit. C and E are compensation networks[12]. D is a mutual inductance coil, which is a device for power transmission. F is a rectifier circuit. G is the electrical equipment.
A magnetic coupling structure is used to transmit power through alternating magnetic fields in high-frequency resonant circuits. The alternating magnetic field can be divided into near and far regions, with magnetic induction being the main source in the near region and radiation being the main source in the far region[13]. Energy is emitted outwards in the form of electromagnetic waves.
2.1. Coupling Coil Circuit Model
The mutual inductance circuit model of the coupling coil is shown in Figure 3. US is the AC power supply at the transmitting coil, and I1 and I2 are the currents of the transmitting and receiving circuits, L1 and L2 are the self-inductances of the transmitting and receiving coils, and R1 and R2 are the coil resistances of the transmitting and receiving coils, respectively. Mutual inductance M is used to represent the degree of coupling between the two coils[14].
The total impedance expression of the receiving end circuit is shown in equation (1), where ω denotes the working angular frequency[15].
Reflection impedance is the influence of the receiving end circuit on the transmitting end circuit and is expressed in equation (2).
The real and imaginary parts reflecting impedance are shown in equations (3) and (4).
Wireless power transmission is a device similar to a transformer, but unlike a transformer, the distance between the transmitting and receiving of infinite power transmission is relatively large. Increasing the magnetic leakage will increase the reactive power of the system and thus the energy loss of the system. Therefore, the transmission efficiency must be improved by adding compensation capacitors to both ends.
2.2. Compensation Circuit
The reactive power compensation of the circuit is usually constructed by increasing the compensation capacitance. Because the position of the compensation capacitor in the circuit differs, its effect also differs. According to the position of the compensation capacitor, it can categorized as series and parallel, and the receiver and transmitter can also choose whether to add to it. Therefore, the capacitor can be divided into single-sided transmitters in series and parallel transmitters[16]. The receiver is connected in series and in parallel. Bilateral compensation can be divided into series series (SS), series parallel (SP), parallel series (PS) and parallel parallel (PP). Several circuit diagrams of bilateral compensation are shown in Figure 4.
Next, we analyse the bilateral compensation circuit. When compensating capacitors are added to the receiving circuit, Zs1 and Zr1 are used to represent the total impedance of the receiving circuit and the reflected impedance of the transmitting circuit. Rr1 and Xr1 are used to represent the reflected impedance and reactance at the transmitting circuit[17]. When the compensating capacitor at the receiving is connected in series to the circuit, the total impedance and reflection impedance at the receiving transmitter can be represented by equations (5) and (6).
The reflection impedance Rr1 and reflection reactance Xr1 of the transmitting circuit are represented by equations (7) and (8), respectively.
The above two equations illustrate that when the parameters are connected as in equation (9), the reactance is reflected as zero. At this time, the receiving compensation circuit is in a resonant working state.
Similarly, using the same algorithm, when the compensating capacitors of the receiving circuit are connected in parallel, the total impedance, reflection impedance, reflection resistance, and reflection reactance of the receiving end are shown in equations (10), (11), (12), and (13), respectively:
By incorporating the equation for resonance, the reflection resistance and reflection impedance of the receiver with the compensation capacitor can be obtained. The parameters are defined in Table 1.
When compensating capacitors are connected in parallel, the reflected impedance is not zero and is related to the coil mutual inductance and self-inductance of the receiving end coil, and the reflected impedance is capacitive. In contrast, when the capacitors are connected in series, the reflected impedance is resistive. Therefore, to compensate for the reactive power, capacitors should be connected in series at the receiving end for compensation.
This same method can be used to calculate the parameter values when the transmitter is connected in series. The input impedance at this point is expressed by equation (14). Additionally, the data in Table 1 illustrates that when the receiving end is a compensation capacitor connected in series, the input impedance is expressed by equation (15).
Equation (15) illustrates that the input impedance always has an imaginary part; therefore, reactive power is always present. When equation (16) is satisfied, the transmitting end is in a resonant state; it should simultaneously meet the resonance formula of the receiving end. This is used to ensure that the entire circuit of the system is in a resonant state[16].
The size of the series compensation capacitor at the starting emitter can be calculated as:
The capacitance values are calculated under the other three conditions while ensuring that the circuit operates in a resonant state. The compensation capacitance values for different compensation methods are shown in Table 2.
Table 2 reveals the following:
The compensation capacitance values of the PS and PP compensation methods are related to the load resistance value. To ensure that the circuit operates in a resonant state, these two compensation methods are not suitable for this study. When the compensation method is SP, the compensation capacitance value is related to the mutual inductance of the coil. When the position of the coil changes, the mutual inductance also changes accordingly, causing the resonance state to change. When the compensation method is SS, the compensation capacitance value is only related to the coil self-inductance and frequency, making this value easy to fix. Therefore, in this article, the SS compensation method is adopted to optimize the coil parameters. The coupling coil mutual inductance circuit model of the SS compensation method is shown in Figure 5.
The total impedance of the receiving end circuit and the total impedance of the transmitting end circuit are calculated using the equation for resonance mentioned above. Equations (18) and (19) are given as follows.
The current I1 at the transmitting end is shown in equation (20).
The current I2 of the receiving end circuit is calculated according to equation (1), as shown in equation (21).
By calculating the current, the power Pout and energy transmission efficiency η of the receiving circuit can be obtained, as shown in equations (22) and (23), respectively.
The transmission efficiency of the coil is related to the system's operating frequency, load resistance, coil mutual inductance, and coil resistance. To further improve the efficiency of the method, this study is primarily focused on changing the coil structure parameters.
3. Optimization of PCB Coil Structure Parameters
Coupling coils are primarily planar spiral coils and spatial spiral coils. Space spiral coils, often used for equipment with a cylindrical shape, are installed on vertical structures in the equipment and occupy large spaces. Flat spiral coils, used in most electronic and electrical equipment, are installed on flat structures in equipment and occupy small spaces. Planer spiral coils are more suitable for the PCB coil structure studied in this article[17].
The flat coil is primarily circular or rectangular in shape, as shown in Figure 6.
To compare the advantages and disadvantages of circular planar coils and rectangular planar coils, 3D simulation models of multiturn circular planar coils and rectangular planar coils are established in the finite element simulation software Maxwell. To avoid errors during comparison, the area size, wire diameter, number of turns, and turn spacing of the two coils are set to be consistent when the coil model is established. The simulated magnetic field cloud map obtained through simulation analysis is shown in Figure 7.
The parameters of the circular and rectangular planar coils and the simulation results of the coil shapes are shown in Table 3.
The inductance value of the circular coil is slightly higher than that of the rectangular coil. The resistance of the circular coil is smaller than that of a rectangular coil, the magnetic field distribution is more uniform, and the convergence is better. Therefore, planar circular coils are ideal for most infinite power transmissions.
The cross-section of the circular coil designed through PCB is shown in Figure 8. N is the number of coil turns, Dout is the outer diameter of the coil, Din is the inner diameter of the coil, P is the coil turn spacing, w is the coil wire width, h is the thickness of the copper wire laid on the PCB, and h1 is the thickness of the PCB.
The formula for calculating the depth of skin effect of wires made of copper material at different temperatures[18] is presented in equation (24).
The wire diameter length of the PCB coil is:
The average wire diameter of the coil is:
The defined coil filling coefficient is:
The DC resistance of the coil is expressed as:
The AC resistance of the coil under high-frequency conditions is expressed as:
Incorporating the DC resistance expression into (29) yields:
where σ is the conductivity of the coil wire, and d is the depth of the wire skin effect.
The resistance of a coil when high-frequency AC power is incorporated is related to the wire diameter length, coil thickness, and skin effect depth of the coil. Therefore, simulation research must be conducted on the structural parameters of the coil, and the impacts of changes in coil structural parameters on the coil resistance must be examined.
The inductance of a PCB planar circular coil is expressed as:
Before the coil parameters are examined, the quality factor Q and coupling coefficient k are introduced:
Substituting (32) and (33) into (23) yields:
Simplifying (34) yields equation (35).
The first partial derivative of RL in equation (35) is zero , and the second order partial derivative is less than zero . The following can be concluded:
Q1Q2k2 is defined as the strong coupling coefficient[19] of the coil. Equation (36) reveals that the larger the strong coupling coefficient is, the higher the transmission efficiency of the coil. Previous analysis has shown that the design of the coil must consider the degree of coupling between the coils in addition to its quality factor. The quality factor and the coupling coefficient of the coil correlates with the strong coupling coefficient. Therefore, maximizing the strong coupling coefficient has become a research goal.
The structural parameters of the receiving and transmitting ends of the PCB coil studied in this article are the same, and Q1 and Q2 are also the same. The efficiency of the coil can be simplified as:
A simulation model is formed with two coils placed in parallel and coaxially with a distance H of 4.5 cm, as shown in Figure 9.
3.1. Coil turn spacing
The outer diameter of the fixed coil is set as 9 cm, the coil thickness is set to 0.07 mm, the coil line width is set as 2 mm, the coil turns are set as 7 turns, and the frequency is set as 100 kHz. The coil turn spacing changes from 0.5 mm to 4 mm in steps of 0.5 mm, and a simulation with a coil turn spacing of 0.2 mm is conducted. The simulation results are shown in Figure 10.
Figure 10 (a) illustrates that as the pitch between the coils increases, the quality factor of the coils decreases, and the coupling coefficient between coils first increases and then decreases, exhibiting a maximum coupling coefficient. Figure 10 (b) shows the simulation data curve of the strong coupling coefficient of the coil. The strong coupling coefficient curve shows a decreasing trend. Considering the requirements of the PCB manufacturing process, the coil turn spacing is set as 0.2 mm in this article.
3.2. Coil line width
The outer diameter of the fixed coil is set as 9 cm, the coil thickness is set as 0.07 mm, the coil turn spacing is set as 0.2 mm, the coil turns are set as 7 turns, the frequency is set as 100 kHz, and the coil line width changes from 0.5 mm to 4.5 mm in steps of 0.5 mm. The simulation results are shown in Figure 11.
Figure 11 (a) illustrates that as the coil width increases, the quality factor of the coil first increases and then decreases. The maximum value occurs when the coil width is 2.5 mm, and the coupling coefficient between coils first increases and then decreases. Figure 11 (b) shows the simulation data curve of the strong coupling coefficient of the coil. The strong coupling coefficient first increases and then decreases. In this figure, the maximum value occurs the coil width is 2.5 mm. Because the simulated curve in Figure 11 is based on the order of magnitude of the coil line width changing in steps of 0.5 mm, to clarify whether the strong coupling coefficient of the coil is maximized at a line width of 2.5 mm or at a certain line width near 2.5 mm, the simulation values for the line width from 2.4 mm to 2.9 mm in steps of 0.1 mm are shown in Table 4.
3.3. Coil turns
The outer diameter of the fixed coil is set as 9 cm, the coil thickness is set to 0.07 mm, the coil turn spacing is set as 0.2 mm, the coil line width is set as 2.8 mm, and the frequency is set as 100 kHz. The number of coil turns changes from 5 to 14 in steps of 1. The corresponding relationship between the coil filling coefficient and the number of turns and the inner diameter of the coil is shown in Table 5.
The simulation data obtained by simulating different turns of the coil are shown in Figure 12.
Figure 12 (b) depicts a simulation data curve of the strong coupling coefficient of the coil. The strong coupling coefficient first increases and then decreases. The filling coefficient of the coil is 0.36, which means that the strong coupling coefficient reaches its maximum when the number of coil turns is equal to 8. Therefore, the number of coil turns is set as 8 in this paper.
Previous research has shown that regardless of the outer diameter of the coil, after setting the coil line width and turn spacing, the inner diameter of the coil and the optimal number of turns of the coil can be determined using the formula for the coil filling coefficient and the optimal value of the coil filling coefficient[20].
4. Research on the Offset Characteristics of Pcb Coils
The deviation of the coil significantly impacts the coupling coefficient between coils, which in turn affects the strong coupling coefficient of the coil. After the coil is offset, the magnetic field weakens, decreasing the coupling degree between the transmitting end coil and the receiving end coil and decreasing the coupling coefficient between the coils. To reduce the adverse effects of coil offset, a double-layer PCB coil, which lays coils on both the top and bottom layers of the PCB board, is designed in this paper[21].
Figure 13 depicts a top view of the top and bottom layers of a double-layer PCB coil. Two design methods for the bottom layers of the coil are proposed. The current directions of the top and bottom layers of the coil are the same. A, B, C, D, E, and F in the figure represent the interface between the coil and the external connection. Figure 13 (a) is the top view of the coil, Figure 13 (b) is the top view of the coil bottom in Scheme 1, and Figure 13 (c) is the top view of the coil bottom in Scheme 2. The bottom layer of the coil adopts Scheme 1, where interface C of the bottom layer coil is connected to interface A of the top layer, and interfaces B and D are connected to external circuits. When the bottom layer of the coil adopts Scheme 2, interface E of the bottom layer coil is connected to interface A of the top layer, and interfaces B and F are connected to external circuits.
To simulate the offset phenomenon in real scenarios, four simulation studies were conducted: coaxial parallel offset, coaxial nonparallel offset, different axis parallel offset, and different axis nonparallel offset. We next explore whether the transmission efficiency of this structure is better than that of single-layer PCB coils.
4.1. Coaxial parallel offset
First, the coaxial parallel offset of the coil is studied. Figure 14 is a schematic diagram of the coaxial parallel offset of the coil. The centre of the transmitting coil is fixed at the coordinate origin, and the transmitting and receiving coils in the figure remain coaxial and fixed.
When coaxial parallel offset simulation analysis is conducted on the coil, the outer diameter of the coil is fixed at 9 cm, the coil thickness is set as 0.07 mm, the coil turn spacing is set as 0.2 mm, the coil line width is set as 2.8 mm, the number of coil turns is set as 8, the operating frequency is set as 100 kHz, and the offset distance of the coil changes from 1 cm to 7 cm. Figure 15 depicts a partial model diagram of the simulation of the coaxial parallel offset of the coil.
Table 6 provides the simulation values of the quality factor, self-inductance, and resistance of the single-layer coil, Scheme 1, and Scheme 2 coils. The simulation data of the single-layer coil, Scheme 1, and Scheme 2 double-layer coils are depicted in Figure 16.
Table 6 shows that the quality factor of the double layer coil in Scheme 1 is higher than that of the other two types of coils, and the coil resistance is the smallest among the three types of coils. The self-inductance value of the double-layer coil in Scheme 2 is significantly higher than that of the other two types of coils, and the coil quality factor is higher than that of the single-layer coil; however, its resistance is significantly higher.
Figure 16 (c) depicts a simulation data graph of the transmission efficiency of three types of coils. As the offset distance increases, the transmission efficiency of the coil decreases. For Scheme 2, the transmission efficiency of the double-layer coil is higher than that of the other two types of coils. At the offset distance of the coil radius, the transmission efficiency is 48%, which is approximately 8% higher than that of the single-layer coil at the same distance.
4.2. Coaxial nonparallel offset
Figure 17 depicts a schematic diagram of the coaxial nonparallel offset of the coil. The centre of the transmitting end coil is fixed at the coordinate origin, and the transmitting end and receiving end coils in the figure remain coaxial and fixed. The receiving end coil undergoes an angular offset in the z-axis direction.
When simulation analysis is conducted on the coaxial nonparallel offset of the coil, the basic simulation parameters of the coil are consistent with those of the coaxial parallel offset, with a working frequency of 100 kHz. The offset angle of the coil changes from 0 degrees to 80 degrees, and the offset distance changes from 4.5 cm to 7 cm. During the simulation, the coil is assumed to be offset in the positive direction of the z-axis. Figure 18 depicts a partial model diagram of the coil coaxial nonparallel offset simulation. The simulation data of the single-layer coil, and the Scheme 1 and Scheme 2 double-layer coils are shown in Figure 19.
The coupling coefficients of the single-layer coil and the double-layer coil in Scheme 1 are basically identical. At the same offset angle, the coupling coefficients and strong coupling coefficients of the double-layer coil in Scheme 2 are greater than those of the other two coils, and the strong coupling coefficient of the single-layer coil is the smallest. The transmission efficiency of the double-layer coil in Scheme 2 is higher than that of the other two coil structures.
Figure 19 (d) shows the data comparison curve of the strong coupling coefficient under different offset angles when the coil offset distance is 5.5 cm. Scheme 2 has the largest strong coupling coefficient, while Scheme 1 has a slightly smaller strong coupling coefficient than Scheme 2. The single-layer coil has the smallest strong coupling coefficient. These results indicate that Scheme 2 has a stronger anti-offset ability than the other two coils.
4.3. Parallel offset of different axes
Figure 20 depicts a schematic diagram of the parallel offset of different axes of the coil. The centre of the transmitting end coil is fixed at the coordinate origin. The transmitting end and receiving end coils in the figure have different axes, and the receiving end coil experiences parallel offset in the horizontal direction. The centre of the coil is assumed to remain on the y-axis when the receiving end coil is offset.
When simulation analysis is conducted on the parallel offset of different axes of the coil, the basic simulation parameters of the coil are consistent with those of the coaxial parallel offset. The operating frequency is set as 100 kHz, and the vertical distance between the two coils is fixed at 4.5 mm. During simulation, the lower coil is assumed to be offset in the positive y-axis direction and the offset distance of the coil is assumed to change from 0 to 5 cm. Figure 21 depicts a partial model diagram of the simulation of the coaxial nonparallel offset of the coil. The simulation data of the single-layer coil and Scheme 1 and Scheme 2 double-layer coils are shown in Figure 22.
Figure 22 (c) depicts a simulation data graph of the transmission efficiency of three types of coils. As the offset distance increases, the transmission efficiency of the coils decreases. The transmission efficiency of the double-layer coils in Scheme 2 is higher than that of the other two coils at the same offset distance.
4.4. Different axes are not parallel offset
Figure 23 depicts a schematic diagram of the nonparallel offset of different axes of the coil. The centre of the transmitting end coil is fixed at the coordinate origin. The transmitting end and receiving end coils in the figure have different axes, and the receiving end coil is offset in the y-axis direction with an angle. The centre of the coil is assumed to remain on the y-axis when the receiving end coil is offset.
When simulation analysis is conducted on the nonparallel offset of different axes of the coil, the basic simulation parameters of the coil are consistent with those of the coaxial parallel offset, with a working frequency of 100 kHz, a fixed vertical distance of 4.5 mm between the two coils, a variation in the offset angle of the coil from 0 degrees to 80 degrees, and a variation in the horizontal offset distance from 0 to 4 cm. During the simulation, the coil is assumed to be offset in the positive direction of the y-axis. Figure 24 depicts a partial model diagram of the simulation of different axis nonparallel offsets of the coil. The simulation data of the single-layer coil and Scheme 1 and Scheme 2 double-layer coils are shown in Figure 25.
Figure 25 (a) is a simulation data graph of three types of coil coupling coefficients, Figure 25 (b) is a simulation data graph of three types of coil strong coupling coefficients, and Figure 25 (c) is a simulation data graph of three types of coil transmission efficiency. Figures (a), (b), and (c) illustrate that when the deviation angle is approximately 0 to 30 degrees, the coupling coefficient, strong coupling coefficient, and coil transmission efficiency remain basically unchanged, and a slight increasing trend is exhibited. After the angle deviation is beyond 30 degrees, excessive angle deviation occurs, and the magnetic field relationship between coils weakens, the coupling coefficient, strong coupling coefficient, and coil transmission efficiency begin decreasing, and the decreasing trend accelerates[22]. The coupling coefficients of the single-layer coil and the double-layer coil in Scheme 1 are basically the same. At the same offset angle, the coupling coefficient and strong coupling coefficient of the double-layer coil in Scheme 2 are greater than those of the other two coils, and the strong coupling coefficient of the single-layer coil is the smallest. The transmission efficiency of the double-layer coil in Scheme 2 is higher than that of the other two coil structures. As the offset distance increases, the coupling coefficient, strong coupling coefficient, and transmission efficiency of the coil gradually decrease[23,24,25].
Figure 25 (d) shows the data comparison curve of the strong coupling coefficient under different offset angles when the coil offset distance is 1 cm. Scheme 2 has the largest strong coupling coefficient, while Scheme 1 has a slightly smaller strong coupling coefficient than Scheme 2. The single-layer coil has the smallest strong coupling coefficient, indicating that Scheme 2's double-layer coil has a stronger anti-offset ability than the other two coil structures.
These results indicate that the anti-offset characteristics of the coil structure in Scheme 2 are better than those of the Scheme 1 and single-layer coils, and the wireless power transmission efficiency is better than that of single-layer PCB coils.
5. Experimental Verification
In this chapter, experimental verification is conducted on Maxwell simulation analysis of PCB coils. Based on the analysis in the previous chapter, a physical PCB coil is constructed, and the quality factor of the PCB coil and the coupling coefficient at different spatial positions of the coil are evaluated[26,27,28]. A comparison and analysis are conducted using simulation data, and a wireless power transmission system experimental platform is built.
5.1. Coil Experimental Model
Based on the theory discussed in the previous chapters, 11 types of PCB coils were manufactured to verify the research results.
Figure 27.
Physical figure of a double-layer coil. (a) Coil 10. (b) Coil 11.
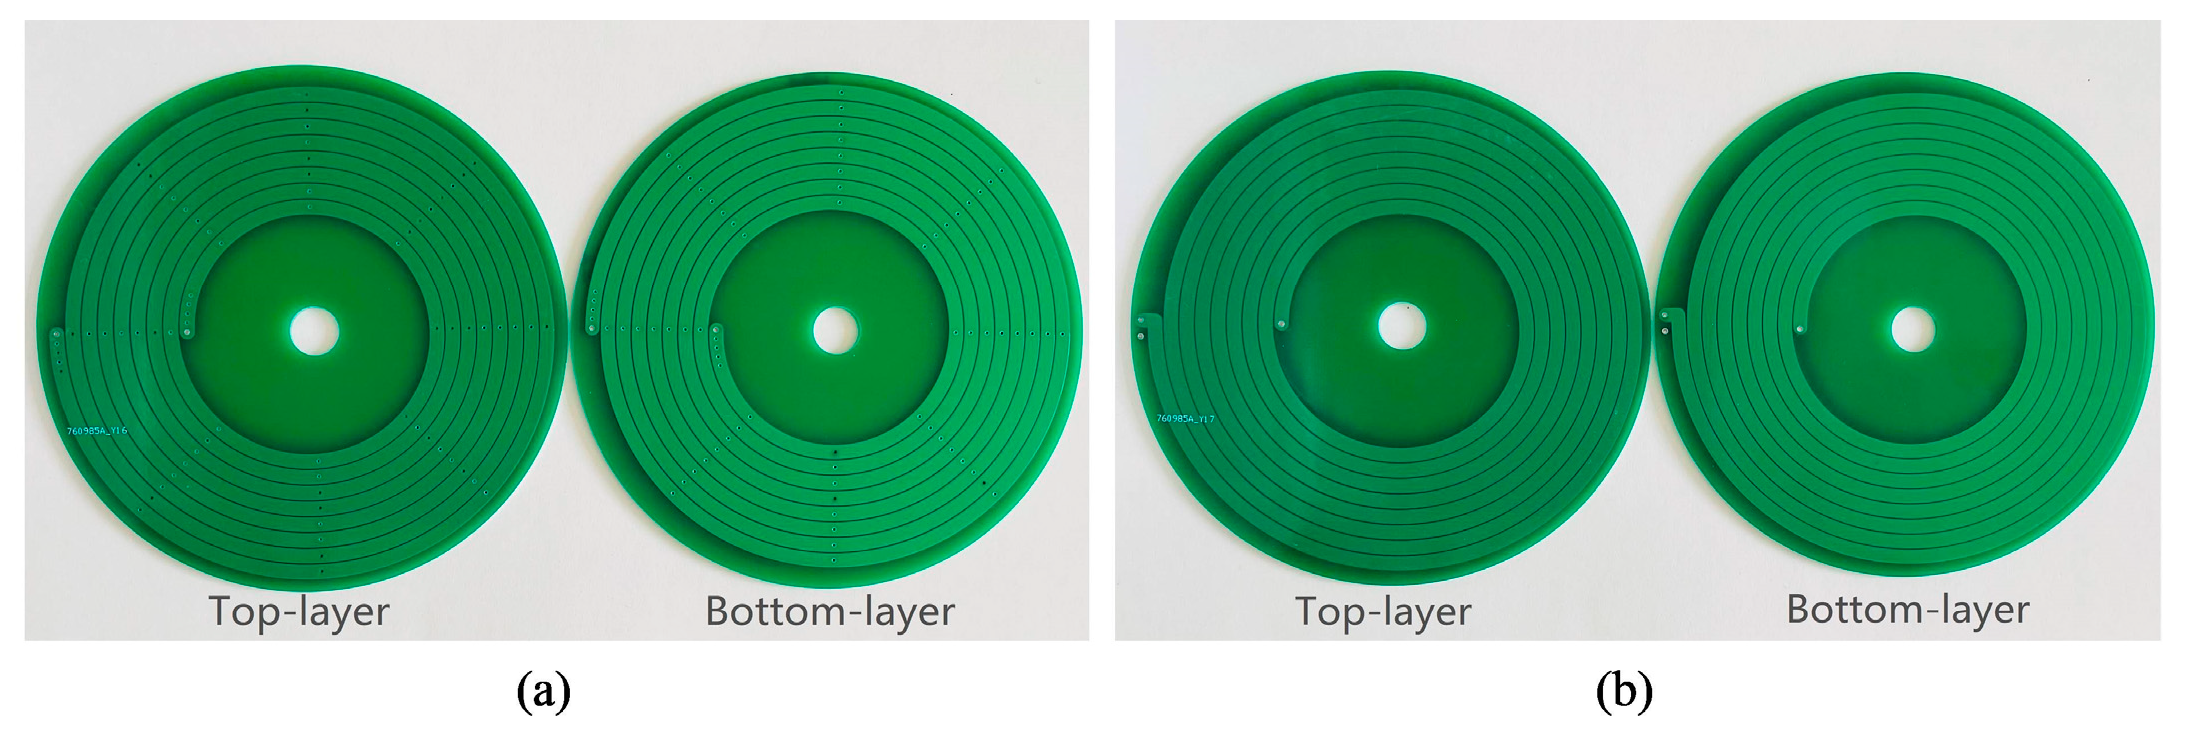
The structural parameters of 11 sets of coils are shown in Table 7. All coils have an outer diameter of 9 cm. Coil 1 and coil 3 are the experimental groups for studying coil thickness; coil 2, coil 3, and coil 4 are the experimental groups for studying coil turn spacing; coil 5, coil 6, and coil 7 are the experimental groups for studying coil line width; coil 6, coil 8, and coil 9 are the experimental groups for studying coil turns; and coil 8, coil 10, and coil 11 are the experimental groups for studying coil offset.
5.2. Measurement of Coil Parameters
A digital bridge can be used to measure the parameters of the PCB coil[29]. The experimental platform is shown in Figure 28.
Parameters such as coil self-inductance are measured as shown in Figure 28 (a). Mutual inductance is measured as shown in Figure 28 (b).
The mutual inductance can be calculated using the forward and reverse measurement results at the same position. Meanwhile, the obtained coupling coefficient can be calculated[30] using equations (38) and (39).
In these equations, L represents the self-inductance value of the coil, L’represents the measured inductance of two coils in forward series, and L’’ represents the measured inductance of two coils in reverse series.
The strong coupling coefficient calculated based on the theoretical formula is compared with the simulation value when the coil spacing is 4.5 cm.
The data in Table 8 illustrates that the changes in coil parameters are consistent with the theoretical analysis, which validates the research on the impacts of PCB coil parameters on wireless power transmission efficiency in this paper.
The proposed double-layer coil structure is validated to address the impact of coil offset on transmission efficiency. Table 9 provides the simulation and experimental coil parameters for the single-layer coils and Scheme 1 and Scheme 2 double-layer coils.
To verify the effectiveness of the double layer coil in resisting offset, the parameters are measured on the transmitting end coil and the receiving end coil at different spatial positions using a digital bridge. The simulation data and measurement calculation data of the strong coupling coefficient of the coil are compared, as shown in Figure 29.
Figure 29 shows that the changes in the measured and calculated values are basically the same as those in the simulation data. The strong coupling coefficient of Scheme 2 is the largest, while the strong coupling coefficient of the single-layer coil is the smallest. This confirms the previously-drawn conclusion and shows that the Scheme 2 coil exhibits a strong anti-offset ability.
Figure 30 shows the experimental platform.
The parameters of the experimental system are presented in Table 10.
Then, an oscilloscope is used to measure the experimental data, as shown in Figure 31.
Figure 31 (a) shows the waveform output by the inverter. The red waveform represents the voltage at the transmitting end, and the blue waveform represents the current at the transmitting end. Figure 31 (b) shows the load waveform of the receiver coil, with red indicating the voltage waveform of the receiver and blue indicating the current waveform of the receiver. The output power is calculated to be 14.4 W, and the coil transmission efficiency is calculated to be 74.6%. The voltage and current are in phase, and the system has reached a resonant operating state.
The vertical distance is changed in space, and the curve between the offset distance and transmission efficiency is drawn, as shown in Figure 32.
The research results of the coil in this article have been verified.
6. Conclusions
Wireless power transmission technology exhibits flexibility, safety and reliability and is widely used in many fields. In this paper, the parameter optimization of a small wireless power transmission system based on a PCB is studied. By analysing the characteristics of several compensation circuits, the most suitable compensation circuit model for PCBs is selected. To improve the transmission efficiency, a strong coupling coefficient is adopted. The strong coupling coefficient is taken as the objective optimization function. Simultaneously, how to increase the transmission efficiency when the coil is offset is examined. The designed double-layer PCB structure improves the anti-offset characteristics of the coil. Finally, a total of 11 groups of PCB coils were fabricated to study the coil structure parameters and coil offset. The parameters were measured by a digital bridge, and the calculation results were compared with the theoretical results. These experimental results indicate that the PCB coil is optimized.
Author Contributions
Conceptualization, Y.F. and Y.Z.; methodology, Y.F.; software, D.J.; validation, Y.F., Y.Z. and D.J.; formal analysis, Y.Z.; investigation, B.J.; resources, Y.F.; data curation, D.J.; writing—original draft preparation, D.J.; writing—review and editing, B.J.; visualization, D.J.; supervision, Z.P.; project administration, Y.F.; funding acquisition, Y.F. All authors have read and agreed to the published version of the manuscript.
Funding
This research was funded by the Fundamental Research Funds for the Central Universities, grant number 3132023112 and the Spring Sunshine Plan Research Project of Ministry of Education of China, grant number HZKY20220410.
Data Availability Statement
Not applicable.
Conflicts of Interest
The authors declare no conflicts of interest.
References
- Ojukwu, H.; Seet, B.C. Metasurface-Aided Wireless Power Transfer and Energy Harvesting for Future Wireless Networks. IEEE Access, 2022, 10, 52431–53450. [Google Scholar] [CrossRef]
- Zhang, Y.; Chen, S.; Li, X.; et al. Design of high-power static wireless power transfer via magnetic induction: An overview. CPSS Trans. Power Electron. APPl., 2021, 6, 281–297. [Google Scholar] [CrossRef]
- Patil; Devendra; Mcdonough; et al. Wireless Power Transfer for Vehicular Applications: Overview and Chanllenges. IEEE Trans. Transp. Electrif., 2018, 4, 13–37. [Google Scholar]
- Page, B.R.; Mahmoudian, N. Simulation-Driven Optimization of Underwater Docking Station Design. IEEE J. Oceanic Eng., 2019, 45, 404–413. [Google Scholar] [CrossRef]
- Zhu, Q.; Zhang, Y.; Liao, C.; et al. Experimental Study on Asymmetric Wireless Power Transfer System for Vehicle Considering Ferrous Chassis. IEEE Trans. Transp. Electrif., 2017, 3, 427–433. [Google Scholar] [CrossRef]
- Feng, H.; Tavakoli, R.; Onar, O.C.; et al. Advances in High-Power Wireless Charging Systems: Overview and Design Considerations. IEEE Trans. Transp. Electrif., 2020, 6, 886–919. [Google Scholar] [CrossRef]
- Hui, S.Y.R.; Zhong, W.; Lee, C.K. A Critical Review of Recent Progress in Mid-Range Wireless Power Transfer. IEEE Trans. Power Electron., 2014, 29, 4500–4511. [Google Scholar] [CrossRef]
- Zhang, Y.; Lu, T.; Zhao, Z. Selective Wireless Power Transfer to Multiple Loads Using Receivers of Different Resonant Frequencies. IEEE Trans. Power Electron., 2015, 30, 6001–6005. [Google Scholar] [CrossRef]
- Shin, J.; Shin, S.; Kim, Y.; et al. Design and Implementation of Shaped Magnetic-Resonance-Based Wireless Power Transfer System for Roadway-Powered Moving Electric Vehicles. IEEE Trans. Ind. Electron., 2014, 61, 1179–1192. [Google Scholar] [CrossRef]
- Jeong, I.S.; Choi, H.S.; Jung, B.I.; et al. Analysis of S-Parameters in Magnetic Resonance WPT Using Superconducting Coils. IEEE Trans. Appl. Supercond., 2016, 26, 1–4. [Google Scholar] [CrossRef]
- Du, Z.X.; Zhang, X.Y. High-Efficiency Single- and Dual-Band Rectifiers Using a Complex Impedance Compression Network for Wireless Power Transfer. IEEE Trans. Ind. Electron., 2018, 65, 5012–5022. [Google Scholar] [CrossRef]
- Johnson, S.; Küppers, F.; Pau, S. Efficiency of continuous-wave solar pumped semiconductor lasers. Opt. Laser Technol., 2013, 47, 194–198. [Google Scholar] [CrossRef]
- Hao, L.L.; Hu, A.P.; Covic, G.A. A Direct AC-AC Converter for Inductive Power Transfer Systems. IEEE Trans. Power Electron., 2012, 27, 661–668. [Google Scholar]
- Budhia, M.; Covic, G.A.; Boys, J.T. Design and Optimization of Circular Magnetic Structures for Lumped Inductive Power Transfer Systems. IEEE Trans. Power Electron., 2011, 26, 3096–3108. [Google Scholar] [CrossRef]
- Krishnan, S.; Bhuyan, S.; Kumar, V.P.; et al. Frequency agile resonance-based wireless charging system for Electric Vehicles. In Proceedings of 2012 IEEE International Electric Vehicle Conference, Greenville, SC, USA, 4-8 March 2012. [Google Scholar]
- Assawaworrarit, S.; Yu, X.; Fan, S. Robust wireless trandfer using a nonlinear parity-time-symmetric circuit. Nature, 2017, 546, 387–390. [Google Scholar] [CrossRef] [PubMed]
- Zahiribarsari V; Thrimawithana, D. J.; Covic, G.A. An Inductive Coupler Array for In-Motion Wireless Charging of Electric Vehicles. IEEE Trans. Power Electron., 2021, 36, 9854–9863. [Google Scholar] [CrossRef]
- Pugi, F.; Grasso, L.; Paolucci, L.; et al. Finite Element Analysis of Copper Wire for Wireless Power Transfer Applications. In Proceedings of 2022 IEEE 21st Mediterranean Electrotechnical Conference, Palermo, Italy, 14-16 June 2022. [Google Scholar]
- Safaee, A.; Woronowicz, K. Time-domain Analysis of Voltage-Driven Series-Series Compensated Inductive Power Transfer Topology. IEEE Trans. Power Electron., 2017, 32, 4981–5003. [Google Scholar] [CrossRef]
- Budhia, M.; Covic, G.A.; Boys, J.T.; et al. Development and Evaluation of Single Sided Flux Couplers for Contactless Electric Vehicle Charging. In Proceedings of 2011 IEEE Energy Conversion Congress and Exposition, Phoenix, AZ, USA, 17-22 September 2011. [Google Scholar]
- Liu, S.; Li, X.; Yang, L. A Three-Coil Structure Based WPT System Design for the Electric Bike CC and CV Charging Without Communication. IET Electr. Power Appl., 2019, 13, 1318–1327. [Google Scholar] [CrossRef]
- Li, Y.; Xu, Q.; Lin, T.; et al. Analysis and Design of Load-Independent Output Current or Output Voltage of a Three-Coil Wireless Power Transfer System. IEEE Trans. Transp. Electrif., 2018, 4, 364–375. [Google Scholar] [CrossRef]
- Jeong, S.; Kim, D.H.; Song, J.; et al. Smartwatch Strap Wireless Power Transfer System With Flexible PCB Coil and Shielding Material. IEEE Trans. Ind. Electron., 2019, 66, 4522–4525. [Google Scholar] [CrossRef]
- Ji, H.K.; Choi, B.G.; Jeong, S.Y.; et al. Plane-Type Receiving Coil With Minimum Number of Coils for Omnidirectional Wireless Power Transfer. IEEE Trans. Power Electron., 2020, 35, 6165–6174. [Google Scholar]
- Bima, M.E.; Bhnttacharya, I.; Adepoju, W.O.; et al. Effect of Coil Parameters on Layered DD Coil for Efficient Wireless Power Transfer. IEEE Lett. Electromagn. Compat. Pract. Appl, 2021, 3, 56–60. [Google Scholar] [CrossRef]
- Hui, S.Y.R.; Zhong, W.; Lee, C.K. A Critical Review of Recent Progress in Mid-Range Wireless Power Transfer. IEEE Trans. Power Electron., 2014, 29, 4500–4511. [Google Scholar] [CrossRef]
- Chen, K.; Zhao, Z. Analysis of the Double-Layer Printed Spiral Coil for Wireless Power Transfer. IEEE J. Emerging Sel. Top. Power Electron., 2013, 1, 114–121. [Google Scholar] [CrossRef]
- Wang, M.; Song, G.; Yin, R.; et al. Design and Analysis of an Anti-Misalignment Wireless Power Transfer System. IEEE Microwave Wireless Technolog. Lett., 2023, 33, 228–231. [Google Scholar] [CrossRef]
- Gyimothy, S.; Kaya, S.; Obara, D.; et al. Loss Computation Method for Litz Cables With Emphasis on Bundle-Level Skin Effect. IEEE Trans. Magn., 2019, 55, 1–4. [Google Scholar] [CrossRef]
- Kim, S.J.; Kim, J.W.; Lee, H.W.; et al. Design of Multiple- Transmitter WPT System with Angular Misalignment Estimation from Mutual Inductance Tracking. In Proceedings of 2022 52nd European Microwave Conference, Milan, Italy, 27-29 September 2022. [Google Scholar]
Figure 1.
Two types of coil structures. (a) Spatial spiral structure. (b) Planar spiral structure.
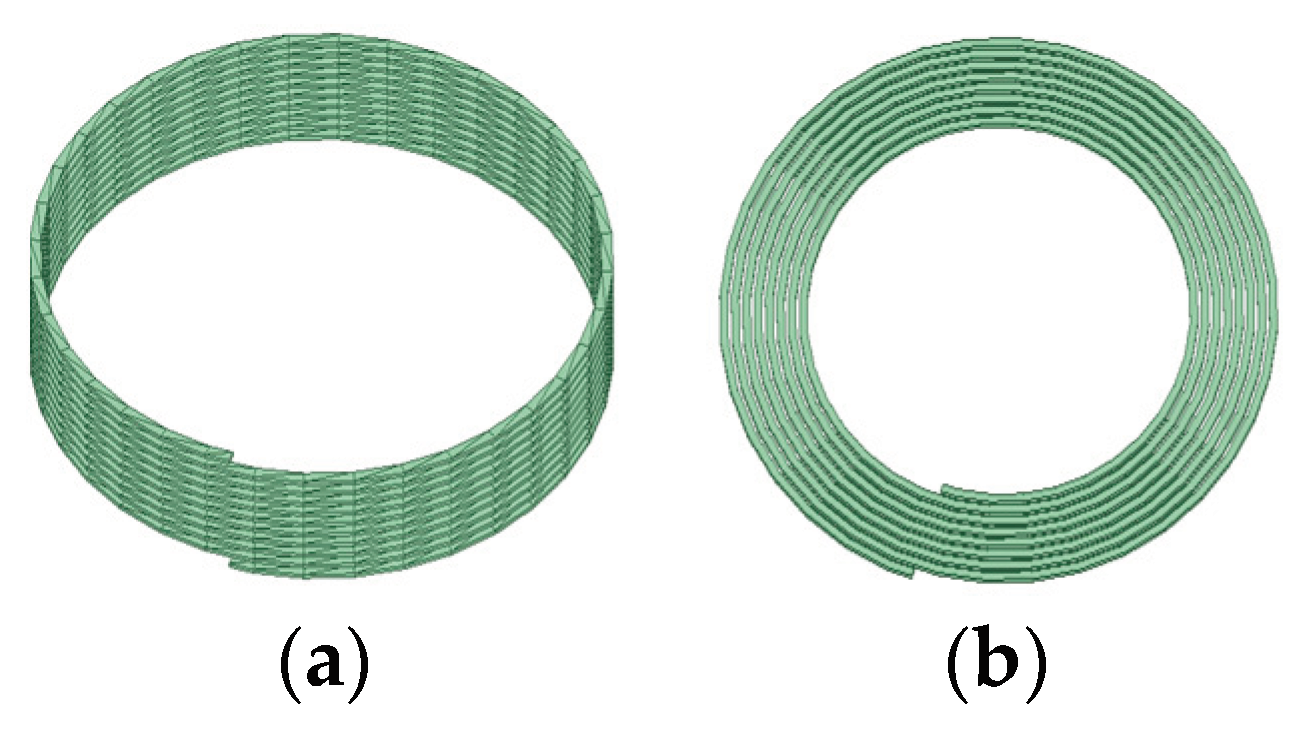
Figure 2.
Structure diagram of the wireless power transfer system.
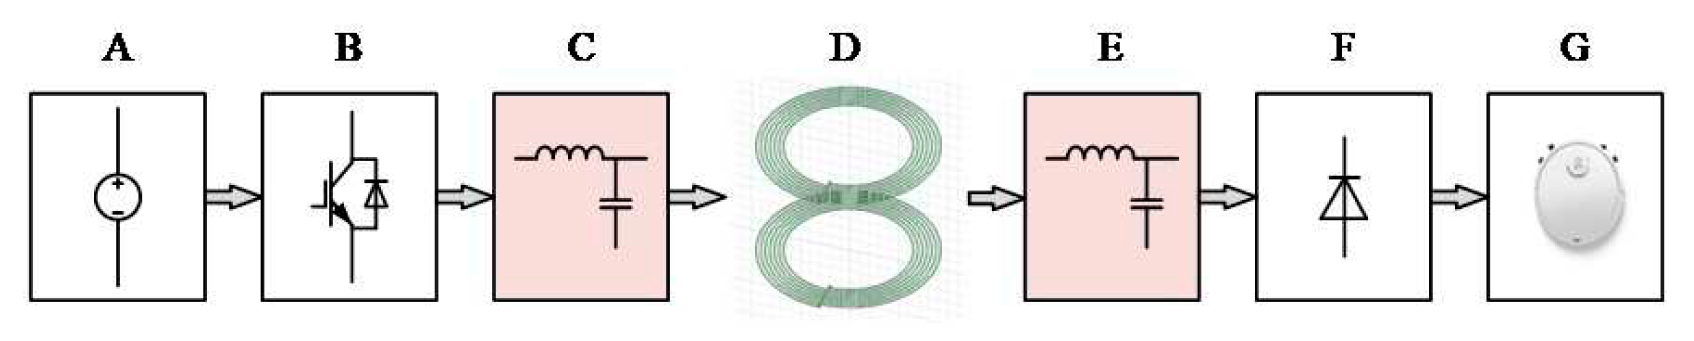
Figure 3.
Coupled coil mutual inductance circuit model.
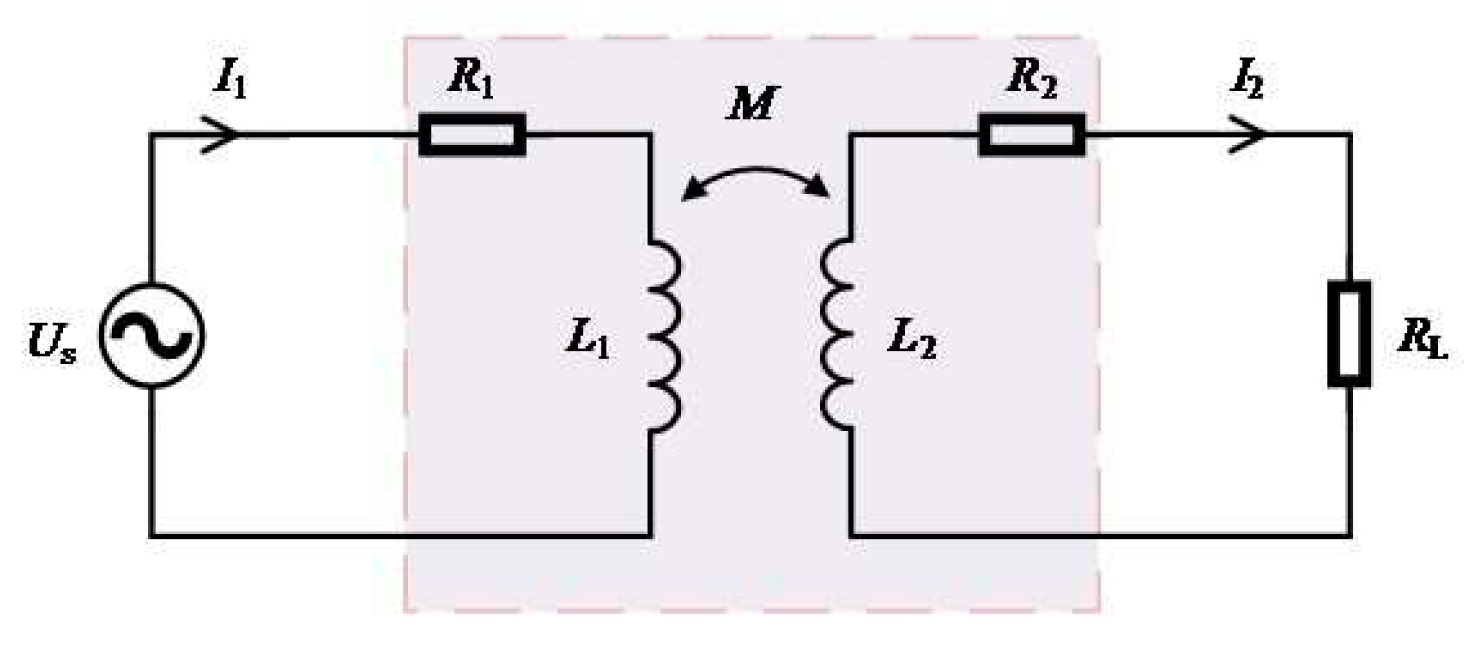
Figure 4.
Circuit figure of the bilateral compensation method . (a) SS type compensation. (b) SP type compensation. (c) PS type compensation. (d) PP type compensation.
Figure 4.
Circuit figure of the bilateral compensation method . (a) SS type compensation. (b) SP type compensation. (c) PS type compensation. (d) PP type compensation.
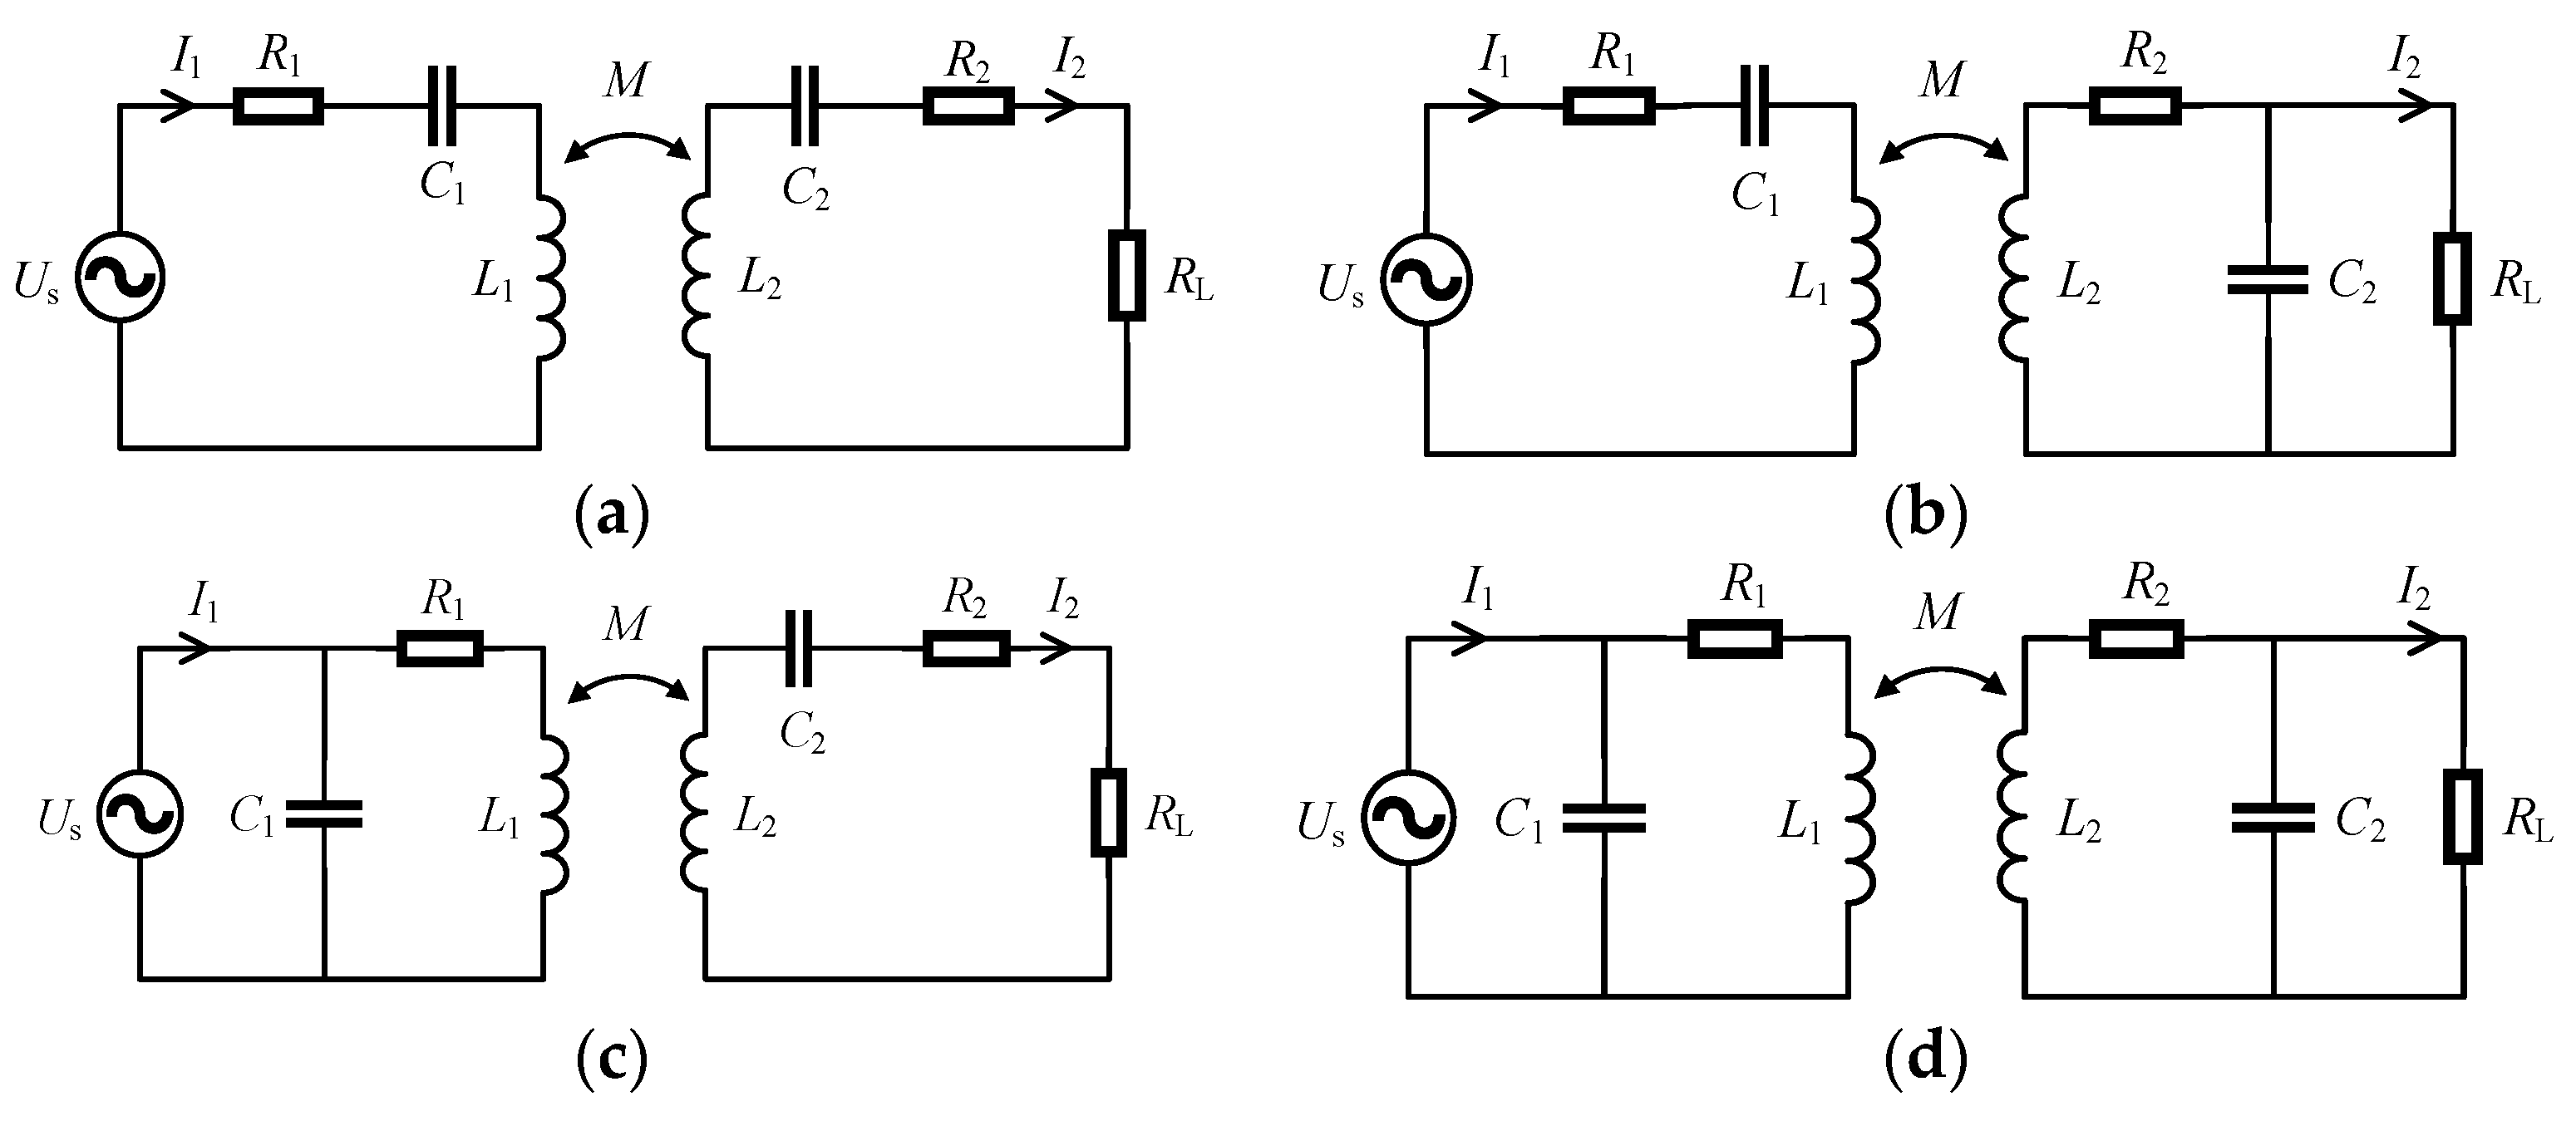
Figure 5.
Coupling coil mutual inductance circuit model of the SS compensation method.
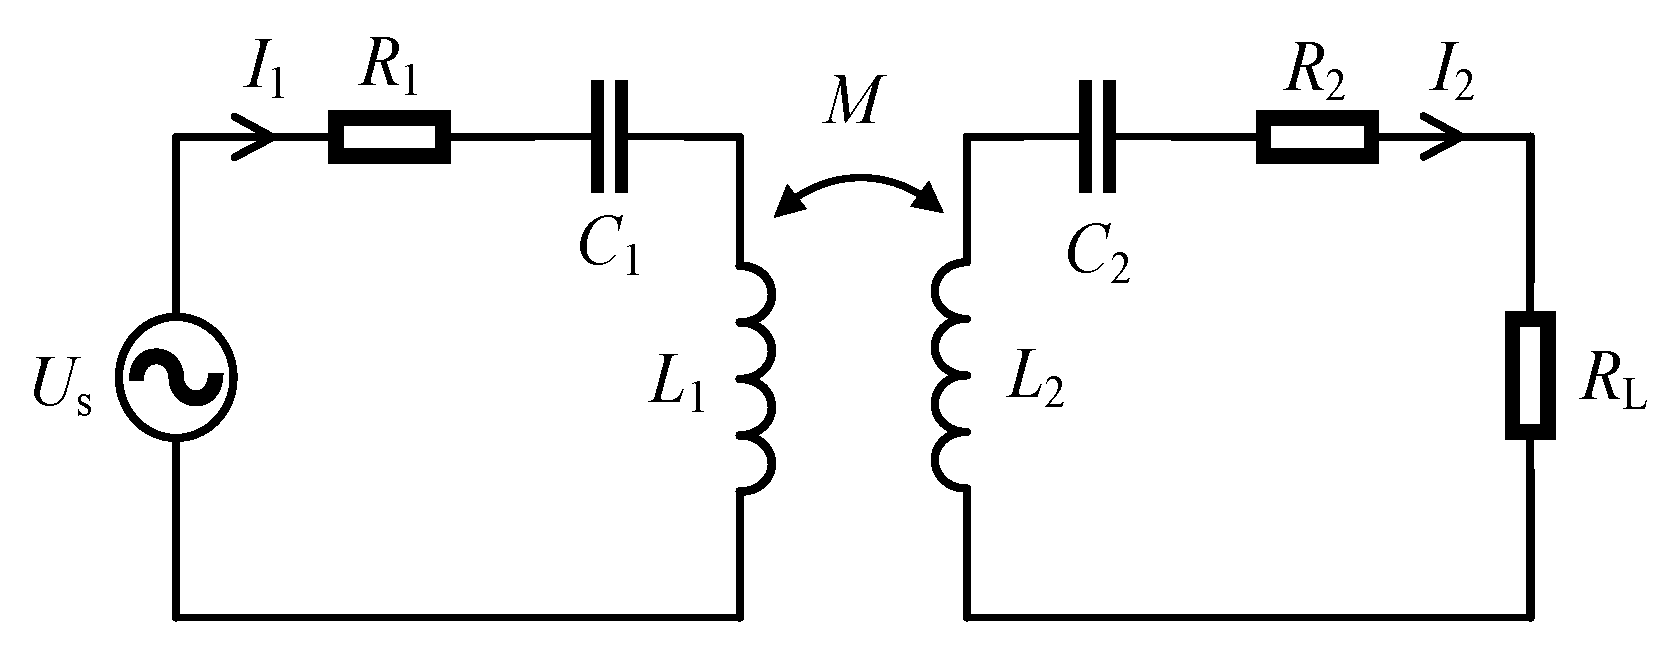
Figure 6.
Flat coils with different shapes. (a) Circular plane spiral coil. (b) Rectangular plane spiral coil.
Figure 6.
Flat coils with different shapes. (a) Circular plane spiral coil. (b) Rectangular plane spiral coil.
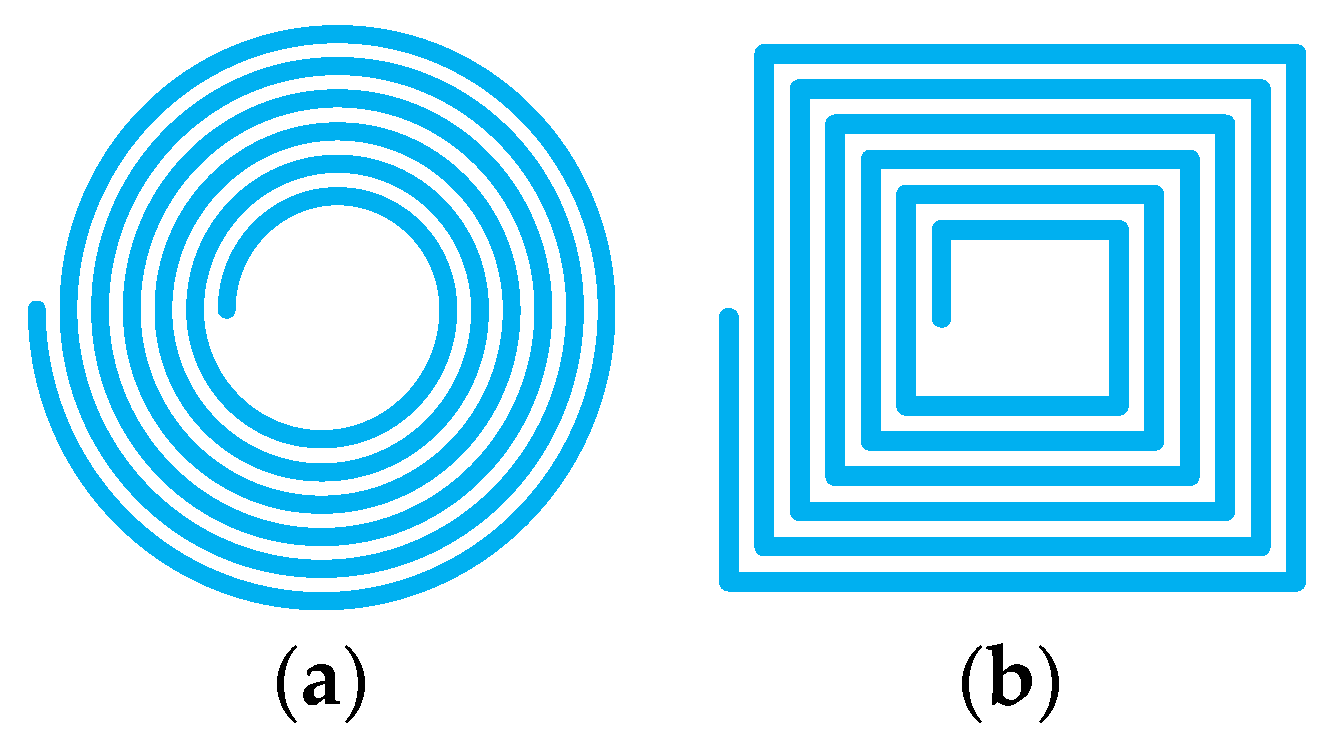
Figure 7.
Magnetic field nephogram of plane coils with different shapes. (a) Circular plane spiral coil. (b) Rectangular plane spiral coil.
Figure 7.
Magnetic field nephogram of plane coils with different shapes. (a) Circular plane spiral coil. (b) Rectangular plane spiral coil.
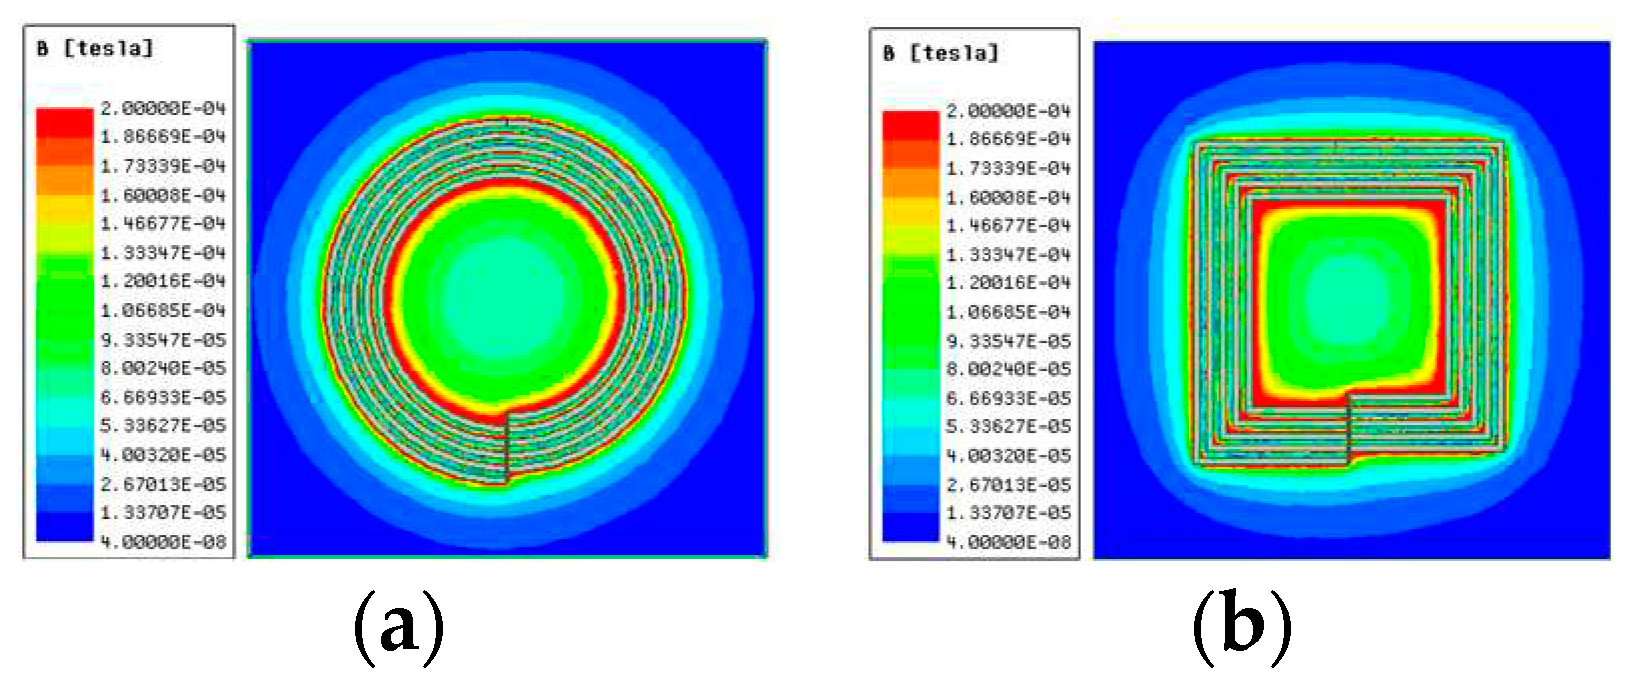
Figure 8.
Sectional figure of the PCB plane circular coil.
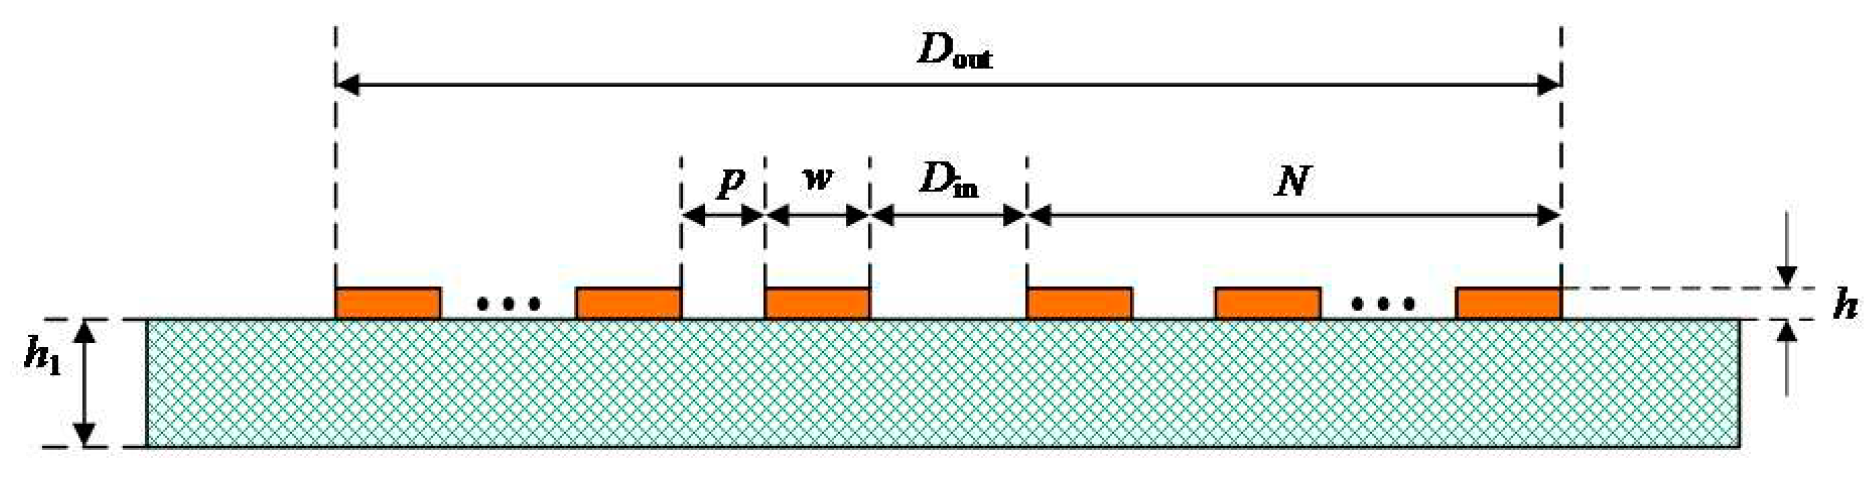
Figure 9.
Three-dimensional simulation model of the coil.
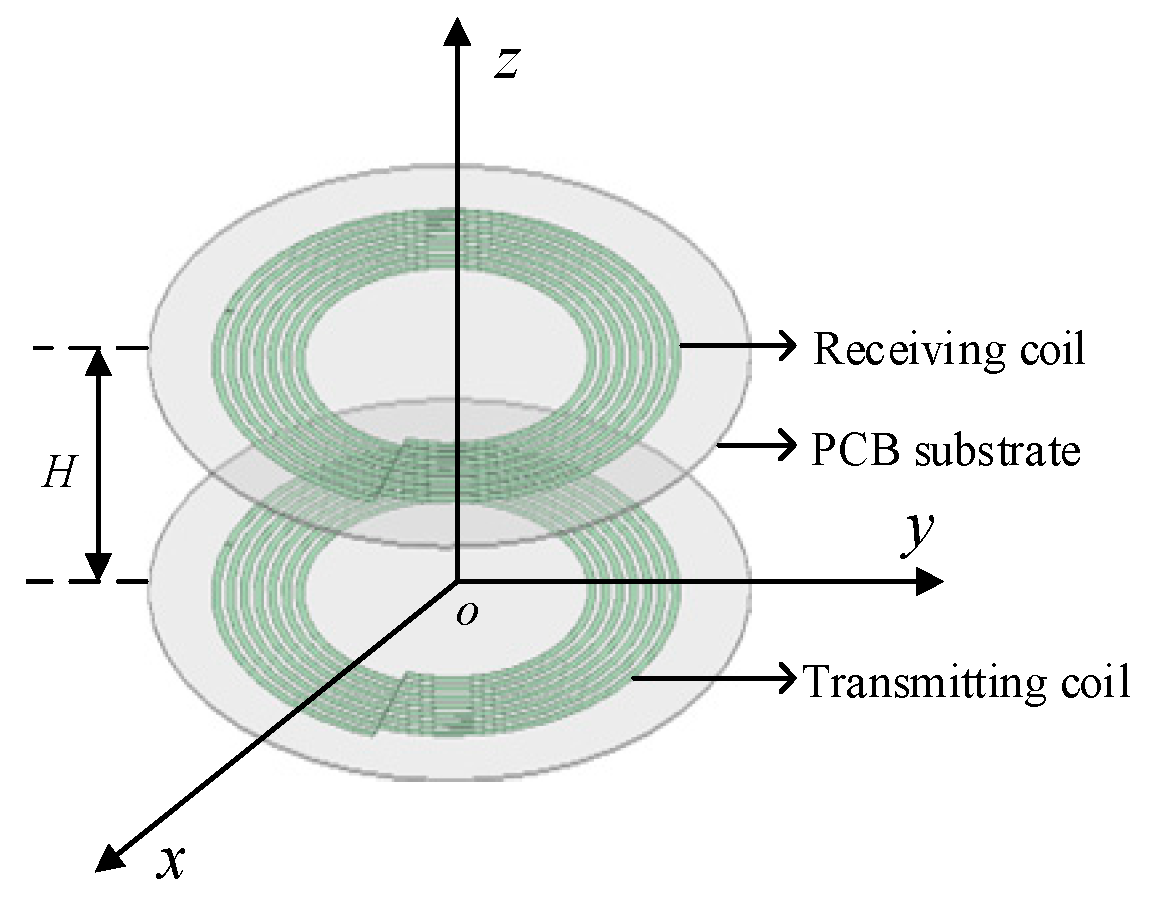
Figure 10.
Simulation results of different coil turn spacings. (a) Coil quality factor and coupling coefficient. (b) Strong coupling coefficient of coil.
Figure 10.
Simulation results of different coil turn spacings. (a) Coil quality factor and coupling coefficient. (b) Strong coupling coefficient of coil.
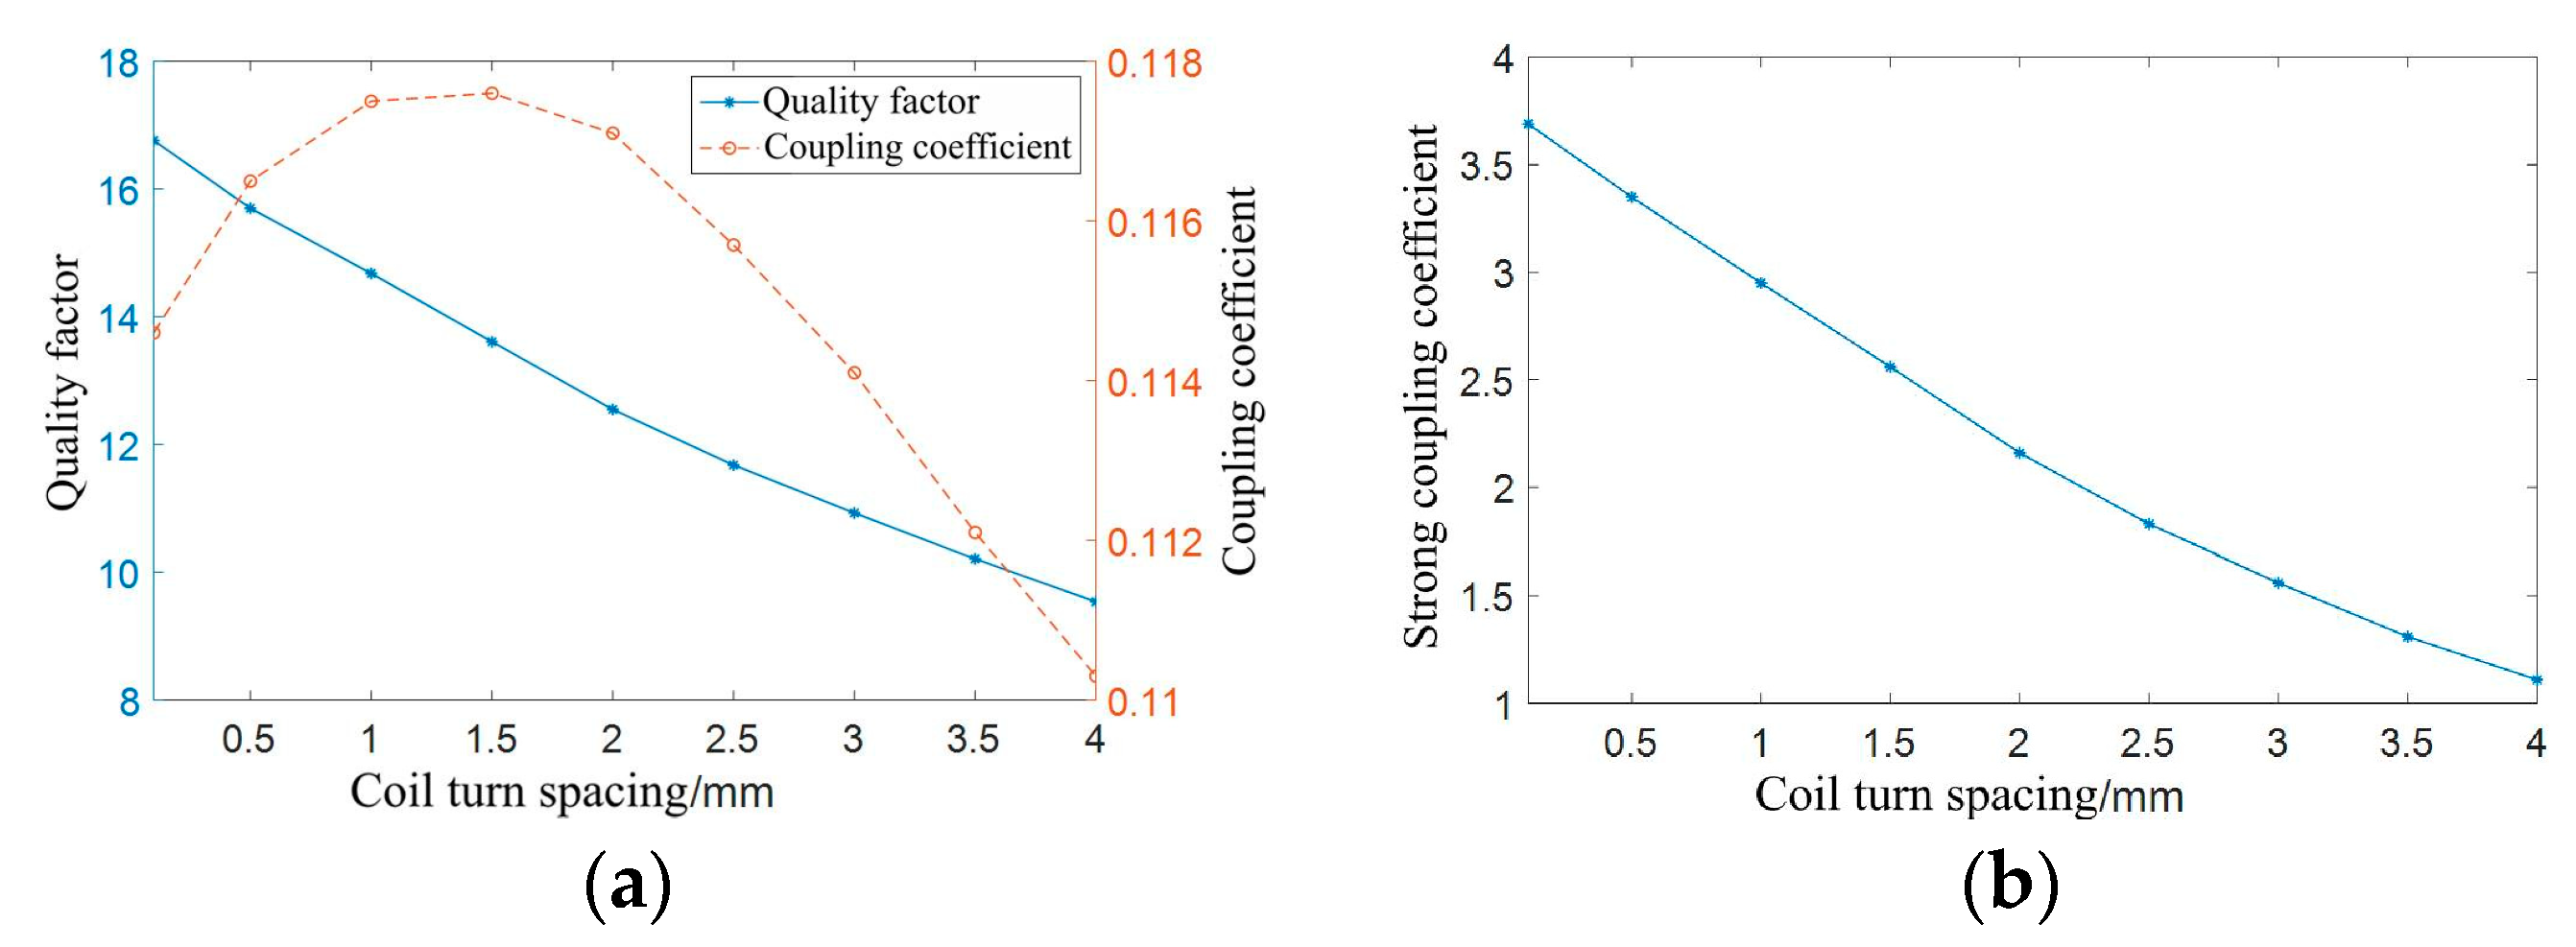
Figure 11.
Simulation results of different coil turn spacings. (a) Coil quality factor and coupling coefficient. (b) Strong coupling coefficient of coil.
Figure 11.
Simulation results of different coil turn spacings. (a) Coil quality factor and coupling coefficient. (b) Strong coupling coefficient of coil.
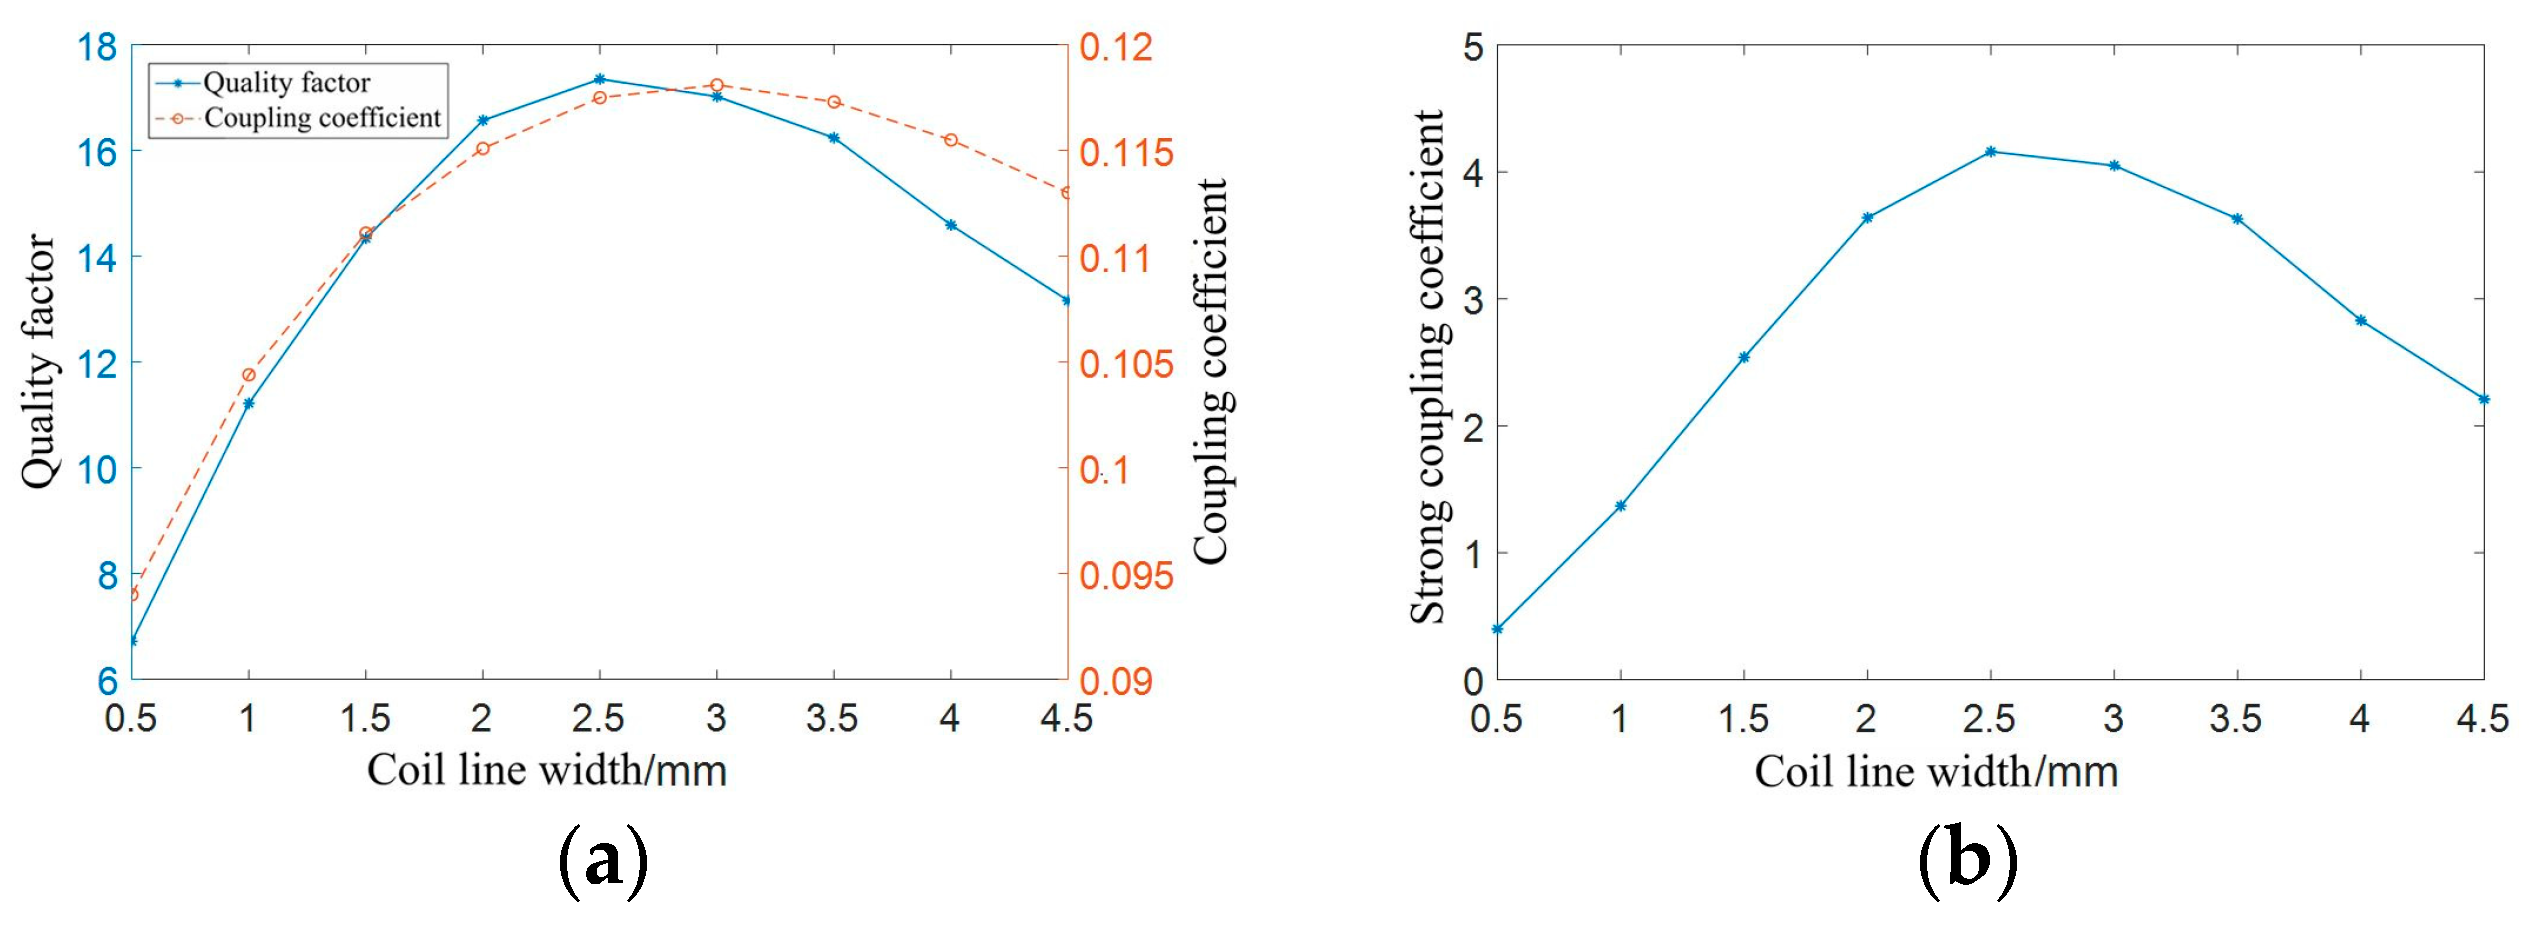
Figure 12.
Simulation data of different coil turns. (a) Coil quality factor and coupling coefficient. (b) Strong coupling coefficient of coil.
Figure 12.
Simulation data of different coil turns. (a) Coil quality factor and coupling coefficient. (b) Strong coupling coefficient of coil.
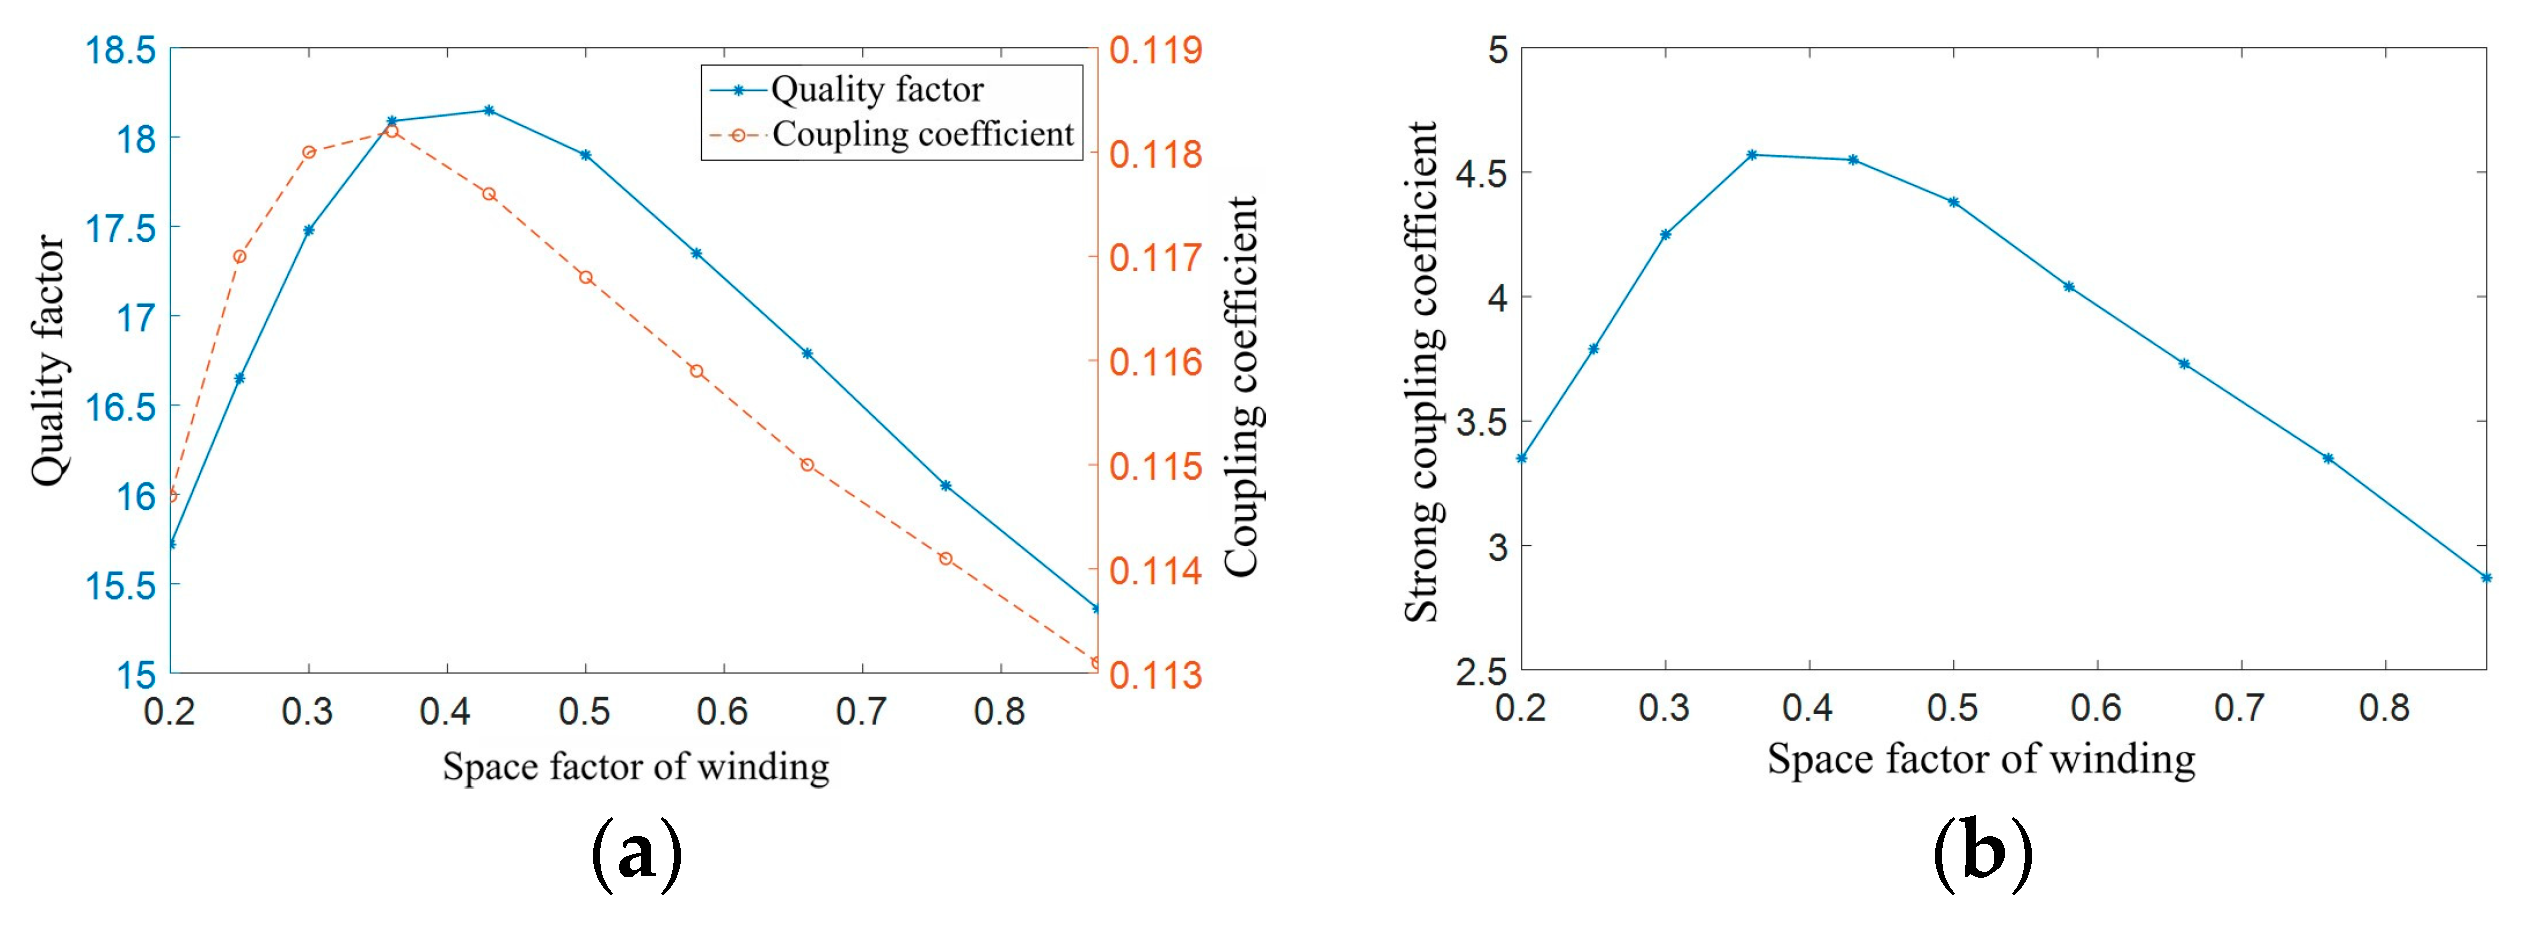
Figure 13.
Top view of the double-layer PCB coil. (a) Top view of the coil top layer. (b) Top view of the coil bottom layer in Scheme 1. (c) Top view of the coil bottom layer in Scheme 2.
Figure 13.
Top view of the double-layer PCB coil. (a) Top view of the coil top layer. (b) Top view of the coil bottom layer in Scheme 1. (c) Top view of the coil bottom layer in Scheme 2.
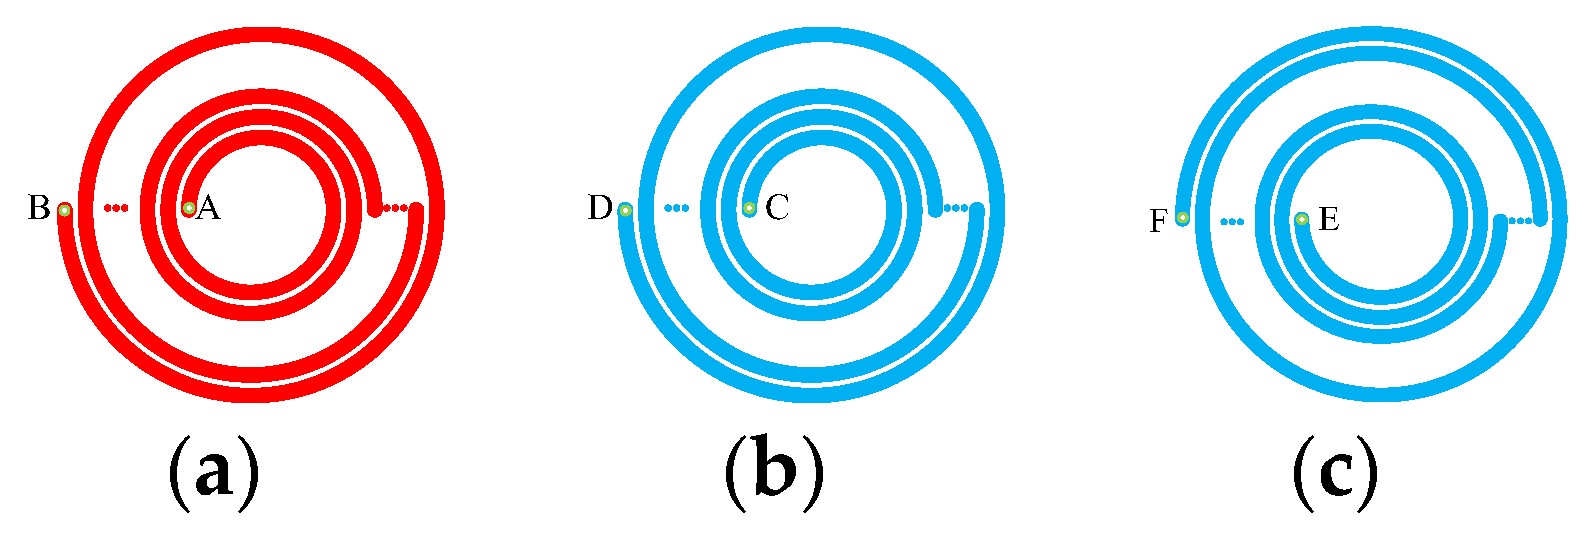
Figure 14.
Model figure of coil coaxial parallel offset.
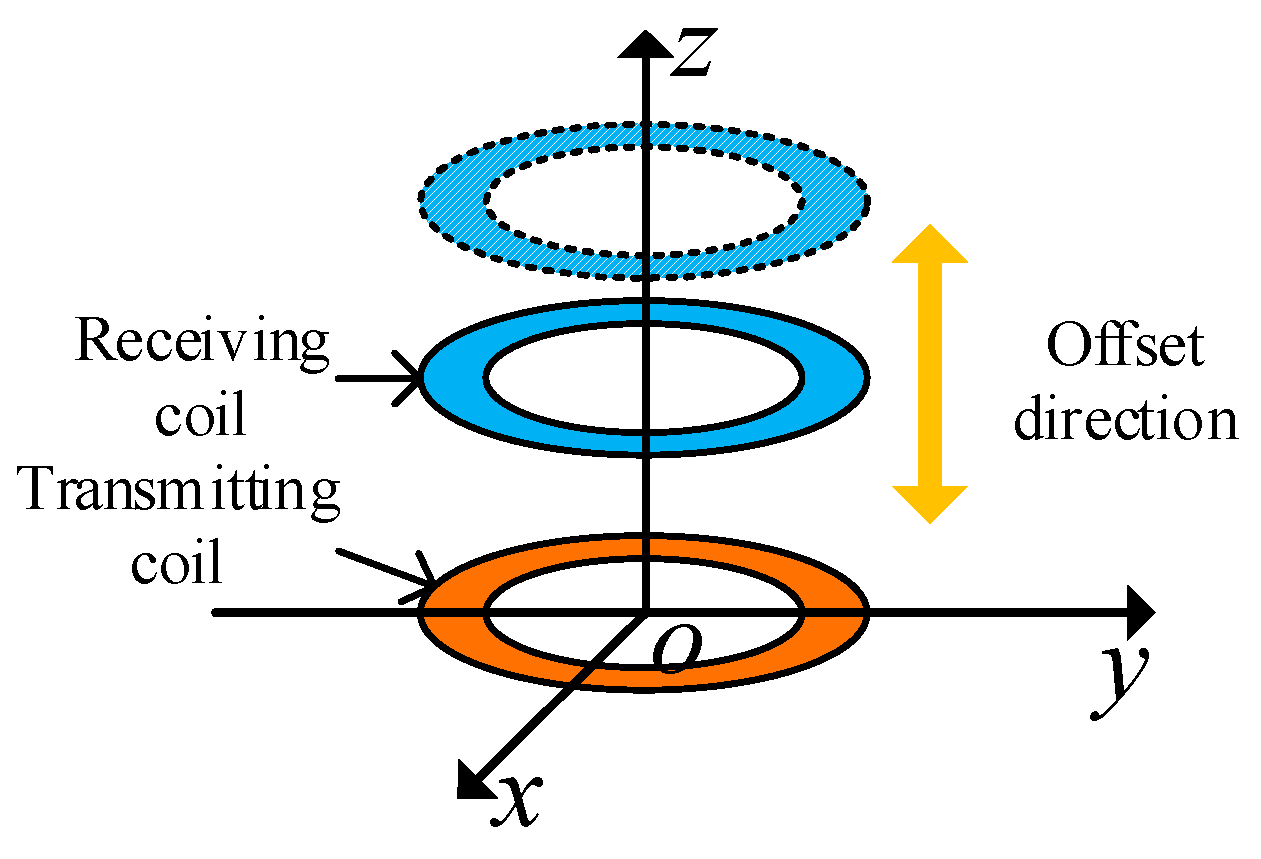
Figure 15.
Schematic figure of coil coaxial parallel offset.(a) Offset 3 cm. (b) Offset 5 cm. (c) Offset 7 cm.
Figure 15.
Schematic figure of coil coaxial parallel offset.(a) Offset 3 cm. (b) Offset 5 cm. (c) Offset 7 cm.
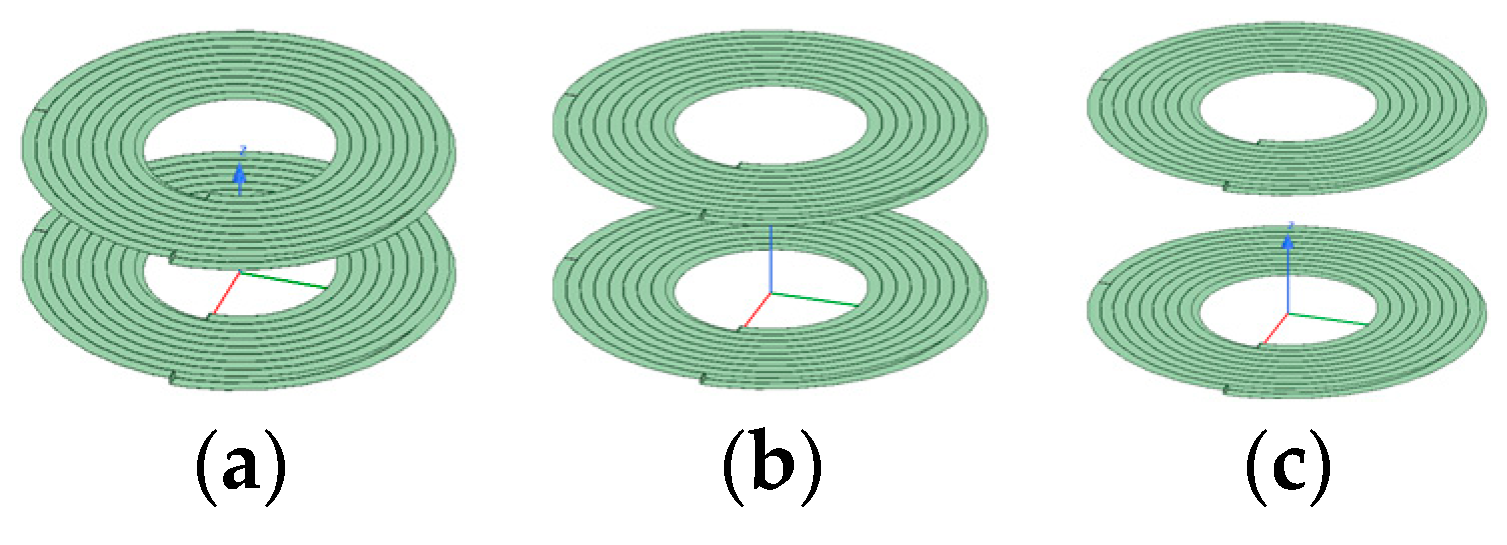
Figure 16.
Simulation data of coil coaxial parallel offset. (a) Coil coupling coefficient. (b) Coil strong coupling coefficient. (c) Coil transmission efficiency.
Figure 16.
Simulation data of coil coaxial parallel offset. (a) Coil coupling coefficient. (b) Coil strong coupling coefficient. (c) Coil transmission efficiency.
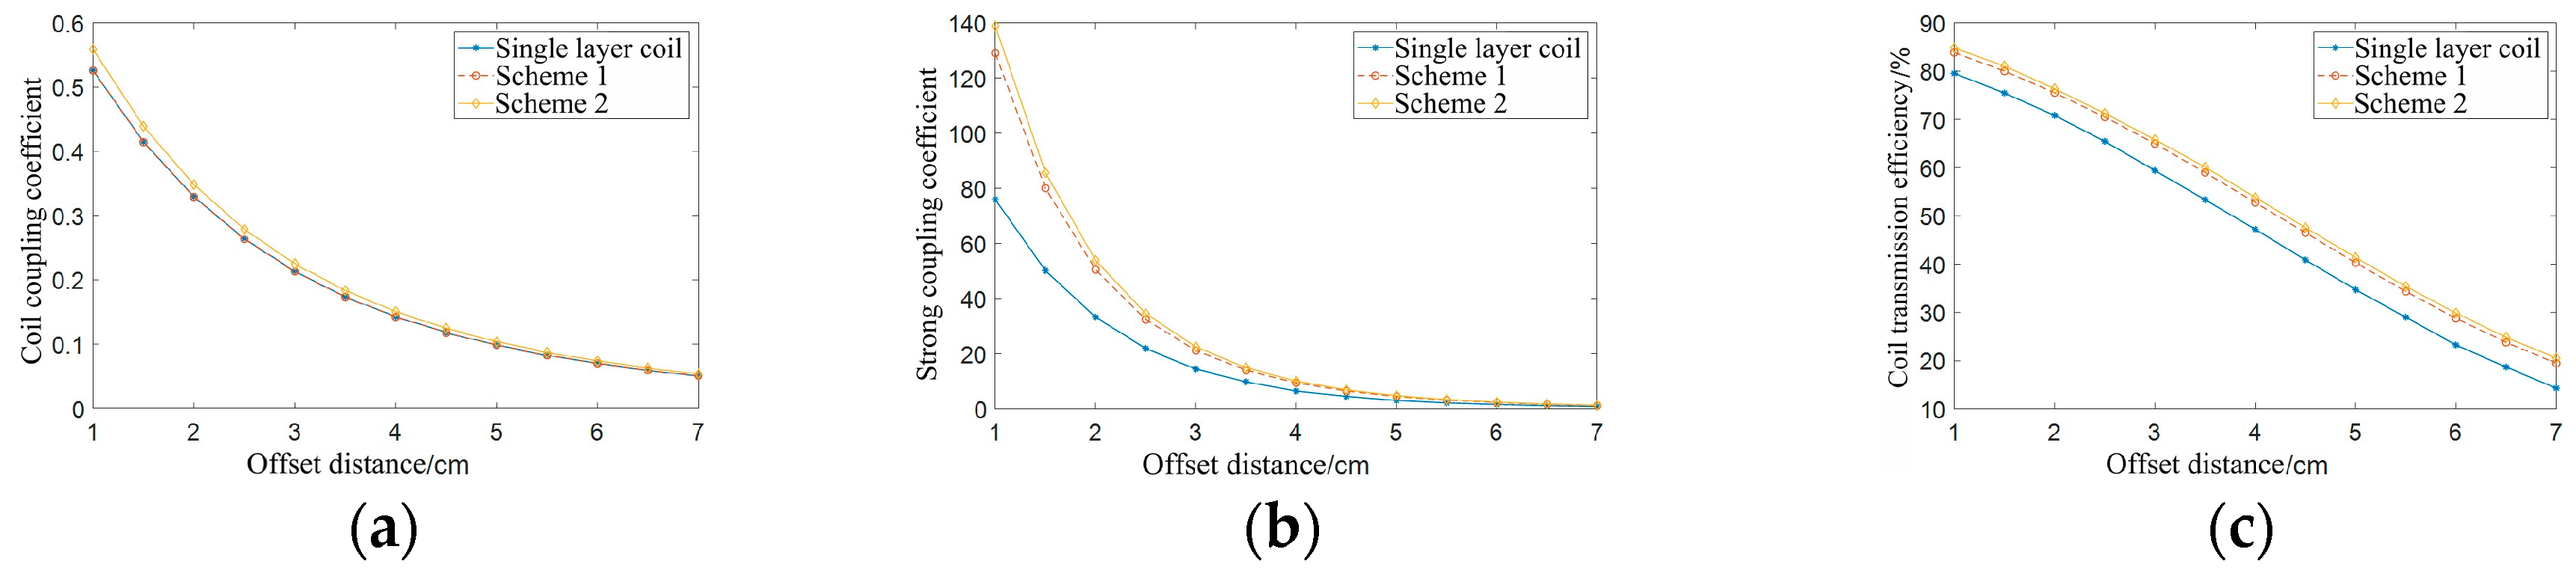
Figure 17.
Schematic figure of coil coaxial nonparallel offset.
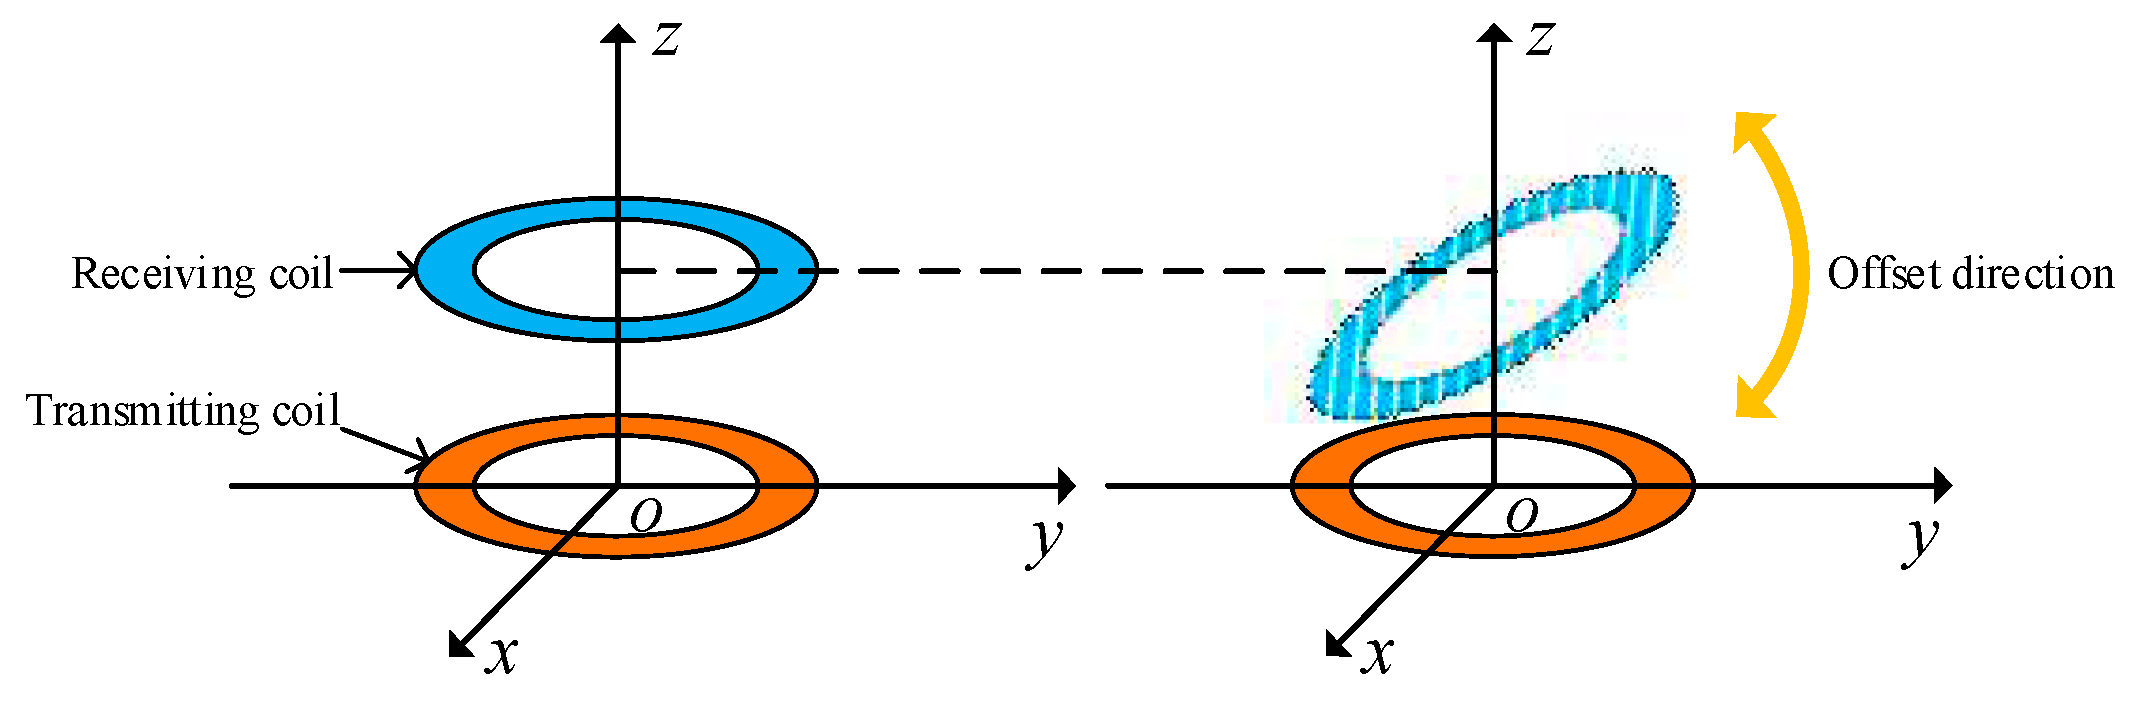
Figure 18.
Model figure of coil coaxial nonparallel offset. (a) Offset 5 cm, offset 30 degrees. (b) Offset 5 cm, offset 60 degrees. (c) Offset 7 cm, offset 30 degrees.
Figure 18.
Model figure of coil coaxial nonparallel offset. (a) Offset 5 cm, offset 30 degrees. (b) Offset 5 cm, offset 60 degrees. (c) Offset 7 cm, offset 30 degrees.
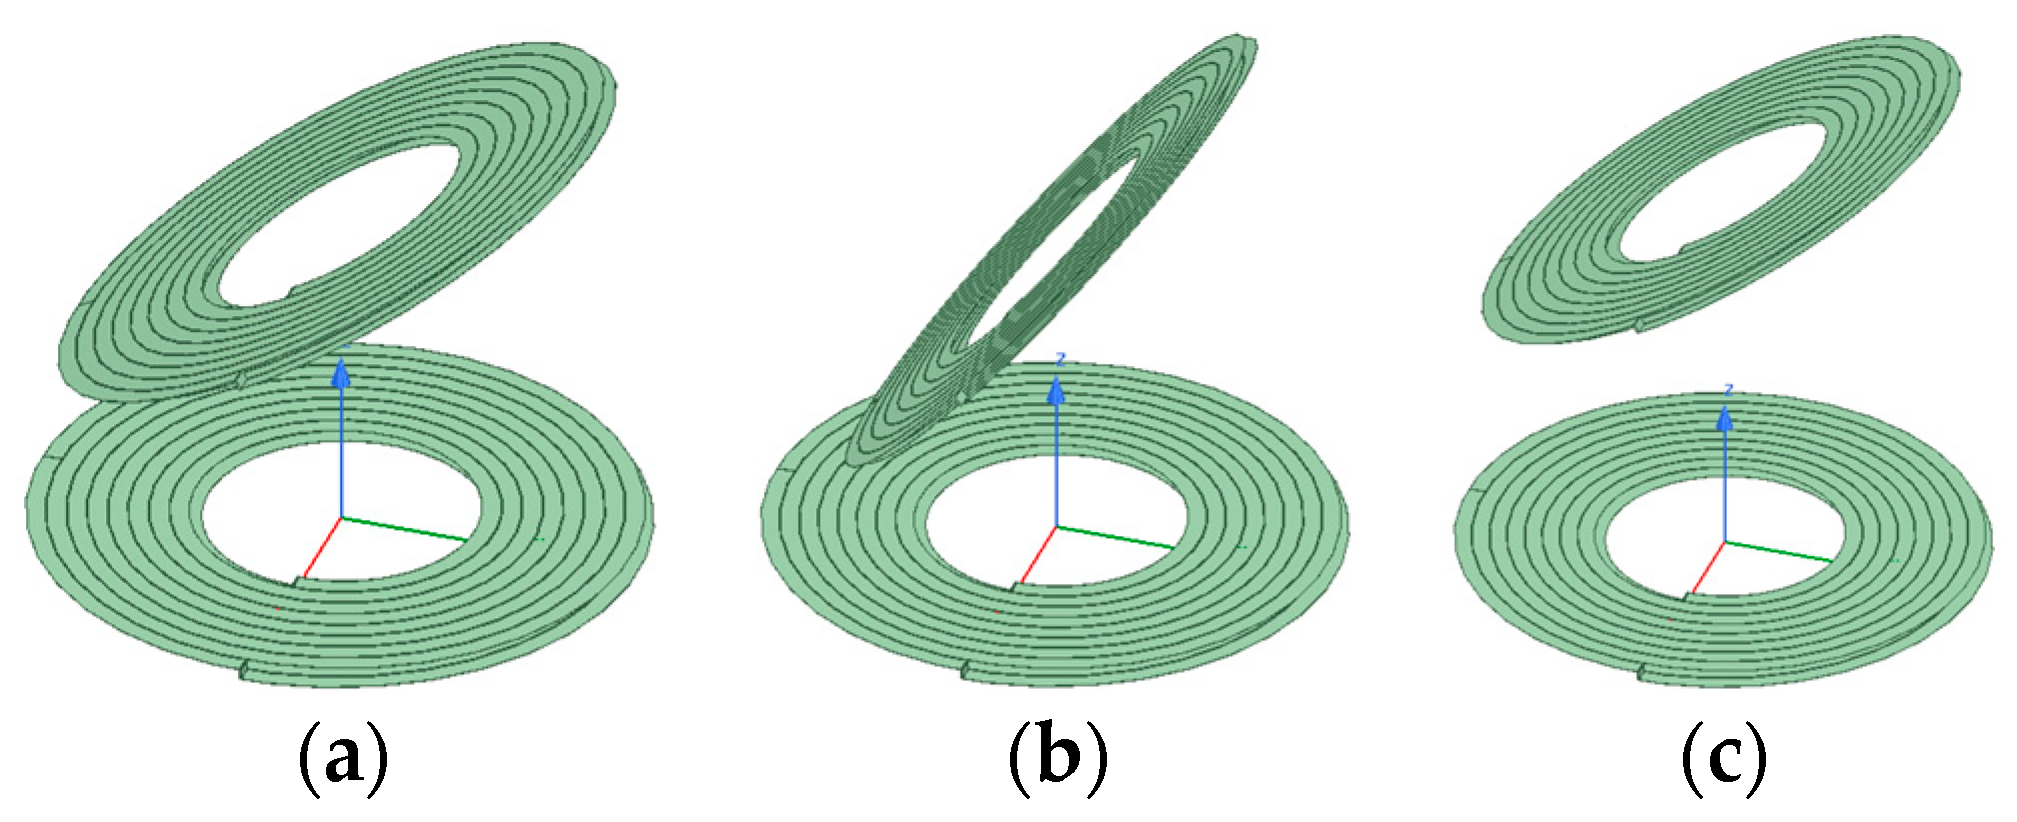
Figure 19.
Simulation results of coil coaxial nonparallel offset. (a) Coil coupling coefficient. (b) Coil strong coupling coefficient. (c) Coil transmission efficiency. (d) Comparison of strong coupling coefficients at different offset angles under the condition of an offset distance of 5.5 cm.
Figure 19.
Simulation results of coil coaxial nonparallel offset. (a) Coil coupling coefficient. (b) Coil strong coupling coefficient. (c) Coil transmission efficiency. (d) Comparison of strong coupling coefficients at different offset angles under the condition of an offset distance of 5.5 cm.
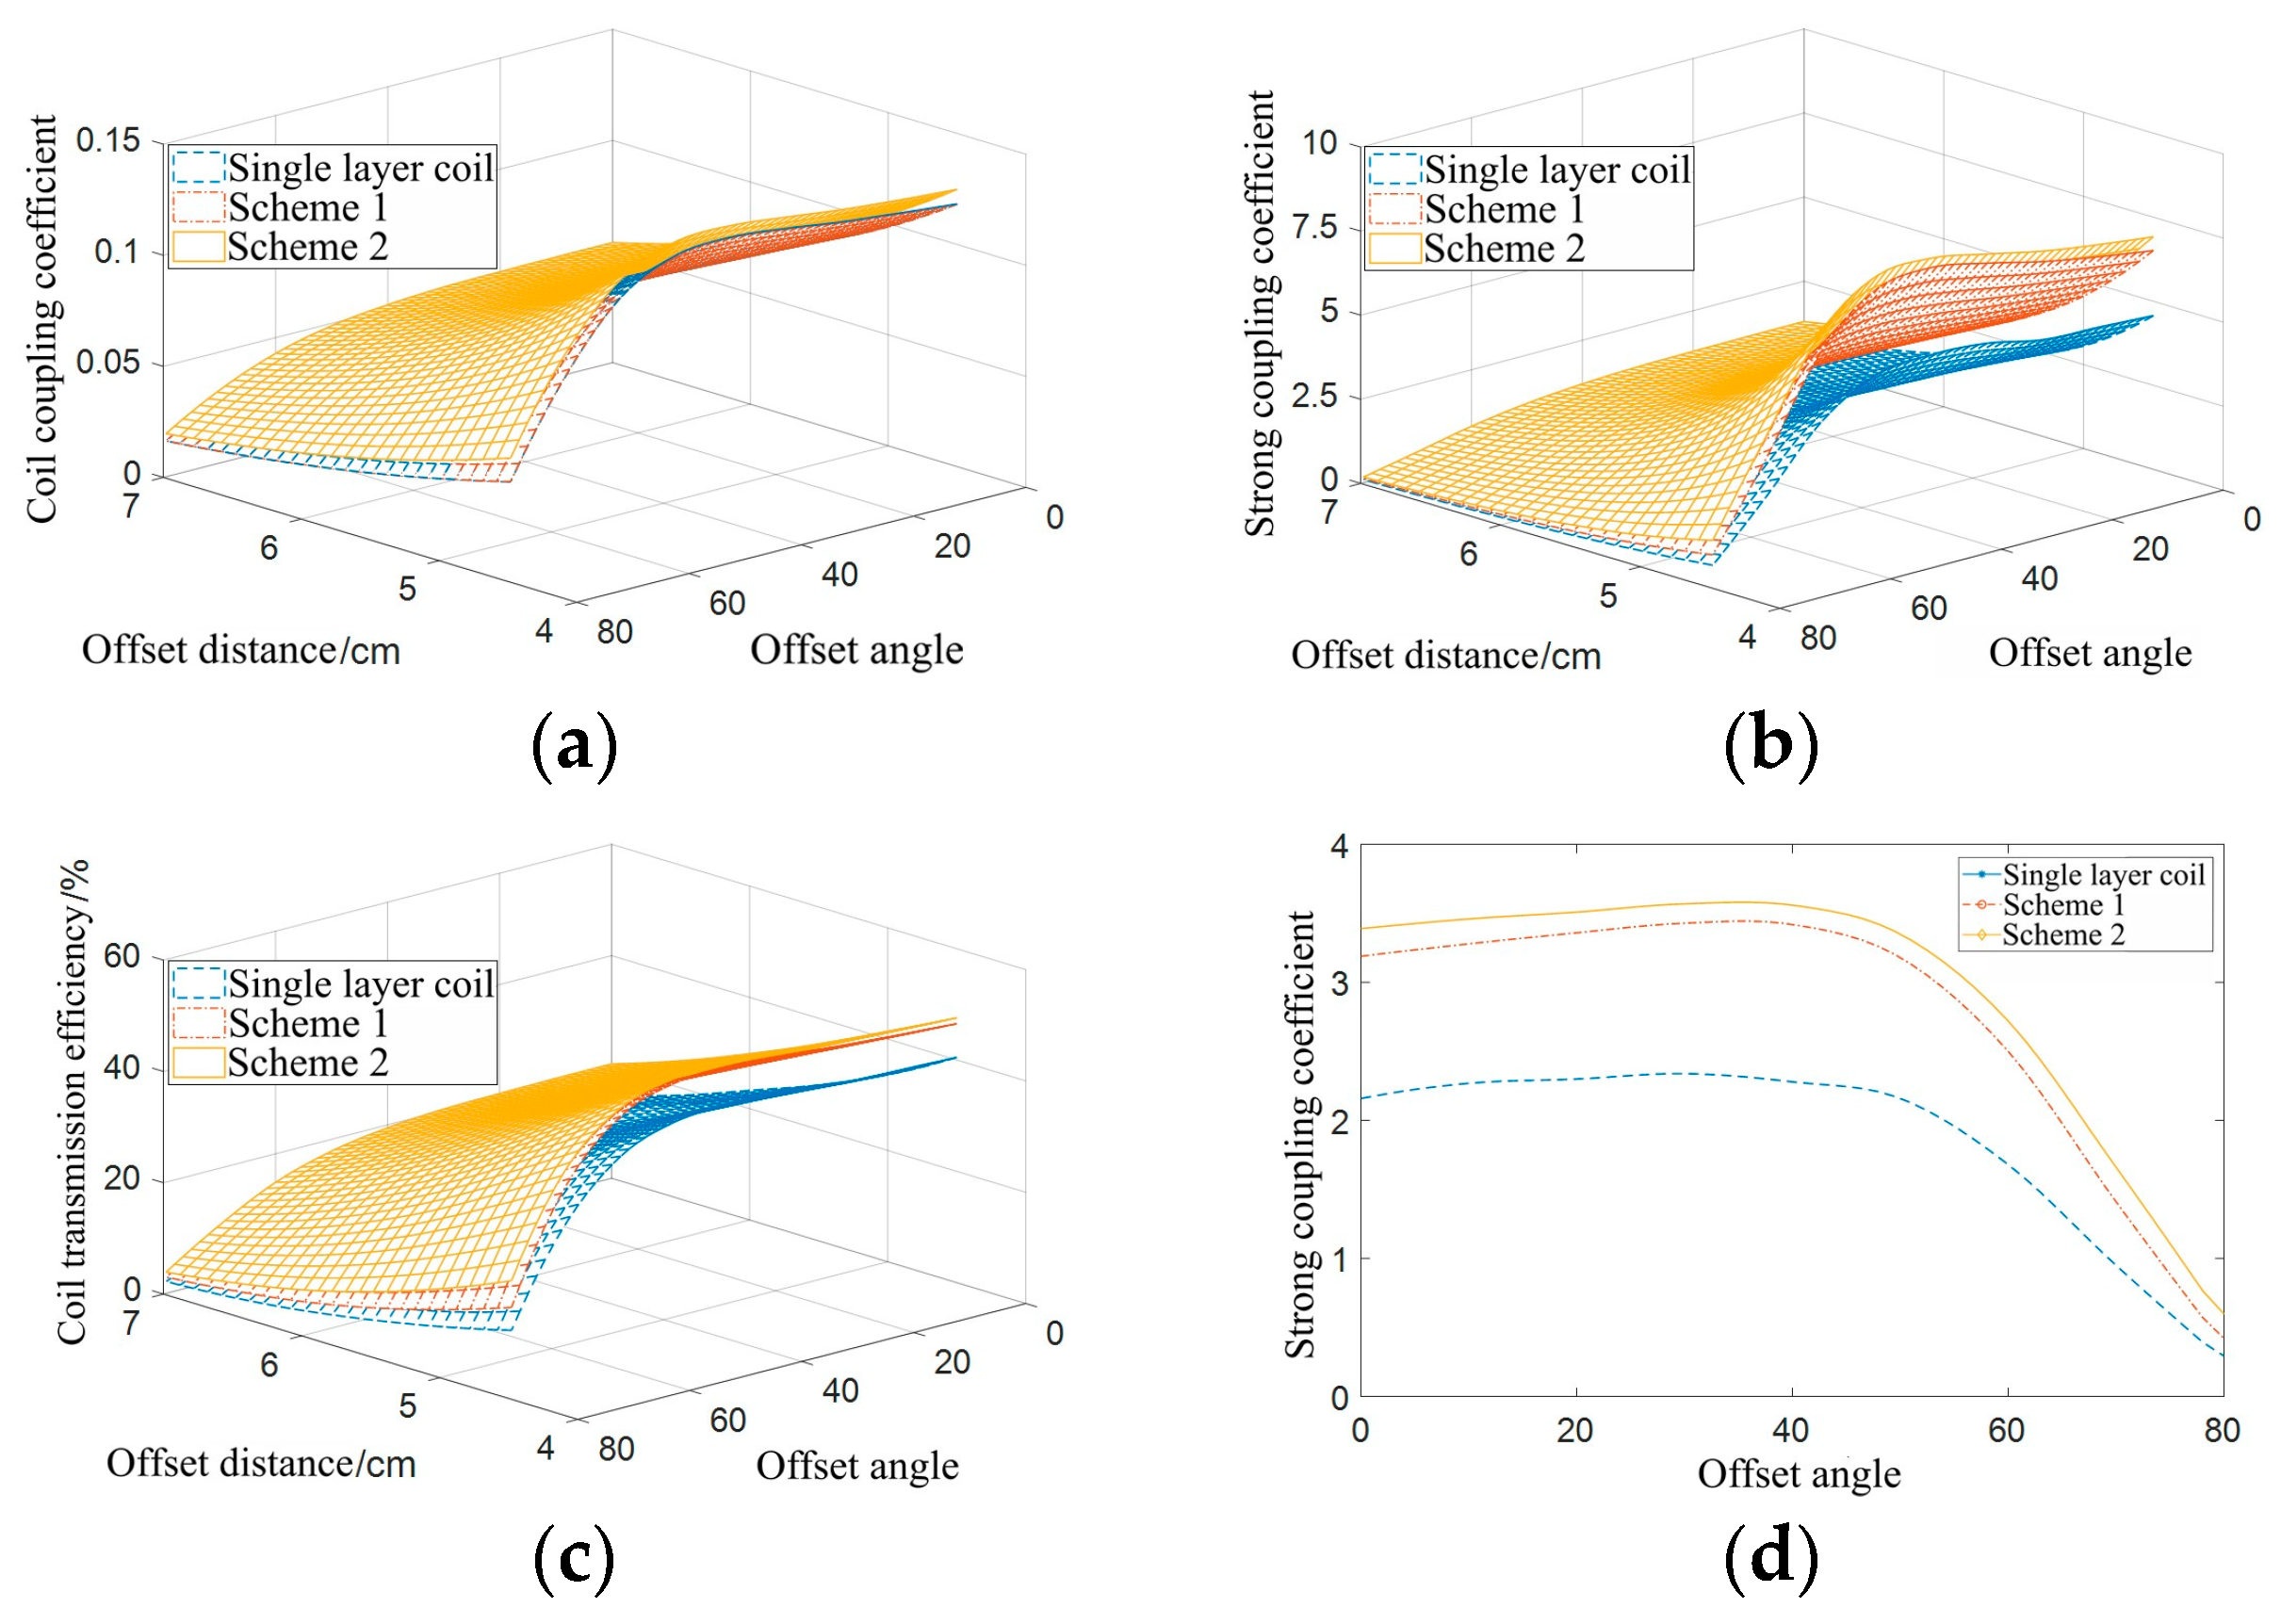
Figure 20.
Schematic figure of coil different axes parallel offset.
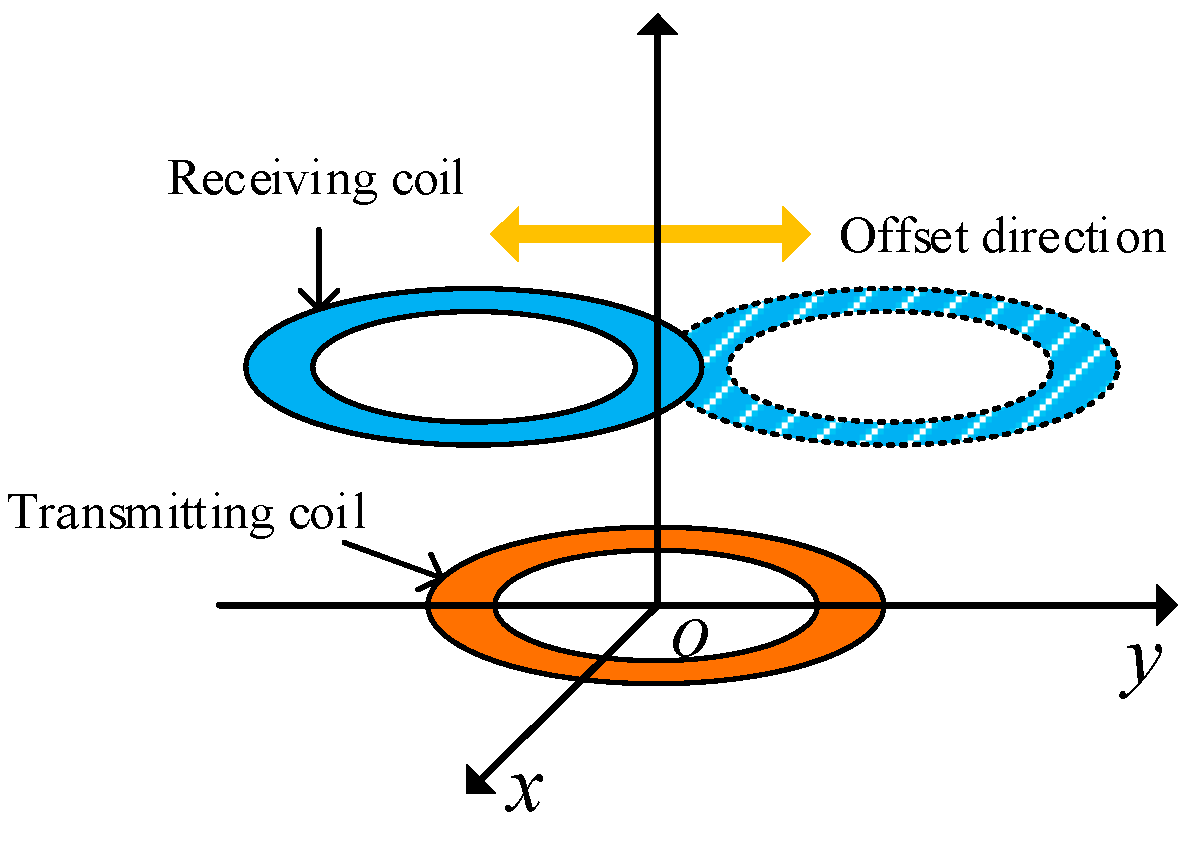
Figure 21.
Model figure of coil different axes parallel offset. (a) Offset 1 cm. (b) Offset 2.5 cm. (c) Offset 4 cm.
Figure 21.
Model figure of coil different axes parallel offset. (a) Offset 1 cm. (b) Offset 2.5 cm. (c) Offset 4 cm.
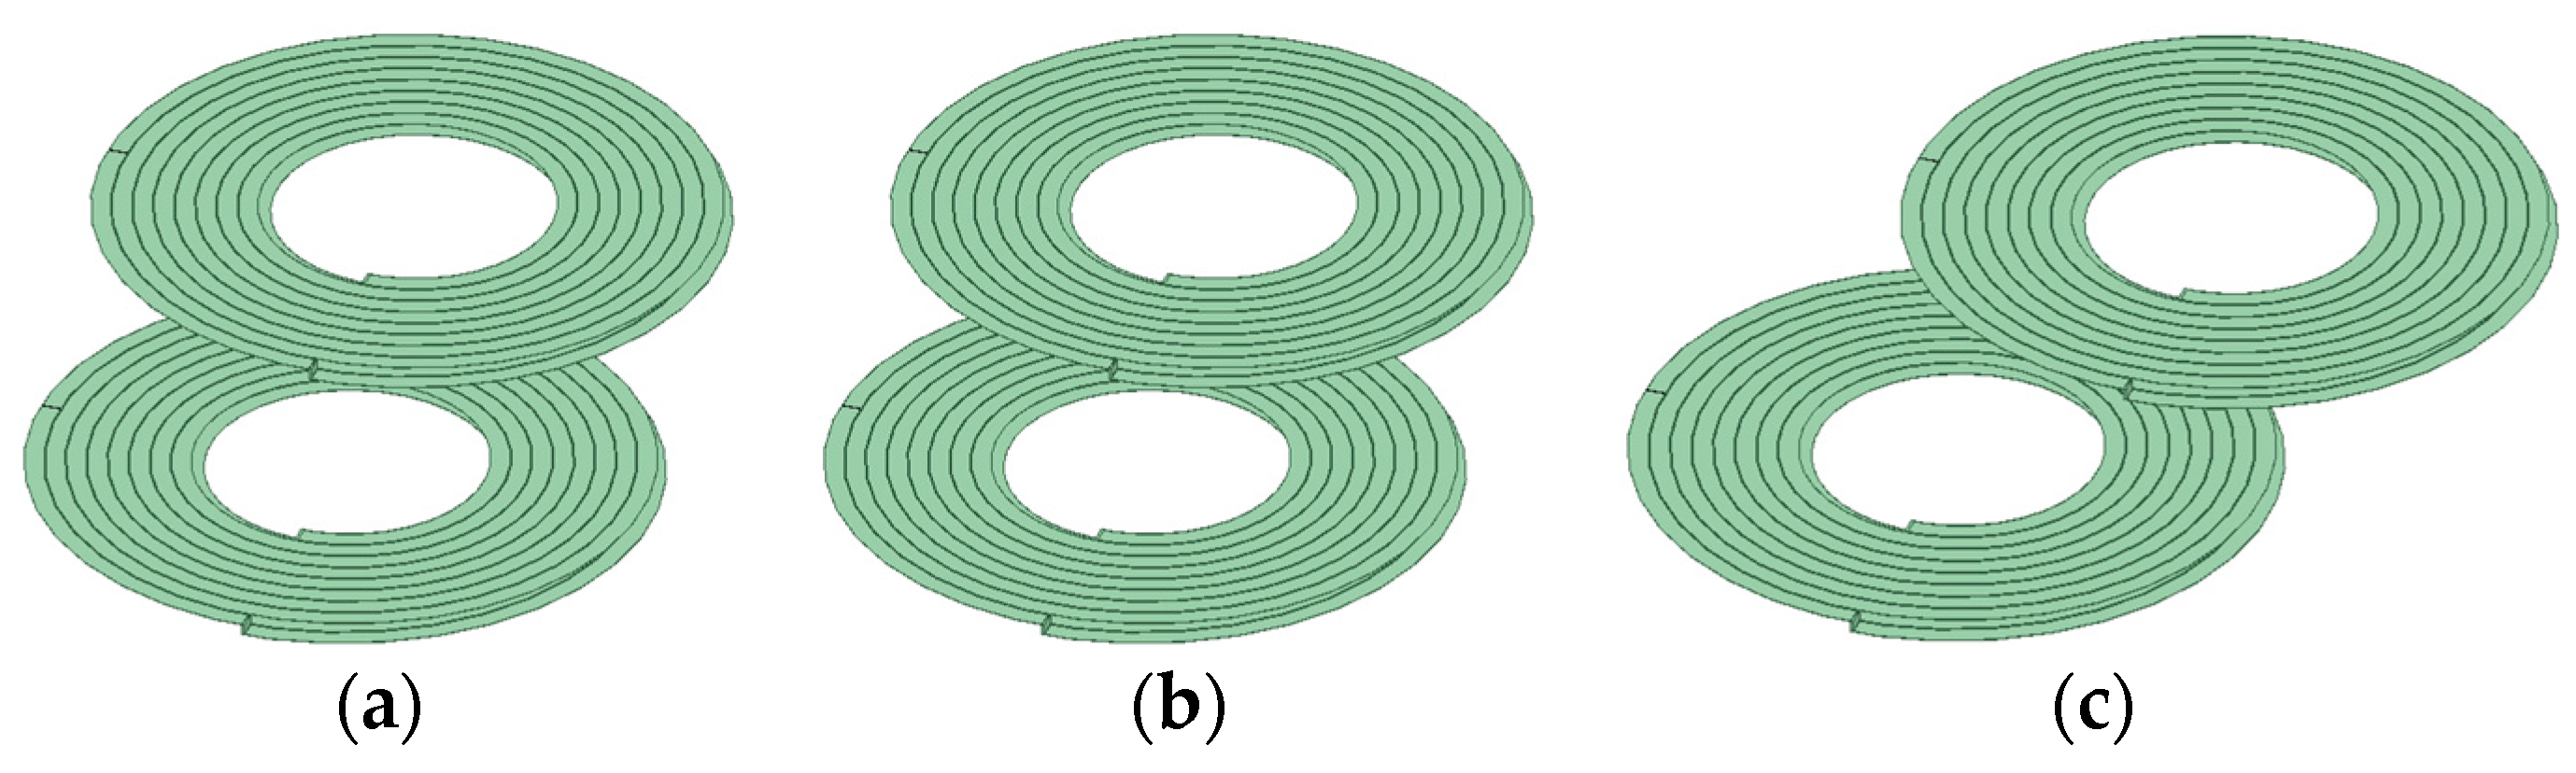
Figure 22.
Simulation data of coils with different parallel offset axes. (a) Coil coupling coefficient. (b) Coil strong coupling coefficient. (c) Coil transmission efficiency.
Figure 22.
Simulation data of coils with different parallel offset axes. (a) Coil coupling coefficient. (b) Coil strong coupling coefficient. (c) Coil transmission efficiency.
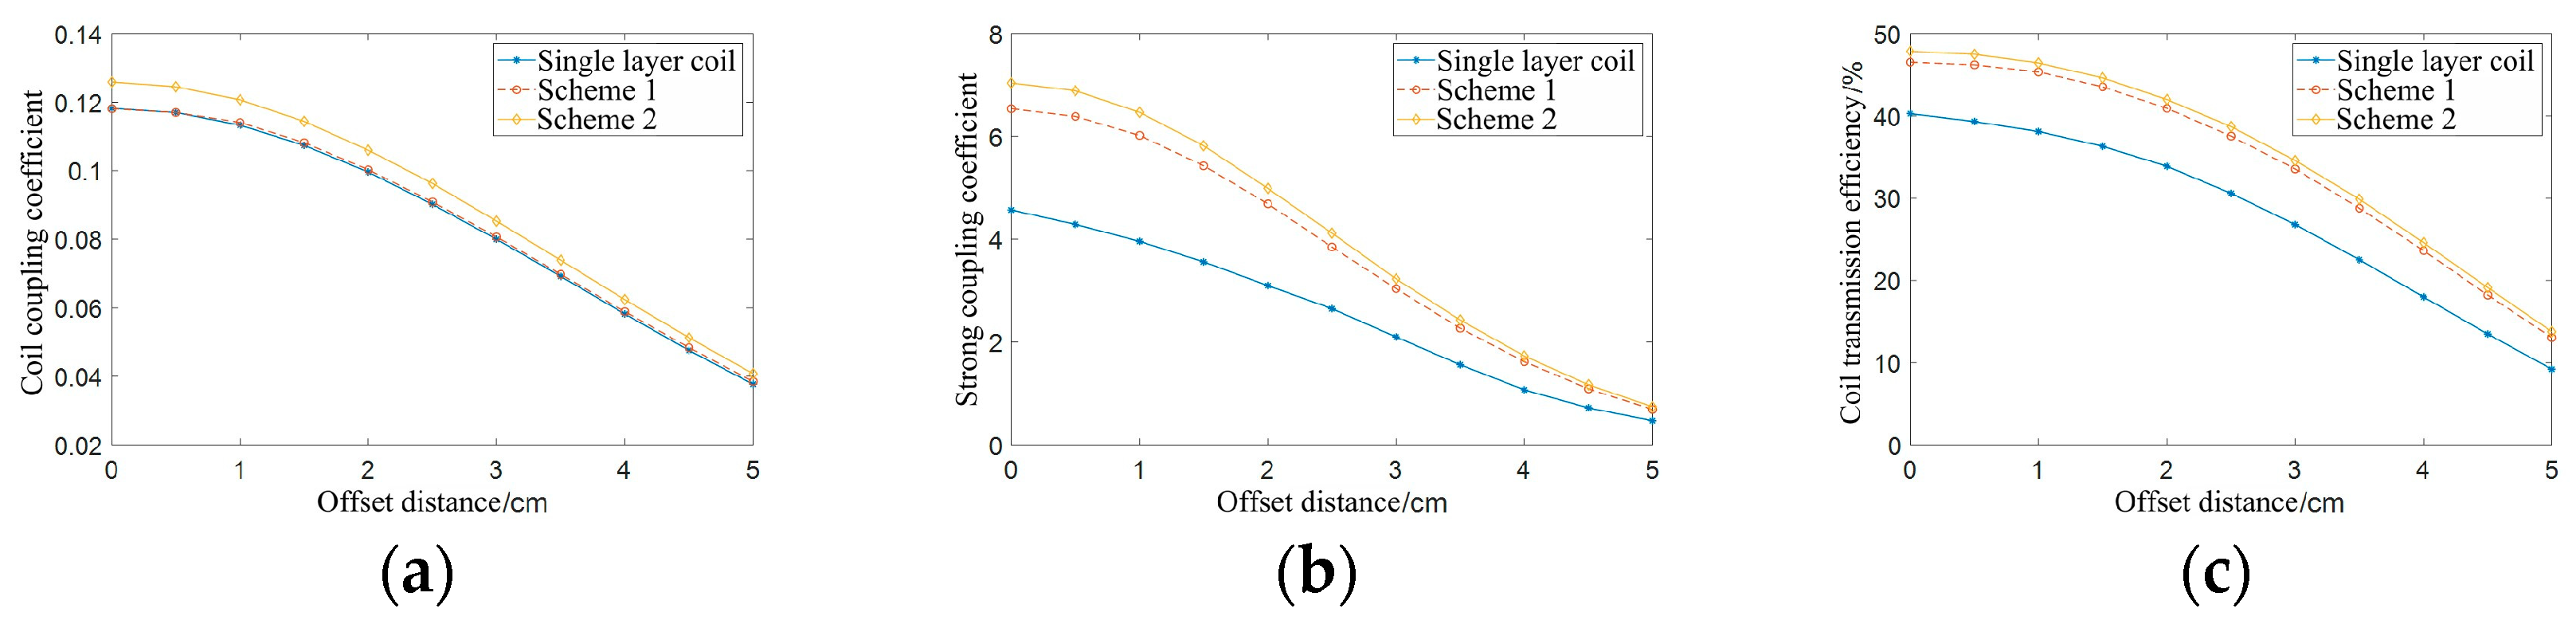
Figure 23.
Schematic figure of coil different axes parallel offset.
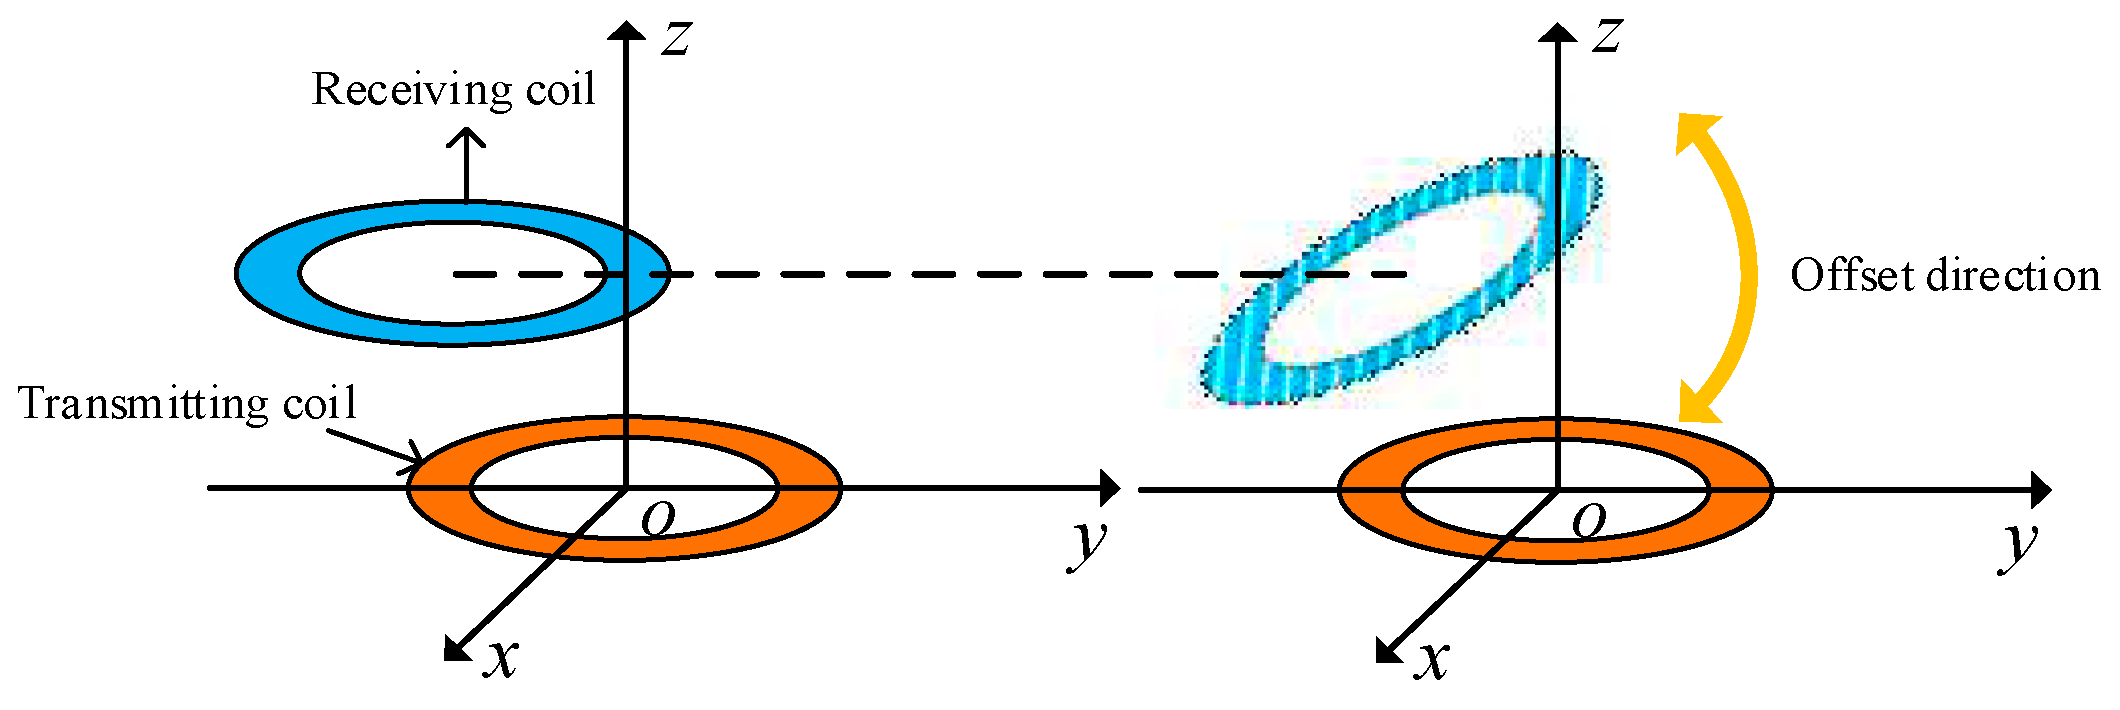
Figure 24.
Model figure of coil different axes nonparallel offset. (a) Offset 2 cm, angle 30 degrees. (b) Offset 2 cm, angle 60 degrees. (c) Offset 4 cm, angle 30 degrees.
Figure 24.
Model figure of coil different axes nonparallel offset. (a) Offset 2 cm, angle 30 degrees. (b) Offset 2 cm, angle 60 degrees. (c) Offset 4 cm, angle 30 degrees.
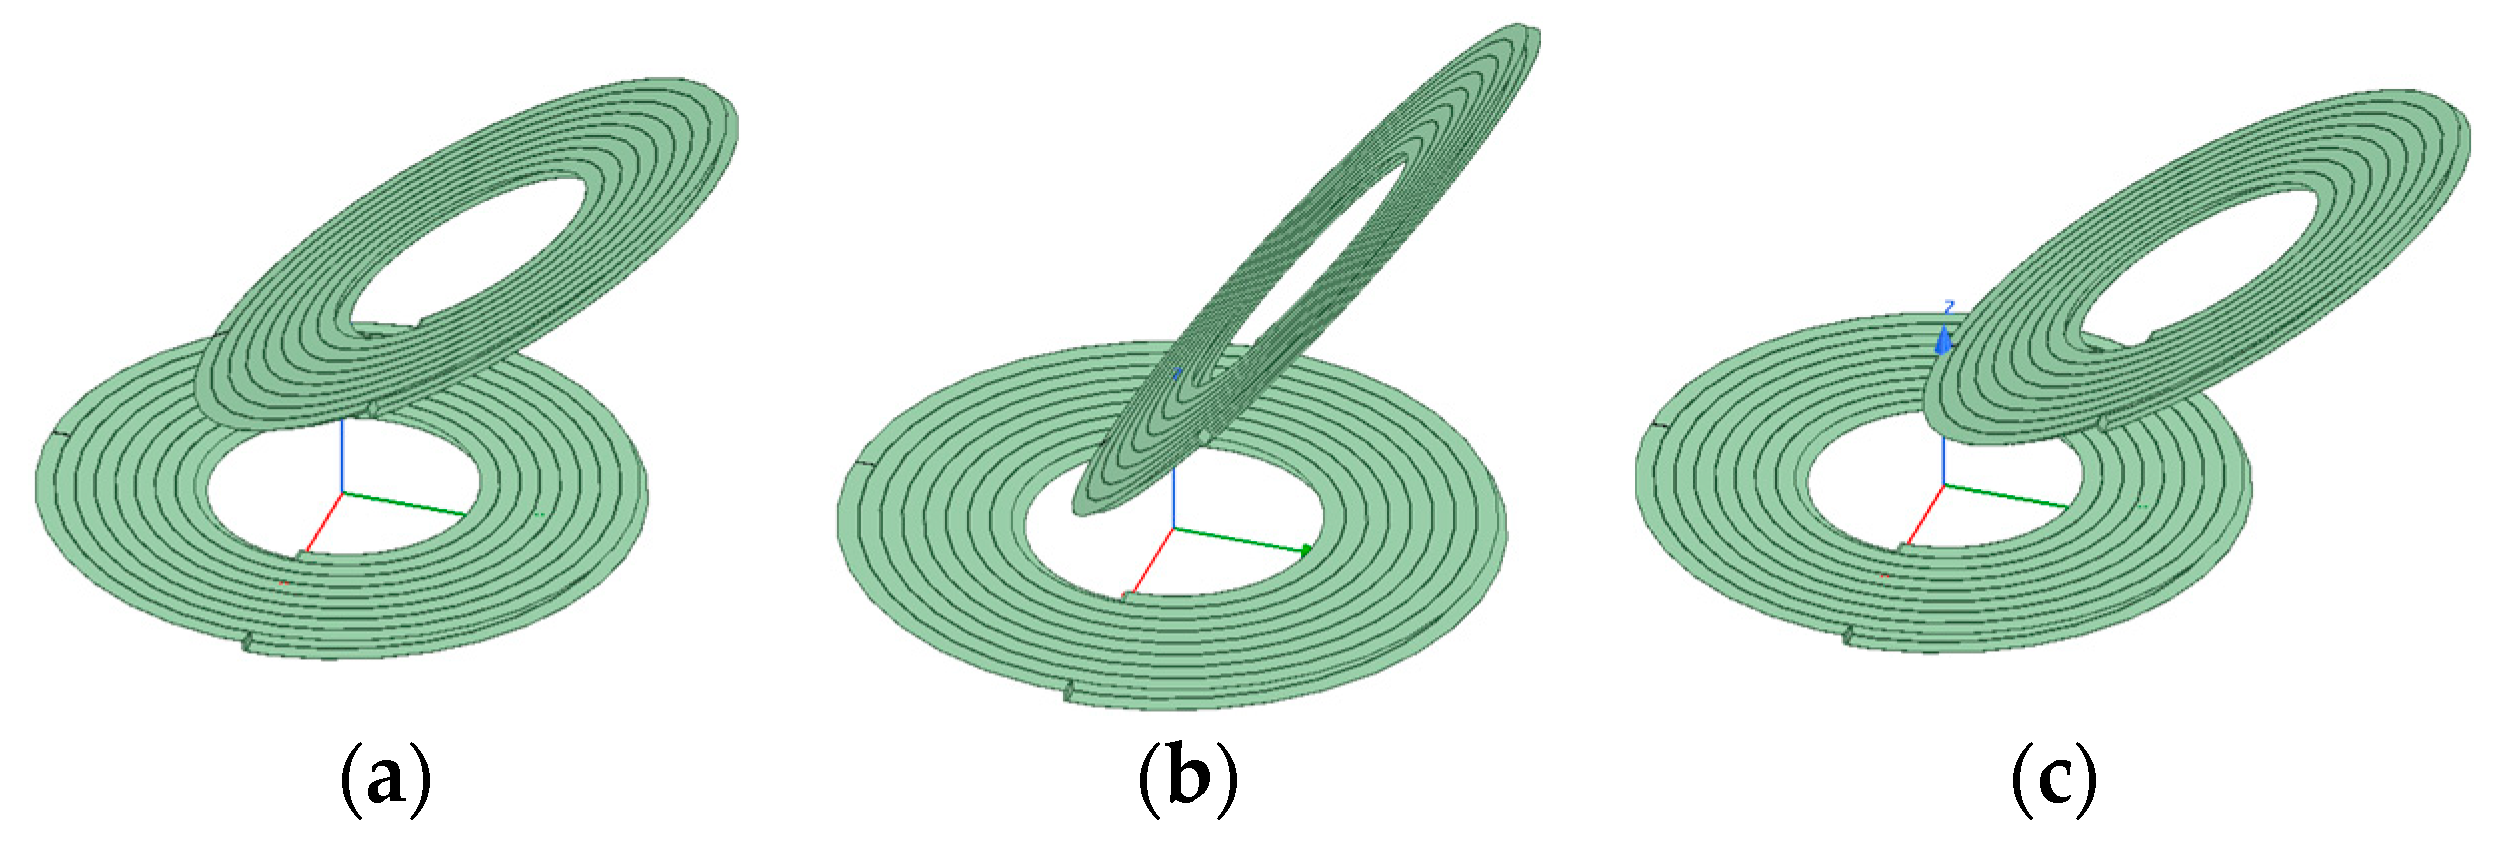
Figure 25.
Simulation data of coils with different nonparallel offset axes. (a) Coil coupling coefficient. (b) Coil strong coupling coefficient. (c) Coil transmission efficiency. (d) Comparison of strong coupling coefficients at different offset angles under the condition of a 1 cm offset distance.
Figure 25.
Simulation data of coils with different nonparallel offset axes. (a) Coil coupling coefficient. (b) Coil strong coupling coefficient. (c) Coil transmission efficiency. (d) Comparison of strong coupling coefficients at different offset angles under the condition of a 1 cm offset distance.
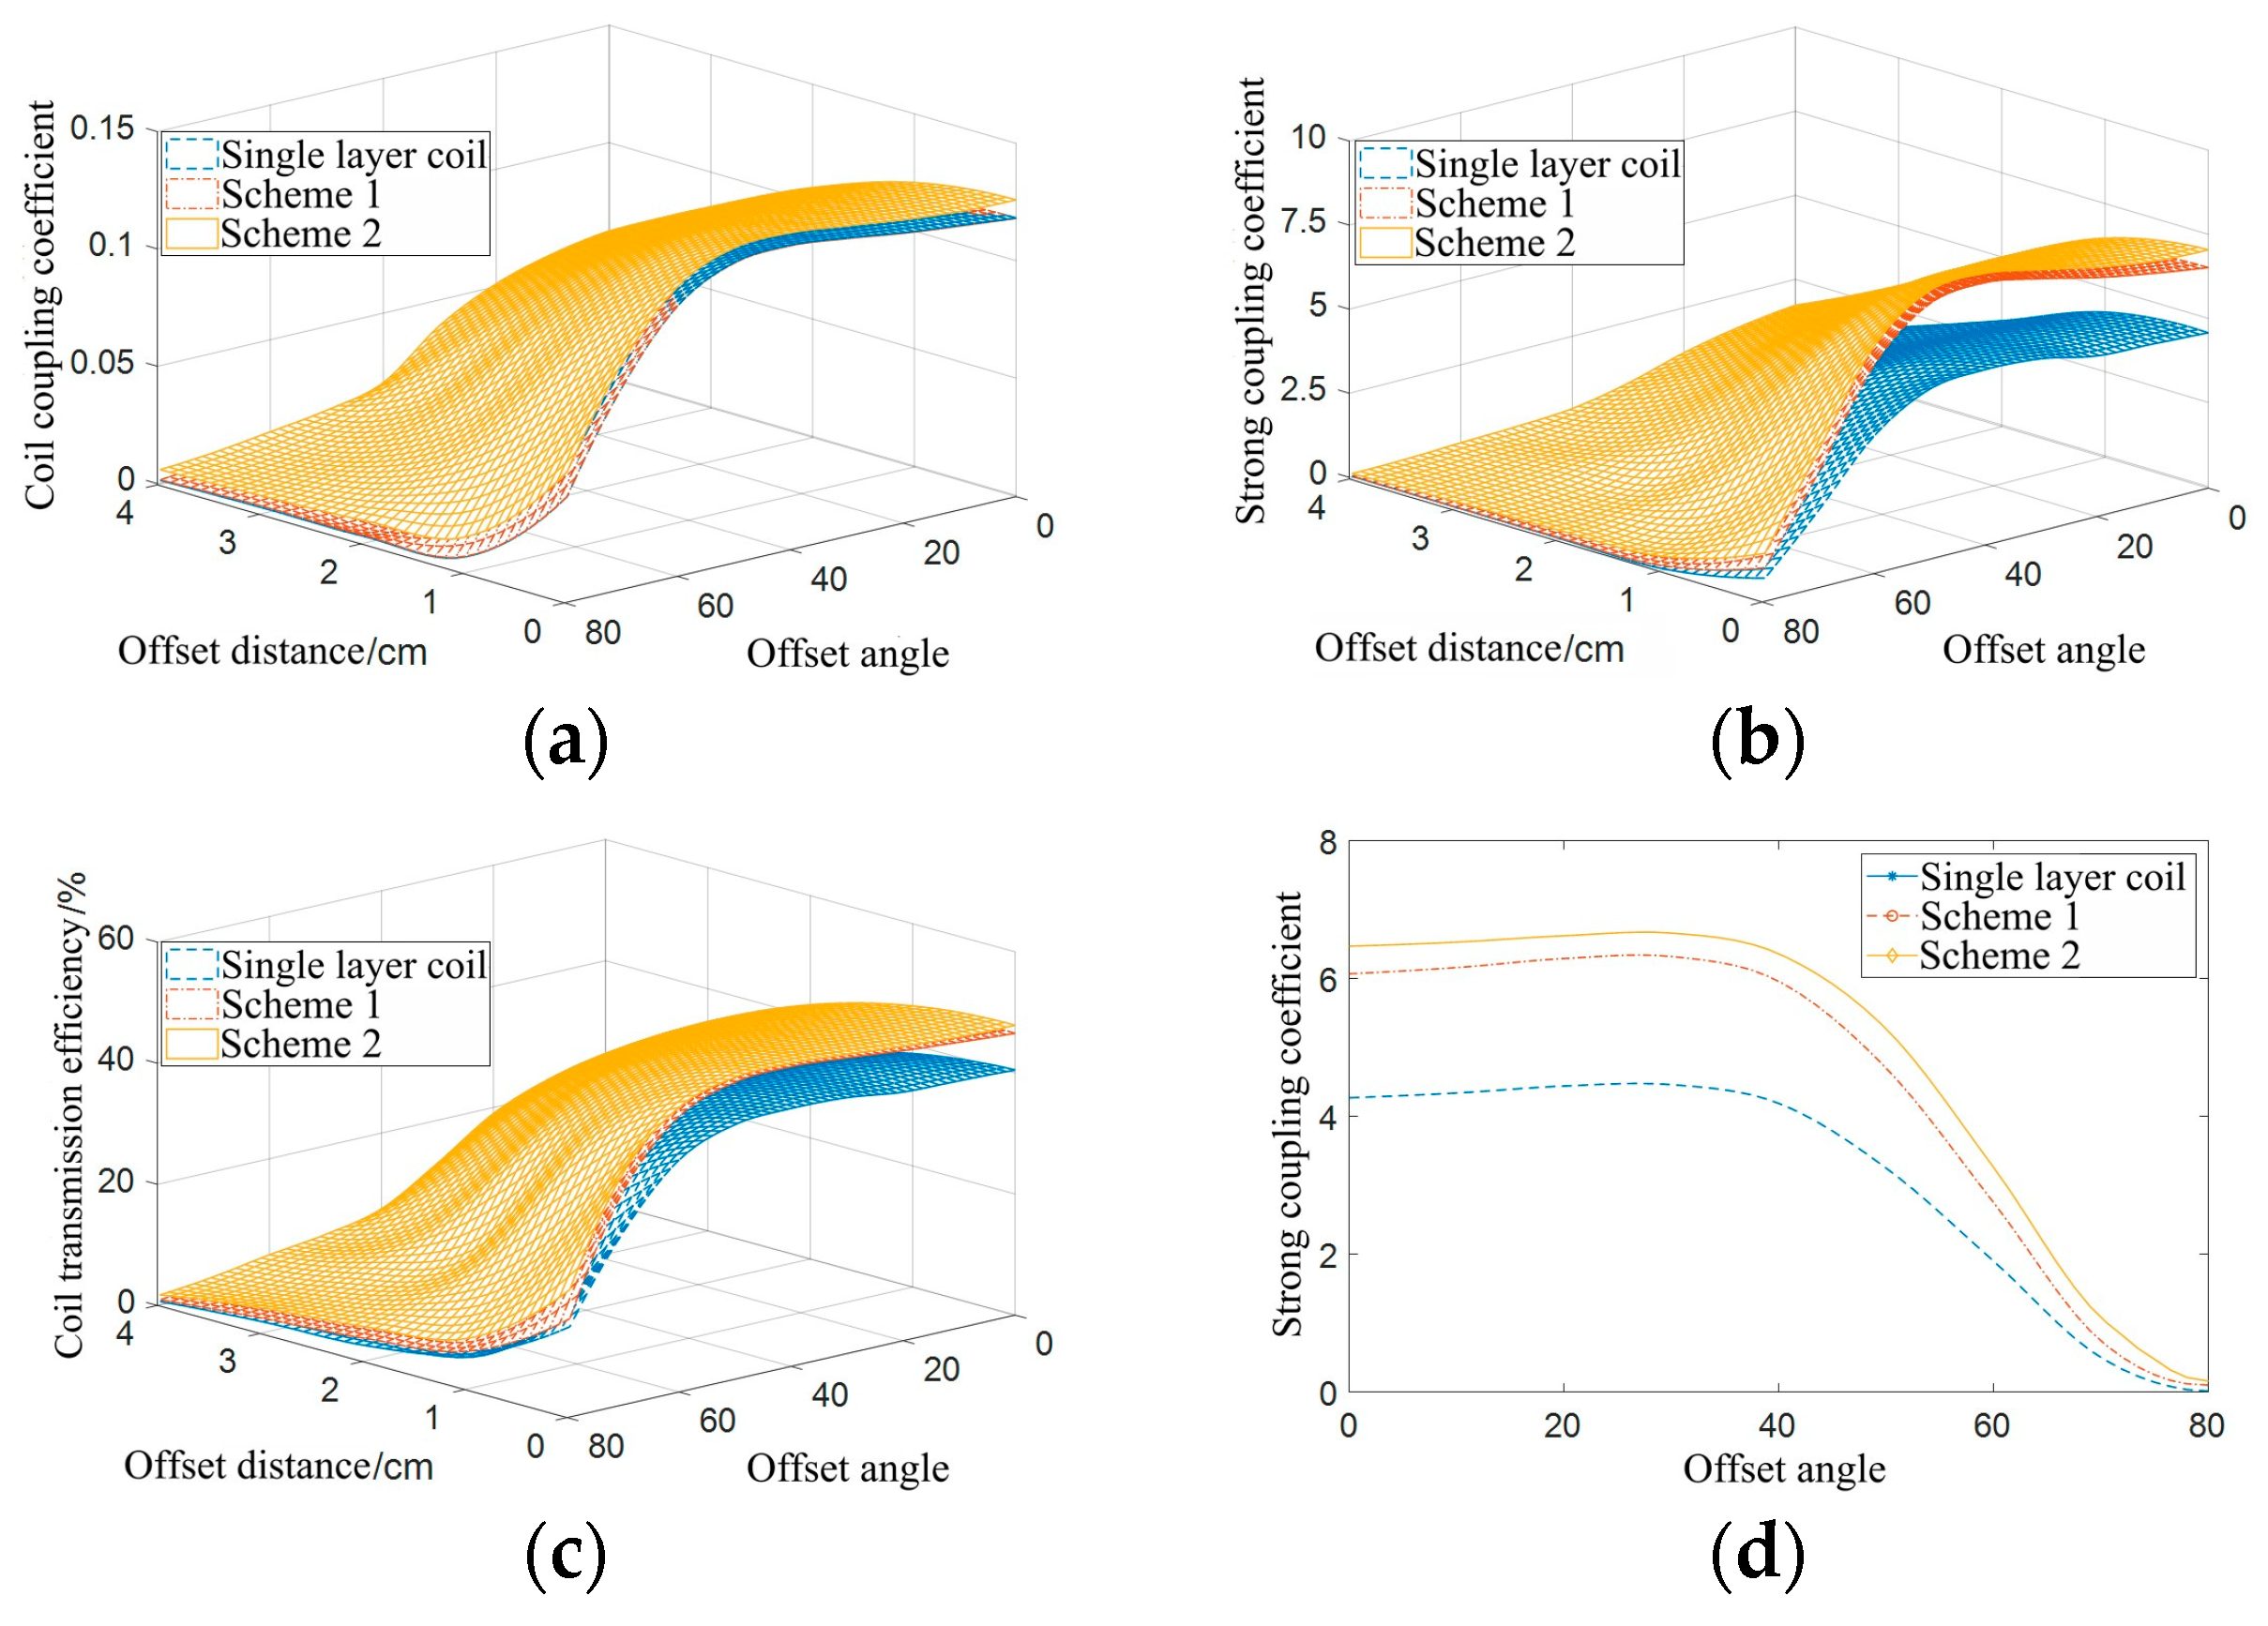
Figure 26.
Physical figure of a single-layer coil. (a) Coil 1. (b) Coil 2. (c) Coil 3. (d) Coil 4. (e) Coil 5. (f) Coil 6. (g) Coil 7. (h) Coil 8. (h) Coil 9.
Figure 26.
Physical figure of a single-layer coil. (a) Coil 1. (b) Coil 2. (c) Coil 3. (d) Coil 4. (e) Coil 5. (f) Coil 6. (g) Coil 7. (h) Coil 8. (h) Coil 9.
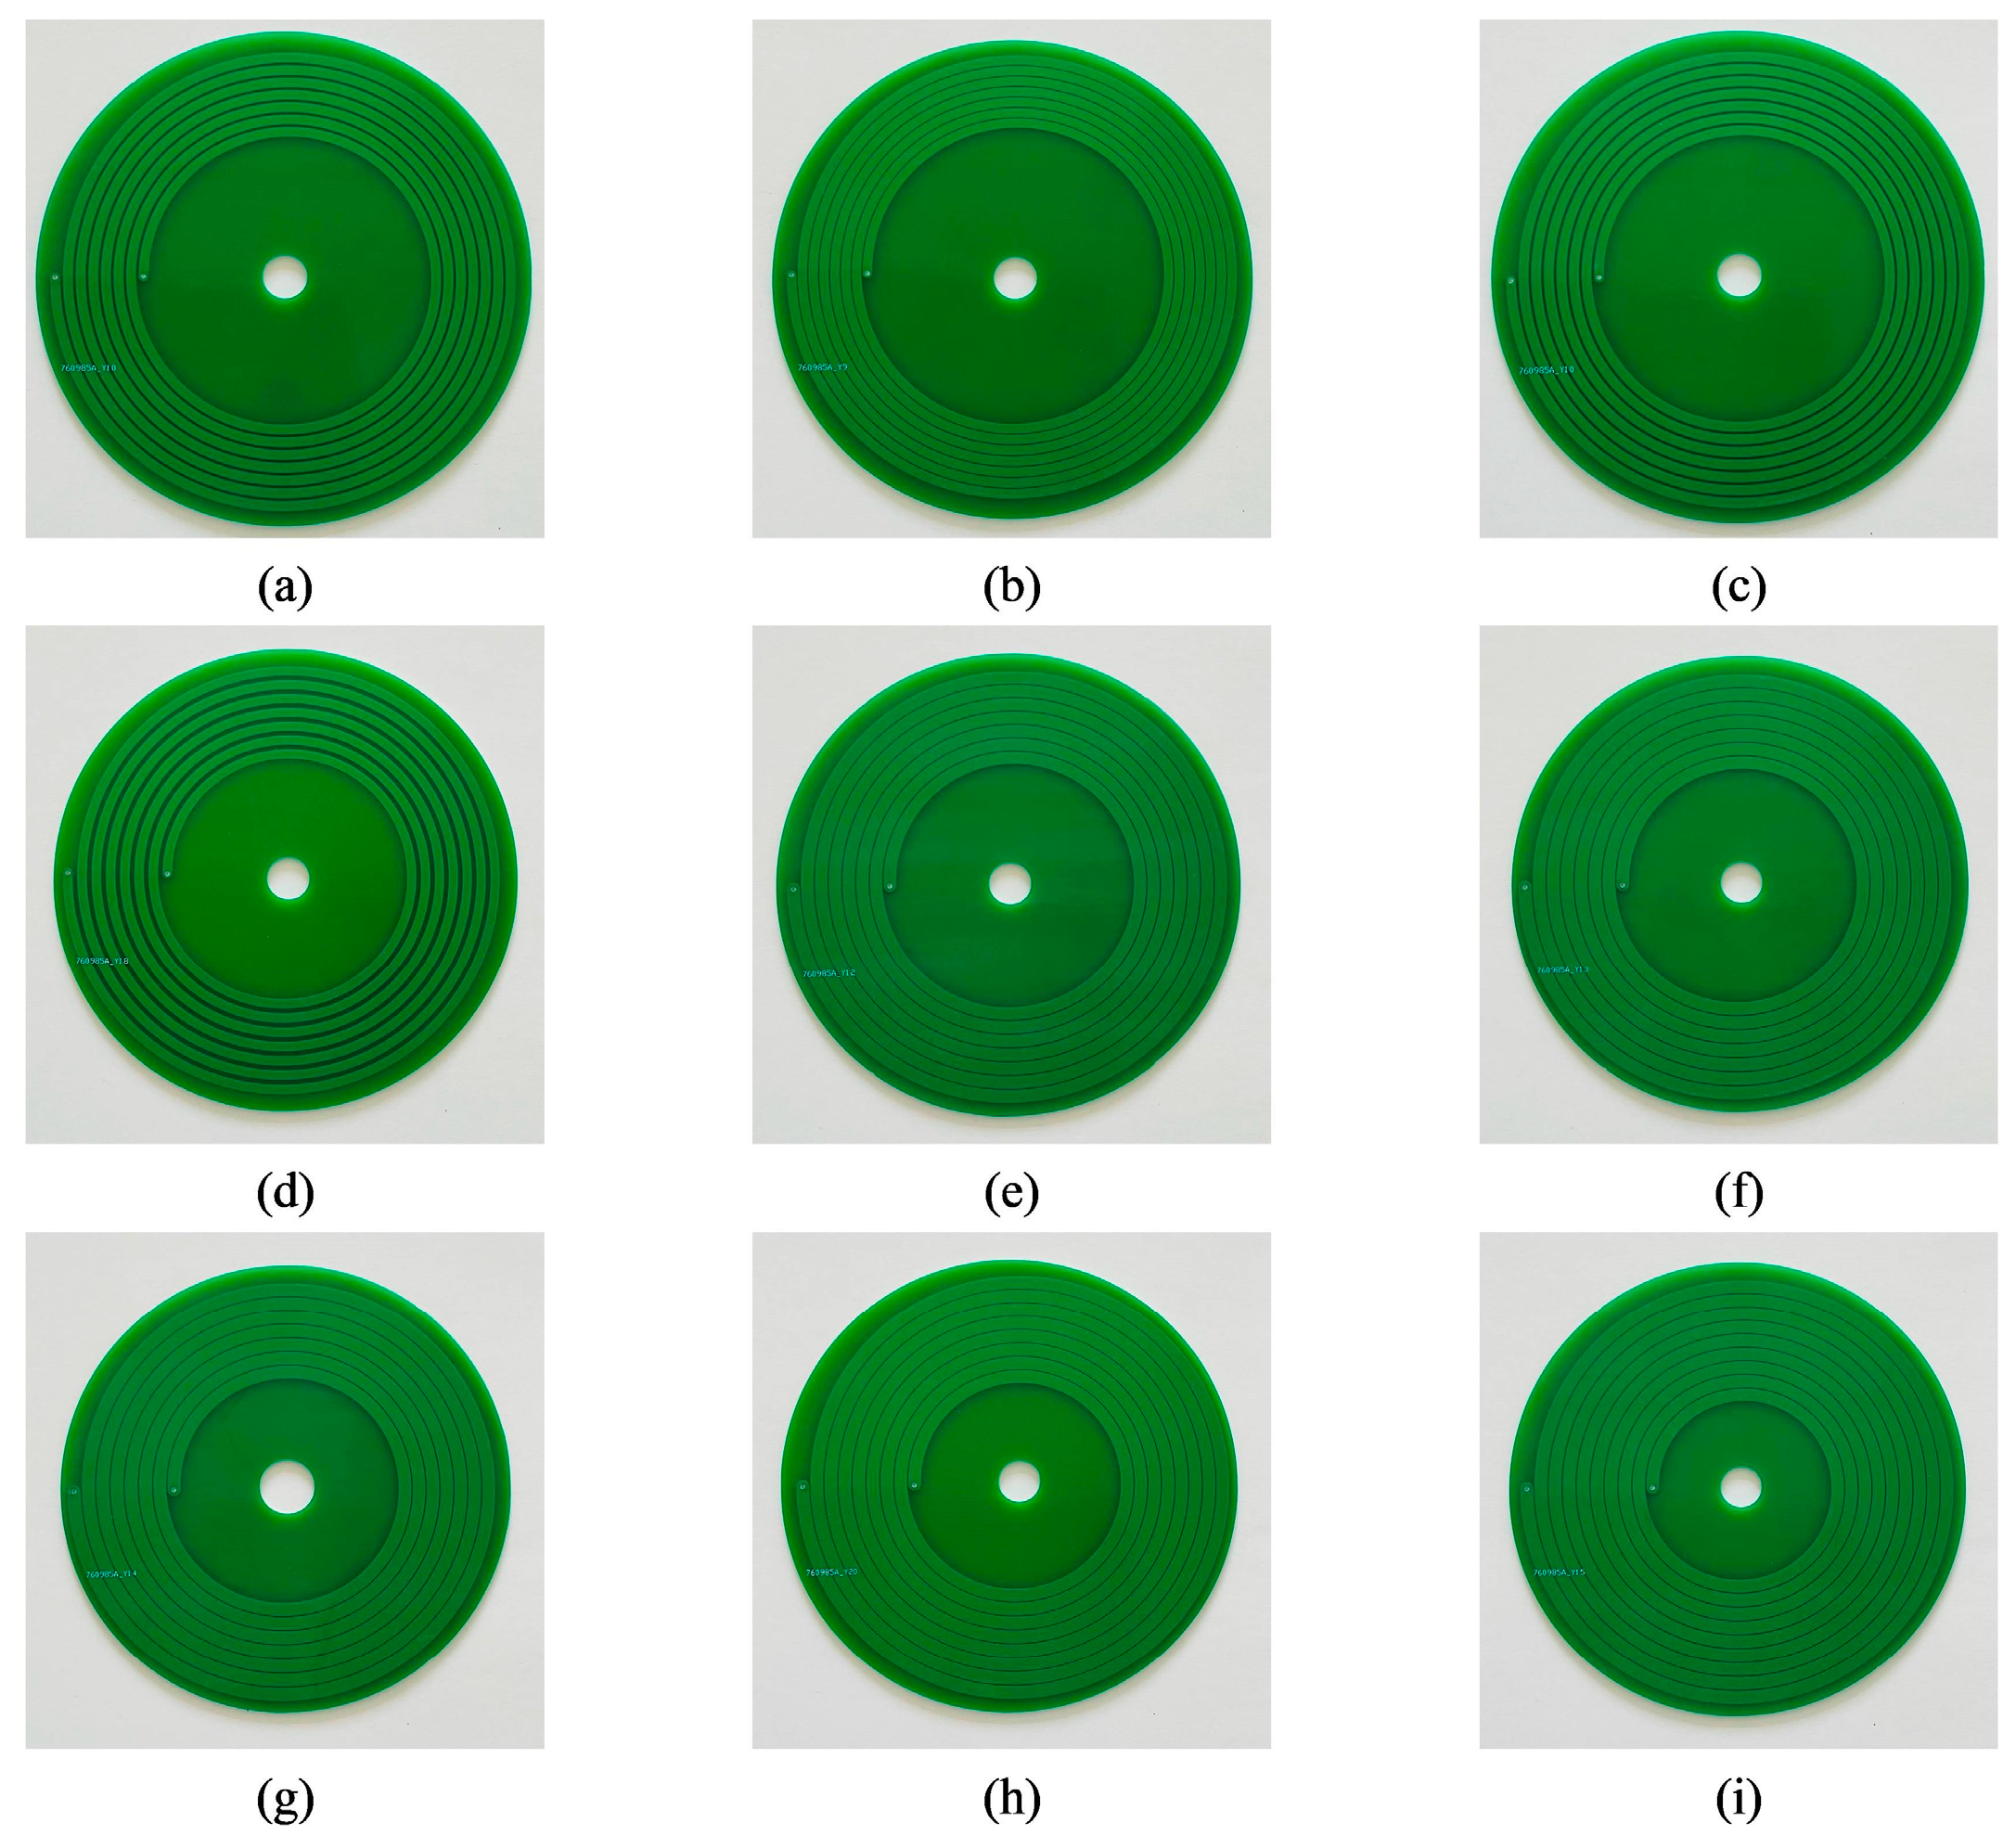
Figure 28.
Experimental platform for coil parameter measurement. (a) Self-inductance measurement. (b) Mutual inductance measurement.
Figure 28.
Experimental platform for coil parameter measurement. (a) Self-inductance measurement. (b) Mutual inductance measurement.
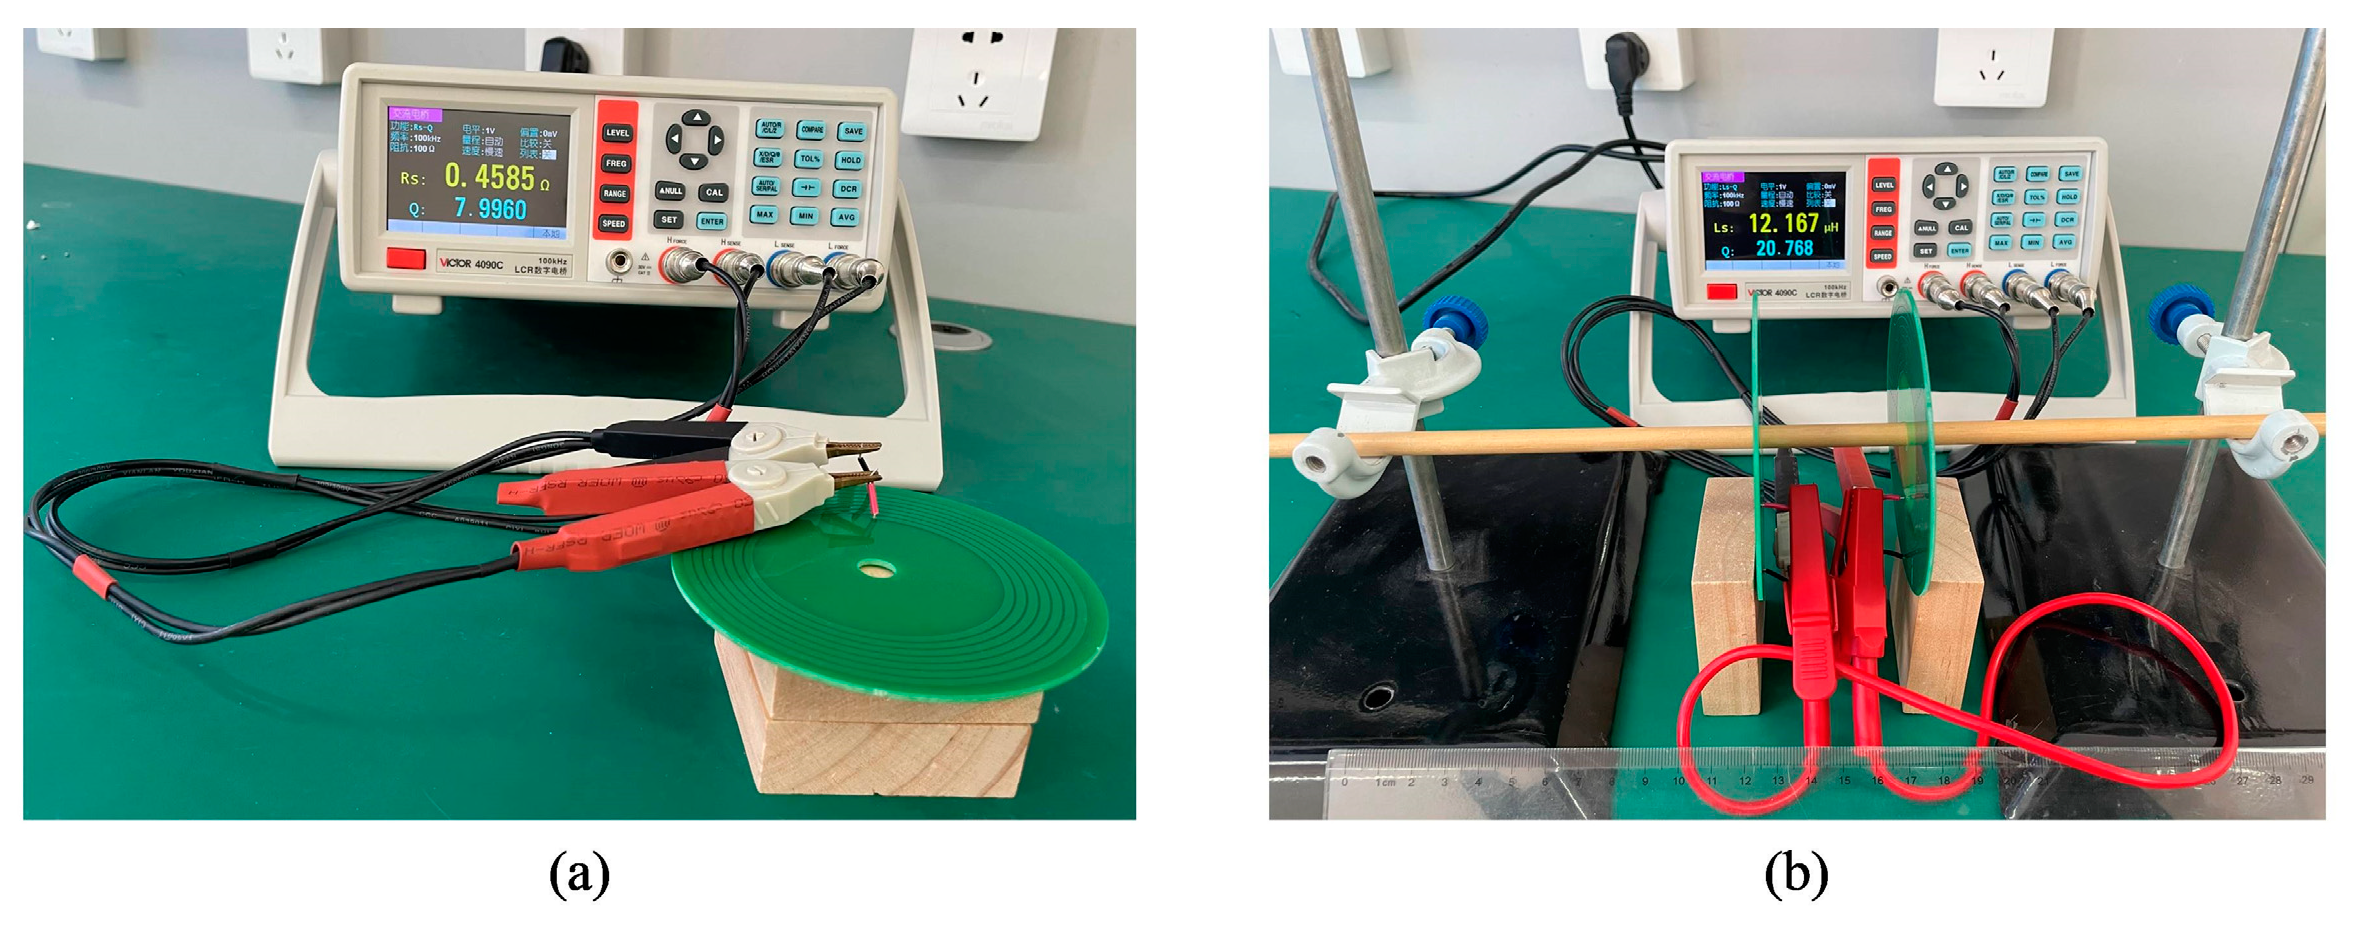
Figure 29.
Simulation data and measurement calculation data of the strong coupling coefficient for coil offset. (a) Coaxial parallel offset. (b) Coaxial nonparallel offset. (c) Parallel offset of different axes. (d) Different axes are not parallel offset.
Figure 29.
Simulation data and measurement calculation data of the strong coupling coefficient for coil offset. (a) Coaxial parallel offset. (b) Coaxial nonparallel offset. (c) Parallel offset of different axes. (d) Different axes are not parallel offset.
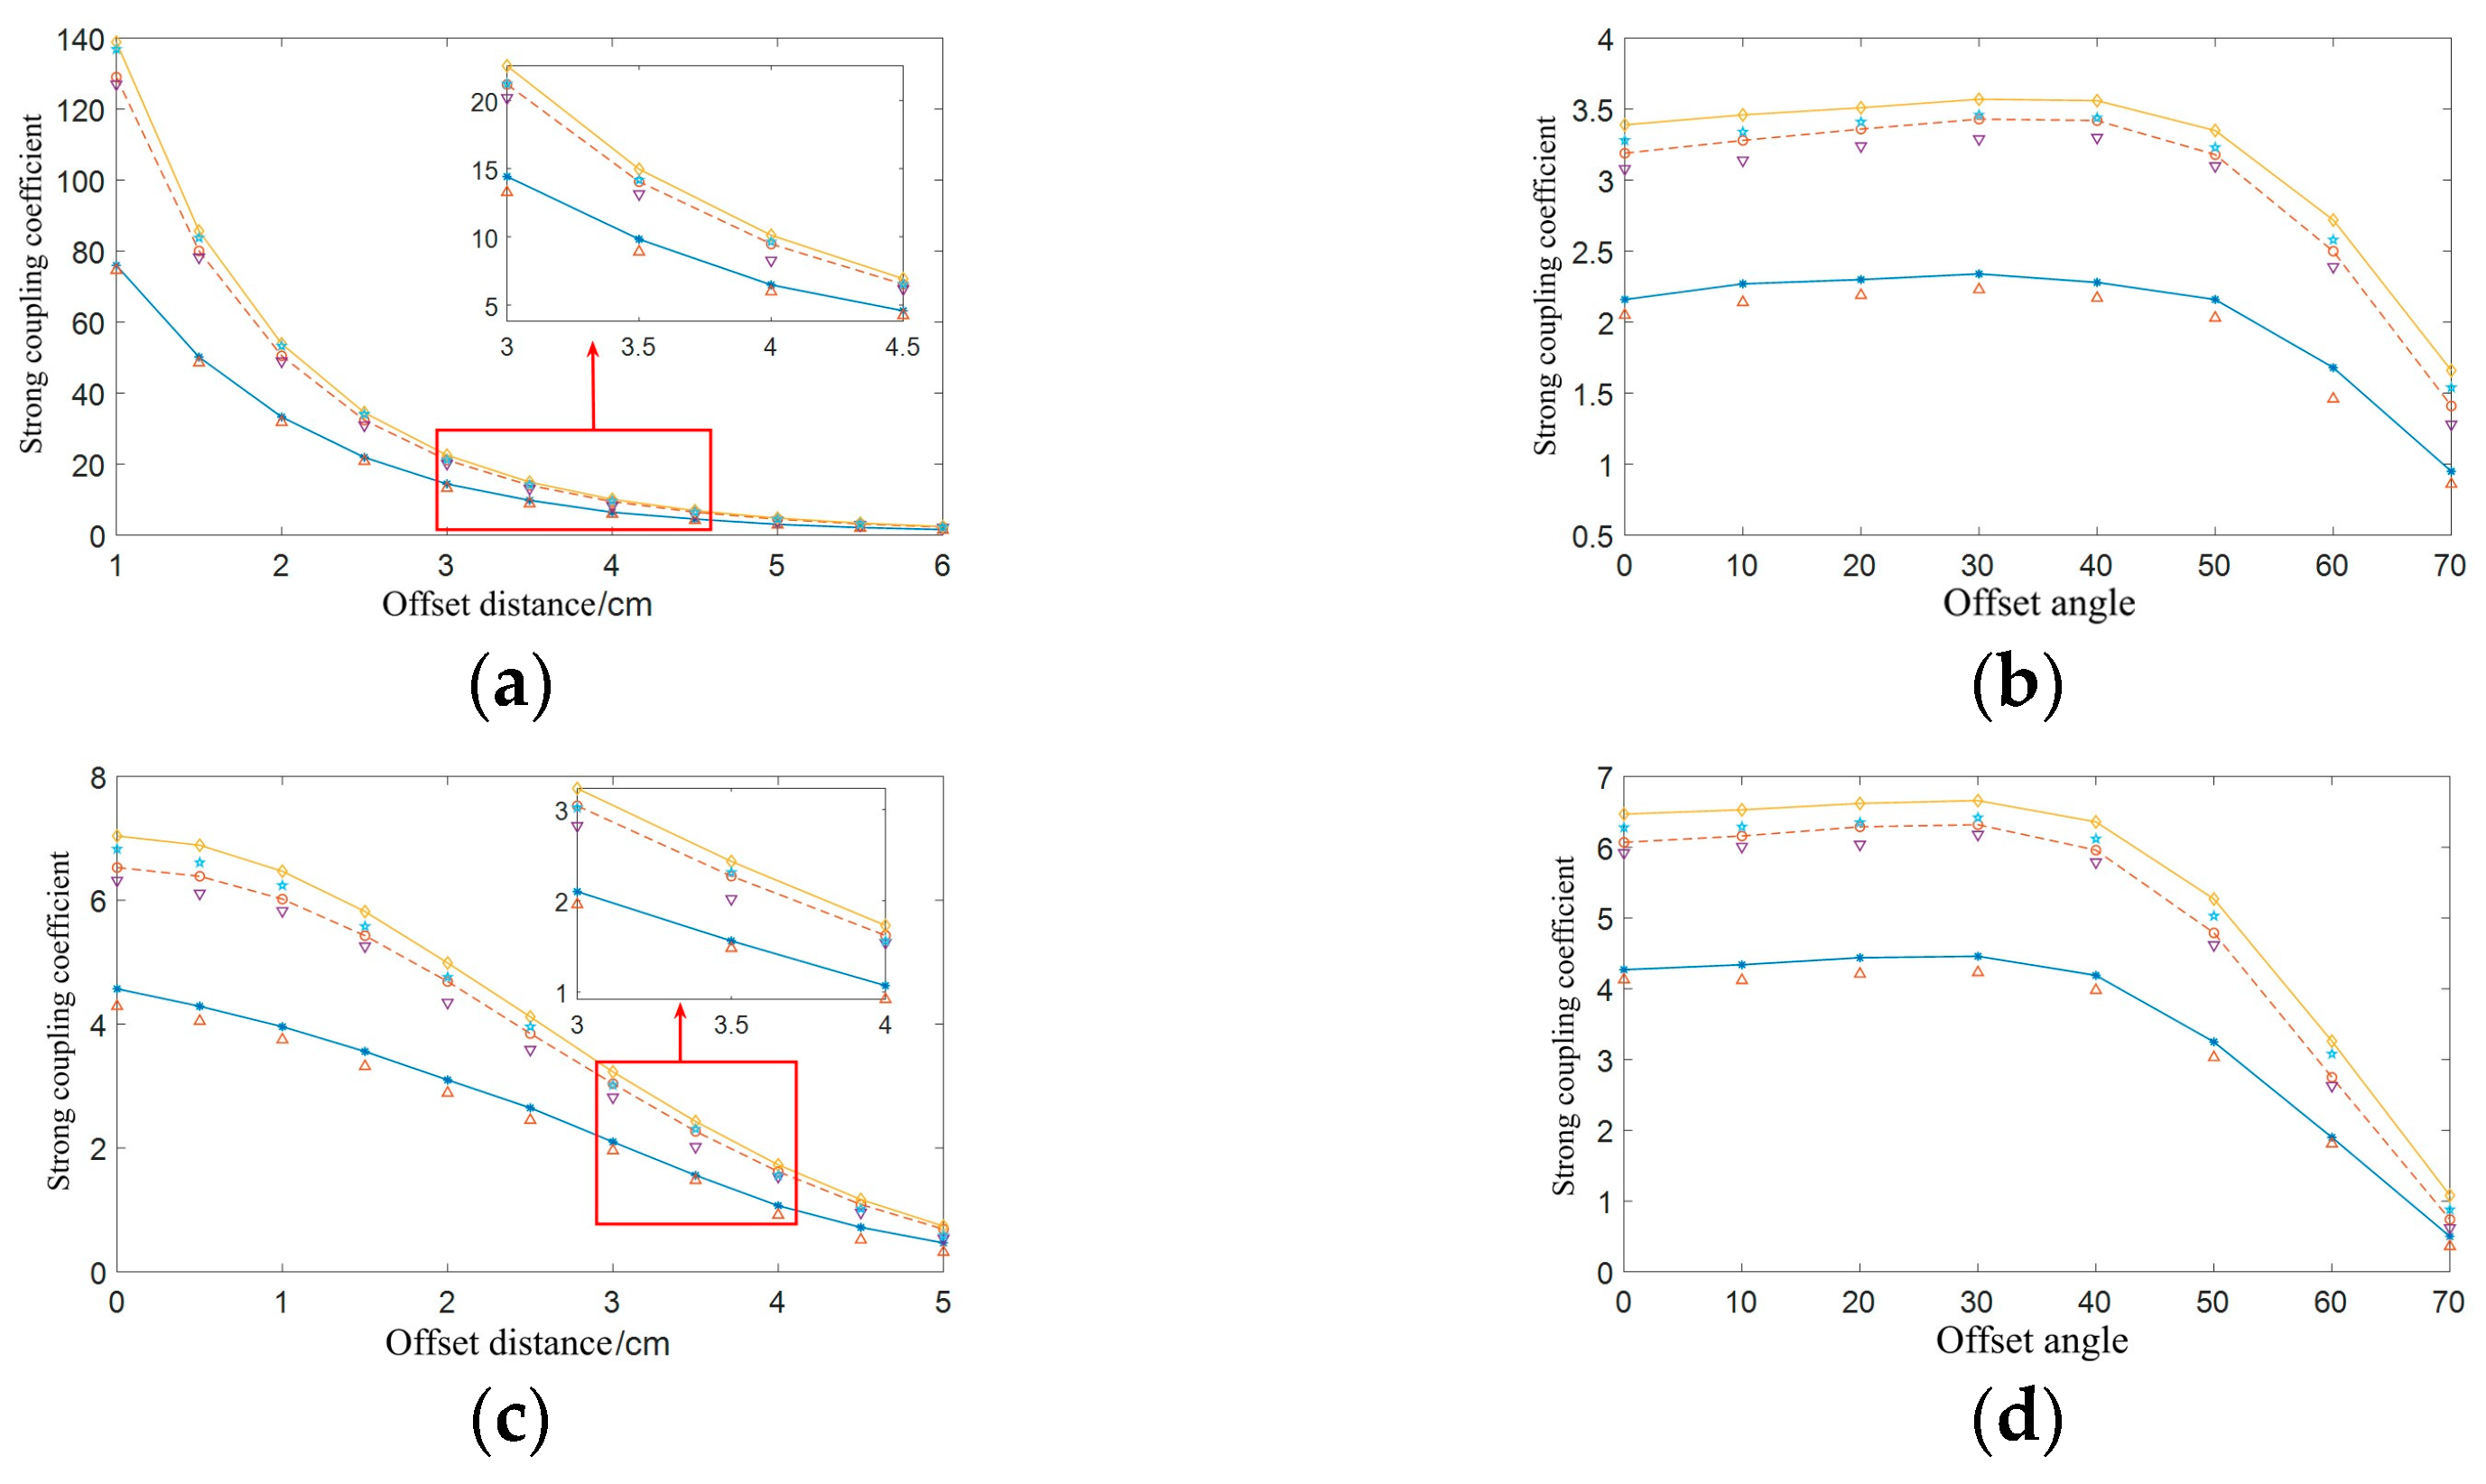

Figure 30.
Wireless power transfer system experimental platform.
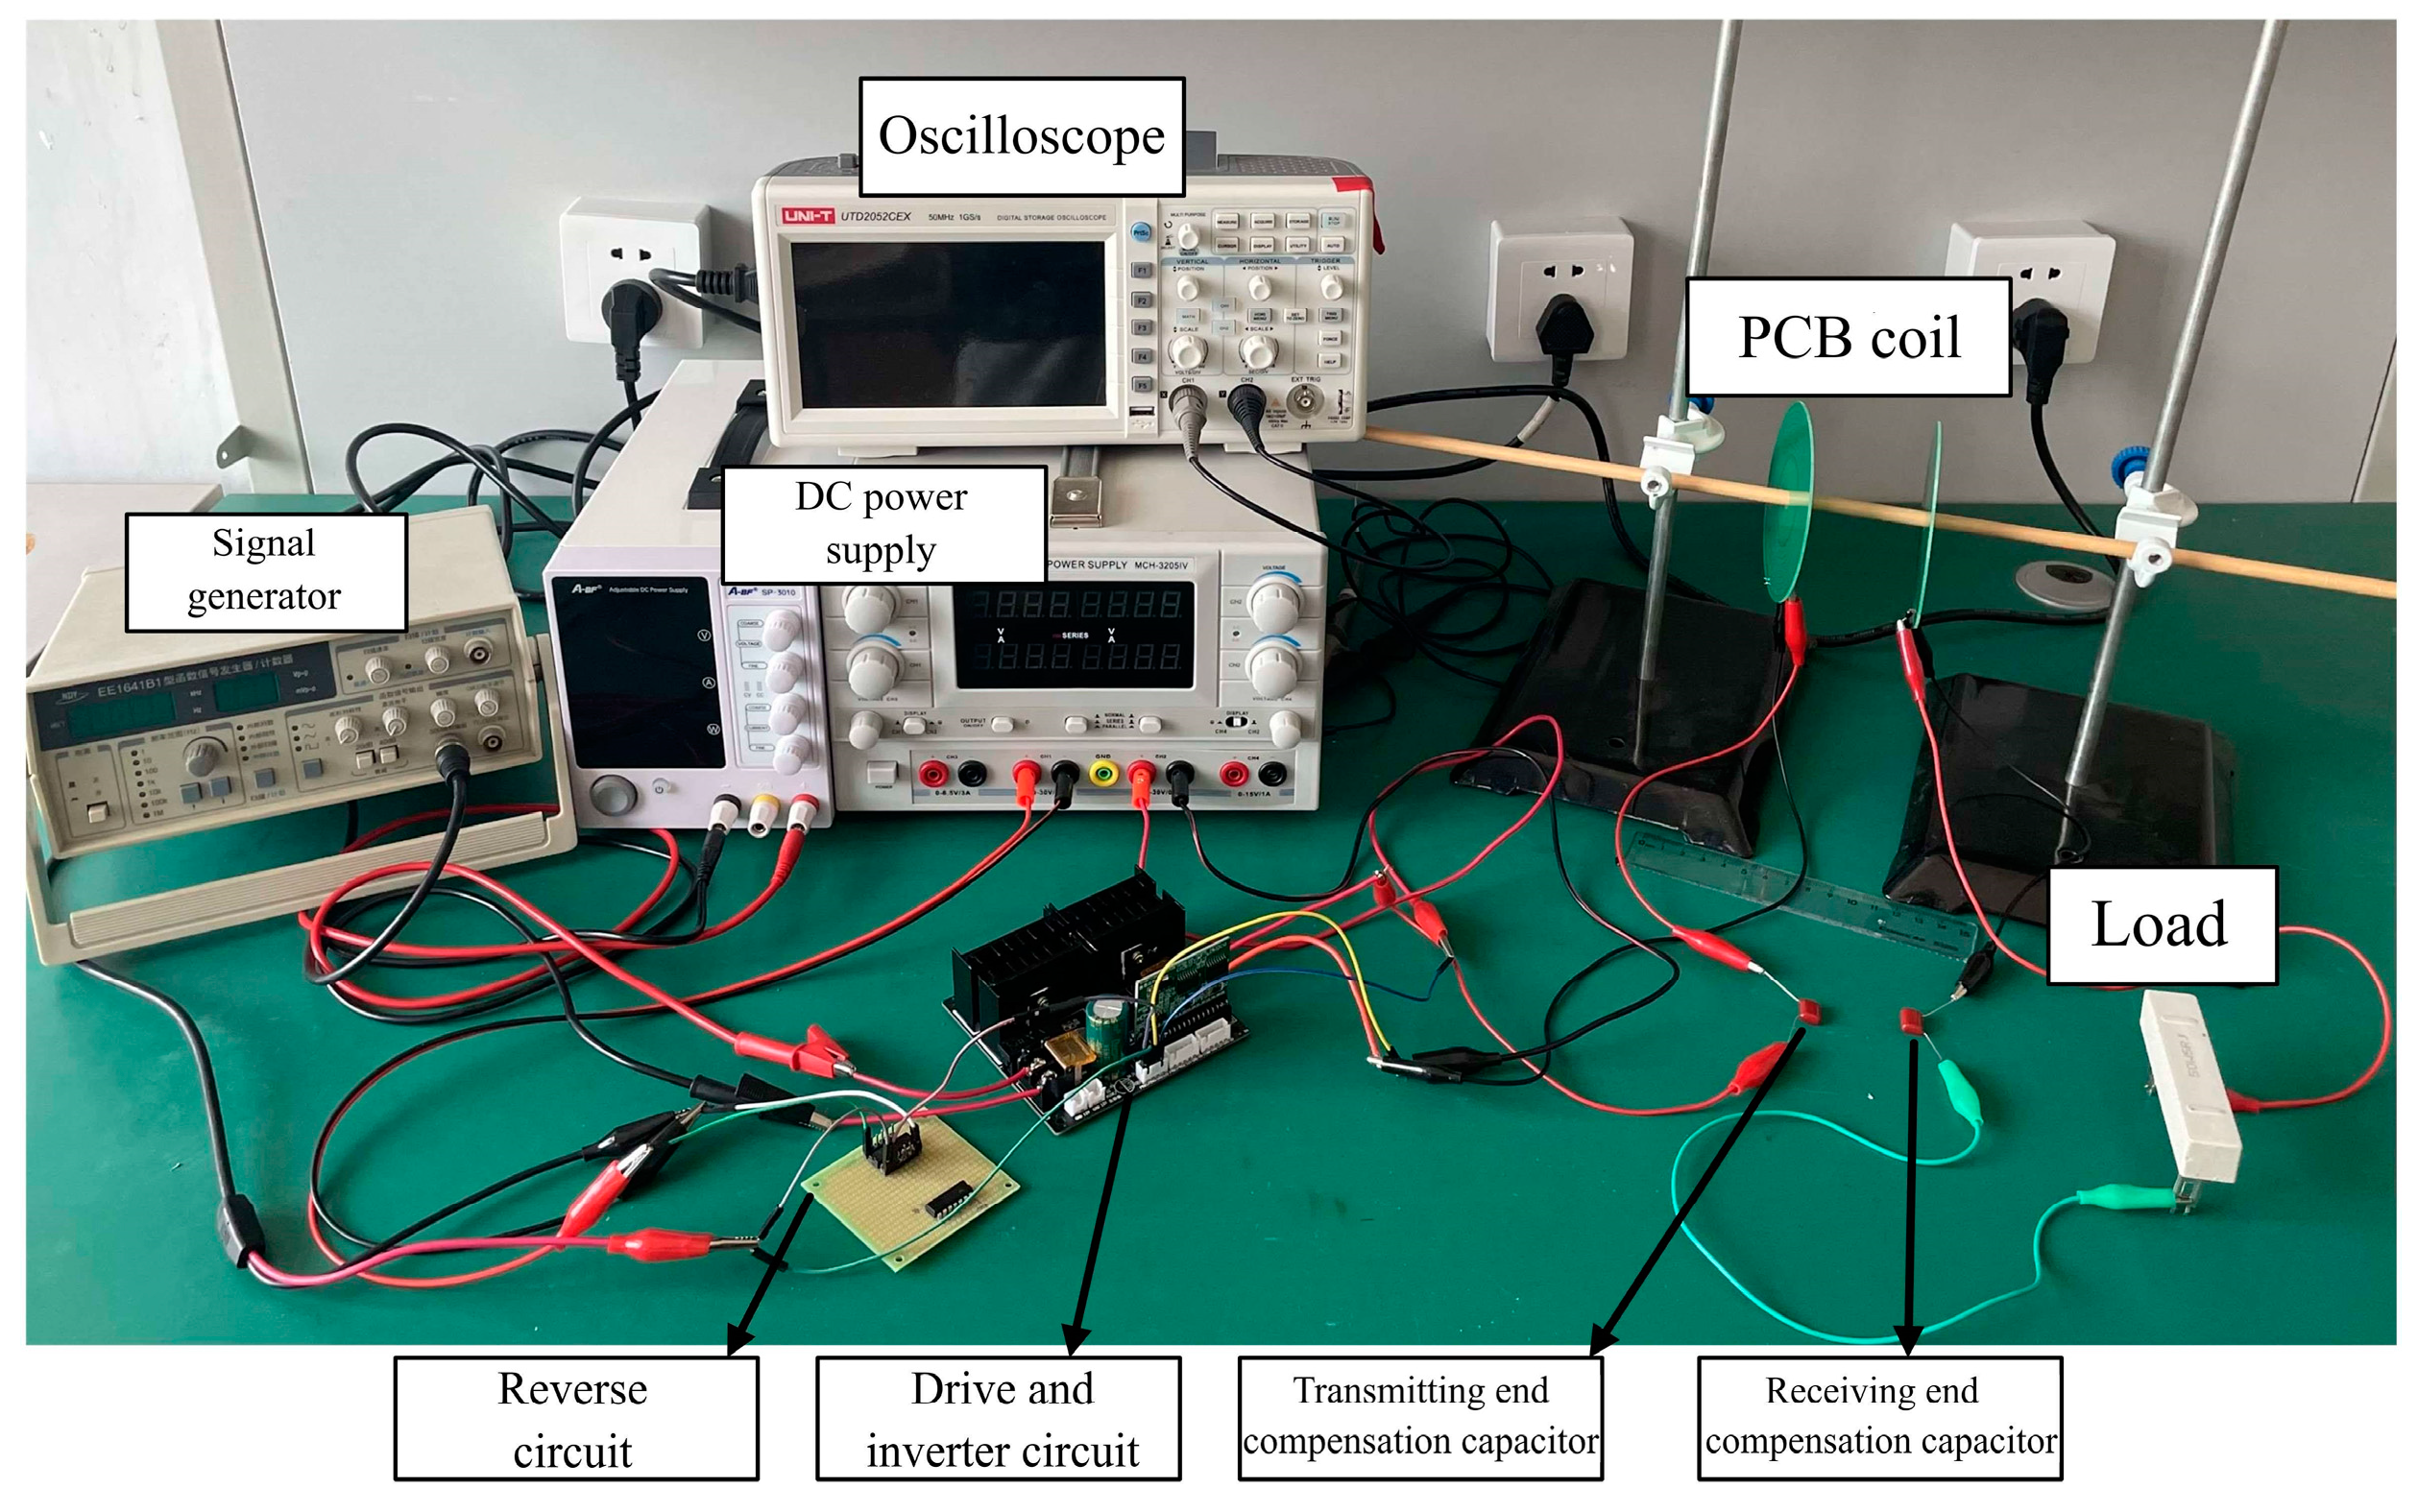
Figure 31.
Oscilloscope-measured waveform. (a) Voltage and current waveforms at the transmitting end (b) Load voltage and current waveform at the receiving end.
Figure 31.
Oscilloscope-measured waveform. (a) Voltage and current waveforms at the transmitting end (b) Load voltage and current waveform at the receiving end.
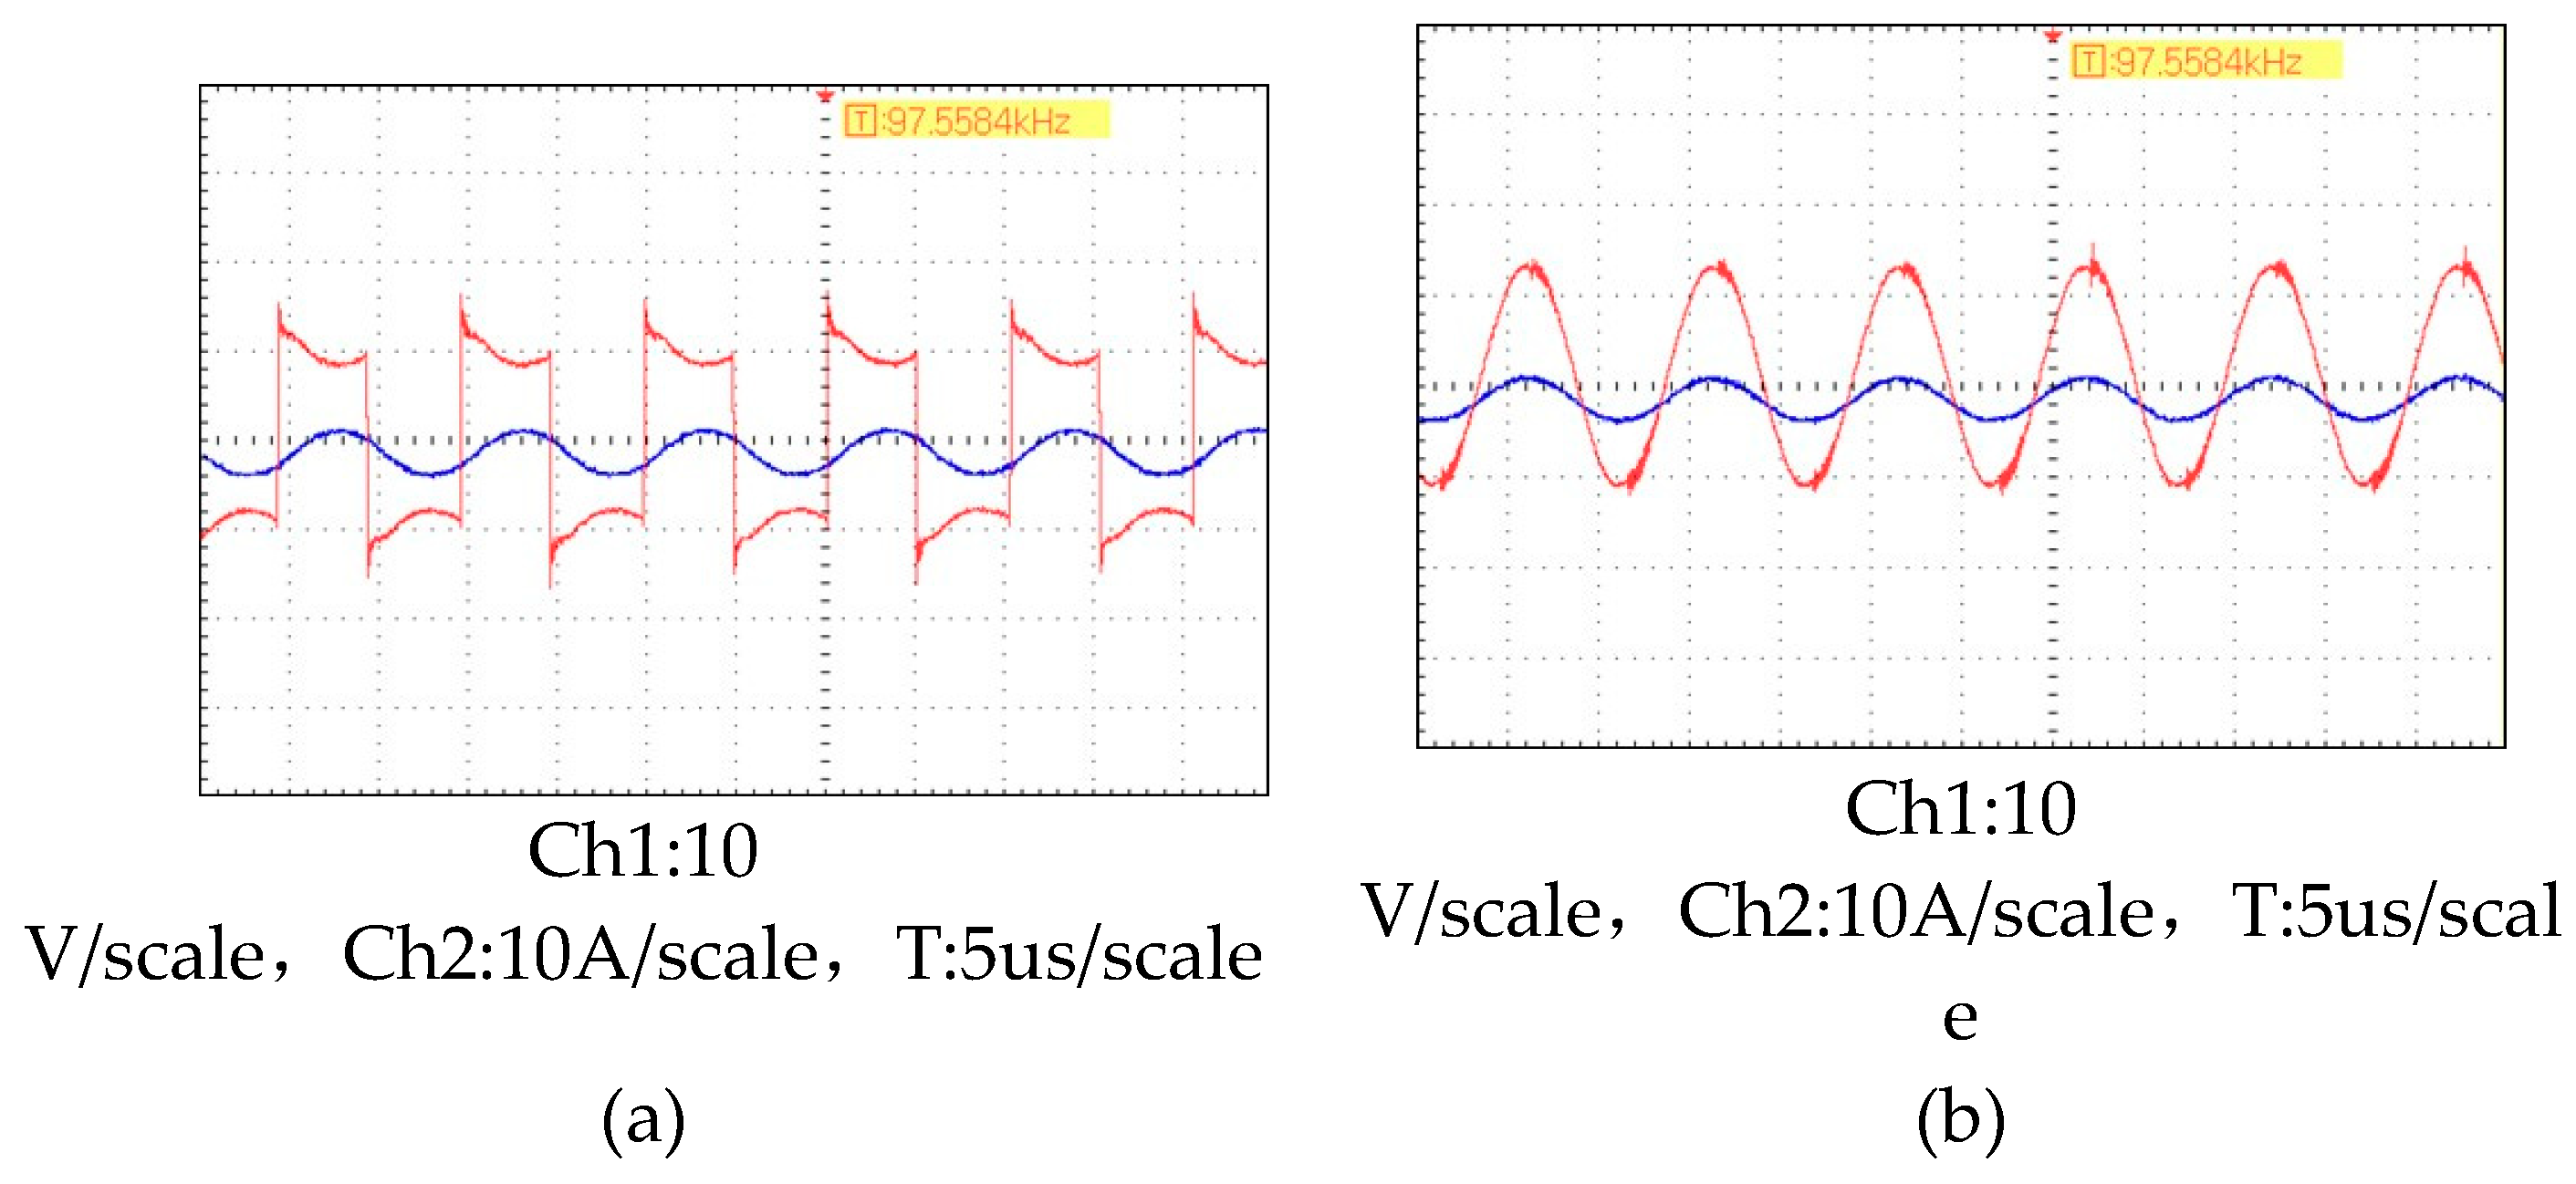
Figure 32.
Simulation and experimental data on coil transmission efficiency.
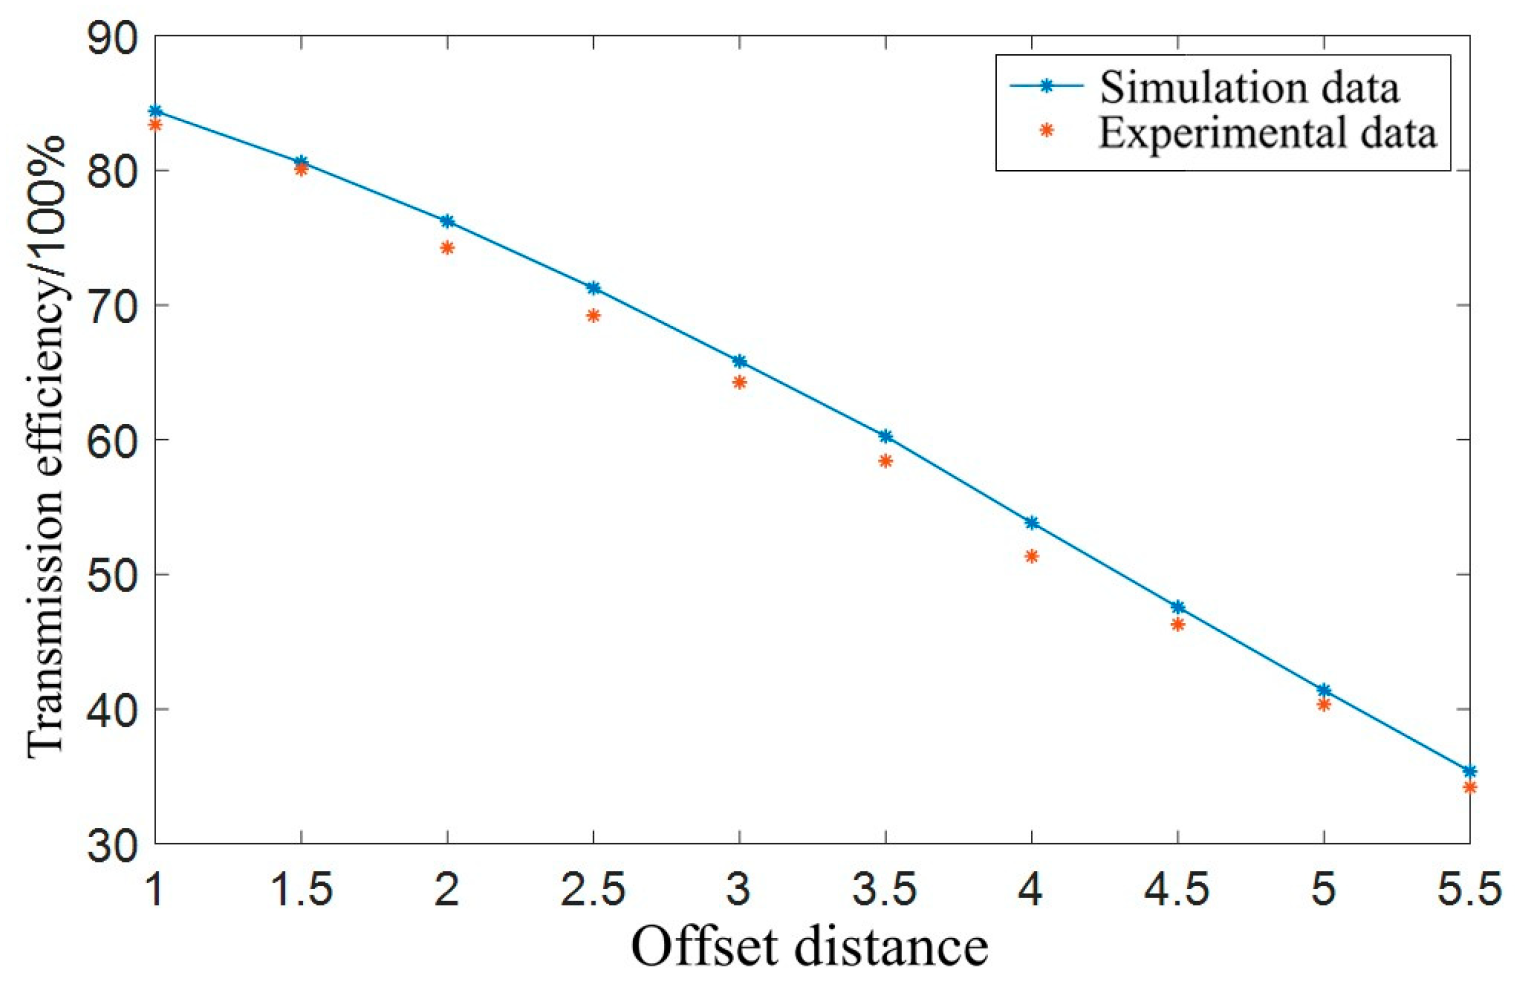

Table 1.
Reflecting resistance and reflecting reactance at the receiving end.
| Receiving capacitance compensation method | Capacitor in Series | Capacitor in Parallel |
|---|---|---|
| Reflective resistance Rr | ||
| Reflective reactance X | 0 |
Table 2.
Different compensation methods for the capacitor value.
| Compensation method | Transmitting end compensation capacitor C1 | Receiving end compensation capacitor C2 |
|---|---|---|
| SS | ||
| SP | ||
| PS | ||
| PP |
Table 3.
Parameters of coils with different shapes.
| Coil shape | Outside diameter (cm) | Area(cm2) | Inductance (uH) | Resistance (mΩ) |
|---|---|---|---|---|
| Circular | 11.26 | 99.58 | 3.72 | 363 |
| Rectangle | 10 | 100 | 3.58 | 393 |
Table 4.
Parameters of coils with different line widths.
| Line width (mm) | 2.4 | 2.5 | 2.6 | 2.7 | 2.8 | 2.9 |
| Quality factor | 17.22 | 17.31 | 17.37 | 17.42 | 17.47 | 17.38 |
| Coupling coefficient | 0.1167 | 0.1171 | 0.1175 | 0.1178 | 0.1180 | 0.1181 |
| Strong coupling coefficient | 4.04 | 4.11 | 4.17 | 4.21 | 4.25 | 4.21 |
Table 5.
Relation between coil filling coefficient and turns and inner diameter.
| Fill factor | 0.20 | 0.25 | 0.30 | 0.36 | 0.43 | 0.50 | 0.58 | 0.66 | 0.76 | 0.87 |
| Coil turns | 5 | 6 | 7 | 8 | 9 | 10 | 11 | 12 | 13 | 14 |
| Inside diameter (mm) | 60.2 | 54.2 | 48.2 | 42.2 | 36.2 | 30.2 | 24.2 | 18.2 | 12.2 | 6.2 |
Table 6.
Simulation data of the coil quality factor, self-inductance, and resistance.
| Coil type | Quality factor | Self-inductance (uH) | Resistance (mΩ) |
|---|---|---|---|
| Single layer coil | 18.09 | 5.12 | 178 |
| Scheme 1 | 21.62 | 5.13 | 149 |
| Scheme 2 | 21.08 | 20.61 | 614 |
Table 7.
Parameters of the coil structure.
| Coil number | thickness (mm) | pitch of turn (mm) | Line width (mm) | Number of turns | Number of layers |
|---|---|---|---|---|---|
| 1 | 0.035 | 0.5 | 2 | 7 | 1 |
| 2 | 0.07 | 0.2 | 2 | 7 | 1 |
| 3 | 0.07 | 0.5 | 2 | 7 | 1 |
| 4 | 0.07 | 1 | 2 | 7 | 1 |
| 5 | 0.07 | 0.2 | 2.7 | 7 | 1 |
| 6 | 0.07 | 0.2 | 2.8 | 7 | 1 |
| 7 | 0.07 | 0.2 | 2.9 | 7 | 1 |
| 8 | 0.07 | 0.2 | 2.8 | 8 | 1 |
| 9 | 0.07 | 0.2 | 2.8 | 9 | 1 |
| 10 | 0.07 | 0.2 | 2.8 | 8 | 2 |
| 11 | 0.07 | 0.2 | 2.8 | 8 | 2 |
Table 8.
Simulation and measured calculation values of the coil strong coupling coefficient.
| Coil number | 1 | 2 | 3 | 4 | 5 | 6 | 7 | 8 | 9 |
| Simulation value | 0.92 | 3.63 | 3.36 | 2.98 | 4.21 | 4.25 | 4.21 | 4.57 | 4.55 |
| Measurement calculation value | 0.86 | 3.39 | 3.10 | 2.74 | 3.90 | 4.93 | 3.89 | 4.23 | 4.20 |
Table 9.
Simulated and measured values of the coil quality factor, self-inductance, and resistance.
| Parameter | Single layer coil | Scheme 1 coil | Scheme 2 coil |
|---|---|---|---|
| Quality factor simulation value | 18.09 | 21.61 | 21.08 |
| Quality factor measurement value | 17.44 | 20.81 | 20.33 |
| Self-perception simulation value (uH) | 5.12 | 5.13 | 20.61 |
| Self-inductance measurement value (uH) | 5.25 | 5.27 | 20.85 |
| Resistance simulation value (mΩ) | 178 | 152 | 623 |
| Resistance measurement value (mΩ) | 189 | 159 | 644 |
Table 10.
Experimental system parameter.
| System parameter | Value |
|---|---|
| Operating Frequency | 98 kHz |
| Transmitting and receiving end coil self-sensing | 20.85 uH |
| Transmitting and receiving terminal coil resistance | 0.64 Ω |
| Compensation capacitance at the transmitting and receiving ends | 126 nF |
| Input voltage at the transmitting end | 12 V |
| Receiving end load resistance | 5 Ω |
Disclaimer/Publisher’s Note: The statements, opinions and data contained in all publications are solely those of the individual author(s) and contributor(s) and not of MDPI and/or the editor(s). MDPI and/or the editor(s) disclaim responsibility for any injury to people or property resulting from any ideas, methods, instructions or products referred to in the content. |
© 2023 by the authors. Licensee MDPI, Basel, Switzerland. This article is an open access article distributed under the terms and conditions of the Creative Commons Attribution (CC BY) license (http://creativecommons.org/licenses/by/4.0/).
Copyright: This open access article is published under a Creative Commons CC BY 4.0 license, which permit the free download, distribution, and reuse, provided that the author and preprint are cited in any reuse.


