

Submitted:
26 December 2023
Posted:
27 December 2023
You are already at the latest version
Abstract
Owing to its properties, boron carbide has been applied in scientific and industrial fields. For this reason, B4C powders should be characterized by high purity and homogeneity in grain size and shape. In this study, boron carbide was prepared using precursors obtained by a hydrothermal method, and the grain morphology of the product was investigated. Boric acid and the saccharides glucose, fructose, inulin, and sorbitol were used as the precursors. Two precursor dehydration methods, freeze-drying and recrystallization, were compared. The precursors were subjected to DLS grain size and FT-IR spectrophotometric studies, and SEM observations of the precursors and products were performed, confirming that boron carbide powders with submicron spherical grains could be successfully synthesized.
Keywords:
Boron Carbide
; nanopowders
; hydrothermal method
; saccharides
1. Introduction
Owing to its specific properties, boron carbide (B4C) has numerous applications in various industries. Applications, such as abrasives, cutting tool components, and nozzles, are based on the remarkable abrasion resistance of this compound. The low density (2.52 g/cm3) [1] combined with the high hardness (over 30 GPa) [1,2,3,4] allows boron carbide to be used as armor plates in ballistic applications. The material is also characterized by a wide active cross-section for thermal neutron capture (755 b) [5], making it the best material for the construction of neutron diodes. This property also allows B4C to be considered as a candidate for the role of a boron carrier in boron neutron capture therapy (BNCT) [6, 7]. This medical application requires powders with well-defined morphology and purity. The commercial method of producing boron carbide-carbothermic reduction [5, 7–9] in Acheson furnaces does not allow precise control of the parameters described, whereas synthesis from free elements is associated with high costs related to the price of elemental boron. For this reason, research is needed on alternative methods of synthesizing B4C, which include synthesis where the carbon source is substances of organic origin; the most promising method appears to be hydrothermal.
Hydrothermal synthesis is one of the most widely used methods for producing nanomaterials. Its origin dates back to the mid-19th century, when quartz was synthesized in the form of micrometer-sized crystallites, followed by barium (BaCO3) and strontium (SrCO3) carbonates at 200⁰C and 15 bar [10]. It is described as a wet bottom-up synthesis method, proceeding in sealed reactors at temperatures of 100-1000 °C, under elevated pressures of 1-100MPa. Reactions occur in either polar or nonpolar solvents, which are in subcritical (temperatures lower than 240 °C) or supercritical (above 240 °C, high-pressure) states. The main difference between synthesis under hydrothermal conditions and solid-phase synthesis is the reactivity, which is due to different reaction mechanisms. Examples of inorganic materials produced by hydrothermal synthesis include optical materials (AlPO4) [11], laser crystals (LiTaO3) [12], oxide materials (ZnO2 and GeO2) [12,13], ferroelectric, magnetoelectric, and photoelectric materials, superconducting membranes, artificial crystals, and quartz monocrystals [15]. The appearance, operation, and modifications of the apparatus used in the hydrothermal method have been described extensively in the literature [2,3].
Owing to the high demand for high-purity boron carbide, much research is currently being conducted to develop methods for synthesizing such compounds. Current research trends focus on synthesizing powders from natural precursors such as saccharides [13,14,15], cotton [20], and aloe vera [21]. The synthesis of saccharides and boric acid using a hydrothermal method has already been investigated by Sudoh [1], however, current scientific developments allow for refinement and further development. Because of their structure (based on carbon and hydrogen), organic compounds appear to be an ideal carbon source, and because of their popularity and low price (compared to analogous inorganic carbon sources), they seem to be promising precursors for this type of synthesis reaction. The hydrothermal synthesis method makes it possible to reduce the grain size of the saccharide precursors and control the morphology of the powder produced. A study was conducted in which spherical carbon structures were obtained by subjecting fructose to hydrothermal conditions. The obtained spheres consisted of nanoparticle aggregates. The formation mechanism of the final product was described as a three-step process. In the first step, fructose is dehydrated to hydroxymethylfurfural (HMF) [22], an organic chemical compound belonging to the alcohol and aldehyde groups that contains a five-membered furan ring. Owing to the presence of active functional groups in the HMF structure, its polycondensation, the second step in the carbon sphere formation process, is possible. In the third stage, the nanoparticles aggregate to form larger carbon structures. The final product was a pro-duct of HMF condensation, and the analysis did not reveal the presence of the structural characteristics of fructose. Analogous studies of other saccharides outside the ketose group have shown similar results. The authors described the mechanism of these reactions as dehydration combined with ring opening, breaking carbon-carbon bonds, followed by processes such as polymerization, polycondensation, aromatization, or keto-enol tautomerism.
2. Materials and Methods
To produce precursors for the synthesis of boron carbide by the hydrothermal method, mixtures consisting of boron sources (boric acid H3BO3) and carbon sources (mono and polysaccharides) were used. To compare the influence of saccharide structure on the mechanism of carbon sphere formation, the following compounds were selected: fructose (ketose), glucose (aldose), inulin (polyketose), and sorbitol (sugar alcohol).
Mixtures of carbon and boron sources at different mass ratios were prepared, and the mixtures were weighed such that the total mass of the elements was 5 g. The weight shares, element weights, and weights of the reagents are listed in Table 1.
The weighed mixtures were dissolved in distilled water, placed in Teflon crucibles, and thermally treated at 423 K for 24h. The resulting products were de-agglomerated by applying ultrasound for 90 s using a SONICS VCX 500 probe.A Hettich UNIVERSAL 320 R centrifuge was used for the particle separation.The centrifugation process was carried out for 30 min (0.5h), and the number of revolutions per minute was 7000G. The suspensions were dried using recrystallization (at 60 ⁰C) and lyophilization (using liquid nitrogen).Differences in the dehydration methods of the boron saccharide precursors affected the degree of agglomeration of the precursors and the color of the powders obtained.The precursors were placed in graphite crucibles, and boron carbide synthesis was carried out at 1650 ⁰C, with a holding time of 1h, under a protective atmosphere of argon.
The following analyses were carried out to analyze the properties of the products obtained at various stages of the study as well as the mechanisms that controlled the transformation. The suspensions that were the products of the processes described were subjected to a grain size distribution study by dynamic light scattering (DLS) using a Zetasizer Nano from A.P.. INSTRUMENTS. The obtained boron saccharide precursors were analyzed for their chemical bonds using mid-infrared (FT-IR) spectroscopy. A BRUKER VERTEX 70v spectrophotometer was used for this purpose. To determine their phase compositions, the final products of all stages of the study were subjected to X-ray diffraction (XRD) analysis using an X’Pert Pro X-ray diffractometer (Phillips, now PANalytical).Both boron-saccharide precursors and synthesis products were observed using a NOVA NANO SEM 200 ultra-high-resolution scanning electron microscope (FEI EUROPE COMPANY). Energy-dispersive spectroscopy (EDS) analysis was also performed using an analyser from EDAX
3. Results
3.1. DLS analysis
The results of DLS particle size analysis are summarized in Figure 1 and Table 2.The results in the table show the average grain size and maximum two maxima visible in the graph.
The samples are labelled as follows: the letter indicates the saccharide name, and the numbers indicate the proportion of carbon:boron (for example, F 8:2 indicates a sample containing fructose with 80% carbon and 20% boron).
From the results in Table 2, it can be concluded that the grain-size distribution in the samples was mostly unimodal.The values included in the ’Maximum 1’ column refer to peaks with intensities greater than 95%. In some samples, the presence of a second peak was registered, but its presence and intensity were due to the presence of fractions that had not been broken down by centrifugation or ultrasound action (they can be considered as impurities)
Figure 1.
DLS analysis results.
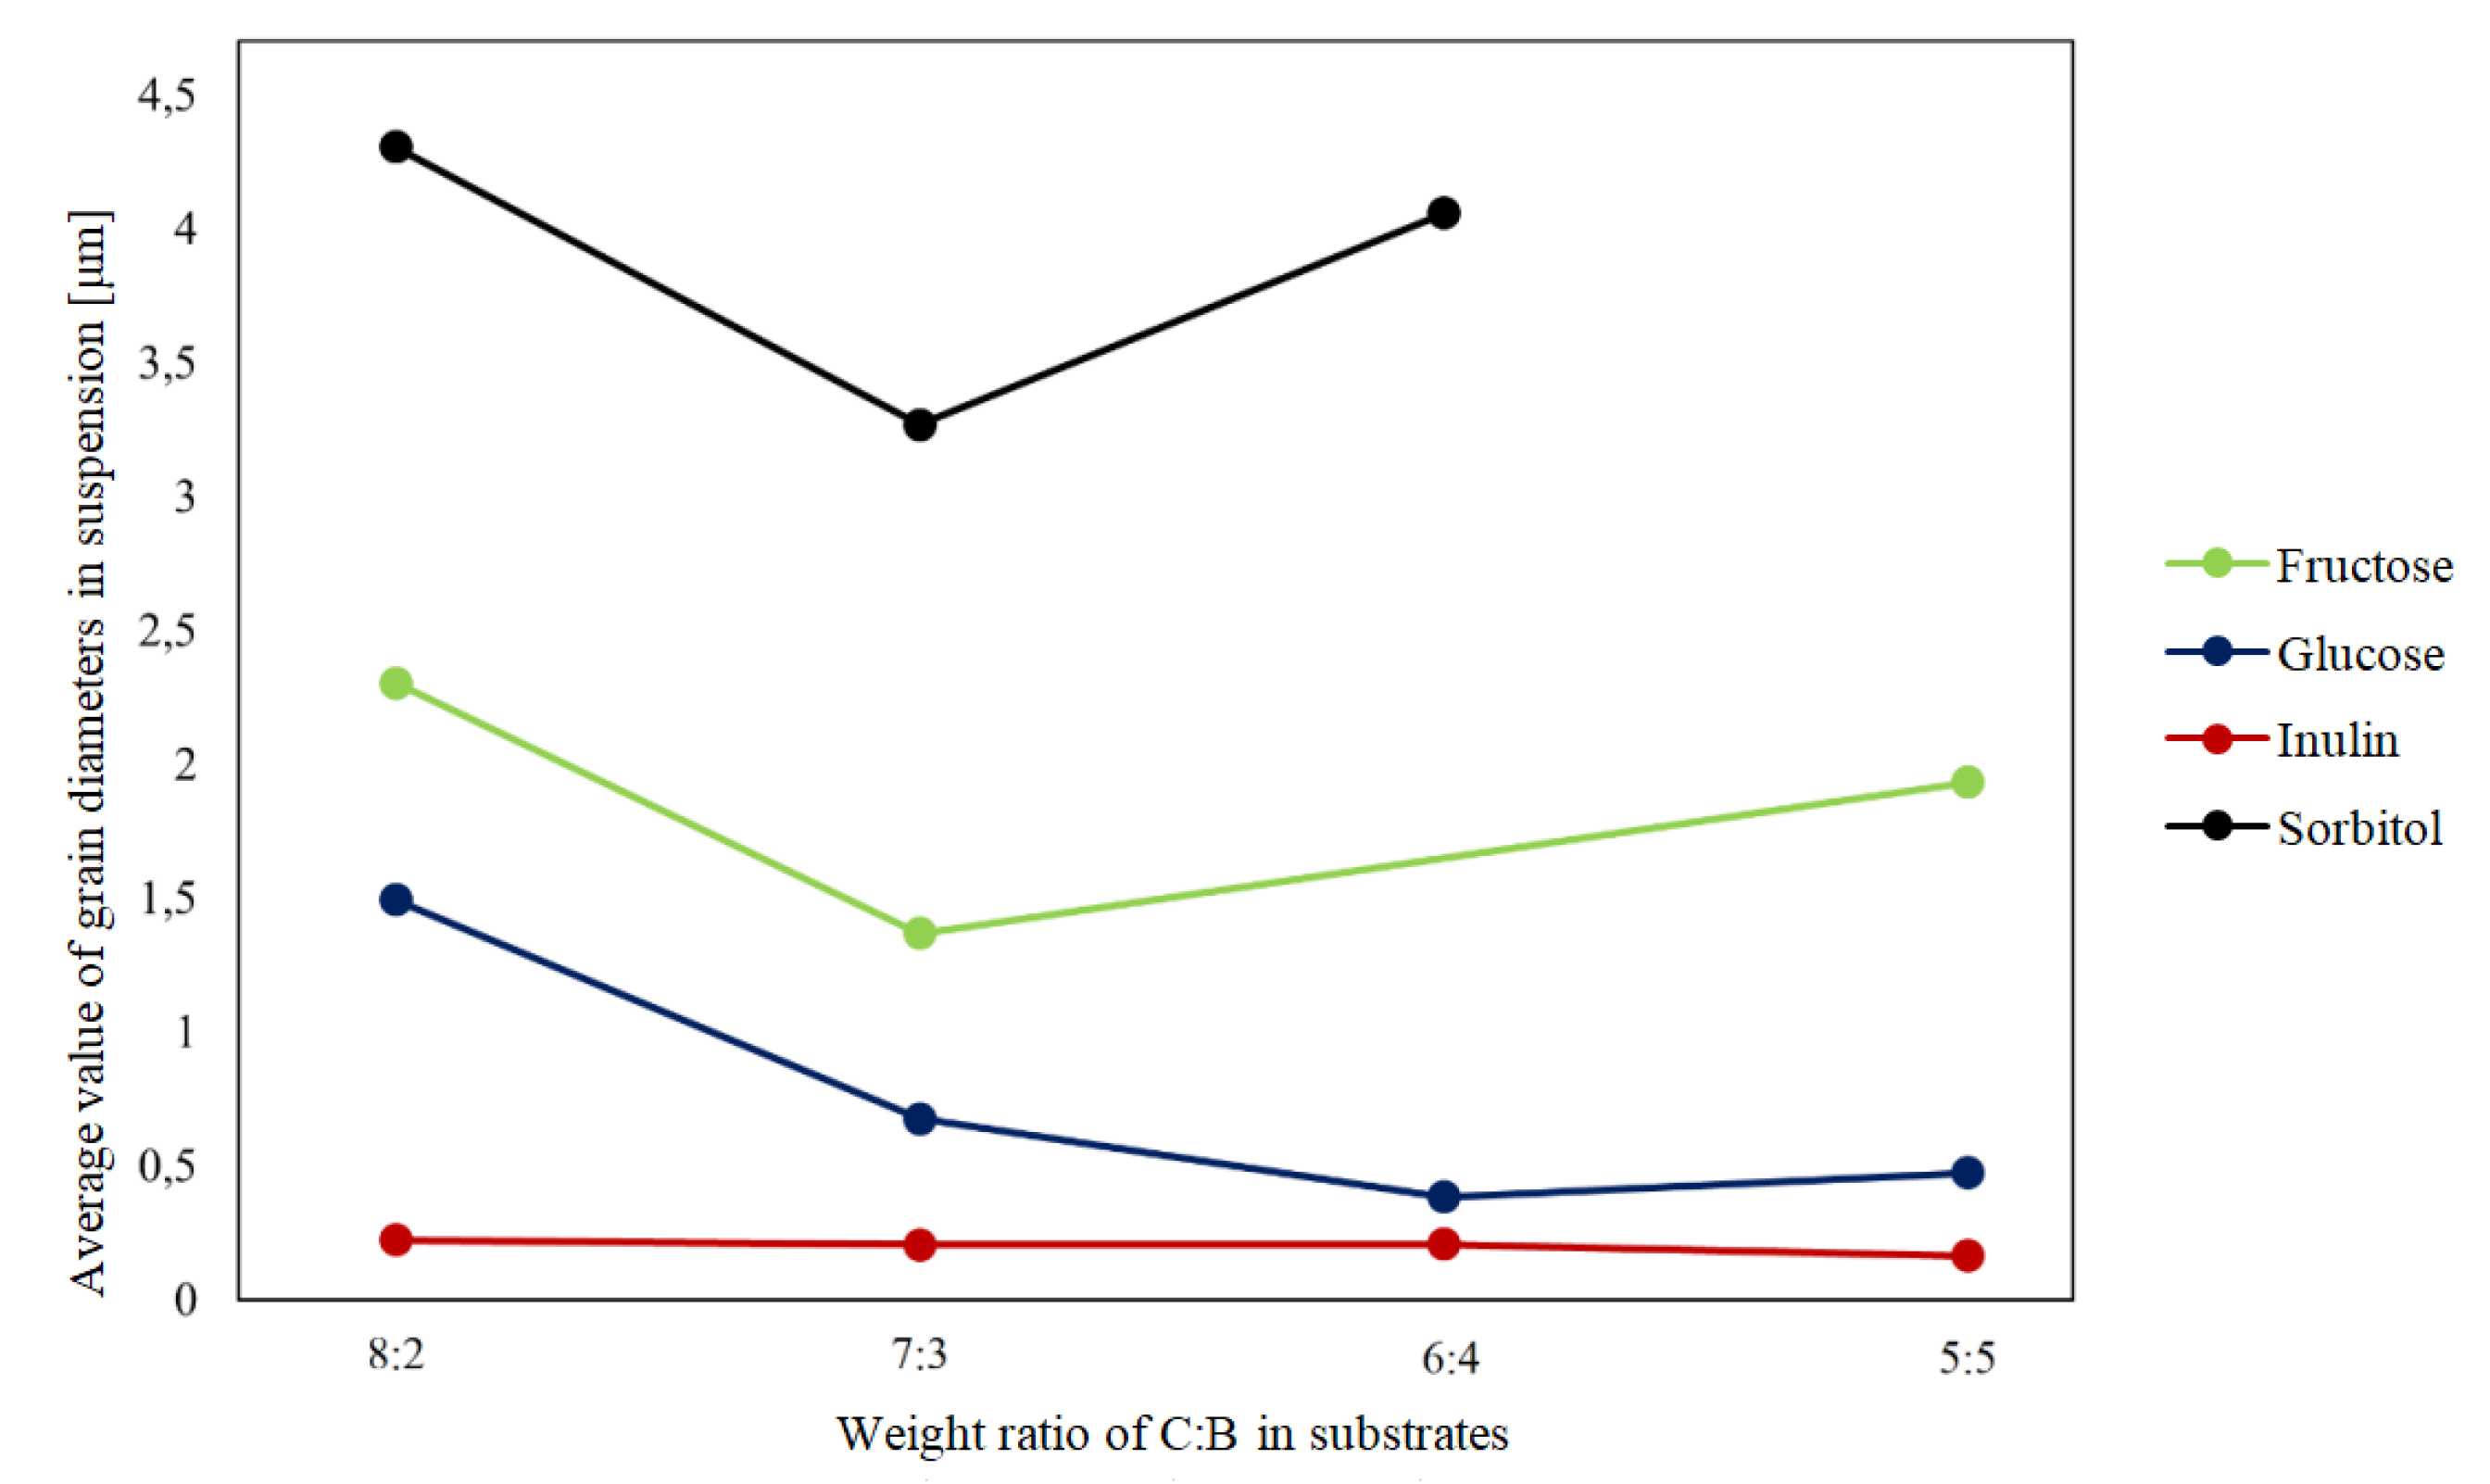
Figure 1 shows the dependence of the particle size in suspension on the ratio of carbon to boron (C:B) in the prepared precursor mixtures. In samples containing inulin and glucose prior to hydrothermal treatment, a decrease in the average grain size was noticeable as the proportion of boron increased, whereas for the other samples, this relationship was only apparent for samples containing more than 60 wt. % carbon, and the highest average grain size was recorded for the samples in which the precursor was sorbitol.
3.2. FT-IR analysis
Spectrophotometric measurements of the tested samples were performed, and FT-IR spectra were obtained. Both the recrystallized and freeze-dried precursors were studied, the obtained spectra were analyzed, and the characteristic bands were marked using available databases. The influence of the method of dehydration of suspensions, which are the products of hydrothermal treatment, on the chemical composition of the precursors obtained was analysed
Figure 2.
FT-IR spectra for boron-saccharide precursors after hydrothermal treatment, obtained by recrystallization with glucose as a carbon source.
Figure 2.
FT-IR spectra for boron-saccharide precursors after hydrothermal treatment, obtained by recrystallization with glucose as a carbon source.
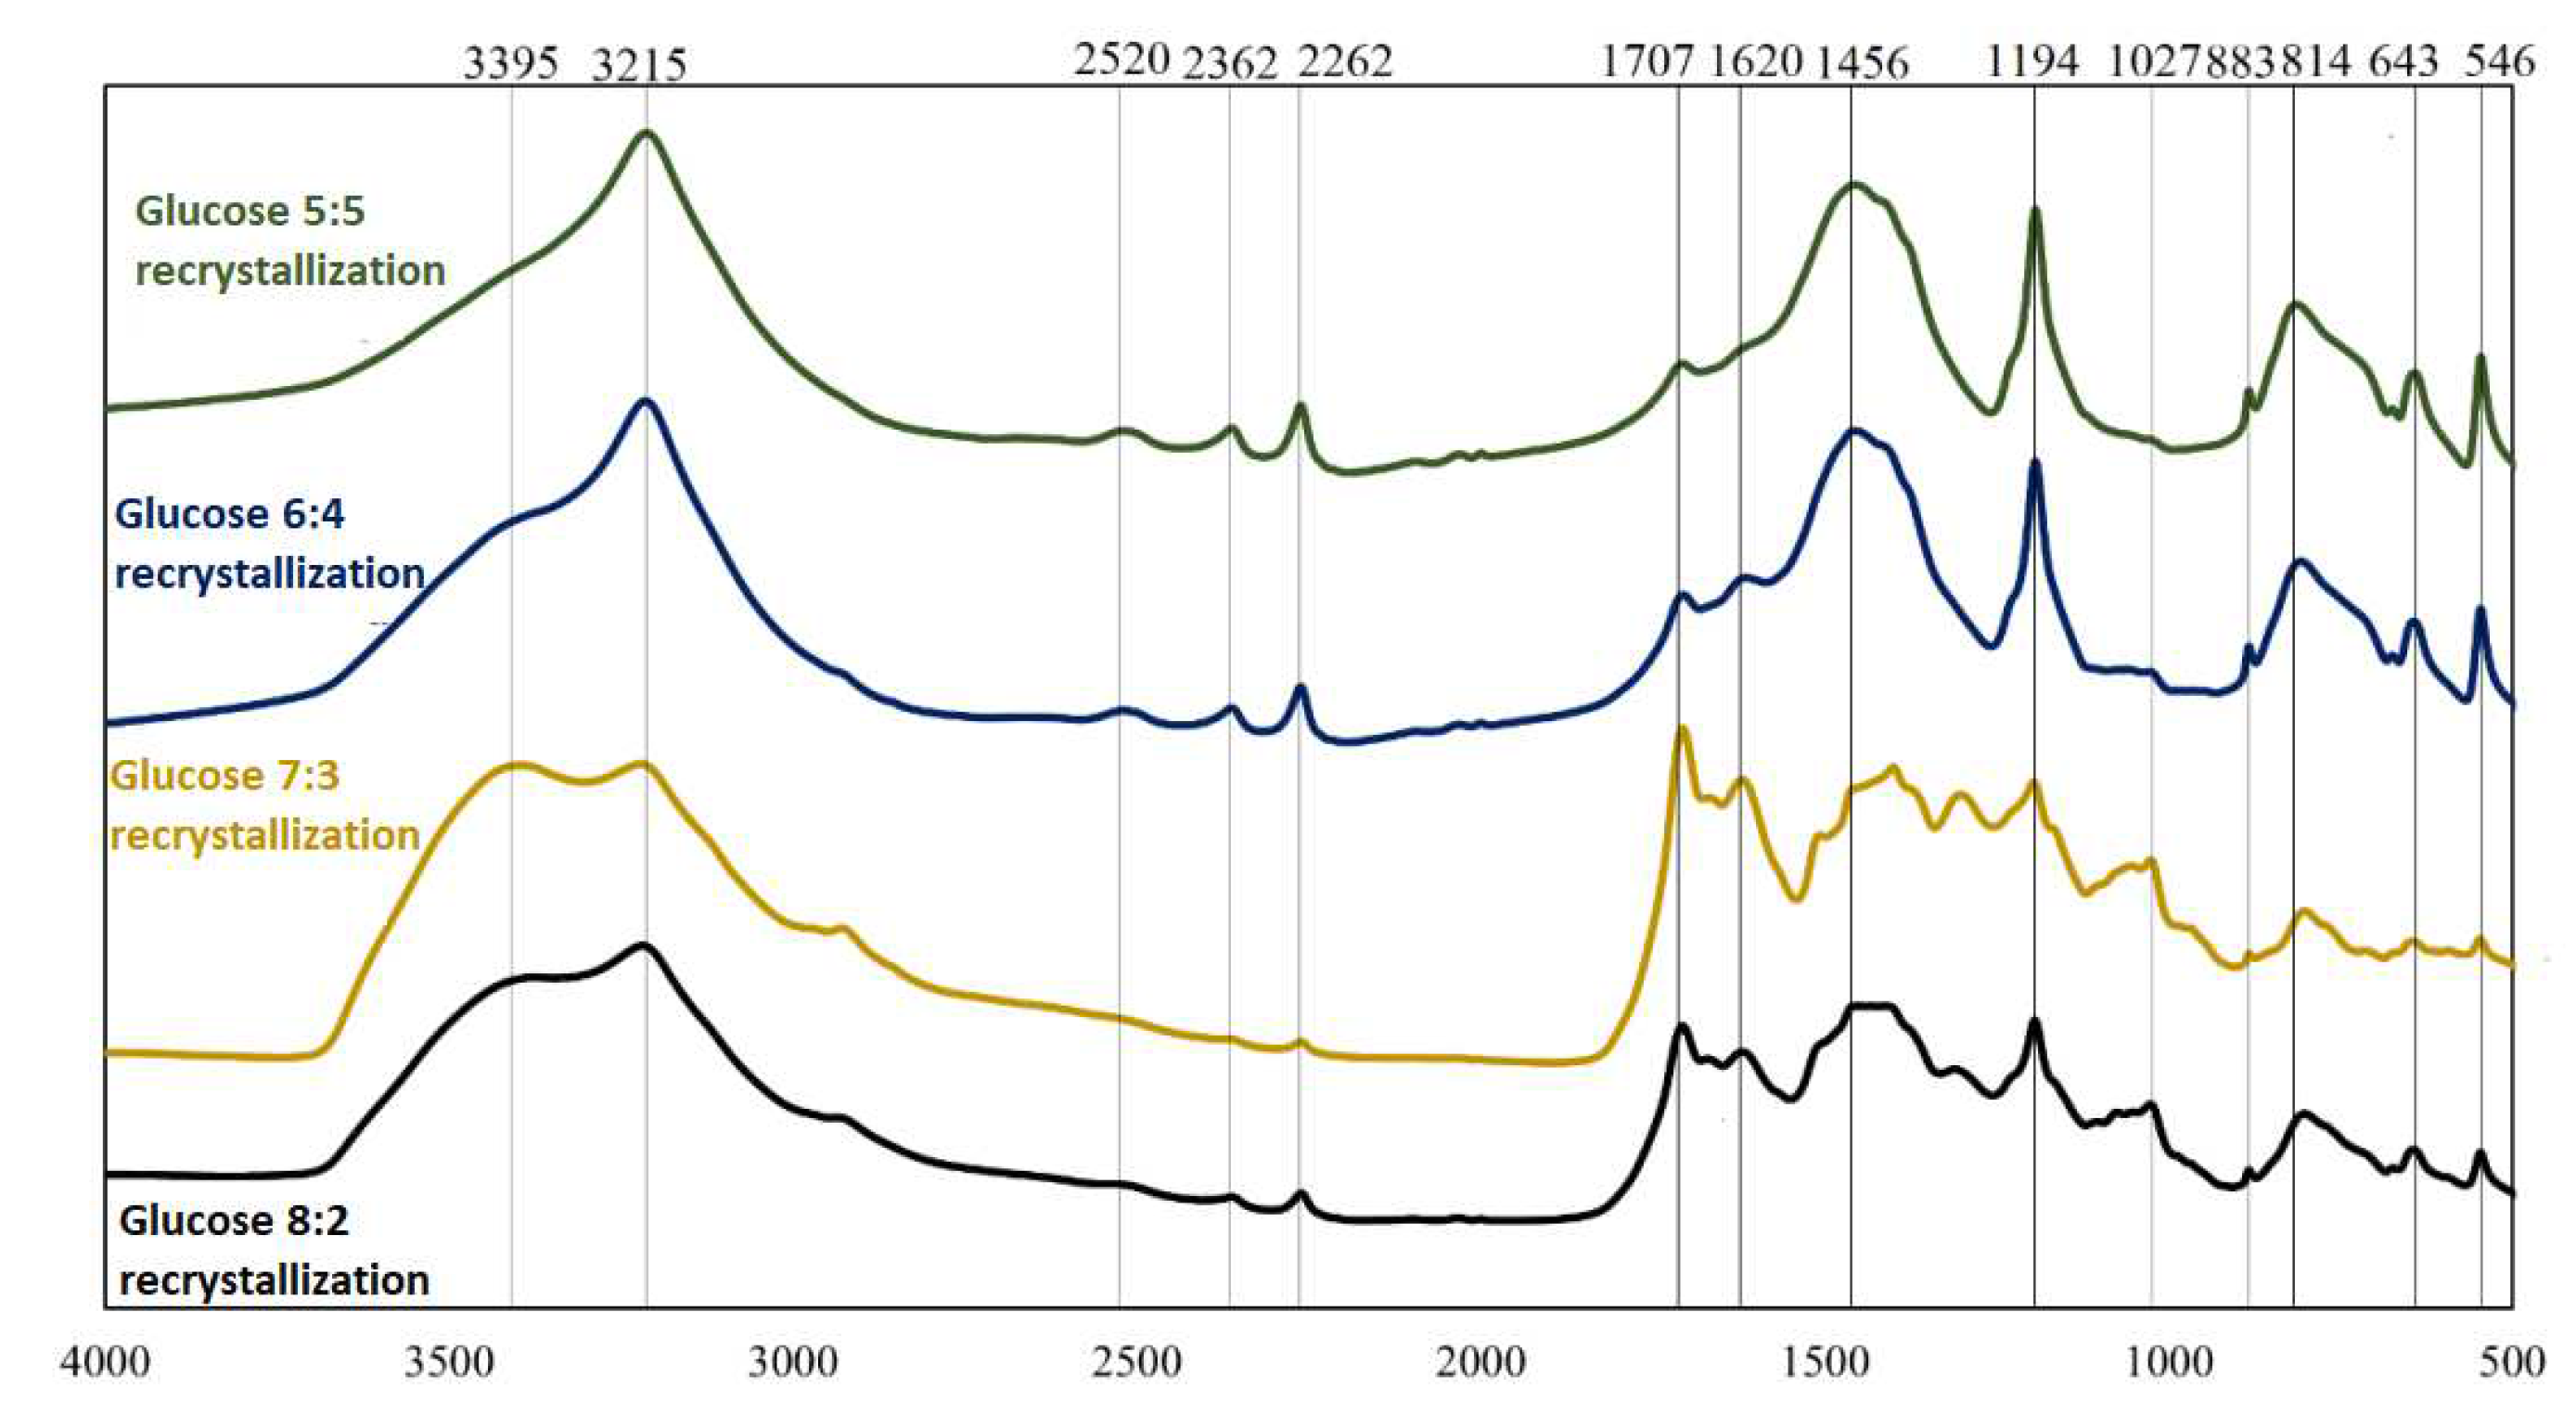
Figure 3.
FT-IR spectra for boron-saccharide precursors after hydrothermal treatment, obtained by freeze-drying with glucose as a carbon source.
Figure 3.
FT-IR spectra for boron-saccharide precursors after hydrothermal treatment, obtained by freeze-drying with glucose as a carbon source.
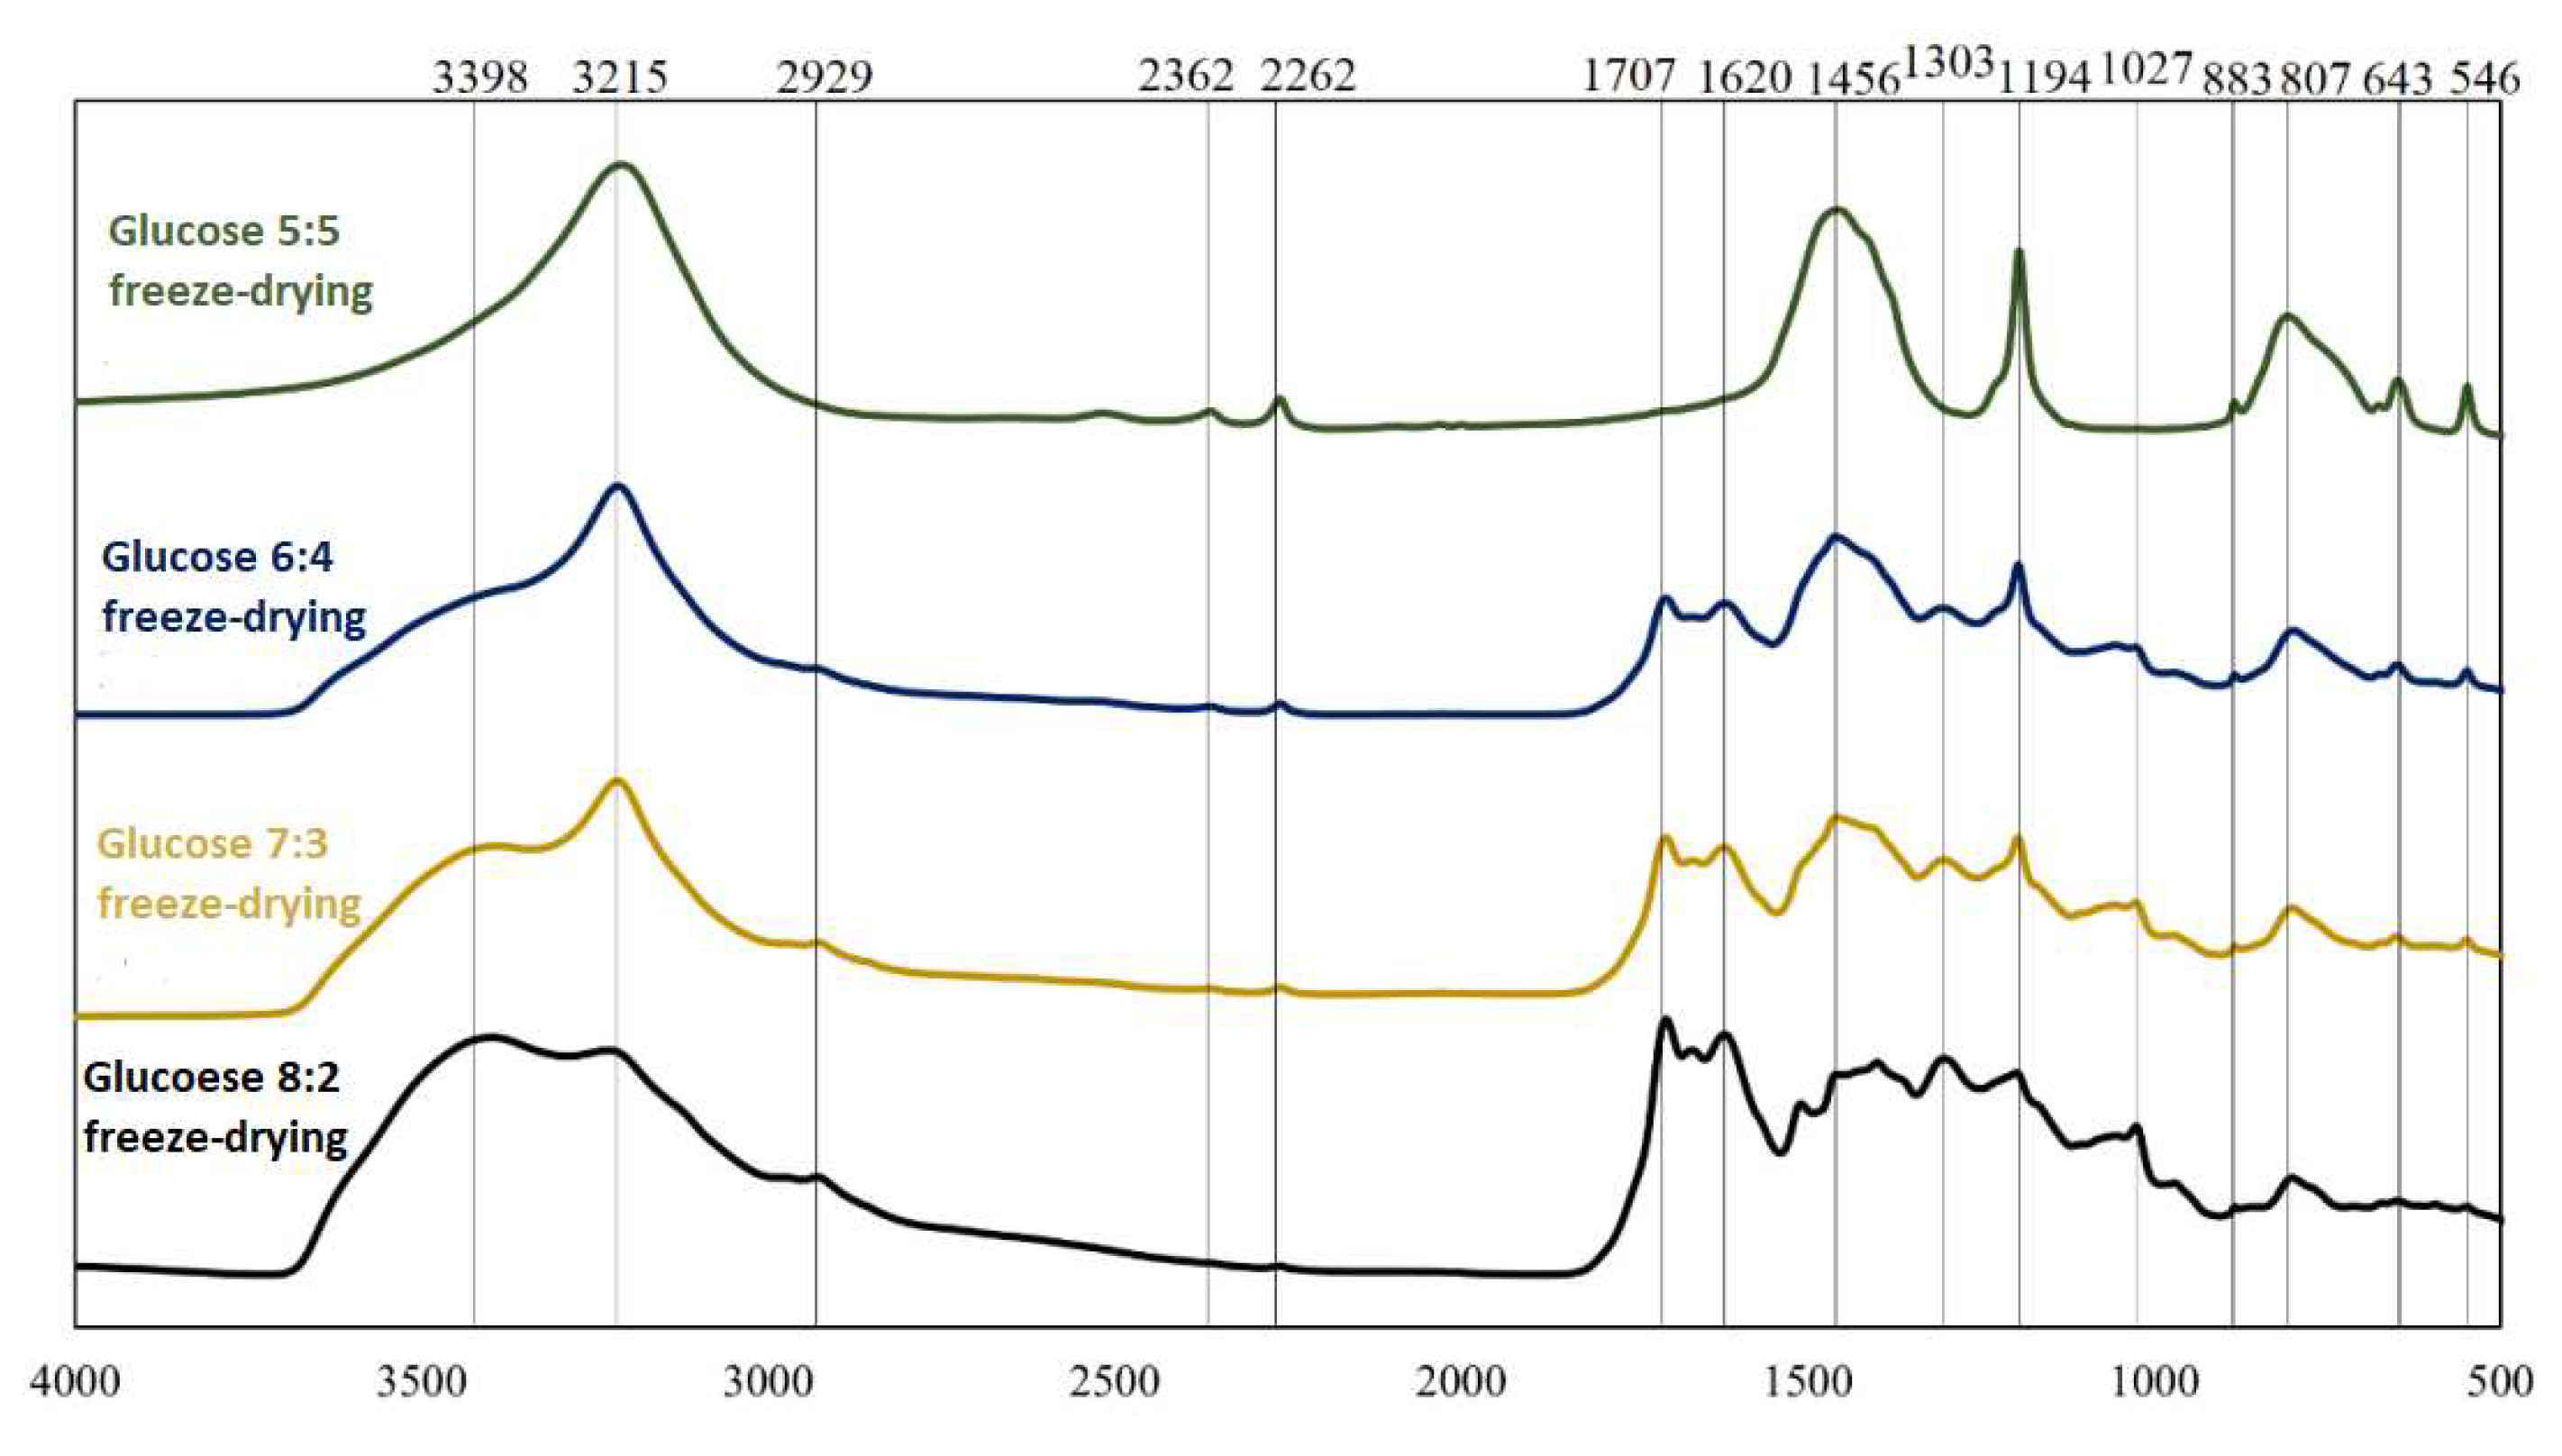
Figure 4.
FT-IR spectra for boron-saccharide precursors after hydrothermal treatment, obtained by recrystallization with sorbitol as a carbon source.
Figure 4.
FT-IR spectra for boron-saccharide precursors after hydrothermal treatment, obtained by recrystallization with sorbitol as a carbon source.
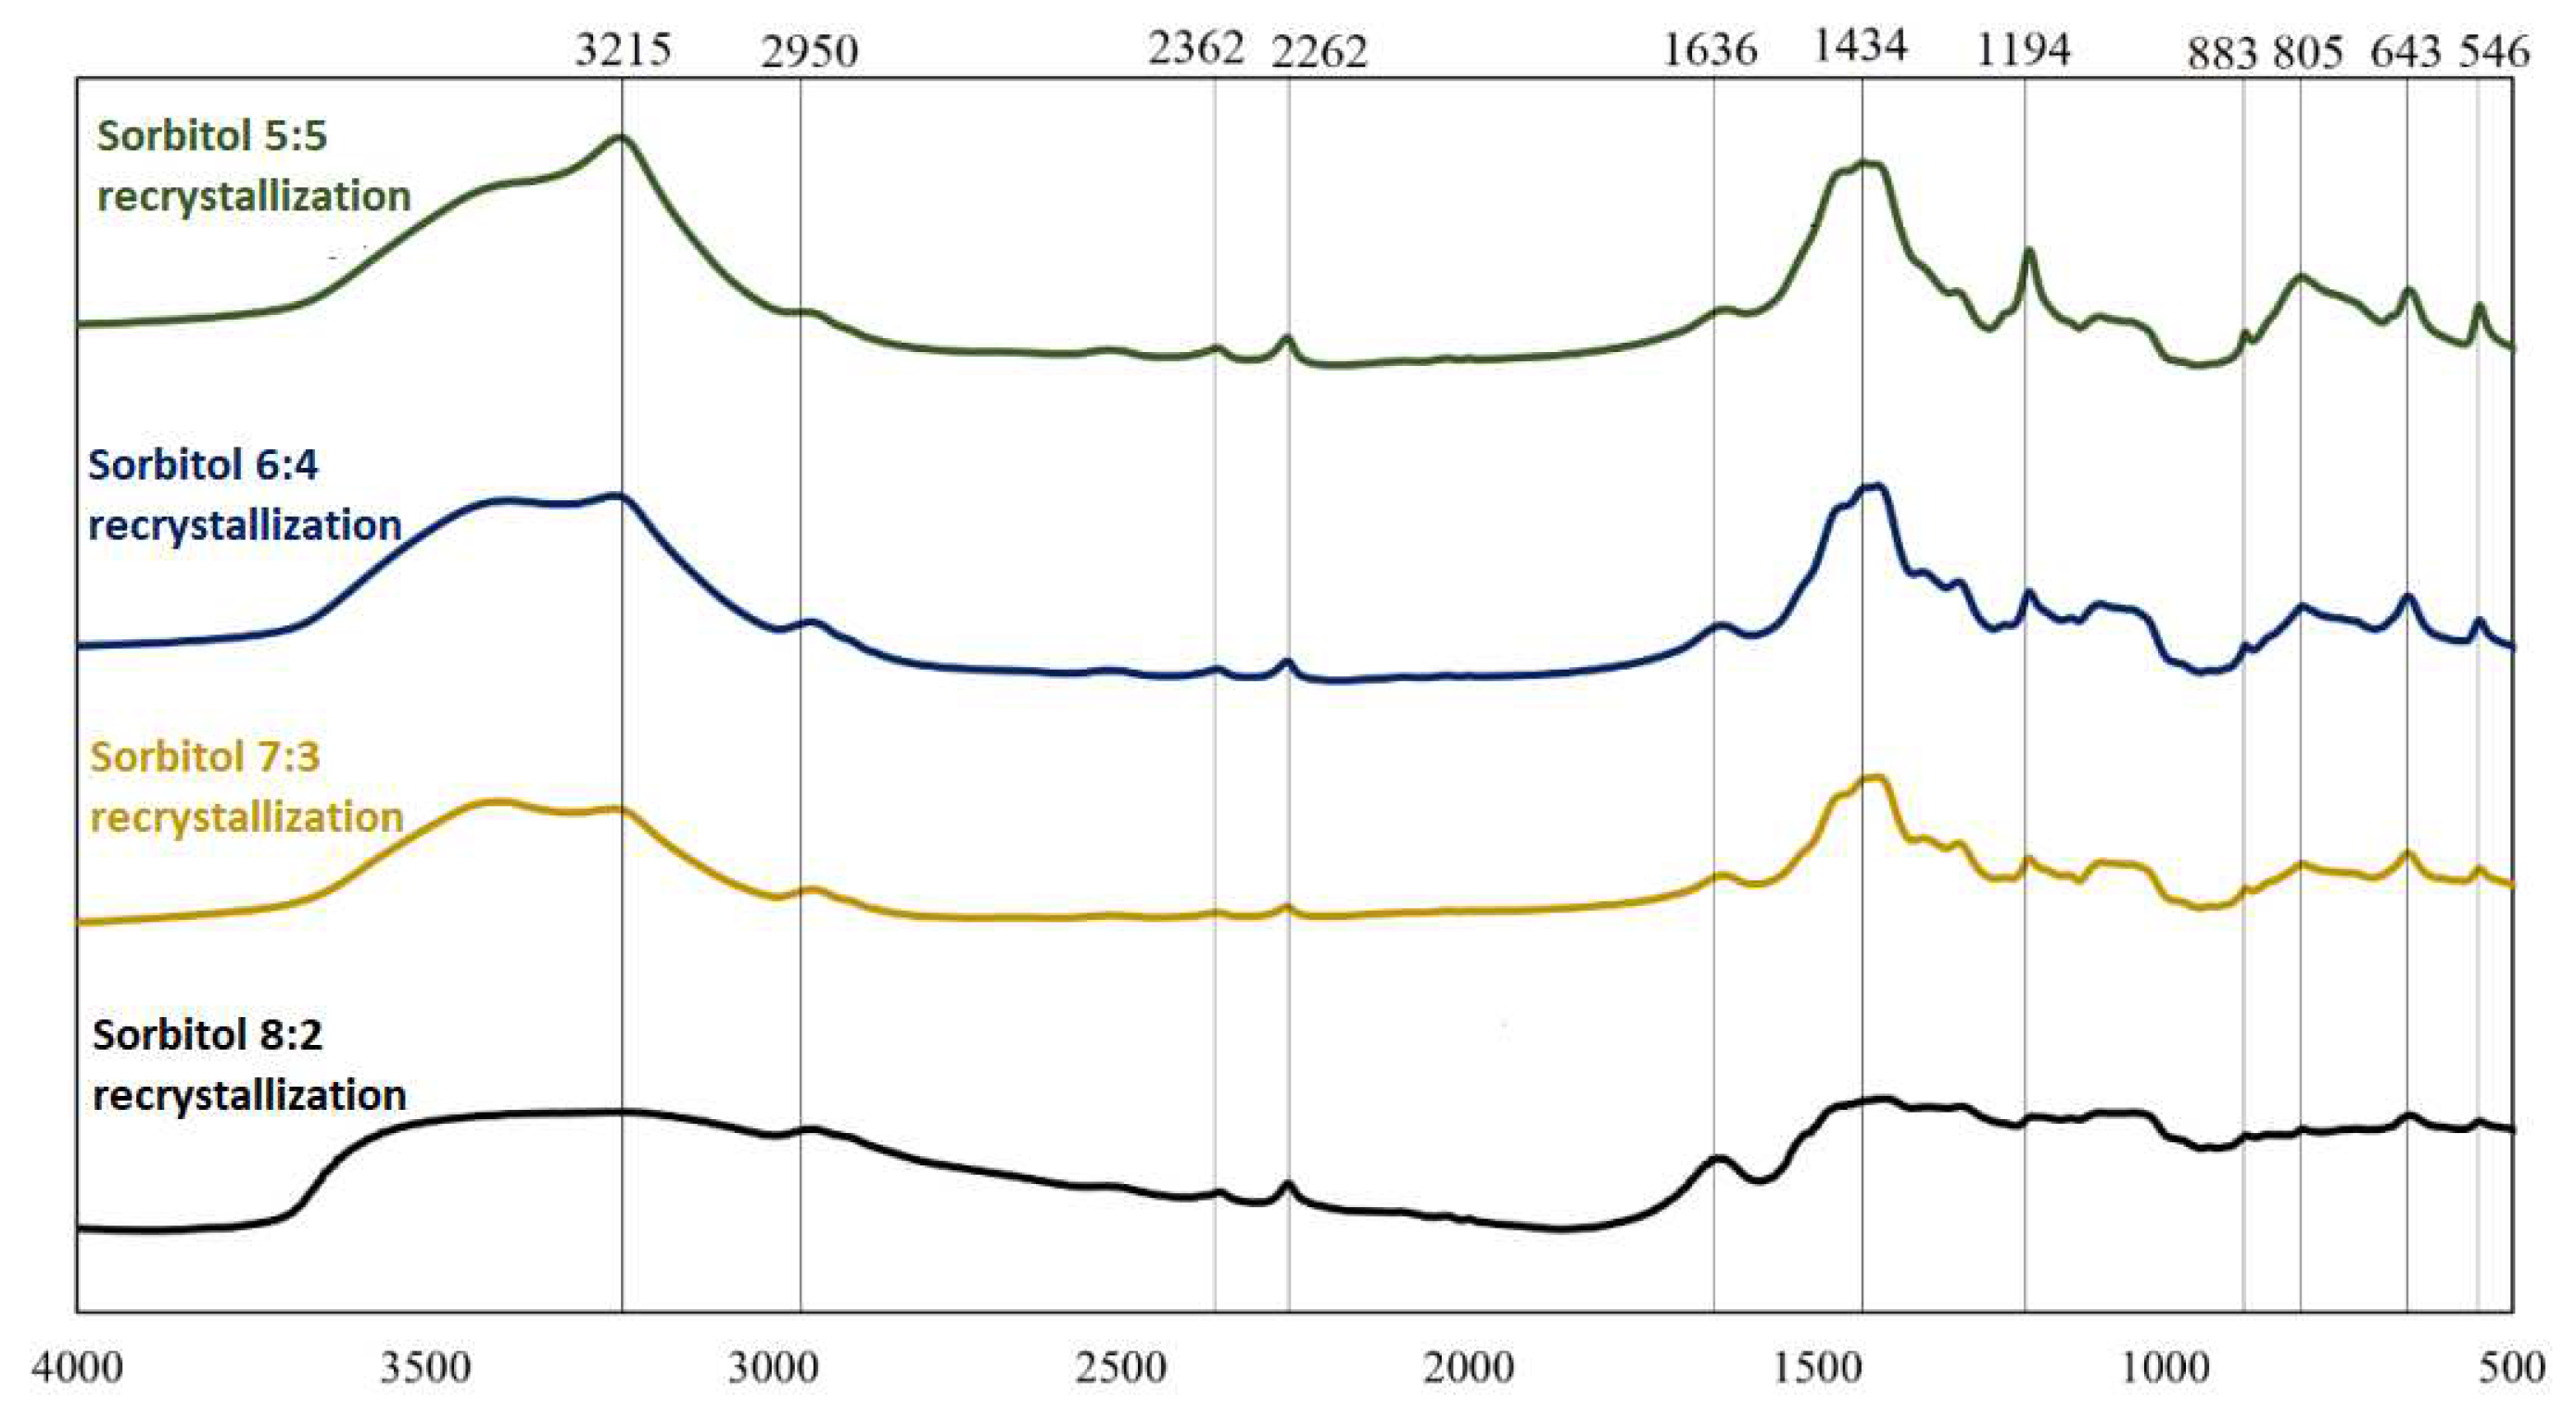
Figure 5.
FT-IR spectra for boron-saccharide precursors after hydrothermal treatment, obtained by freeze-drying with sorbitol as a carbon source.
Figure 5.
FT-IR spectra for boron-saccharide precursors after hydrothermal treatment, obtained by freeze-drying with sorbitol as a carbon source.
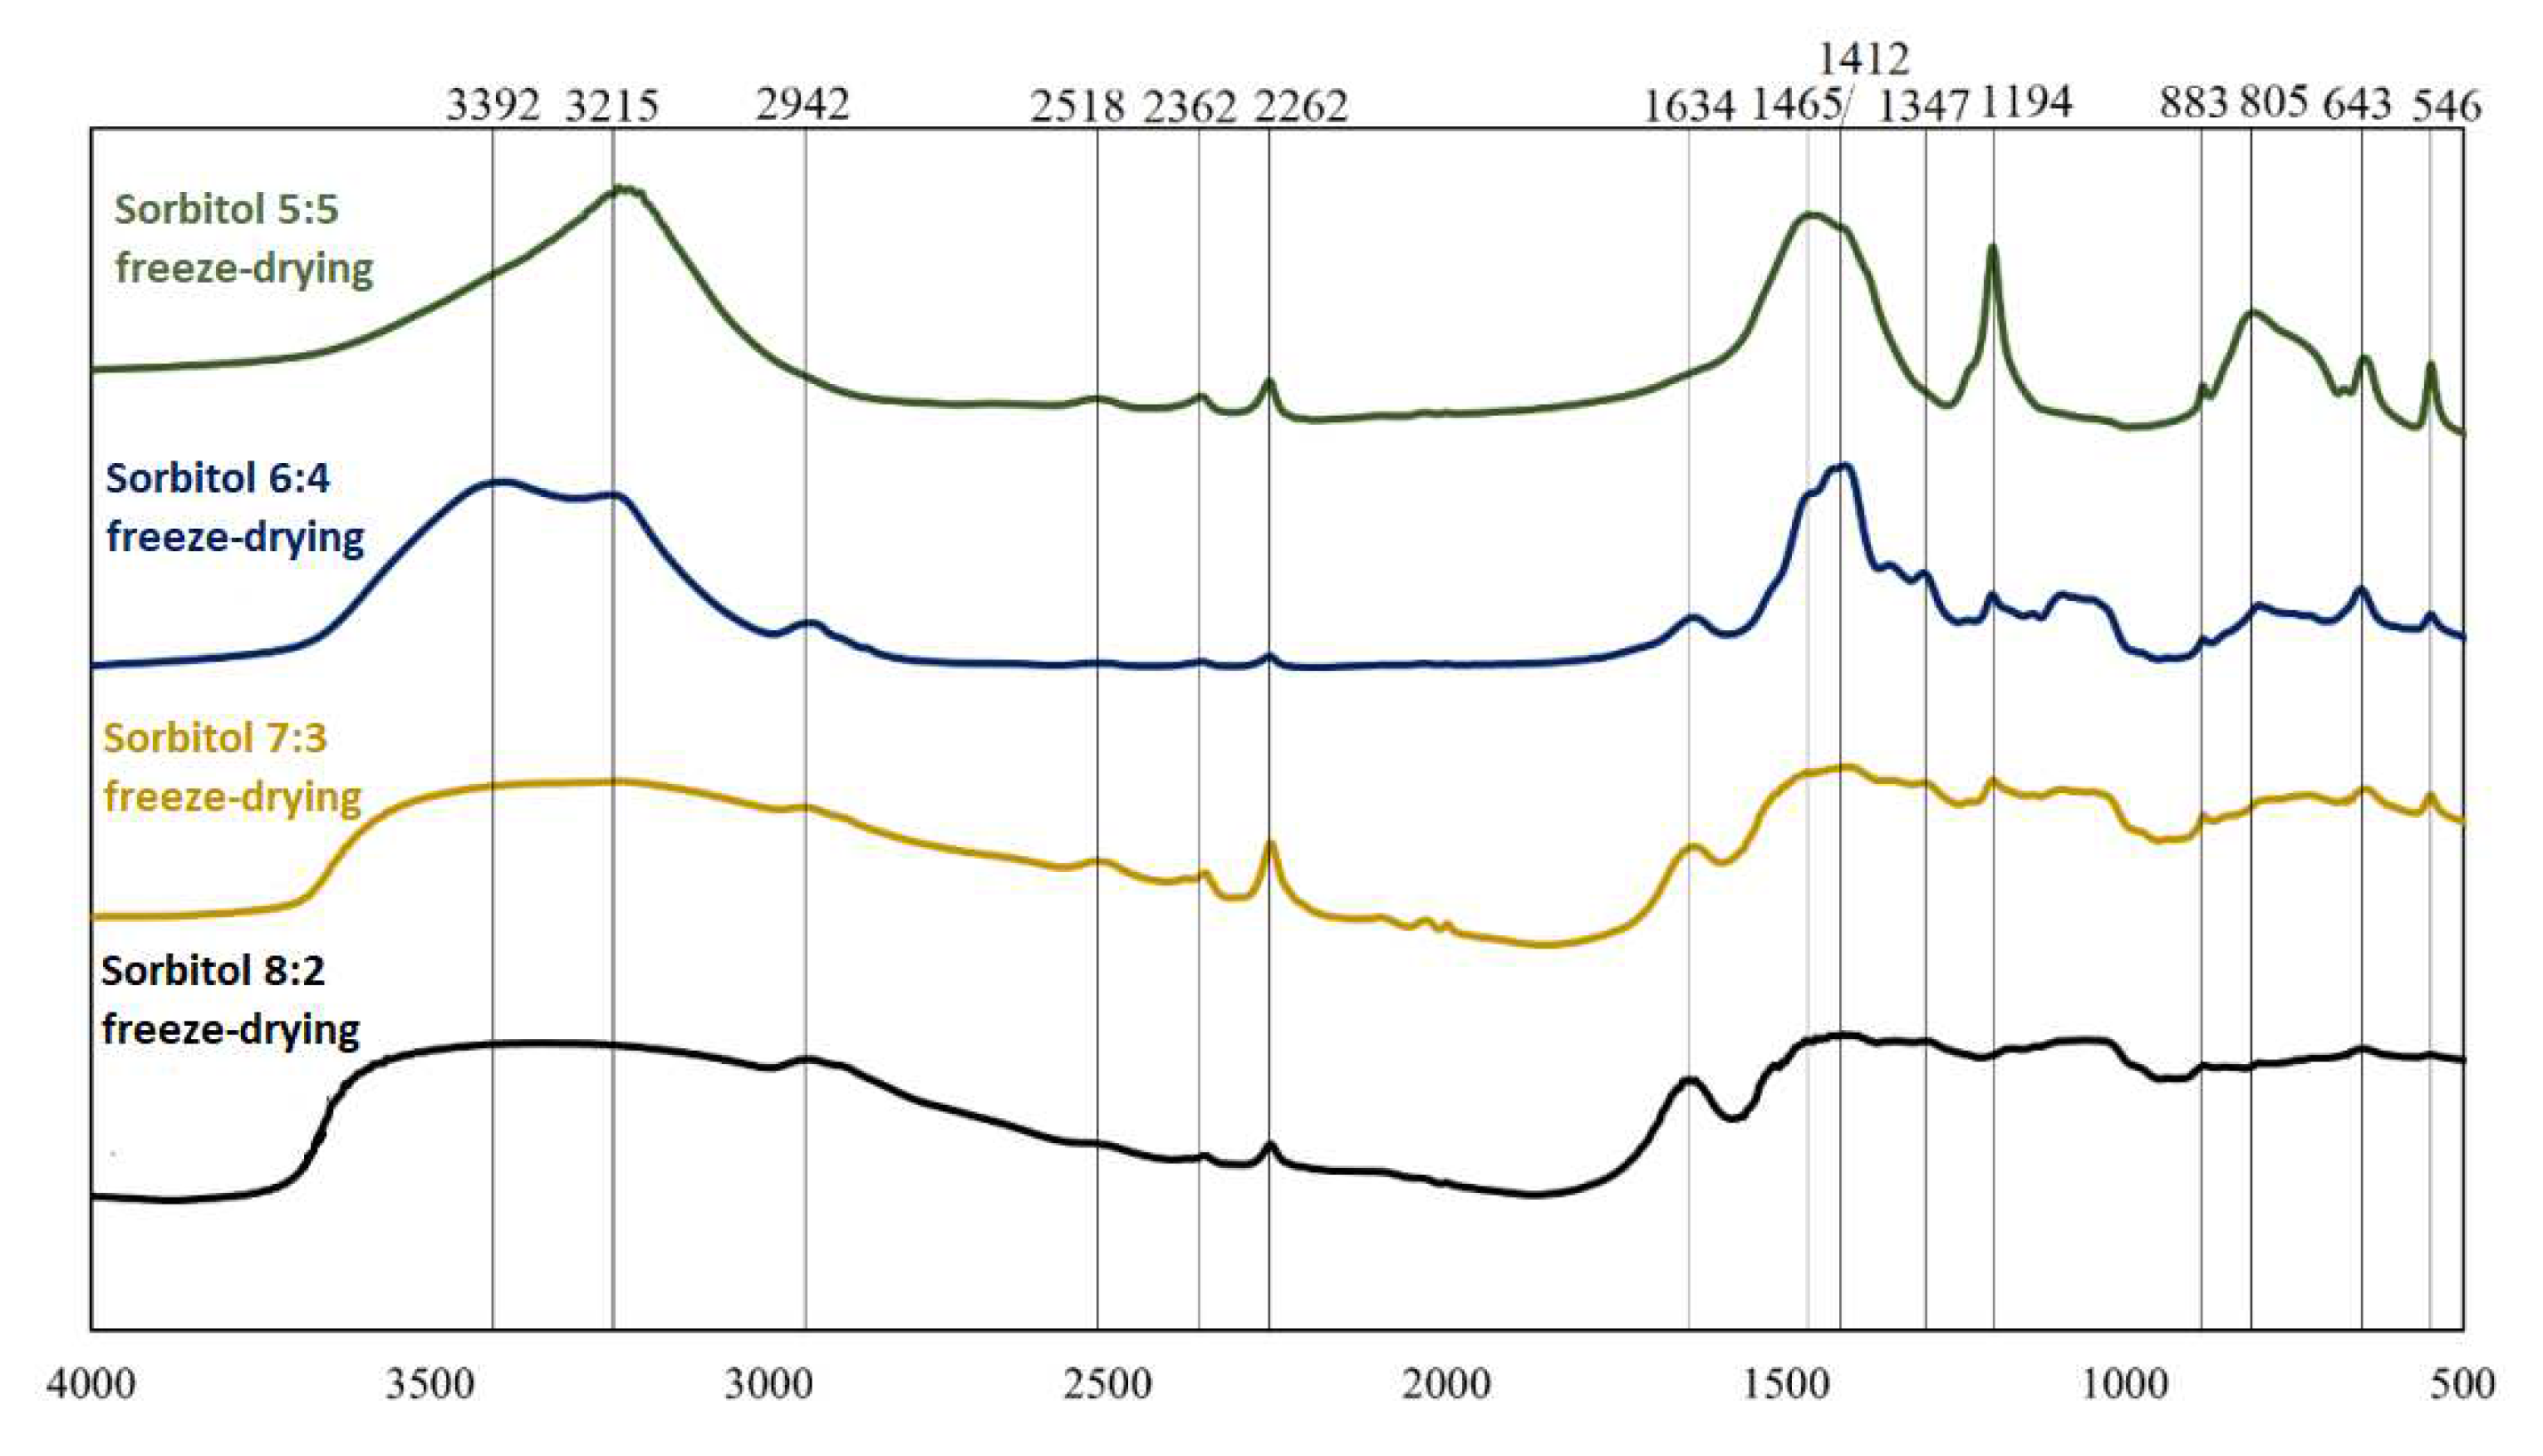
FT-IR spectra for two different precursors (glucose and sorbitol) for two dehydration methods are presented; analogous spectra were obtained and analyzed. From the graphs (Figs 2-5), the repeatability of the absorption bands in almost all spectra was noted. The positions of the bands were independent of the weight ratios of the substrates involved in the reactions under hydrothermal conditions, whereas their intensities changed, indicating the similarity of the products obtained at this stage of research. Distinctly different from the others are the spectra of sorbitol, which may indicate a different reaction mode. Based on literature data [4,5], Table 3 was prepared, in which the interpretations of bands visible on the obtained spectra are given.
Analysis of the spectra in which inulin and fructose were the precursors revealed that they were identical in terms of spectral position (both precursors were ketoses). Comparing the precursors formed using saccharides belonging to different groups (aldoses and ketoses), it can be concluded that the products obtained are qualitatively similar. However, the proportions of the individual chemical bond types and elemental groupings were not similar, as indicated by the different intensities of the corresponding bands. Significant differences were observed in the spectra of sorbitol. The observation of bands corresponding to bonds between oxygen and hydrogen, carbon and hydrogen, and oxygen and carbon indicates that the reactants did not completely decompose during hydrothermal treatment. The 814 cm−1 and 643 cm−1 bands confirm the presence of HMF in the boron-saccharide precursors obtained
3.3. SEM images for precursors
The figures below show SEM images taken with a NOVA NANO SEM 200 scanning electron microscope from FEI EUROPE COMPANY.
Figure 6.
SEM images of the saccharide precursors obtained using the hydrothermal method from glucose and dried by recrystallization. Weight ratios of carbon to boron: a) 8:2, b) 7:3, (c) 6:4, (d) 5:5.
Figure 6.
SEM images of the saccharide precursors obtained using the hydrothermal method from glucose and dried by recrystallization. Weight ratios of carbon to boron: a) 8:2, b) 7:3, (c) 6:4, (d) 5:5.
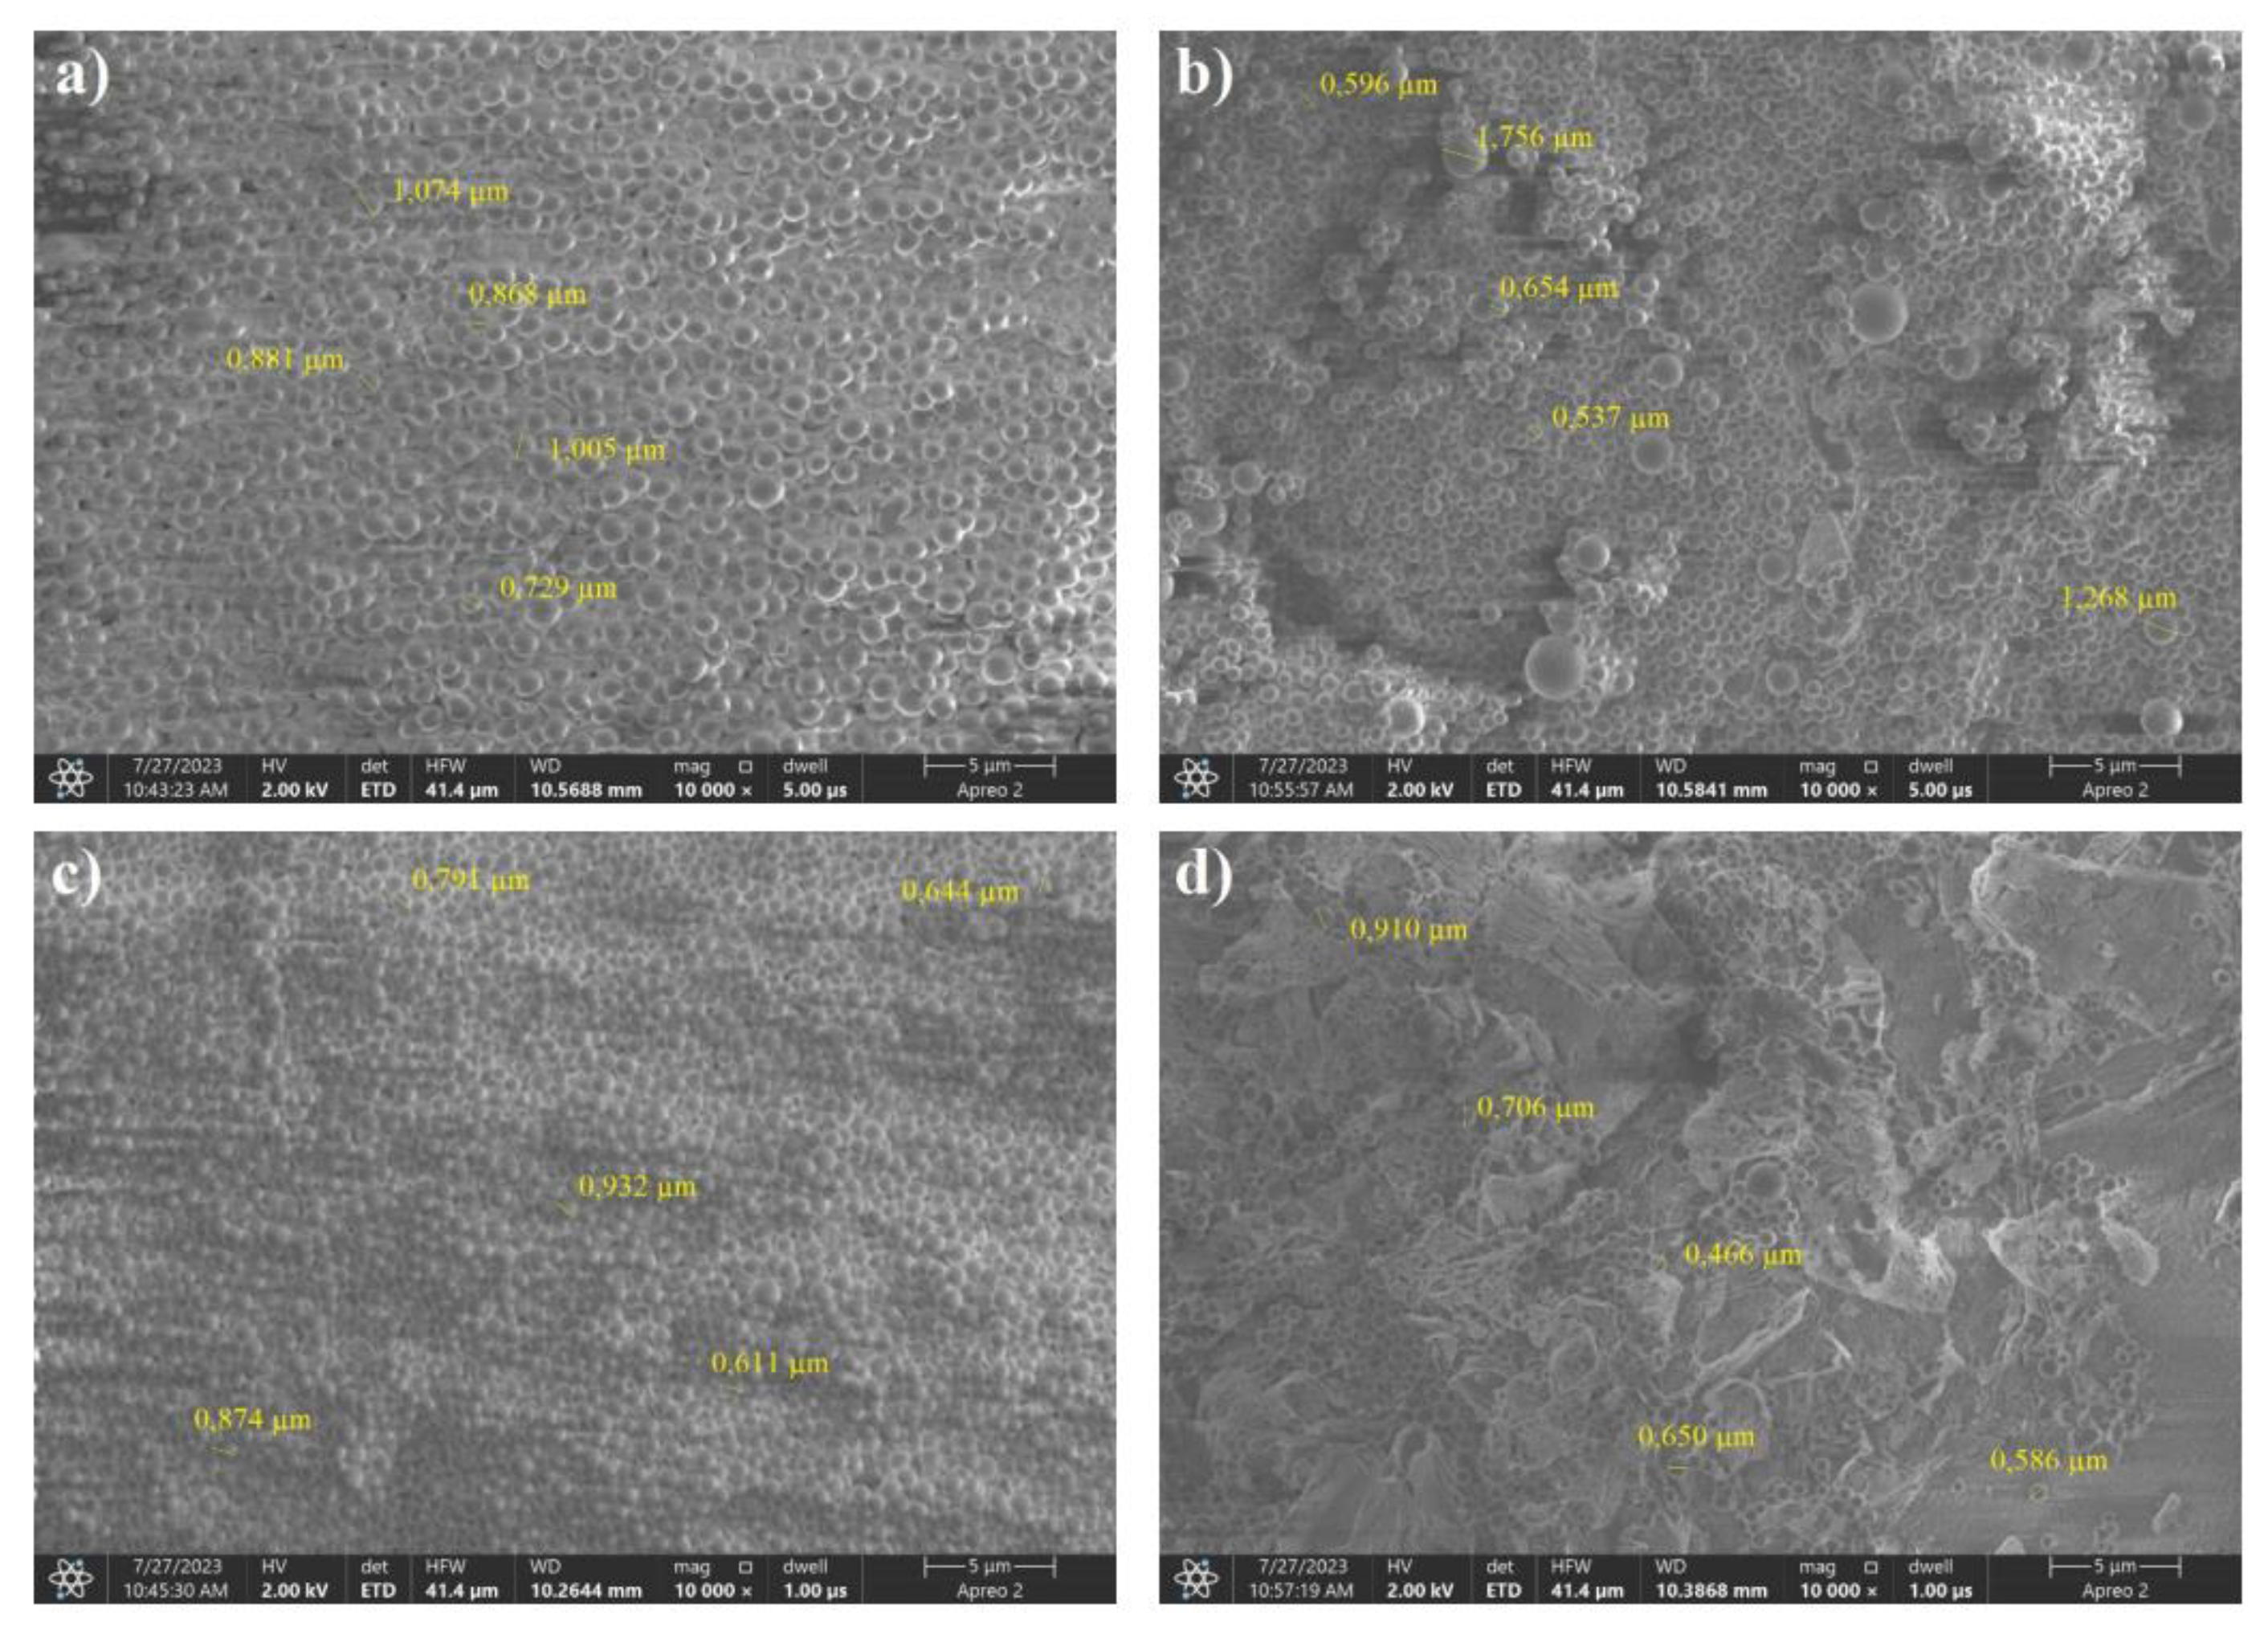
From the images shown in Figure 18, it can be seen that the spheres formed during the hydrothermal treatment of glucose were characterized by a smaller grain size than in the case of fructose. In the images of the samples with a boron content of less than 50% in the precursor, only spherical structures were visible and not deformed, but aggregation and agglomeration were observed. In the case of a sample with a carbon-to-boron weight ratio of 7:3, bi-modality of the precursor grain size distribution was noted. Particles of boric acid were only visible in the case of the sample with an equal weight ratio of carbon to boron
Figure 7.
SEM images of the saccharide precursors obtained by the hydrothermal method from glucose and freeze-dried. Weight ratios of carbon to boron: a) 8:2, b) 7:3, (c) 6:4, (d) 5:5.
Figure 7.
SEM images of the saccharide precursors obtained by the hydrothermal method from glucose and freeze-dried. Weight ratios of carbon to boron: a) 8:2, b) 7:3, (c) 6:4, (d) 5:5.
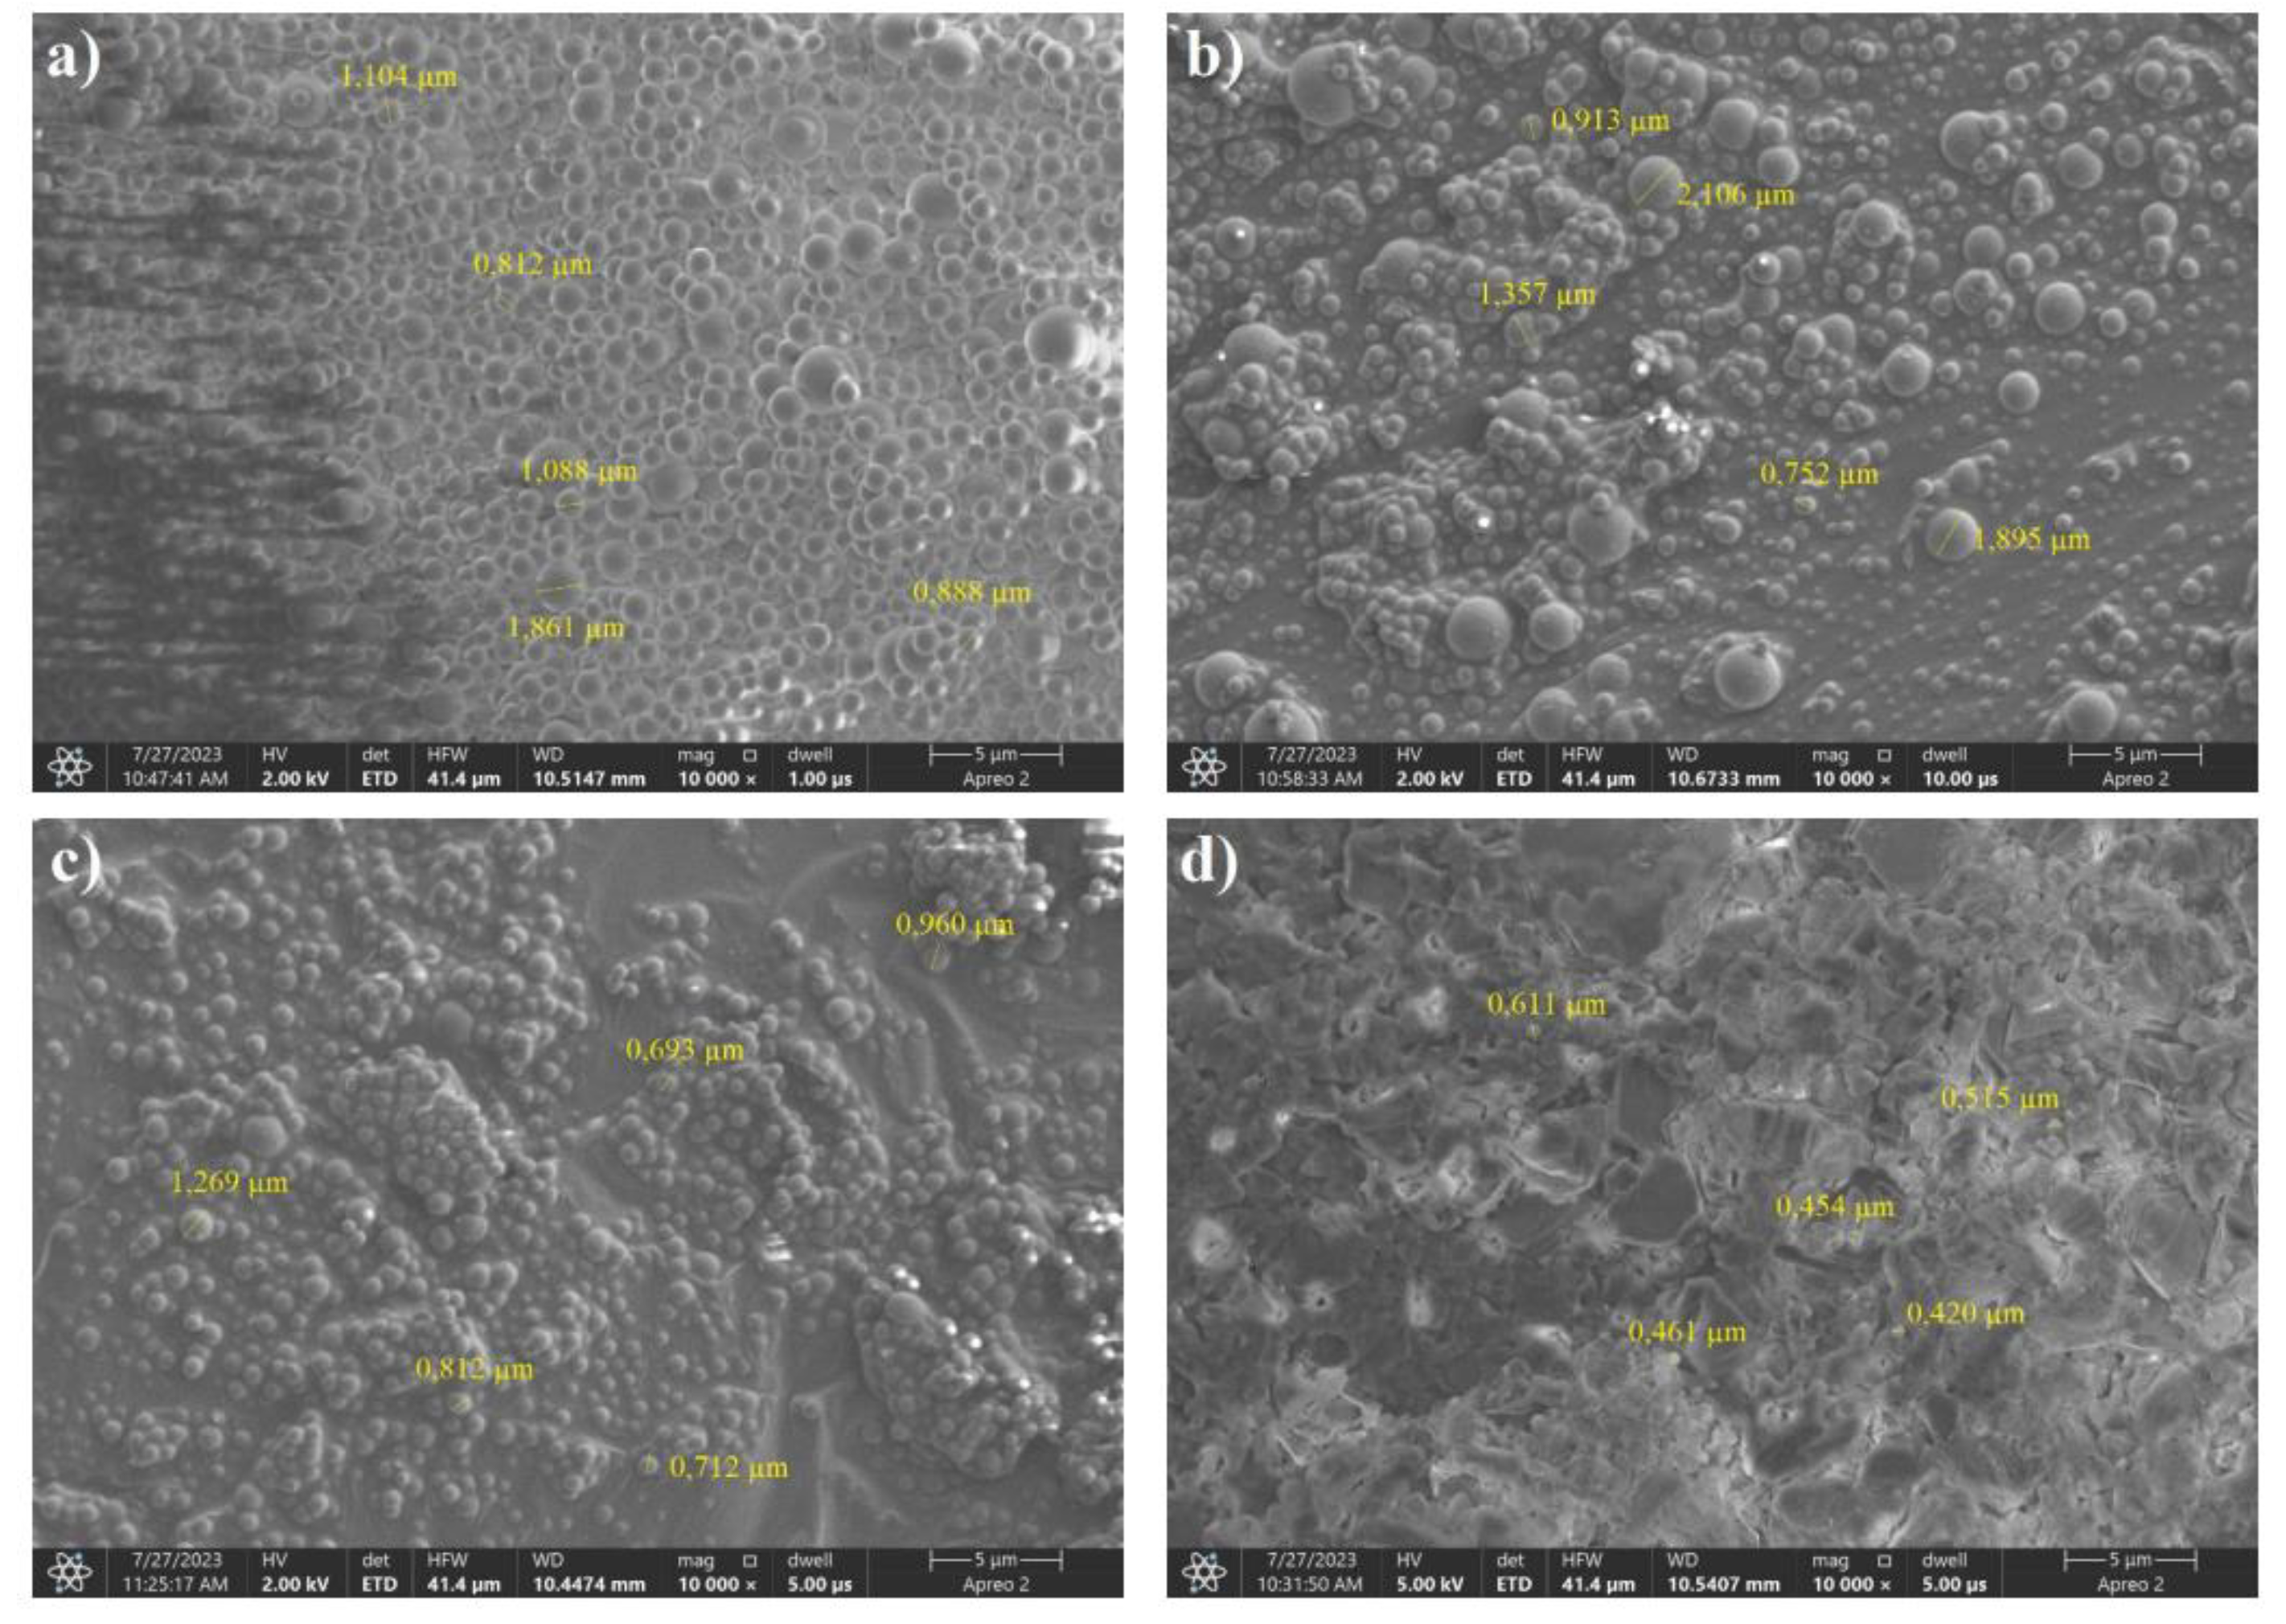
The microstructure images produced by SEM analysis showed that freeze-drying affected the morphology of the product (the same was true for other sugars, e.g., fructose).The sample with a low boron content was morphologically very similar to its counterpart dried by recrystallization. Samples 7:3 and 6:4 were characterized by significant agglomeration of carbon spheres with boric acid in between. The image of the sample with the highest boron content shows sparse carbon spheres within the boric acid matrix. The pronounced bi-modality of the grain size distribution was attributed to the precursor obtained by the hydrothermal treatment of a mixture of glucose and boric acid with carbon-to-boron ratios of 7:3 by weight.
Figure 8.
SEM images of the saccharide precursors obtained by the hydrothermal method from sorbitol and dried by recrystallization. Weight ratios of carbon to boron: a) 8:2, b) 7:3, (c) 6:4, (d) 5:5.
Figure 8.
SEM images of the saccharide precursors obtained by the hydrothermal method from sorbitol and dried by recrystallization. Weight ratios of carbon to boron: a) 8:2, b) 7:3, (c) 6:4, (d) 5:5.
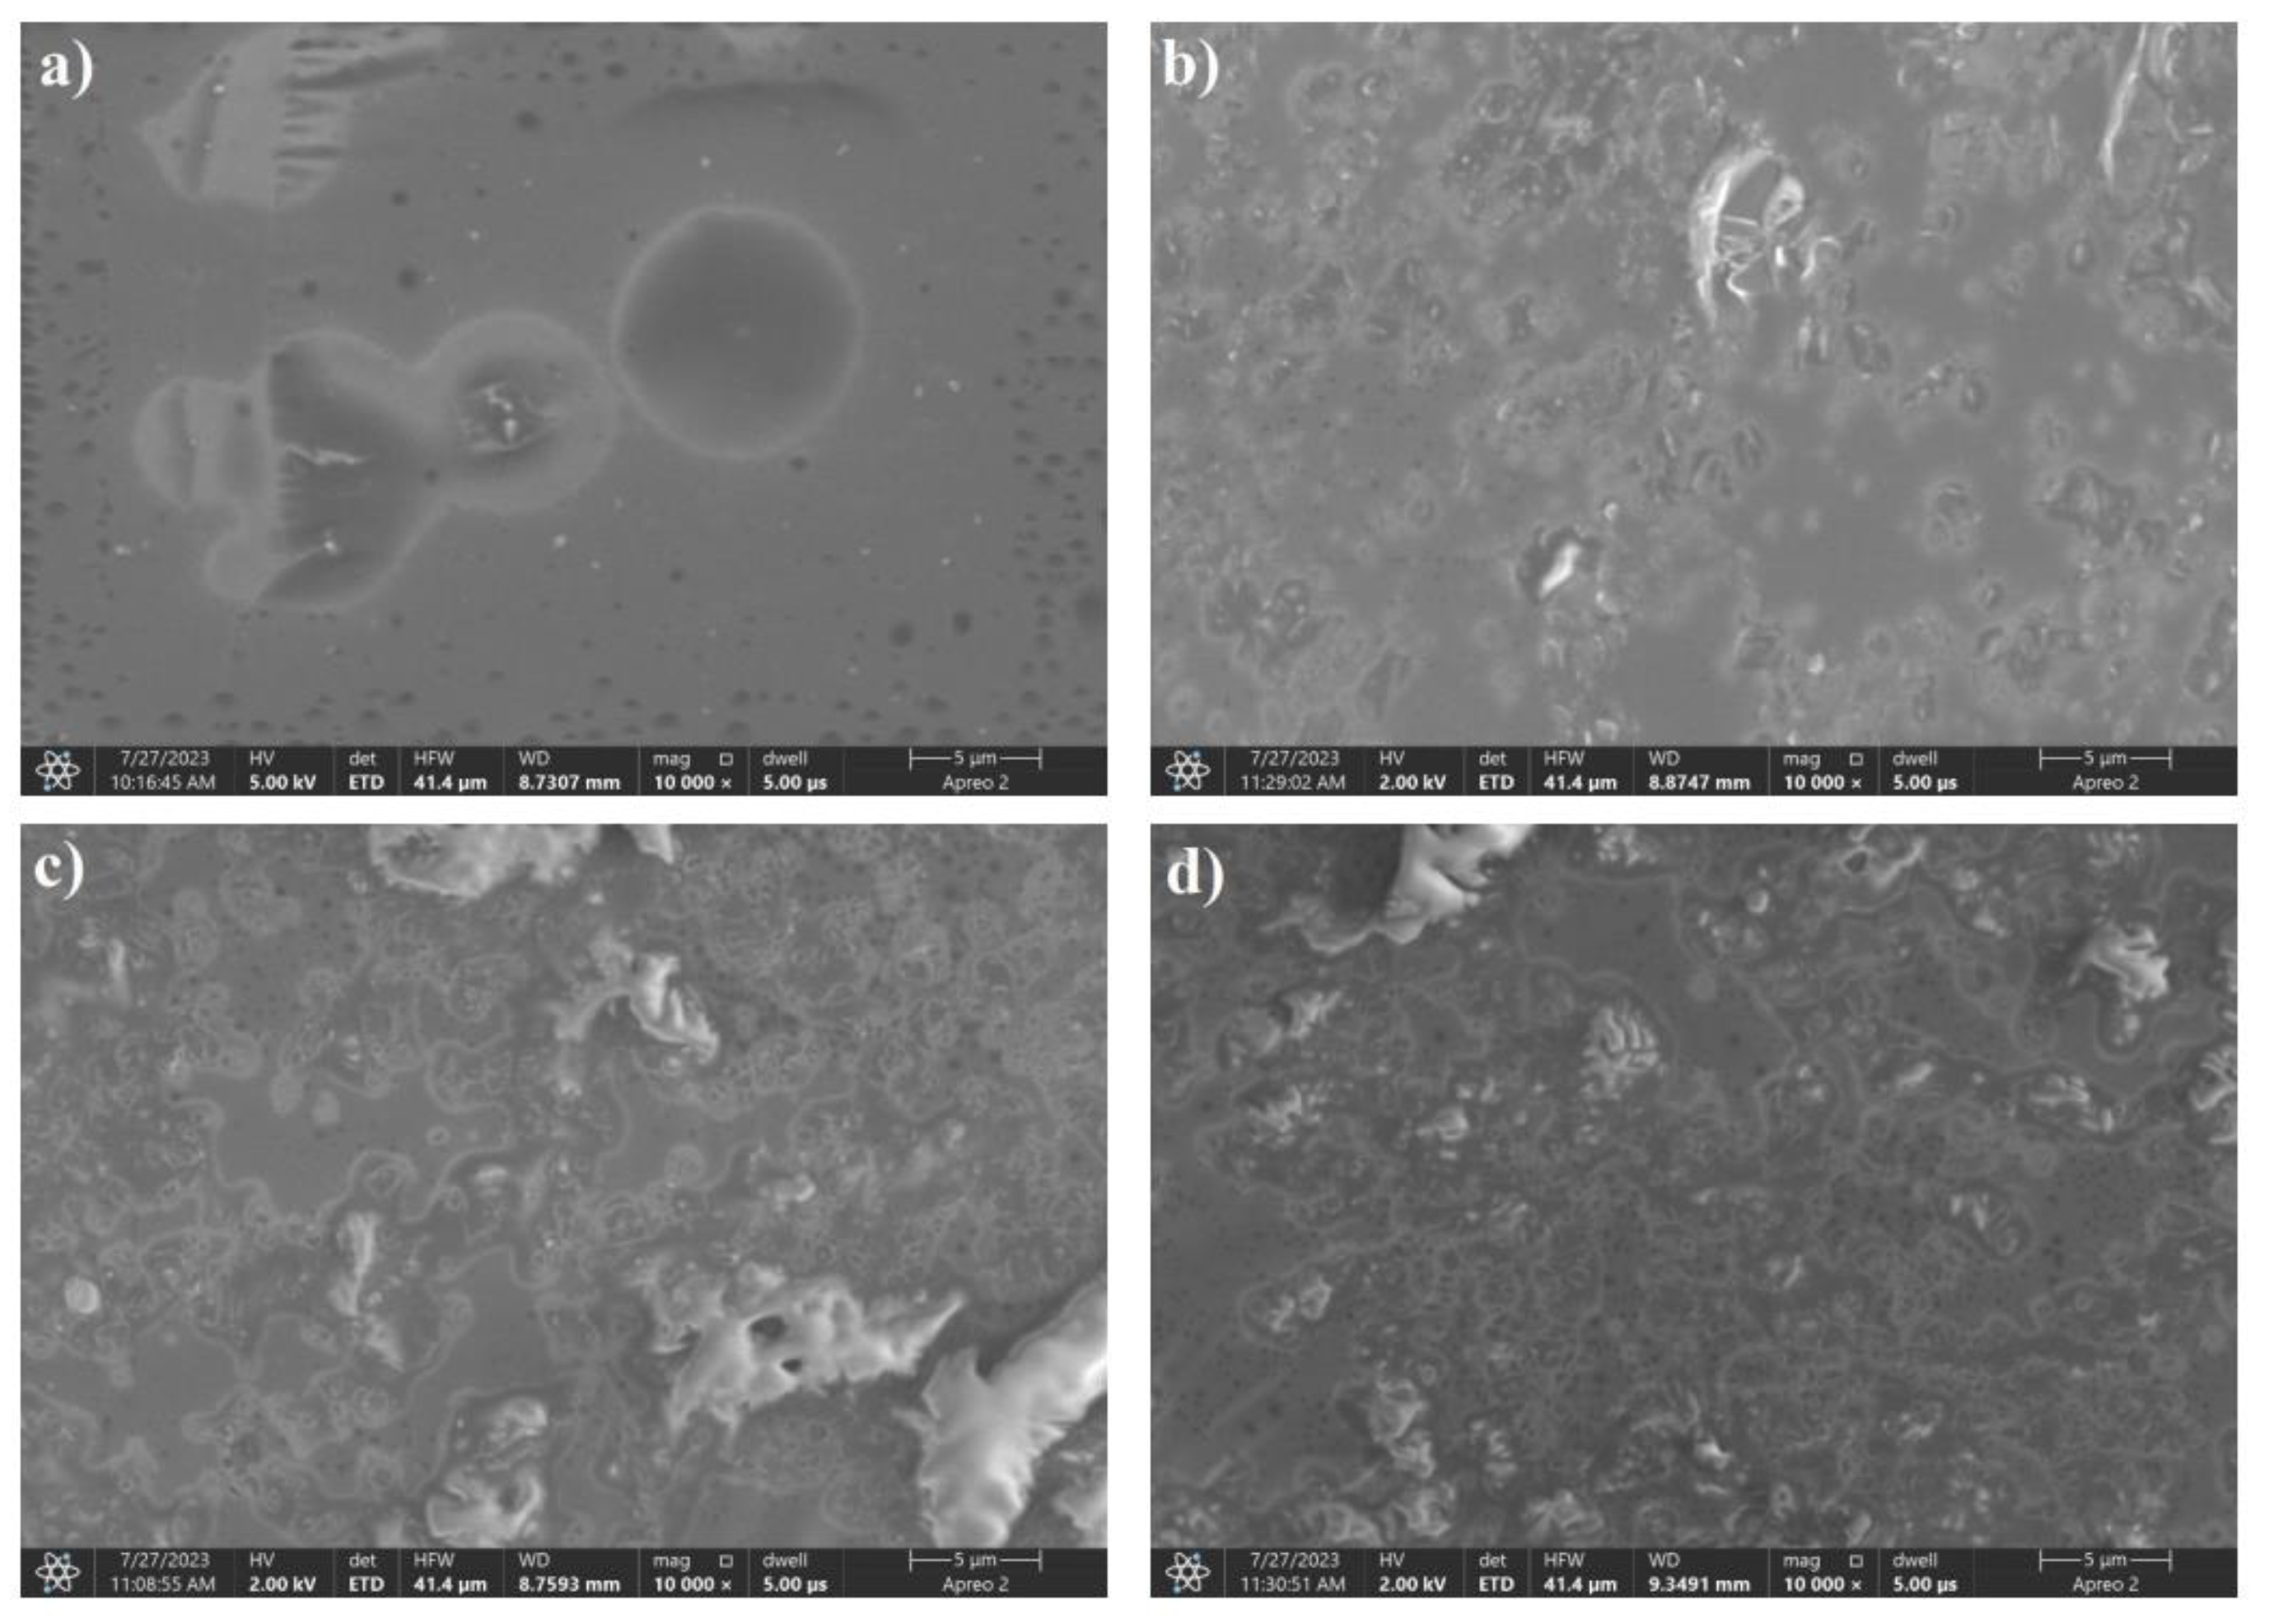
The SEM images shown in Figure 22 are significantly different from all the boron-saccharide precursor photographs shown above. The presence of carbon spheres, which is characteristic of the hydrothermal treatment of saccharides, was not clearly observed. The consistency of the product obtained after recrystallization resembled that of a glassy polymer. The organic nature of the obtained precursors was confirmed by the dark traces visible in the photograph of sample 8:2, which are areas burnt off under electron microscopy. As the proportion of boron to carbon increased, crystallites of boric acid could be seen on the surface of the polymer.
Figure 9.
SEM images of the saccharide precursors obtained by the hydrothermal method from sorbitol were freeze-dried. Weight ratios of carbon to boron: a) 8:2, b) 7:3, (c) 6:4, (d) 5:5.
Figure 9.
SEM images of the saccharide precursors obtained by the hydrothermal method from sorbitol were freeze-dried. Weight ratios of carbon to boron: a) 8:2, b) 7:3, (c) 6:4, (d) 5:5.
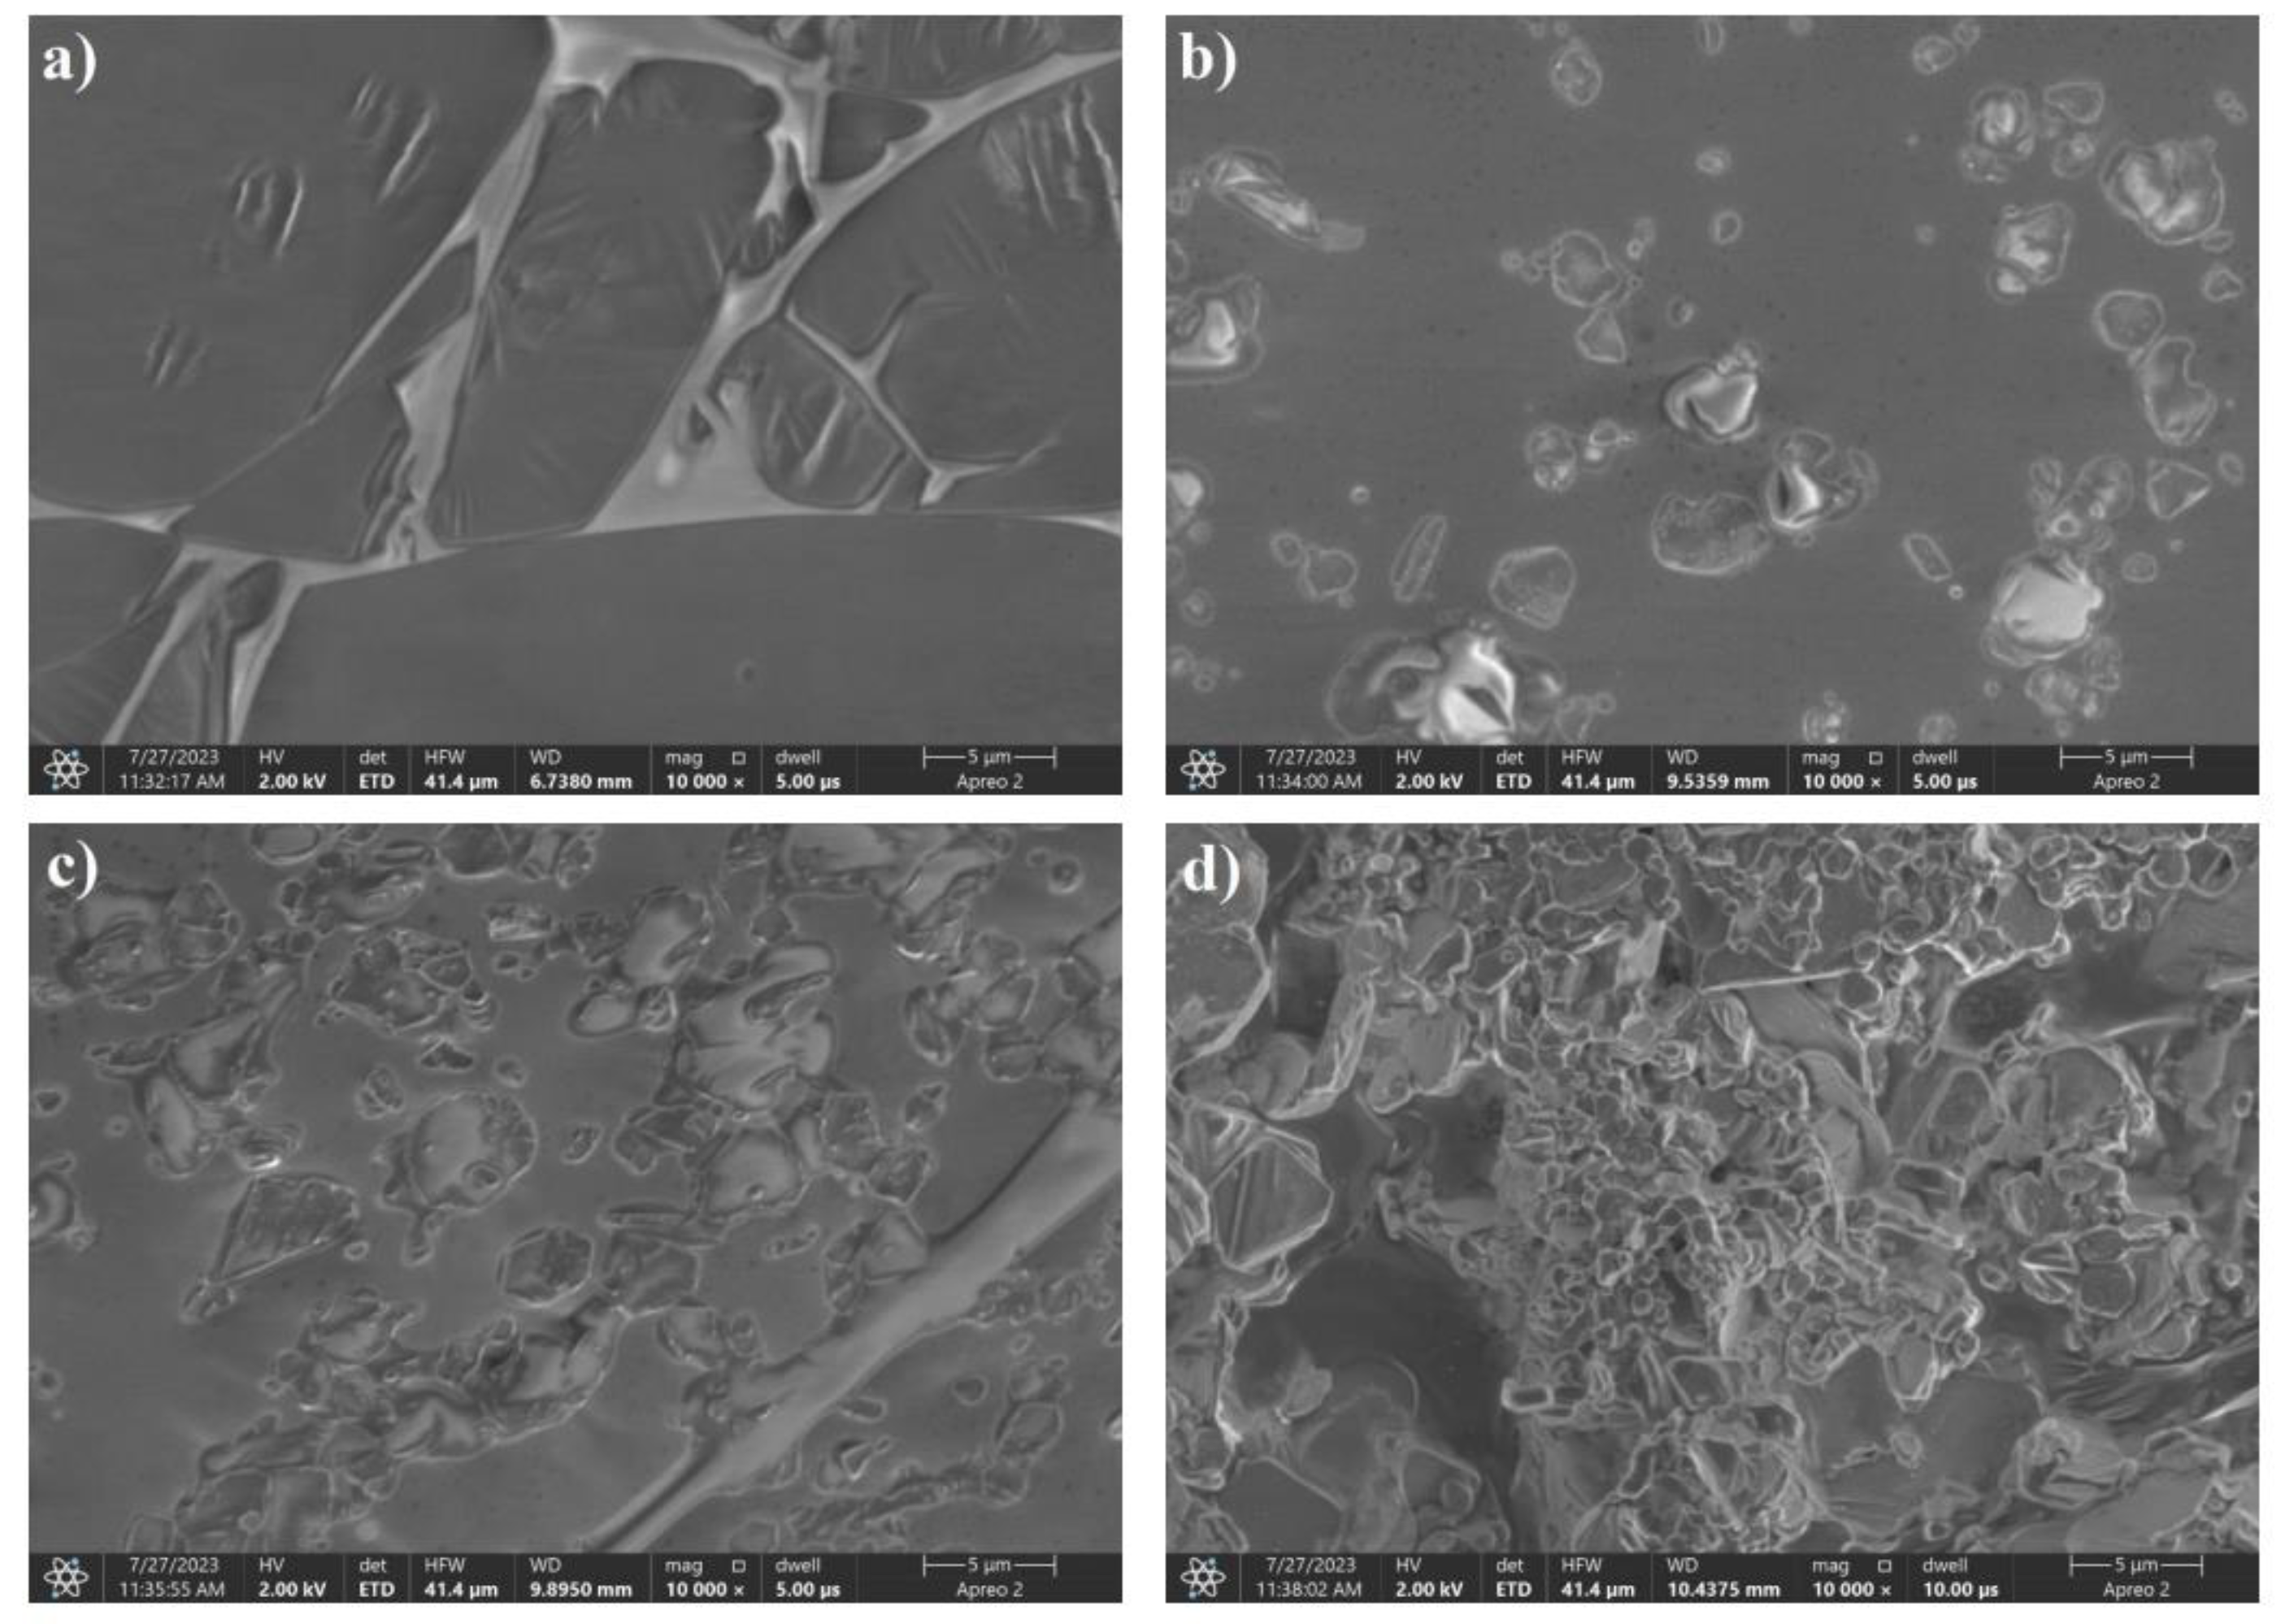
As shown in Figure 23, the freeze-drying process affected the morphology of the resulting product, regardless of the precursor used.Boric acid is visible in the SEM images.Powders with a weight proportion of carbon greater than 50% obtained by freeze-drying immediately absorbed the water present in the air when removed from the vacuum.Samples with a high proportion of carbon were characterized by the consistency of liquids with very high viscosities.
Based on the studies presented above, a graph comparing the particle sizes of the precursors before and after the dehydration process (considering both possible recrystallization and dehydration processes) was plotted.
Figure 10.
Comparison of precursor particle sizes before and after dehydration.
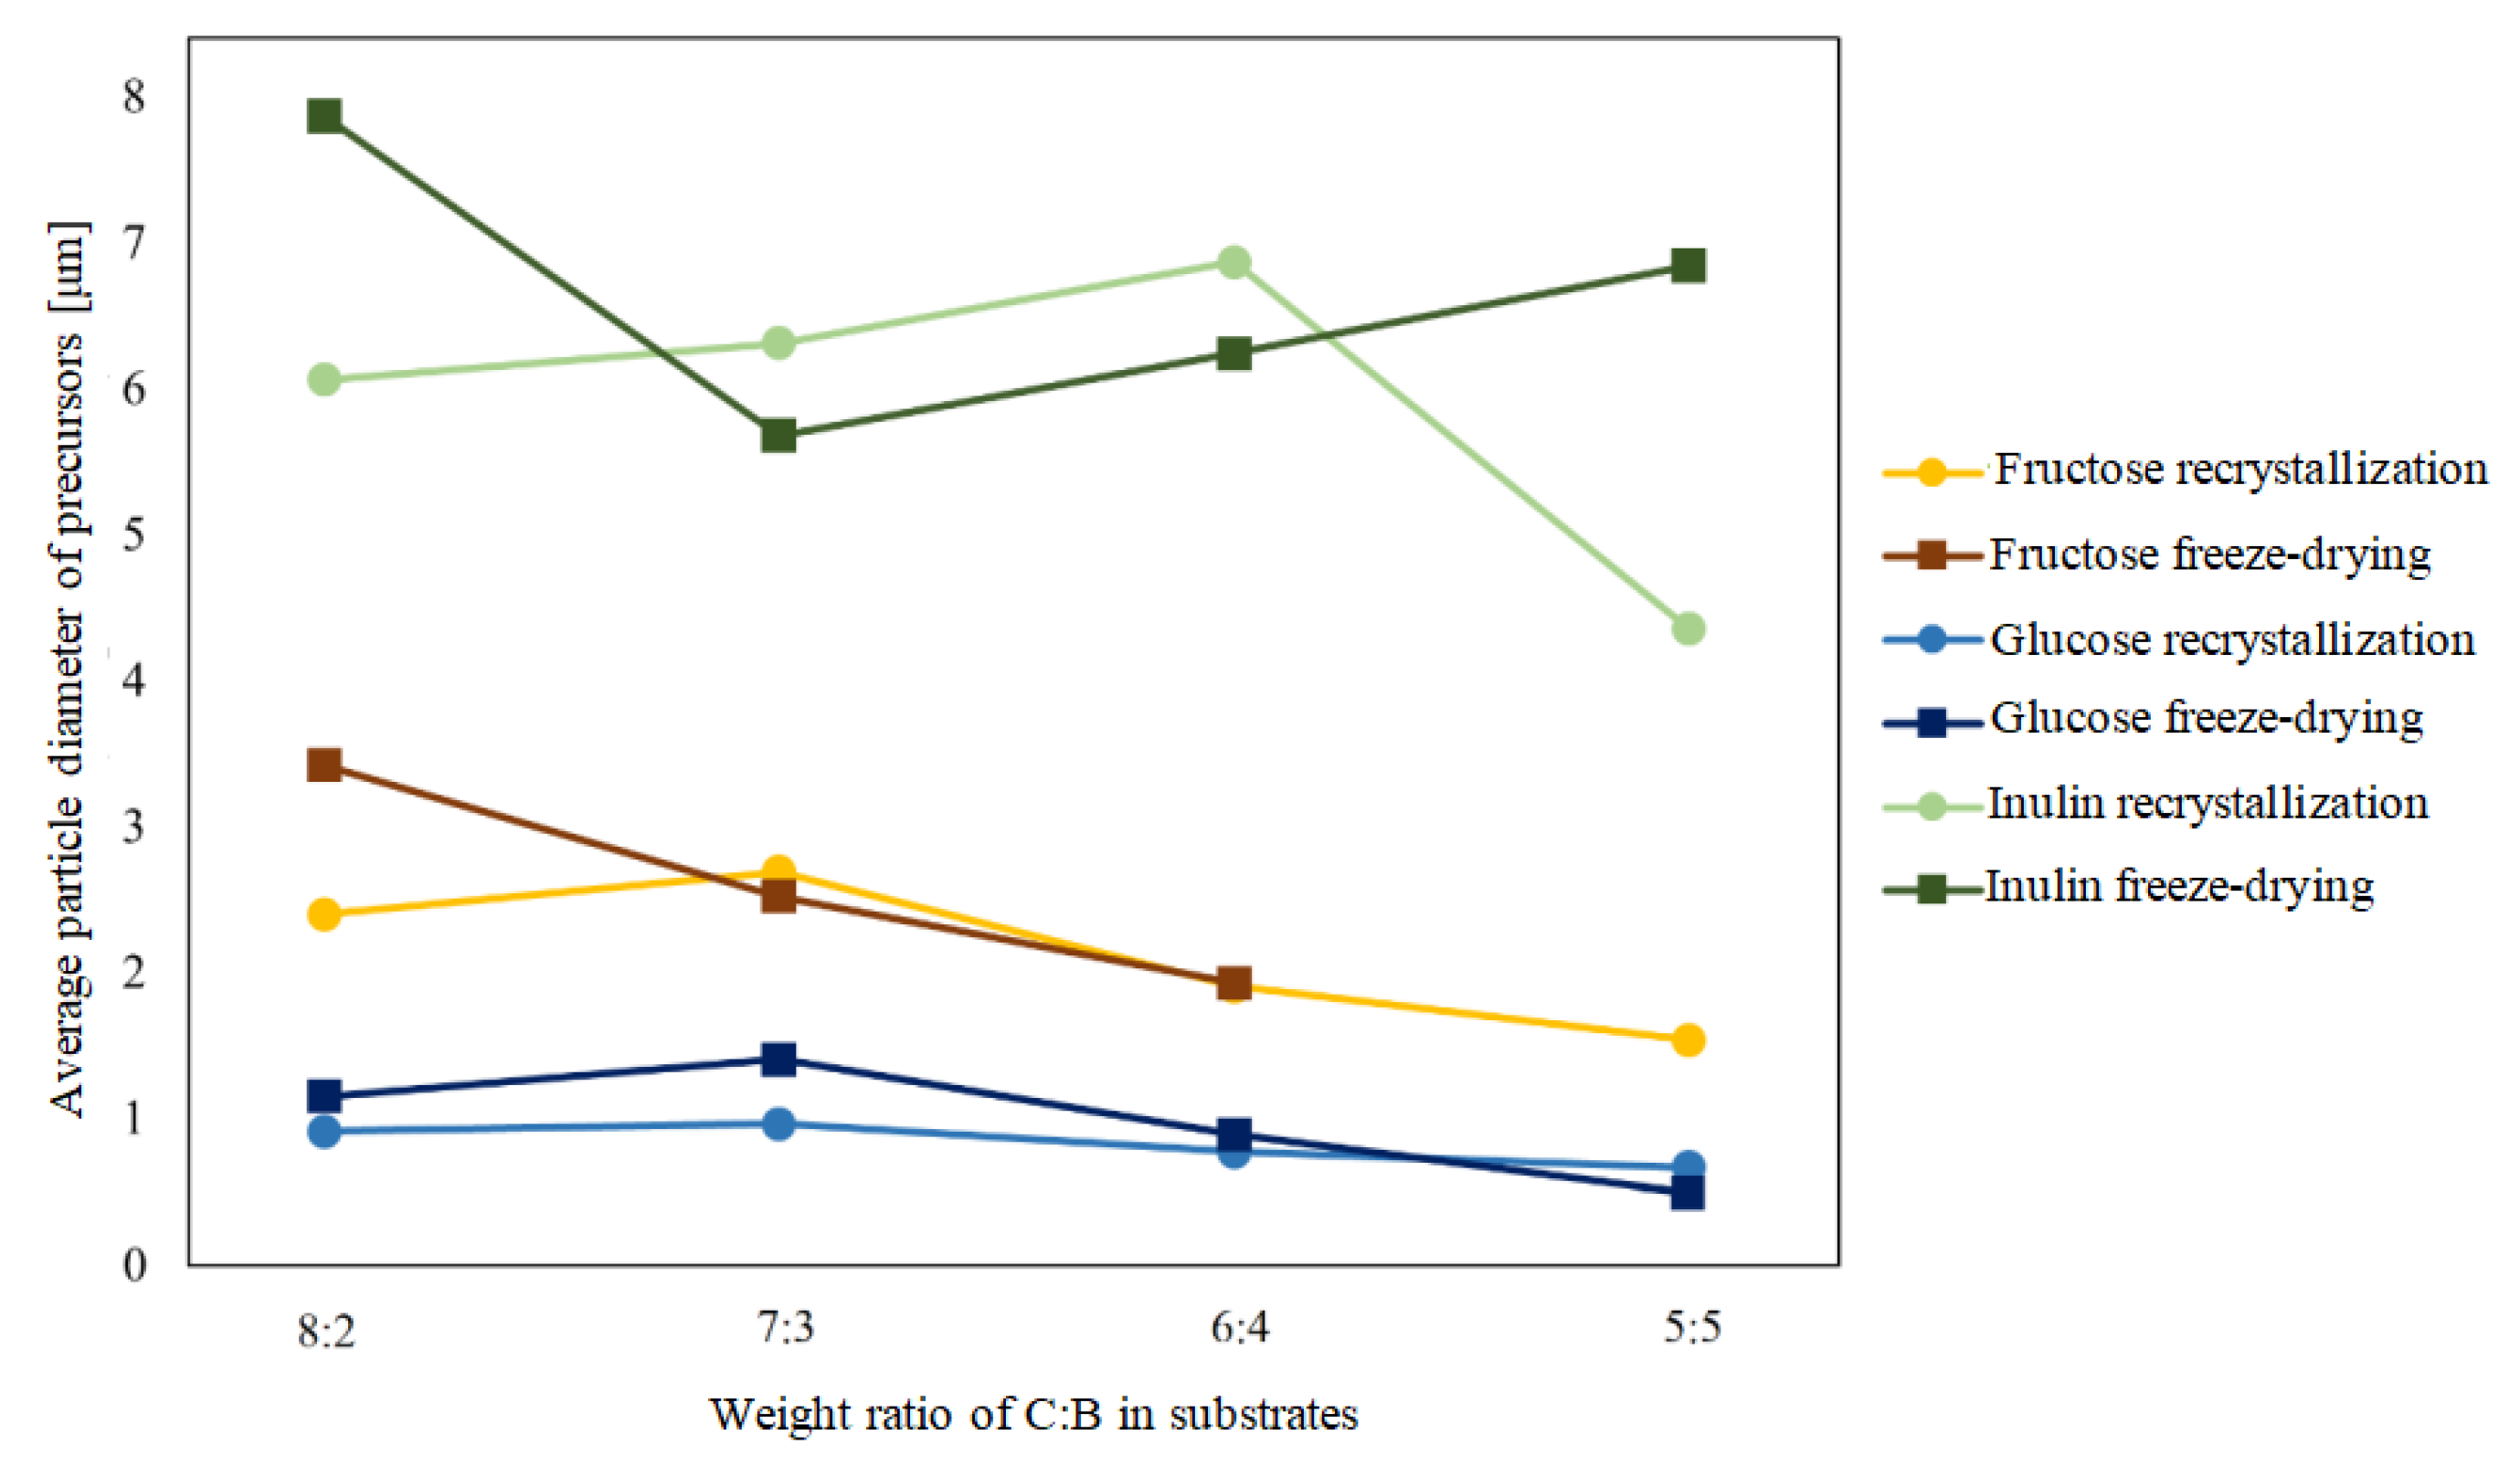
The data shown in Figure 10 demonstrate that the dehydration process, carried out by both freeze-drying and recrystallization, affects the particle size of the boron-saccharide precursors for samples in which polysaccharide inulin was the carbon source. The diameter of the inulin precursor after water removal was 40 times that of the particles in the suspension, indicating that spherical precursor particles with diameters of 4-8 μm were agglomerates of smaller spheres with diameters of approximately 0.2 μm.
3.3. SEM images for final B4C product
B4C powders were produced using the boron-saccharide precursors tested according to the procedure described above.
Figure 11.
SEM images of boron carbide powders produced from a glucose precursor dried by recrystallization. Weight ratios of carbon to boron: a) 8:2, b) 7:3, c) 6:4, d) 5:5.
Figure 11.
SEM images of boron carbide powders produced from a glucose precursor dried by recrystallization. Weight ratios of carbon to boron: a) 8:2, b) 7:3, c) 6:4, d) 5:5.
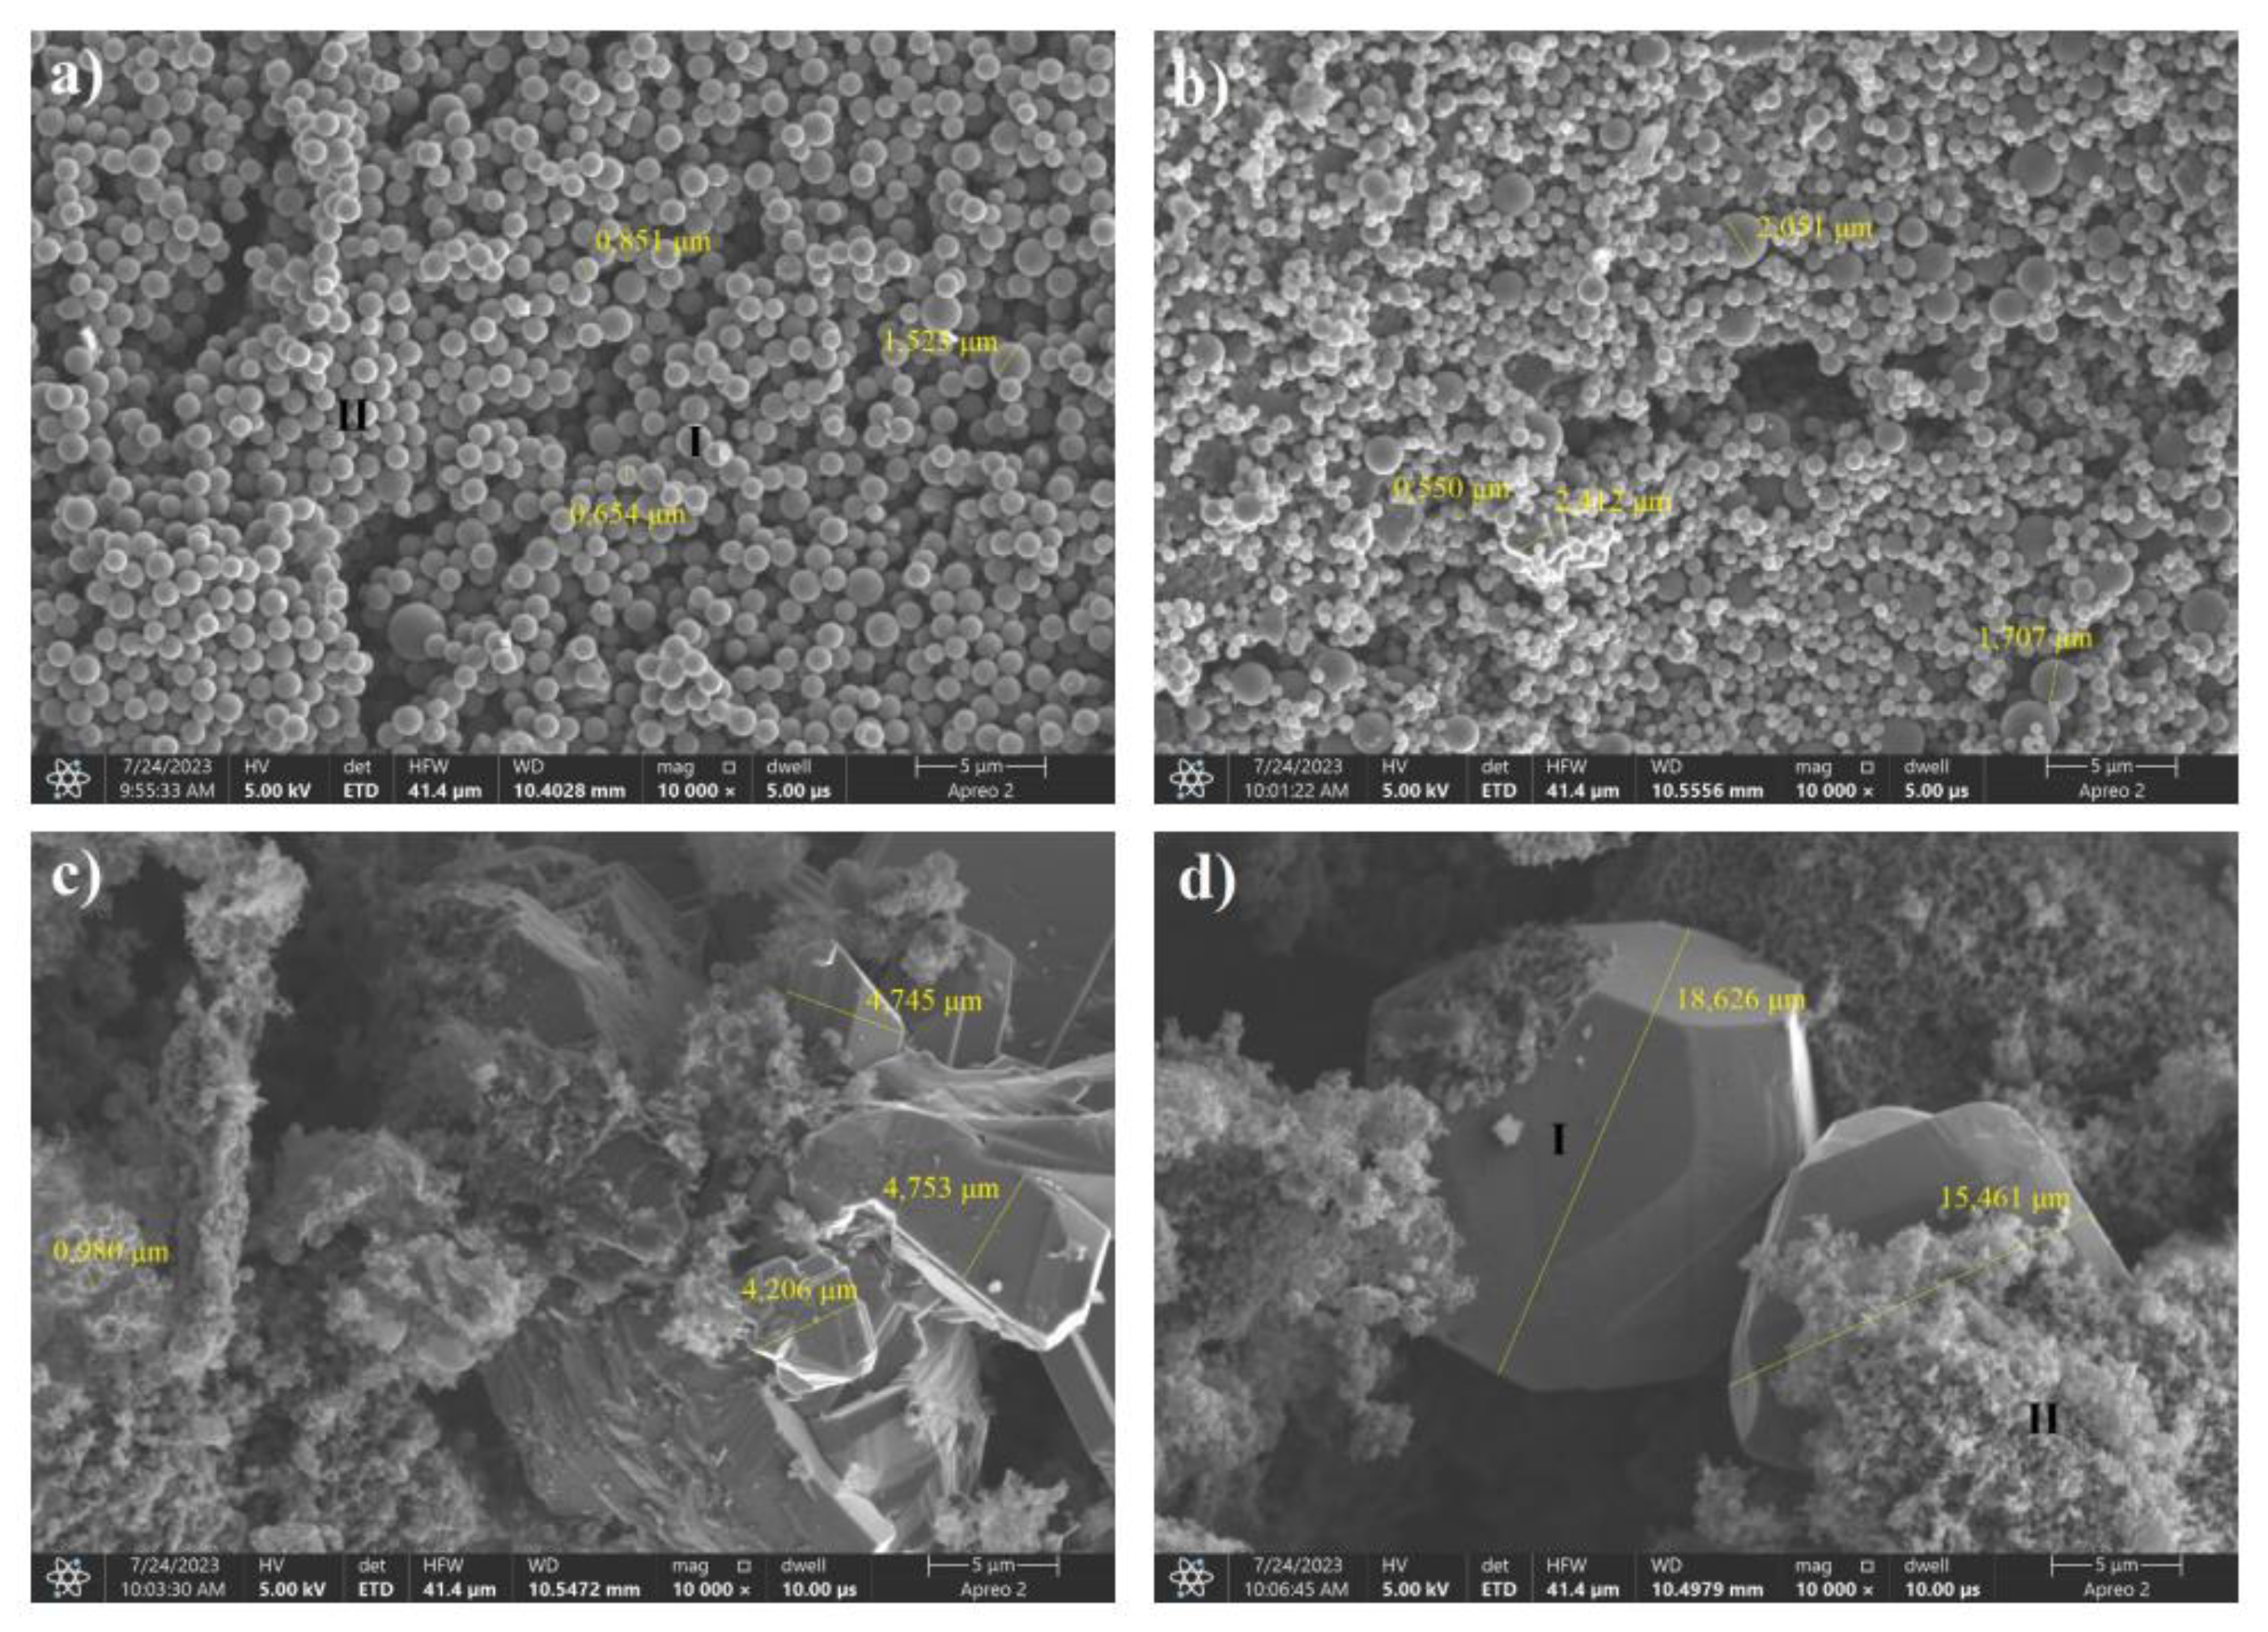
The SEM images are shown in Fig. 11. shows a change in the morphology of the resulting B4C powders with changing C:B ratios. However, structures that were significantly different from the precursors used in the reaction were only visible at boron weight ratios above 70%.The grain morphology was different in the images of the samples with the highest proportion of carbon in the precursor. At a lower boron proportion, particles that are aggregates of plate-shaped grains are visible. For samples with the highest proportion of boron, the grains had a near-spherical shape. The size of the microstructural elements increased as the proportion of carbon in the precursors decreased. Based on EDS analysis, the large particles visible in the image (Fig 11D) were partly composed of boron carbide. The SEM image shows the interior of the particles, whose microstructure was clearly porous. The pores are spherical in shape. The recorded proportion of carbon (greater than 20%) suggests that none of the precursors building large grains reacted.
Figure 12.
SEM images of boron carbide powders produced from a glucose precursor by freeze-drying. Weight ratios of carbon to boron: a) 8:2, b) 7:3, c) 6:4, d) 5:5.
Figure 12.
SEM images of boron carbide powders produced from a glucose precursor by freeze-drying. Weight ratios of carbon to boron: a) 8:2, b) 7:3, c) 6:4, d) 5:5.
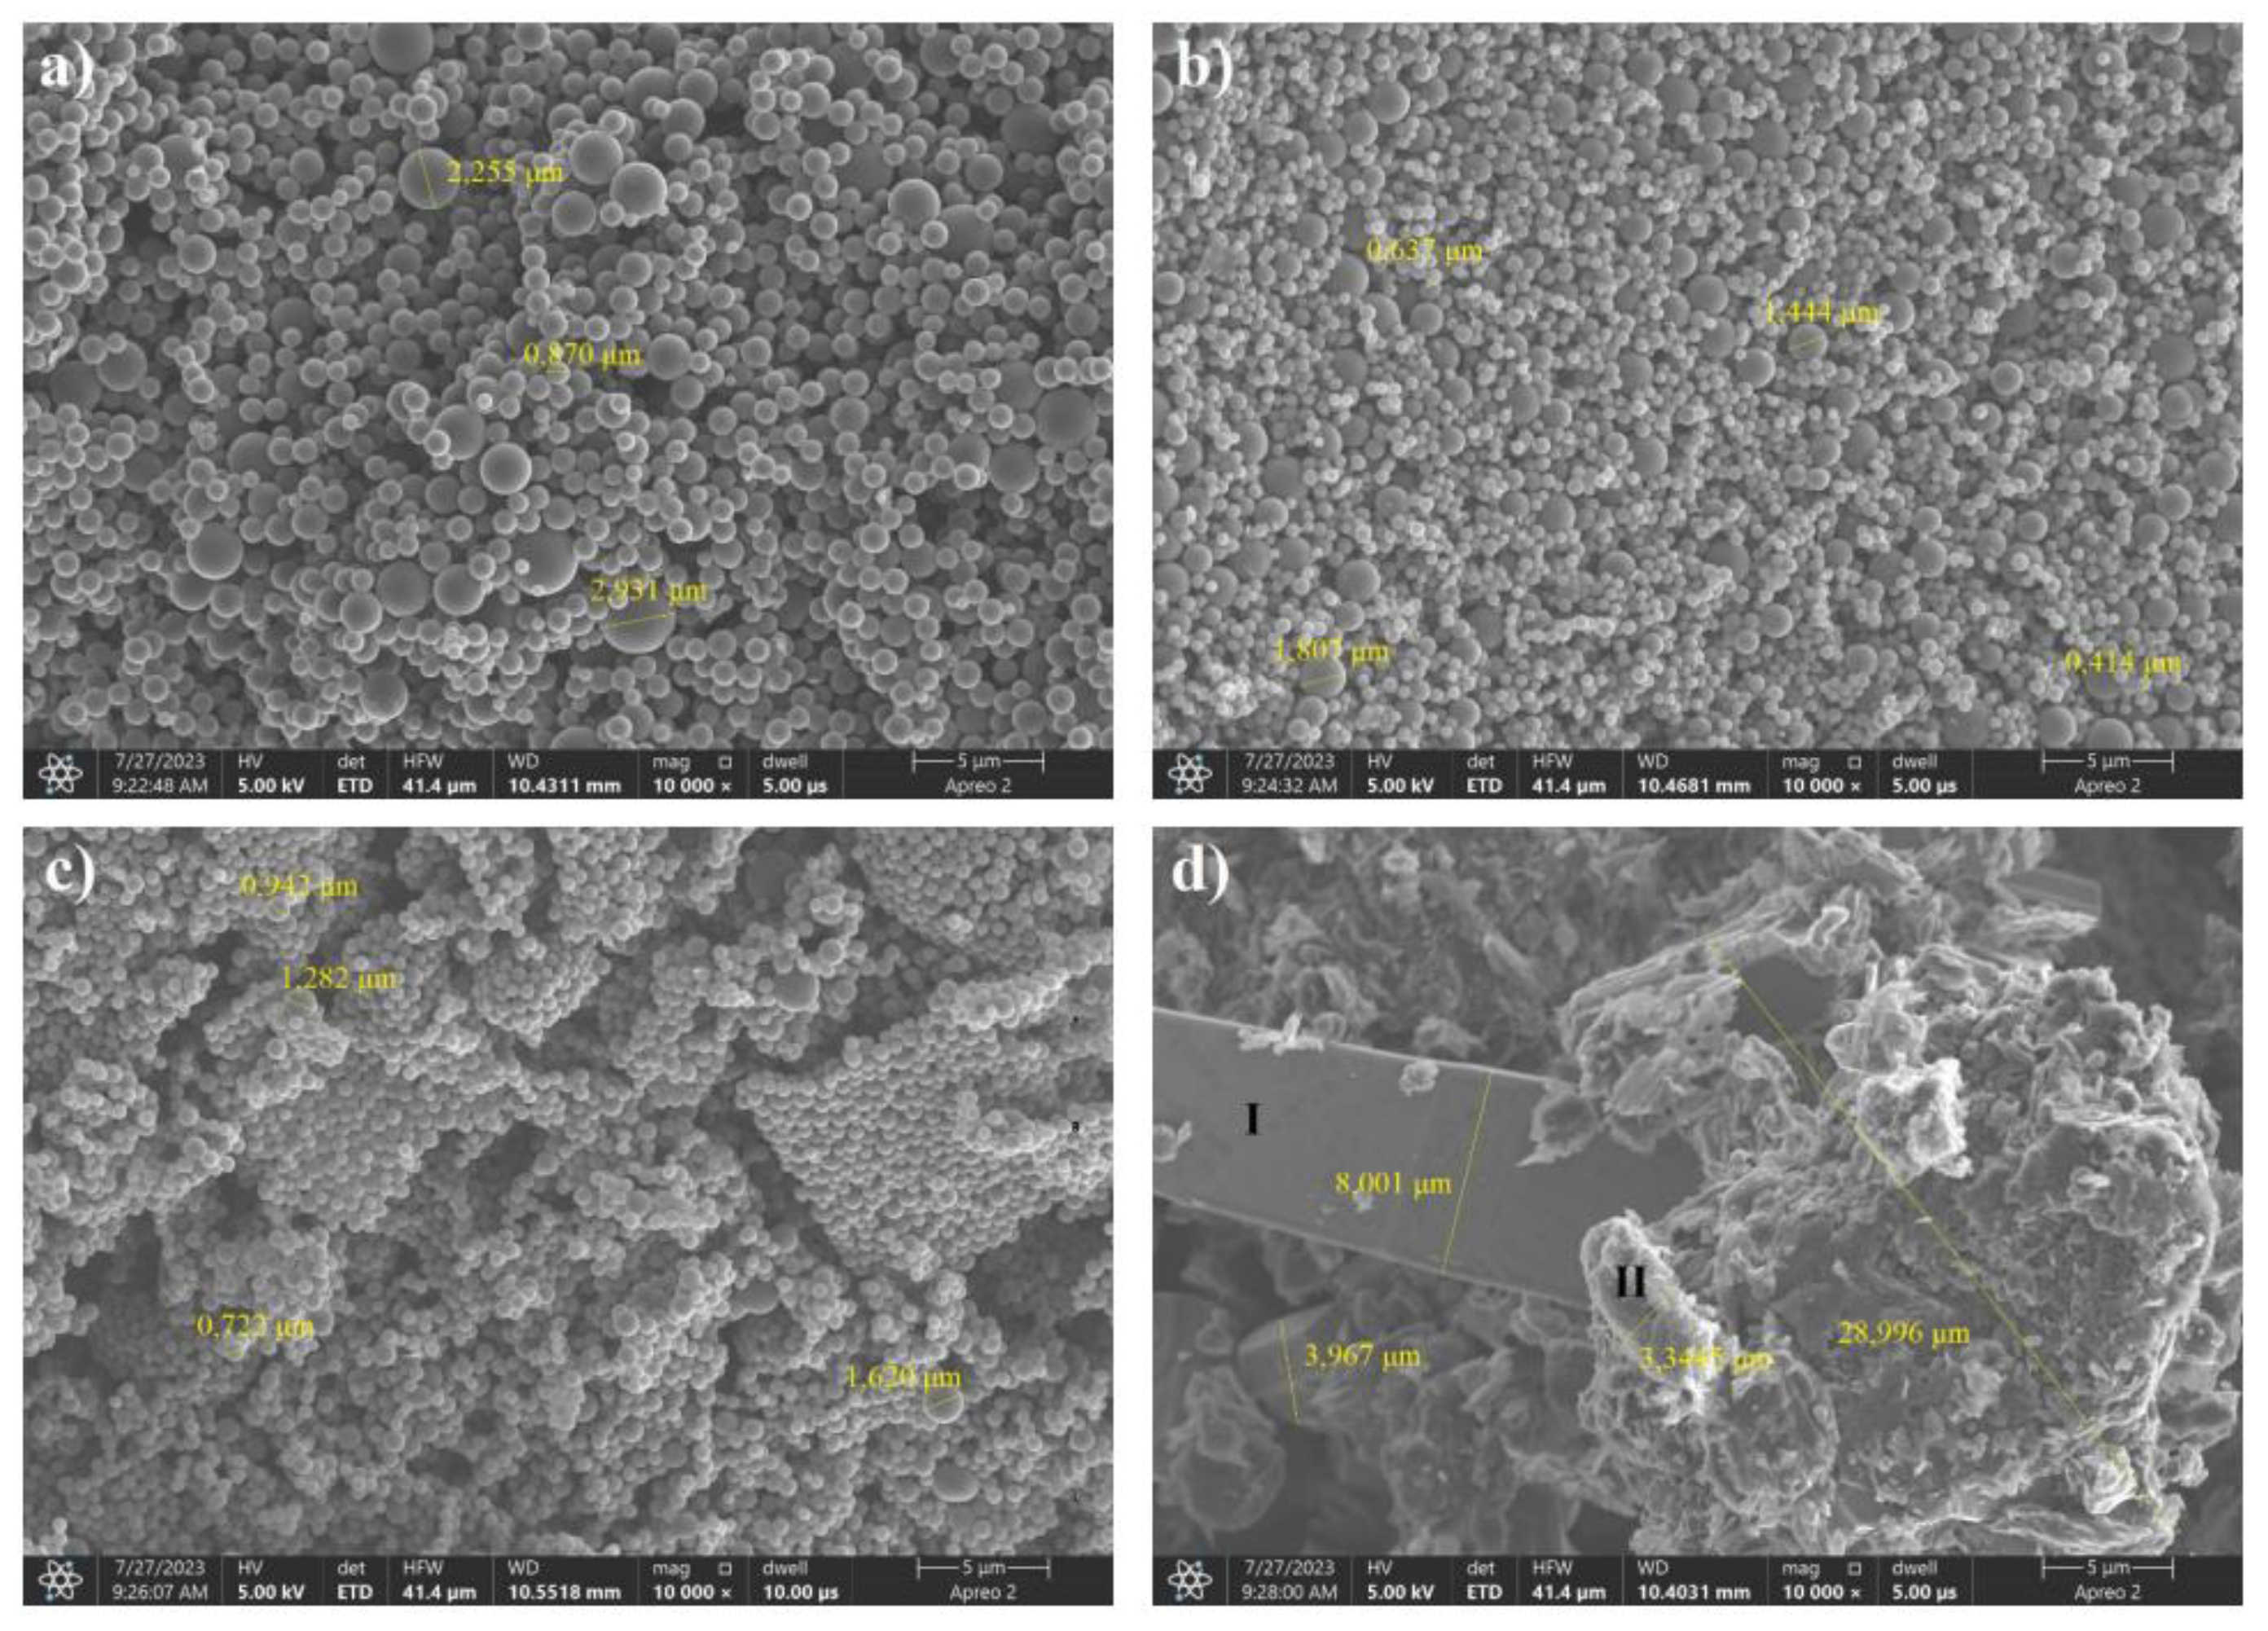
The SEM images shown in Figure 12 provide evidence that, as the proportion of boron in the reaction mixture increases, there is a gradual agglomeration of the precursors, followed by a reaction between boron and carbon. A particle form different from the spherical form was visible only in the case of the sample with the highest boron content. EDS analysis showed that only particle "I" in Fig12D is made of boron carbide, while structure "II" is an agglomerate of unreacted precursors.
Figure 13.
SEM images of boron carbide powders produced from the sorbitol precursor dried by recrystallization. Weight ratios of carbon to boron: a) 8:2, b) 7:3, c) 6:4, d) 5:5.
Figure 13.
SEM images of boron carbide powders produced from the sorbitol precursor dried by recrystallization. Weight ratios of carbon to boron: a) 8:2, b) 7:3, c) 6:4, d) 5:5.
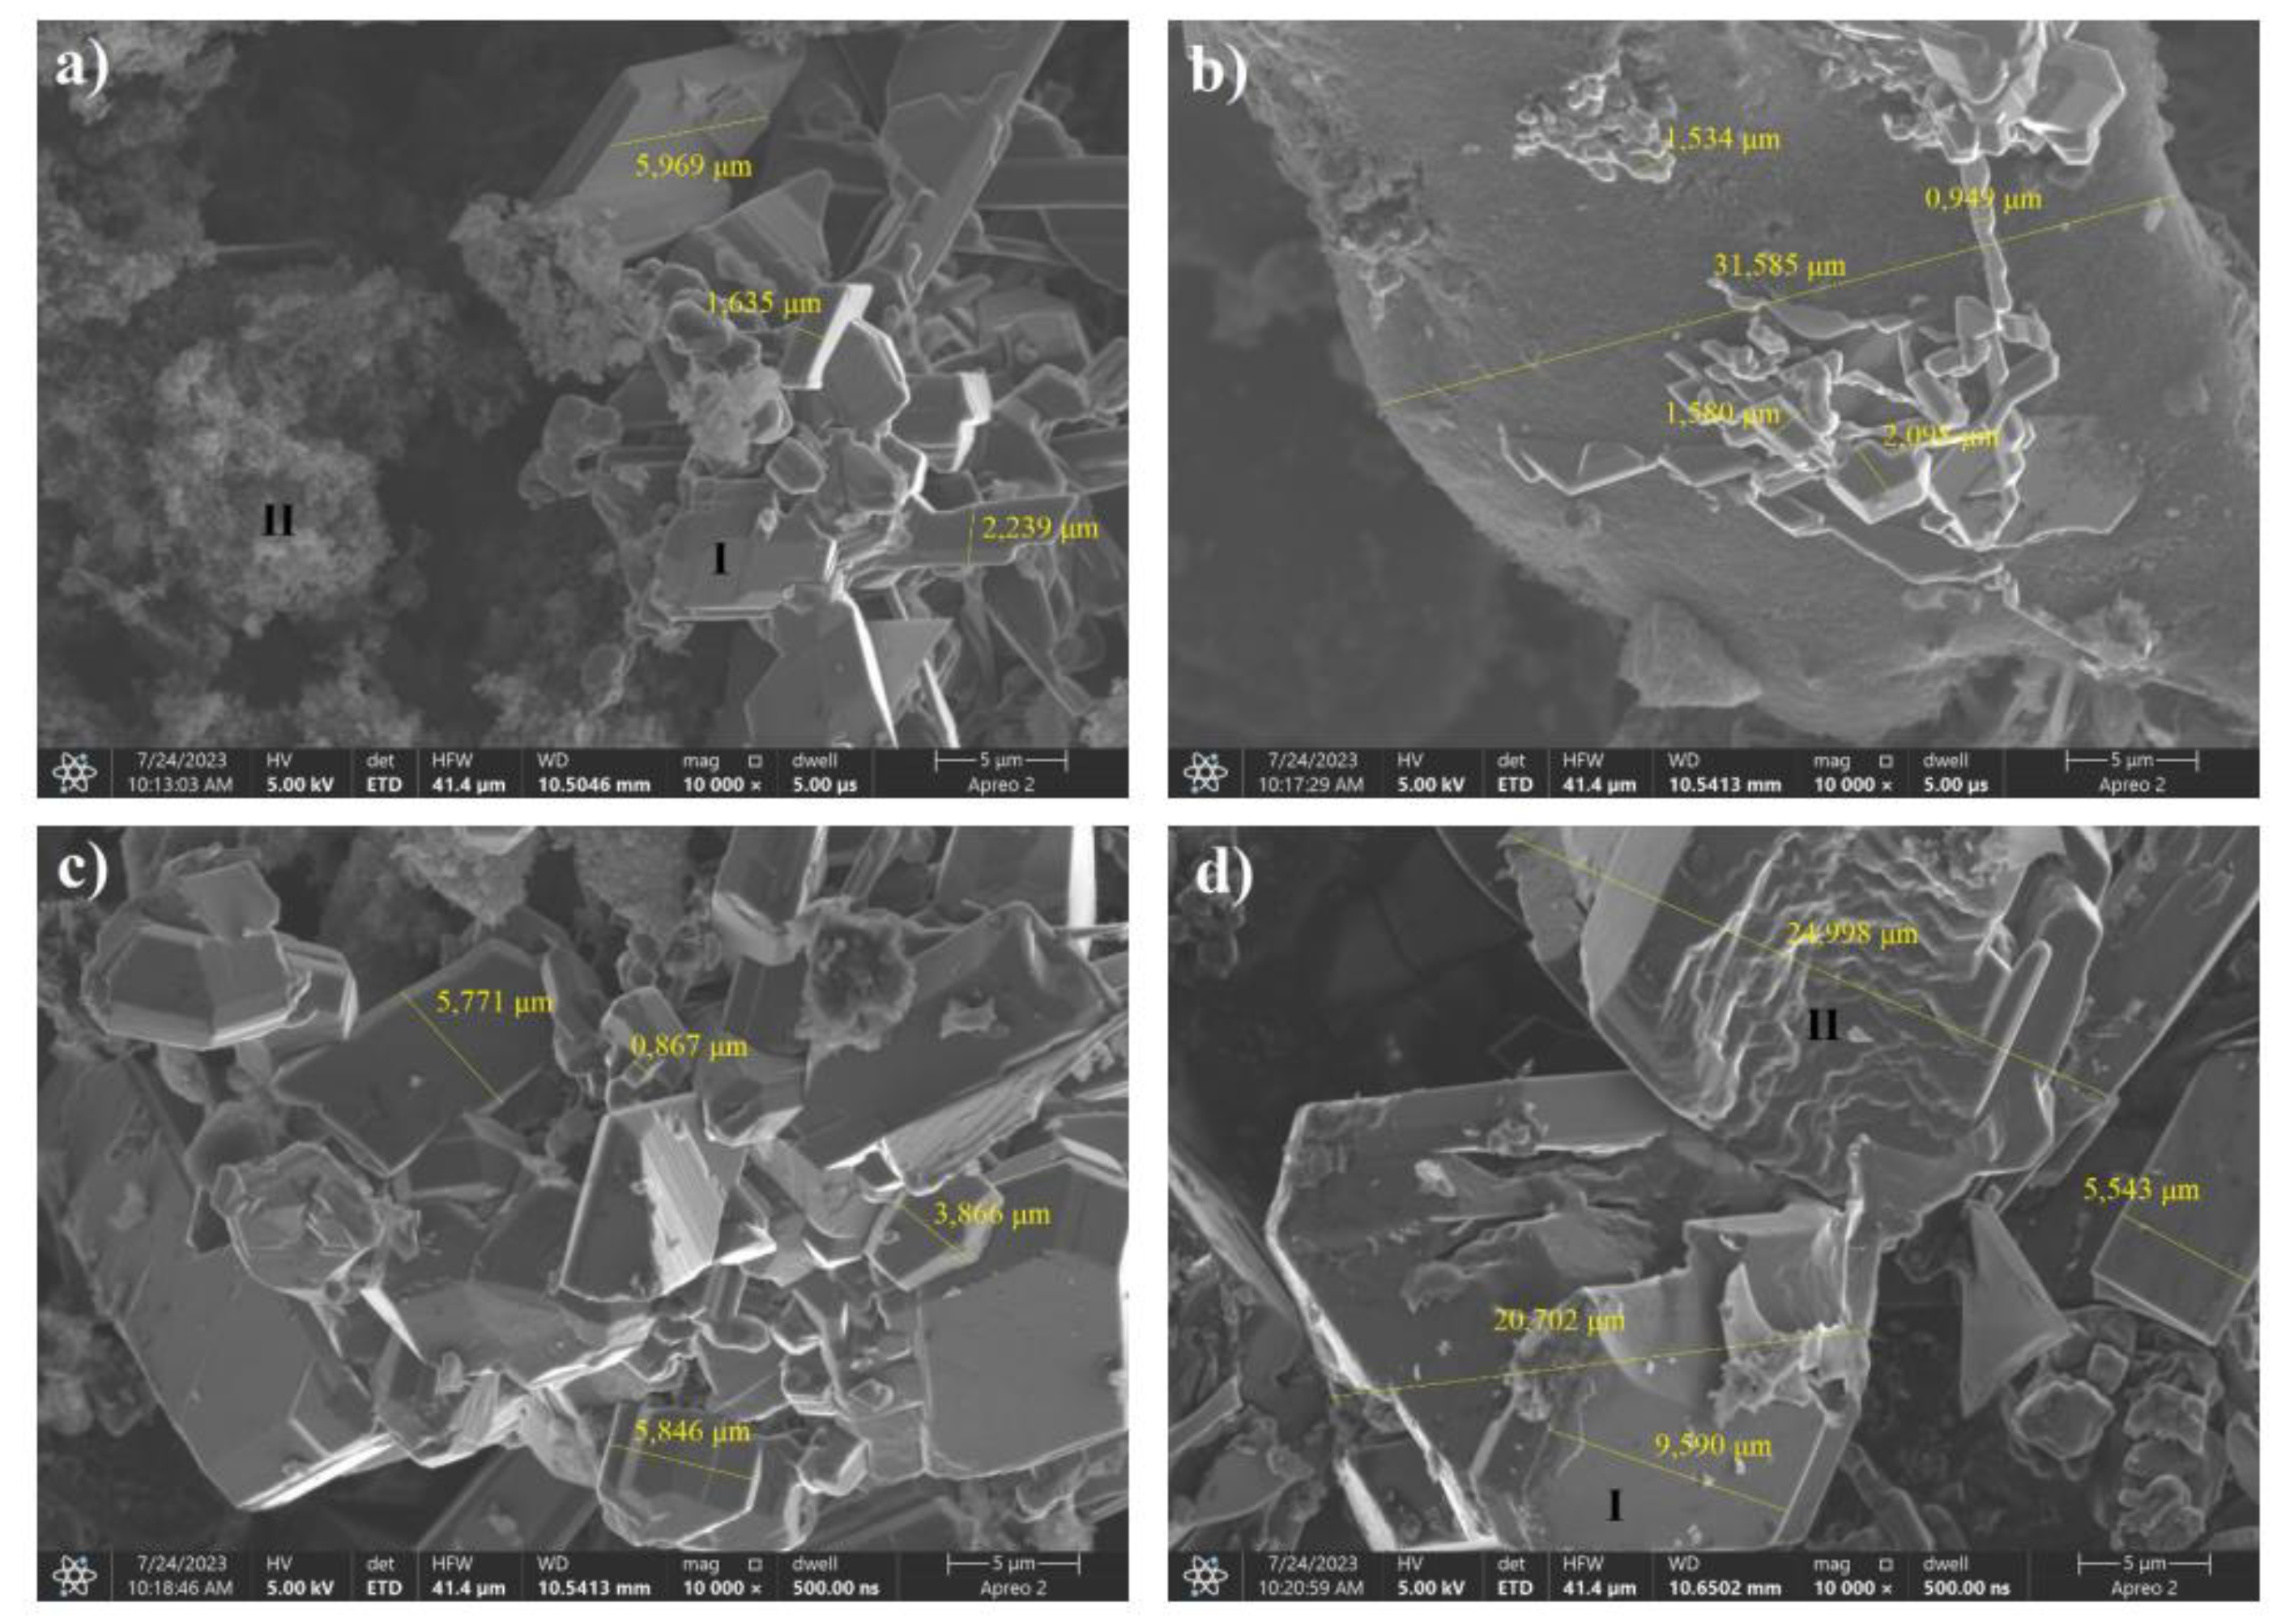
SEM images showed that precursors containing sorbitol as a carbon source for as low as 20 wt% boron allowed the boron carbide formation reaction to occur. The grains were composed of agglomerates of lamellar particles whose dimensions increased with increasing boron content in the reaction mixture. For samples with a boron content of less than 40%, areas of morphology significantly different from lamellae, which are boron carbide grains, were visible. For samples in which the boron content in the precursor exceeded 30%, only crystallites could be seen in the SEM images.EDS analysis showed that for sorbitol precursors, the formation of B4C occurred independently of the C:B ratio in the synthesis substrate.
Figure 14.
SEM images of boron carbide powders produced from a sorbitol precursor by freeze-drying. Weight ratios of carbon to boron: a) 8:2, b) 7:3, c) 6:4, d) 5:5.
Figure 14.
SEM images of boron carbide powders produced from a sorbitol precursor by freeze-drying. Weight ratios of carbon to boron: a) 8:2, b) 7:3, c) 6:4, d) 5:5.
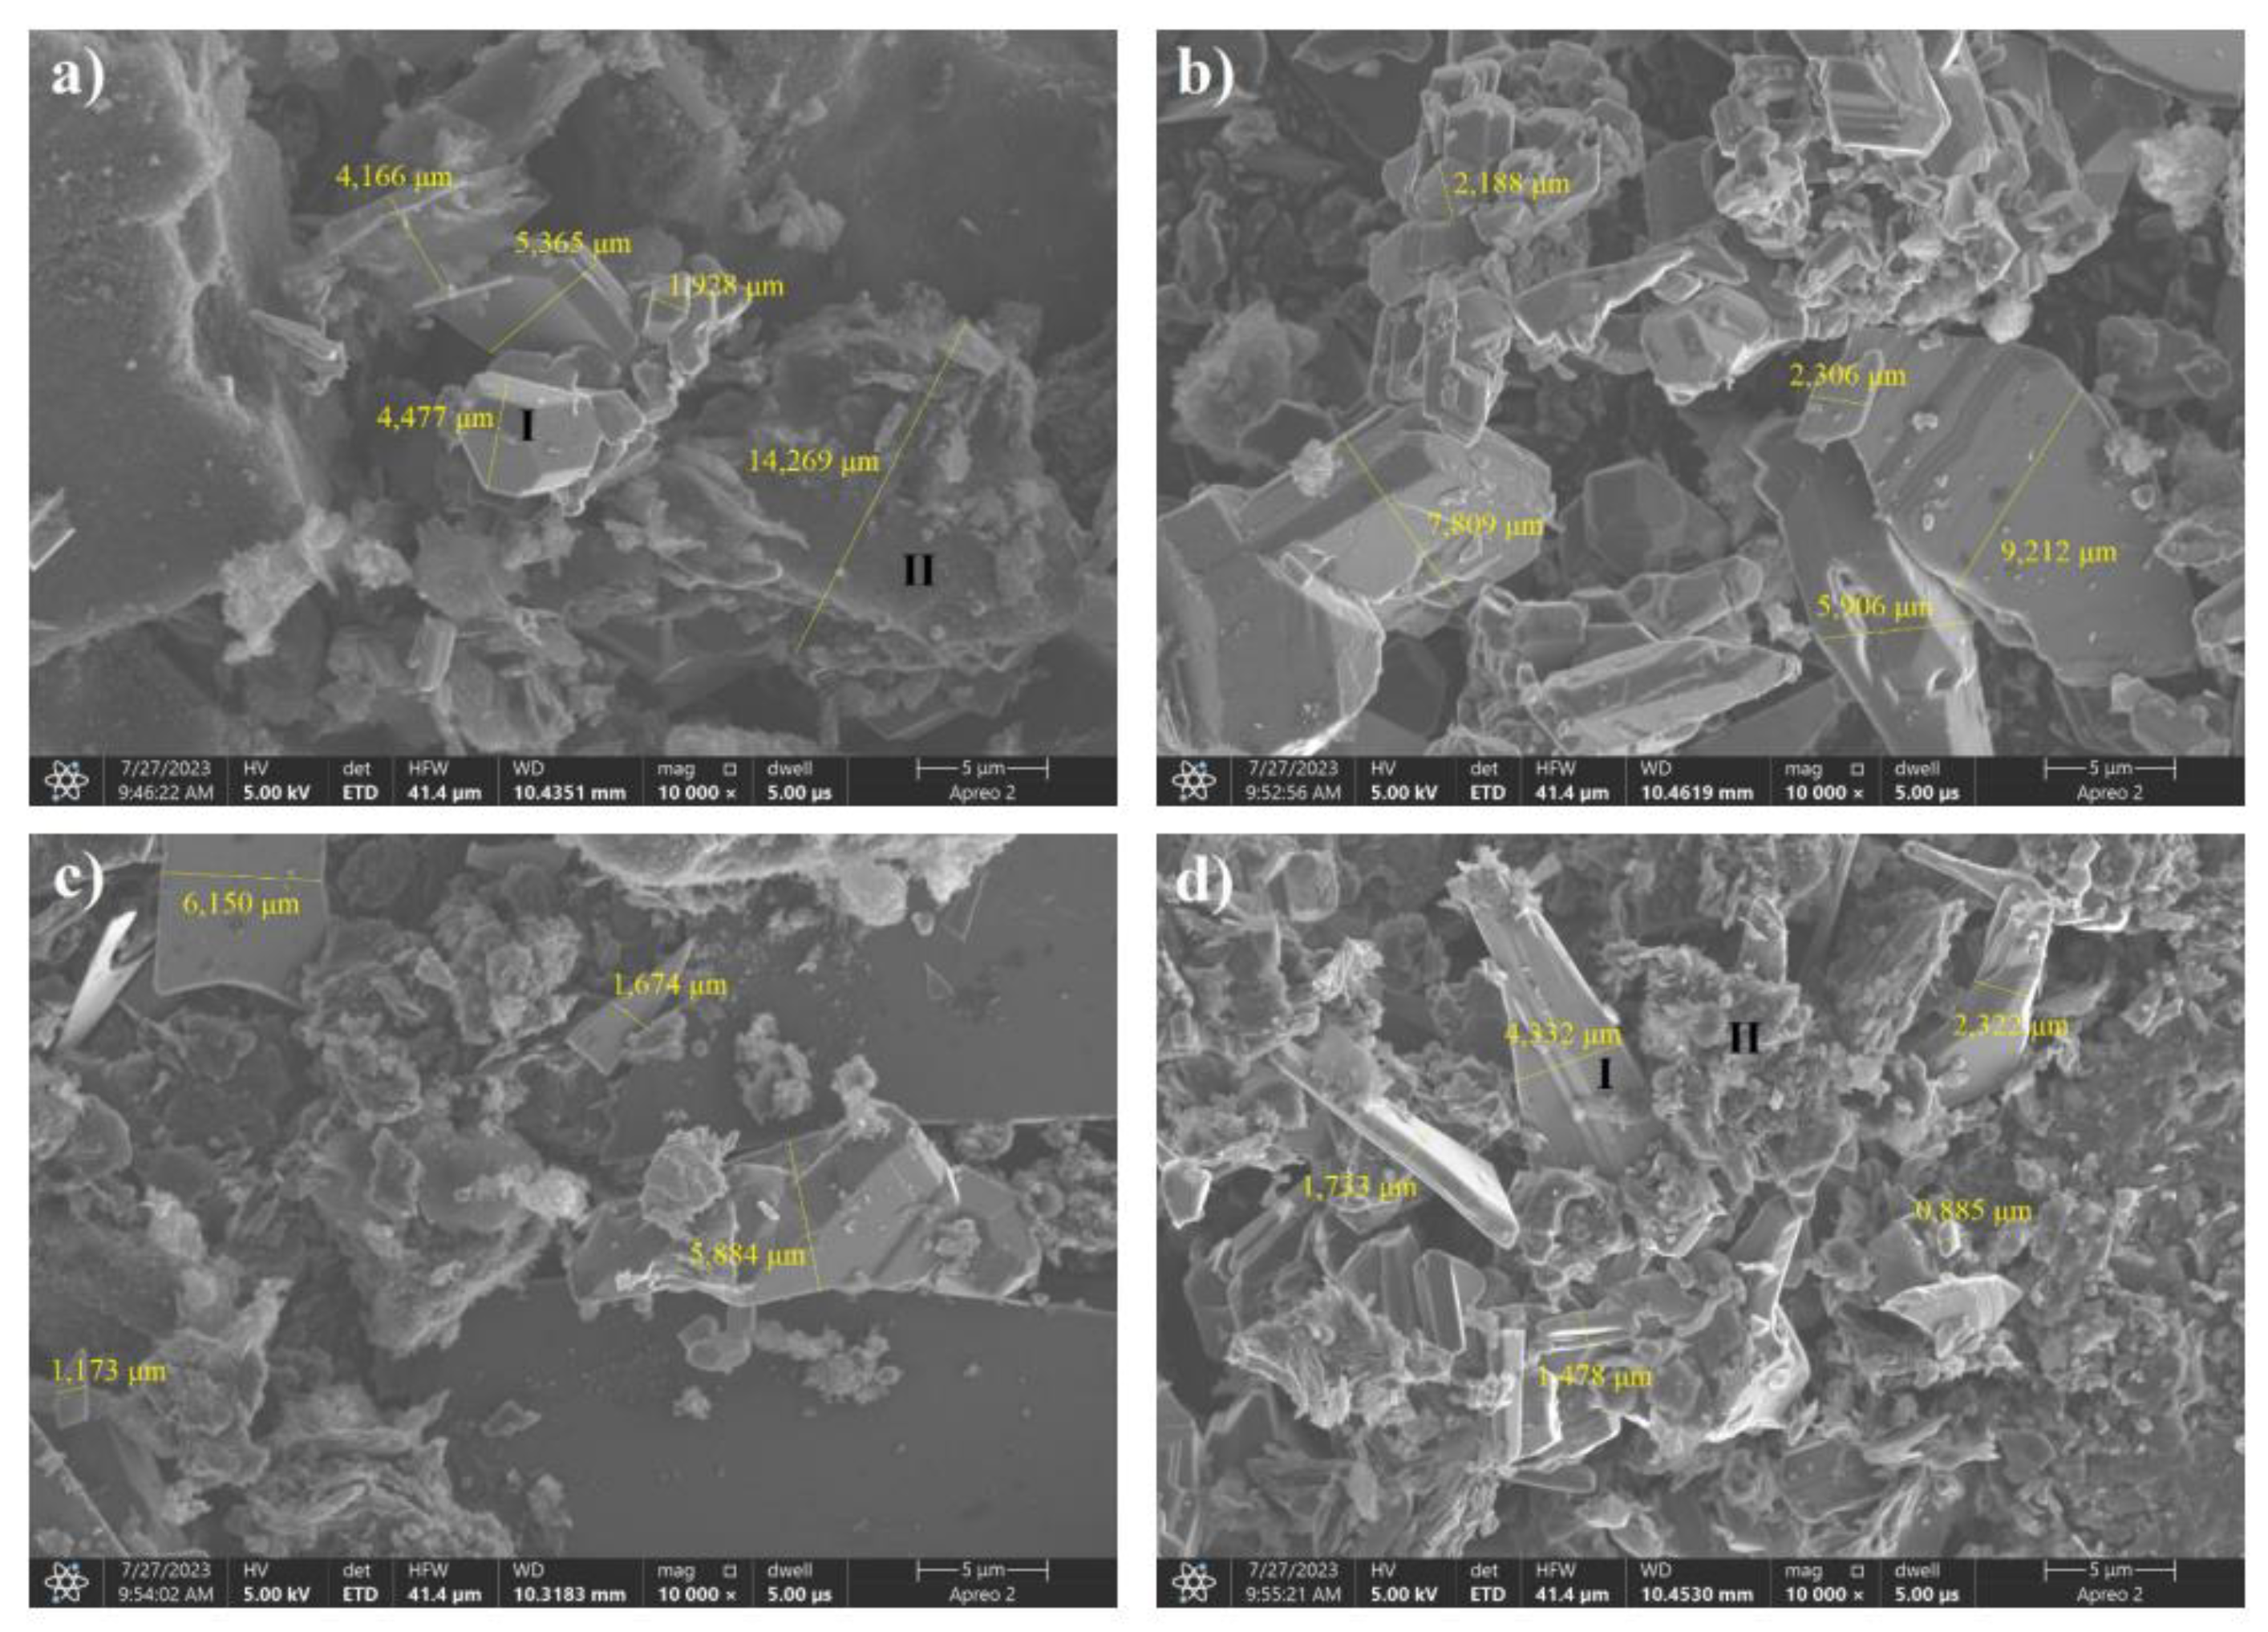
SEM analysis proved that sorbitol precursors allow boron carbide to be obtained at low-boron-weight shares. The effect of freeze-drying as a method of precursor dehydration on their morphology is not clear. Samples with C:B ratios of 6:4 and 7:3 showed particles with larger dimensions than those obtained using recrystallized precursors. The sample with the highest boron content, on the other hand, was characterized by significantly smaller platelet dimensions compared to a sample of identical composition not subjected to freeze-drying. The platelets were elongated and formed agglomerates, and EDS analysis showed a different trend (compared with the other cases studied).The sample containing the highest amount of boron in the precursor after synthesis contained only 25% boron in the area capable of forming a boron carbide crystallite. The boron content characteristic of the boron carbide homogeneity range, on the other hand, was characterized by a sample with 80% by weight of carbon atoms in the precursor.
4. Discussion
The aim of the above work was to synthesize boron carbide with a spherical shape and nanometer-sized grains from boron-saccharide precursors, in which the carbon source was saccharides. The study proved that the type of functional group in a saccharide or its derivative has a significant effect on the size of the spherical grains obtained when saccharides are used. The use of sorbitol does not allow the precursor to be obtained in powder form. Replacing recrystallization in the precursor preparation process with freeze-drying allows for better control of the precursor composition and can also have an impact on reducing the segregation of boron from carbon, which has a key effect on maintaining the spherical shape of grains after the synthesis stage. The results of the FT-IR analysis showed that regardless of the carbon source used, the infrared spectral materials obtained had a similar course, with the exception being the use of sorbitol. The determined average values of the precursor grain sizes showed that as the proportion of carbon decreased, the average grain size decreased for samples with fructose and sorbitol precursors. In addition, the use of sorbitol as a precursor resulted in grain sizes that were significantly larger (more than double on average) than those of other precursors. Based on SEM analysis and DLS measurements, it was concluded that the sorbitol precursor exhibited a different powder morphology. The obtained carbon source, as well as the final B4C powder, was characterized by significantly different parameters from the other tested samples; the grain size was much larger, and the SEM images showed the absence of spherical phases present in the other tested materials. This is related to the structure of sorbitol, in which there are hydroxyl groups on both sides of the carbon chain; therefore, the polycondensation step cannot occur. The sorbitol precursors after the dehydration stage differed significantly from the others. The recrystallized samples resembled a glassy polymer in terms of consistency; freeze-dried samples were liquids with very high viscosit. SEM images of the samples with other boron-saccharide precursors showed the presence of spherical grains. For these samples, as the proportion of boron increased, a decrease in the proportion of spherical grains was observed, whereas the number of lamellar and irregular grains increased. For glucose and fructose precursors at high carbon shares, a structure with a large number of spherical grains was observed, and irregular grains began to appear only for carbon shares lower than 70 %. According to theoretical assumptions, the size of the boron carbide grains was much larger than that of the precursor grains. Based on the DLS study, the smallest grain sizes characterized the inulin precursors; however, each of the two dehydration processes involved grain agglomeration, which affected the glucose and fructose precursors much less than those in which the polysaccharide was the carbon source. By varying the ratio of carbon to boron during precursor preparation, the stoichiometry of boron carbide can be controlled. Boron carbide, rich in boron, was obtained at a C: B ratio of 5:5.For carbon ratios in the 60-70% range, boron carbide rich in boron or metastable BC5 and BC7 phases was obtained, depending on the saccharide used and the dehydration method. For a carbon-to-boron ratio of 8:2, boron carbide with a B4C stoichiometry and the aforementioned metastable phases were obtained. The results demonstrate the progress of work on the synthesis of boron carbide from saccharide precursors.
Author Contributions
Conceptualization, Dawid Kozień, Katarzyna Pasiut, Wojciech Banaś and Mateusz Zagórny; Methodology, Dawid Kozień and Katarzyna Pasiut; Formal analysis, Dawid Kozień, Katarzyna Pasiut, Wojciech Banaś and Mateusz Zagórny; Investigation, Wojciech Banaś and Mateusz Zagórny; Data curation, Katarzyna Pasiut and Janusz Partyka; Writing – original draft, Dawid Kozień; Writing – review & editing, Dawid Kozień, Katarzyna Pasiut, Wojciech Banaś, Mateusz Zagórny and Janusz Partyka; Visualization, Dawid Kozień and Katarzyna Pasiut; Supervision, Janusz Partyka. All authors have read and agreed to the published version of the manuscript.
Data Availability Statement
The data presented in this study are available in the article. - We encourage all authors of articles published in MDPI journals to share their research data. In this section, please provide details regarding where data supporting reported results can be found, including links to publicly archived datasets analyzed or generated during the study. Where no new data were created, or where data is unavailable due to privacy or ethical restrictions, a statement is still required. Suggested Data Availability Statements are available in section “MDPI Research Data Policies” at https://www.mdpi.com/ethics.
Acknowledgments
In this section, you can acknowledge any support given which is not covered by the author contribution or funding sections. This may include administrative and technical support, or donations in kind (e.g., materials used for experiments).
Conflicts of Interest
The authors declare no conflict of interest
References
- C. Cheng, K. M. Reddy, A. Hirata, T. Fujita, and M. Chen, “Structure and mechanical properties of boron-rich boron carbides,” J. Eur. Ceram. Soc., vol. 37, no. 15, pp. 4514–4523, 2017. [CrossRef]
- D. Y. Kovalev and S. V. Konovalihin, Boron Carbide. Elsevier Inc., 2017. [CrossRef]
- Gubernat, W. Pichór, D. Zientara, M. M. Bućko, Ł. Zych, and D. Kozień, “Direct synthesis of fine boron carbide powders using expanded graphite,” Ceram. Int., vol. 45, no. 17, pp. 22104–22109, 2019. [CrossRef]
- W. Zhang, S. Yamashita, and H. Kita, “Progress in pressureless sintering of boron carbide ceramics–a review,” Adv. Appl. Ceram., vol. 118, no. 4, pp. 222–239, 2019. [CrossRef]
- D. Gosset, “Basic Properties of Boron Carbide,” Compr. Nucl. Mater. Second Ed., pp. 539–553, 2020. [CrossRef]
- C. K. Ceramiki and D. Kozien, “Autoreferat „ Synteza i określenie właściwości biologicznych,” pp. 1–30, 2021.
- D. Kozien et al., “Boron-rich boron carbide nanoparticles as a carrier in boron neutron capture therapy: Their influence on tumor and immune phagocytic cells,” Materials (Basel)., vol. 14, no. 11, 2021. [CrossRef]
- Alizadeh, E. Taheri-Nassaj, and N. Ehsani, “Synthesis of boron carbide powder by a carbothermic reduction method,” J. Eur. Ceram. Soc., vol. 24, no. 10–11, pp. 3227–3234, 2004. [CrossRef]
- S. Gao, X. Li, S. Wang, P. Xing, J. kong, and G. Yang, “A low cost, low energy, environmentally friendly process for producing high-purity boron carbide,” Ceram. Int., vol. 45, no. 3, pp. 3101–3110, 2019. [CrossRef]
- R. E. Riman, “Powders, Solution Synthesis of,” Encycl. Mater. Sci. Technol., pp. 7800–7811, 2001. [CrossRef]
- D. Li, J. Yao, and H. Wang, “Hydrothermal synthesis of AlPO4-5: Effect of precursor gel preparation on the morphology of crystals,” Prog. Nat. Sci. Mater. Int., vol. 22, no. 6, pp. 684–692, 2012. [CrossRef]
- F. Zheng, H. Liu, D. Liu, S. Yao, T. Yan, and J. Wang, “Hydrothermal and wet-chemical synthesis of pure LiTaO3 powders by using commercial tantalum hydroxide as starting material,” J. Alloys Compd., vol. 477, no. 1–2, pp. 688–691, 2009. [CrossRef]
- S. Mohan, M. Vellakkat, A. Aravind, and U. Reka, “Hydrothermal synthesis and characterization of Zinc Oxide nanoparticles of various shapes under different reaction conditions,” Nano Express, vol. 1, no. 3, 2020. [CrossRef]
- M. Seal and S. Mukherjee, “Determination of hydrothermal synthesis pressure of crystalline GeO2 nano particle of the order of 10 nm through a Central Force Potential model,” Mater. Today Proc., vol. 5, no. 3, pp. 10169–10176, 2018. [CrossRef]
- S. H. Feng and G. H. Li, Hydrothermal and Solvothermal Syntheses. 2017. [CrossRef]
- L. Khan and Z. Khan, “Bifunctional Nanomaterials: Magnetism, Luminescence and Multimodal Biomedical Applications,” in Complex Magnetic Nanostructures: Synthesis, Assembly and Applications, 2017, pp. 121–171. [CrossRef]
- D. Kozień, P. Jeleń, M. Sitarz, and M. Bucko, “Synthesis of boron carbide powders from mono- and polysaccharides,” Int. J. Refract. Met. Hard Mater., vol. 86, p. 105099, Sep. 2019. [CrossRef]
- Sudoh, H. Konno, H. Habazaki, and H. Kiyono, “Synthesis of boron carbide microcrystals from saccharides and boric acid,” Tanso, vol. 2007, no. 226, pp. 8–12, 2007. [CrossRef]
- M. Sevilla and A. B. Fuertes, “Chemical and Structural Properties of Carbonaceous Products Obtained by Hydrothermal Carbonization of Saccharides,” Chem. – A Eur. J., vol. 15, no. 16, pp. 4195–4203, Apr. 2009. [CrossRef]
- H. V. S. Devi, M. S. Swapna, V. Raj, G. Ambadas, and S. Sankararaman, “Natural cotton as precursor for the refractory boron carbide—a hydrothermal synthesis and characterization,” Mater. Res. Express, vol. 5, no. 1, p. 15603, 2018. [CrossRef]
- H. V SarithaDevi, M. S Swapna, G. Ambadas, and S. Sankararaman, “Low-temperature green synthesis of boron carbide using aloe vera,” Chinese Phys. B, vol. 27, no. 10, p. 107702, 2018. [CrossRef]
- Y. Shao et al., “The formation of 5-hydroxymethylfurfural and hydrochar during the valorization of biomass using a microwave hydrothermal method,” Sci. Total Environ., vol. 755, p. 142499, 2021. [CrossRef]
- M. Zhang, H. Yang, Y. Liu, X. Sun, D. Zhang, and D. Xue, “First identification of primary nanoparticles in the aggregation of HMF,” Nanoscale Res. Lett., vol. 7, pp. 1–5, 2012. [CrossRef]
- “‘https://spectrabase.com/10.08.2023r.’”.

Table 1.
Weight proportion and masses of reagents.
| Weight proportion [%] | Masses of elements in precursors [g] |
Weights of reagents [g] | |||||
|---|---|---|---|---|---|---|---|
| C | B | C | B | Boron acid | Fructose, glucose |
Inulin | Sorbitol |
| 50 | 50 | 2,5 | 2,5 | 14,298 | 6,250 | 5,625 | 6,316 |
| 60 | 40 | 3 | 2 | 11,438 | 7,500 | 6,750 | 7,580 |
| 70 | 30 | 3,5 | 1,5 | 8,579 | 8,750 | 7,875 | 8,843 |
| 80 | 20 | 4 | 1 | 5,719 | 10,000 | 9,000 | 10,106 |
Table 2.
DLS analysis results for each tested sample.
| Sample | Average size grains [μm] | Maximum 1 [μm] | Maximum 2 [μm] |
|---|---|---|---|
| F 8:2 | 2,304 | 1,890 | - |
| F 7:3 | 1,369 | 2,225 | 0,197 |
| F 6:4 | 0,208 | 0,227 | 5,076 |
| F 5:5 | 1,933 | 1,881 | - |
| G 8:2 | 1,494 | 1,477 | - |
| G 7:3 | 0,677 | 0,737 | - |
| G 6:4 | 0,384 | 0,419 | 3,531 |
| G 5:5 | 0,475 | 0,546 | - |
| I 8:2 | 0,223 | 0,249 | - |
| I 7:3 | 0,205 | 0,234 | - |
| I 6:4 | 0,208 | 0,222 | 4,844 |
| I 5:5 | 0,164 | 0,170 | 5,271 |
| S 8:2 | 4,306 | 0,770 | - |
| S 7:3 | 3,269 | 1,697 | - |
| S 6:4 | 4,058 | 0,818 | - |
| S 5:5 | 0,38 | 0,165 | 1,475 |
Table 3.
Wavelengths with meaning for FT-IR analysis.
| Wave number [cm−1] | Meaning |
|---|---|
| 3392-3398 | The band corresponds to an intramolecular, stretching O-H bond |
| 3215 | The band characteristic of boronic acid corresponds to an intramolecularly stretched O-H bond |
| 2929-2950 | The band corresponds to the stretching C-H bond, characteristic of alkanes |
| 2518-2520 | The band corresponds to the tensile O-H bond |
| 2362 | The band corresponds to the O=C=O group |
| 2262 | The band corresponds to a stretching C≡C bond |
| 1707 | The band corresponds to a C=O stretching bond, characteristic of an aldehyde or ketone group |
| 1620-1636 | The band corresponds to a stretching C=C bond |
| 1434-1457 | Band characteristic of boric acid |
| 1194-1195 | |
| 970-1027 | Glucose characteristic band |
| 883 | The band corresponds to the deformation bond C=C |
| 805-814 | The band characteristic of the HC=CH group belonging to the five-atom ring |
| 643-651 | Band characteristic of the furan ring |
Disclaimer/Publisher’s Note: The statements, opinions and data contained in all publications are solely those of the individual author(s) and contributor(s) and not of MDPI and/or the editor(s). MDPI and/or the editor(s) disclaim responsibility for any injury to people or property resulting from any ideas, methods, instructions or products referred to in the content. |
© 2023 by the authors. Licensee MDPI, Basel, Switzerland. This article is an open access article distributed under the terms and conditions of the Creative Commons Attribution (CC BY) license (http://creativecommons.org/licenses/by/4.0/).
Copyright: This open access article is published under a Creative Commons CC BY 4.0 license, which permit the free download, distribution, and reuse, provided that the author and preprint are cited in any reuse.