
Submitted:
26 December 2023
Posted:
26 December 2023
You are already at the latest version
Abstract
Abstract: Wildfires in forest ecosystems exert substantial ecological, economic, and social impacts. The effectiveness of fire management hinges on precise pre‐fire risk assessments to inform mitigation efforts. This study aims to investigate the relationship between predictions from pre‐fire risk assessments and outcomes observed through post‐fire burn severity analyses. In this study, forest fire risk was assessed with the Fuzzy Analytical Hierarchy Process, in which fire behavior factors were used as input. The degree of burn was determined using the Random Forest method using 11519 training points and 400 test points on Sentinel‐2 satellite images in three different classes. According to the results obtained from 266 selected test points located within the forest boundaries, all primary factors showed an increased effect in areas with high burn severity. Climate, in particular, emerged as the most influential factor, accounting for 52% of the overall impact. However, in cases of high fire severity, climate proved to be the most effective risk factor, ac‐counting for 67%. It followed by topography with 50% accuracy at high fire intensity. In the risk assessment is based on the FAHP method, climate was assigned the highest weight value among other factors with 32.2%. Topography emerged as the second most effective risk factor with 27 %. To evaluate the results more comprehensively both visually and statistically, two regions with different stand canopy characteristics were selected within the study area. While high burn severity had the highest accuracy in Case 1 area, moderate burn severity had the highest in Case 2 area. During the days when the fire continued, the direction of spread was obtained from MODIS images. In this way, the fire severity depending on the direction of fire progression was also interpreted. Through an analysis of various case studies and existing literature, the research underscores both the strengths and limitations inherent in predicting forest fire behavior‐based pre‐fire risk assessments. Furthermore, it emphasizes the necessity of continuous improvement to increase the success of forest fire management.
Keywords:
forest fire
; remote sensing
; risk assessment
; burnt analysis
; fuzzy analytic hierarchyprocess (FAHP)
1. Introduction
Forest fires, prevalent in various biomes globally, alter the scope and structural characteristics of forested areas. Consequently, these changes disrupt the provision of ecosystem services and products, introducing uncertainties in the trajectory of these alterations. In the context of global climate change, the frequency of severe forest fires is inclined to rise, necessitating an accelerated adjustment in forest fire regimes [1]. Forest fires, as intricate natural disturbances, significantly influence ecosystem dynamics and have profound impacts on human societies. The continuous increase in fire danger and the extent of burned areas in Mediterranean ecosystems across diverse global regions is anticipated, attributed to factors such as global warming, population growth, and irregular land use [2,3]. This escalation underscores the growing significance assigned to forest fire risk and susceptibility [4], as well as post-fire studies [5,6]. To enhance firefighting success, risk-based possibilities and their management information should be seamlessly integrated into decision support systems through tactical and operational synthesis [7,8]. Achieving effective fire decision support necessitates a precise explication of uncertainties associated with the risk. Therefore, it is crucial to elucidate the uncertainties arising from spatial patterns, comprehend their origins, and make informed decisions regarding fire prevention and ignition probability [9,10].
With the increasing frequency of severe wildfires, the imperative to comprehend and predict fire behavior becomes pivotal for effective forest management. Pre-fire risk assessments assume a crucial role in anticipating fire behavior, directing resource allocation, and fortifying preparedness [11,12]. Pre-fire risk assessments encompass a myriad of factors contributing to fire behavior in forested areas, including forest type, fuel load, moisture content, weather patterns, and topography. Models such as the Fire Spread Probability Model and the Fire Potential Index leverage these inputs to estimate fire behavior and potential spread, forming the foundation for proactive fire management strategies.
In forest fire risk mapping, diverse methods are employed, including logistic regression [9], GIS-based decision support systems [13], maximum entropy [14], machine learning [15,16], artificial neural network analytics [17], analytical hierarchy process [18], and fuzzy analytic hierarchy process [19,20]. GIS-based Multi-Criteria Decision Analysis (MCDA) is an intelligent approach that transforms spatial and non-spatial data into information usable alongside the decision-maker’s judgment to facilitate critical decisions [21]. Analytical Hierarchy Process (AHP) and Fuzzy Analytical Hierarchy Process (FAHP) are commonly featured in the literature as GIS-based MCDA methods preferred for risk analysis in various sectors [22,23]. However, AHP’s susceptibility to subjectivity in determining criteria roles within the pairwise comparison matrix is acknowledged. To mitigate this issue, methods for improving AHP have been developed [24,25]. Fuzzy logic methods can be integrated into the post-AHP decision-making process to evaluate criteria and utilize fuzzy membership functions, enhancing result accuracy [21,23]. In FAHP fire risk analysis, despite numerous criteria constituting fire risk, it facilitates hierarchical weighting of criteria and their sub-criteria importance levels. This proves crucial for risk management, enabling the storage of a quantitative database essential for deciding on measures to minimize the impact of variables related to risk factors [19].
The mortality rate of vegetation is directly influenced by fire characteristics, which, in turn, are determined by the spatial distribution of varying weights assigned to forest fire risks. Determining tree mortality in various forested areas with different burn indexes [6] is crucial for establishing a sustainable foundation in forestry to support post-fire recovery [1]. The extent of mortality depends on several factors, including the physiological parts of the tree that have been damaged [26,27], burn ratio [1], burn severity [28], fire behavior factors, and specific tree characteristics [6,29]. Identifying distinct burning intensities across the burned area yields crucial data for strategically planning post-fire spatial treatments within the framework of sustainable forest management.
Post-fire analysis involves evaluating fire severity, burn patterns, and the effectiveness of suppression efforts. By comparing these outcomes with predictions made in pre-fire assessments, we can identify discrepancies and assess the accuracy of the assessment models. Numerous case studies exemplify situations where pre-fire risk assessments failed to accurately predict fire behavior due to unexpected changes in weather, ignition points, or fire behavior feedback. Several factors contribute to disparities between pre-fire predictions and post-fire outcomes in forest ecosystems. Rapid shifts in weather conditions, anomalies in ignition sources, and changes in fuel availability can substantially alter fire behavior. Additionally, uncertainties in input data quality, model assumptions, and calibration procedures can introduce errors into pre-fire risk assessments. Improving the accuracy of pre-fire risk assessments in forested areas requires addressing the unique challenges of these ecosystems. Incorporating real-time weather data, high-resolution fuel maps, and advanced fire behavior models tailored to forests can enhance prediction reliability. Regular validation and updating of assessment models using post-fire data are crucial for refining predictions. The occurrence of fires in the investigated area is primarily attributed to climate anomalies characterized by exceptionally high air temperatures and drought. It is crucial to consider these factors in the context of sustainable development goals related to land use and cover [30], as well as the quality and quantity of ecosystem services [31].
According to the EFFIS 2021 database, Turkey recorded the highest total area burned. Specifically, the Manavgat Fire stands out with the largest burned area among the recorded incidents in Turkey, the European Mediterranean, North Africa, and the Middle East [32]. The study aims to assess the risk of fire spread based on pre-fire behavior during the Manavgat Fire in 2021 and examine the post-fire situation by detecting burn severity using satellite images. In addition, the study delves into the precision of pre-fire risk assessments in predicting post-fire outcomes within forest ecosystems.
2. Materials and Methods
2.1. Study Area
The study focused on the Manavgat region in Antalya, characterized by a typical Mediterranean climate. This area is subject to hot and dry summers along with mild and rainy winters. Utilizing digital elevation model data provided by the General Directorate of Maps, the average elevation within the study area is 488.85. This is accompanied by an average slope value of 21.71 degrees. The predominant forest type in the region is Turkish red pine (Pinus brutia Ten.) and evergreen Mediterranean shrubs. Agricultural activities are concentrated in areas with lower slopes [33]. The research encompasses the fire zone that ignited on July 28, 2021, and persisted for approximately 10 days. Additionally, it includes various land cover and land use classes such as settlements, industrial and agricultural areas, rocky terrains, and wetland areas in the vicinity (Figure 1).
The anticipation of potential wildfires in forested areas and the subsequent analysis of their impacts constitute significant aspects. While interventions during a fire event may influence the extent of its spread, prior knowledge of the degree to which forested areas will be affected by the fire provides a substantial input to risk analyses. The utilization of land cover information emerges as a critical parameter in the estimation and evaluation of these predictions. In extensive forested areas affected by wildfires, remote sensing data stands out as a crucial source for the rapid generation and updating of such information. Furthermore, satellite imagery is commonly employed in the assessment of the consequences following a fire incident. In this study, the outcomes of a risk analysis conducted prior to the 2021 Manavgat wildfire were juxtaposed with the results of burn severity derived from satellite imagery. Figure 2 represents the general framework of the methodology employed in this study.
2.2. Data
In this study, data obtained from various sources has been amalgamated. Due to the extensive geographical coverage of the study area, satellite images with varying resolution characteristics were employed to extract information from the field. MODIS satellite images were utilized to assess the spread of the forest fire that occurred in the region. A Landsat satellite image was employed for determining surface temperatures, while a Sentinel-2 image was used to ascertain burn severity. To verify the accuracy of the results, high-resolution SPOT 7 and Pleiades satellite patterns, along with aerial photographs specific to the region, were utilized. Codes from the CORINE classification was used in the analysis of land uses. Additionally, ground surveys were conducted to validate the results, involving an examination of land cover/use conditions and the implementation of spectral measurements (Figure 3). The general characteristics of the data utilized in the study are presented in Table 1.
2.3. Methodology
2.3.1. Burn severity
The degree of burn in the Sentinel-2 satellite image was determined through classification using the Random Forest method [34]. 11519 training points that belongs to different land use/cover classes and 400 test points belonging to areas affected by fire in three different classes, named “Low Burn Severity”, “Moderate Burn Severity” and “High Burn Severity”, were produced from the fire zone. SPOT, Pleiades, and Aerial Photos were used for visual interpretation and production of spectral signatures. This approach enabled the creation of reliable and accurate training and test points, as well as an understanding of the spectral differences between the classes. Spectral signatures and statistical parameters also took into account in order to determine burn severity class definitions and thresholds between classes[35].
The burn severity classification has reached 0.81 of overall accuracy and the obtained results have been utilized as input for risk assessment.
2.3.2. Risk Assessment
Weather conditions, especially the daily and seasonal drying/cooling based on surface fuel moisture, have short and long-term effects [36]. Daily fire danger rating systems based solely on meteorological variables have even been developed [37]. Increasing high temperatures enhance evaporation (transpiration), rapidly reducing the moisture content of fuel types, creating suitable conditions for ignition temperature as a result [38].
The fuel-moisture content (FMC), defined as the ratio between the ten-hour-time-lag fine-fuel moisture and the extinction moisture, plays a crucial role in forest fires [39]. The flammability of the vegetation cover is largely dependent on the moisture content of fine dead fuels. It is the fuel type where moisture change occurs most rapidly. Therefore, the accuracy of moisture content in such fuels is a crucial component of fire management and the fire danger rating system, contributing to the shortening of ignition time [40] and controlling fire behavior, which is one of the key factors [41,42].
Topography interacts with climate in terms of fire behavior characteristics. In dry weather conditions, topography has less effect than in wet weather conditions. Regional or temporal climate variations that reduce fuel moisture make much of the land in various topographic positions susceptible to fire spread [43].
The distribution of flammable material characteristics in the field varies significantly, directly impacting fire risk and behavior in different spatial areas [44]. A crucial precondition for successful fire management, including risk assessment studies, is the accurate determination of fuel (flammable material) load and associated fuel characteristics [45]. In the risk assessment part of this study, forest structural characteristics and flammable material load data were used to incorporate flammable material characteristics. Flammable indices for surface and canopy fuels were developed using the amounts of dead surface and crown flammable material. Data from flammable material studies conducted in pine and hardwood forests throughout Antalya were used to determine flammable material indices [19,46]. The flammable material loads of existing pine and hardwood stands in the study area were calculated by taking the average loads of the same stands in the study conducted for Antalya (estimated). Flammable material quantities for pine and other tree and shrub species stands [47,48,49,50] were derived by interpolation from similar distinctive features, such as leaf biomass, stand density, developmental stage, rocky growing environment, of pine stands and maquis vegetation types. Coefficients ranging from 0.7 to 1.4 were used in the interpolation of flammable material quantities for mixed forest structures of needle-leaved and broad-leaved tree species in comparison to pine forests. It is assumed that broad-leaved forests have a higher flammable material load than needle-leaved forests.
2.3.2.1. The fuzzy AHP model (FAHP)
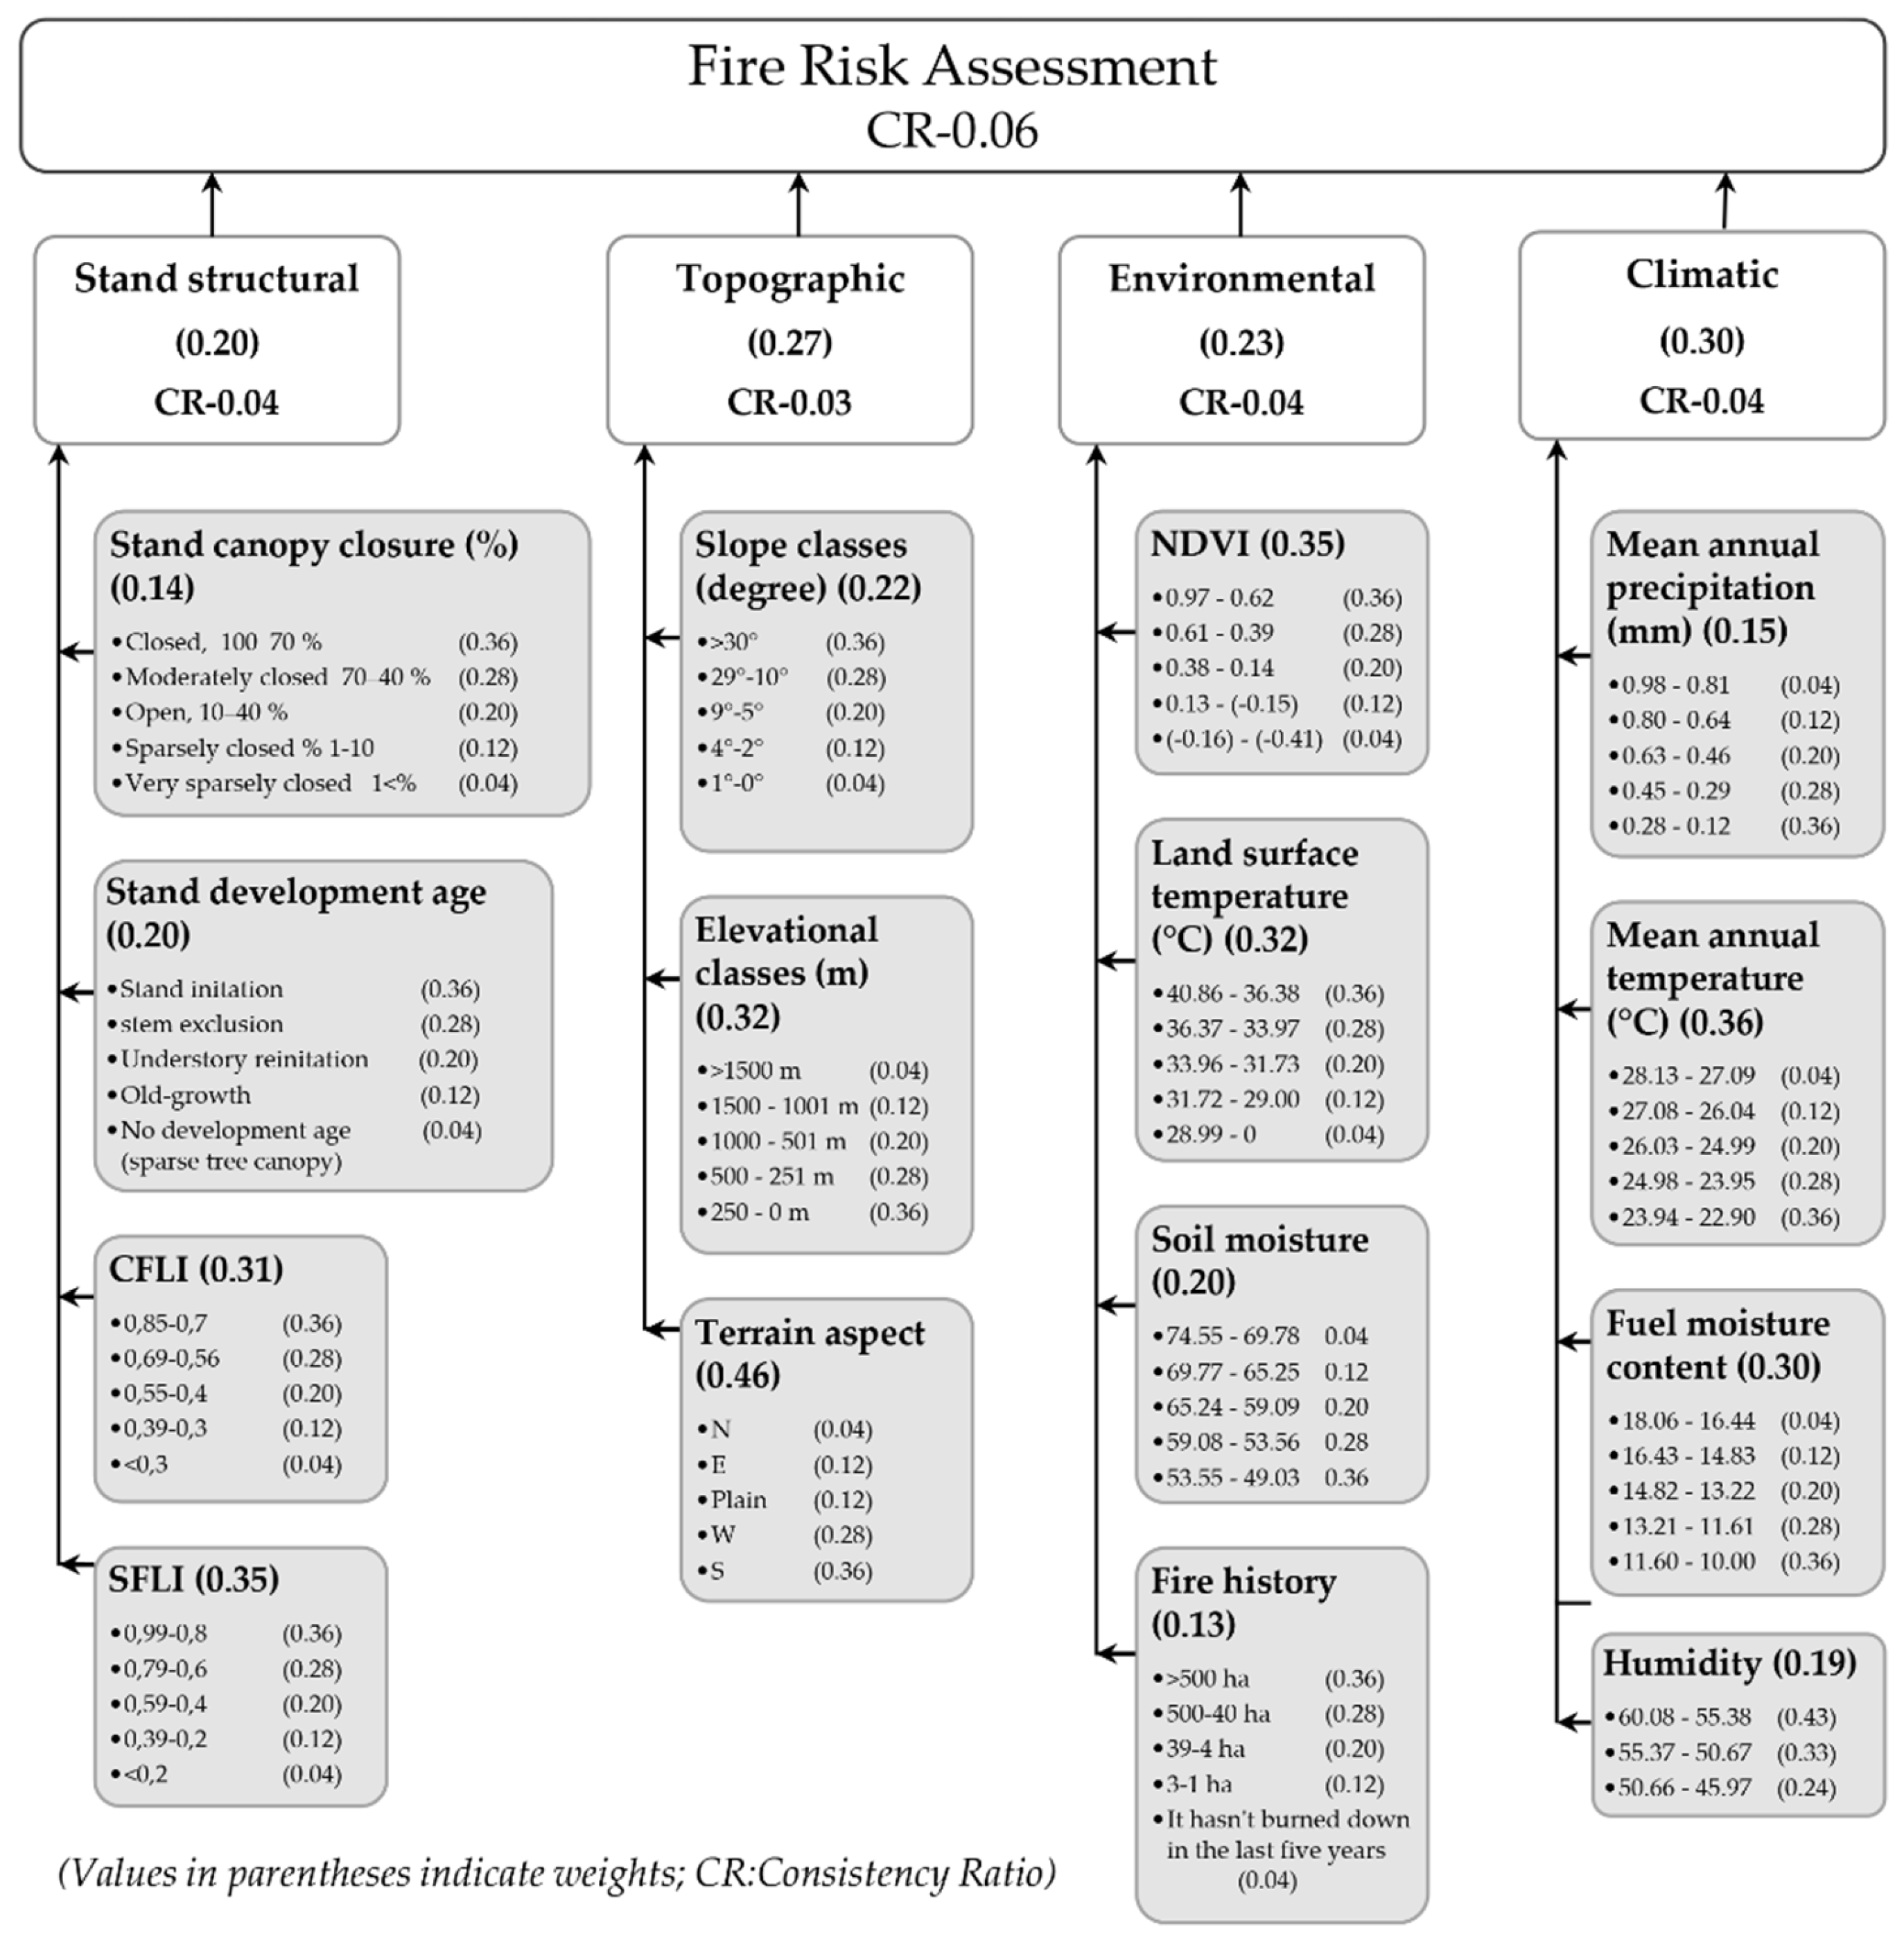
The criteria, sub-criteria, and their respective intervals for the FAHP risk assessment were established in a hierarchical manner. The weights assigned to the criteria, sub-criteria, and factors were computed through pairwise comparison matrices utilizing Chang’s extension analysis method [51] as cited in [19]. The fuzzy scale of relative importance, developed by [52], was employed to quantify the relative weights (see Table 2).
Figure 4.
The weights of the criteria, sub-criteria and factors used in FAHP.
3. Results
In this study, a comparison was conducted between the risk assessment based on pre-fire data and the post-fire situation, specifically examining the analysis of outcomes from 266 selected test points located within the forest boundaries in the study area (Table 3). All primary factors demonstrated a heightened impact in areas with elevated burn severity. Notably, climate emerged as the most influential factor, constituting 67% of the overall effect. In prior risk determination using the FAHP method, climate had already been assigned the highest weight value, accounting for 32.2% among other factors. Topography emerged as the second-most influential risk factor in burn severity, securing the second-highest value at 27% among other factors in the FAHP assessment. The risk weights of additional environmental and stand structure factors, contributing to burn severity, followed a similar ranking pattern in the FAHP risk assessment.
Given that the 2021 fire in question was the largest in both the country and the European Mediterranean region, it is evident that climatic factors played a significant role in its expansion. Among the climatic risk factors, the cumulative effect of annual average temperature and flammable substance content contributed to 66% of the total weight, significally influencing the fires expansion. In terms of topography, terrain aspect held the highest weight at approximately 46%, while elevation had the highest weight at approximately 32%. In the FAHP risk assessment, Stand Fuel Loading Index (SFLI) and Canopy Fuel Loading Index (CFLI) were subsumed under stand structure, collectively representing 66% of the weight within this primary factor. When compared to burn severity levels, these indices exhibited higher accuracy in areas characterized by low and moderate burn severity.

Table 3.
Main Factors, SFLI, CFLI, and complete Pre-Fire Risk Analysis Accuracy Analysis Scores.
| Evaluated Factors | F-Score |
Overall Accuracy |
||
|
Low Burn Severity |
Moderate Burn Severity |
High Burn Severity |
||
| Topographic Factors | 0.2581 | 0.4110 | 0.5089 | 0.4167 |
| Climatic Factors | 0.4634 | 0.3710 | 0.6705 | 0.5288 |
| Environmental Factors | 0.0779 | 0.4184 | 0.4800 | 0.3936 |
| Stand Structure Factors | 0.3648 | 0.2074 | 0.4660 | 0.3640 |
| SFLI | 0.4953 | 0.3846 | 0.2439 | 0.4131 |
| CFLI | 0.4129 | 0.4533 | 0.2105 | 0.3846 |
|
Pre-Fire Risk Analysis |
0.4959 | 0.2920 | 0.5432 | 0.4476 |
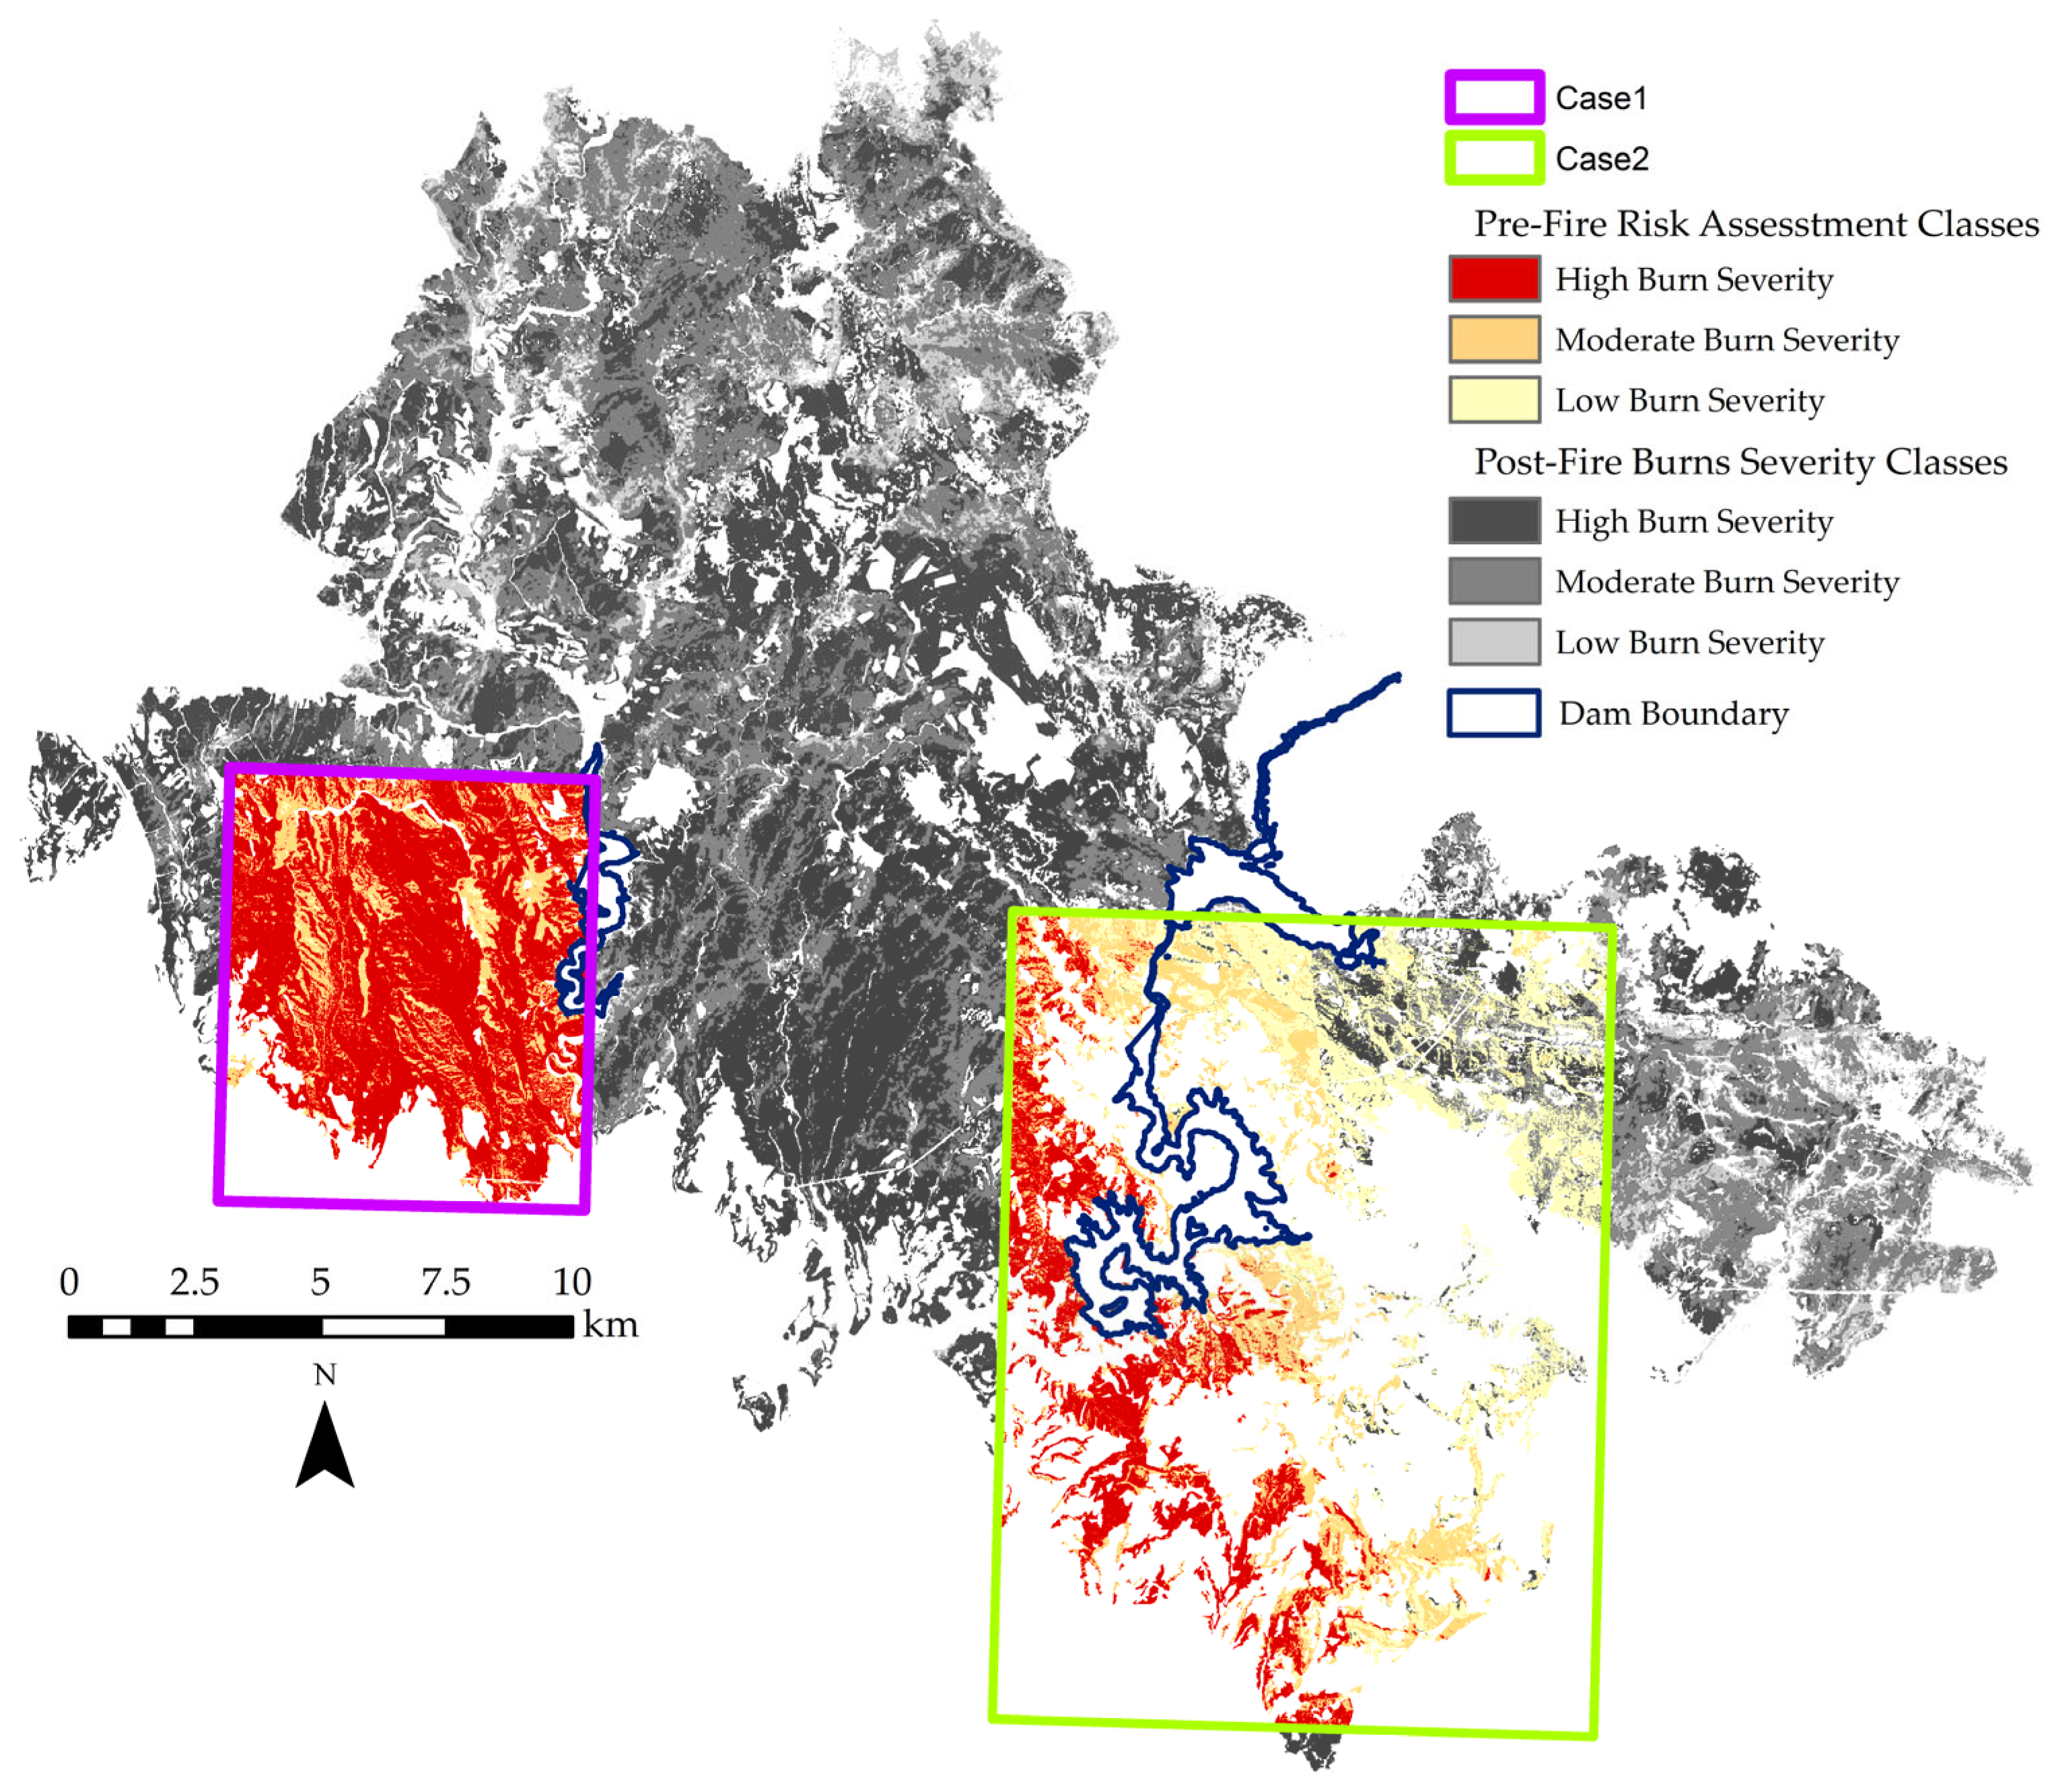
To perform a more comprehensive evaluation of the results, both visually and statistically, two regions with distinct canopy characteristics were chosen within the study area (Figure 5).
In Case 1, the F-score, particularly for severe and moderate fire severity levels, demonstrated greater accuracy compared to low severity (Table 4). Case 1 encompasses the initial outbreak point of the fire (or the closest distance). The implication is that the fire advanced significantly from the ignition point. In Case 2, a reduction in high fire severity was noted, with a prevalence of more moderate-severity fires. Case 2 includes the Oymapınar Dam area and larger agricultural fields, which appear to have functioned as barriers in mitigating high fire severity.
Figure 5.
Pre-Fire Risk Assessment Result within Case1,2 Boundaries and Post-Fire Burn Severity.
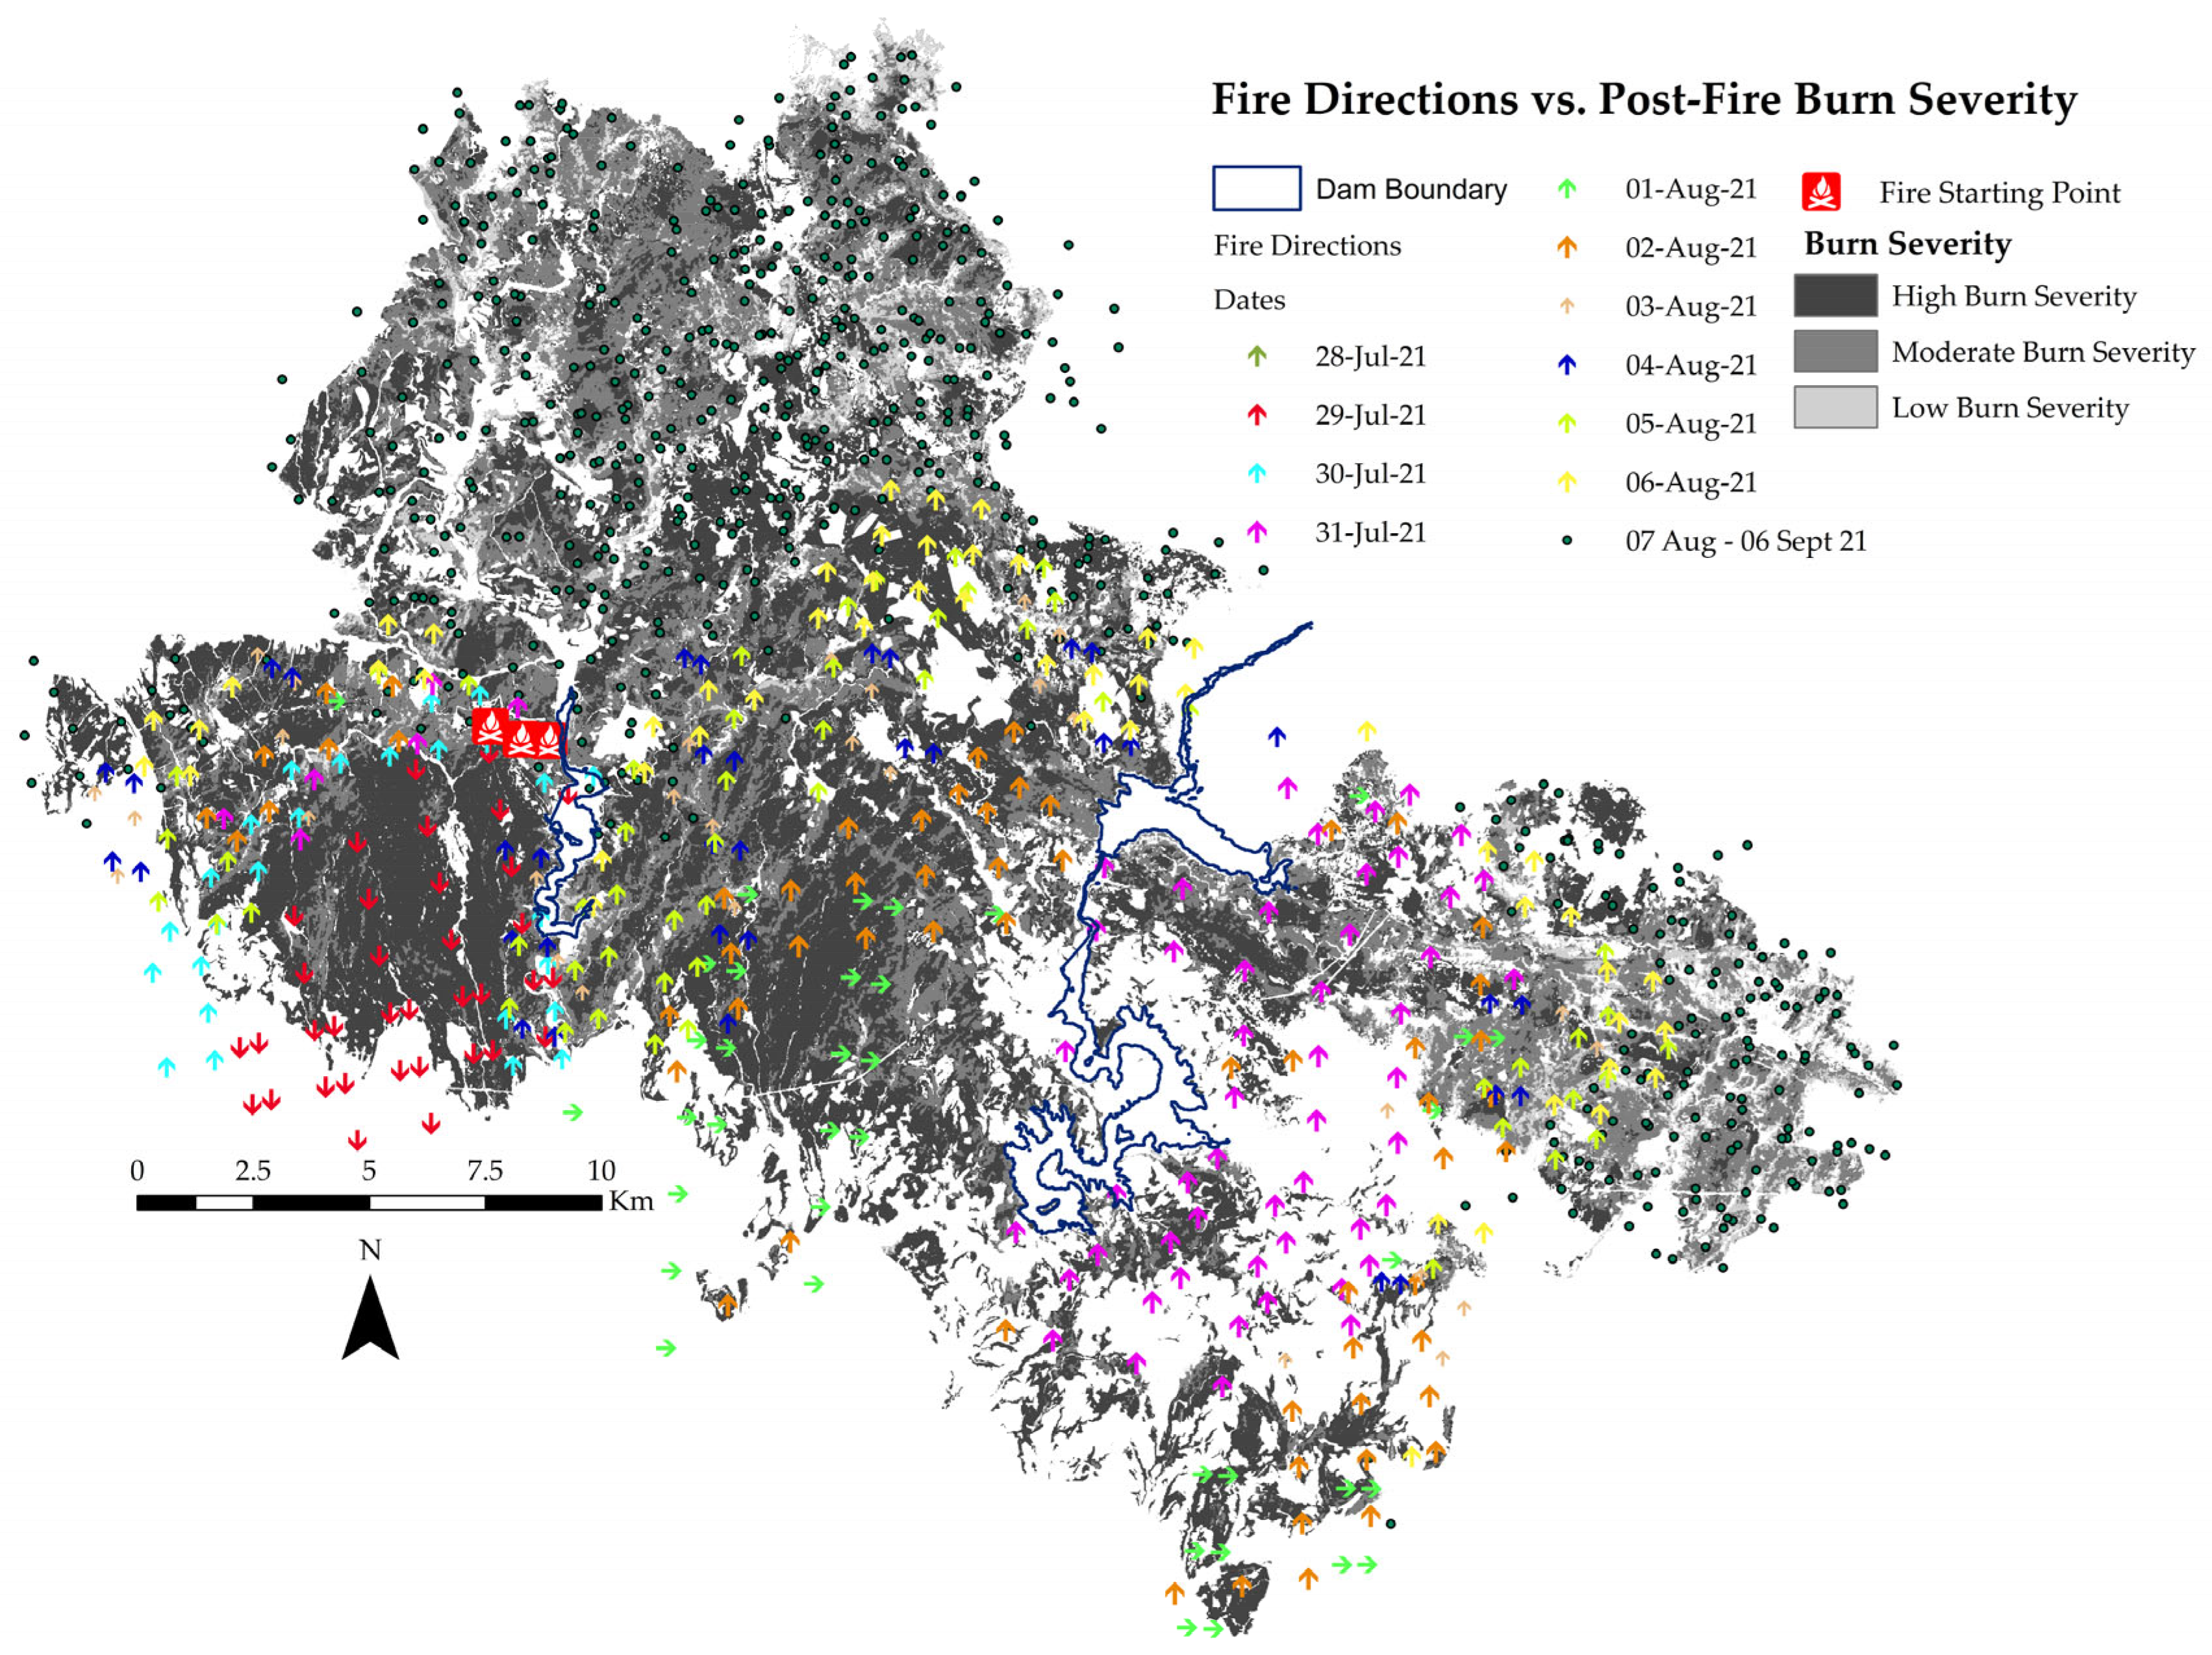
One of the pivotal factors influencing the progression of fire in forested areas is the external interventions made to control the fire. The direction of spread during the days when the fire continued was evaluated in conjunction with the results obtained from MODIS images, as depicted in Figure 5, The figure illustra the course and severity of the fire from its initial outbreak until it was brought under control. The fire commenced on July 28th, advancing with high intensity towards the south in the mountainous area within the first 24 hours. On the third day, as the fire predominantly moved towards the north in sporadic locations, it also made a move towards the east on the same day. By the 4th day, the fire reached the Case 2 section, located further east. In this section, although the intensity decreased due to land use and the Oymapınar Dam, it remained active over the forested areas, progressing over the northeastern mountainous region of this section for an additional 3-4 days. During the same period, the fire also moved north. In this region, there are deep valleys and long mountain slopes. Generally, the fire remained active in the mountainous region during the last 3-4 days of the fire duration. It is understood that during these final 3-4 days, the fire was also effective in the region between the Case 1 and Case 2 sections. Overall, the variable topography in the northern regions facilitated the formation of local winds during the fire, and it was observed that the progression of the fire frequently changed according to the wind directions. The higher elevation in the northern regions, the prevalence of low-vegetation rocky areas, and the absence of Scots pine and hard-soiled vegetation cover contributed to easier control of the fire. The fire initially progressed towards the south in the mountainous area with strong northerly winds. The higher density of settlements and agricultural areas further south can be explained by lower flammable materials. On the third day, when the fire turned towards the north and then to the east, it could be attributed to finding new flammable material sources and the more effective topography. The threat posed by the fire to settlements by reaching south in the first two days shifted the firefighting organization to this region. On the 3rd day, as the fire weakened and moved towards the north and then to the east on the same day, it was due to the presence of a weaker firefighting organization in this region.
Figure 6.
Fire Directions based on MODIS Data.
Discussion
The values of the fire behavior risk model in the study demonstrated higher accuracy in areas with both high and low fire severity, explaining the expected relationship with burn intensity. However, overall accuracy was lower for areas burning at moderate severity. In the study, fire behavior risk was assessed in five classes, while burn severity was evaluated in three classes. It is particularly evident that the intermediate classes of both models affect each other’s accuracy throughout the entire area. Areas with high fire severity include both very high-risk and high-risk areas. A similar situation is expected in areas with very low and low risk classes and low fire severity. Overall, a high level of accuracy was not observed in the comparison of fire behavior risk model results with burn severity. Various factors, including differences in data types and weighting schemes for both models, could explain this [53]. In similar studies, areas with high fire severity have shown higher accuracy with high-risk classes compared to other severity and risk classes. However, in our study and others, accuracy has never exceeded 60% [53,54,55]. It is crucial to further investigate whether changes in the weights of inputs influencing fire severity occur in each spatial area. In this regard, the relationships between fire risk’s main inputs and burn severity have also been examined separately. Values considered in a risk analysis are generally sensitive to possible fire behaviors, providing different responses. Particularly in large fires, where predicting fire progression becomes challenging due to difficulties in estimating emerging fire characteristics, such fires are defined as uncharacteristic [56]. Quantitative fire risk analysis and the fire risk models conducted through it aim to describe the distribution of risk and predict its occurrence degree. A fire event is the realization of the predicted risk distribution in a single level in space (pixel or raster scale). Fire is a complex phenomenon, necessitating a complex structure that takes into account many factors influencing fire ignition and spread [54]. Fire behavior probabilities differ from fire occurrence statistics because they develop based on spatial and temporal factors that control the growth of fire. The probability of burning a specific area depends on fuel characteristics, topography, current weather conditions, and the direction of fire spread that enables each fire to reach that location [56]. Although it is known that topography, weather, and fuels are factors directing fire behavior, there are still inadequacies in understanding the contribution level of each under different conditions to the spatial arrangement of fire severity [57].
The comparison of post-fire analyses in forests with pre-fire risk assessments highlights the ongoing need to enhance prediction methodologies. Although pre-fire assessments are valuable tools, their accuracy depends on the integration of real-world data and continuous model refinement. The dynamic nature of forest ecosystems necessitates adaptable and robust assessment approaches. Effective forest fire management requires precise pre-fire predictions to mitigate adverse effects on ecosystems and human communities. Although pre-fire risk assessments provide valuable insights, the disparities between predicted and actual fire behavior emphasize the need for continuous refinement. By integrating real-time data, advanced modeling techniques, and learning from post-fire analyses, pre-fire risk assessments can evolve into more reliable tools for proactive forest fire management.
Numerical and computational models used to understand and predict nonlinear environmental events like fire are often complex, and currently, there is no other tool than modeling them separately for each space (pixel or raster scale). To move to the next stage, it is crucial to use more local data and include neighborhood relationships between different fuel types affecting fire severity in the analysis [58]. In this study, surface and crown fuel index values obtained from previous fuel load studies conducted in the region were used for the pre-fire risk assessment according to fire risk levels. In these indices, distinctions between needle and broad-leaved tree species and sclerophyll vegetation were included in index calculations. Indices based on flammable loads show that the canopy and surface flammable indices of pine and deciduous forest stand types are higher compared to other tree species. This observation is attributed to the flammability of these pine and deciduous species being linked to post-fire regeneration based on their fire regime characteristics [59]. The significant difference between the surface flammable index and canopy flammable index values in older stands is explained by the decrease in canopy flammable load as trees age, starting the aging process [50], leading to a decrease in the probability of crown fire initiation [60]. Achieving accuracy in the actual degree of fire severity with a fire hazard risk mapping that includes such approaches will be possible. Models and all the data required for determining fire risk and severity should be easily accessible, and relevant institutions and authorities should be able to integrate them into their systems. All data necessary for implementing the models should be integrated into national and international spatial data infrastructures [55]. Only in this way can an understanding of extremely large fires be achieved, or preventive measures for their non-occurrence be known in advance.
In addition to fuel properties, stand canopy closure and development age were added. It was observed that in the areas where sub-criteria feature of topography change rapidly in short distances, fire severity also exhibits variability in parallel with this. To accurately describe the potential fire severity in fire risk maps, attention should be paid to region-growing techniques based on neighborhood relationships of fuel or vegetation that prioritize similar structures. This way, areas with similar vegetation structures will be combined, prioritizing the fuel properties that increase fire severity. The grouped areas with enlarged vegetation or fuel characteristics can be expected to be converted into average values by bringing together climate and topography characteristics. It is evident that climate data will affect broader areas.
Conclusiond
Research revealing both fire risk and burn severity in the same fire is crucial for improving the accuracy of models when studying these aspects separately. Additionally, it will provide crucial foundations for spatially planning fire management measures, such as prescribed fires, thinning for fire mitigation, establishing fire break zones, developing a network of fire roads, determining locations for fire pools, and deploying fire monitoring tools. Furthermore, it can facilitate the development of high accuracy burn severity mapping. These mappings can establish valid criteria that impact the success of post-fire adaptation and restoration activities. Sharing studies based on comparing the effects of fires that occur in areas where national or international fire risks are identified will strengthen decision-making frameworks for coping with challenges encountered in fire management efforts. Such a network will contribute significantly to reducing global environmental issues like sustainable forest management, carbon management, and climate change.
Acknowledgments
The authors would like to acknowledge the financial support of Istanbul Technical University (ITU) Scientific Projects Office (BAP) under project number MGA-2021-43241.
References
- Tepley, A.J.; Thomann, E.; Veblen, T.T.; Perry, G.L.W.; Holz, A.; Paritsis, J.; Kitzberger, T.; Anderson-Teixweria, K.J. Influences of fire–vegetation feedbacks and post-fire recovery rates on forest landscape vulnerability to altered fire regimes. Journal of Ecology. 2018, 106:1925–1940. [CrossRef]
- Brotons, L.; Aquilué, N.; De Cáceres, M.; Fortin, M.J.; Fall, A. How fire history, fire suppression practices and climate change affect wildfire regimes in Mediterranean landscapes. PLOS one. 2013, 8 (5), p.e62392. [CrossRef]
- Moreira, F.; Ascoli, D.; Safford, H.; Adams, M.A.; Moreno, J.M.; Pereira, J.M.; Catry, F.X.; Armesto, J.; Bond, W.; González, M.E.; Curt, T. Wildfire management in Mediterranean-type regions: paradigm change needed. Environmental Research Letters 2020, 15(1), p.011001. [CrossRef]
- Chicas, S.D.; Nielsen, Ø.J. Who are the actors and what are the factors that are used in models to map forest fire susceptibility? A systematic review. Natural Hazards. 2022, 114 (3), 2417-2434. [CrossRef]
- Kavanagh, K.L.; Dickinson, M.B.; Bova, A.S. A way forward for fire-caused tree mortality prediction: modeling a physiological consequence of fire. Fire Ecology. 2010, 6, 80-94. [CrossRef]
- Kwon, S.; Kim, S.; Kim, J.; Kang, W.; Park, K.H.; Kim, C.B. and Girona, M.M. Predicting post-fire tree mortality in a temperate pine forest, Korea. Sustainability. 2021, 13(2), p.569. [CrossRef]
- Thompson, M.P.; Calkin, D.E. Uncertainty and risk in wildland fire management: a review. Journal of environmental management. 2011, 92(8), pp.1895-1909. [CrossRef]
- Miller, C.; Ager, A.A. A review of recent advances in risk analysis for wildfire management. International journal of wildland fire. 2013, 22(1), pp.1-14. [CrossRef]
- Martinez, J.; Vega-Garcia, C.; Chuvieco, E. Human-caused wildfire risk rating for prevention planning in Spain. Journal of Environmental Management. 2009, 90, 1241–1252. [CrossRef]
- Rodrigues, M.; Riva, J. Assessing the effect on fire risk modeling of the uncertainty in the location and cause of forest fires. In Viegas DX (eds), Advances in Forest Fire Research. 2014, 1061–72. Coimbra, Portugal, da Universidade de Coimbra.
- Finney, M. A. The challenge of quantitative risk analysis for wildland fire. Forest ecology and management. 2005, 211(1-2), 97-108. [CrossRef]
- Maniatis, Y.; Doganis, A.; Chatzigeorgiadis, M. Fire Risk Probability Mapping Using Machine Learning Tools and Multi-Criteria Decision Analysis in the GIS Environment: A Case Study in the National Park Forest Dadia-Lefkimi-Soufli, Greece. Applied Sciences. 2022, 12(6), 2938. [CrossRef]
- Saglam, B.; Boyatan, M.; Sivrikaya, F. An innovative tool for mapping forest fire risk and danger: case studies from eastern Mediterranean. Scottish Geographical Journal. 2023, 139 (1-2), 160-180. [CrossRef]
- Sari, F. Identifying anthropogenic and natural causes of wildfires by maximum entropy method-based ignition susceptibility distribution models. Journal of Forestry Research. 2023, 34, 355–371. [CrossRef]
- Bot, K.; Borges, J.G. A Systematic Review of Applications of Machine Learning Techniques for Wildfire Management Decision Support. Inventions. 2022, 7, 15. [CrossRef]
- Akıncı, H. A.; Akıncı, H. Machine learning based forest fire susceptibility assessment of Manavgat district (Antalya), Turkey. Earth Science Informatics. 2023, 16, 397–414. [CrossRef]
- Satir, O.; Berberoglu, S.; Donmez, C. Mapping regional forest fire probability using artificial neural network model in a Mediterranean forest ecosystem. Geomatics, Natural Hazards and Risk. 2016, 7 (5), 1645-1658. [CrossRef]
- Nuthammachoti, N.; Stratoulias, D. A GIS- and AHP-based approach to map fire risk: a case study of Kuan Kreng peat swamp forest, Thailand. Geocarto International. 2021, 36 (2), 212-225. [CrossRef]
- Güngöroğlu, C. Determination of Forest Fire Risk with Fuzzy Analytic Hierarchy Process and its Mapping with the Application of GIS: The Case of Turkey/Çakırlar. Human and Ecological Risk Assessment: An International Journal. 2017, 23 (2), 388-406. [CrossRef]
- Parajuli, A.; Manzoor, S.A.; Lukac, M. Areas of the Terai Arc landscape in Nepal at risk of forest fire identified by fuzzy analytic hierarchy process. Environmental Development. 2023, 45: 100810. [CrossRef]
- Feizizadeh, B.; Roodposhti, M.S.; Jankowski, P.; Blaschke, T. A GIS-based extended fuzzy multi-criteria evaluation for landslide susceptibility mapping. Computers & Geosciences. 2014, 73, 208–221. [CrossRef]
- Bakırman, T.; Gümüşay, M.U.; Musaoğlu, N.; Tanık, A.G. Development of Sustainable Wetland Management Strategies by using Analytical Hierarchy Process (AHP) and Web-Based GIS: A Case Study from Turkey. Transactions in GIS. 2021, 26 (3), 1589-1608. [CrossRef]
- Sinha, A.; Nikhil, S.; Ajin, R.S.; Danumah, J.H.; Saha, S.; Costache, R.; Rajaneesh, A.; Sajinkumar, K.S.; Amrutha, K.; Johny, A.; Marzook F.; Mammen P.C.; Abdelrahman, K.S.; Fnais, M.; Abioui, M. Wildfire Risk Zone Mapping in Contrasting Climatic Conditions: An Approach Employing AHP and F-AHP Models. Fire. 2023, 6, 44. [CrossRef]
- Sari, F. Forest fire susceptibility mapping via multi-criteria decision analysis techniques for Mugla, Turkey: A comparative analysis of VIKOR and TOPSIS. Forest Ecology and Management. 2021, 480, 118644. [CrossRef]
- Sivrikaya, F.; Küçük, Ö. Modeling forest fire risk based on GIS-based analytical hierarchy process and statistical analysis in Mediterranean region. Ecological Informatics. 2022, 68, 101537. [CrossRef]
- Kavanagh, K.L.; Dickinson, M.B.; Bova, A.S. A Way Forward For Fire-Caused Tree Mortality Prediction: Modeling A Physiological Consequence of Fire. Fire Ecology. 2010, 6 (1), 80-94. [CrossRef]
- Hood, S.M. Physiological responses to fire that drive tree mortality. Plant Cell Environment. 2021, 44:692–695. [CrossRef]
- Etchell, H.; O’Donnell, A.J.; McCaw, M.L.; Grierson, P. Fire severity impacts on tree mortality and post-fire recruitment in tall eucalypt forests of southwest Australia. Forest Ecology and Management. 2020, 459 (1), 117850. [CrossRef]
- Peterson, D.L.; Ryan, K.C. Modeling Postfire Planning Conifer Mortality for Long-range planning. Environmental Management. 2012, 10 (6), 797-808. [CrossRef]
- Wei, M.; Zhang, Z.; Long, T.; He, G.; Wang, G. Monitoring Landsat based burned area as an indicator of Sustainable Development Goals. Earth’s Future. 2021, 9, e2020EF001960. [CrossRef]
- Roces-Díaz, J.V.; Santin, C.; Martínez-Vilalta, J.; Doerr, S.H. A global synthesis of fire effects on ecosystem services of forests and woodlands. Frontiers in Ecology and the Environment. 2022, 20 (3), 170–178. [CrossRef]
- San-Miguel-Ayanz, J.; Durrant, T.; Boca, R.; Maianti, P.; Libertá, G.; Artés-Vivancos, T.; Oom, D.; Branco, A.; de Rigo, D.; Ferrari, D.; Pfeiffer, H.; Grecchi, R.; Onida, M.; Löffler, P. 2022. Forest Fires in Europe, Middle East and North Africa 2021, Publications Office of the European Union, Luxembourg. 2022, JRC130846. [CrossRef]
- Manavgat Orman İşletme Müdürlüğü, Orman Amenajman Planları Meşcere Haritaları, 2021.
- Roy, D.P.; Huang, H.; Boschetti, L.; Giglio, L.; Yan, L.; Zhang, H.H.; Li, Z. Landsat-8 and Sentinel-2 burned area mapping - A combined sensor multi-temporal change detection approach. Remote Sensing of Environment. 2019, 231, 111254. [CrossRef]
- İsmailoğlu, İ.; Musaoğlu, N. Burn severity assessment with different remote sensing products for wildfire damage analysis, SPIE Conference Proceeding. October 4, 2023, San Diego, USA.
- Bennett, M.; Fitzgerald, S.; Parker, B.; et al. Reducing Fire Risk on Your Forest Property. A Pacific Northwest.
- Extension Publication. 2010, 618. Available at: https://catalog.extension.oregonstate.edu/sites/catalog/files/project/pdf/pnw618.pdf.
- Pereira, M.G.; Trigo, R.M.; Da Camara, C.C.; et al. Synoptic patterns associated with large summer forest fires in Portugal. Agricultural and Forest Meteorology. 2005, 129, 11–25. [CrossRef]
- Bonora, L.; Conese, C.; Marchi, E.; Tesi, E.; Montorselli, N.B. Wildfire occurrence: Integrated model for risk analysis and operative suppression aspects management. American Journal of Plant Sciences. 2013. 4, 705–710. [CrossRef]
- Bradshaw, L.; Deeming, J.E.; Burgan, R.E.; Cohen, J.D. The 1978 National Fire-Danger Rating System: technical documentation. USDA Forest Service, Intermountain Forest and Range Experiment Station, General Technical Report INT-169. 1984, (Ogden, UT).
- Possell, M.; Bell, T. L. The influence of fuel moisture content on the combustion of Eucalyptus foliage. International journal of wildland fire. 2013, 22 (3), 343-352. [CrossRef]
- Syphard, A. D.; Rustigian-Romsos, H.; Mann, M.; Conlisk, E.; Moritz, M.A.; Ackerly, D. The relative influence of climate and housing development on current and projected future fire patterns and structure loss across three California landscapes. Global Environmental Change. 2019, 56, 41-55. [CrossRef]
- Sharples, J. J.; McRae, R. H. D.; Weber, R. O.; Gill, A. M. Simple indices for assessing fuel moisture content and fire danger rating. Fire Note. 2010, 65, 1-4. [CrossRef]
- Flatley, W.T.; Lafon, C.W.; Grissino-Mayer, H.D. Climatic and topographic controls on patterns of fire in the southern and central Appalachian Mountains, USA. Landscape Ecology. 2011, 26:195–209. [CrossRef]
- Fernandes, P.M. Combining forest structure data and fuel modelling to classify fire hazard in Portugal. Annals of Forest Science. 2009, 66: 415p9. [CrossRef]
- Bond-Lamberty, B.; Wang, C.; Gower, S. Aboveground and belowground biomass and sapwood area allometric equations for six boreal tree species of northern Manitoba. Canadian Journal of Forest Research. 2002, 32, 1441-1450. [CrossRef]
- Güngöroğlu, C.; Güney, Ç. O.; Sarı, A.; Serttaş, A. Estimation of fuel load in maquis type vegetation of Antalya. International Symposium on New Horizons in Forestry, October 18-20, 2017, Isparta / Turkey.
- Küçük, Ö.; Bilgili, E.; Sağlam, B. Estimating crown fuel loading for Calabrian pine and Anatolian black pine. International Journal of Wildland Fire. 2008, 17(1), 147–54. [CrossRef]
- Küçük, Ö.; Sağlam, B.; Bilgili, E. Canopy fuel characteristics and fuel load in young black pine trees. Biotechnology and Biotechnological Equipment. 2007, 21 (2), 235-240. [CrossRef]
- Sağlam, B.; Küçük, Ö.; Bilgili, E.; Dinç Durmaz, B.; Baysal, İ. Estimating fuel biomass of some shrub species (Maquis) in Turkey. Turkish Journal of Agriculture and Forestry. 2008, 32 (4), 349-356.
- Yurtgan, M.; Baysal, İ.; Küçük, Ö. Fuel characterization and crown fuel load prediction in non-treated Calabrian pine (Pinus brutia Ten.) plantation areas. iForest - Biogeosciences and Forestry. 2022, 15 (6), 458-464. [CrossRef]
- Chang, D.Y. Applications of the extent analysis method on fuzzy AHP. European Journal of Operational Research. 1996, 95 (3), 649–55. [CrossRef]
- Kahraman, C.; Ertay, T.; Büyüközkan, G. A fuzzy optimization model for QFD planning process using analytic network approach. European Journal of Operational Research. 2006, 171 (2), 390–411. [CrossRef]
- Szpakowski, D.M.; Jensen, J.L.R.; Butler, D.R.; Chow, T.E. A study of the relationship between fire hazard and burn severity in Grand Teton National Park, USA. International Journal of Applied Earth Observations and Geoinformation. 2021, 98: 102305. [CrossRef]
- Paz, S.; Carmel, Y.; Jahshan, F.; Shoshany, M. Post-fire analysis of pre-fire mapping of fire-risk: A recent case study from Mt. Carmel (Israel). Forest Ecology and Management. 2010, 262, 1184–1188. [CrossRef]
- Maniatis, Y.; Athanasios Doganis, A.; Chatzigeorgiadis, M. Fire Risk Probability Mapping Using Machine Learning Tools and Multi-Criteria Decision Analysis in the GIS Environment: A Case Study in the National Park Forest Dadia-Lefkimi-Soufli, Greece. Applied Science. 2022, 12, 2938. [CrossRef]
- Finney, M.A. The challenge of quantitative risk analysis for wildland fire. Forest Ecology and Management. 2005, 211, 97–108. [CrossRef]
- Estes, B.L.; Knapp, E.E.; Skinner, C.N.; Miller, J.D.; Preisler, H.K. Factors influencing fire severity under moderate burning conditions in the Klamath Mountains, northern California, USA. Ecosphere. 2017, 8 (5):e01794. [CrossRef]
- Trucchia, A.; Meschi, G.; Fiorucci, P.; Provenzale, A.; Tonini, M.; Pernice, U. Wildfire hazard mapping in the eastern Mediterranean landscape. International Journal of Wildland Fire. 2023, 32 (3), 417–434. [CrossRef]
- Saura-Mas, S.; Paula, S.; Pausas, J.G.; Lloret, F. Fuel loading and flammability in the Mediterranean Basinwoody species with different post-fire regenerative strategies. International Journal of Wildland Fire. 2010, 19, 783–794. [CrossRef]
- Mitsopoulos, I.D.; Dimitrakopoulos, A.P. Canopy fuel characteristics and potential crown fire behavior in Aleppo pine (Pinus halepensis Mill.) forests. Annals of Forest Science. 2007, 64, 287–2992007. [CrossRef]
Figure 1.
Study Area.
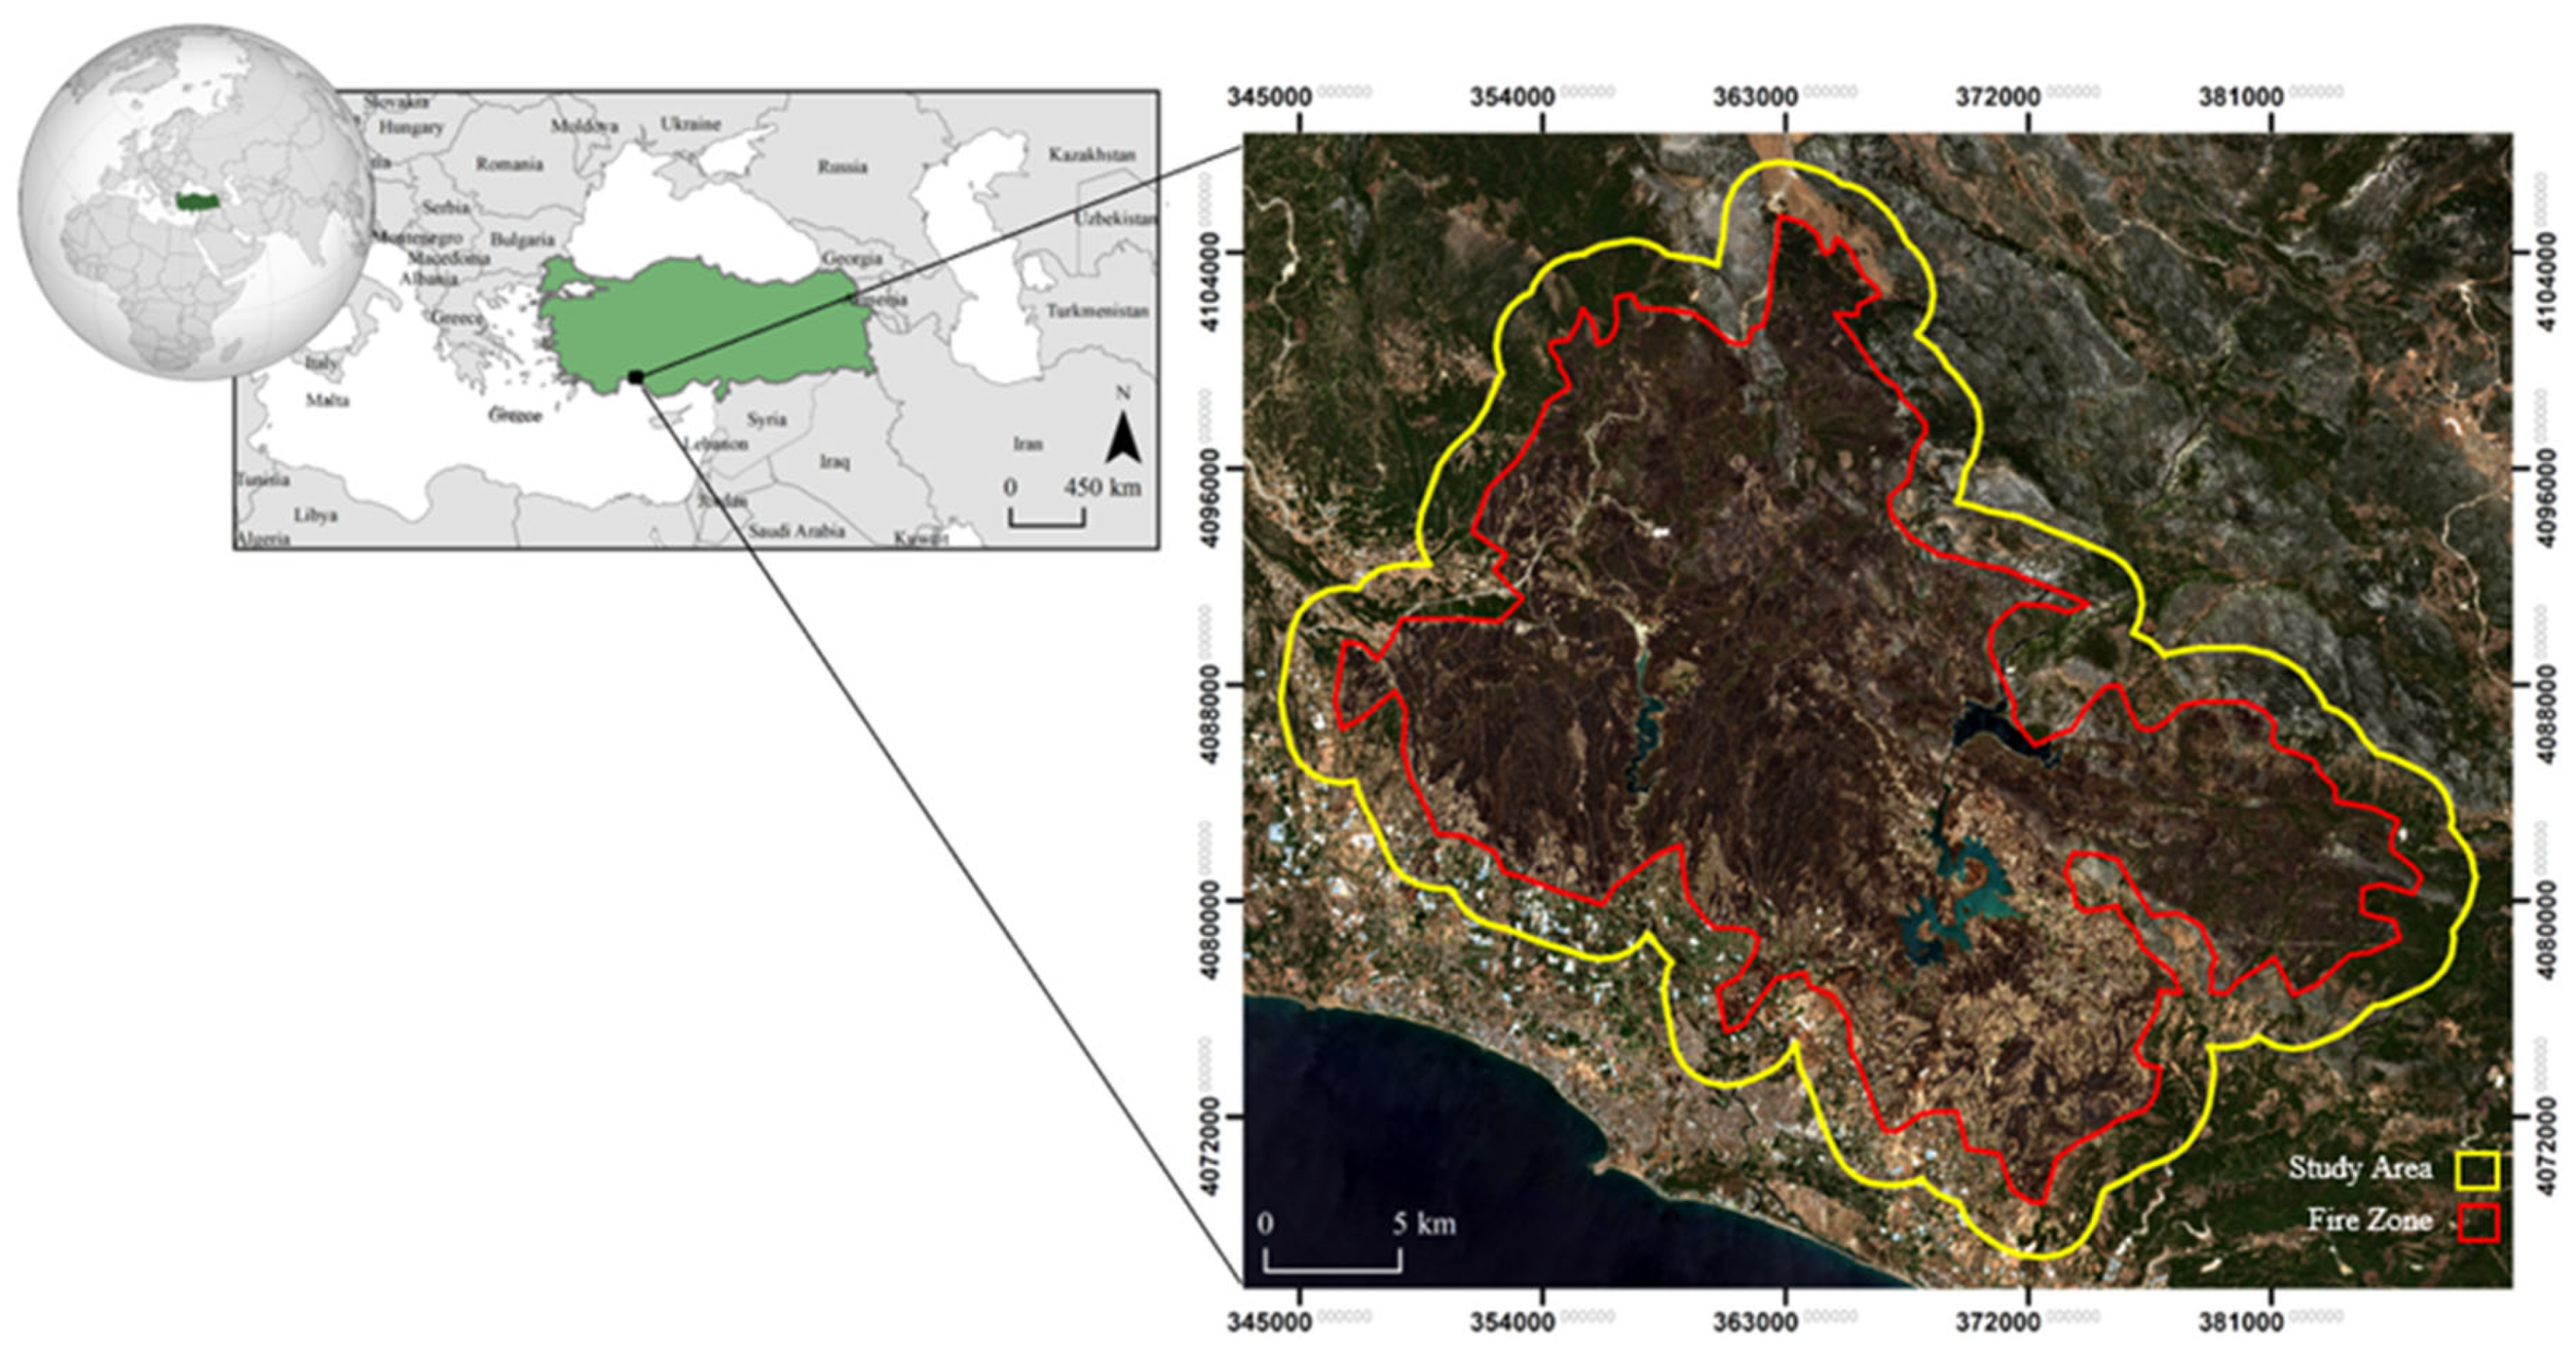
Figure 2.
Methodology.
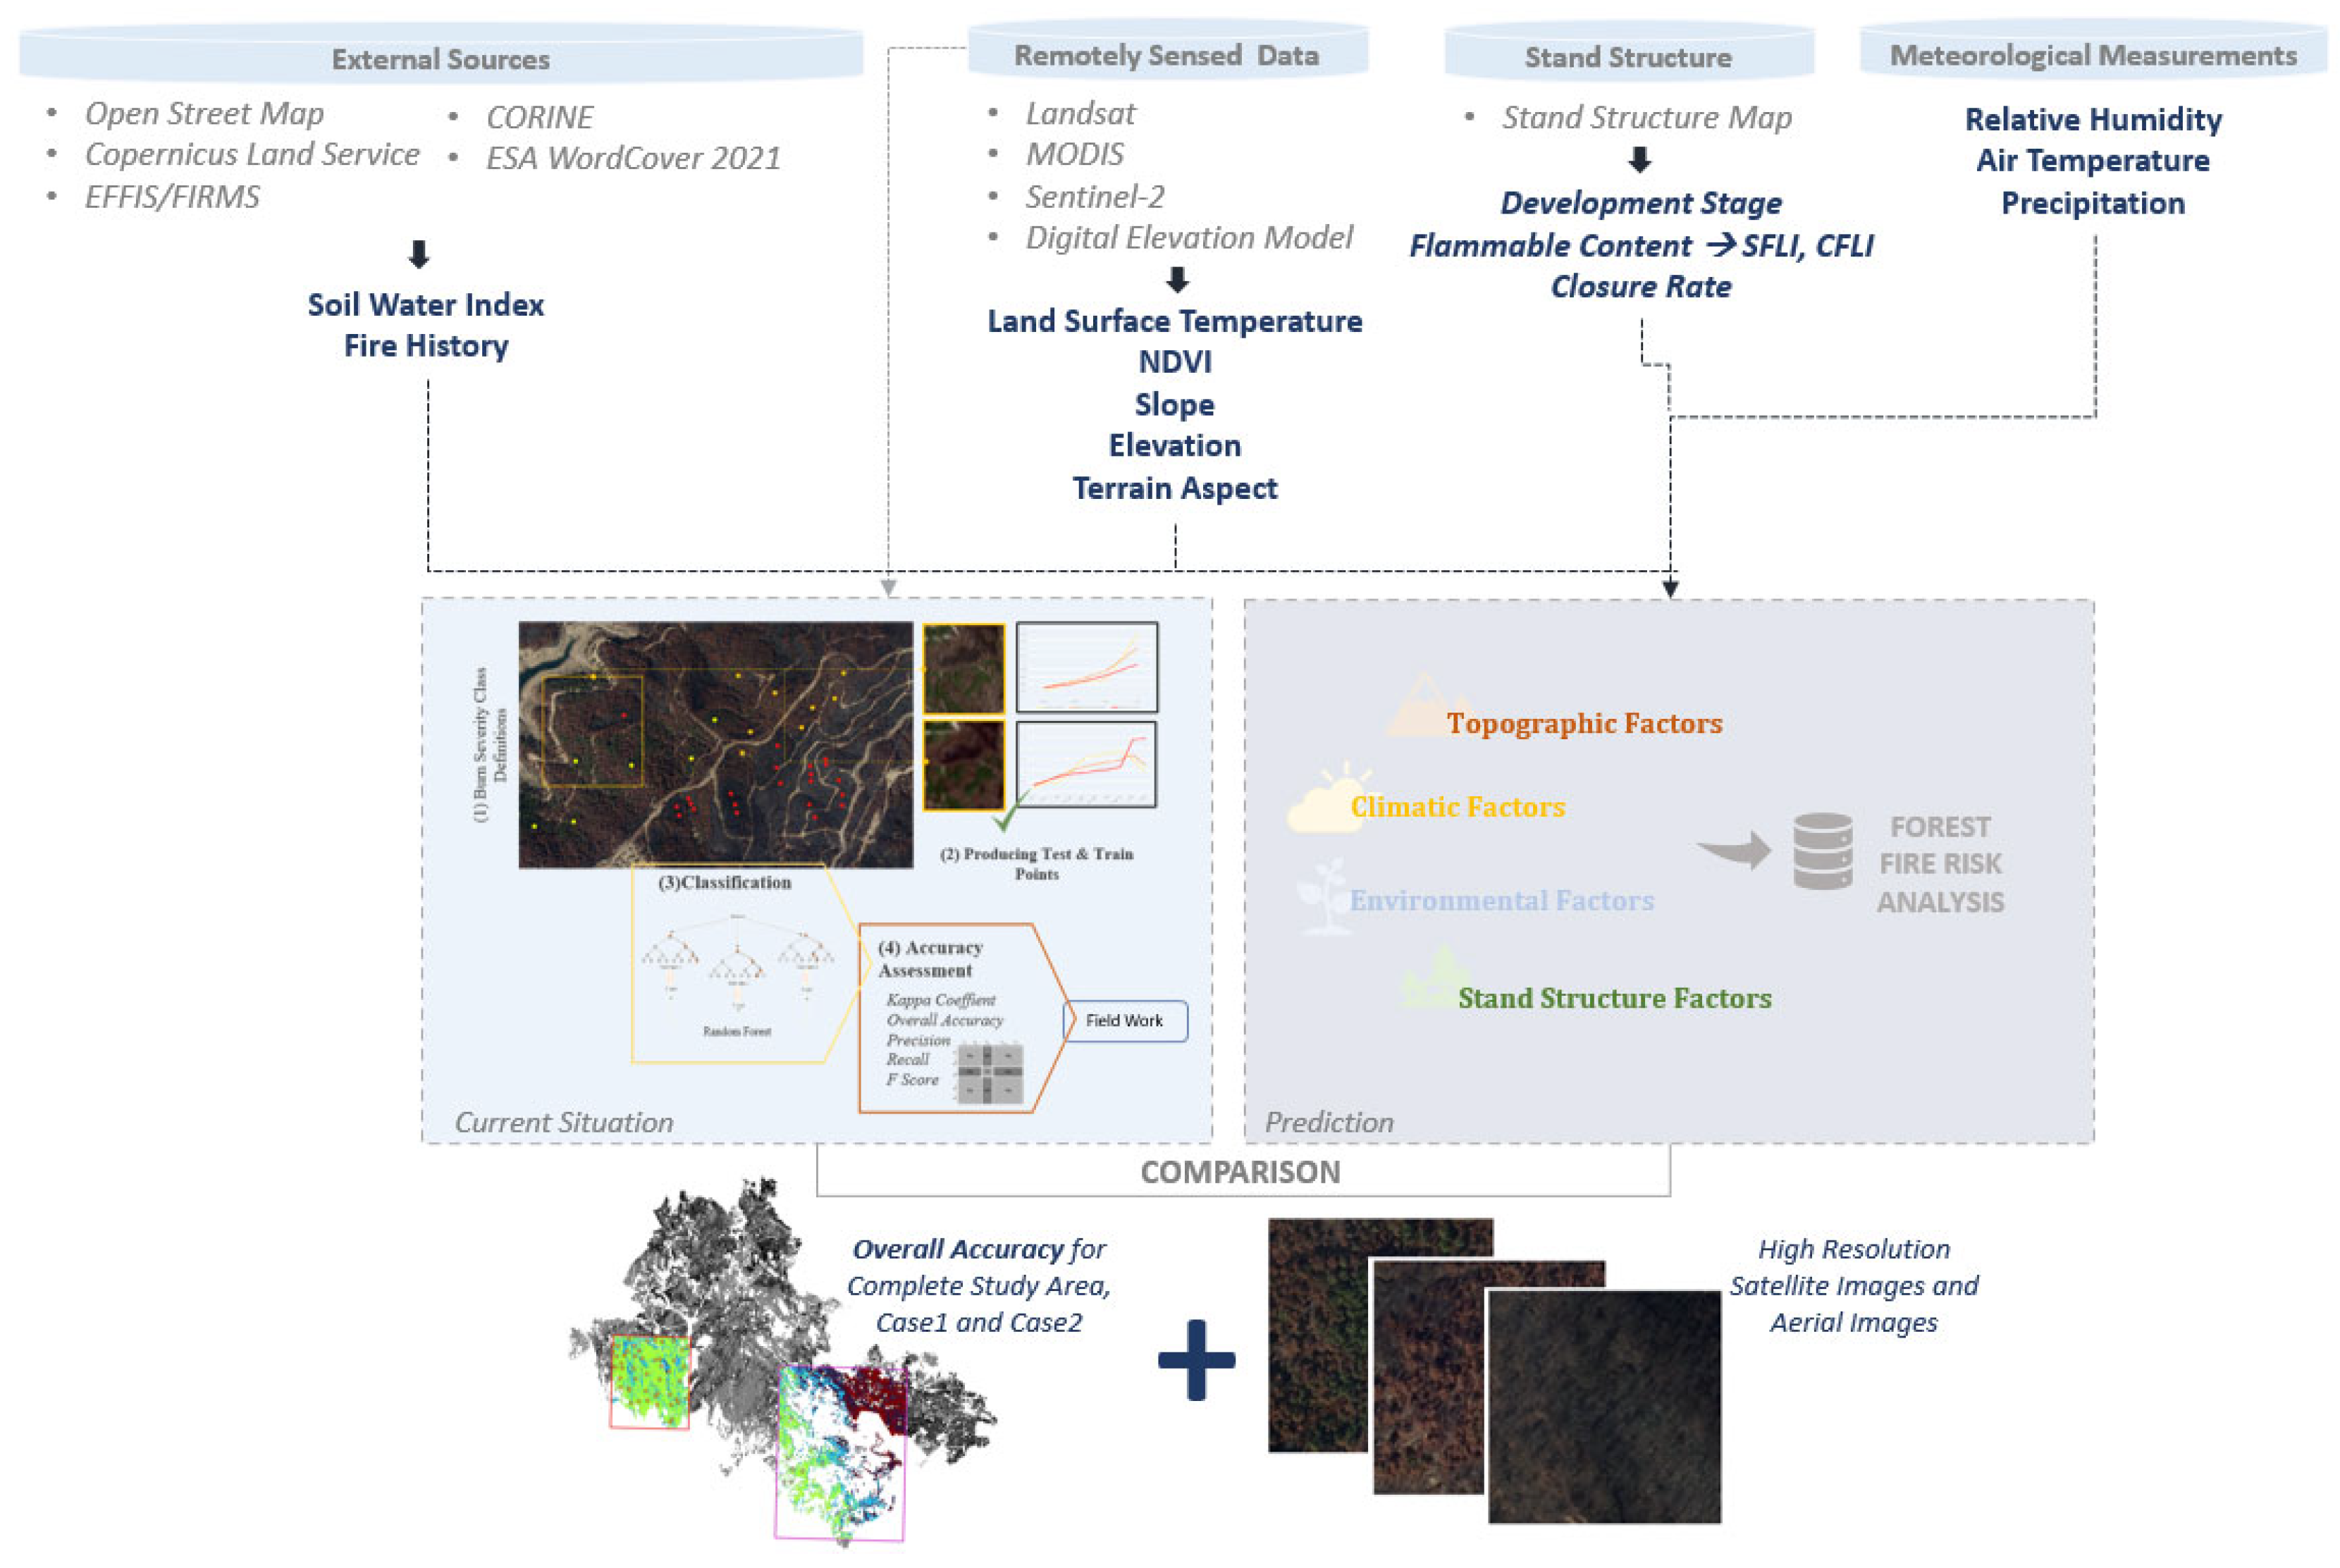
Figure 3.
(a) Samples from field measurements conducted in the ancient city of Libre and its surroundings (b) Examples of trees affected to varying degrees by the fire and a sample of a completely burnt forest area.
Figure 3.
(a) Samples from field measurements conducted in the ancient city of Libre and its surroundings (b) Examples of trees affected to varying degrees by the fire and a sample of a completely burnt forest area.
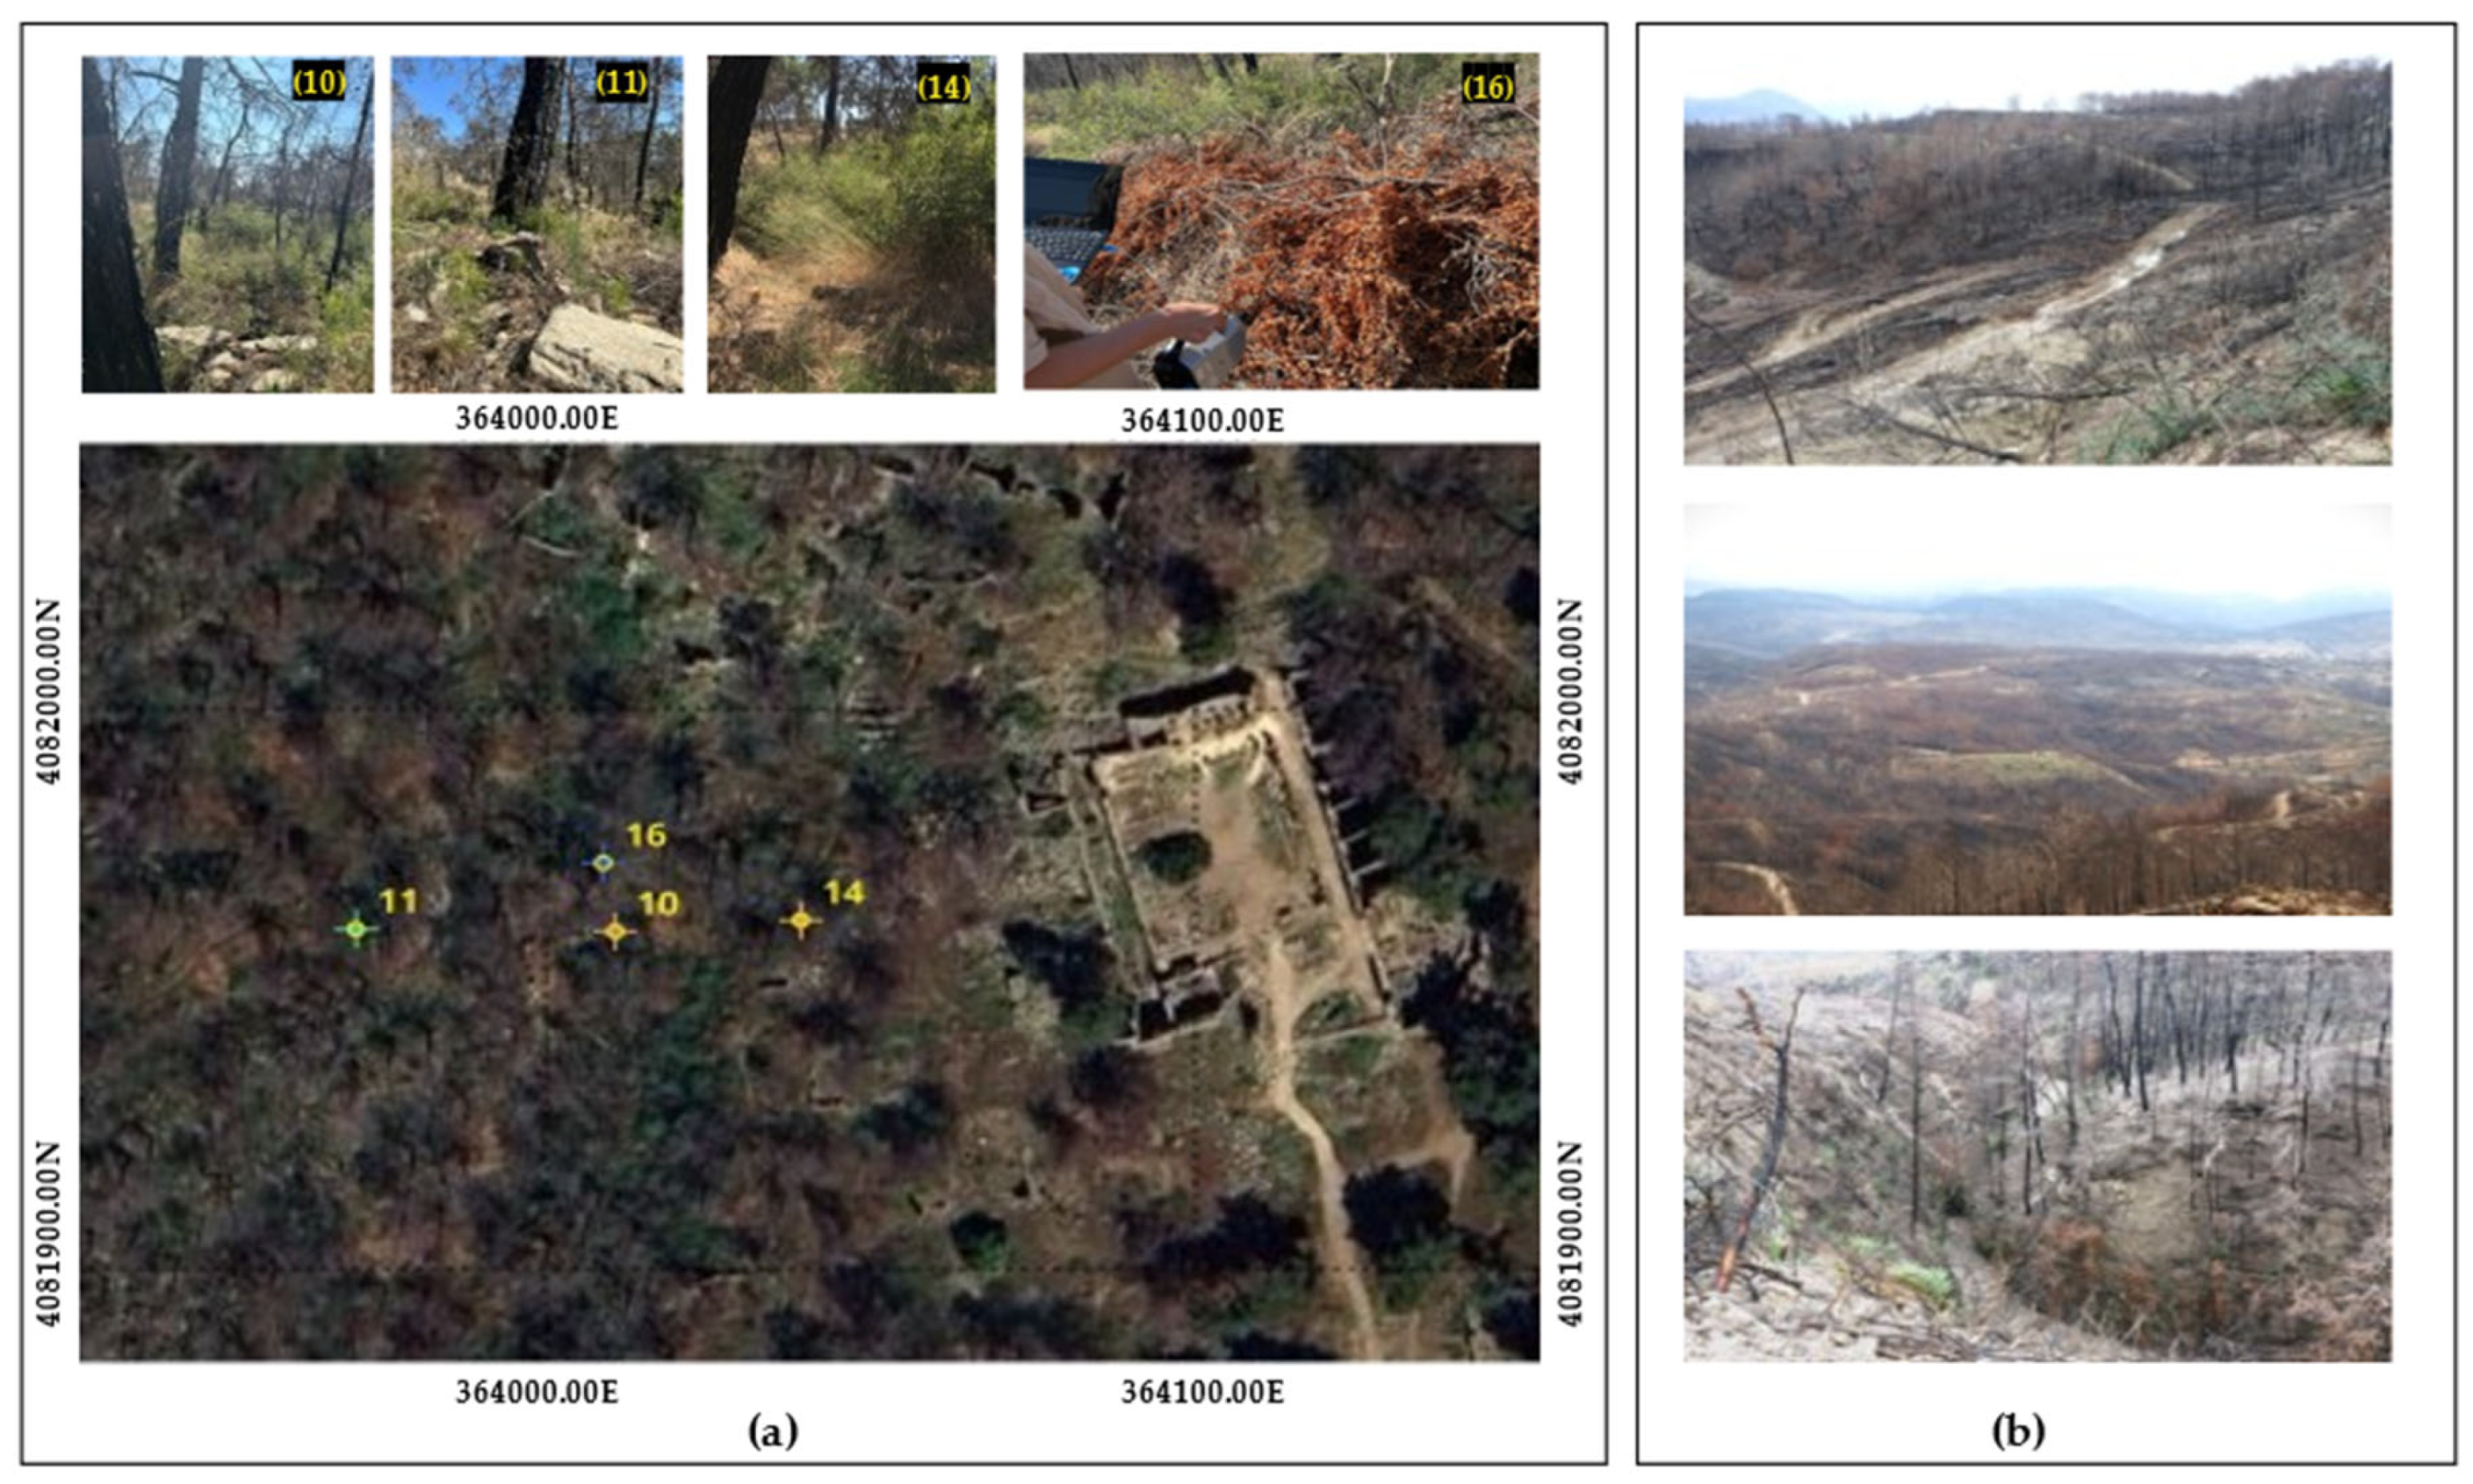
Table 1.
The general characteristics of the data used.
| Data | Operator | Global/Local | Extracted Information | Spatial Resolution (m) |
Source |
|---|---|---|---|---|---|
| Landsat | NASA and the U.S. Geological Survey (USGS) | Global | Land Surface Temperature | 30 | https://landsat.gsfc.nasa.gov/data/ |
| Sentinel-2 | European Space Agency (ESA) | Global | Normalized Difference Vegetation Index, Burn Severity Classes (by Classification) |
10,20,60 | https://www.esa.int/Applications/Observing_the_Earth/Copernicus/Sentinel-2 |
| Digital Elevation Model | Republic of Türkiye General Directorate of Mapping | Local | Slope, Elevation, Terrain Aspect | 2,50 | https://www.harita.gov.tr/ |
| Aerial Photos | Visual Interpretation | 0,25 | |||
| SPOT - Pleiades | AIRBUS | Global | Visual Interpretation | 1,5 - 0,5 | |
| Open Street Map | Open Street Map | Global | Land Use/Land Cover Classes | https://www.openstreetmap.org/ | |
| European Forest Fire Information System (EFFIS) | European Commission, EU Copernicus Program | European, Middle East and North African countries (Totally 43 countries) | Active Fire Points | - | https://effis.jrc.ec.europa.eu/about-effis |
| Fire Information for Resource Management System (FIRMS) | NASA LANCE | Global | Active Fire Points | - | https://firms.modaps.eosdis.nasa.gov/ |
| Copernicus Land Monitoring Service | European Environment Agency’s Copernicus Land Monitoring Service | Global, European continent | Soil Water Index(SWI) Land Use/Land Cover Classes(LU/LC) |
1000(SWI) Minimum Mapping Unit (MMU) of 25 hectares (ha)(LU/LC) |
https://land.copernicus.eu/en |
| ESA WorldCover | European Space Agency (ESA) | Global | Land Use/Land Cover Classes | 10 | https://esa-worldcover.org/en |
| Stand Structure Map | Republic of Türkiye General Directorate of Forestry | Local | Development Stage,Closure Rate, Flammable Content | - | https://www.ogm.gov.tr/en/organization/general-information |
| Meteorological Measurements | Turkish State Meteorological Service | Local | Relative Humidity, Air Temperature, Precipitation | - | https://www.mgm.gov.tr/eng/forecast-cities.aspx |
Table 2.
Used fuzzy scale of relative importance.
| Linguistic scale for importance | Triangular fuzzy scale | Triangular fuzzy reciprocal scale |
|---|---|---|
| Just equal | (1, 1, 1) | (1, 1, 1) |
| Equally important | (1/2, 1, 3/2) | (2/3, 1, 2) |
| Strongly more important | (1, 3/2, 2) | (1/2, 2/3, 1) |
| Very strongly more important | (3/2, 2, 5/2) | (2/5, 1/2, 2/3) |
| Absolutely more important | (2, 5/2, 3) | (1/3, 2/5, 1/2) |
Table 4.
Accuracy metrics for case areas.
| Case 1 | Case 2 | ||
|---|---|---|---|
| Overall Accuracy | 0.4490 | 0.3429 | |
| F-score | Low BurnSeverity | 0 | 0.0909091 |
| Moderate Burn Severity | 0.4 | 0.518519 | |
| High Burn Severity | 0.588235 | 0.380952 | |
Disclaimer/Publisher’s Note: The statements, opinions and data contained in all publications are solely those of the individual author(s) and contributor(s) and not of MDPI and/or the editor(s). MDPI and/or the editor(s) disclaim responsibility for any injury to people or property resulting from any ideas, methods, instructions or products referred to in the content. |
© 2023 by the authors. Licensee MDPI, Basel, Switzerland. This article is an open access article distributed under the terms and conditions of the Creative Commons Attribution (CC BY) license (http://creativecommons.org/licenses/by/4.0/).
Copyright: This open access article is published under a Creative Commons CC BY 4.0 license, which permit the free download, distribution, and reuse, provided that the author and preprint are cited in any reuse.


