Submitted:
20 December 2023
Posted:
21 December 2023
You are already at the latest version
Abstract
Hypertension stands as the foremost modifiable risk factor for cardiovascular disorders in South Asia. This research demonstrates the superiority of statistical models over traditional approaches in identifying clinical risks related to hypertension. Leveraging individual-level data from the Bangladesh Demographic and Health Survey (2017-18), a unified dataset was created. Adhering to JNC7 and ACC/AHA guidelines for hypertension classification, two prominent regression models were employed to estimate the prevalence of undiagnosed hypertension. A substantial 16% of hypertension cases in Bangladesh remain undetected. The study identifies undiagnosed hypertension as a heightened risk, particularly among the youth and residents of Sylhet and Rangpur divisions. Statistical models exhibit efficacy in discerning undiagnosed hypertension and associated factors in South Asia. Subsequent investigations should incorporate biological markers to enhance statistical models and ascertain their practicality.
Keywords:
Undiagnosed Hypertension
; Logistic Regression
; Log-Binomial Regression
; Machine Learning
; Cross-Sectional Studies
1. Introduction
Hypertension, also known as high blood pressure, is a significant global health issue associated with cardiovascular and cerebrovascular disorders. [1]. It contributes to nearly 13% of worldwide fatalities annually and poses a risk for adverse health outcomes [2,3]. Despite cost-effective treatments being available, a considerable number of individuals remain untreated due to a lack of awareness or insufficient treatment.
In 2008, over 40% of individuals aged 25 and above globally were diagnosed with hypertension, and the prevalence has been steadily increasing [6,7]. Undiagnosed hypertension can lead to severe health issues such as kidney failure, blindness, artery rupture, and brain damage. However, even a slight reduction in blood pressure can significantly decrease the risk of cardiovascular disease.
Addressing the challenge of undiagnosed hypertension requires collective action to raise awareness, promote screening and diagnosis, and improve access to cost-effective treatments. This approach has the potential to benefit millions of people worldwide and improve health outcomes [10,11].
Despite being preventable and manageable, hypertension is widespread globally, affecting people from different regions and socioeconomic backgrounds at varying rates. Noncommunicable diseases (NCDs) have a substantial global and regional burden, responsible for more than two-thirds of worldwide fatalities, with a higher impact in low- and middle-income countries [3].
The prevalence of hypertension, defined as systolic blood pressure (SBP) of 140 mm Hg or diastolic blood pressure (DBP) of 90 mm Hg in adults, varies across regions. High-income countries and several Southeast Asian countries show a 35% prevalence, while African countries, India, and rural China exhibit higher rates. This highlights a disproportionate impact on populations in low and middle-income countries with weaker healthcare systems [12,13].
In Southeast Asian countries, over half of patients with hypertension are undiagnosed, and Bangladesh is one such low-income country facing a rise in diabetes and hypertension. The age-standardized prevalence of both known and newly diagnosed hypertension in Bangladesh is 38.6%, with no significant difference between men and women [6]. The aging population in Bangladesh is expected to further increase the number of people suffering from hypertension [15].
Despite being common and preventable, hypertension can be asymptomatic, leading to misdiagnosis and untreated cases. Rural areas in Bangladesh lack information about hypertension management strategies, and the government is legally obligated to provide basic healthcare to all citizens.
Estimating the incidence of undiagnosed hypertension at the national level is crucial for developing effective strategies to alleviate the burden of hypertension. Unfortunately, knowledge of the national prevalence of undiagnosed hypertension in Bangladesh is limited.
Despite being common and preventable, hypertension can be asymptomatic, leading to misdiagnosis and untreated cases. Rural areas in Bangladesh lack information about hypertension management strategies, and the government is legally obligated to provide basic healthcare to all citizens. Estimating the incidence of undiagnosed hypertension at the national level is crucial for developing effective strategies to alleviate the burden of hypertension. Unfortunately, knowledge of the natioal prevalence of undiagnosed hypertension in Bangladesh is limited.
To address this gap, our research aims to determine the national prevalence of undiagnosed hypertension among Bangladeshi adults aged 18 and above. We also seek to identify socioeconomic factors associated with undiagnosed hypertension. The study employs logistic regression analysis and log-binomial regression analysis to compare their effectiveness in predicting the prevalence of undiagnosed hypertension in the Bangladeshi adult population.
The study aims to answer the following research questions:
- What is the prevalence of undiagnosed hypertension in the Bangladeshi adult population?
- What are the socioeconomic factors associated with undiagnosed hypertension?
- How do logistic regression analysis and log-binomial regression analysis compare in predicting the prevalence of undiagnosed hypertension in the Bangladeshi adult population?
The study’s contributions are as follows:
- The study provides the first estimate of the national prevalence of undiagnosed hypertension in Bangladesh.
- It identifies socioeconomic factors associated with undiagnosed hypertension, offering insights into the broader context of the issue.
- The study compares the effectiveness of two statistical models, logistic regression analysis and log-binomial regression analysis, in predicting the prevalence of undiagnosed hypertension.
- It demonstrates the application of both statistical methods on real-world datasets, showcasing their practical utility.
- The findings aim to inform the development of effective hypertension prevention and control programs not only in Bangladesh but also in other low and middle-income countries facing similar challenges.
2. Materials and Methods
2.1. Data sources
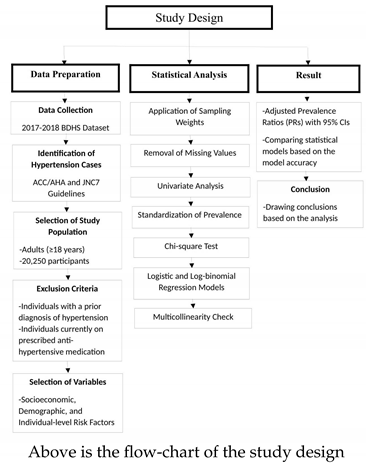
This study utilized the 2017-2018 Bangladesh Demographic and Health Survey (BDHS) dataset, conducted between October 2017 and March 2018 under the Ministry of Health and Family Welfare, Medical Education and Family Welfare Division, and the National Institute of Population Research and Training. The survey aimed to assess health indicators, population health, maternity and child health, as well as the prevalence of major non-communicable diseases such as diabetes and hypertension.
2.2. Study population and survey design
The nationally representative sample for the 2017-18 BDHS comprised enumeration areas (EAs), with primary sampling units (PSUs) covering approximately 120 households. The two-stage stratified sample included 20,250 participants, with blood pressure (BP) and fasting plasma glucose (FPG) testing conducted for all adults aged (≥18) years [17]. The research focused on Bangladeshi adults aged (≥18) years without a prior diagnosis of hypertension to inform effective prevention and control programs.
2.3. Dependent variable
Undiagnosed hypertension was identified using the 2017 American College of Cardiology/American Heart Association (ACC/AHA) and the Seventh Report of Joint National Committee (JNC7) guidelines. Individuals with systolic blood pressure (SBP) of ≥ 130 mmHg and/or diastolic blood pressure (DBP) of ≥ 80 mmHg (ACC/AHA) or SBP of ≥ 140 mmHg and/or DBP of ≥ 90 mmHg (JNC7) were classified as hypertensive [18]. The outcome variable was defined as undiagnosed hypertension, indicating individuals meeting the guidelines but not receiving prescribed anti-hypertensive medication or professional diagnosis before the survey [6,14,19,20].
2.4. Explanatory variables
Socioeconomic, demographic, and individual-level risk factors were selected based on literature from low- and middle-income countries (LMICs) [6,14,19,20,21]. Variables included administrative division (Barishal, Chattogram, Dhaka, Khulna, Mymensingh, Rajshahi, Rangpur, Sylhet); place of residence (urban, rural); socioeconomic status (poorest, poorer, middle, richer, richest); age (in years); education level (no formal education, primary, secondary, higher); occupational status (employed; unemployed).
2.5. Statistical analysis
In this study, a rigorous statistical analysis was employed to investigate the prevalence of undiagnosed hypertension among Bangladeshi adults using the 2017-2018 Bangladesh Demographic and Health Survey (BDHS) dataset [17]. The analysis adhered to best practices and sought to provide a comprehensive understanding of the factors influencing undiagnosed hypertension.
To account for the complex sample design, sampling weights were meticulously applied, ensuring that the study’s findings accurately represented the broader population. This step was crucial for robust and unbiased statistical inferences.
Univariate analysis was conducted to identify potential risk factors associated with undiagnosed hypertension. Continuous variables, including medians and interquartile ranges, and categorical variables, expressed as frequencies and percentages, were presented. The age-standardized prevalence allowed for nuanced insights into the distribution of undiagnosed hypertension across different age groups.
Chi-square tests were employed to scrutinize the relationship between undiagnosed hypertension and various risk variables. This approach facilitated the identification of potential associations and informed subsequent multivariate analyses.
Both simple logistic and log-binomial regression models were chosen for their suitability in estimating adjusted prevalence ratios (PRs) along with 95% confidence intervals. These models were instrumental in discerning the influence of socioeconomic, demographic, and individual-level risk factors on the prevalence of undiagnosed hypertension while accounting for potential confounding variables.
An essential consideration in the analysis was the evaluation of multicollinearity among risk factors. Variance inflation factors were calculated to ensure the independence and reliability of the information provided by each variable in predicting undiagnosed hypertension.
In addition to traditional model evaluation metrics, the study incorporated Akaike Information Criterion (AIC) and Bayesian Information Criterion (BIC). These criteria were employed to assess the goodness of fit and model complexity, enhancing the robustness of the statistical models.
Model accuracy, a key performance indicator, was systematically assessed to compare the effectiveness of the statistical models. The emphasis on accuracy aimed to enhance the reliability of the findings, providing valuable insights for shaping future hypertension prevention and control programs.
2.6. Data Analysis Software
All data analyses were conducted using Bell Laboratories’ R version 4.1.2 (Bell Laboratories, New Jersey, USA).
2.7. Ethical consideration
This study used publicly available secondary data from the Demographic and Health Surveys (DHS) Program, obviating the need for additional ethical approval. Ethical procedures adhered to by the DHS Program are detailed in the BDHS report [16].
3. Results
3.1. Background characteristics
A total of 1769 weighted participants were included in the analysis (Table 1) who were undiagnosed with hypertension till the survey of 2017-18 BDHS. The median (IQR) of SBP and DBP were 142 mmHg (125-161) and 89 mmHg (81-97), respectively. 73.50% of participants among the total 1769 participants ever measured their blood pressure before the survey was taken. Whereas 26.5% of the participants never checked their blood pressure before. During the survey, around 77% of the total participants were diagnosed with hypertension among them around 81% participants were already taking anti-hypertensive medications to lower their blood pressure.
Recognizing other explanatory variables, administrative divisions of Bangladesh have an almost equal proportion of participants who were undiagnosed with hypertension. Among those participants, around 59% of participants were from rural areas of Bangladesh. Table 1 also shows that the median (IQR) age of the respondents was 49.0 years (38.0–60.0). More than half of the total 1769 participants who were undiagnosed with hypertension have almost no to little education. Among the total of 1769 participants, around 53% are not actively working in their daily life and more than half of the total belongs to well-off family backgrounds.
3.2. Logistic regression model
Based on the ACCAHA guideline, from the logistic regression model, we have found that the administrative division and the age of the participants were significantly associated with undiagnosed hypertension. The results of the multiple logistic regression study with a 67% model accuracy are shown in Table 2.
In Table 2, we can see that respondents from Chattogram, Dhaka, Khulna, Rajshahi, Rangpur, Mymensingh divisions are less likely to have undiagnosed hypertension compared to the respondents from Barisal division. On the other hand, it also shows that respondents from Sylhet division (PR = 1.40; 95% CI = 0.71 – 2.77) are more likely to have undiagnosed hypertension than Barisal division. Also, hypertensive patients who are from urban areas, have a 3% more chance to have undiagnosed hypertension in contrast with those patients who are from rural (PR = 0.97; 95% CI = 0.64 – 1.46) areas.
Old age patients (age range from 55 to 64 years or more) are less likely to have undiagnosed hypertension compared to patients from young and adult age groups, mostly those aged from 25 to 34 (PR = 0.87; 95% CI = 0.39 – 1.93) years and 35 to 44 (PR = 0.32; 95% CI = 0.14 – 0.75) years. Patients who received primary, secondary, and higher-level education were 28% (PR = 0.72; 95% CI = 0.44 – 1.17), 25% (PR = 0.75; 95% CI = 0.40 – 1.38), and 43% (PR = 0.57; 95% CI = 0.23 – 1.31) less likely to have undiagnosed hypertension respectively compared to the patients with no education at all. Patients with poor financial status are 8% (PR = 1.08; 95% CI = 0.55 – 1.55) more likely to have undiagnosed hypertension in comparison with those patients who belong to middle-class families. On the contrary, respondents with rich financial stability are 26% (PR = 0.74; 95% CI = 0.44 – 1.25) less likely to have undiagnosed hypertension.
According to the JNC7 guideline, the logistic regression model revealed a strong association between undiagnosed hypertension and the participants’ age and administrative division. Table 3 displays the findings of the multiple logistic regression analysis with an accuracy of 86%.
Table 3 shows that respondents from the divisions of Chattogram, Dhaka, Khulna, Rajshahi, and Mymensingh are less likely to have undiagnosed hypertension than respondents from the division of Barisal. On the other hand, it also reveals that respondents from Sylhet and Rangpur divisions are more likely than those from Barisal to have undiagnosed hypertension (PR = 1.86; 95% CI = 0.84 - 4.18) and 2.09 and 2.09, respectively. Additionally, compared to patients from urban regions, hypertensive patients from rural areas have a 9% (PR = 1.09; 95% CI = 0.68 - 1.80) higher likelihood of having undiagnosed hypertension. When contrast to individuals from young and adult age groups, most commonly those aged 25 to 34 (PR = 0.79; 95% CI = 0.34 - 2.18) and 35 to 44 (PR = 0.53; 95% CI = 0.19 - 1.49) years, older patients (age range of 55 to 64 years or more) are less likely to have undetected hypertension. Those with primary, secondary, and higher education had undiagnosed hypertension rates that were 5% (PR = 0.95; 95% CI = 0.55-1.60), 32% (PR = 0.68; 95% CI = 0.33-1.36), and 65% (PR = 0.35; 95% CI = 0.10-0.89) lower, respectively, than patients with no education. Comparing patients from middle-class households to those from low-income families, it is 19% (PR = 1.19; 95% CI = 0.66 - 2.16) more likely that they have undetected hypertension. Likely to have undiagnosed hypertension is 7% more likely in responders with wealthy financial stability (PR = 1.07; 95% CI = 0.59 - 2.02).
3.3. Log-binomial regression model
Following the ACCAHA guidelines, we conducted a log-binomial regression analysis as our second model to see the prevalence of undiagnosed hypertension among the total 1769 participants of our study.
In accordance with ACCAHA standards, the log-binomial regression model revealed a strong association between undetected hypertension and the participants’ age and administrative division. Table 4 displays the outcomes of the log-binomial regression study with a 68% model accuracy.
Table 4 shows that respondents from the Sylhet division are 29% more likely than those from the Barisal division to have undiagnosed hypertension (PR = 1.29; 95% CI = 0.79 - 2.16). On the other hand, it also demonstrates that respondents from the divisions of Chattogram, Dhaka, Khulna, Rajshahi, Rangpur, and Mymensingh are less likely than those from the division of Barisal to have undiagnosed hypertension. Additionally, compared to patients from urban regions, those with hypertension who are from rural areas have a 2% (PR = 0.98; 95% CI = 0.71 - 1.36) lower likelihood of having undetected hypertension.
In contrast to older patients (age range of 55 to 64 years or more), the pattern of association between participant’s age and undiagnosed hypertension was more pronounced among young and adult age groups, most commonly those aged 25 to 34 (PR = 0.79; 95% CI = 0.44 - 2.27) and 35 to 44 (PR = 0.30; 95% CI = 0.18 - 0.84) years. Education levels at elementary, secondary, and higher levels were associated with decreased rates of undetected hypertension of 20% (PR = 0.80; 95% CI = 0.54-1.18), 13% (PR = 0.87; 95% CI = 0.55-1.34), and 22% (PR = 0.78; 95% CI = 0.39-1.48), respectively, than in patients with no education.
When taking into account the participants’ current employment status, working patients have a 6% (PR = 1.06; 95% CI = 0.78 - 1.48) higher risk of having undetected hypertension than those who are not now employed. Patients from middle-class families are more likely to have undiagnosed hypertension as compared to those from low-income families (PR = 0.94; 95% CI = 0.63 - 1.40). Wealthy patients are 21% less likely (PR = 0.79; 95% CI = 0.54 - 1.19) to have had their hypertension undetected as of the survey date.
Table 5 presents the log-binomial regression study’s findings, with an accuracy rate of 86%. According to Table 5, respondents from Sylhet and Rangpur divisions are 68% (PR = 1.89; 95% CI =0.86 - 3.39) and 89% (PR = 1.89; 95% CI = 1.03 - 3.74) more likely to have undiagnosed hypertension than respondents from Barisal division. However, research also shows that respondents from the divisions of Chattogram, Dhaka, Khulna, Rajshahi, and Mymensingh are noticeably less likely to have undetected hypertension than those from the division of Barisal.
Rural individuals with hypertension are more likely to have undiagnosed hypertension by 6% (PR = 1.06; 95% CI = 0.69 - 1.63) compared to patients, from metropolitan settings. Young and adult age groups, most frequently those aged 25 to 34 (PR = 0.90; 95% CI = 0.43 - 2.18) and 35 to 44 (PR = 0.65; 95% CI = 0.30 - 1.60) years, showed a more discernible pattern of association between participant’s age and undiagnosed hypertension than older patients (age range of 55 to 64 years or more). Primary, secondary, and higher education levels were linked to lower rates of undiagnosed hypertension by 4% (PR = 0.96; 95% CI = 0.60-1.51), 28% (PR = 0.72; 95% CI = 0.39- 1.31), and 58% (PR = 0.78; 95% CI = 0.39-1.48) relative to those with no education.
Working patients have a 16% (PR = 1.06; 95%CI = 0.78 - 1.48) increased probability of having undiagnosed hypertension compared to those who are not now employed after accounting for the participants’ current job status. Patients from middle-class families have a lower risk of having undetected hypertension than those from low-income families (PR = 1.19; 95% CI = 0.73 - 1.99). The likelihood that a patient’s hypertension was undiagnosed as of the survey date is 6% higher (PR = 1.06; 95% CI = 0.63 - 1.80) for wealthy patients.
3.4. Model prediction
The model performance is taken into account while comparing the models to find the best one. We discovered that the JNC7 guidelines for hypertension provide more accurate estimates for undiagnosed hypertension. The model accuracy of the logistic regression model is 86% (prediction error 14%) whereas the log-binomial has 87% (prediction error 13%). Even yet, when we included log-binomial sub-models in the comparison, the accuracy of the log-binomial regression model was slightly higher.
We get to the conclusion that the log-binomial regression model is the most appropriate one for our investigation.
4. Discussion
This study delved into the prevalence of undiagnosed hypertension and its associations with various health factors among Bangladeshi adults. Notably, undiagnosed hypertension exhibited significant correlations with specific age groups and administrative divisions, indicating the multifaceted nature of its determinants. Our findings align with existing literature, emphasizing the intricate relationship between undetected hypertension and diverse health indicators.
Analyzing model fit using AIC and BIC values, logistic regression emerged as the most suitable for our dataset, while log-binomial regression demonstrated superior performance when accounting for hypertension guidelines, particularly those outlined in JNC7. The emphasis on JNC7 guidelines in our analysis provided the most accurate outcomes (86%), suggesting the robustness of utilizing specific guidelines for prevalence measurement.
Uddin et al.’s [22] observations underscored that a substantial percentage of individuals with high blood pressure remained undiagnosed, possibly due to factors such as limited awareness, challenges in accessing screening services, and patients’ reluctance for routine checkups [20]. However, our study revealed a promising decrease in the prevalence rate to 16%, indicating a notable improvement in the healthcare system’s efficacy in addressing undetected hypertension.
Examining regional disparities, Rangpur and Sylhet demonstrated a higher likelihood of undiagnosed hypertension compared to Barisal. Interestingly, the lower prevalence (16%) in the Sylhet region could be linked to a reduced overall hypertension prevalence, warranting further exploration into the contextual factors contributing to undetected hypertension in this region [20,24].
Contrary to expectations, socio-economic factors such as educational attainment, employment status, and wealth did not exhibit substantial associations with undiagnosed hypertension in our study. This challenges previous assumptions and emphasizes the need for a nuanced understanding of the factors influencing undetected hypertension.
The study highlighted the disparity in healthcare facility distribution between urban and rural areas in Bangladesh [25]. While urban areas boast higher healthcare facility numbers, the deployment of these resources for timely hypertension detection remains a challenge. The potential reorientation of primary healthcare facilities, as suggested by the NCDs action plan [25], necessitates substantial training for primary-level healthcare providers.
Notably, Bangladesh’s efforts to address hypertension through guidelines emphasizing lifestyle changes and non-pharmaceutical treatments demonstrate a proactive approach [16]. However, the observed discrepancy in medication adherence, with over 80% of patients in our study receiving anti-hypertensive medication, raises questions about the overall effectiveness of treatment strategies and warrants further investigation [26].
In concluding our study, the comparison of prevalence ratio estimates between log-binomial and logistic regression models revealed minor differences in accuracy. However, the utilization of JNC7 guidelines emerged as crucial for accurate prevalence determination. The observed improvements in the health system and the reduced prevalence of undetected hypertension compared to earlier research signal positive strides. Nonetheless, the study underscores the need for more sophisticated statistical approaches in future research to unravel additional relevant factors in this context.
5. Conclusions
In summary, our study suggests a slight advantage in using the log-binomial model for prevalence ratio estimates, especially in prevalent scenarios with a simple model. Continued monitoring of hypertension prevalence and identification of undiagnosed cases at the community level is crucial. While Bangladesh’s existing guidelines for hypertension management in primary care settings are in place, there is potential for improvement.
Aligning these guidelines with the 2017 ACC/AHA recommendations is recommended to enhance effectiveness. Given the impracticality of mass screening, a targeted approach in areas with higher socioeconomic inequalities can optimize resources for more efficient hypertension control. This underscores the need for ongoing adaptation of guidelines and focused interventions to address the evolving landscape of hypertension in Bangladesh.
Importantly, as highlighted in Ahmed et al. (2023) [27], integrating shrinkage strategies by combining the sub-model and full model can significantly enhance prediction accuracy. This methodological approach aligns with the broader goal of refining hypertension management strategies, ensuring a comprehensive and effective framework for addressing the dynamic nature of this health challenge in Bangladesh.
Author Contributions
Conceptualization, T.S.; methodology, T.S.; formal analysis, T.S.; investigation, T.S. and S.E.A.; resources, T.S.; data curation, T.S.; writing—original draft preparation, T.S.; writing—review and editing, T.S. and S.E.A.; project administration, S.E.A; funding acquisition, S.E.A. All authors have read and agreed to the published version of the manuscript.
Funding
The research work was supported by the Natural Sciences and Engineering Research Council (NSERC) of Canada.
Institutional Review Board Statement
Not applicable
Informed Consent Statement
Not applicable
Data Availability Statement
Data can be found at the following link https://dhsprogram.com/data/dataset/Bangladesh_Standard-DHS_2017.cfm?flag=0
Conflicts of Interest
The authors declare no conflict of interest.
Abbreviations
The following abbreviations are used in this manuscript:
| HTN | Hypertension |
| WHO | World Health Organization |
| NCD | Noncommunicable Diseases |
| SBP | Systolic Blood Pressure |
| DBP | Diastolic Blood Pressure |
| SEAR | South-East Asian |
| BP | Blood Pressure |
| JNC7 | Seventh Report of the Joint National Committee |
| ACC/AHA | 2017 American College of Cardiology/American Heart Association |
| BDHS | Bangladesh Demographic and Health Survey |
| ML | Machine Learning |
| PR | Prevalence Ratio |
| EA | Enumeration Areas |
| PSU | Primary Sampling Unit |
| FPG | Fasting Plasma Glucose |
| NIPORT | National Institute of Population Research and Training |
| ICF | International Classification of Functioning, Disability, and Health |
| LMIC | Lower and Middle Income Country |
| CI | Confidence Interval |
| MLE | Maximum Likelihood Estimates |
| AIC | Akaike Information Criterion |
| BIC | Bayesian Information Criterion |
| IQR | Inter Quartile Range |
| RC | Reference Category |
Appendix A
For this study, we selected our variables based on AIC and BIC. The followings are the AIC and BIC values of the sub-models based on JNC7 guidelines. By removing one predictor variable at a time, we sub-modeled our reference model. and determined the AIC and BIC values of 6 different sub-models.

Table A1.
AIC and BIC values of Logistic Regression Submodels.
| Logit-submodels | AIC | BIC |
|---|---|---|
| Sub-model-1 | 665.4433 | 733.7399 |
| Sub-model-2 | 658.2487 | 760.6936 |
| Sub-model-3 | 658.2487 | 760.6936 |
| Sub-model-4 | 656.4109 | 744.2207 |
| Sub-model-5 | 656.7813 | 754.3478 |
| Sub-model-6 | 654.5958 | 747.2840 |
Table A2.
AIC and BIC values of Log-binomial Regression Submodels.
| Logbinom-submodels | AIC | BIC |
|---|---|---|
| Sub-model-1 | 665.7860 | 734.0826 |
| Sub-model-2 | 658.0569 | 760.5018 |
| Sub-model-3 | 658.0569 | 760.5018 |
| Sub-model-4 | 655.8622 | 743.6721 |
| Sub-model-5 | 656.5595 | 754.1260 |
| Sub-model-6 | 654.5413 | 747.2295 |
Table A1 and Table A2 above represent the AIC and BIC values of the logistic regression sub-models and log-binomial regression sub-models. Referring to our reference models’ AIC values from Table 3 we can see that our logistic sub-model-1 t(Table A1 has the higher AIC values in which we dropped our predictor variable "Division" while sub-modeling our full model. Other sub-models have lower AIC values than our full or reference logistic regression model. We found similar results when comparing with the log-binomial reference model Table 5 and the sub-models AIC value in Table A2.
When considering the BIC values in Table 3, likely all of our sub-models have lower to similar BIC values referred to our full logistic regression model in Table A1 and similar for the log-binomial model’s comparison.
In conclusion, we can say that our full model including all selected predictor variables is our best model for logistic regression in this study.
References
- D. Zhou, B. Xi, M. Zhao, L. Wang, and S. P. Veeranki,. Uncontrolled hypertension increases risk of all-cause and cardiovascular disease mortality in US adults: the NHANES III Linked Mortality Study. Scientific reports 2018, 8, 1–7.
- I. of Medicine (US) Committee on Preventing the Global Epidemic of Cardiovas- cular Disease: Meeting the Challenges in Developing Countries. Epidemiology of cardiovascular disease. Promoting cardiovascular health in the developing world: a critical challenge to achieve global health 2010, 49–105. [CrossRef]
- World Health Organization. Global status report on noncommunicable diseases 2014; World Health Organization: Geneva, Switzerland, 2014; 280 p. [Google Scholar]
- K. Mills, A. Stefanescu, and J. He. The global epidemiology of hypertension Katherine. Physiol Behav [Internet] 2016, 176, 139–48.
- B. M. Egan, Y. Zhao, and R. N. Axon. US trends in prevalence, awareness, treatment, and control of hypertension, 1988-2008. Journal of hypertension 2010, 303, 2043–2050. [CrossRef]
- F. Islam, A. Bhuiyan, R. Chakrabarti, M. A. Rahman, Y. Kanagasingam, and J. E. Hiller. Undiagnosed hypertension in a rural district in Bangladesh: The Bangladesh Population-based Diabetes and Eye Study (BPDES). Journal of human hypertension 2016, 30, 252–259.
- P. M. Kearney, M. Whelton, K. Reynolds, P. Muntner, P. K. Whelton, and J. He. Global burden of hypertension: analysis of worldwide data. The lancet 2005, 365, 217–223.
- WHO. World Health Day 2013: measure your blood pressure, reduce your risk. Available online: https://www.who.int/news/item/03-04-2013-world-health-day-2013-measure-your-blood-pressure-reduce-your-risk#: :text=World (accessed on 09 June 2021).
- S. S. Lim, T. Vos, A. D. Flaxman, G. Danaei, K. Shibuya, H. Adair-Rohani, M. A. AlMazroa, M. Amann, H. R. Anderson, K. G. Andrews et al. A comparative risk assessment of burden of disease and injury attributable to 67 risk factors and risk factor clusters in 21 regions, 1990–2010: a systematic analysis for the Global Burden of Disease Study 2010. The lancet 2012, 380, 2224–2260.
- B. Zhou, R. M. Carrillo-Larco, G. Danaei, L. M. Riley, C. J. Paciorek, G. A. Stevens, E. W. Gregg, J. E. Bennett, B. Solomon, R. K. Singleton et al. Worldwide trends in hypertension prevalence and progress in treatment and control from 1990 to 2019: a pooled analysis of 1201 population-representative studies with 104 million participants. The lancet 2021, 398, 957–980. [CrossRef]
- N. Dereje, A. Earsido, L. Temam, and A. Abebe. Uncovering the high burden of hypertension and its predictors among adult population in Hosanna town, southern Ethiopia: a community-based cross-sectional study. BMJ open 2020, 10, e035823. [CrossRef]
- S. R. Joshi, B. Saboo, M. Vadivale, S. I. Dani, A. Mithal, U. Kaul, M. Prevalence of diagnosed and undiagnosed diabetes and hypertension in India—results from the Screening India’s Twin Epidemic (SITE) study. Diabetes technology & therapeutics 2012, 14, 8–15. [CrossRef]
- J. Wang, L. Zhang, F. Wang, L. Liu, and H. Wang. Prevalence, awareness, treatment, and control of hypertension in China: results from a national survey. American journal of hypertension 2014, 27, 8–151355–1361.
- M. M. Hasan, F. Tasnim, M. Tariqujjaman, S. Ahmed, A. Cleary, and A. Mamun,. Examining the prevalence, correlates and inequalities of undiagnosed hypertension in Nepal: a population-based cross-sectional study. BMJ open 2020, 10, e037592.
- M. A. Khanam, W. Lindeboom, A. Razzaque, L. Niessen, W. Smith, and A. H. Milton. Undiagnosed and uncontrolled hypertension among the adults in rural Bangladesh: findings from a community-based study. Journal of hypertension 2015, 33, 2399–2406.
- National Institute of Population Research and Training - NIPORT/Bangladesh, Mitra and Associates/Bangladesh and ICF International, 2013. Bangladesh Demographic and Health Survey 2011. Dhaka, Bangladesh: NIPORT, Mitra and Associates, and ICF International. Available online: https://dhsprogram.com/publications/publication-fr265-dhs-final-reports.cfm (accessed on 09 June 2021).
- National Institute of Population Research and Training (NIPORT) & ICF Internationa. (Bangladesh Demographic and Health Survey 2017–2018 (2020)). Personal communication, 2020.
- G. M. Al Kibria, K. Swasey, K. Angela, M. Mirbolouk, M. N. Sakib, A. Sharmeen, M. J. Chadni, and K. A. Stafford. Estimated change in prevalence of hypertension in Nepal following application of the 2017 ACC/AHA guideline. JAMA network open. 2018, 1, e180606–e180606.
- M. Rahman, H. R. Halder, U. N. Yadav, S. K. Mistry et al. Eberhardt.Prevalence of and factors associated with hypertension according to JNC 7 and ACC/AHA 2017 guidelines in Bangladesh. The Journal of Wildlife Management 2021, 11, 1–10.
- S. Ahmed, M. Tariqujjaman, M. Rahman, M. Hasan et al.. Inequalities in the prevalence of undiagnosed hypertension among Bangladeshi adults: evidence from a nationwide survey. International journal for equity in health 2019, 18, 1–12. [CrossRef]
- Khan MS, Naznin S, Halder HR, Khan U, Hossain MM, Siddiquee T. Examining the prevalence of hypertension by urban–rural stratification: A Cross-sectional study of Nepal demographic and health survey. International journal for equity in health 2019, 18, 1–12.
- M. Uddin, N. Alam, and H. Sarma.Consequences of hypertension and chronic obstructive pulmonary disease, healthcare-seeking behaviors of patients, and responses of the health system: a population-based cross-sectional study in Banglades. BMC Public Health 2014, 14.
- P. Joshi, S. Islam, P. Pais, S. Reddy, P. Dorairaj, K. Kazmi, M. R. Pandey, S. Haque, S. Mendis, S. Rangarajan et al. Risk factors for early myocardial infarction in South Asians compared with individuals in other countries. Jama 2007, 297, 286–294.
- M. E. Hoque, M. R. Khokan, and W. Bari. Rangarajan et al..Impact of stature on non-communicable diseases: evidence based on Bangladesh Demographic and Health Survey, 2011 data. BMC Public Health 2014, 14, 1–8. [CrossRef]
- National Institute of Population Research and Training - NIPORT/Bangladesh, Mitra and Associates/Bangladesh and ICF International, 2015. Bangladesh Demographic and Health Survey 2014. Dhaka, Bangladesh: NIPORT, Mitra and Associates, and ICF International. Available online: https://dhsprogram.com/publications/publication-fr311-dhs-final-reports.cfm (accessed on 05 June 2022).
- L. B. Rawal, K. Kanda, T. Biswas, M. I. Tanim, P. Poudel, A. M. N. Renzaho, A. S. Abdullah, S. M. Shariful Islam, and S. M. Ahmed. Non-communicable disease (NCD) corners in public sector health facilities in Bangladesh: a qualitative study assessing challenges and opportunities for improving NCD services at the primary healthcare level. BMJ Open 2019, 9, e029562. [CrossRef]
- Ahmed, S.E., Ahmed, F., & Yüzbaşı, B. (2023). Post-Shrinkage Strategies in Statistical and Machine Learning for High Dimensional Data (1st ed.). Chapman and Hall/CRC. [CrossRef]
Table 1.
Distribution of respondents by background characteristics. SBP systolic blood pressure, DBP diastolic blood pressure, BP blood pressure, IQR interquartile range.
Table 1.
Distribution of respondents by background characteristics. SBP systolic blood pressure, DBP diastolic blood pressure, BP blood pressure, IQR interquartile range.
| Variables | Characteristics | Frequency(n) | Percent(%) |
|---|---|---|---|
| Systolic Blood Pressure | Median (IQR), (mmHg) | 142.0 (125.0 - 161.0) | |
| Diastolic Blood Pressure | Median (IQR), (mmHg) | 89.0 (81.0 – 97.0) | |
| Ever measured BP | No | 496 | 26.50 |
| Taking anti-hypertensive medication for BP | No | 346 | 19.61 |
| Yes | 1423 | 80.44 | |
| Diagnosed with BP | No | 413 | 23.34 |
| Yes | 1356 | 76.66 | |
| Administrative Division | Barisal | 230 | 13.01 |
| Chattogram | 253 | 14.32 | |
| Dhaka | 226 | 12.77 | |
| Khulna | 267 | 15.09 | |
| Mymensingh | 172 | 9.72 | |
| Rajshahi | 208 | 11.75 | |
| Rangpur | 191 | 10.80 | |
| Sylhet | 222 | 12.55 | |
| Place of Residence | Urban | 734 | 41.49 |
| Rural | 1035 | 58.51 | |
| Age of the Participants | Median (IQR) | 49.0(38.0-60.0) | |
| 18–24 | 59 | 4.84 | |
| 25–34 | 166 | 13.57 | |
| 35–44 | 245 | 20.03 | |
| 45–54 | 261 | 21.34 | |
| 55–64 | 261 | 22.32 | |
| ≥ 65 | 273 | 17.90 | |
| Education Level | No Education | 567 | 32.05 |
| Primary | 542 | 30.64 | |
| Secondary | 432 | 24.42 | |
| Higher | 228 | 12.89 | |
| Occupational Status | Not Working | 929 | 52.63 |
| Working | 836 | 47.36 | |
| Wealth Status | Poor | 479 | 27.10 |
| Middle Class | 334 | 18.86 | |
| Rich | 956 | 54.04 |
Table 2.
Risk factors associated with undiagnosed hypertension among Bangladeshi adults (logistic regression analysis (ACC/AHA))
Table 2.
Risk factors associated with undiagnosed hypertension among Bangladeshi adults (logistic regression analysis (ACC/AHA))
| Explanatory variables | BDHS 2017-2018 | |||
|---|---|---|---|---|
| ACCAHA2017 | ||||
| PR | (95% CI) | p-value | ||
| Lower CI | Upper CI | |||
| Administrative divisions | ||||
| Barisal (RC) | 1 | |||
| Chattogram | 0.38 | 0.17 | 0.83 | 0.0169 |
| Dhaka | 0.49 | 0.22 | 1.03 | 0.0643 |
| Khulna | 0.93 | 0.48 | 1.77 | 0.8225 |
| Rajshahi | 0.57 | 0.25 | 1.21 | 0.1519 |
| Rangpur | 0.93 | 0.46 | 1.86 | 0.8424 |
| Sylhet | 1.40 | 0.71 | 2.77 | 0.3221 |
| Mymensingh | 0.39 | 0.18 | 0.85 | 0.0197 |
| Place of residence | ||||
| Urban (RC) | 1 | |||
| Rural | 0.97 | 0.64 | 1.46 | 0.8796 |
| Age of the participants (years) | ||||
| 18-24 (RC) | 1 | |||
| 25-34 | 0.87 | 0.39 | 1.93 | 0.6914 |
| 35-44 | 0.32 | 0.14 | 0.75 | 0.0074 |
| 45-54 | 0.23 | 0.09 | 0.55 | 0.0007 |
| 55-64 | 0.18 | 0.07 | 0.45 | <0.0001 |
| ≥ 65 | 0.20 | 0.08 | 0.51 | <0.0001 |
| Education Level | ||||
| No education (RC) | 1 | |||
| Primary | 0.72 | 0.44 | 1.17 | 0.1923 |
| Secondary | 0.75 | 0.40 | 1.38 | 0.3548 |
| Higher | 0.57 | 0.23 | 1.31 | 0.1948 |
| Occupational Status | ||||
| Not Working (RC) | 1 | |||
| Working | 1.18 | 0.79 | 1.80 | 0.4134 |
| Wealth Status | ||||
| Middle Class (RC) | 1 | |||
| Poor | 1.08 | 0.55 | 1.55 | 0.7688 |
| Rich | 0.74 | 0.44 | 1.25 | 0.2499 |
| AIC | 801.05 | |||
| BIC | 903.50 | |||
| Model Accuracy | 0.6694 | |||
Table 3.
Risk factors associated with undiagnosed hypertension among Bangladeshi adults (logistic regression analysis (JNC7))
Table 3.
Risk factors associated with undiagnosed hypertension among Bangladeshi adults (logistic regression analysis (JNC7))
| Explanatory variables | BDHS 2017-2018 | |||
|---|---|---|---|---|
| JNC7 | ||||
| PR | (95% CI) | p-value | ||
| Lower CI | Upper CI | |||
| Administrative divisions | ||||
| Barisal (RC) | 1 | |||
| Chttogram | 0.62 | 0.24 | 1.54 | 0.3058 |
| Dhaka | 0.74 | 0.29 | 1.80 | 0.5063 |
| Khulna | 0.88 | 0.39 | 1.99 | 0.7630 |
| Rajshahi | 0.84 | 0.33 | 2.03 | 0.6850 |
| Rangpur | 2.09 | 1.01 | 4.53 | 0.0526 |
| Sylhet | 1.86 | 0.84 | 4.18 | 0.1318 |
| Mymensingh | 0.39 | 0.13 | 1.04 | 0.0700 |
| Place of residence | ||||
| Urban (RC) | 1 | |||
| Rural | 1.09 | 0.68 | 1.80 | 0.7024 |
| Age of the participants (years) | ||||
| 18-24 (RC) | 1 | |||
| 25-34 | 0.79 | 0.34 | 2.18 | 0.625 |
| 35-44 | 0.53 | 0.19 | 1.49 | 0.2034 |
| 45-54 | 0.41 | 0.15 | 1.21 | 0.0889 |
| 55-64 | 0.30 | 0.10 | 0.89 | 0.0248 |
| ≥ 65 | 0.44 | 0.15 | 1.34 | 0.1336 |
| Education Level | ||||
| No education (RC) | 1 | |||
| Primary | 0.95 | 0.55 | 1.60 | 0.8335 |
| Secondary | 0.68 | 0.33 | 1.36 | 0.2803 |
| Higher | 0.35 | 0.10 | 1.02 | 0.0693 |
| Occupational Status | ||||
| Not Working (RC) | 1 | |||
| Working | 1.19 | 0.73 | 1.93 | 0.4649 |
| Wealth Status | ||||
| Middle Class (RC) | 1 | |||
| Poor | 1.19 | 0.66 | 2.16 | 0.5610 |
| Rich | 1.07 | 0.59 | 2.02 | 0.8160 |
| AIC | 658.25 | |||
| BIC | 760.69 | |||
| Model Accuracy | 0.8636 | |||
Table 4.
Risk factors associated with undiagnosed hypertension among Bangladeshi adults (log-binomial regression analysis (ACC/AHA))
Table 4.
Risk factors associated with undiagnosed hypertension among Bangladeshi adults (log-binomial regression analysis (ACC/AHA))
| Explanatory variables | BDHS 2017-2018 | |||
|---|---|---|---|---|
| ACCAHA2017 | ||||
| PR | (95% CI) | p-value | ||
| Lower CI | Upper CI | |||
| Administrative divisions | ||||
| Barisal (RC) | 1 | |||
| Chattogram | 0.45 | 0.23 | 2.08 | 0.0156 |
| Dhaka | 0.55 | 0.29 | 0.85 | 0.0587 |
| Khulna | 0.95 | 0.58 | 1.57 | 0.8260 |
| Rajshahi | 0.65 | 0.33 | 1.19 | 0.1832 |
| Rangpur | 0.93 | 0.54 | 1.58 | 0.7840 |
| Sylhet | 1.29 | 0.79 | 2.16 | 0.2981 |
| Mymensingh | 0.45 | 0.23 | 0.86 | 0.0174 |
| Place of residence | ||||
| Urban (RC) | 1 | |||
| Rural | 0.98 | 0.71 | 1.36 | 0.9143 |
| Age of the participants (years) | ||||
| 18-24 (RC) | 1 | |||
| 25-34 | 0.79 | 0.44 | 2.27 | 0.7113 |
| 35-44 | 0.30 | 0.18 | 0.84 | 0.0069 |
| 45-54 | 0.23 | 0.07 | 0.69 | 0.0007 |
| 55-64 | 0.16 | 0.05 | 0.59 | 0.0002 |
| ≥ 65 | 0.16 | 0.08 | 0.64 | 0.0009 |
| Education Level | ||||
| No education (RC) | 1 | |||
| Primary | 0.80 | 0.54 | 1.18 | 0.2642 |
| Secondary | 0.87 | 0.55 | 1.34 | 0.5564 |
| Higher | 0.78 | 0.39 | 1.48 | 0.4462 |
| Occupational Status | ||||
| Not Working (RC) | 1 | |||
| Working | 1.06 | 0.78 | 1.48 | 0.6811 |
| Wealth Status | ||||
| Middle Class (RC) | 1 | |||
| Poor | 0.94 | 0.63 | 1.40 | 0.7526 |
| Rich | 0.79 | 0.54 | 1.19 | 0.2564 |
| AIC | 804.38 | |||
| BIC | 887.31 | |||
| Model Accuracy | 0.677686 | |||
Table 5.
Risk factors associated with undiagnosed hypertension among Bangladeshi adults (log-binomial regression analysis (JNC7))
Table 5.
Risk factors associated with undiagnosed hypertension among Bangladeshi adults (log-binomial regression analysis (JNC7))
| Explanatory variables | BDHS 2017-2018 | |||
|---|---|---|---|---|
| JNC7 | ||||
| PR | (95% CI) | p-value | ||
| Lower CI | Upper CI | |||
| Administrative divisions | ||||
| Barisal (RC) | 1 | |||
| Chattogram | 0.66 | 0.28 | 1.51 | 0.3286 |
| Dhaka | 0.77 | 0.33 | 1.72 | 0.5208 |
| Khulna | 0.91 | 0.44 | 1.89 | 0.7982 |
| Rajshahi | 0.85 | 0.36 | 1.88 | 0.6903 |
| Rangpur | 1.89 | 1.03 | 3.74 | 0.0444 |
| Sylhet | 1.68 | 0.86 | 3.39 | 0.1353 |
| Mymensingh | 0.42 | 0.15 | 1.04 | 0.0746 |
| Place of residence | ||||
| Urban (RC) | 1 | |||
| Rural | 1.06 | 0.69 | 1.63 | 0.7790 |
| Age of the participants (years) | ||||
| 18-24 (RC) | 1 | |||
| 25-34 | 0.90 | 0.43 | 2.18 | 0.8108 |
| 35-44 | 0.65 | 0.30 | 1.60 | 0.3230 |
| 45-54 | 0.52 | 0.24 | 1.28 | 0.1372 |
| 55-64 | 0.38 | 0.17 | 0.99 | 0.0412 |
| ≥ 65 | 0.54 | 0.23 | 1.42 | 0.1959 |
| Education Level | ||||
| No education (RC) | 1 | |||
| Primary | 0.96 | 0.60 | 1.51 | 0.8536 |
| Secondary | 0.72 | 0.39 | 1.31 | 0.2900 |
| Higher | 0.42 | 0.14 | 1.06 | 0.0878 |
| Occupational Status | ||||
| Not Working (RC) | 1 | |||
| Working | 1.16 | 0.77 | 1.75 | 0.4771 |
| Wealth Status | ||||
| Middle Class (RC) | 1 | |||
| Poor | 1.19 | 0.73 | 1.99 | 0.4952 |
| Rich | 1.06 | 0.63 | 1.80 | 0.8231 |
| AIC | 658.06 | |||
| BIC | 760.50 | |||
| Model Accuracy | 0.8686 | |||
Disclaimer/Publisher’s Note: The statements, opinions and data contained in all publications are solely those of the individual author(s) and contributor(s) and not of MDPI and/or the editor(s). MDPI and/or the editor(s) disclaim responsibility for any injury to people or property resulting from any ideas, methods, instructions or products referred to in the content. |
© 2023 by the authors. Licensee MDPI, Basel, Switzerland. This article is an open access article distributed under the terms and conditions of the Creative Commons Attribution (CC BY) license (http://creativecommons.org/licenses/by/4.0/).
Copyright: This open access article is published under a Creative Commons CC BY 4.0 license, which permit the free download, distribution, and reuse, provided that the author and preprint are cited in any reuse.


