Submitted:
15 December 2023
Posted:
15 December 2023
You are already at the latest version
Abstract
Keywords:
1. INTRODUCTION
1.1. Challenges
1.2. Scope of the article
1.3. Contributions
2. LITERATURE SURVEY / Organization
- Study of different clustering algorithms with clustering criteria.
- Study of different parallel clustering platforms.
- Use of clustering platforms and clustering algorithms with clustering criteria for clustering.
3. Study of different clustering algorithms with clustering criteria
Clustering Types:
Different Clustering Algorithms with Clustering Criteria
4. Overview of different Parallel clustering platforms
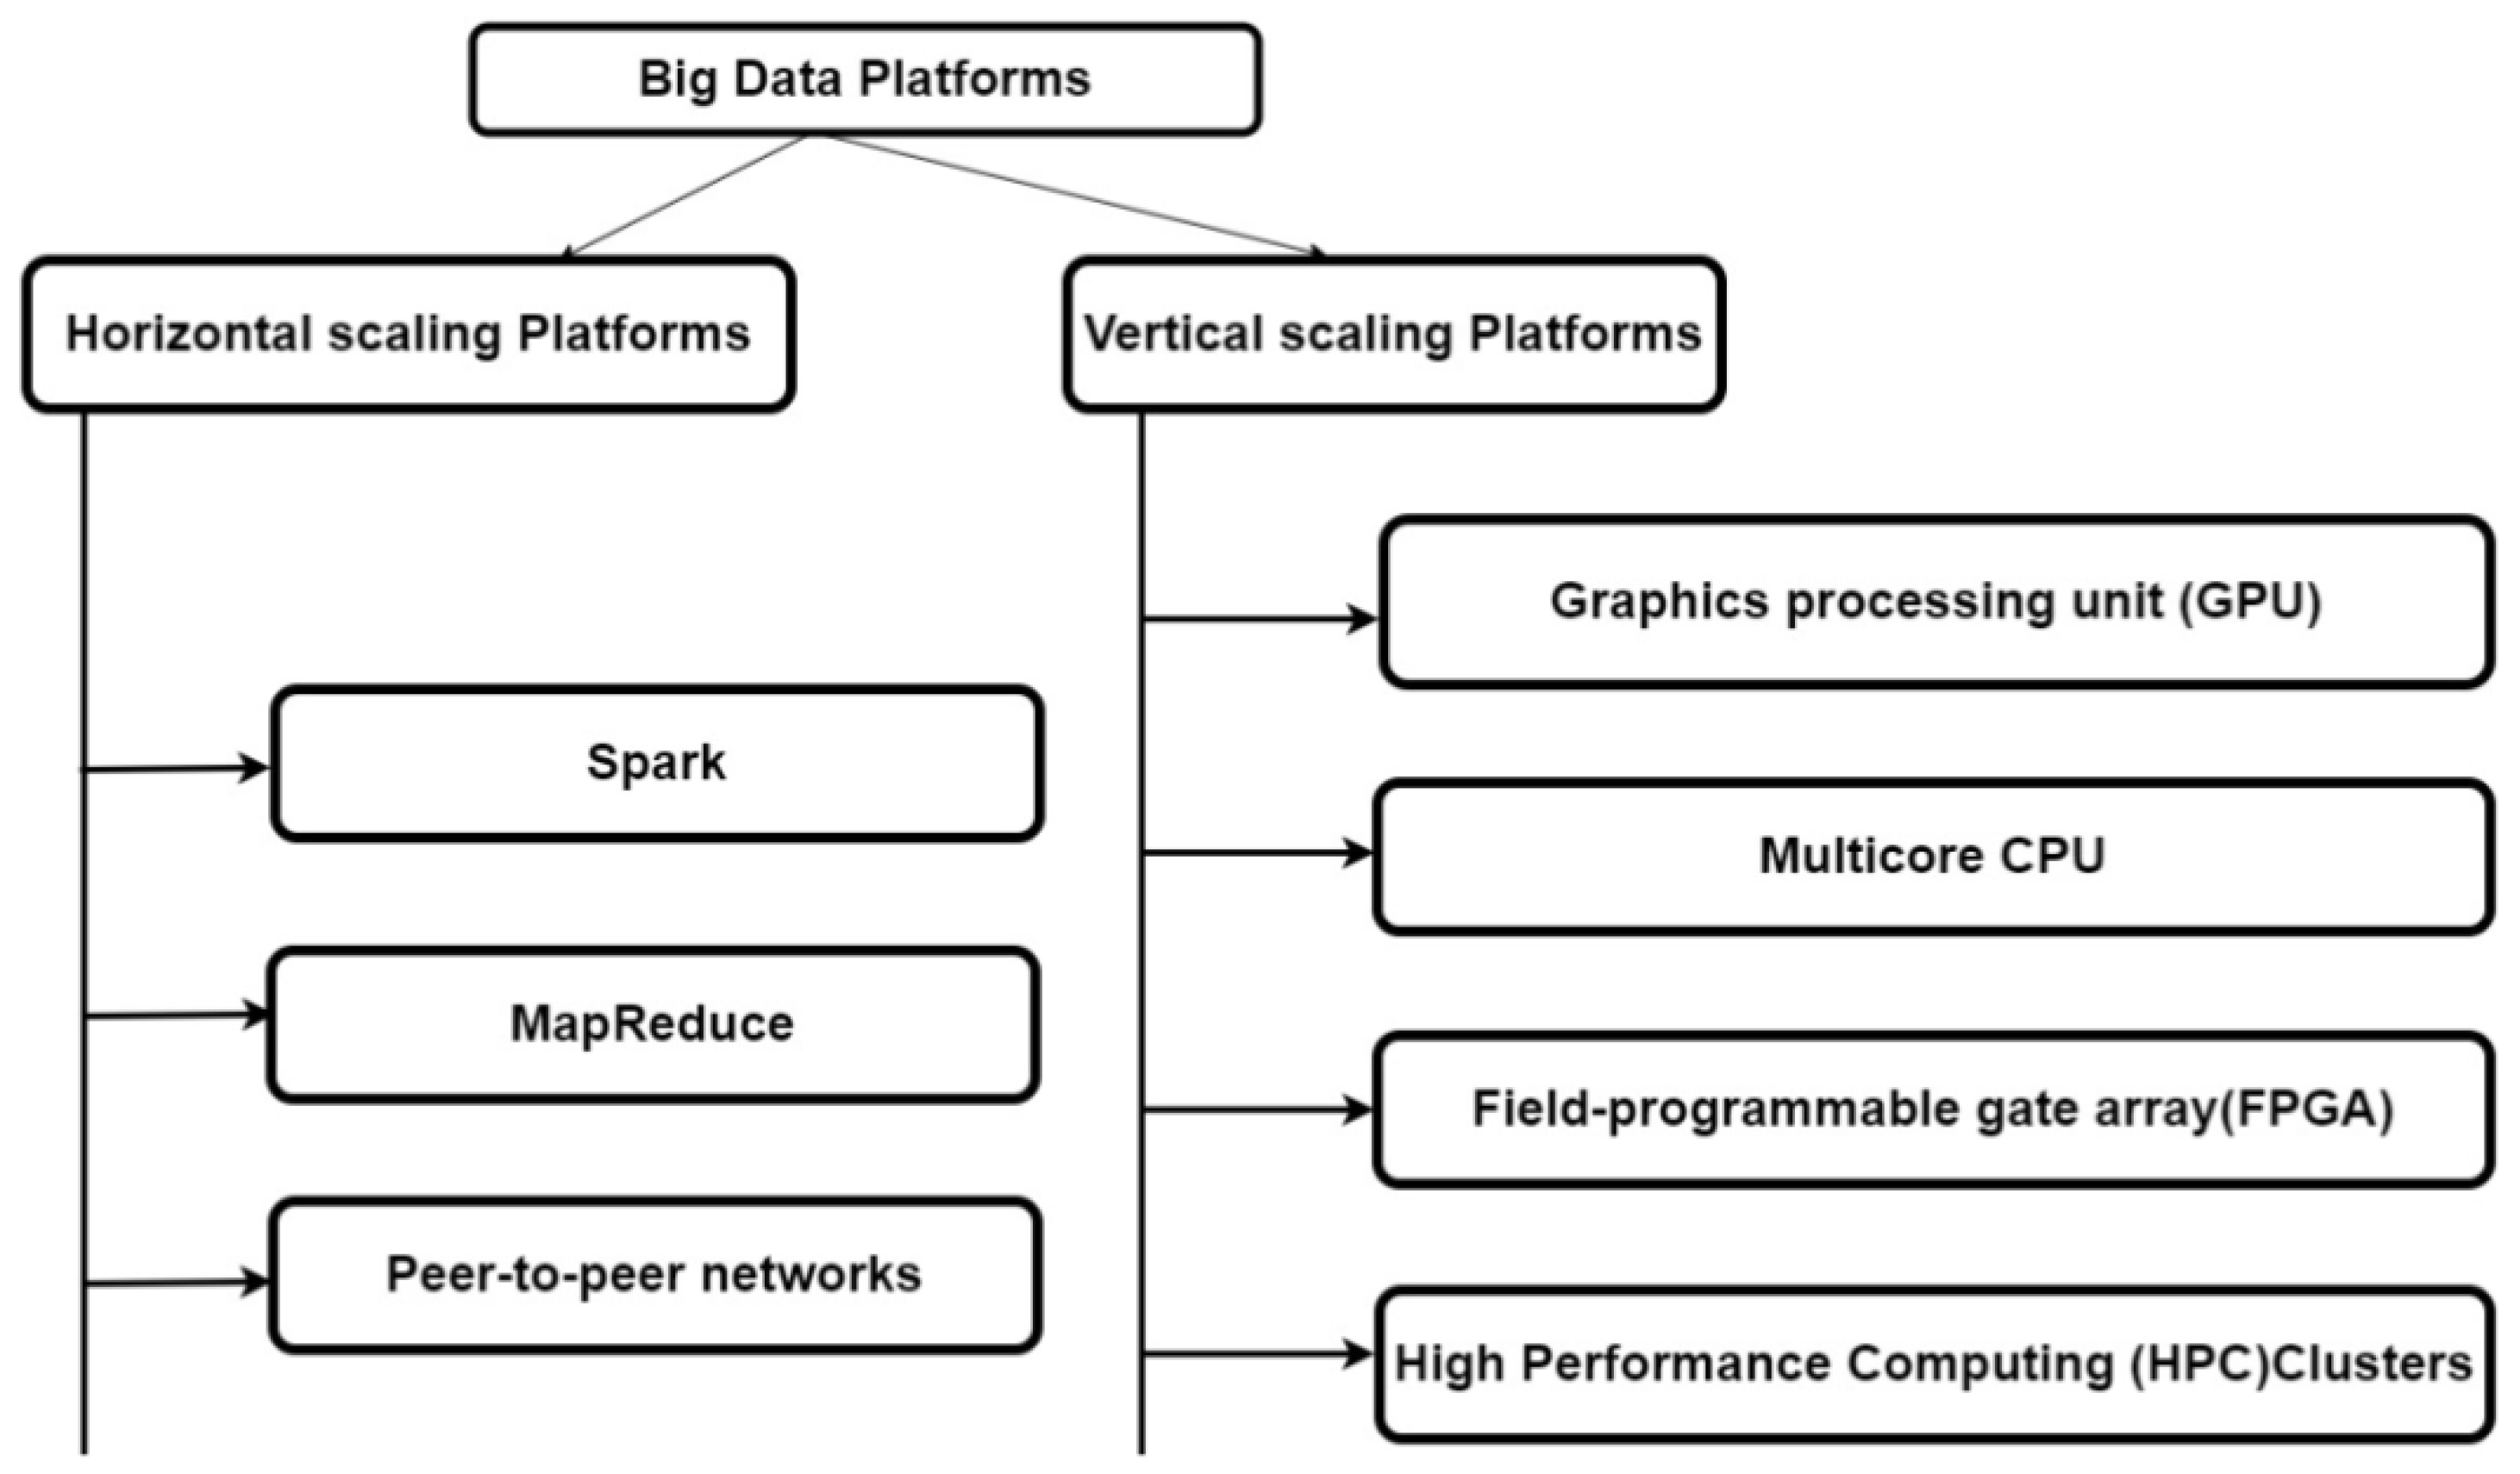
Parallel clustering platform: Horizontal scaling platforms
4.1. MapReduce
MapReduce program Phases
MapReduce Work Organization in Hadoop
Execution Process of MapReduce Programs
4.2. Spark Apache
Spark Apache Execution Modes
Cluster Manager Types
4.3. P2P networks
Parallel clustering platform: Vertical scaling platforms
4.4. Graphics processing unit (GPU)
5.5. Multi-core CPU
6.6. Field programmable gate arrays (FPGA)
4. Clustering Dependence on parallel clustering platform, clustering Algorithms and clustering Criteria
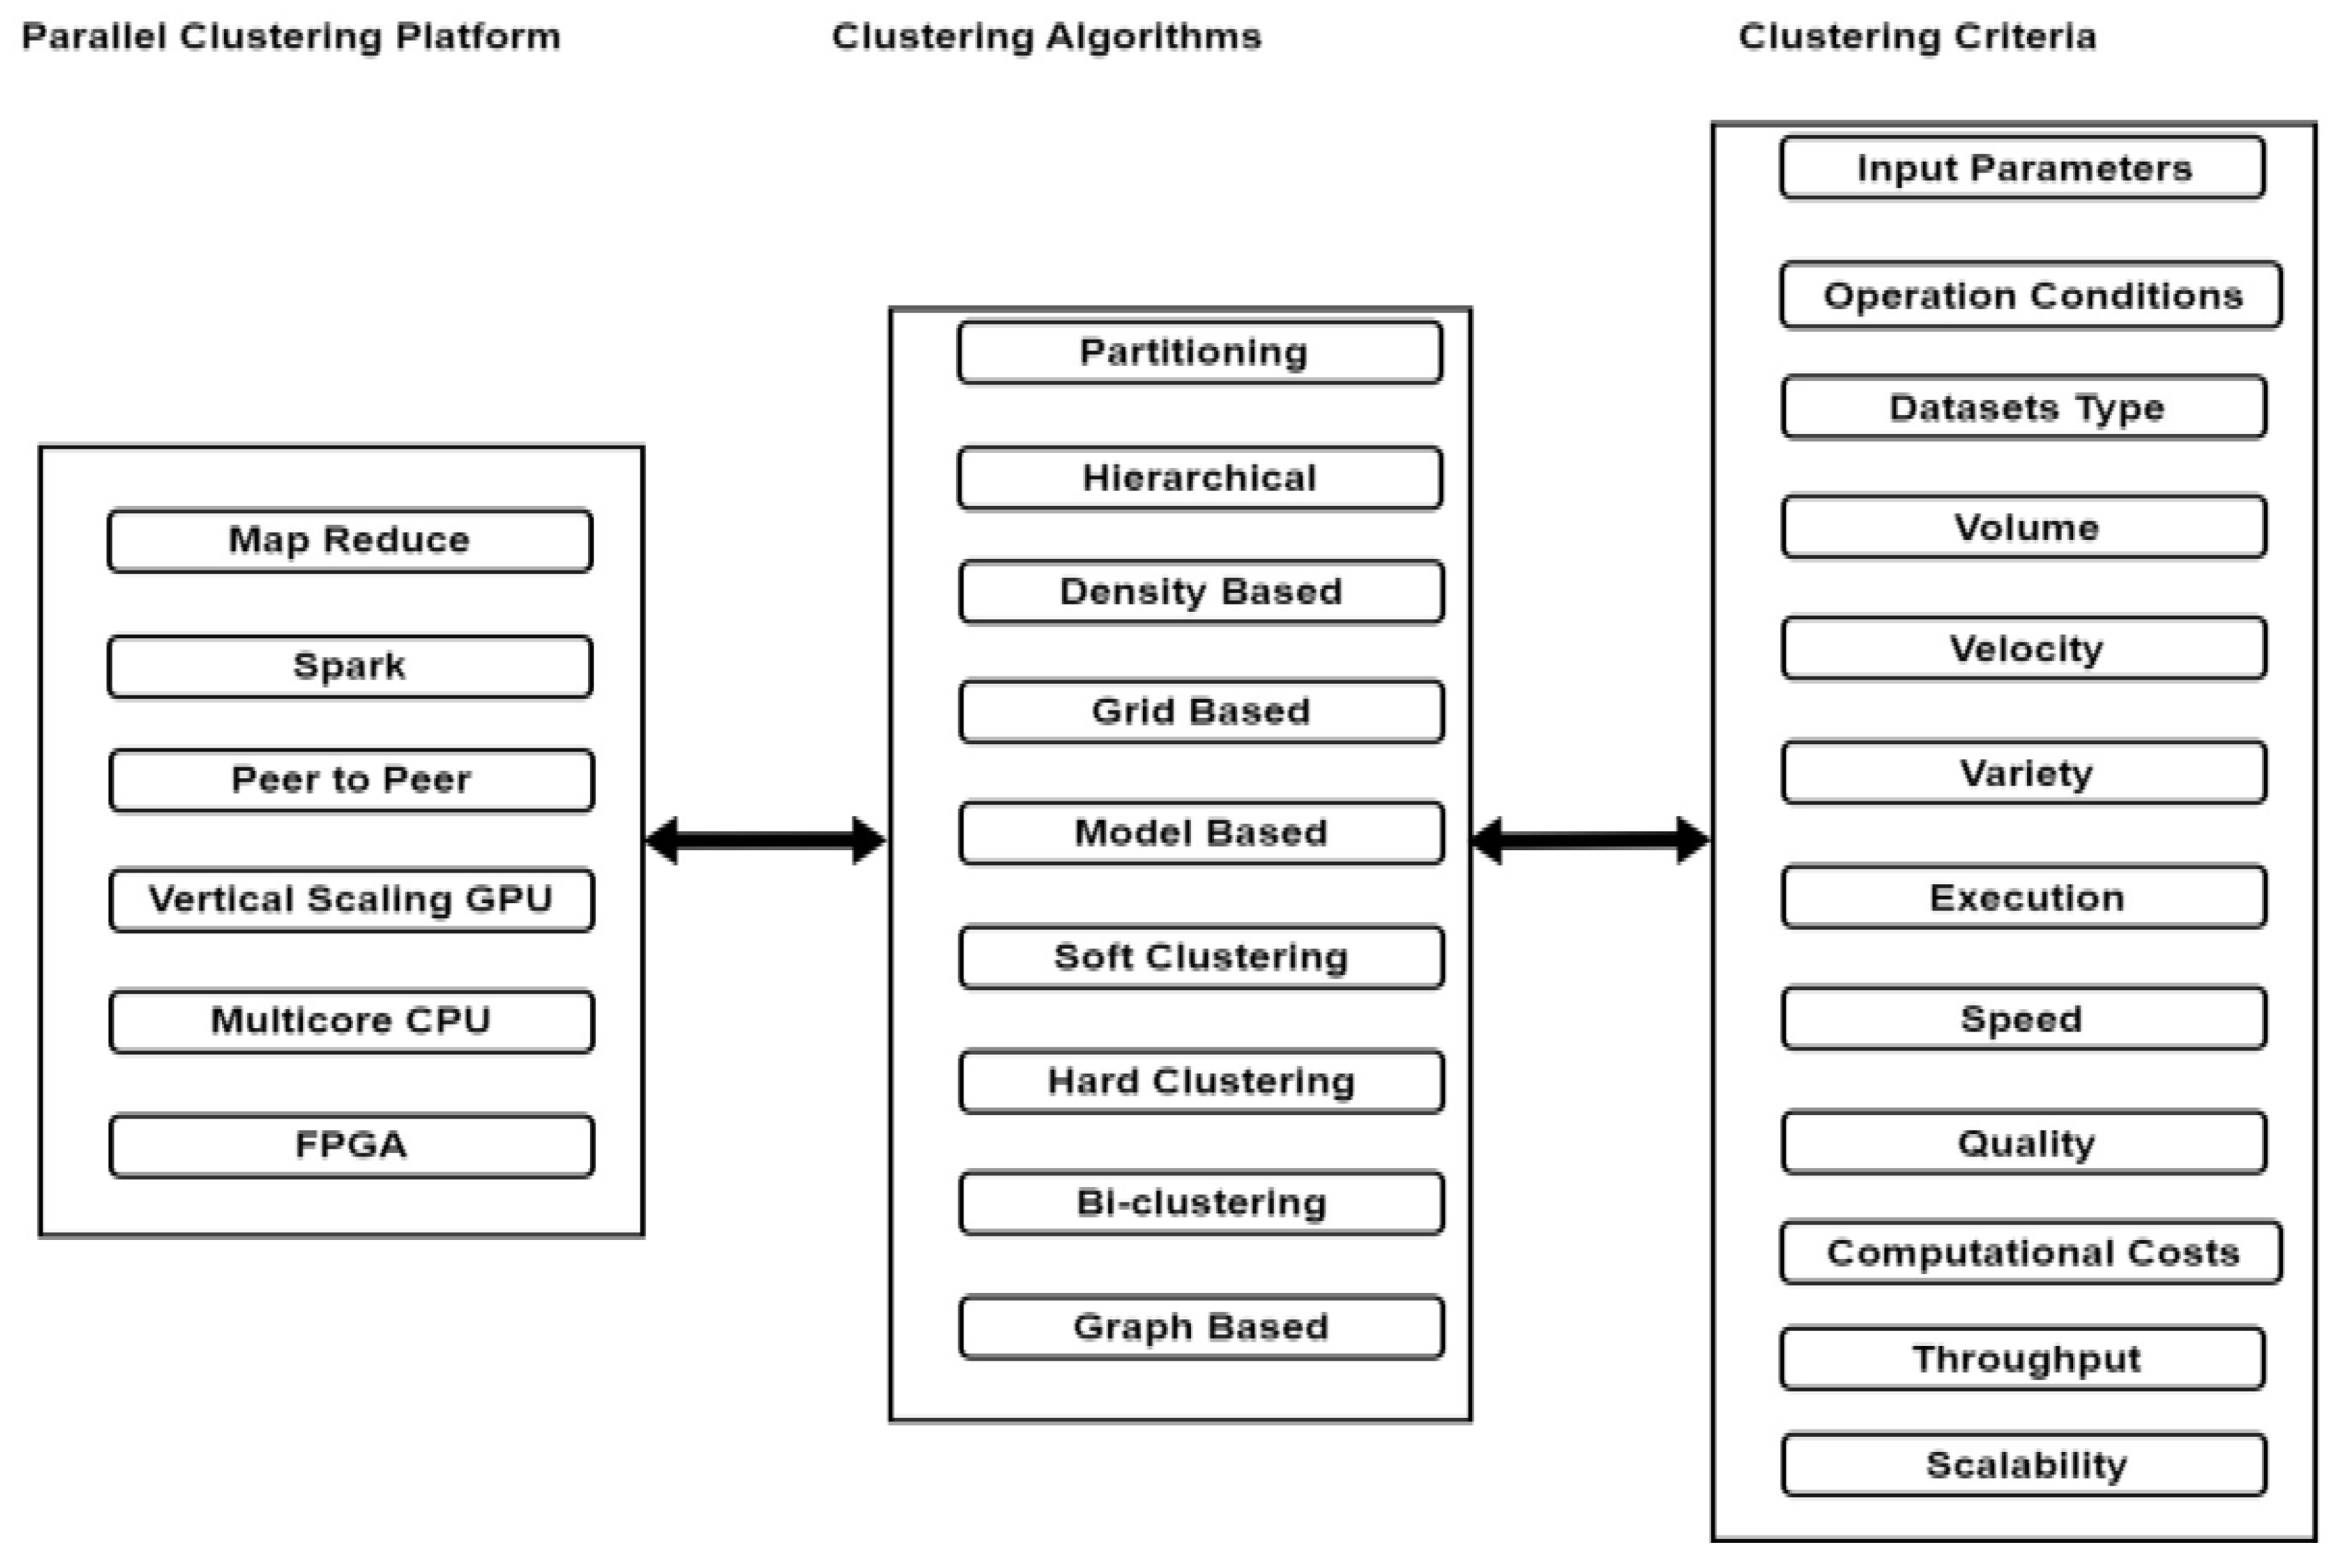
Note:
- Every algorithm uses its own data type to get optimal clusters or results [49].
- Based on patterns, clusters, iterations and Levels Generated, clustering algorithm time and space Complexity of the clustering algorithm will varies [50].
- Clustering method performance based on Data source, Data source size, shape of clusters shape, objective function, and similarity measurement functions [51].
- Clustering methods use different data types like Numerical, categorical, Textual data, Multimedia, Network, Uncertain, Time Series, Discrete data e.t.c [52].
- Similarity functions are used for identify inter and intra clusters similarities in between the clusters. Examples of distance functions are Euclidean Distance Function, Manhattan Distance Function, Chebyshev Distance Function, Davies Bould in Index e.t.c. Distance Function can affect the Performance of the clustering Algorithms [53].
- Clustering algorithm is one of the steps in Knowledge Discovery in Databases (KDD) process [54].
- In the clustering process Uniqueness may or may not be present in the Inter and Intra clustering process [55].
- In any Clustering Algorithm used to differentiate between one cluster group with other cluster group [56].
- Each and every Clustering method will have its own advantages and disadvantages based on the constraints, metrics used in the clustering algorithm [57].
- Each clustering algorithm will have its own sub methods [58].
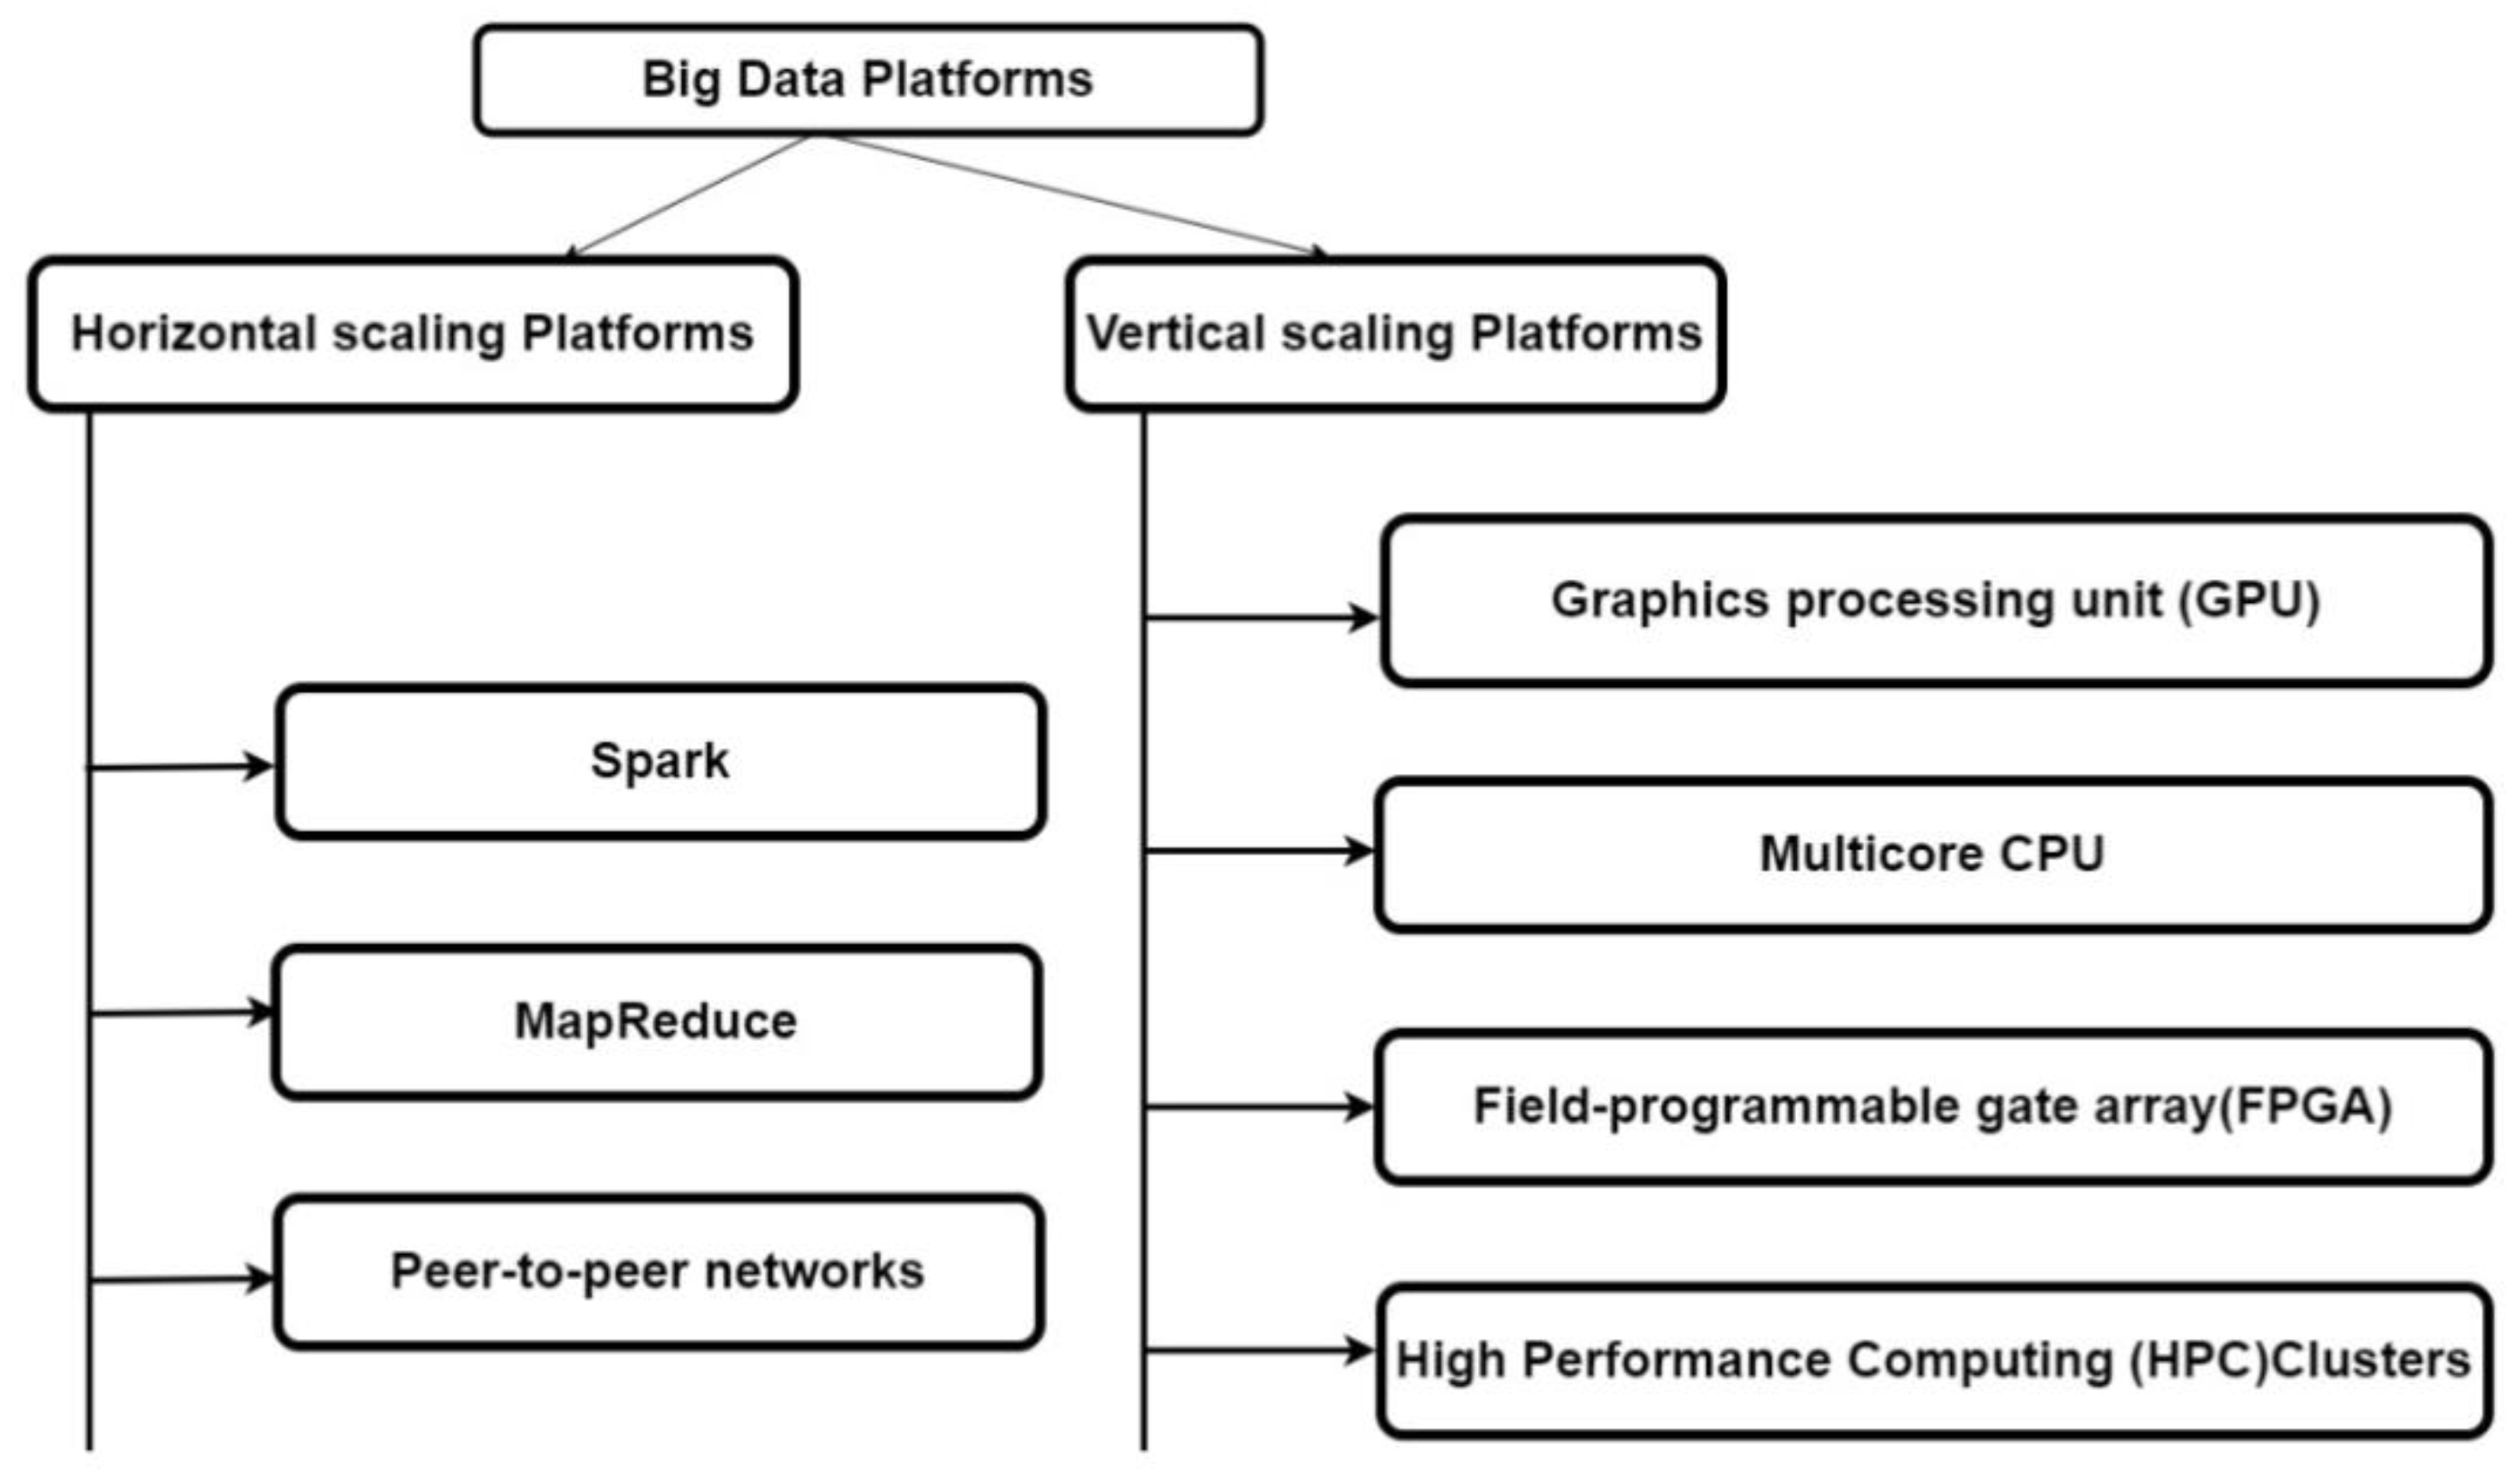
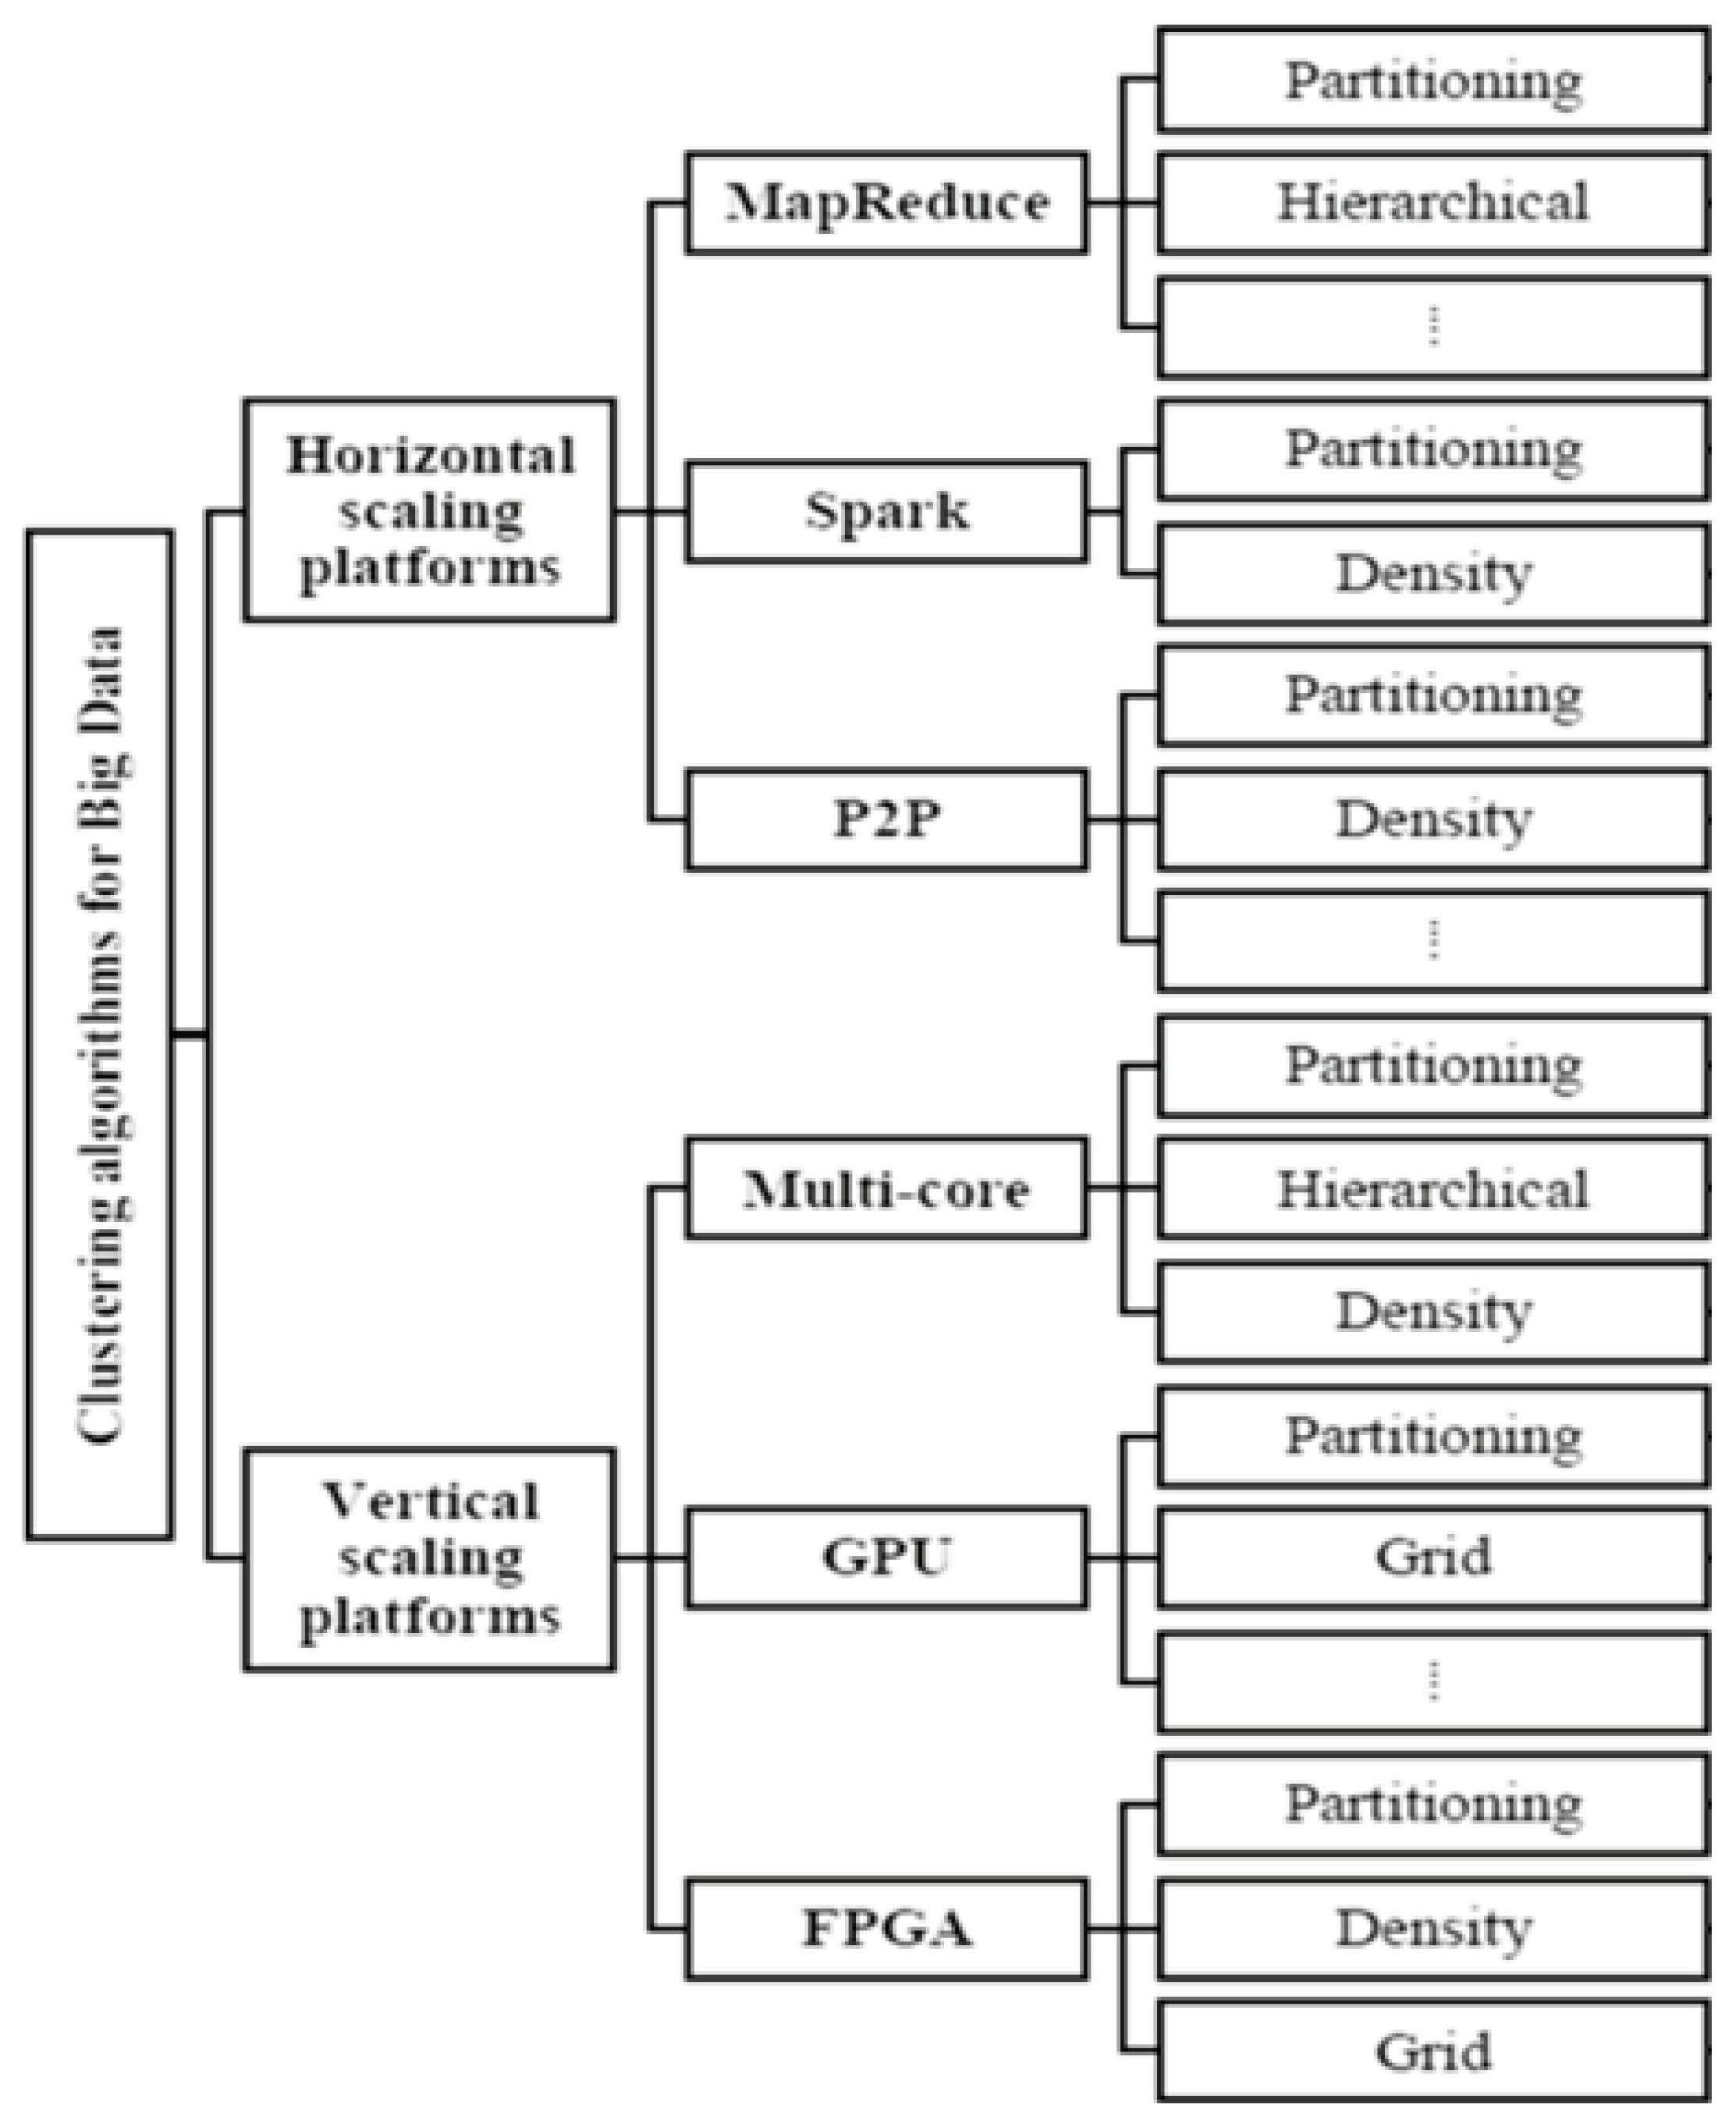
- Parallel clustering platform is used to run the clustering algorithms in parallel [59].
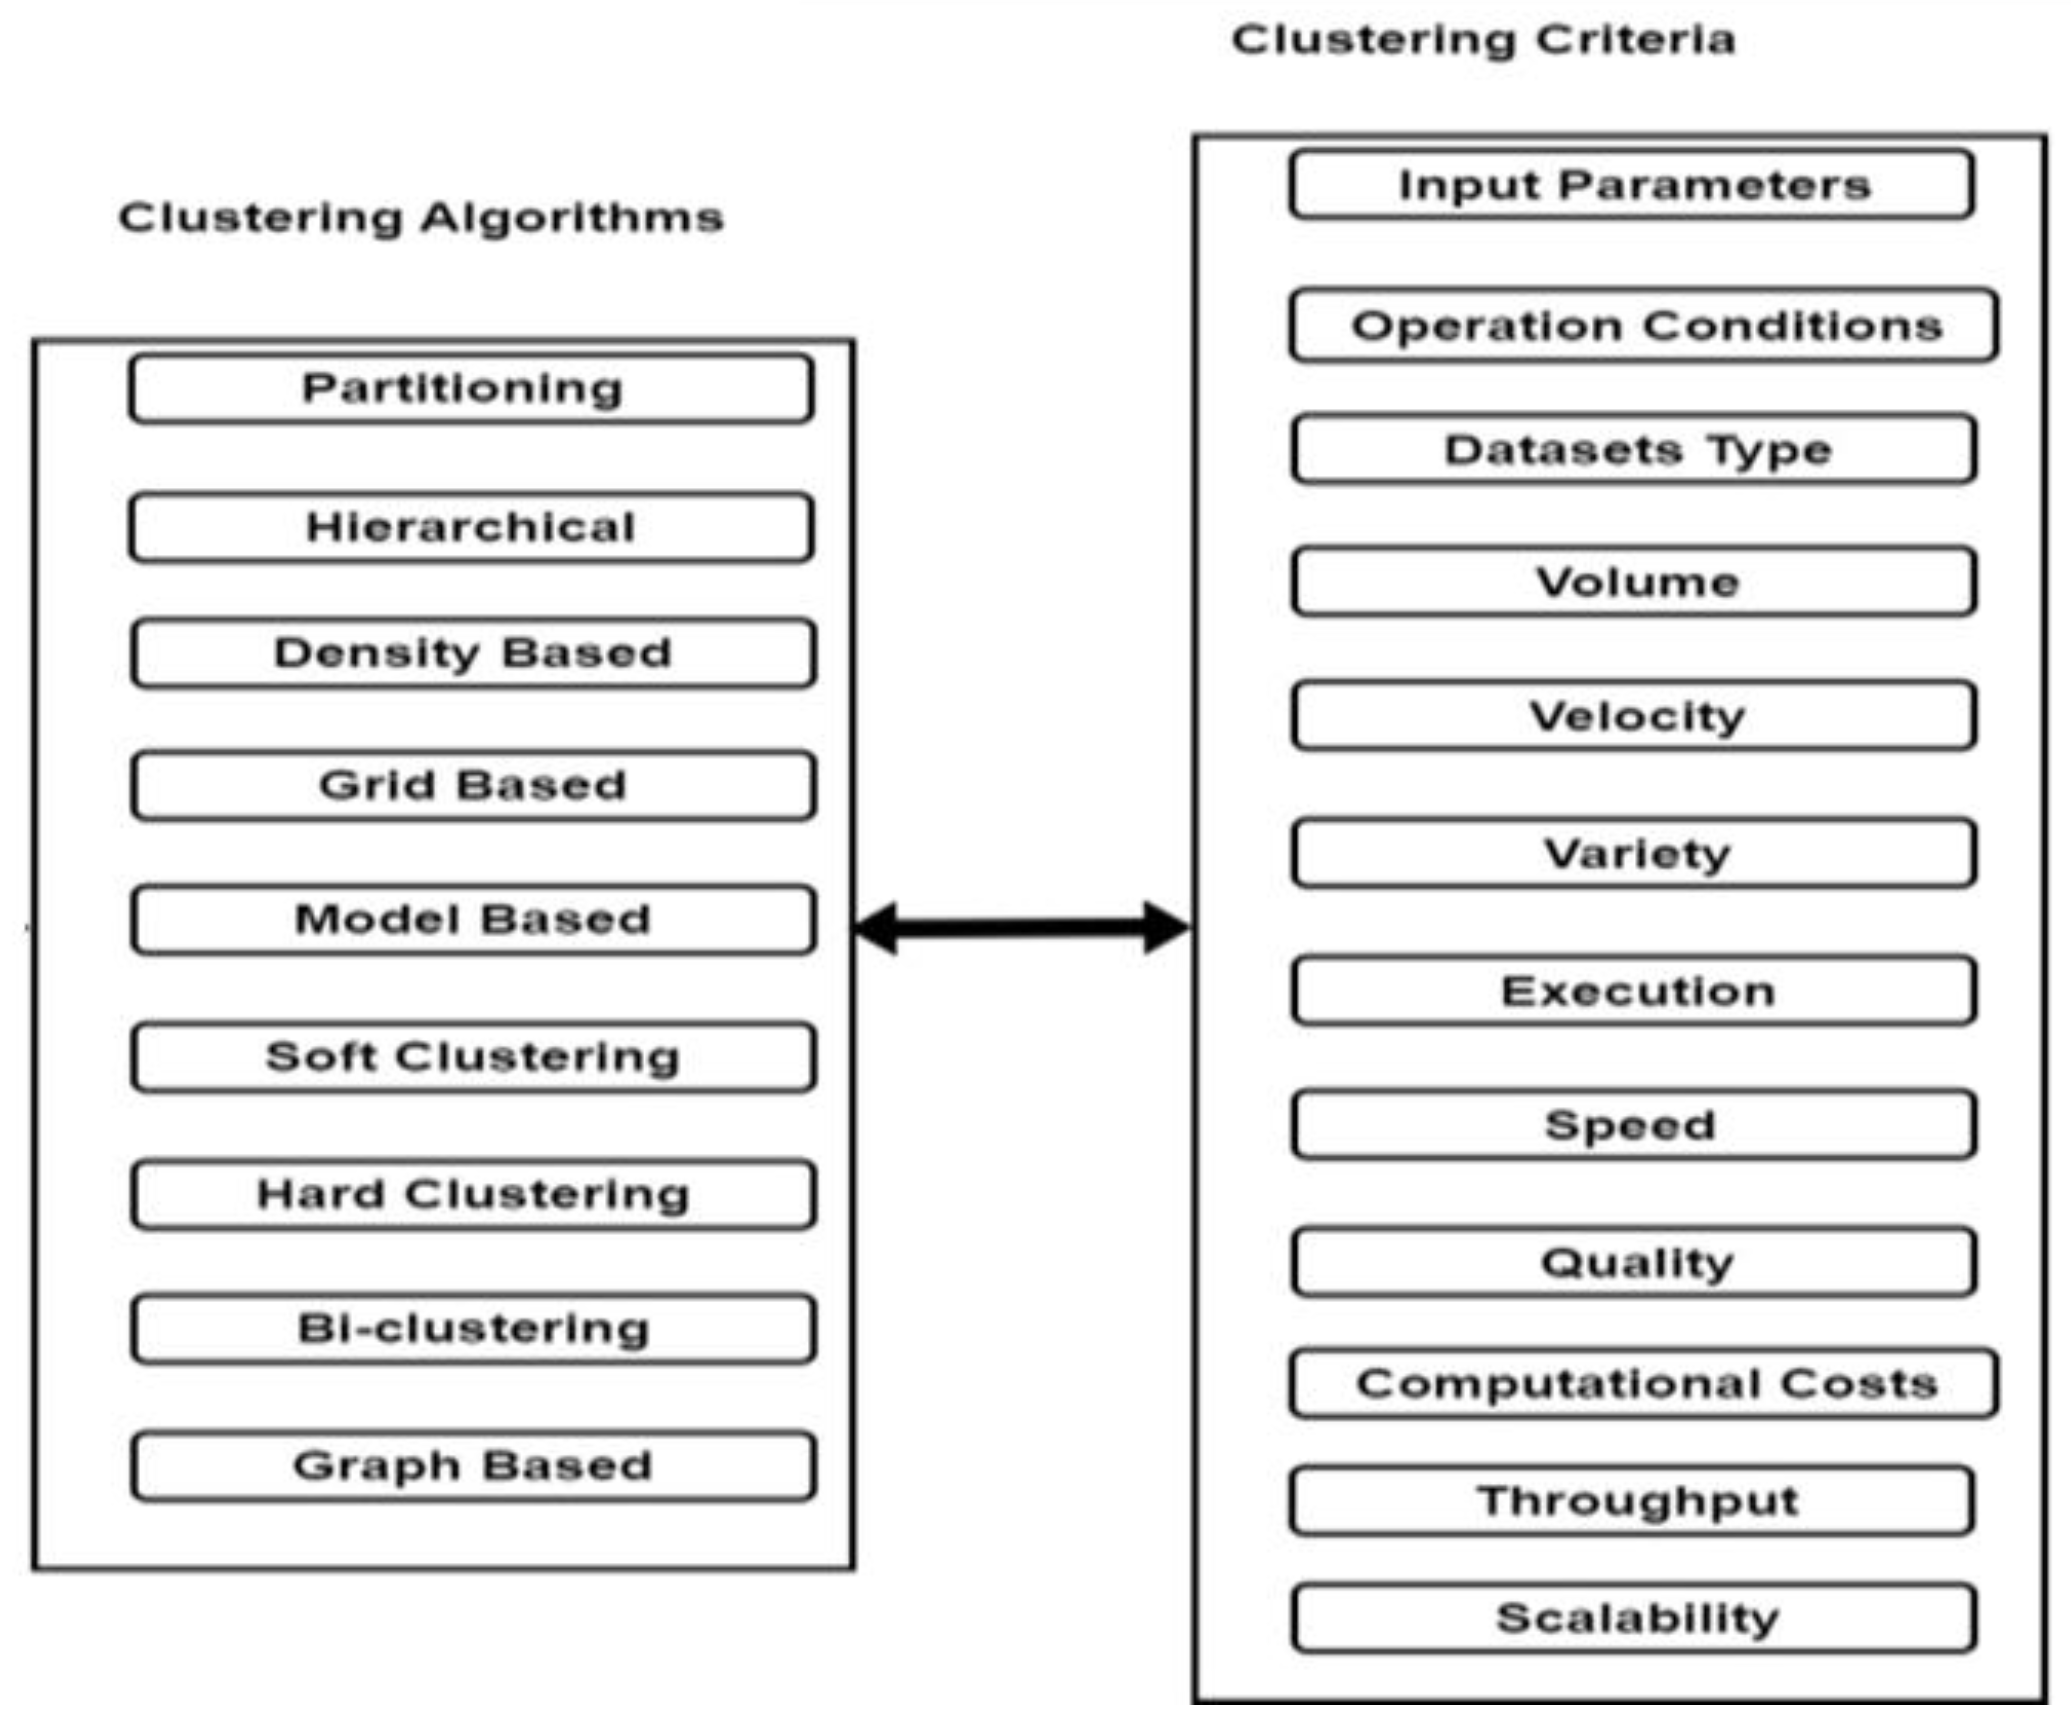
- Parallel clustering platform depends on clustering algorithm and clustering algorithm depends on clustering criteria [60].
5. Conclusions
Conflicts of Interest
References
- Kamalpreet Bindra and Anuranjan Mishra, “A detailed study of clustering algorithms”, 2017 6th International Conference on Reliability, Infocom Technologies and Optimization (Trends and Future Directions) (ICRITO). [CrossRef]
- Jelili Oyelade, Itunuoluwa Isewon, Olufunke Oladipupo, Onyeka Emebo, Zacchaeus Omogbadegun, Olufemi Aromolaran, Efosa Uwoghiren, Damilare Olaniyan and Obembe Olawole, “Data Clustering: Algorithms and Its Applications”. [CrossRef]
- Obulesu, M. Mahendra and M. ThrilokReddy, “Machine Learning Techniques and Tools: A Survey”, 2018 International Conference on Inventive Research in Computing Applications (ICIRCA). [CrossRef]
- Diyana Kinaneva, Georgi Hristov, Petko Kyuchukov, Georgi Georgiev, Plamen Zahariev and Rosen Daskalov, “Machine Learning Algorithms for Regression Analysis and Predictions of Numerical Data”, 2021 3rd International Congress on Human-Computer Interaction, Optimization and Robotic Applications (HORA). [CrossRef]
- Shovan Chowdhury and Marco P. Schoen, “Research Paper Classification using Supervised Machine Learning Techniques”, 2020 Intermountain Engineering, Technology and Computing (IETC). [CrossRef]
- Ritesh C. Sonawane and Hitendra D. Patil, “Clustering Techniques and Research Challenages in Machine Learning”, 2020 Fourth International Conference on Computing Methodologies and Communication (ICCMC). [CrossRef]
- Deddy Jobson and Tirucherai Gopalakrishnan Venkatesh, “Dimensionality Reduction Techniques to Aid Parallelization of Machine Learning Algorithms”, 2022 IEEE 7th International conference for Convergence in Technology (I2CT). [CrossRef]
- Nitin Namdeo Pise and Parag Kulkarni, “A Survey of Semi-Supervised Learning Methods”,2008 International Conference on Computational Intelligence and Security. [CrossRef]
- Dharmarajan and T. Velmurugan, “Applications of partition based clustering algorithms: A survey”, 2013 IEEE International Conference on Computational Intelligence and Computing Research. [CrossRef]
- Zahra Nazari, Dongshik Kang, M. Reza Asharif, Yulwan Sung and Seiji Ogawa, “A new hierarchical clustering algorithm”, 2015 International Conference on Intelligent Informatics and Biomedical Sciences (ICIIBMS). [CrossRef]
- Pradeep Singh and Prateek A. Meshram, “Survey of density based clustering algorithms and its variants”, 2017 International Conference on Inventive Computing and Informatics (ICICI). [CrossRef]
- Qiang Zhang, “A Grid Based Clustering Algorithm”, 2010 6th International Conference on Wireless Communications Networking and Mobile Computing (WiCOM). [CrossRef]
- H.-P. Kriegel, P. Kroger, A. Pryakhin and M. Schubert, “Effective and efficient distributed model-based clustering”, Fifth IEEE International Conference on Data Mining (ICDM’05). [CrossRef]
- S. Rajathi, N. Shajunisha and S.Shiny Caroline, “Correlative analysis of soft clustering algorithms”, 2013 Fifth International Conference on Advanced Computing (ICoAC). [CrossRef]
- Mohiuddin Ahmed and Abu Barkat, “Performance Analysis of Hard Clustering Techniques for Big IoT Data Analytics”, 2019 Cybersecurity and Cyberforensics Conference (CCC). [CrossRef]
- S.C. Madeira and A.L. Oliveira, “Biclustering algorithms for biological data analysis: a survey”, IEEE/ACM Transactions on Computational Biology and Bioinformatics. [CrossRef]
- Shimei Jin, Wei Chen and Jiarui Han, “Graph-based machine learning algorithm with application in data mining”, 2017 Third International Conference on Research in Computational Intelligence and Communication Networks (ICRCICN). [CrossRef]
- H. Ahonen, O. Heinonen, M. Klemettinen and A.I. Verkamo, “Applying data mining techniques for descriptive phrase extraction in digital document collections”. [CrossRef]
- Hina Gulati, M. Klemettinen and A.I. Verkamo, “Predictive analytics using data mining technique”, 2015 2nd International Conference on Computing for Sustainable Global Development (INDIACom).
- Mohammed Amine El Mrabet, Khalid El Makkaoui and Ahmed Faize, “Supervised Machine Learning: A Survey ”, 2021 4th International Conference on Advanced Communication Technologies and Networking (CommNet). [CrossRef]
- Nagdev Amruthnath and Tarun Gupta, “A research study on unsupervised machine learning algorithms for early fault detection in predictive maintenance ”, 2018 5th International Conference on Industrial Engineering and Applications (ICIEA). [CrossRef]
- Muddasar Naeem, Syed Tahir Hussain Rizvi and Antonio Coronato, “A Gentle Introduction to Reinforcement Learning and its Application in Different Fields”, IEEE Access. [CrossRef]
- Ayush Soni, Akhtar Rasool, Aditya Dubey and Nilay Khare, “Data Mining based Dimensionality Reduction Techniques”, “2022 International Conference for Advancement in Technology (ICONAT)”. [CrossRef]
- Seema Maitrey and C. K. Jha, “Handling Structured Data Using Data Mining Clustering Techniques”, 2019 International Conference on Issues and Challenges in Intelligent Computing Techniques (ICICT). [CrossRef]
- Suyash Mishra and Anuranjan Misra, “Structured and Unstructured Big Data Analytics”, “ 2017 2017 International Conference on Current Trends in Computer, Electrical, Electronics and Communication (CTCEEC). [CrossRef]
- Mike Simpson, Simon Woodman, Hugo Hiden, Sebastian Stein, Stephen Dowsland, Mark Turner, Vicki L. Hanson and Paul Watson, “A Platform for the Analysis of Qualitative and Quantitative Data about the Built Environment and Its Users”, “ 2017 IEEE 13th International Conference on e-Science (e-Science)”. [CrossRef]
- Dao Lam, Mingzhen Wei And Donald Wunsch, “Clustering Data of Mixed Categorical and Numerical Type With Unsupervised Feature Learning”, IEEE Access. [CrossRef]
- Avishek Bose; Arslan Munir; Neda Shabani, “A Quantitative Analysis of Big Data Clustering Algorithms for Market Segmentation in Hospitality Industry”, 2020 IEEE International Conference on Consumer Electronics (ICCE. [CrossRef]
- Rahmadi Wijaya and Bambang Pudjoatmodjo, “An overview and implementation of extraction-transformation-loading (ETL) process in data warehouse (Case study: Department of agriculture)”, 2015 3rd International Conference on Information and Communication Technology (ICoICT). [CrossRef]
- Sanjay Kumar Dwivedi and Bhupesh Rawat, “A review paper on data preprocessing: A critical phase in web usage mining process”, 2015 International Conference on Green Computing and Internet of Things (ICGCIoT). [CrossRef]
- Asma Saleem, Khadim Hussain Asif, Ahmad Ali, Shahid Mahmood Awan and Mohammed A. Alghamdi, “Pre-processing Methods of Data Mining”, “2014 IEEE/ACM 7th International Conference on Utility and Cloud Computing. [CrossRef]
- Sakshi Patel, Shivani Sihmar and Aman Jatain, “A study of hierarchical clustering algorithms”, 2015 2nd International Conference on Computing for Sustainable Global Development (INDIACom).
- Nurcan Yuruk, Mutlu Mete, Xiaowei Xu, Thomas A. J. Schweiger, “A Divisive Hierarchical Structural Clustering Algorithm for Networks”, Seventh IEEE International Conference on Data Mining Workshops (ICDMW 2007). [CrossRef]
- Hussain Abu Dalbouh and Norita Md. Norwawi, “Improvement on Agglomerative Hierarchical Clustering Algorithm Based on Tree Data Structure with Bidirectional Approach”, 2012 Third International Conference on Intelligent Systems Modelling and Simulation. [CrossRef]
- Usha Rani and Shashank Sahu, “Comparison of clustering techniques for measuring similarity in articles”, 2017 3rd International Conference on Computational Intelligence & Communication Technology (CICT). [CrossRef]
- Sarra Ben Hariz and Zied Elouedi, “IK-BKM: An incremental clustering approach based on intra-cluster distance”, ACS/IEEE International Conference on Computer Systems and Applications - AICCSA 2010. [CrossRef]
- Xin Xin and Aggelos K. Katsaggelos, “A novel image retrieval framework exploring inter cluster distance”, 2010 IEEE International Conference on Image Processing. [CrossRef]
- José Ortiz-Bejar, Eric S. Tellez, Mario Graff, Jesús Ortiz-Bejar, Jaime Cerda Jacobo and Alejandro Zamora-Mendez, “Performance Analysis of K-Means Seeding Algorithms”, 2019 IEEE International Autumn Meeting on Power, Electronics and Computing (ROPEC). [CrossRef]
- R.M. Castro, M.J. Coates and R.D. Nowak, “Likelihood based hierarchical clustering”, IEEE Transactions on Signal Processing (Volume: 52, Issue: 8, August 2004). [CrossRef]
- Sajad Shirali-Shahreza, Soheil Hassas Yeganeh, Hassan Abolhassani and Jafar Habibi, “Circluster: Storing cluster shapes for clustering”, IEEE Transactions on Signal Processing”, 2008 4th International IEEE Conference Intelligent Systems. [CrossRef]
- Wenbo Wang; Yuwei Li; Feng Wang; Xiaopei Liu; Youyi Zheng“, Using Visualization to improve Clustering Analysis on Heterogeneous Information Network”, IEEE Transactions on Signal Processing”, 2018 22nd International Conference Information Visualisation (IV). [CrossRef]
- Hadjir Zemmouri, Said Labed and Akram Kout “, “A survey of parallel clustering algorithms based on vertical scaling platforms for big data”, 2022 4th International Conference on Pattern Analysis and Intelligent Systems (PAIS). [CrossRef]
- Sukhwant kour Siledar, Bhagyashree Deogaonkar, Nutan Panpatte and Jayshri Pagare, “Map Reduce Overview and Functionality”, 2021 6th International Conference on Communication and Electronics Systems (ICCES). [CrossRef]
- Eman Shaikh, Iman Mohiuddin, Yasmeen Alufaisan and Irum Nahvi, “Apache Spark: A Big Data Processing Engine”, 2019 2nd IEEE Middle East and North Africa COMMunications Conference (MENACOMM). [CrossRef]
- Mirza Abdur Razzaq, Javed Ahmed Mahar, Muneer Ahmad, Najia Saher, Arif Mehmood And Gyu Sang Choi, “Hybrid Auto-Scaled Service-Cloud-Based Predictive Workload Modeling and Analysis for Smart Campus System”, Digital Object Identifier. [CrossRef]
- Ahmed Hussein Ali and Mahmood Zaki Abdullah, “A Survey on Vertical and Horizontal Scaling Platforms for Big Data Analytics”, International Journal of Integrated Engineering • September 2019.
- Xiaohong Qiu, Geoffrey Fox, Huapeng Yuan, Seung-Hee Bae, George Chrysanthakopoulos and Henrik Nielsen, “Parallel Data Mining on Multicore Clusters”, 2008 Seventh International Conference on Grid and Cooperative Computing. [CrossRef]
- Ahmed Hussein Ali and Mahmood Zaki Abdullah, “A Survey on Vertical and Horizontal Scaling Platforms for Big Data Analytics”. [CrossRef]
- Punyaban Patel and Borra Sivaiah; Riyam Patel, “Approaches for finding Optimal Number of Clusters using K-Means and Agglomerative Hierarchical Clustering Techniques”. [CrossRef]
- Punyaban Patel and Borra Sivaiah; Riyam Patel, “Approaches for finding Optimal Number of Clusters using K-Means and Agglomerative Hierarchical Clustering Techniques”. [CrossRef]
- Simone Santiniand Ramesh Jain, “Similarity Measures”, IEEE Transactions On Pattern Analysis And Machine Intelligence.
- Dao Lam, Mingzhen Wei And Donald Wunsch, “Clustering Data of Mixed Categorical and Numerical Type With Unsupervised Feature Learning”. [CrossRef]
- Naveen Kumar, Sanjay Kumar Yadav and Divakar Singh Yadav, “Similarity Measure Approaches Applied in Text Document Clustering for Information Retrieval”, 2020 Sixth International Conference on Parallel, Distributed and Grid Computing (PDGC). [CrossRef]
- U. Fayyad, “Data mining and knowledge discovery in databases: implications for scientific databases”, Proceedings. Ninth International Conference on Scientific and Statistical Database Management (Cat. No.97TB100150). [CrossRef]
- Sachin Paranjape, S. Barani, Mukul Sutaone, Prachi Mukherji, “Intra and inter cluster congestion control technique for mobile wireless sensor networks”, 2016 Conference on Advances in Signal Processing (CASP). [CrossRef]
- Huican Zhu, Hong Tang and Tao Yang, “Demand-driven service differentiation in cluster-based network servers”, Proceedings IEEE INFOCOM 2001. Conference on Computer Communications. Twentieth Annual Joint Conference of the IEEE Computer and Communications Society (Cat. No.01CH37213. [CrossRef]
- Nuwan Ganganath, Chi-Tsun Cheng and Chi K. Tse, “Data Clustering with Cluster Size Constraints Using a Modified K-Means Algorithm”, 2014 International Conference on Cyber-Enabled Distributed Computing and Knowledge Discovery. [CrossRef]
- Ritesh C. Sonawane and Hitendra D. Patil, “Clustering Techniques and Research Challenages in Machine Learning”, 2020 Fourth International Conference on Computing Methodologies and Communication (ICCMC). [CrossRef]
- Bing Zhou, Jun-Yi Shen and Qin-Ke Peng, “PARCLE: a parallel clustering algorithm for cluster system”, Proceedings of the 2003 International Conference on Machine Learning and Cybernetics. [CrossRef]
- Xia Daoping and Zhong Alin and Long Yubo, “A Parallel Clustering Algorithm Implementation Based on Apache Mahout”, 2016 Sixth International Conference on Instrumentation & Measurement, Computer, Communication and Control (IMCCC). [CrossRef]
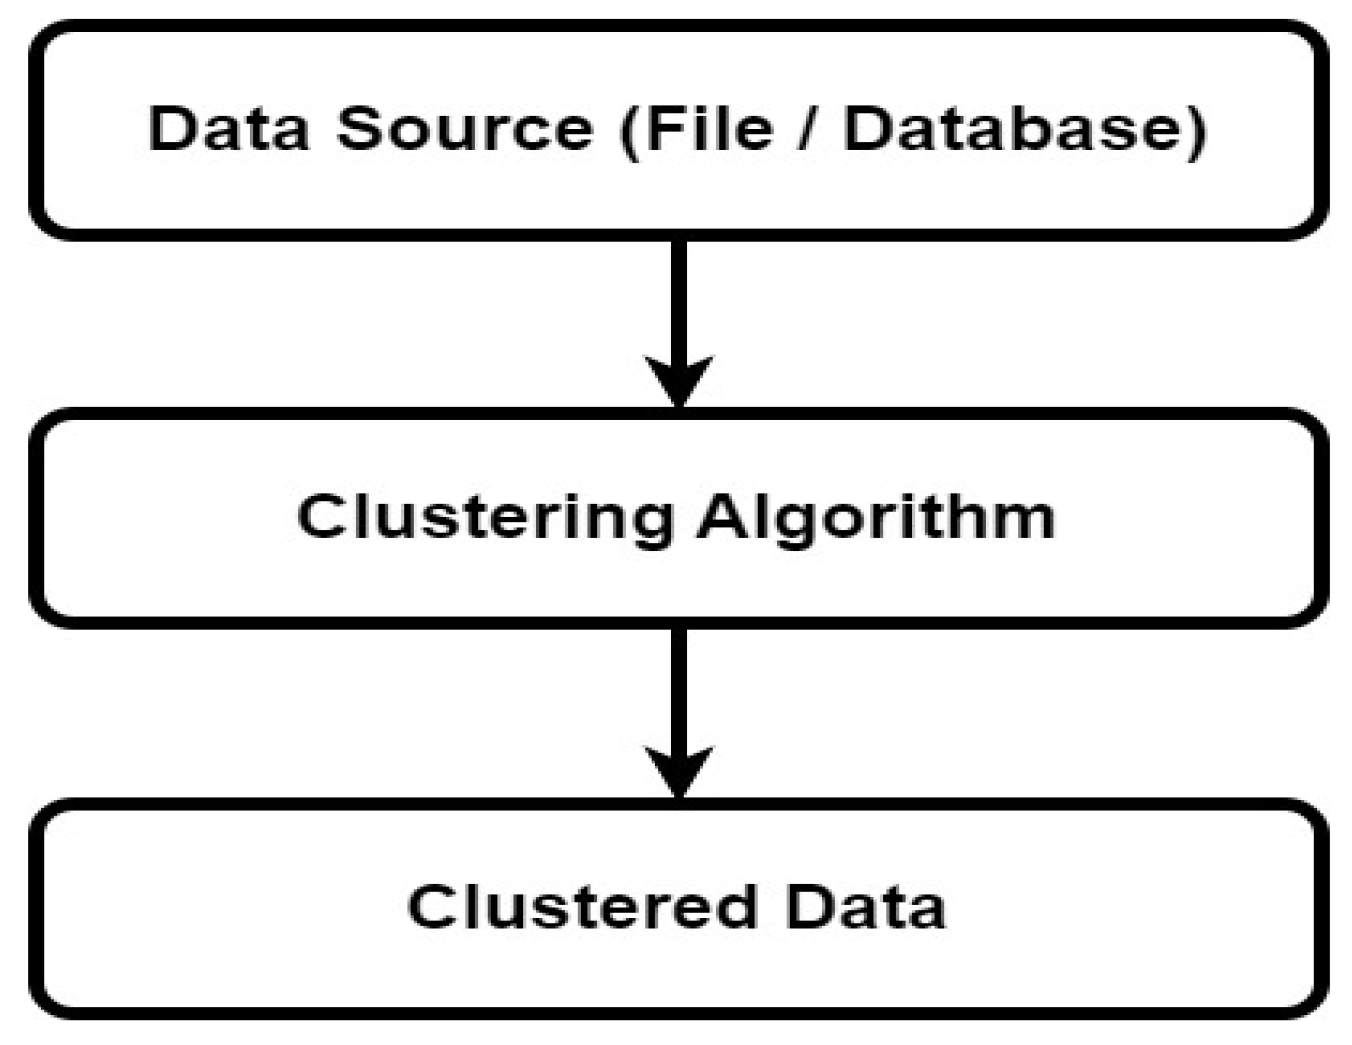

| Algorithms of Machine Learning List | Sub Methods | Details |
|---|---|---|
| Supervised Learning |
Regression |
It is used to predict continuous numeric values. Examples: Linear regression and support vector regression [4]. |
| Classification |
It is used to assign data points to predefined categories. Examples: decision trees, logistic regression, random forests, support vector machines [5]. | |
| Unsupervised Learning |
Clustering |
It is used to group similar data points into. Examples: partition clustering, K-Means and DBSCAN [6]. |
| Dimensionality Reduction |
It is used to remove unnecessary features from a given data set. Examples: Principal Component Analysis (PCA) and t-distributed Stochastic Neighbor Embedding (t-SNE)[7]. |
|
| Semi-Supervised Learning | It combines the aspects of supervised unsupervised learning [8]. |
| Clustering Algorithms | ||
|---|---|---|
| Evaluation Criteria | Traditional | Parallel |
| Knowledge | Require prior knowledge | Not require prior knowledge |
| Data | Should be ordered | Ordered not required |
| Input Parameters | complex | Simple |
| Data Set | Not partitioned | Partitioned (chunks) |
| Problem | Specific Problem | All Problems |
| Operation Conditions | particular | All Conditions |
| Computational Costs | More | Less |
| Data it handle | can’t handle heterogeneous data | can handle heterogeneous data |
| Execution | Serial | Parallel |
| Speed | Less | More |
| Throughput | Less | More |
| Scalability | Less | More |
| Big Data Challenges | Can’t Meet | Can Meet |
|
Volume / Data Quantity (Created / Stored) |
More | More |
|
Velocity / Frequency (Coming / Updated) |
Less | Less |
|
Types Of Data (Data Forms And Sources From Where It Is Coming) |
Less | More |
| Clustering Algorithm | Details | Sub Clustering Methods |
|---|---|---|
| Partitioning | It is a technique used to break a data source into two groups [9]. | 1. CLARA. 2. CLARANS. 3.EMCLUSTERING 4. FCM. 5. K MODES. 6. KMEANS. 7. KMEDOIDS. 8. PAM. 9. XMEANS |
| Hierarchical | It creates clusters based on objects similarity [10] |
1. AGNES. 2. BIRCH. 3. CHAMELEON. 4. CURE. 5. DIANA. 6. ECHIDNA 7. ROCK. |
| Density Based | It creates clusters based on radius as a condition. i.e within radius one cluster and remaining other cluster(noise) [11]. | 1. DBCLASD. 2. DBSCAN. 3. DENCLUE. 4. OPTICS. |
| Grid Based | Clustering is done based on calculation values of density of cells using the grid [12]. | 1. CLIQUE. 2. OPT GRID. 3. STING. 4. WAVE CLUSTER. |
| Model Based | It uses statistical approach of assigning weights to every object. Based on object weights clustering is done [13]. | 1. EM. 2. COBWEB. 3. SOMS. |
| Soft Clustering | It is based on assigned of individual data points to more than one cluster [14]. | 1. FCM. 2. GK. 3. SOM. 4. GA Clustering |
| Hard Clustering | It is based on assigned of individual data points to everyone cluster [15]. |
1. KMEANS |
| Bi-clustering | It creates clusters based on cluster matrix rows and columns as a condition [16]. |
1. OPSM. 2. Samba 3. JSa |
| Graph Based | It is based on graph theory that graph contains vertices or nodes. Here every node is assigned particular weights. Based on graph node weights Clustering is done [17]. | 1. Graph based k-means algorithm |
| Clustering Type | Hard Clustering | Soft Clustering |
|---|---|---|
| All Data Point Assigned to | single cluster | multiple clusters |
| Similarity Clustering | maximum | minimum |
| Clustering Criteria | Details |
|---|---|
| Data Mining Tasks | It is of two types. They were Descriptive or Predictive. Clustering is Descriptive Data Mining Tasks. Descriptive Data Mining task gives us the provide correlation, cross-tabulation, frequency, etc., from the data [18]. Predictive Data Mining task is used to analyze and predict future occurrences of events or other data or trends [19]. |
| Type of Learning / Knowledge | Machine learning is of three types. They were Supervised / Unsupervised, Reinforced learning and unsupervised. Supervised / Reinforced machine learning is based on output training data and the labeled input and [20] and unsupervised learning Machine learning processes unlabelled data [21]. Reinforcement technique is used to train algorithms to learn from their environments [22]. |
| Dimensionality | If the clustering algorithm deals with more types of data then it is said to be multi dimensional. (High / Low / Medium) [23]. |
| Data Sources | Data Set / File / Data Base |
| Volume | Number of data points of a dataset. (Created / Stored) |
| Unstructured or Structured Data | If the data in the data set is in a standardized format (clearly defined) for the easy access by the systems or humans is called as Structured data [24]. If the data in the data set is not a standardized format (clearly defined) for the easy access by the systems or humans is called as Unstructured data [25]. Structured data is easily made into clusters but not Unstructured data. So algorithms are used to convert unstructured data to Structured data. So there is a requirement of unstructured data to be converted into unstructured data and it can discover new patterns. Clustering uses Structured in most cases. |
| Data Types used in Clustering | Two types of data are processed by the Clustering algorithms. They were Qualitative and Quantitative Data [26]. Clustering algorithm processes two types of data are shown in Figure 5 shown below. Qualitative / Categorical type (Subjective) of data can be split into categories. Example: Persons Gender (male, female, or others) [27]. It is of three types. They were Nominal (sequenced), Ordinal (ordered) and binary (take true (1) / false (0)). Quantitative / Numerical Data are measurable and are of two types. They were Discrete (countable, continuously, measurable) [28]. Example: Student height. 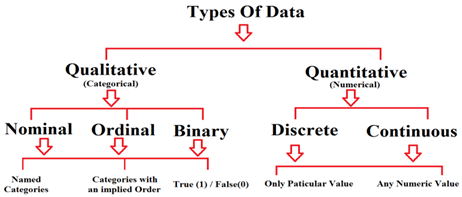 Figure 5: Clustering algorithm processes two types of data |
| ETL Operations used | Extraction, Transformation and loading operations are performed on the data source [29]. |
| Data Preprocessed | It is used for data cleaning and data transforming to make it used for the analysis [30]. |
| Data Preprocessing Methods | Data Preprocessing Methods used in the market are cleaning, instance selection, normalization, scaling, feature selection, one-hot encoding, data transformation, feature extraction and feature selection and dimensionality reduction [31]. |
| Hierarchical Clustering Algorithms Type | In Hierarchical clustering algorithms [32] is two types Divisive (Top-Down) [33] Or Agglomerative (Bottom-Up) [34]. |
| No Of Clustering Algorithms | It is the total count of two types of Clustering Algorithms (Main and sub).i.e. It is count of sum of total number of Main Clustering Algorithms and total number of Sub Clustering Algorithms. |
| Algorithms Threshold / Stops At What Level | Hierarchical clustering algorithms Stops at a level defined by the user as his Preferences. |
| Algorithm Stability | It uses different clustering applications to determine the number of clusters. |
| Programming Language |
It used For processing (Python, Java, .Net e.t.c) the clustering algorithm. |
| Number Of Inputs For The Clustering Process | Clustering Algorithm, Algorithm Constraints, Number of Levels and clusters per each level. |
| Number Of Levels | In Hierarchical clustering algorithms, divisive clustering (top-down) how many split it goes down is the number levels. Or Agglomerative (bottom-up) how many merges it goes up to the number of levels. |
| Clusters Level Wise | It is number of clusters at each level or stage |
| Data Points per Cluster | It is always depends on the type of cluster algorithm used and its preferences defined by the user. |
| Similarity Functions / Similarity Measure. | It is used to quantify how similar or dissimilar two clusters are in a clustering analysis. Similarity measures are used to identify the good clusters in the given data set. There are so many Similarity measures used in the current market. They were Weighted, Average, Chord, Mahalanobis, Canberra Metric, Czekanowski Coefficient, Index of Association, Mean Character Difference, Pearson coefficient, Minkowski Metric, Manhattan or City blocks distance, KullbackLeibler Divergence, Clustering coefficient, Cosine, Kmean e.t.c[35]. |
| Intra Cluster Distance | It is the distance between the data points of one cluster to other. If its value is low then the clusters are said to be tightly coupled other clusters are said to be loosely coupled [36]. |
| Inter Cluster Distance | It measures the dissimilarity / separation between different clusters. It quantifies how distinct or well-separated the clusters are from each other [37]. |
| Sum Of Square Error (SSE) Or Other Errors | It is a measure of difference the actual to the expected result of the model [38]. |
| Clusters Likelihood | It is clusters similarity in the data points [39]. |
| Clusters Unlikelihood | It is clusters dissimilarity in the data points. |
| Number Of Variable Parameters At Each Level | These are the input parameters which are changed during the running of the algorithm like threshold. |
| Outlier | In the clustering process any object doesn’t belong to any cluster it is called as an outlier. |
| Clusters Compactness | It deals with the inertia for better clustering. It means lower inertia indicates better clustering. Inertia means Within-Cluster Sum of Squares. |
| Purpose | Develop and predict model |
| Clustering Scalability | It is the increasing and decreasing abilities of every cluster as a part o whole. |
| Total Number of Clusters | It is total number clusters generated by the clustering algorithm after its execution. |
| Interpretability | Understandability , usability of clusters after is generation is called as Interpretability |
| Convergence | Convergence criterion is a condition by which controls the change in cluster centers. It should be always to be minimum. |
| Clusters Shape | Each clustering Algorithm handles the clustering in different shapes [40]. Clustering Algorithm ------- Cluster Shape K Means ------- Hyper Spherical, Centroid Based Approach ------- Concave Shaped Clusters, Cure ------- Arbitrary, Partitional Clustering ------- Ellipsoidal, Clarans ------- Polygon Shaped, Dbscan ------- Concave E.t.c |
| Execution | Running the clustering Algorithm or Algorithms in serial or parallel. |
| Output | Clusters |
| Velocity | It is nothing but the frequency of Coming / Updated data to the clusters. |
| Throughput | It is the count of number of units processed by the system in the given amount of time. |
| Space Complexity | It of a clustering algorithm refers to the amount of memory or storage for storing input data, data structures or variables required by the algorithm to perform clustering on a given dataset. Space Complexity=Auxiliary Space + Space For Input Values. |
| Time Complexity | It is the time taken to run each and instructions of an algorithm. Time Complexities of Clustering Algorithms Clustering Algorithm ---- Time Complexity BIRCH ---- O(n) Chameleon ---- O(nˆ2) CLARA ---- O(n) CLARANS ---- O(nˆ2) Clique ---- O(n) CURE ---- O(sˆ2*s) K -Means ---- O(n) K-medoids ---- O(nˆ2) PAM ---- O(nˆ2) ROCK ---- O(nˆ3) Sting ---- O(n) e.t.c |
| Clusters Visualization | It is a process used to representing clusters or groups of data points in a visual format. It gives the insights into patterns, relationships, and structures within the data. Techniques and tools for visualizing clusters: Scatter Plots, Dendrogram, Heatmaps, t-Distributed Stochastic Neighbor Embedding, Silhouette Plots, Principal Component Analysis Plot, K-Means Clustering Plot, Hierarchical Clustering Dendrogram, Density-Based Clustering Visualization, Interactive Visualization Tools: Matplotlib, Seaborn, Plotly, D3.js, and Tableau [41]. |
| MapReduce phases Name | Phase Purpose |
|---|---|
| Map tasks (Splits & Mapping) | splitting and mapping of data |
| Reduce tasks (Shuffling, Reducing) | Shuffle and reduce the data. |
| Phases of MapReduce | Details |
|---|---|
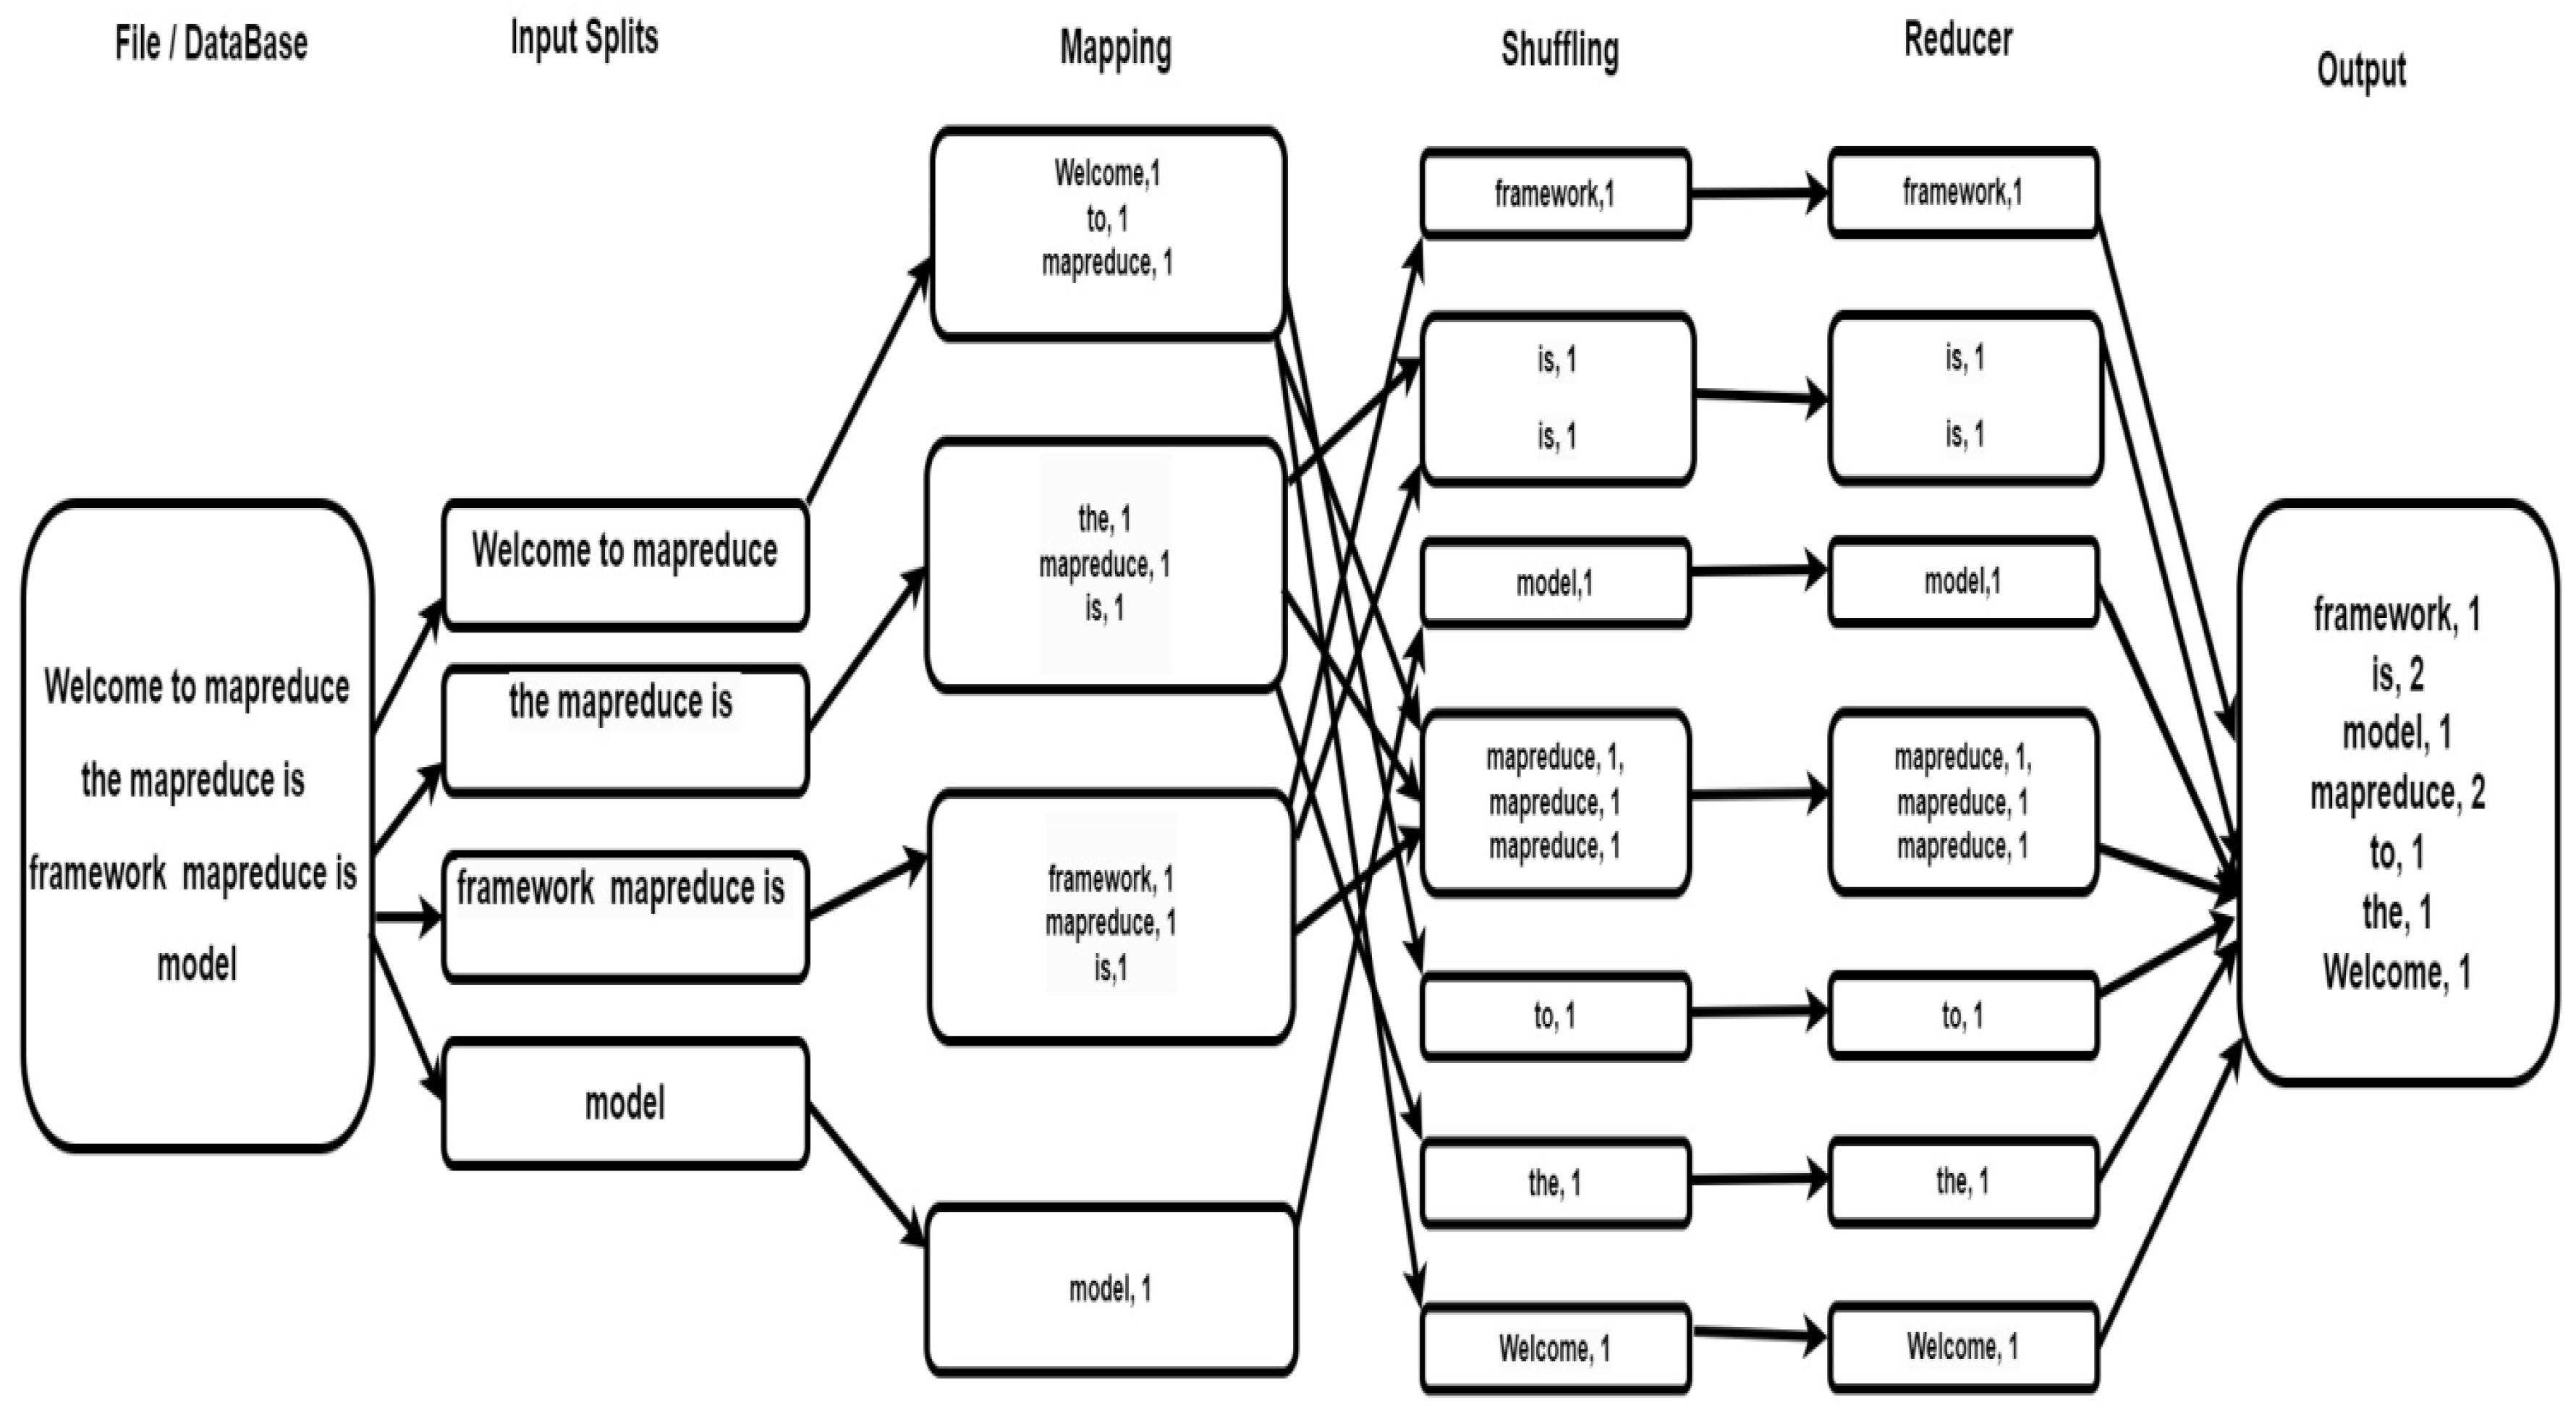
| Splitting | The Input data set is broken down into small parts called as data chunks and is used by a single map. |
| Mapping | Splitting is input phase for mapping phase where each data chunk is given to the mapping function to measure the number of occurrences of each word. Mapping phase Output: (word, frequency) |
| Shuffling & Sorting | This phase is used to combine similar words with their frequency. |
| Reducing | It is used to give the consolidated summary of the given dataset. |
| MapReduce Tasks | Purpose |
|---|---|
| Map tasks | Splits & Mapping |
| Reduce tasks | Shuffling, Reducing |
| MapReduce Execution Process Components | Details |
|---|---|
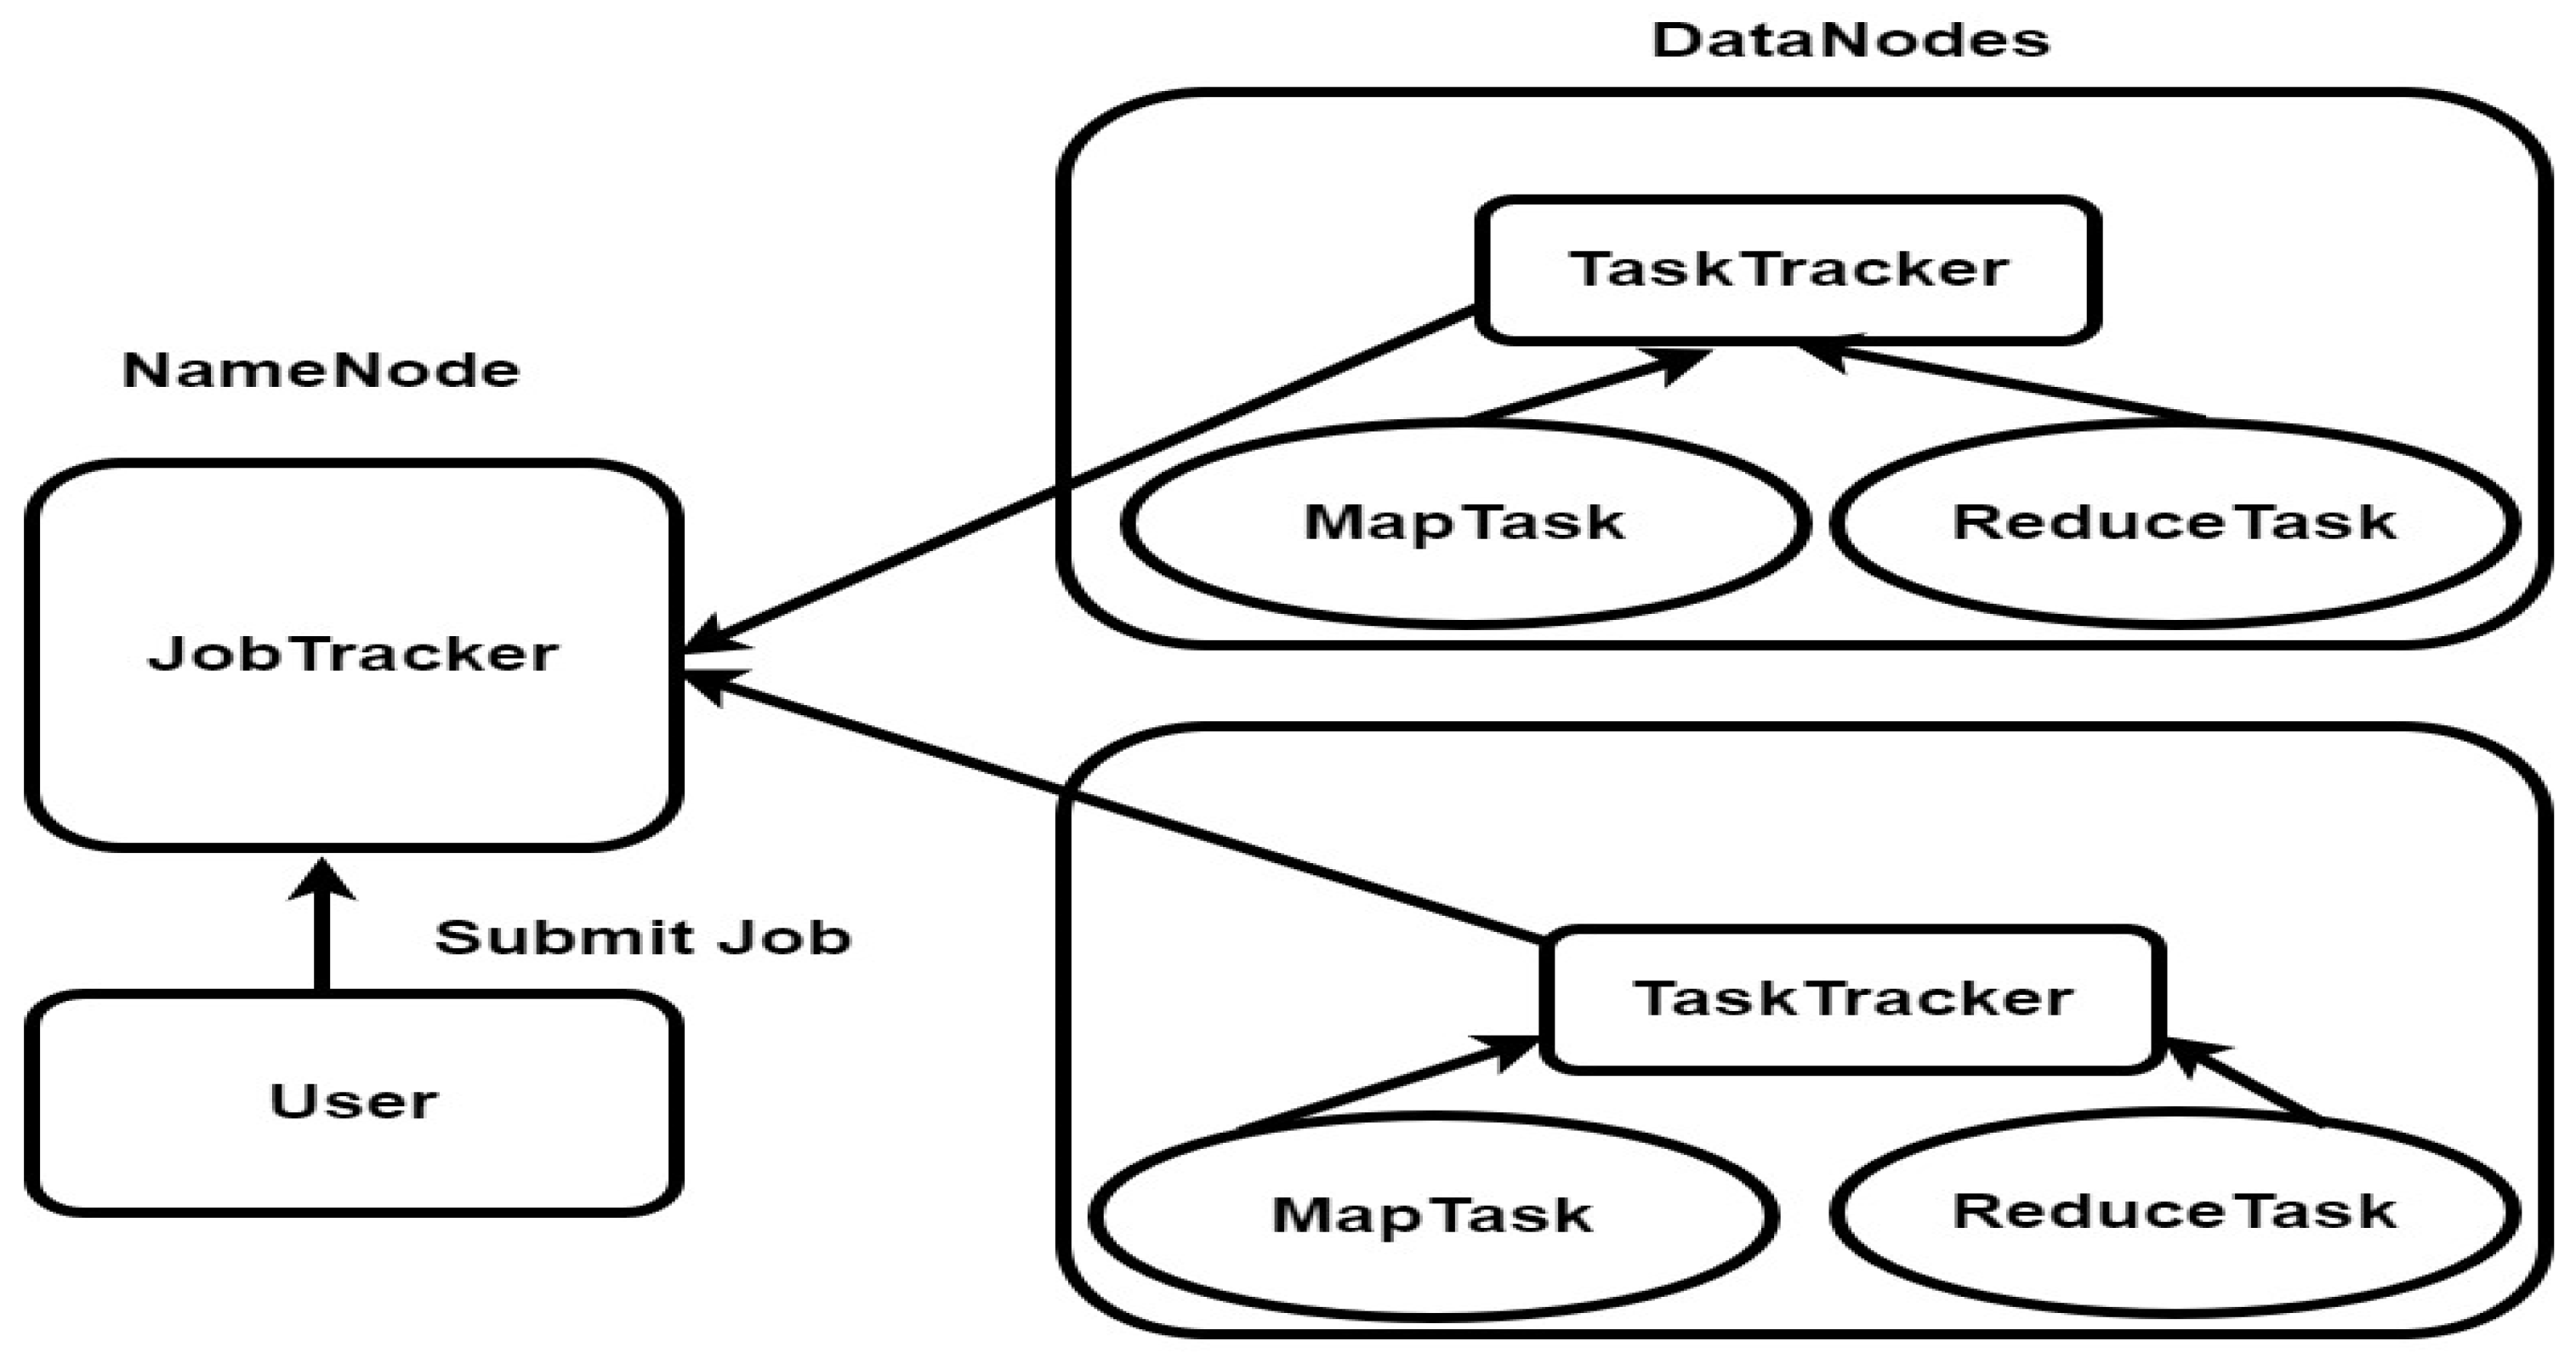
| Jobtracker | It is a master node which is used to complete execution of submitted job. Jobtracker resides on Namenode. |
| Multiple Task Trackers | Multiple Task Trackers are the slave machines for performing the job submitted by Jobtracker node. Task Trackers resides on Datanode |
| Execution Modes | Details |
|---|---|
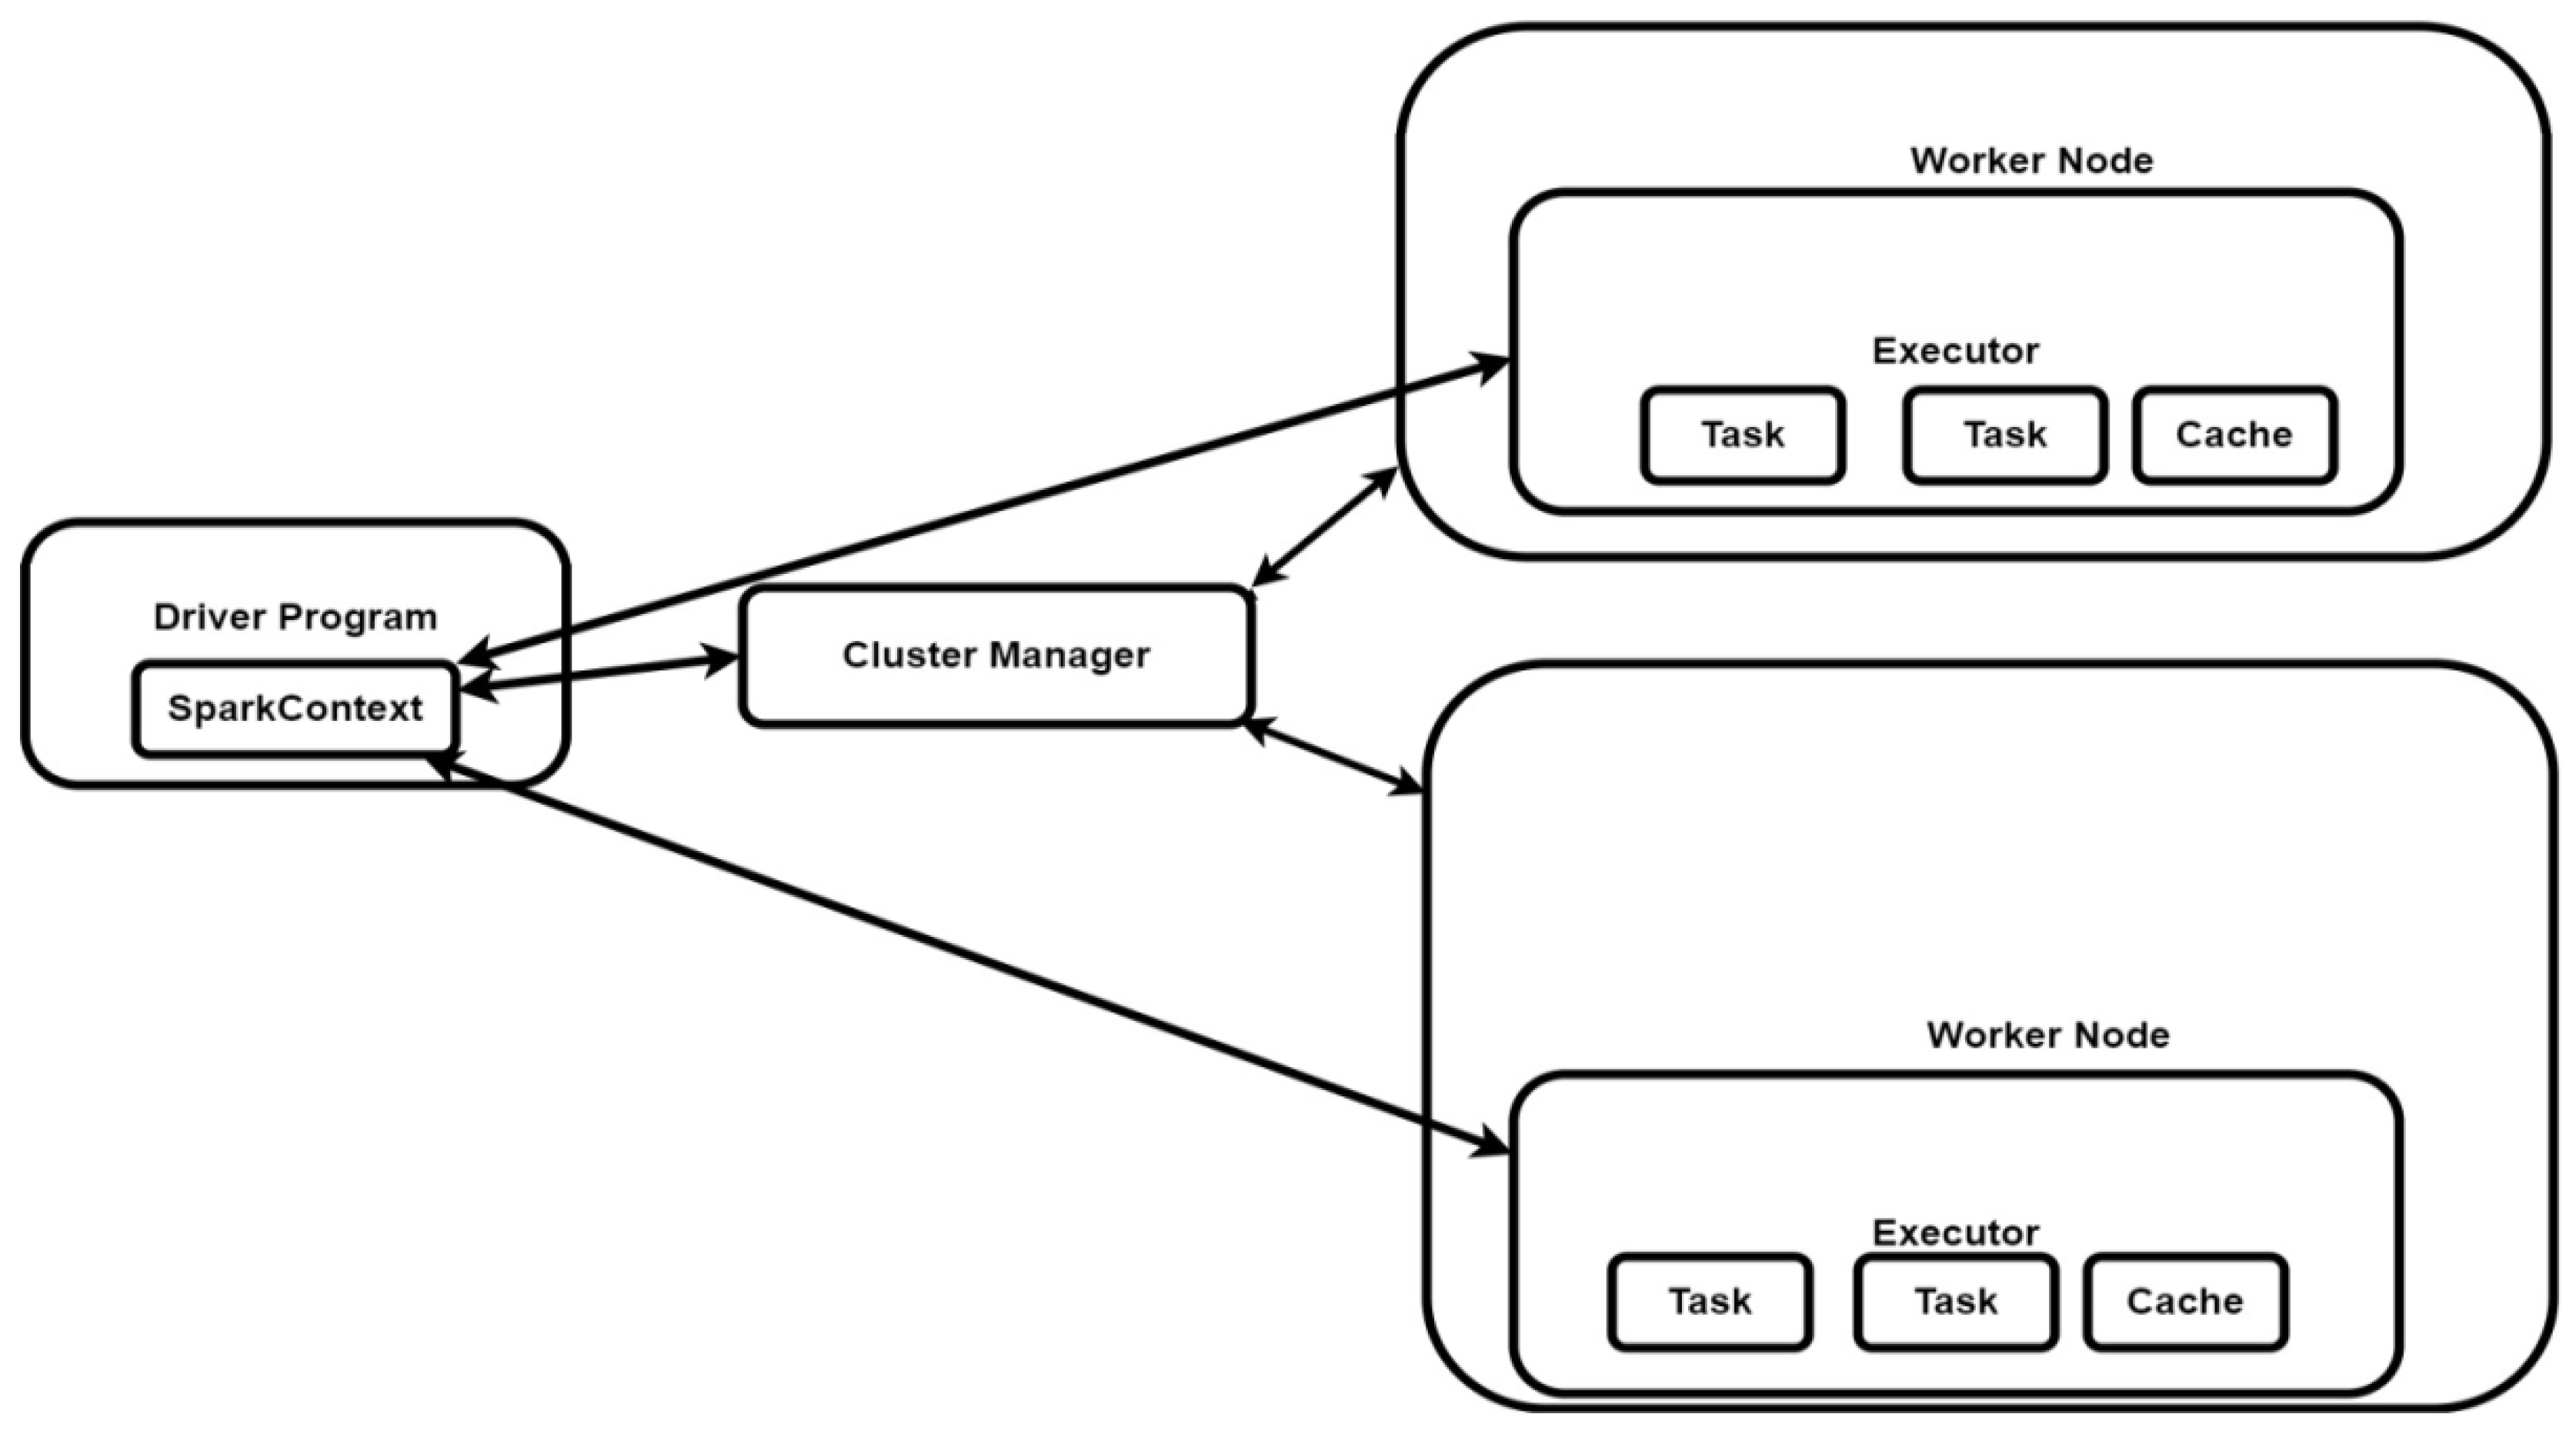
| Cluster | It is used to run production jobs where the driver executes under the worker nodes. |
| Client | Here the driver runs locally from where you are submitting your application using spark-submit command. |
| Local | It is used to run complete Spark Application on a individual machine. Local mode uses threads instead of parallelized threads. |
| Cluster Manager Types | Details |
|---|---|
| Standalone | It is used to set up a cluster and provides a web-based graphical user interface to monitor the cluster. |
| Apache Mesos | It is used to run multiple distributed applications on the same cluster resource allocation and scheduling conflicts. |
| Hadoop YARN | It is a Hadoop3 resource manager. |
| Kubernetes | It an open source system for automatic scaling, management , deployment applications. |
| Apache Spark Features | Details |
|---|---|
|
Speed |
Applications run on Spark process which is much faster in memory and on disk by reducing number of read and write operations to disk. |
| Multi-Language Support | Spark uses various APIs like Java, Scala, or Python. So application programs can be written different languages. |
| Advanced Analytics | For generating analytics spark uses Map, reduce, SQL queries machine learning (ML), and graph algorithms and streaming data |
| CPU(Central processing unit) | Graphics processing unit (GPU) | |
|---|---|---|
| No Of Cores | 4 to 8 | 100s Or 1000s |
| Throughput | Low | High |
| Instructions Execution | Serial | Parallel |
| Computing Applications | General purpose | High Performance |
| Parallel Programming Languages | Java, .net e.t.c | CUDA, Opencl E.T.C |
| Drawback | Limited Memory Capacity | |
| Memory Management | Easy | Complex |
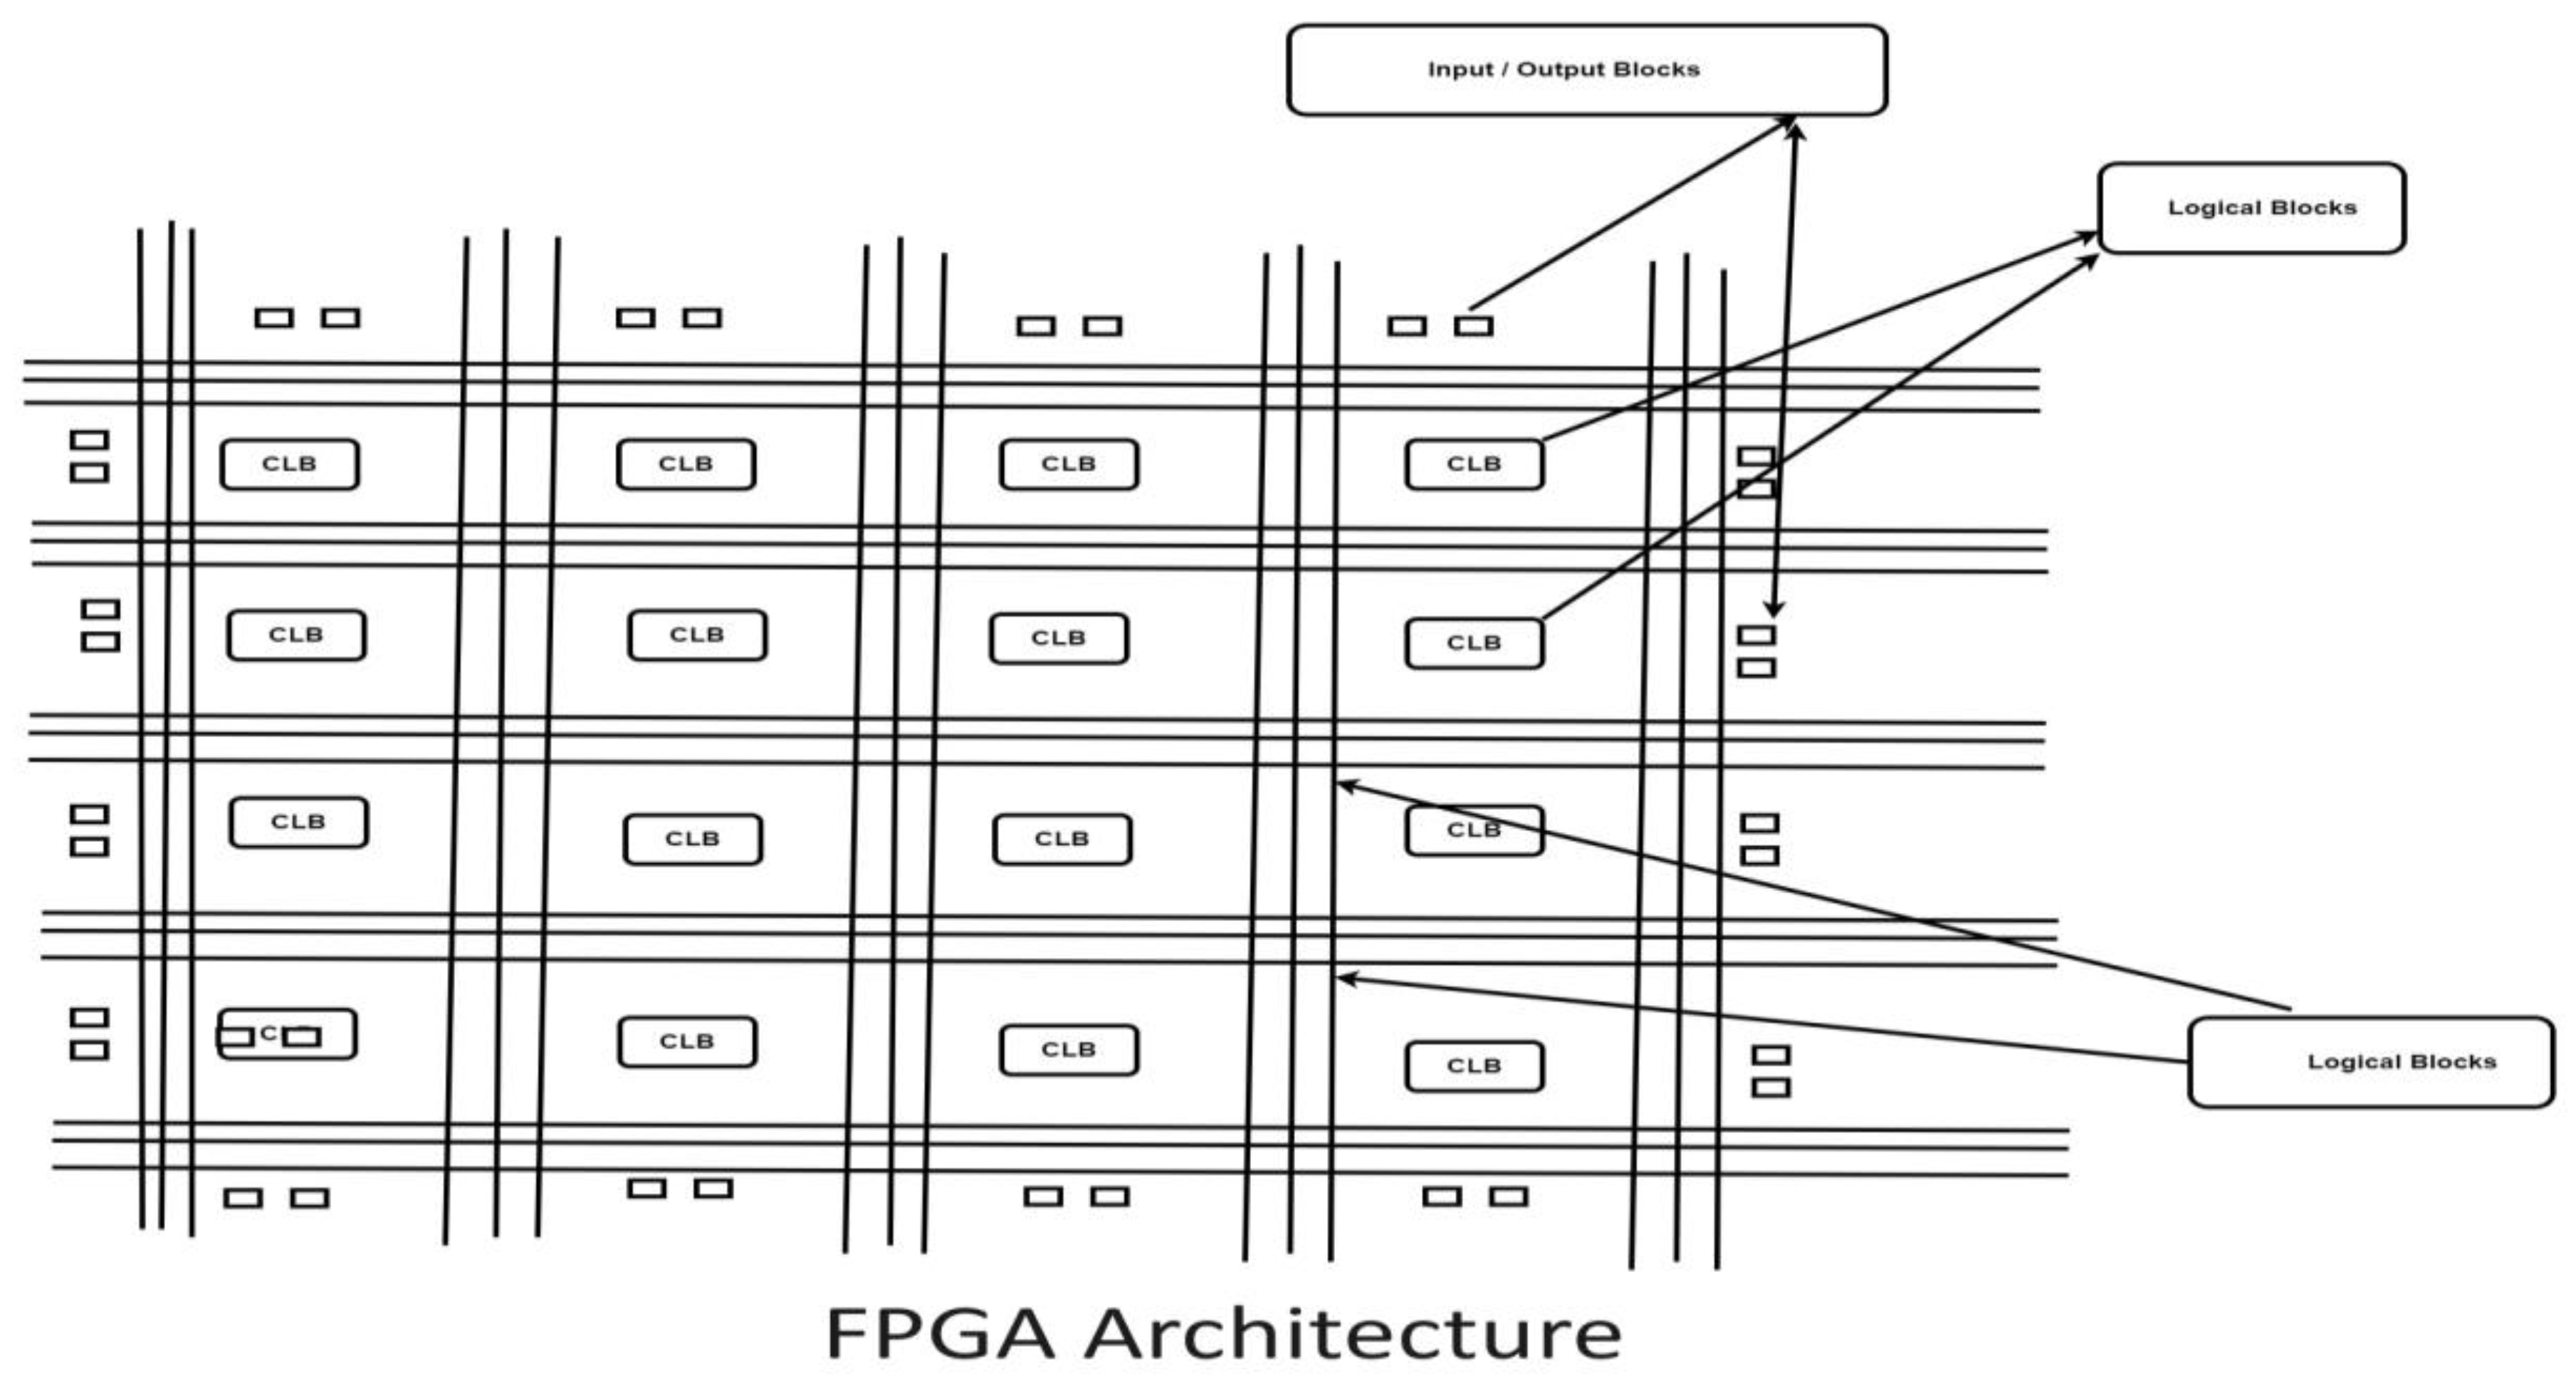
| FPGA structure | Details |
|---|---|
| Programmable logic structure | It consists of collection of CLBs. CLB means configurable logic block used to implement any Boolean function of 4 to 6 variables. One or two flip-flops are used to implement one CLB. |
| Programmable routing structure | It is used for routing the information. It consists of vertical and horizontal routing channels, connection boxes and switch boxes. |
| Programmable Input / Output structure | It consists of buffers either which are used as Input buffers or used as output buffers. |
Disclaimer/Publisher’s Note: The statements, opinions and data contained in all publications are solely those of the individual author(s) and contributor(s) and not of MDPI and/or the editor(s). MDPI and/or the editor(s) disclaim responsibility for any injury to people or property resulting from any ideas, methods, instructions or products referred to in the content. |
AUTHOR DETAILS:
 |
Dr. Srikanth Thota received his Ph.D in Computer Science Engineering for his research work in Collaborative Filtering based Recommender Systems from J.N.T.U, Kakinada. He received M.Tech. Degree in Computer Science and Technology from Andhra University. He is presently working as an Associate Professor in the department of Computer Science and Engineering, School of Technology, GITAM University, Visakhapatnam, Andhra Pradesh, India. His areas of interest include Machine learning, Artificial intelligence, Data Mining, Recommender Systems, Soft computing. |
 |
Mr. Maradana Durga Venkata Prasad received his B.TECH (Computer Science and Information Technology) in 2008 from JNTU, Hyderabad and M.Tech. (Software Engineering) in 2010 from Jawaharlal Nehru Technological University, Kakinada, He is a Research Scholar with Regd No: 1260316406 in the department of Computer Science and Engineering, Gandhi Institute Of Technology And Management (GITAM) Visakhapatnam, Andhra Pradesh, INDIA. His Research interests include Clustering in Data Mining, Big Data Analytics, and Artificial Intelligence. He is currently working as an Assistant Professor in Department of Computer Science Engineering, CMR Institute of Technology, Ranga Reddy, India. |
© 2023 by the authors. Licensee MDPI, Basel, Switzerland. This article is an open access article distributed under the terms and conditions of the Creative Commons Attribution (CC BY) license (http://creativecommons.org/licenses/by/4.0/).


