Submitted:
14 December 2023
Posted:
15 December 2023
You are already at the latest version
Abstract
Globally, the use of whole-cell matrix-assisted laser desorption ionization-time of flight mass spectrometry (MALDI-TOF MS) in clinical microbiology laboratories has increased considerably. With the rapid growth of artificial intelligence technology, there is an increasing number of areas devoted to solving problems by implementing machine learning-based methods. Applying the use of artificial intelligence to the analysis of the massive amount of information obtained in the mass spectrum derived from MALDI-TOF MS should be a breakthrough in clinical microbiology. Specifically, it would facilitate a more rapid and accurate strain typing or antibiotic susceptibility test (AST) based on whole-cell MALDI-TOF MS spectra, and hence, it is a promising solution. Even though the reproducibility of peaks could result in some critical problems, computational methods have been developed to address this issue. Therefore, clinical microbiologists are able to perform strain typing or an AST as smoothly and easily as identifying species by using MALDI-TOF MS and artificial intelligence.
Keywords:
artificial intelligence
; antimicrobial susceptibility testing
; antimicrobial typing
; MALDI-TOF
Introduction
Worldwide the application of whole-cell matrix-assisted laser desorption ionization-time of flight mass spectrometry (MALDI-TOF MS has increased considerably in clinical microbiological laboratories (Burckhardt and Zimmermann, 2018). The MALDI-TOF mass spectrum provides vast information that includes the mass-to-charge ratios (m/z) and peak intensities. The technique provides a rapid, reliable, and cost-effective identification of bacteria, mycobacteria, and fungi (Wolters et al., 2011; Croxatto et al., 2012; Lee et al., 2013; Chao et al., 2014; Hsueh et al., 2014a; Hsueh et al., 2014b; Chen et al., 2015; Cheng et al., 2015; Lee et al., 2015; Lin et al., 2015; Nomura, 2015; Patel, 2015; Chien et al., 2016; Wang et al., 2016a; Ge et al., 2017; Li et al., 2017; Su et al., 2018; Vrioni et al., 2018; Wang et al., 2019d; Yeh et al., 2019).
Apart from bacterial identification MALDI-TOF MS is a promising method for accurate strain typing and antimicrobial resistance profiling (Wolters et al., 2011; Croxatto et al., 2012; Josten et al., 2013; Sandrin et al., 2013; Cox et al., 2015; Nomura, 2015; Camoez et al., 2016; Mather et al., 2016; Wang et al., 2018b; Wang et al., 2018c; Wang et al., 2018d). Strain typing by MALDI-TOF MS is advantageous because it has a low cost compared to the standard strain typing methods, such as pulse-field gel electrophoresis and multi-locus sequence typing (Wang et al., 2018c) and rapid compared to the minimal inhibitory concentration determination or agar diffusion, a factor that determines the appropriate prescription of antibiotics. Without guidance from an AST, adequate antibiotic use based on empirical prescriptions would be low, at around 50%, depending on the local epidemiology (O’Driscoll and Crank, 2015). Thus, whole cell MALDI-TOF MS is a promising and novel tool for rapid and accurate strain typing/AST.
A subtle difference in MALDI-TOF MS spectra between differ strains hinder strain typing or detection of antibiotic resistance, is overcome by the introduction of appropriate computational methods (Sandrin et al., 2013; Camoez et al., 2016). MALDI-TOF MS generates massive datasets with hundreds of peak signals on the spectra (Lopez-Fernandez et al., 2015; Wang et al., 2018d). This complex data is overwhelming to even an experienced medical staff (Wang et al., 2018c) with an intrinsic limitation in the reproducibility of the spectra. The peak-level reproducibility of peak presence/absence is ~ 80% (Croxatto et al., 2012) and the reproducibility is affected by numerous factors like duration of culture or type of culture media (Croxatto et al., 2012; Mather et al., 2016). In clinical practice, only a single analytical measurement of the MALDI-TOF MS spectra is utilized to make a decision which is accurate for species-level identification. The current search is for strain typing or an AST using a single analytical measurement.
Previous studies have attempted to identify single characteristic peaks for specific strain or antibiotic resistance by visual inspection (Wolters et al., 2011; Lasch et al., 2014). Visual examination of the MALDI-TOF MS spectrum is easy in practice, but the analytical accuracy is highly dependent on the operator. Inter-batch and/or intra-batch analytical variation is extremely likely. Moreover, visual examination of a MALDI-TOF MS spectrum or pseudo-gel is labor-intensive. Analyzing complex proteomic data, such as that obtained by MALDI-TOF MS, by visual examination often is not precise, objective, or high-throughput. Thus, the results among the studies were discordant, limiting the clinical utility (Kostrzewa et al., 2013; Burckhardt and Zimmermann, 2018; Vrioni et al., 2018). To analyze MALDI-TOF MS spectra in a more objective and standard way, the use of computational methods is a promising approach.
Computational approaches can reduce failure frequency of preclinical diagnosis. Artificial intelligence (AI) uses computer software programs to evaluate, learn, and reveal data to predictively unravel treatment options by assimilating the advances in machine learning (ML) in a highly unified and mechanized way (Duch et al., 2007). From advancements in ML schemes, AI paradigms have stamped a new arena of clinical approach for antimicrobial resistance from a data-impelled computational process. Compared to conventional approaches, ML-facilitated approach, an offshoot of AI, does not rely on theoretical tenets, instead relies on big data. Typical algorithms synonymous with ML include: Logistic Regression (LR), Naive Bayesian Classification (NBC), k Nearest Neighbor (KNN), Multiple Linear Regression (MLR), Support Vector Machine (SVM), Probabilistic Neural Network (PNN), Binary Kernel Discrimination (BKD), Linear Discriminant Analysis (LDA), Random Forest (RF), Artificial Neural Network (ANN), Partial Least-Squares (PLS), Principal Component Analysis (PCA), and the virtual learning.
Conventional ML approaches engage manually made attributes, while the Deep Learning (DL) approaches, the paradigm of AI acquires inputs in an automated fashion, leading to reorganization of simple attributes into convoluted characteristics via multi-layer attribute extrication. The DL approaches exhibit less generalization errors than the conventional ML techniques, which facilitates more beneficial outputs on some criterion or competitive assessments (Sarkar, Das et al. 2023).
As an extensive field ML, overlays concepts from statistics, computer science and AI. The definitions and descriptions on ML in-depth explanations of ML are been discussed previously (Pasrija, Jha et al. 2022). ML within the AI framework has two main learning modes: supervised (also known as predictive) to make future predictions from training data, and unsupervised (descriptive), which is exploratory in nature without training data, defined target or output (Michalski, Carbonell et al. 2014). The use of AI in microbiology is grouped and explained in terms of four groups of algorithms for chromogenic detection, colony counting with growth, no growth discrimination, phenotypic colony recognition and application of expert rules.
This review describes the computational methods to extract valuable data from MALDI-TOF MS and advance its application further to strain typing and AST prediction.
Issues Regarding Reproducibility and Data Preprocessing Using Clinical Maldi-Tof MS Spectra
At the species-level identification, ribosomal proteins are well-represented by conserved peaks. Consequently, it is feasible to use MALDI-TOF for bacterial identification even without the standardization of experimental conditions (Croxatto et al., 2012). However, several factors affect the MALDI-TOF MS spectrum. Standardization of all the factors, such as type of culture media (Mather et al., 2016; Wang et al., 2019a), sample preparation (Croxatto et al., 2012), and culture conditions (Croxatto et al., 2012), should be considered when using MALDI-TOF MS in identifying sub-species characteristics or for AST prediction.
In a study focused on distinguishing vancomycin-susceptible S. aureus (VSSA) from vancomycin-intermediate S. aureus (VISA), Mather et al. identified a difference in the distinguishing power between sheep blood (tryptic soy agar with 5% sheep blood), Müller-Hinton, or brain heart infusion media (Mather et al., 2016). Species -level identification of Candida tropicalis was affected by using different types of culture media (Wang et al., 2019a). Even under ideal standardized laboratory conditions, intra-laboratory variability exists. The peak-level reproducibility for the 100 highest peaks from each spectrum was around 80% in E. coli ATCC 25922 and S. aureus ATCC 25923 (Croxatto et al., 2012).
MALDI-TOF MS data preprocessing is critical as the classification of strain typing or AST prediction is considered uncertain from the MALDI-TOF MS spectra. Recognition of representative patterns could address the reproducibility.
MALDI-TOF MS data preprocessing includes baseline subtraction (baseline correction), de-noising, peak detection, alignment, and intensity normalization. Specifically, baseline subtraction is used to rescale the plots to remove systematic artifacts produced by small clusters of matrix material. De-noising removes noise signals added to the true spectra from the matrix material and by sample contaminants (chemical noise) together with the noise caused by the physical characteristics of the machine (electrical noise). Alignment combines unusual groups of data, as same peaks may be present with small gaps between different biological samples as result of unavoidable inaccuracies in the spectrum. Peak detection is necessary for every method and is a key feature of preprocessing the data. It is necessary to detect each peak relying on the peak intensity and time of flight. Normalization of peak intensity facilitates a uniform format for the data analysis, as it corrects any systematic variation between different spectra.
Numerous studies have proposed a variety of methods for these preprocessing procedures, including baseline subtraction, peak detection, alignment of spectra, normalization, denoising, and deisotoping (Wong et al., 2005; Mantini et al., 2007; Barla et al., 2008; Wu et al., 2010; Gibb and Strimmer, 2012). Wong et al. used C++ to develop a graphical computational tool, SpecAlign, for the visualization and manipulation of multiple mass spectra datasets (Wong et al., 2005). It implements an algorithm that enables the complete alignment of each mass spectrum within a loaded dataset. It provides spectral processing tools including normalization by total spectrum signal, conversion to relative intensities, subtraction of baseline, scaling about the y-axis to enhance small peaks or to suppress noise, smoothing by the Savitzky—Golay filter, binning values about the x-axis, automatically picking peaks based on default or user-defined parameters, and finally spectral alignment. It renders spectral datasets suitable for statistical or machine learning analysis.
In case of Bruker Biotyper system, the FlexAnalysis was mainly adopted for implementing preprocessing. The MS data derived from FlexAnalysis is of high-quality, but the resulting peaks are not aligned within the dataset that requires a preprocessing for further analysis. The spectrum obtained from MALDI-TOF MS contains abundant biological information as well as a large amount of noise. Preprocessing aims to filter the noise and further identify the location of peaks and quantify their corresponding intensities (Wu et al., 2012). Computational methods for the detection of protein peaks from linear-mode MALDI-TOF data (LIMPIC) include MATLAB (Mantini et al., 2007) and a versatile R package (Gibb and Strimmer, 2012). No standard operation process for these preprocessing steps have been developed but denoising is an essential step.
The reproducibility of MS implies that it is necessary to determine the real signals obtained from the MALDI-TOF MS (Walker et al., 2002; van Hal and Paterson, 2011; Croxatto et al., 2012; Sandrin et al., 2013). Computational methods have also been proposed to overcome the issue of variability which cannot be quantified by replicating spectra (López Fernández et al., 2016; Wang et al., 2018b; Wang et al., 2018c; Wang et al., 2018d; Chung et al., 2019). Alignment technique is mainly adopted for variability in peaks, as a MALDI-TOF spectrum peak may not be recorded at exactly the same m/z even in multiple replications. The m/z of peaks would drift or shift within an error window (Figure 1).
Several methods, such as density clustering (Figure 2) (Wang et al., 2018b; Wang et al., 2018c), have been proposed to address the peak drifting problem and estimate the error windows for the peaks. The optimal value of the error window differs for different microorganisms, but the values are approximately ±5 m/z in S. aureus and S. haemolyticus strain typing (Mather et al., 2016; Wang et al., 2018c; Chung et al., 2019). When the MS spectra are adequately preprocessed into a structured data format, AI or ML algorithms can recognize the representative pattern but not the several single peaks for specific strains from the MALDI-TOF MS spectra.
As analytical method ML discovers the implicit data patterns from complex data and solves classification difficulties (Witten et al., 2016). It outperforms traditional statistical methods with an excellent ability to handle complex interactions between large amounts of predictors and good performance in non-linear classification hitches (Lo-Ciganic et al., 2019) and has been successfully applied in clinical fields (Wang et al., 2016b; Lin et al., 2018; Wang et al., 2018a; Tseng et al., 2019; Wang et al., 2019b).
Clinically, for the antimicrobial resistance prediction approaches based on MS, Database of ResIstance against Antimicrobials with MALDI-TOF Mass Spectrometry (DRIAMS) has been developed. It is a large-scale, high quality collection of bacterial and fungal MALDI-TOF mass spectra from clinical isolates that are coupled with respective laboratory-confirmed antibiotic resistance profile.(Weis, Cuénod et al. 2021). DRIAMS increased the resistance profiling performance and good predictability.
MALDI-TOF based ML demonstrated accurate predictions clinically (Weis et al., 2022), as the spectra reproduced by individual mass peaks retain full accuracy in m/z and intensity values. As ML are non-applicable to the spectral representation of varying length. However, a new kernel has been specifically developed for MALDI-TOF mass peak input- PIKE, the Peak Information Kernel combined with a Gaussian Process classifier. Using agglomerative hierarchical clustering and incorporating into the antimicrobial resistance prediction, classification performance was improved for ciprofloxacin resistance in Escherichia coli and amoxicillin-clavulanic acid resistant Staphylococcus aureus. A novel kernel method based on diffusion processes outperformed the prevailing methods (Weis, Horn et al. 2020).
A kernel is a function that quantifies the similarity of objects by evaluating the inner product in a reproducing kernel Hilbert space (RKHS) (Schölkopf and Smola 2018) and the most expressive and versatile method in the computational biology (2004). Few kernels exploit information in mass spectrometry data as designed for metabolomics (Zhan, Patterson et al. 2015). Kernels have been designed to compare spectra requiring additional information like the molecule’s mass spectrometry fragmentation process (Brouard, Shen et al. 2016).
Thus, a ML algorithm is especially appropriate for analyzing complex data, such as MALDI-TOF spectra.
Analyzing Maldi-Tof MS Spectra for Strain Typing or Ast Prediction with and without Computational Methods
Sub -species identification or AST prediction using representative biomarkers in whole-cell MALDI-TOF MS spectra have been reported (Lu et al., 2012; Chen et al., 2018; Lin et al., 2019; Liu et al., 2019) without applying an intensive computational aid. Whole-cell MALDI-TOF MS is advantageous as it requires no additional incubation time and additional agents for strain typing. Sub-species identification or AST prediction is obtained by analyzing the existing MALDI-TOF MS spectra generated during the clinical routine. The m/z value of 6251 plays a role in the emergence of an ST1 clone, serotype VI Group B Streptococcus (GBS) (Lin et al., 2019), whereas m/z values of 5005.7, 5033.99, 6440.5, 6526.4, and 6635.9 may be a biomarker to distinguish Staphylococcus species, S. aureus and S. argenteus. For detection of heterogeneous VISA (hVISA), m/z values of 1835.0 and 1863.0 as proteolytic products of the acyl carrier protein may be employed (Lu et al). Thus, studies have recognized the potential of using whole-cell MALDI-TOF MS spectra in strain typing or AST prediction.
Discordances prevailed when computational methods were used for analyzing the MALDI-TOF MS spectra. For example, m/z peaks of 1835.0 and 1863.0 were found as biomarkers for hVISA (Lu et al., 2012), but neither of these peaks were informative peaks for hVISA using computational methods (Asakura et al., 2018; Wang et al., 2018b). In case of GBS strain typing, m/z value of 6251 is an informative peak for sequence type I with (Wang et al., 2019c) and without computational methods (Lin et al., 2019). However, many informative peaks were identified only in the study using computational methods (Wang et al., 2019c).
Many factors can contribute to the discordance between the studies performed with and without using computational methods. First, visual examination is used for identifying the representative peaks in studies not using computational methods. The intensity of the peaks is used as important information for selecting the representative peaks. In this case, the distribution of the peaks with high intensity is examined while peaks with low intensity are dismissed. Thus, the peaks with low intensity are rarely selected as the discriminative peaks, even when these peaks are present predominantly in one class and absent in other classes. In addition, given the high variability of peak intensity obtained by MALDI-TOF MS, using peak intensity for identifying discriminative peaks could be misleading. Additionally, under visual examination, the error windows for peak alignment is quite different among different analyzers. The intrinsic problem of peak drifting/shifting cannot be determined accurately, and the presence or absence of specific peaks could be subjective and operator-dependent.
Second, the discordance is attributed to different statistical methods. In the studies not using computational methods, discriminative peaks are obtained by analyzing whole cases in the dataset. In contrast, restricting feature engineering may be used for detecting discriminative peaks. A nested cross-validation method is used for non-biased detection of discriminative peaks and validation of a classification model (Wang et al., 2018b). In this approach, whole cases were divided iteratively into training and testing datasets (Figure 3). The discriminative peaks were detected in the training dataset, and the importance was validated independently in the testing dataset. The importance of the discriminative peaks would be presented as a distribution curve, and an unbiased evaluation of their importance in distinguishing different classes is possible (Figure 4). Finally, different epidemiological factors between these studies and intra-laboratory variation are also major contributors to discordance.
Detection of antimicrobial resistance (AMR) is time-consuming and tedious process however ML methods are efficacious in predicting AMR in a variety of bacterial strains(Liu, Deng et al. 2020). The ML algorithms can also identify the various mechanisms underlying antimicrobial resistance, such as efflux pumps, target modifications, and enzymatic inactivation, and predict resistance in bacterial strains. After being trained on whole-genome sequencing, a number of ML algorithms, including support vector machines (SVM), logistic regression models (LR), and random forests (RF), have been shown to demonstrate excellent accuracy for predicting AMR (Liu, Deng et al. 2020). Deep learning algorithms’ effectiveness in predicting new antibiotics, AMR genes, and AMR peptides has also recently been proven (Stokes, Yang et al. 2020).
Deep learning approaches have addressed AMR through combinations of antibiotics and non-antibiotic compounds(Tyers and Wright 2019). The most commonly used algorithms in AMR prediction are Bayesian hyperparameter optimization, quantitative structure–activity relationships (QSAR), and support vector machines (SVM) and logistic regression models. The ML algorithms, include decision support systems, random forest, rapid detection, decision trees high-throughput screening, and multivariate analysis(Macesic, Walk et al. 2020, Melo, Maasch et al. 2021, Wang, Zhao et al. 2022, Yasir, Karim et al. 2022). The growth of the ML mechanism, through the use of deep learning models such as artificial neural networks, has advanced machine learning-driven AMR research (Popa, Pop et al. 2022). Current methods include automated antibiotic discovery, logistic regression models, and k-means clustering (Barlandas-Quintana and Martinez-Ledesma 2020, ValizadehAslani, Zhao et al. 2020, Marini, Oliva et al. 2022). These algorithms train the ML system to identify unique features and resolve the complicated network, enabling computer-aided drug design in the field of AMR..
Trained by Real-World Data and Applied to Real-World Workflow
Successful bacterial strain typing has been reported with whole cell MALDI-TOF MS approach, such as for S. aureus (Wang, Chung et al. 2021)(Wang et al., 2018c; Wang et al., 2018d), S. haemolyticus (Chung et al., 2019), GBS (Wang et al., 2019c), and Escherichia coli (Christner et al., 2017). A rapid AST using ML-aided analysis of MALDI-TOF MS spectra, distinguishes methicillin-resistant S. aureus (MRSA) from methicillin-susceptible S. aureus (MSSA) (Tang et al., 2019), as well vancomycin-resistant Enterococcus faecium (VREfm) from vancomycin-susceptible E. faecium (VSEfm) (Griffin et al., 2012). Based on this, generalization of the ML models could be the next option. The generalization of ML based analysis of MALDI-TOF spectra for a rapid AST are limited as the case number were insufficient (Griffin et al., 2012; Nakano et al., 2014; Huang et al., 2017). Further difference in microbiological composition on the basis of site restricts the development of ML model (i.e., one-size fits all) (Oh et al., 2018).
Epidemiological differences among pathogens can be generalized. The workflow of applying ML can also be generalized but the discriminative peaks identified cannot be generalized (Oh et al., 2018). In the process of building a robust ML model, standard procedures include straining, validating, and testing. K-fold cross validation is a common method of validating an ML model. In the approach of five-fold cross validation, for example, the data are iteratively validated five times. Specifically, for each validation iteration, the cases are randomly allocated to five sets, in which four sets are used for the training model and the remaining one set is used as the independent/unseen data set to evaluate the performance of the ML models (Wang et al., 2018b).
With validation the performance of ML models can be estimated. Ideally, independent data obtained from another institute is tested for generalization of an ML model. However, the necessity of using an independent dataset from a different institute is questionable because of the epidemiological diversity of pathogens. A good ML model may not perform well using an independent testing dataset obtained from another institute and the same is not true for ML-aided analysis of the MALDI-TOF MS spectra in predicting AST or strain typing. It is suggested that one can train and establish his/her own classification model based on the locally relevant data by using a generalizable approach. An area-specific or even institute-specific ML model capable of facilitating more rapid and accurate detection of an AST or strain typing in the real world is valuable for better management of infectious diseases or infection control. Under this scheme, a team from Chang Gung Memorial Hospital, Taiwan has developed, validated, and tested MALDI-TOF ML models for rapid detection of MRSA and VREfm by using tens of thousands of real world routine datasets collected in Taiwan (Wang, Liu et al. 2022).
As an applicable tool, the MALDI-TOF ML models ideally should be integrated into the existing workflow in the current clinical microbiology laboratory. The whole process includes raw data input, raw data transformation, peak alignment, analysis by ML model, and prediction results output. The processes of raw data transformation, peak alignment, and analysis by the ML model is integrated as an “analytical core” that is convenient when automated. Typically, processes of peak alignment and analysis by ML model are integrated in a function script developed by a local developer. The process of raw data transformation is relatively difficult using either Bruker Biotyper or VITEK MS.
Using Bruker Biotyper, the MALDI-TOF analytical raw data is transferred into an analyzable structured data format with a built-in function of the FlexAnalysis software. The transformation process of raw data is not automated, and the analyzer utilizes the user interface of FlexAnalysis to conduct the process of raw data transformation. Alternatively, in MALDIquant, a package of R, transforms raw data of the MALDI-TOF MS spectra into analyzable structured data (Gibb and Strimmer, 2012) that can be easily controlled and linked with the transformed data for the subsequent processes of peak alignment and analysis by the ML model. Using this scheme, clinical microbiologists can just upload the raw data of the MALDI-TOF MS spectra onto a web-based analytical tool (e.g., http://140.138.77.239/~Joy105/gbs_web/) and obtain the results of strain typing or AST prediction. Furthermore, linkage between the analytical core and the laboratory information system can be optimized by automating the processes of raw data input and prediction results output. Clinical microbiologists are able to perform strain typing or the AST as smoothly as species identification (Figure 5).
Summary
The application of whole-cell MALDI-TOF MS from bacterial species identification to strain typing or AST prediction is promising when spectral variation issues are resolved. In addition to standardizing the conditions of the analytical phase of the MALDI-TOF MS measurement, computational methods reduce the effects of the peak drifting/shifting phenomenon noted in MS spectra such that the MALDI-TOF MS spectra can be standardized to a structured data format. On this basis, ML technologies and unbiased validation methods can be applied to create strain typing/AST predictive models and detect important peaks. Currently, AI-aided whole-cell MALDI-TOF analysis has been successfully used in several studies of strain typing or AST prediction. For further applications in a clinical microbiology laboratory, integrating the AI analytical core with the existing workflow is essential. A robust ML model can be trained and validated using locally relevant data and a generalizable approach to meet the needs of rapid strain typing or AST prediction in the clinic.
References
- (2004). Kernel Methods in Computational Biology, The MIT Press.
- Asakura, K.; Azechi, T.; Sasano, H.; Matsui, H.; Hanaki, H.; Miyazaki, M.; et al. (2018).
- Rapid and easy detection of low-level resistance to vancomycin in methicillin-resistant Staphylococcus aureus by matrix-assisted laser desorption ionization time-of-flight mass spectrometry. PLoS ONE 2018, 13, e0194212. [CrossRef]
- Barla, A.; Jurman, G.; Riccadonna, S.; Merler, S.; Chierici, M.; Furlanello, C. Machine learning methods for predictive proteomics. Brief. Bioinform. 2008, 9, 119–128. [Google Scholar] [CrossRef] [PubMed]
- Barlandas-Quintana, E. A. and J. E. Martinez-Ledesma (2020). Detection of Carbapenems Resistant K-mer Sequences in Bacteria of Critical Priority by the World Health Organization (Pseudomonas aeruginosa and Acinetobacter baumannii). 2020 7th International Conference on Internet of Things: Systems, Management and Security (IOTSMS).
- Brouard, C.; H. Shen, K. Dührkop, F. d’Alché-Buc, S. Böcker and J. Rousu Fast metabolite identification with Input Output Kernel Regression. Bioinformatics 2016, 32, i28–i36. [CrossRef]
- Burckhardt, I.; Zimmermann, S. Susceptibility sesting of bacteria using MALDI-TOF mass spectrometry. Front. Microbiol. 2018, 9, 1744. [Google Scholar] [CrossRef]
- Camoez, M.; Sierra, J.M.; Dominguez, M.A.; Ferrer-Navarro, M.; Vila, J.; Roca, I. Automated categorization of methicillin-resistant Staphylococcus aureus clinical isolates into different clonal complexes by MALDI-TOF mass spectrometry. Clin. Microbiol. Infect. 2016, 22, 161.e1–161.e7. [Google Scholar] [CrossRef] [PubMed]
- Chao, Q.T.; Lee, T.F.; Teng, S.H.; Peng, L.Y.; Chen, P.H.; Teng, L.J.; et al. Comparison of the accuracy of two conventional phenotypic methods and two MALDI-TOF MS systems with that of DNA sequencing analysis for correctly identifying clinically encountered yeasts. PLoS ONE 2014, 9, e109376. [Google Scholar] [CrossRef]
- Chen, S.Y.; Lee, H.; Teng, S.H.; Wang, X.M.; Lee, T.F.; Huang, Y.C.; et al. Accurate differentiation of novel Staphylococcus argenteus from Staphylococcus aureus using MALDI-TOF MS. Future Microbiol. 2018, 13, 997–1006. [Google Scholar] [CrossRef]
- Chen, Y.S.; Liu, Y.H.; Teng, S.H.; Liao, C.H.; Hung, C.C.; Sheng, W.H.; et al. Evaluation of the matrix-assisted laser desorption/ionization time-of-flight mass spectrometry Bruker Biotyper for identification of Penicillium marneffei, Paecilomyces species, Fusarium solani, Rhizopus species, and Pseudallescheria boydii. Front. Microbiol. 2015, 6, 679. [Google Scholar] [CrossRef]
- Cheng, W.C.; Jan, I.S.; Chen, J.M.; Teng, S.H.; Teng, L.J.; Sheng, W.H.; et al. Evaluation of the Bruker Biotyper matrix-assisted laser desorption ionization-time of flight mass spectrometry system for identification of blood isolates of Vibrio species. J. Clin. Microbiol. 2015, 53, 1741–1744. [Google Scholar] [CrossRef]
- Chien, J.Y.; Yu, C.J.; Hsueh, P.R. Identification of nontuberculous mycobacteria in MGIT by matrix-assisted laser desorption/ionization mass spectrometry. Future Microbiol. 2016, 11, 1025–1033. [Google Scholar] [CrossRef]
- Christner, M.; Dressler, D.; Andrian, M.; Reule, C.; Petrini, O. Identification of Shiga-toxigenic Escherichia coli outbreak isolates by a novel data analysis tool after matrix-assisted laser desorption/ionization time-of-flight mass spectrometry. PLoS ONE 2017, 12, e0182962. [Google Scholar] [CrossRef]
- Chung, C.R.; Wang, H.Y.; Lien, F.; Tseng, Y.J.; Chen, C.H.; Lee, T.Y.; et al. Incorporating statistical test and machine intelligence into strain typing of Staphylococcus haemolyticus based on matrix-assisted laser desorption ionization-time of flight mass spectrometry. Front. Microbiol. 2019, 10, 2120. [Google Scholar] [CrossRef]
- Cox, C.R.; Jensen, K.R.; Saichek, N.R.; Voorhees, K.J. Strain-level bacterial identification by CeO2-catalyzed MALDI-TOF MS fatty acid analysis and comparison to commercial protein-based methods. Sci. Rep. 2015, 5, 10470. [Google Scholar] [CrossRef]
- Croxatto, A.; Prod’hom, G.; Greub, G. Applications of MALDI-TOF mass spectrometry in clinical diagnostic microbiology. FEMS Microbiol. Rev. 2012, 36, 380–407. [Google Scholar] [CrossRef] [PubMed]
- Duch, W.; Swaminathan, K.; Meller, J. Artificial Intelligence Approaches for Rational Drug Design and Discovery. Curr. Pharm. Des. 2007, 13, 1497–1508. [Google Scholar] [CrossRef] [PubMed]
- Ge, M.C.; Kuo, A.J.; Liu, K.L.; Wen, Y.H.; Chia, J.H.; Chang, P.Y.; et al. Routine identification of microorganisms by matrix-assisted laser desorption ionization time-of-flight mass spectrometry: Success rate, economic analysis, and clinical outcome. J. Microbiol. Immunol. Infect. 2017, 50, 662–668. [Google Scholar] [CrossRef]
- Gibb, S.; Strimmer, K. MALDIquant: A versatile R package for the analysis of mass spectrometry data. Bioinformatics 2012, 28, 2270–2271. [Google Scholar] [CrossRef]
- Griffin, P.M.; Price, G.R.; Schooneveldt, J.M.; Schlebusch, S.; Tilse, M.H.; Urbanski, T.; et al. Use of matrix-assisted laser desorption ionization-time of flight mass spectrometry to identify vancomycin-resistant enterococci and investigate the epidemiology of an outbreak. J. Clin. Microbiol. 2012, 50, 2918–2931. [Google Scholar] [CrossRef]
- Hsueh, P.R.; Kuo, L.C.; Chang, T.C.; Lee, T.F.; Teng, S.H.; Chuang, Y.C.; et al. Evaluation of the Bruker Biotyper matrix-assisted laser desorption ionization-time of flight mass spectrometry system for identification of blood isolates of Acinetobacter species. J. Clin. Microbiol. 2014, 52, 3095–3100. [Google Scholar] [CrossRef]
- Hsueh, P.R.; Lee, T.F.; Du, S.H.; Teng, S.H.; Liao, C.H.; Sheng, W.H.; et al. Bruker biotyper matrix-assisted laser desorption ionization-time of flight mass spectrometry system for identification of Nocardia, Rhodococcus, Kocuria, Gordonia, Tsukamurella, and Listeria species. J. Clin. Microbiol. 2014, 52, 2371–2379. [Google Scholar] [CrossRef] [PubMed]
- Huang, T.S.; Lee, S.S.; Lee, C.C.; Chen, C.Y.; Chen, F.C.; Chen, B.C.; et al. Evaluation of a matrix-assisted laser desorption ionization-time of flight mass spectrometry assisted, selective broth method to screen for vancomycin-resistant enterococci in patients at high risk. PLoS ONE 2017, 12, e0179455. [Google Scholar] [CrossRef]
- Josten, M.; Reif, M.; Szekat, C.; Al-Sabti, N.; Roemer, T.; Sparbier, K.; et al. Analysis of the matrix-assisted laser desorption ionization-time of flight mass spectrum of Staphylococcus aureus identifies mutations that allow differentiation of the main clonal lineages. J. Clin. Microbiol. 2013, 51, 1809–1817. [Google Scholar] [CrossRef]
- Kostrzewa, M.; Sparbier, K.; Maier, T.; Schubert, S. MALDI-TOF MS: An upcoming tool for rapid detection of antibiotic resistance in microorganisms. Proteom. Clin. Appl. 2013, 7, 767–778. [Google Scholar] [CrossRef]
- Lasch, P.; Fleige, C.; Stammler, M.; Layer, F.; Nubel, U.; Witte, W.; et al. Insufficient discriminatory power of MALDI-TOF mass spectrometry for typing of Enterococcus faecium and Staphylococcus aureus isolates. J. Microbiol. Methods 2014, 100, 58–69. [Google Scholar] [CrossRef]
- Lee, M.R.; Tsai, C.J.; Teng, S.H.; Hsueh, P.R. Identification of Weissella species by matrix-assisted laser desorption/ionization time-of-flight mass spectrometry. Front. Microbiol. 2015, 6, 1246. [Google Scholar] [CrossRef]
- Lee, T.F.; Lee, H.; Chen, C.M.; Du, S.H.; Cheng, Y.C.; Hsu, C.C.; et al. Comparison of the accuracy of matrix-assisted laser desorption ionization-time of flight mass spectrometry with that of other commercial identification systems for identifying Staphylococcus saprophyticus in urine. J. Clin. Microbiol. 2013, 51, 1563–1566. [Google Scholar] [CrossRef] [PubMed]
- Li, Y.; Wang, H.; Zhao, Y.P.; Xu, Y.C.; Hsueh, P.R. Evaluation of the bruker biotyper matrix-assisted laser desorption/ionization time-of-flight mass spectrometry system for identification of Aspergillus species directly from growth on solid agar media. Front. Microbiol. 2017, 8, 1209. [Google Scholar] [CrossRef]
- Lin, C.S.; Su, C.C.; Hsieh, S.C.; Lu, C.C.; Wu, T.L.; Jia, J.H.; et al. Rapid identification of Mycobacterium avium clinical isolates by matrix-assisted laser desorption/ionization time-of-flight mass spectrometry. J. Microbiol. Immunol. Infect. 2015, 48, 205–212. [Google Scholar] [CrossRef] [PubMed]
- Lin, H.C.; Lu, J.J.; Lin, L.C.; Ho, C.M.; Hwang, K.P.; Liu, Y.C.; et al. Identification of a proteomic biomarker associated with invasive ST1, serotype VI Group B Streptococcus by MALDI-TOF MS. J. Microbiol. Immunol. Infect. 2019, 52, 81–89. [Google Scholar] [CrossRef]
- Lin, W.Y.; Chen, C.H.; Tseng, Y.J.; Tsai, Y.T.; Chang, C.Y.; Wang, H.Y.; et al. Predicting post-stroke activities of daily living through a machine learning-based approach on initiating rehabilitation. Int. J. Med. Inform. 2018, 111, 159–164. [Google Scholar] [CrossRef]
- Liu, Y.H.; Yamazaki, W.; Huang, Y.T.; Liao, C.H.; Sheng, W.H.; Hsueh, P.R. Clinical and microbiological characteristics of patients with bacteremia caused by Campylobacter species with an emphasis on the subspecies of C. fetus. J. Microbiol. Immunol. Infect. 2019, 52, 122–131. [Google Scholar] [CrossRef] [PubMed]
- Liu, Z.; D. Deng, H. Lu, J. Sun, L. Lv, S. Li, G. Peng, X. Ma, J. Li, Z. Li, T. Rong and G. Wang Evaluation of Machine Learning Models for Predicting Antimicrobial Resistance of Actinobacillus pleuropneumoniae From Whole Genome Sequences. Front Microbiol 2020, 11, 48. [CrossRef]
- Lo-Ciganic, W.H.; Huang, J.L.; Zhang, H.H.; Weiss, J.C.; Wu, Y.; Kwoh, C.K.; et al. Evaluation of machine-learning algorithms for predicting opioid overdose risk among medicare beneficiaries with opioid prescriptions. JAMA Netw Open 2019, 2, e190968. [Google Scholar] [CrossRef] [PubMed]
- López Fernández, H.; Reboiro-Jato, M.; Pérez Rodríguez, J.A.; Fdez-Riverola, F.; Glez-Peña, D. Implementing effective machine learning-based workflows for the analysis of mass spectrometry data. J. Integr. OMICS 2016, 6. [Google Scholar] [CrossRef]
- Lopez-Fernandez, H.; Santos, H.M.; Capelo, J.L.; Fdez-Riverola, F.; Glez-Pena, D.; Reboiro-Jato, M. Mass-Up: An all-in-one open software application for MALDI-TOF mass spectrometry knowledge discovery. BMC Bioinform. 2015, 16, 318. [Google Scholar] [CrossRef]
- Lu, J.J.; Tsai, F.J.; Ho, C.M.; Liu, Y.C.; Chen, C.J. Peptide biomarker discovery for identification of methicillin-resistant and vancomycin-intermediate Staphylococcus aureus strains by MALDI-TOF. Anal. Chem. 2012, 84, 5685–5692. [Google Scholar] [CrossRef] [PubMed]
- Macesic, N.; O. J. B. D. t. Walk, I. Pe’er, N. P. Tatonetti, A. Y. Peleg and A.-C. Uhlemann Predicting Phenotypic Polymyxin Resistance in Klebsiella pneumoniae through Machine Learning Analysis of Genomic Data. mSystems 2020, 5. [CrossRef]
- Mantini, D.; Petrucci, F.; Pieragostino, D.; Del Boccio, P.; Di Nicola, M.; Di Ilio, C.; et al. LIMPIC: A computational method for the separation of protein MALDI-TOF-MS signals from noise. BMC Bioinform. 2007, 8, 101. [Google Scholar] [CrossRef]
- Marini, S.; M. Oliva, I. B. Slizovskiy, R. A. Das, N. R. Noyes, T. Kahveci, C. Boucher and M. Prosperi AMR-meta: A k-mer and metafeature approach to classify antimicrobial resistance from high-throughput short-read metagenomics data. GigaScience 2022, 11. [CrossRef]
- Mather, C.A.; Werth, B.J.; Sivagnanam, S.; SenGupta, D.J.; Butler-Wu, S.M. Rapid detection of vancomycin intermediate Staphylococcus aureus (VISA) by matrix assisted laser desorption ionization time-of-flight mass spectrometry (MALDI-TOF MS). J. Clin. Microbiol. 2016, 54, 883–890. [Google Scholar] [CrossRef]
- Melo, M. C. R.; J. R. M. A. Maasch and C. de la Fuente-Nunez Accelerating antibiotic discovery through artificial intelligence. Commun. Biol. 2021, 4, 1050. [Google Scholar] [CrossRef]
- Michalski, R. S.; J. G. Carbonell and T. M. Mitchell (2014). Machine Learning: An Artificial Intelligence Approach (Volume I), Elsevier Science.
- Nakano, S.; Matsumura, Y.; Kato, K.; Yunoki, T.; Hotta, G.; Noguchi, T.; et al. Differentiation of vanA-positive Enterococcus faecium from vanA-negative E. faecium by matrix-assisted laser desorption/ionisation time-of-flight mass spectrometry. Int. J. Antimicrob. Agents 2014, 44, 256–259. [Google Scholar] [CrossRef]
- Nomura, F. Proteome-based bacterial identification using matrix-assisted laser desorption ionization-time of flight mass spectrometry (MALDI-TOF MS): A revolutionary shift in clinical diagnostic microbiology. Biochim. Biophys. Acta 2015, 1854, 528–537. [Google Scholar] [CrossRef]
- O’Driscoll, T.; Crank, C.W. Vancomycin-resistant enterococcal infections: Epidemiology, clinical manifestations, and optimal management. Infect. Drug Resist. 2015, 8, 217–230. [Google Scholar] [CrossRef]
- Oh, J.; Makar, M.; Fusco, C.; McCaffrey, R.; Rao, K.; Ryan, E.E.; et al. A generalizable, data-driven approach to predict daily risk of Clostridium difficile infection at two large academic health centers. Infect. Control Hosp. Epidemiol. 2018, 39, 425–433. [Google Scholar] [CrossRef]
- Pasrija, P.; P. Jha, P. Upadhyaya, M. S. Khan and M. Chopra Machine Learning and Artificial Intelligence: A Paradigm Shift in Big Data-Driven Drug Design and Discovery. Curr Top Med Chem 2022, 22, 1692–1727. [CrossRef]
- Patel, R. MALDI-TOF MS for the diagnosis of infectious diseases. Clin. Chem. 2015, 61, 100–111. [Google Scholar] [CrossRef] [PubMed]
- Popa, S. L.; C. Pop, M. O. Dita, V. D. Brata, R. Bolchis, Z. Czako, M. M. Saadani, A. Ismaiel, D. I. Dumitrascu, S. Grad, L. David, G. Cismaru and A. M. Padureanu Deep Learning and Antibiotic Resistance. Antibiotics 2022, 11, 1674. [CrossRef]
- Sandrin, T.R.; Goldstein, J.E.; Schumaker, S. MALDI TOF MS profiling of bacteria at the strain level: A review. Mass Spectrom. Rev. 2013, 32, 188–217. [Google Scholar] [CrossRef] [PubMed]
- Sarkar, C.; B. Das, V. S. Rawat, J. B. Wahlang, A. Nongpiur, I. Tiewsoh, N. M. Lyngdoh, D. Das, M. Bidarolli and H. T. Sony Artificial Intelligence and Machine Learning Technology Driven Modern Drug Discovery and Development. Int J Mol Sci 2023, 24, 2026. [CrossRef]
- Schölkopf, B. and A. J. Smola (2018). Learning with Kernels: Support Vector Machines, Regularization, Optimization, and Beyond, The MIT Press.
- Stokes, J. M., Yang, K., Swanson, K., Jin, W., Cubillos-Ruiz, A., Donghia, N. M., Collins, J. J. A deep learning approach to antibiotic discovery. Cell 2020, 180, 688–702.e613. [CrossRef]
- Su, T.Y.; Lee, M.H.; Huang, C.T.; Liu, T.P.; Lu, J.J. The clinical impact of patients with bloodstream infection with different groups of viridans group streptococci by using matrix-assisted laser desorption ionization-time of flight mass spectrometry (MALDI-TOF MS). Medicine 2018, 97, e13607. [Google Scholar] [CrossRef] [PubMed]
- Tang, W.; Ranganathan, N.; Shahrezaei, V.; Larrouy-Maumus, G. MALDI-TOF mass spectrometry on intact bacteria combined with a refined analysis framework allows accurate classification of MSSA and MRSA. PLoS ONE 2019, 14, e0218951. [Google Scholar] [CrossRef] [PubMed]
- Tseng, Y.J.; Huang, C.E.; Wen, C.N.; Lai, P.Y.; Wu, M.H.; Sun, Y.C.; et al. Predicting breast cancer metastasis by using serum biomarkers and clinicopathological data with machine learning technologies. Int. J. Med. Inform. 2019, 128, 79–86. [Google Scholar] [CrossRef]
- Tyers, M. and G. D. Wright Drug combinations: A strategy to extend the life of antibiotics in the 21st century. Nat. Rev. Microbiol. 2019, 17, 141–155. [Google Scholar] [CrossRef] [PubMed]
- ValizadehAslani, T.; Z. Zhao, B. A. Sokhansanj and G. L. Rosen Amino Acid k-mer Feature Extraction for Quantitative Antimicrobial Resistance (AMR) Prediction by Machine Learning and Model Interpretation for Biological Insights. Biology 2020, 9, 365. [CrossRef]
- van Hal, S.J.; Paterson, D.L. Systematic review and meta-analysis of the significance of heterogeneous vancomycin-intermediate Staphylococcus aureus isolates. Antimicrob. Agents Chemother. 2011, 55, 405–410. [Google Scholar] [CrossRef] [PubMed]
- Vrioni, G.; Tsiamis, C.; Oikonomidis, G.; Theodoridou, K.; Kapsimali, V.; Tsakris, A. MALDI-TOF mass spectrometry technology for detecting biomarkers of antimicrobial resistance: Current achievements and future perspectives. Ann. Transl. Med. 2018, 6, 240. [Google Scholar] [CrossRef]
- Walker, J.; Fox, A.J.; Edwards-Jones, V.; Gordon, D.B. Intact cell mass spectrometry (ICMS) used to type methicillin-resistant Staphylococcus aureus: Media effects and inter-laboratory reproducibility. J. Microbiol. Methods 2002, 48, 117–126. [Google Scholar] [CrossRef]
- Wang, H. Y.; C. R. Chung, Z. Wang, S. Li, B. Y. Chu, J. T. Horng, J. J. Lu and T. Y. Lee A large-scale investigation and identification of methicillin-resistant Staphylococcus aureus based on peaks binning of matrix-assisted laser desorption ionization-time of flight MS spectra. Brief Bioinform 2021, 22. [CrossRef]
- Wang, H.; Chen, Y.L.; Teng, S.H.; Xu, Z.P.; Xu, Y.C.; Hsueh, P.R. Evaluation of the Bruker Biotyper matrix-assisted laser desorption/ionization time-of-flight mass spectrometry system for identification of clinical and environmental isolates of Burkholderia pseudomallei. Front. Microbiol. 2016, 7, 415. [Google Scholar] [CrossRef]
- Wang, H.; Li, Y.; Fan, X.; Chiueh, T.S.; Xu, Y.C.; Hsueh, P.R. Evaluation of Bruker Biotyper and Vitek MS for the identification of Candida tropicalis on different solid culture media. J. Microbiol. Immunol. Infect. 2019, 52, 604–611. [Google Scholar] [CrossRef]
- Wang, H.Y.; Chang, S.C.; Lin, W.Y.; Chen, C.H.; Chiang, S.H.; Huang, K.Y.; et al. Machine learning-based method for obesity risk evaluation using single-nucleotide polymorphisms derived from next-generation sequencing. J. Comput. Biol. 2018, 25, 1347–1360. [Google Scholar] [CrossRef]
- Wang, H.Y.; Chen, C.H.; Lee, T.Y.; Horng, J.T.; Liu, T.P.; Tseng, Y.J.; et al. Rapid detection of heterogeneous vancomycin-intermediate Staphylococcus aureus based on matrix-assisted laser desorption ionization time-of-flight: Using a machine learning approach and unbiased validation. Front. Microbiol. 2018, 9, 2393. [Google Scholar] [CrossRef] [PubMed]
- Wang, H.Y.; Hsieh, C.H.; Wen, C.N.; Wen, Y.H.; Chen, C.H.; Lu, J.J. Cancers screening in an asymptomatic population by using multiple tumour markers. PLoS ONE 2016, 11, e0158285. [Google Scholar] [CrossRef] [PubMed]
- Wang, H.Y.; Hung, C.C.; Chen, C.H.; Lee, T.Y.; Huang, K.Y.; Ning, H.C.; et al. Increase Trichomonas vaginalis detection based on urine routine analysis through a machine learning approach. Sci. Rep. 2019, 9, 11074. [Google Scholar] [CrossRef]
- Wang, H.Y.; Lee, T.Y.; Tseng, Y.J.; Liu, T.P.; Huang, K.Y.; Chang, Y.T.; et al. A new scheme for strain typing of methicillin-resistant Staphylococcus aureus on the basis of matrix-assisted laser desorption ionization time-of-flight mass spectrometry by using machine learning approach. PLoS ONE 2018, 13, e0194289. [Google Scholar] [CrossRef] [PubMed]
- Wang, H.Y.; Li, W.C.; Huang, K.Y.; Chung, C.R.; Horng, J.T.; Hsu, J.F.; et al. Rapid classification of group B Streptococcus serotypes based on matrix-assisted laser desorption ionization-time of flight mass spectrometry and machine learning techniques. BMC Bioinform. 2019. [Google Scholar] [CrossRef]
- Wang, H.Y.; Lien, F.; Liu, T.P.; Chen, C.H.; Chen, C.J.; Lu, J.J. Application of a MALDI-TOF analysis platform (ClinProTools) for rapid and preliminary report of MRSA sequence types in Taiwan. PeerJ 2018, 6, e5784. [Google Scholar] [CrossRef]
- Wang, H.-Y.; Y.-H. Liu, Y.-J. Tseng, C.-R. Chung, T.-W. Lin, J.-R. Yu, Y.-C. Huang and J.-J. Lu Investigating Unfavorable Factors That Impede MALDI-TOF-Based AI in Predicting Antibiotic Resistance. Diagnostics 2022, 12, 413. [CrossRef]
- Wang, S.; C. Zhao, Y. Yin, F. Chen, H. Chen and H. Wang A Practical Approach for Predicting Antimicrobial Phenotype Resistance in Staphylococcus aureus Through Machine Learning Analysis of Genome Data. Front. Microbiol. 2022, 13, 841289. [CrossRef]
- Wang, Y.; Chen, X.F.; Xie, X.L.; Xiao, M.; Yang, Y.; Zhang, G.; et al. Evaluation of VITEK MS, Clin-ToF-II MS, Autof MS 1000 and VITEK 2 ANC card for identification of Bacteroides fragilis group isolates and antimicrobial susceptibilities of these isolates in a Chinese university hospital. J. Microbiol. Immunol. Infect. 2019, 52, 456–464. [Google Scholar] [CrossRef] [PubMed]
- Weis, C.; A. Cuénod, B. Rieck, F. Llinares-López, O. Dubuis, S. Graf, C. Lang, M. Oberle, M. Brackmann, K. K. Søgaard, M. Osthoff, K. Borgwardt and A. Egli (2021). Direct Antimicrobial Resistance Prediction from clinical MALDI-TOF mass spectra using Machine Learning. bioRxiv: 2020.2007.2030.228411.
- Weis, C.; M. Horn, B. Rieck, A. Cuénod, A. Egli and K. Borgwardt Topological and kernel-based microbial phenotype prediction from MALDI-TOF mass spectra. Bioinformatics 2020, 36 (Suppl. S1), i30–i38. [CrossRef] [PubMed]
- Weis, C.; A. Cuénod, B. Rieck, O. Dubuis, S. Graf, C. Lang, M. Oberle, M. Brackmann, K. K. Søgaard, M. Osthoff, K. Borgwardt and A. Egli Direct antimicrobial resistance prediction from clinical MALDI-TOF mass spectra using machine learning. Nat. Med. 2022, 28, 164–174. [CrossRef]
- Weis, C.; B. Rieck, S. Balzer, A. Cuénod, A. Egli and K. Borgwardt (2022). Improved MALDI-TOF MS based antimicrobial resistance prediction through hierarchical stratification. bioRxiv: 2022.2004.2013.488198.
- Witten, I.H.; Frank, E.; Hall, M.A.; Pal, C.J. (2016). Data Mining: Practical machine learning tools and techniques (Morgan Kaufmann Series in Data Management Systems) 4th edition.
- Wolters, M.; Rohde, H.; Maier, T.; Belmar-Campos, C.; Franke, G.; Scherpe, S.; et al. MALDI-TOF MS fingerprinting allows for discrimination of major methicillin-resistant Staphylococcus aureus lineages. Int. J. Med. Microbiol. 2011, 301, 64–68. [Google Scholar] [CrossRef] [PubMed]
- Wong, J.W.; Cagney, G.; Cartwright, H.M. SpecAlign-processing and alignment of mass spectra datasets. Bioinformatics 2005, 21, 2088–2090. [Google Scholar] [CrossRef]
- Wu, L.C.; Chen, H.H.; Horng, J.T.; Lin, C.; Huang, N.E.; Cheng, Y.C.; et al. A novel preprocessing method using Hilbert Huang Transform for MALDI-TOF and SELDI-TOF mass spectrometry data. PLoS ONE 2010, 5, e12493. [Google Scholar] [CrossRef]
- Wu, L.C.; Hsieh, P.H.; Horng, J.T.; Jou, Y.J.; Lin, C.D.; Cheng, K.F.; et al. Improved candidate biomarker detection based on mass spectrometry data using the Hilbert-Huang transform. Protein Pept Lett 2012, 19, 120–129. [Google Scholar] [CrossRef]
- Yasir, M.; A. M. Karim, S. K. Malik, A. A. Bajaffer and E. I. Azhar Application of Decision-Tree-Based Machine Learning Algorithms for Prediction of Antimicrobial Resistance. Antibiotics 2022, 11, 1593. [CrossRef]
- Yeh, H.C.; Lu, J.J.; Chang, S.C.; Ge, M.C. Identification of microbiota in peri-implantitis pockets by matrix-assisted laser desorption/ionization time-of-flight mass spectrometry. Sci. Rep. 2019, 9, 774. [Google Scholar] [CrossRef]
- Zhan, X.; A. D. Patterson and D. Ghosh Kernel approaches for differential expression analysis of mass spectrometry-based metabolomics data. BMC Bioinform. 2015, 16, 77. [CrossRef]
Figure 1.
Peaks shifting/drifting phenomenon on MALDI-TOF MS spectra. (A) Peaks of MALDI-TOF MS spectra from the same species could occur by a form of distribution and not sharply at the exact m/z position. The figure illustrates peak distributions of two strain classes (i.e., class I and class II) of the same species. As noted, the figure summarizes several thousand MS spectra for each class. The occurrence frequency is significantly different at m/z values of 3165, 6690, and 7360. Typically, the occurrence frequency of a specific peak would follow a normal distribution, attributed to the peaks shifting/drifting phenomenon on the MALDI-TOF MS spectra. (B) The depiction illustrated is an example of generating a peak feature of a type template by using the density clustering method. First, a location with high occurrence density (m/z 3989) could be set as a temporary density center. Subsequently, the signals in the local region (±5 m/z) are calculated to determine the location and standard deviation (i.e., error window) of the peak feature. Integrating the peak features could be a “type template” for a specific type of classification problem. (Wang et al., 2018c) (permission of use has been obtained from the copyright holders).
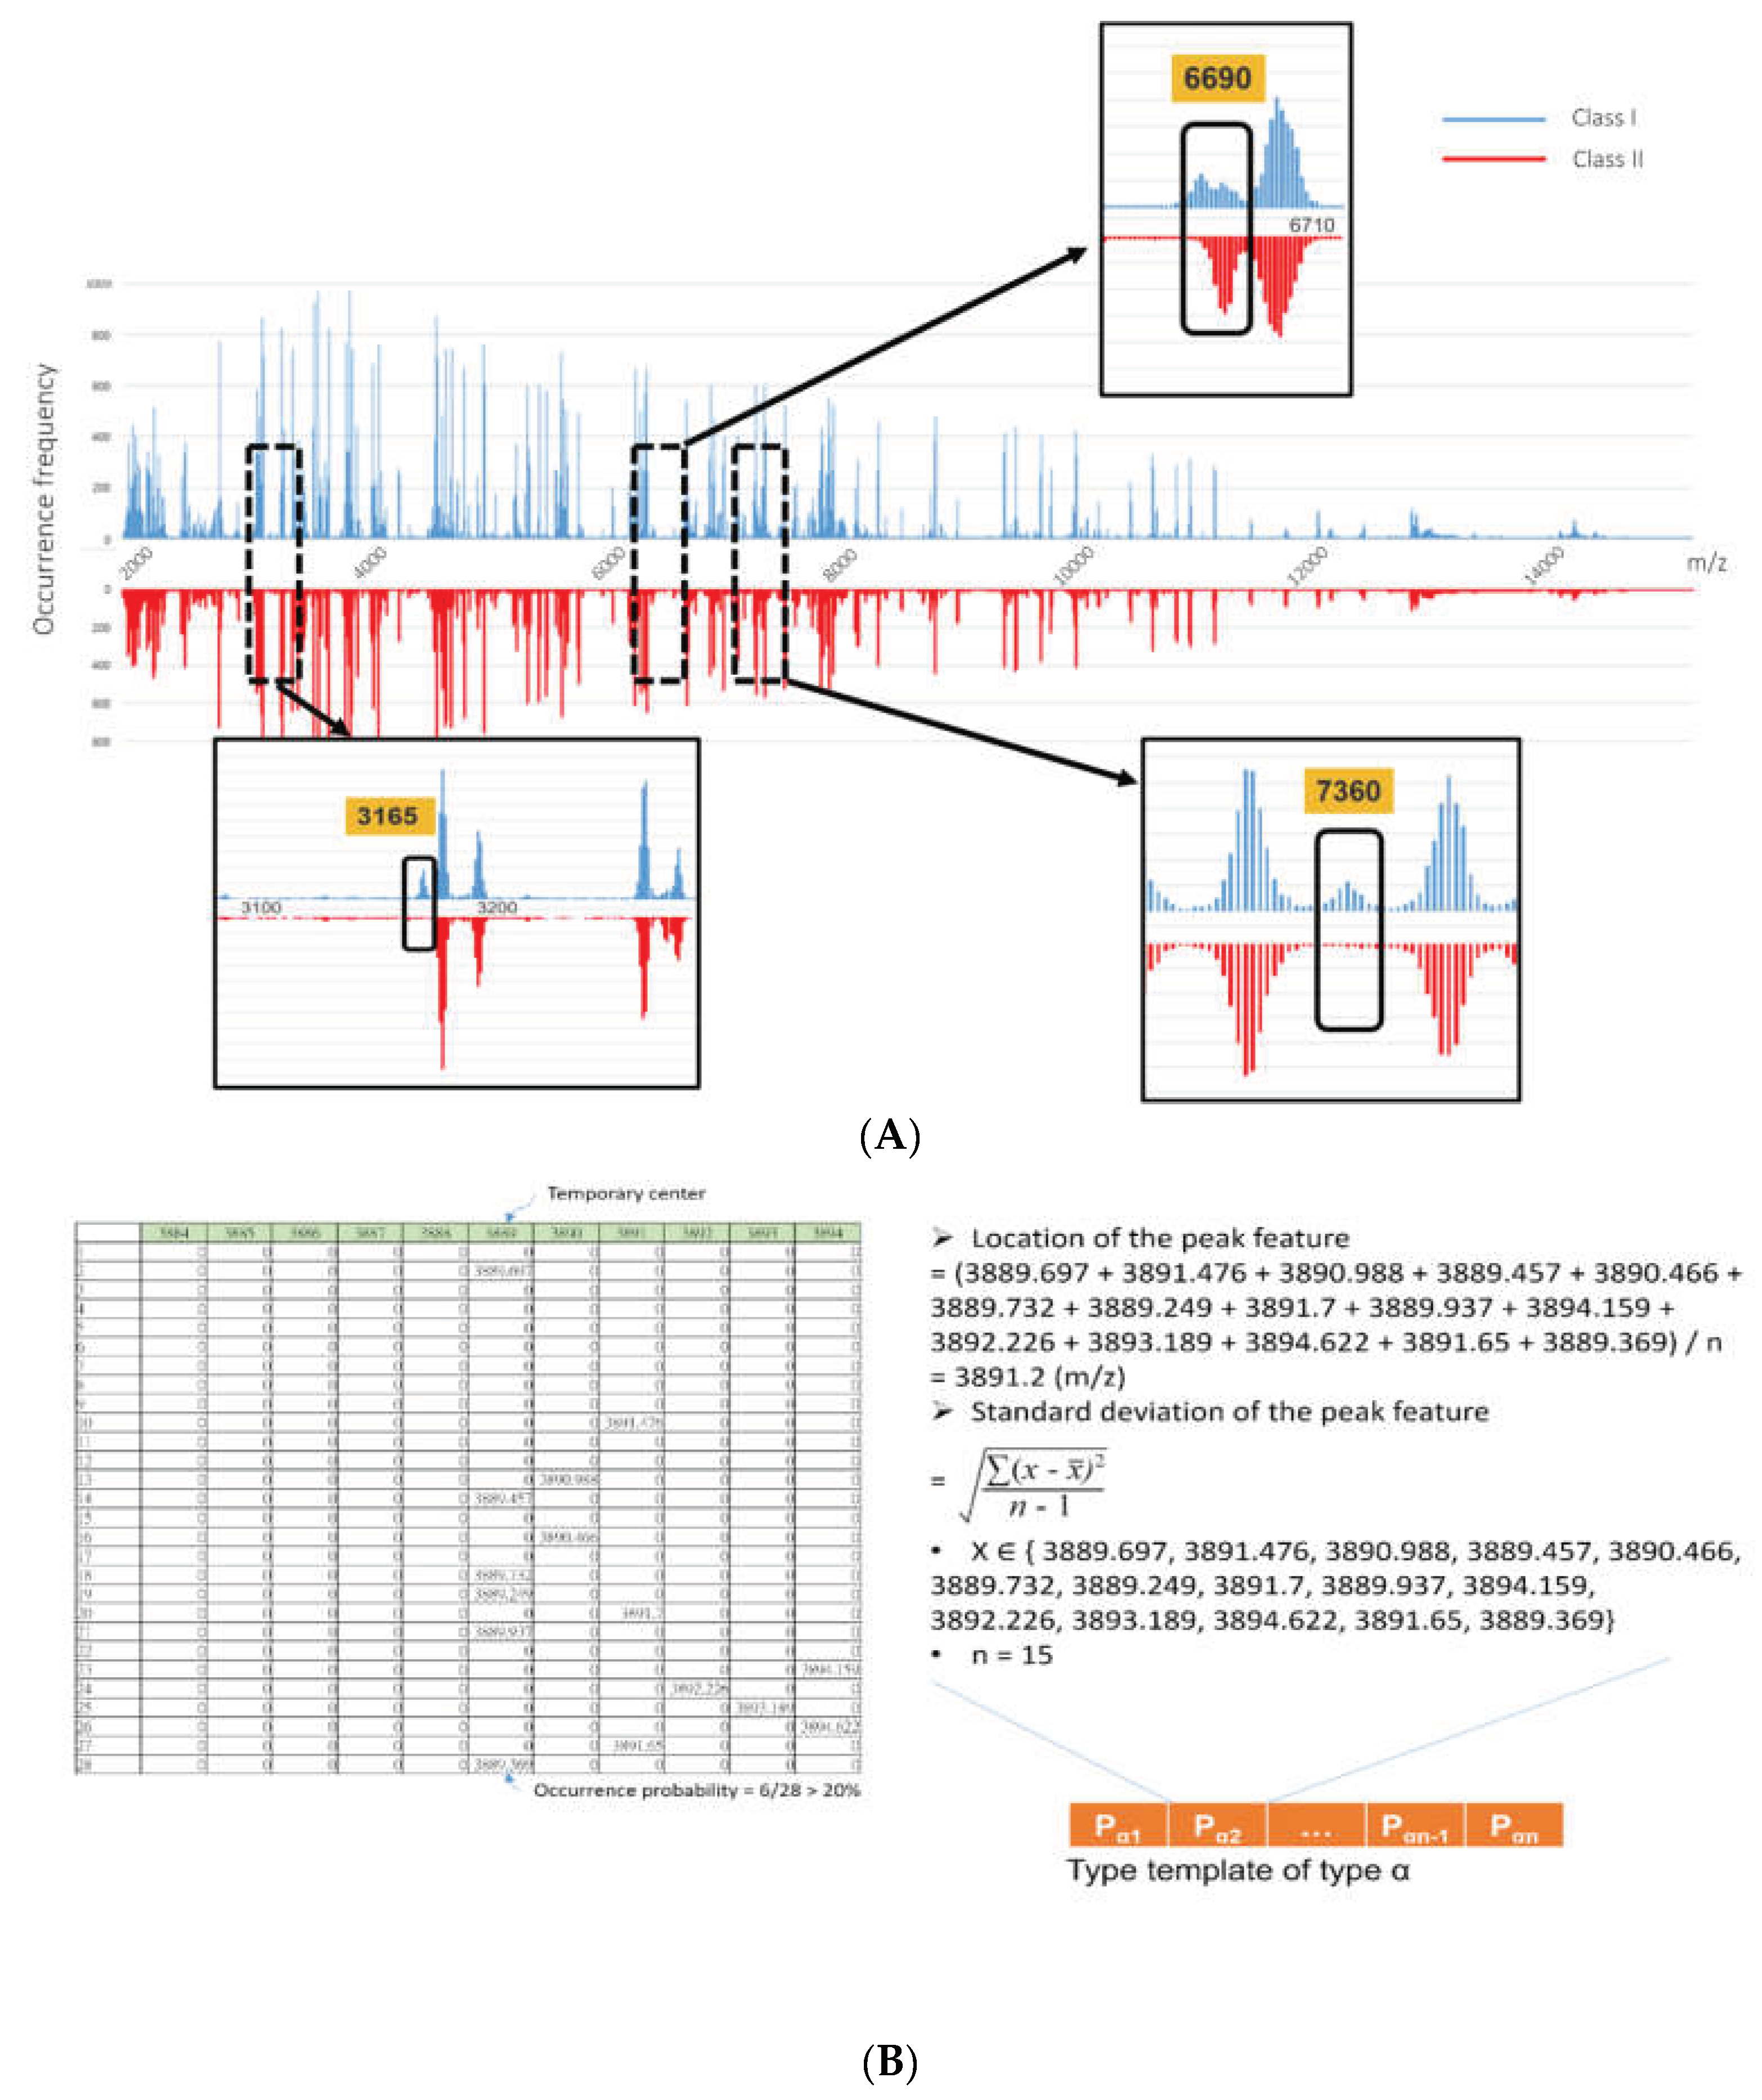
Figure 2.
Scheme for transforming the MALDI-TOF spectrum into structured data (A) The MALDI-TOF spectrum is measured and matched against various type templates (in the illustration, type templates of type α, β, and γ) to obtain the matched vectors (in the illustration, matched vectors of type α, β, and γ). (B) Matched vectors of type α, β, and γ are pooled together to generate an integrated vector that is a structured data format (Wang et al., 2018c) (permission of use has been obtained from the copyright holders).
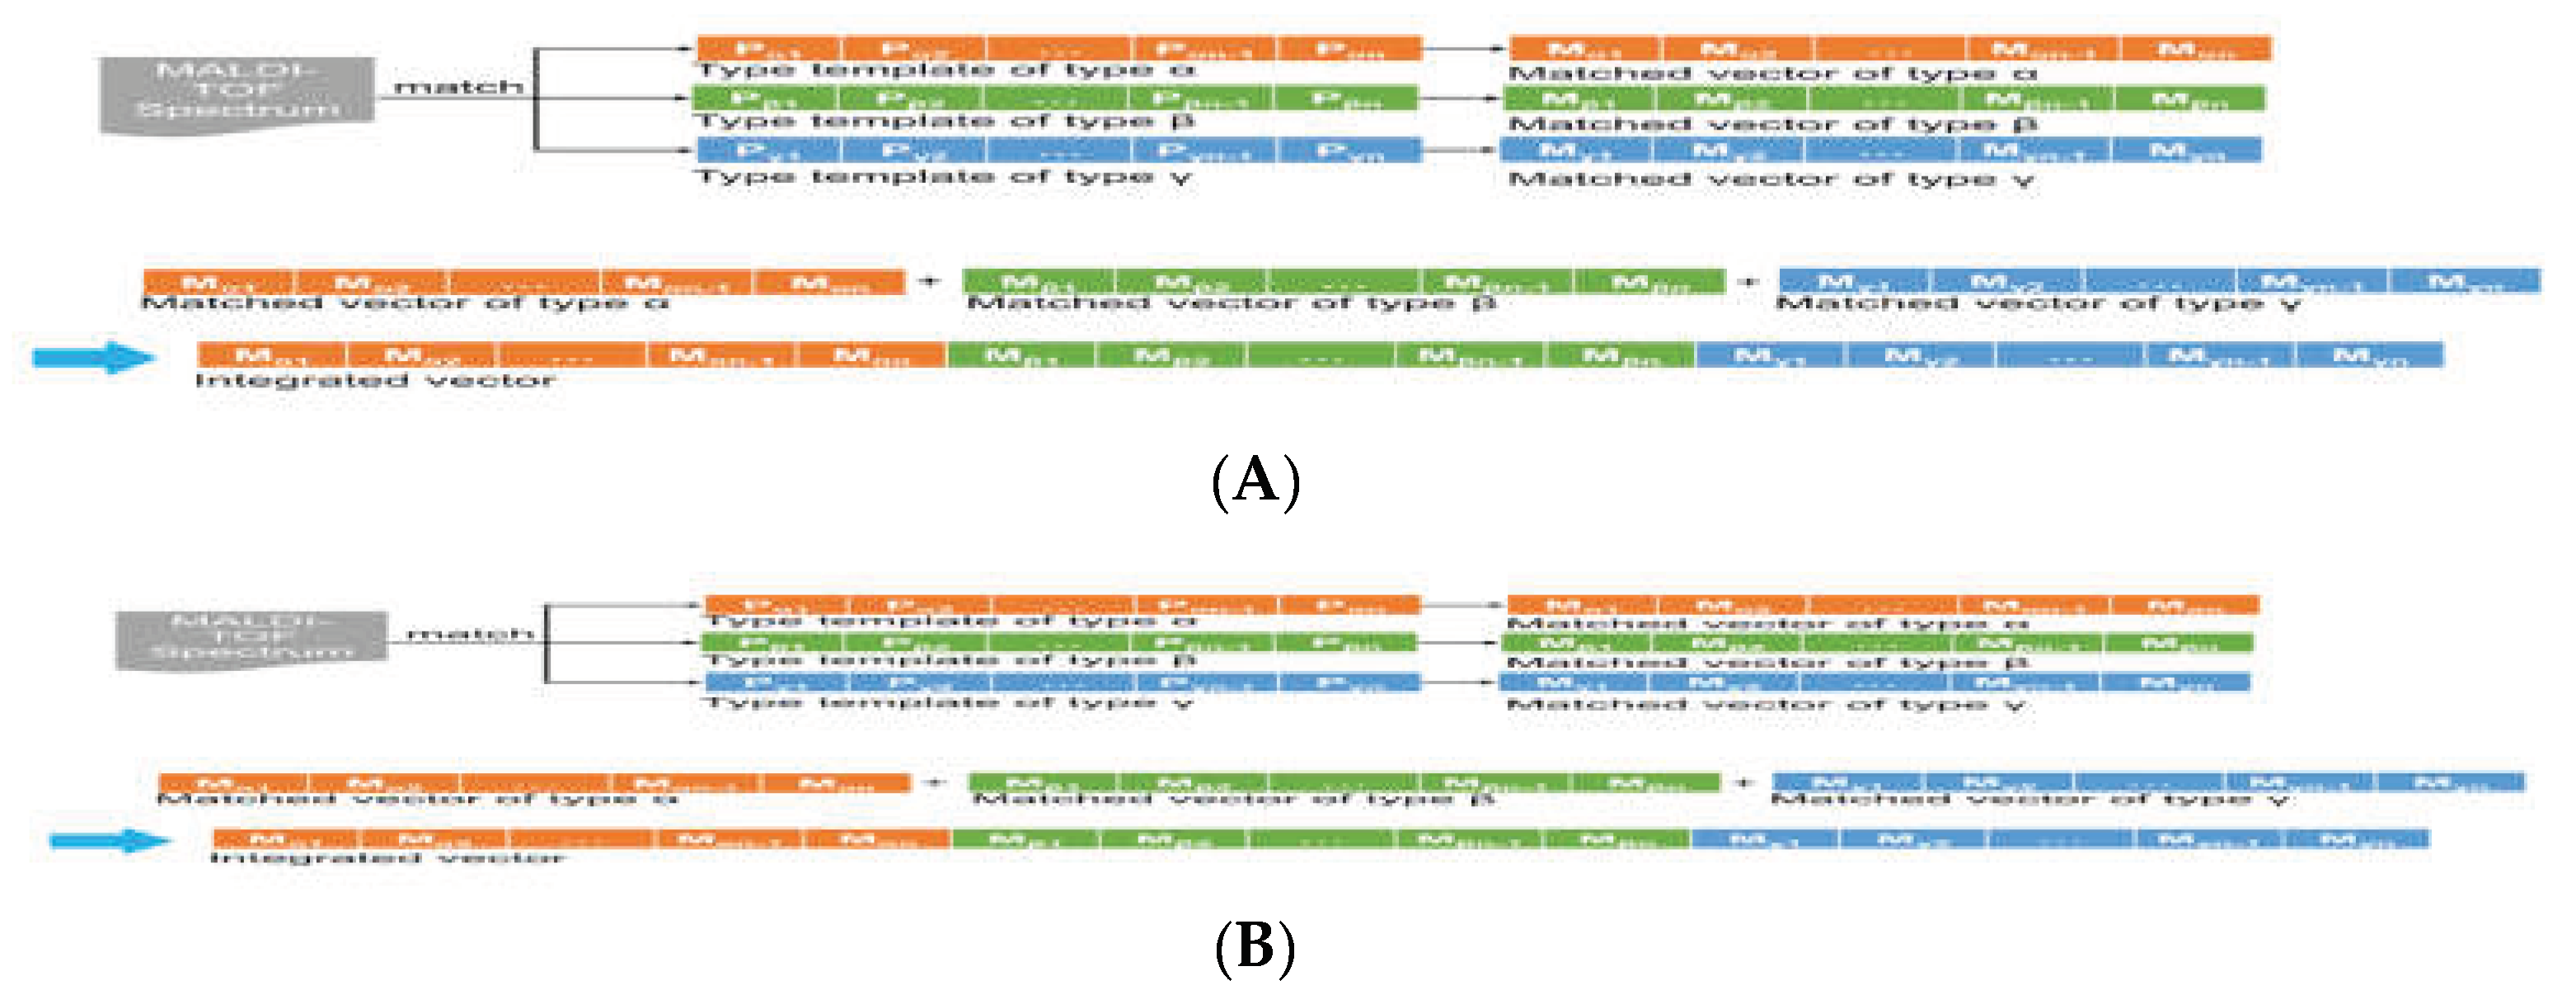
Figure 3.
Nested cross-validation: an unbiased approach for selecting important features and evaluating model performance. In the outer m-fold cross-validation loop, the data are divided into training (m-1 folds) and test (one fold) datasets to evaluate the performance of the models with an untouched test set. In each training step in the outer fold, repeated inner p-fold cross-validation is applied to select the optimal important features, parameters, and models. The nested cross-validation process can be repeated four times to ensure robustness of a model. In each fold of outer cross-validation, important features and models constructed by using data from the training set are tested by the data in the untouched test set (Wang et al., 2018b) (permission of use has been obtained from the copyright holders).
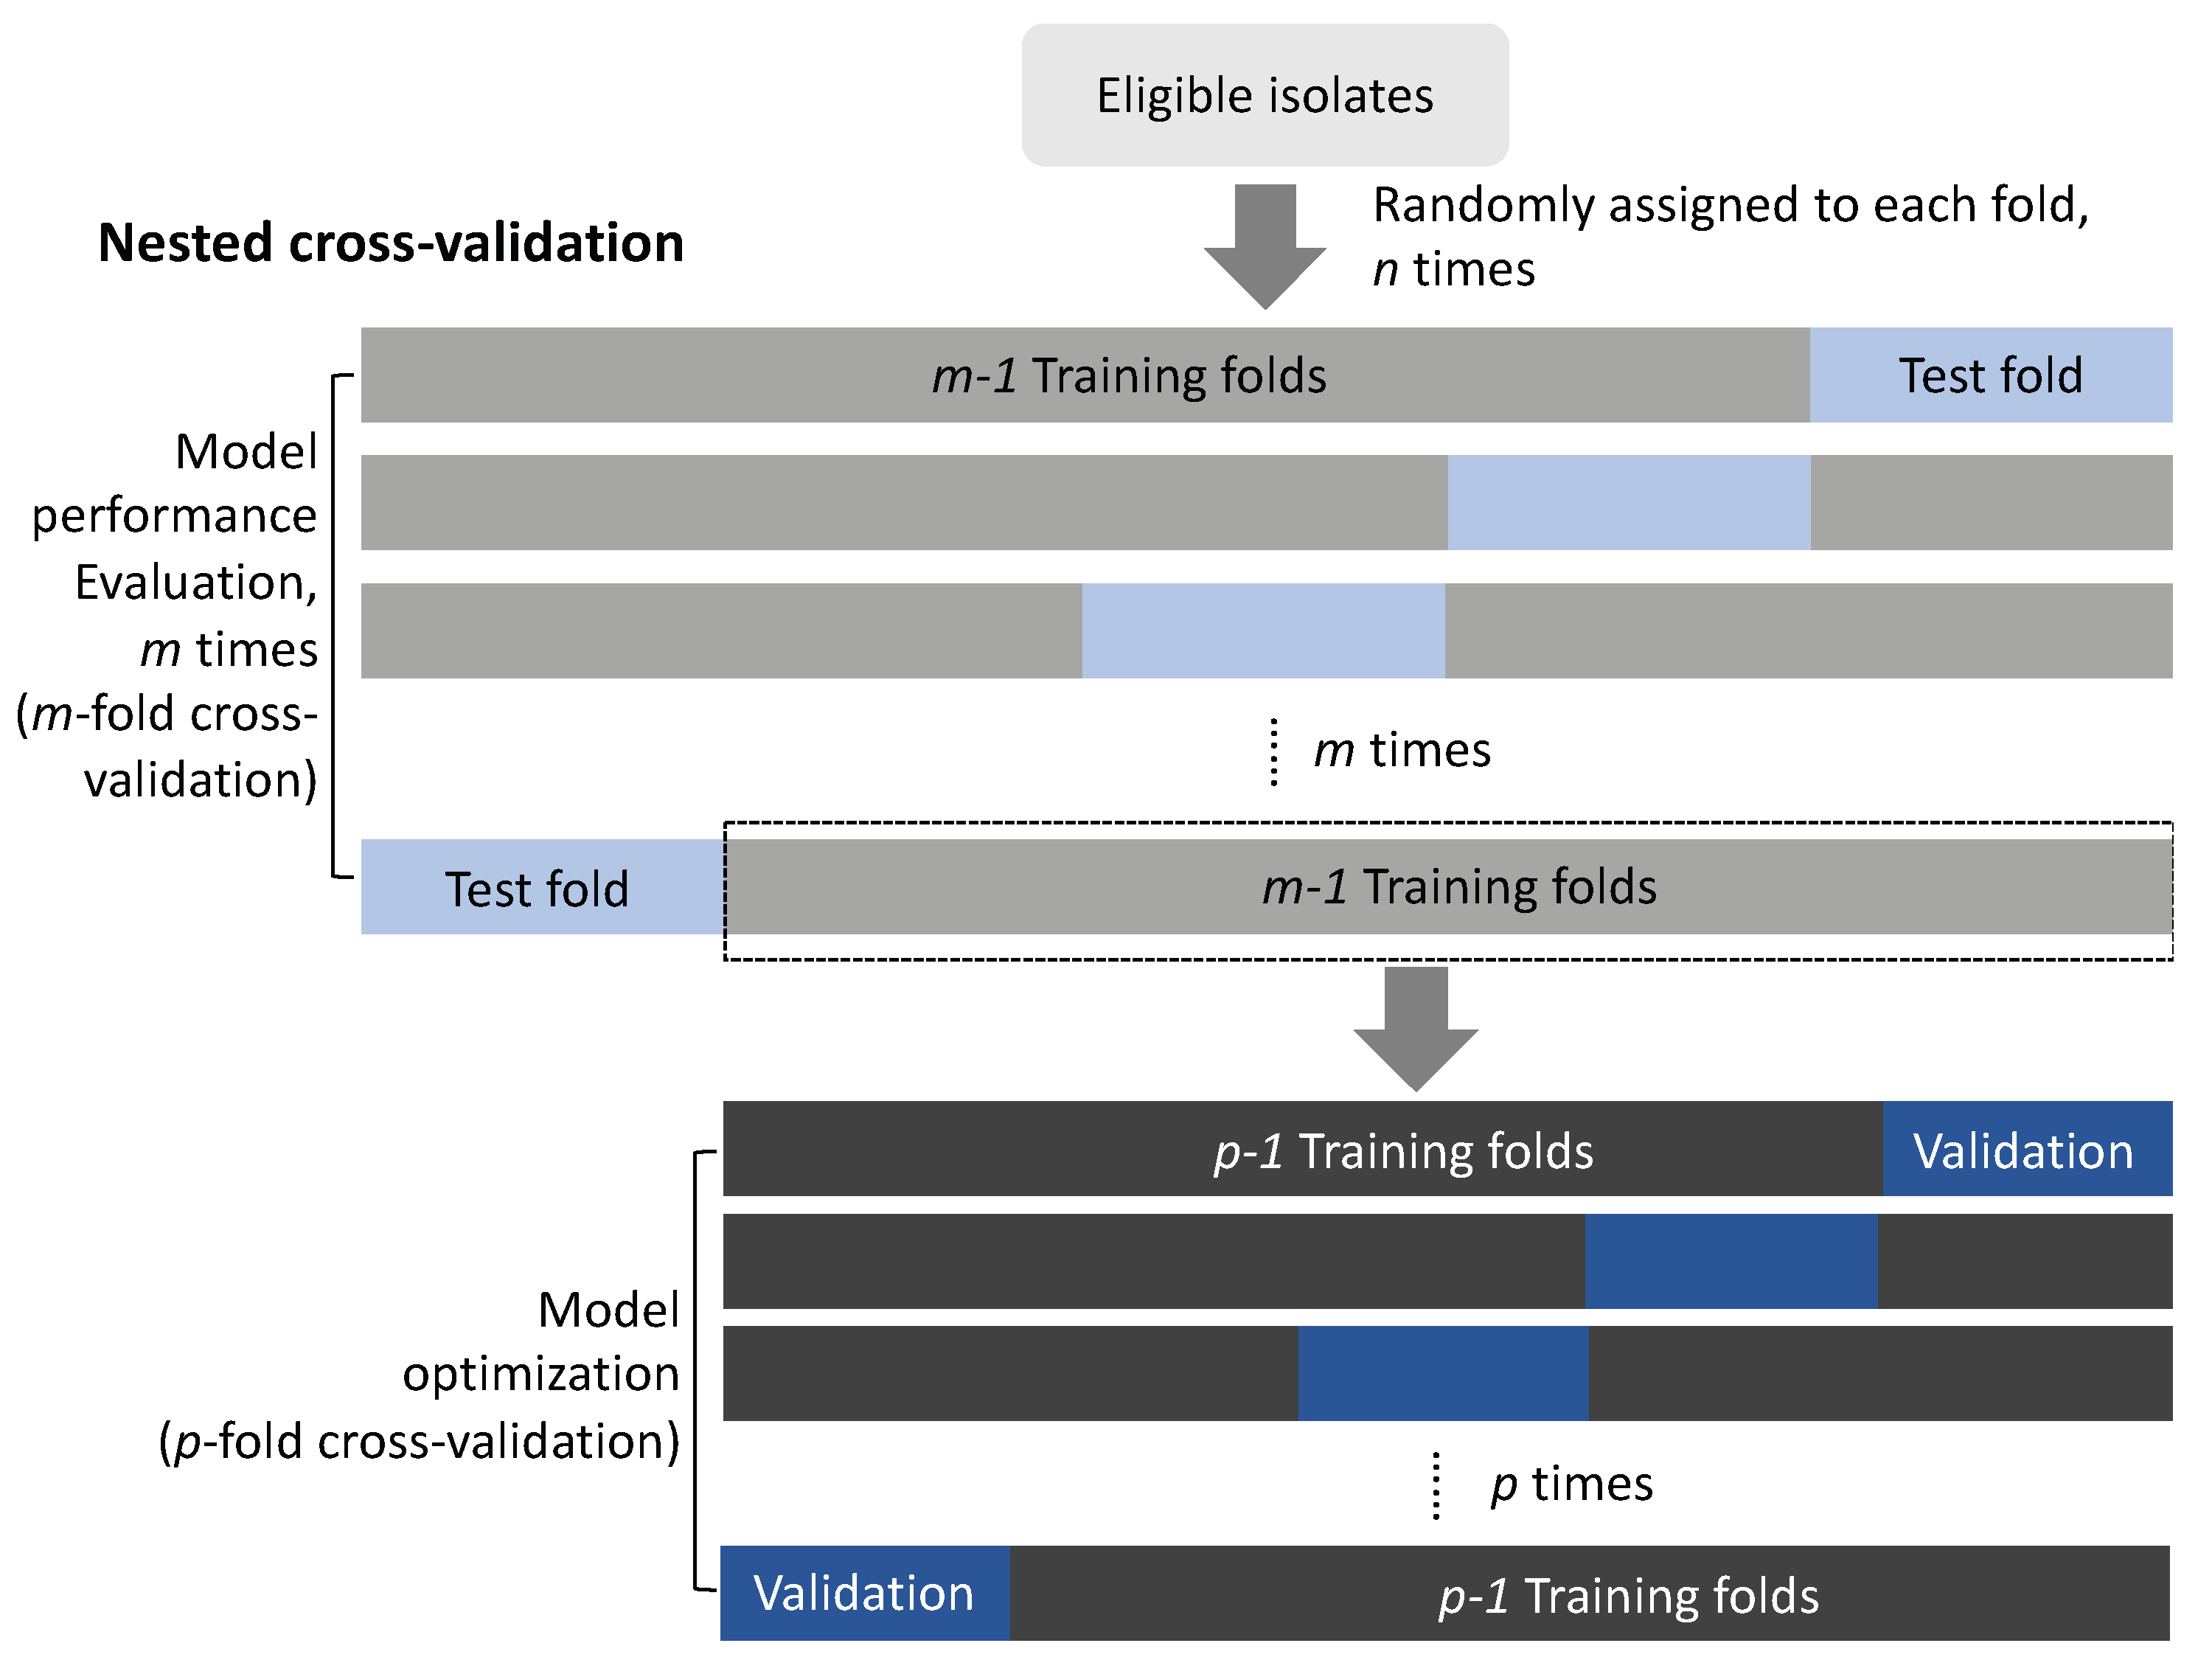
Figure 4.
Distribution of importance for the selected important peaks. The figure illustrates that the importance of the peaks are distributed in a range and are not at a specific value when using nested cross validation to evaluate peak importance. In this figure, there are importance distributions for the three important peaks. The distributions are overlapped with each other. In the multiple training-and-testing process, it is possible that the important peak 3 is identified as the most important peak in some specific data composition. The risk of bias is possible when using a single data set for descriptive statistics without an adequate validation method. Contrastingly, the importance of peaks could be evaluated more comprehensively in multiple tests so that the results could be more robust and unbiased by using nested cross validation (Wang et al., 2018b) (permission of use has been obtained from the copyright holders).

Figure 5.
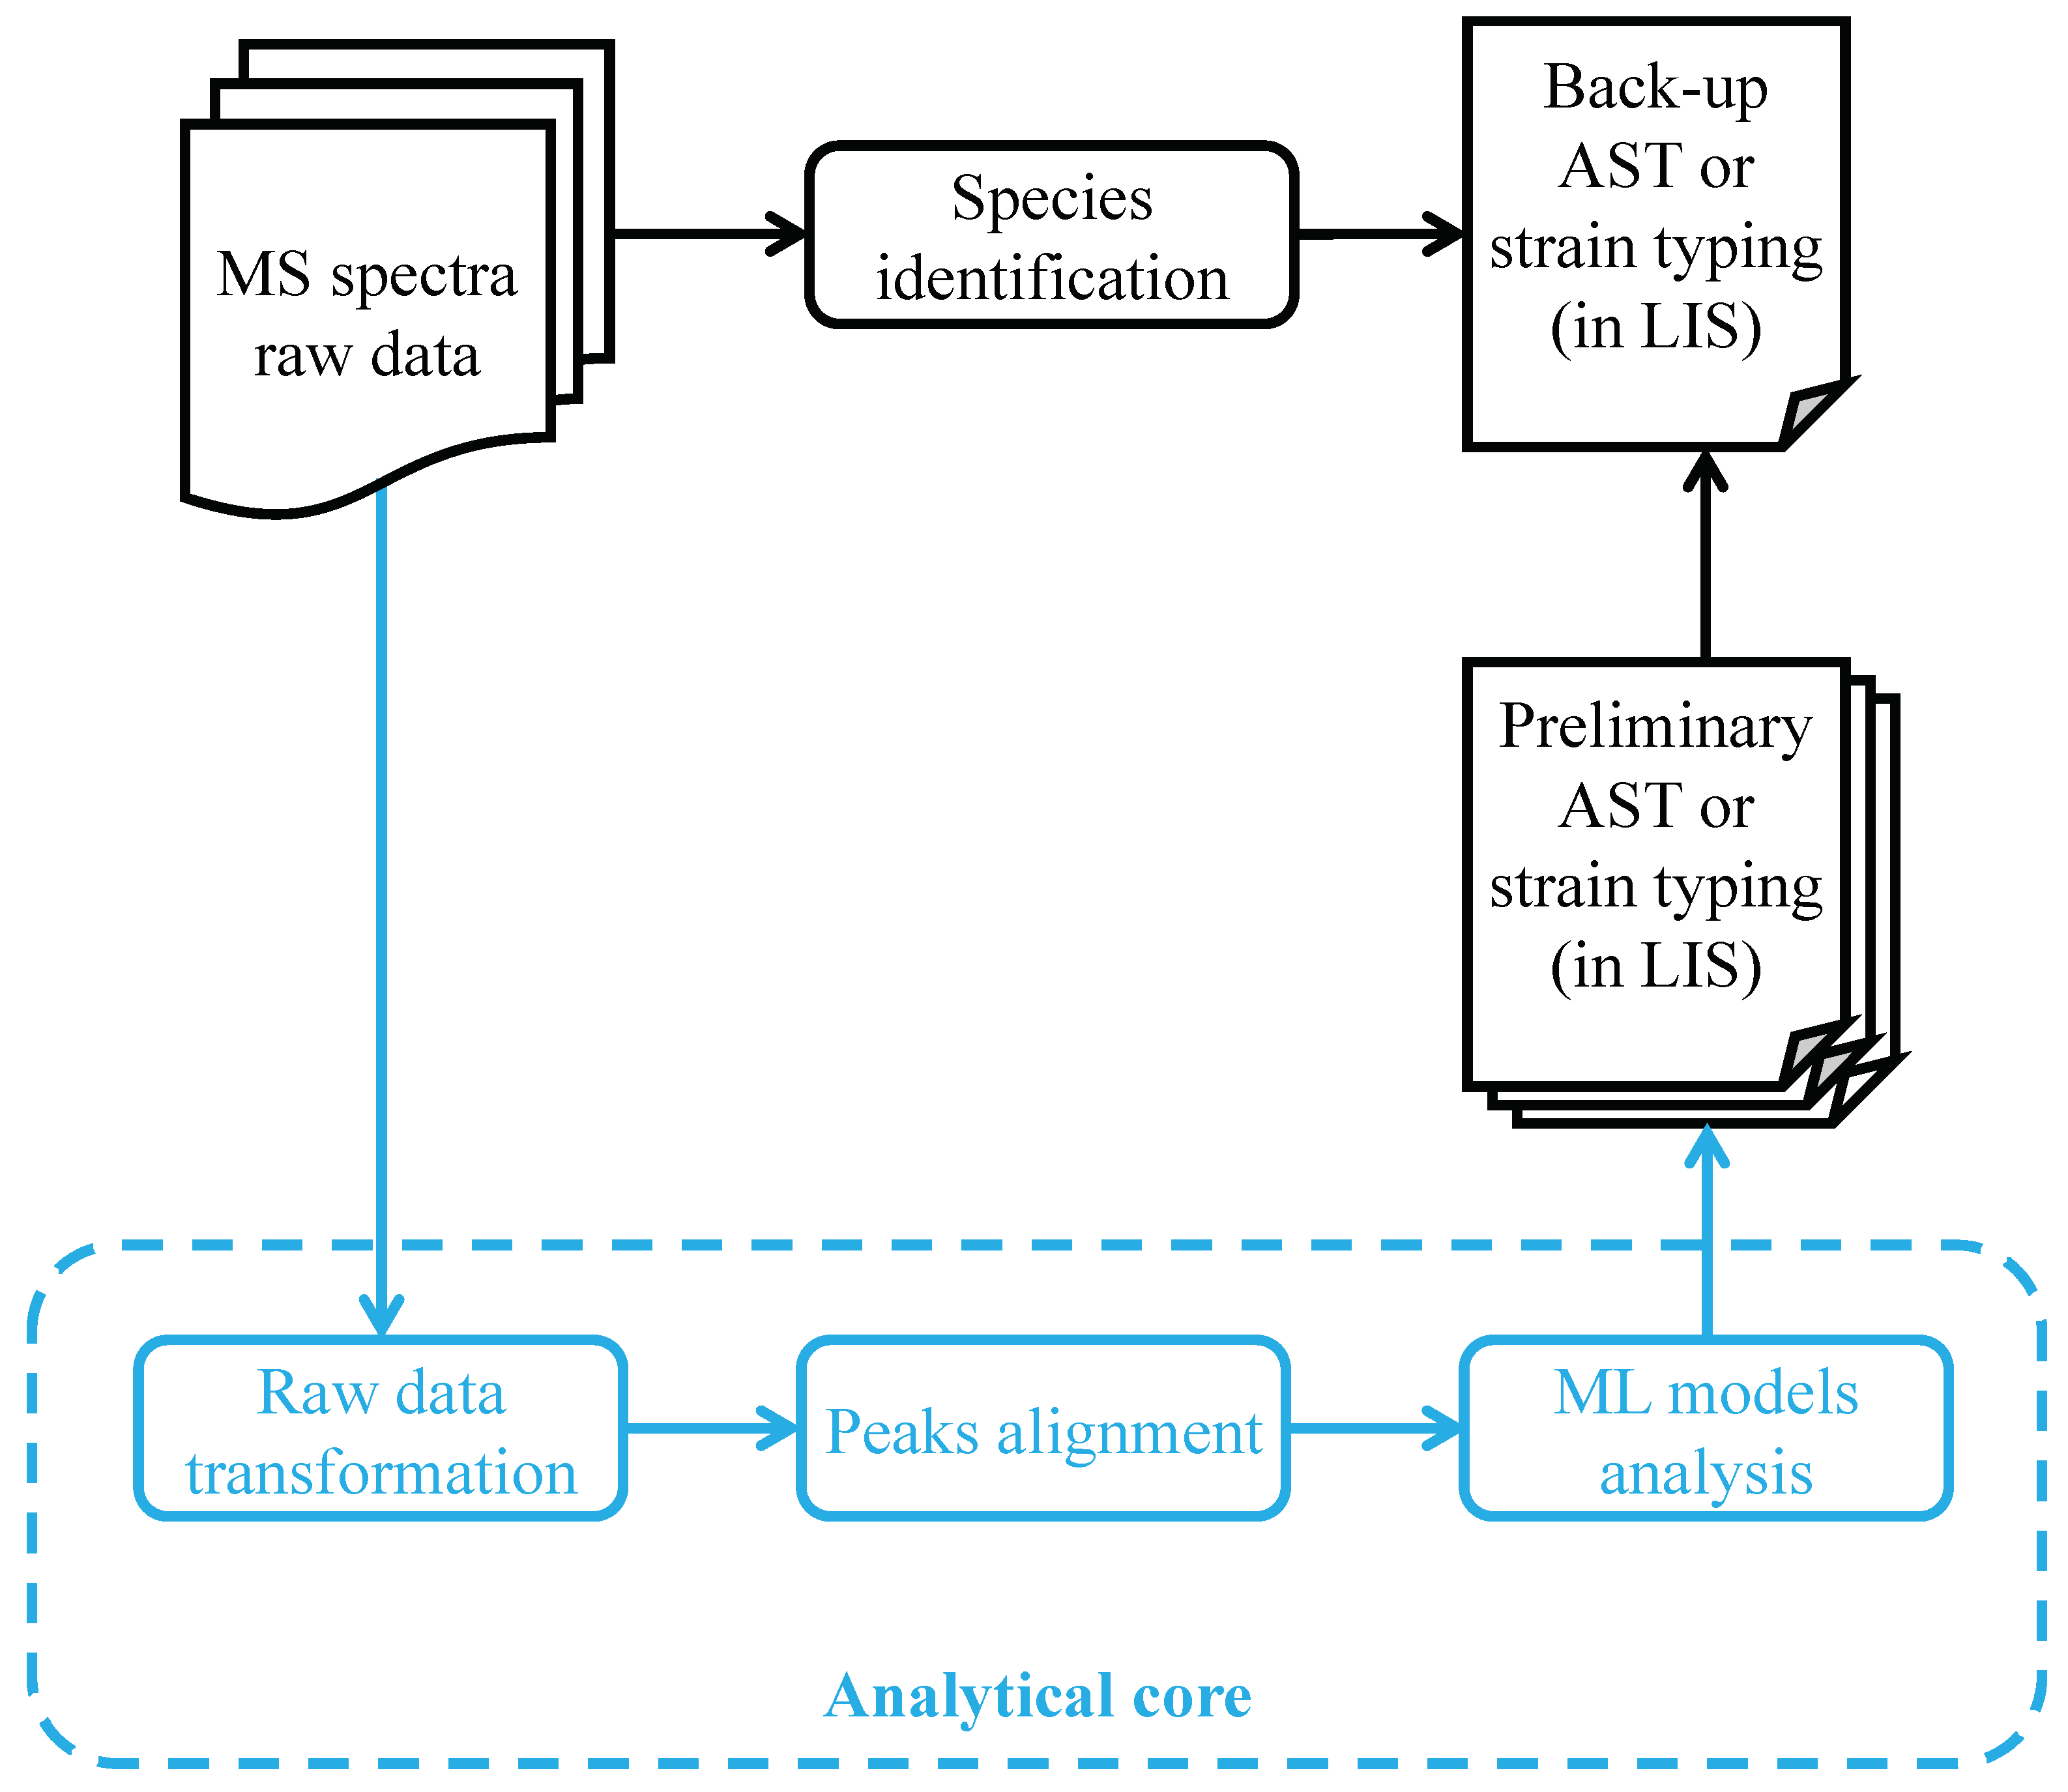
Scheme of using AST or strain typing predictive ML models in the existing workflow of the clinical microbiology laboratory. Successful application of AST or strain typing predictive ML models would depend largely on integrating the approach into the existing workflow. In the current clinical microbiology laboratory, MALDI-TOF MS raw data are processed and analyzed automatically to provide bacterial species identification, followed by a back-up AST or strain typing. When applying the predictive ML models, ideally the processes of raw data transformation, peak alignment, and ML model analysis are automated in an analytical core, which can be installed in local computers or provided via web-based tools. The predictive ML models will provide preliminary AST or strain typing in a rapid and accurate manner, which would reduce the time required for adequate management of infectious diseases. MS: mass; ML: machine learning; AST: antimicrobial susceptibility test; LIS: laboratory information system.
Figure 5.
Scheme of using AST or strain typing predictive ML models in the existing workflow of the clinical microbiology laboratory. Successful application of AST or strain typing predictive ML models would depend largely on integrating the approach into the existing workflow. In the current clinical microbiology laboratory, MALDI-TOF MS raw data are processed and analyzed automatically to provide bacterial species identification, followed by a back-up AST or strain typing. When applying the predictive ML models, ideally the processes of raw data transformation, peak alignment, and ML model analysis are automated in an analytical core, which can be installed in local computers or provided via web-based tools. The predictive ML models will provide preliminary AST or strain typing in a rapid and accurate manner, which would reduce the time required for adequate management of infectious diseases. MS: mass; ML: machine learning; AST: antimicrobial susceptibility test; LIS: laboratory information system.
Disclaimer/Publisher’s Note: The statements, opinions and data contained in all publications are solely those of the individual author(s) and contributor(s) and not of MDPI and/or the editor(s). MDPI and/or the editor(s) disclaim responsibility for any injury to people or property resulting from any ideas, methods, instructions or products referred to in the content. |
© 2023 by the authors. Licensee MDPI, Basel, Switzerland. This article is an open access article distributed under the terms and conditions of the Creative Commons Attribution (CC BY) license (http://creativecommons.org/licenses/by/4.0/).
Copyright: This open access article is published under a Creative Commons CC BY 4.0 license, which permit the free download, distribution, and reuse, provided that the author and preprint are cited in any reuse.


