1. Introduction
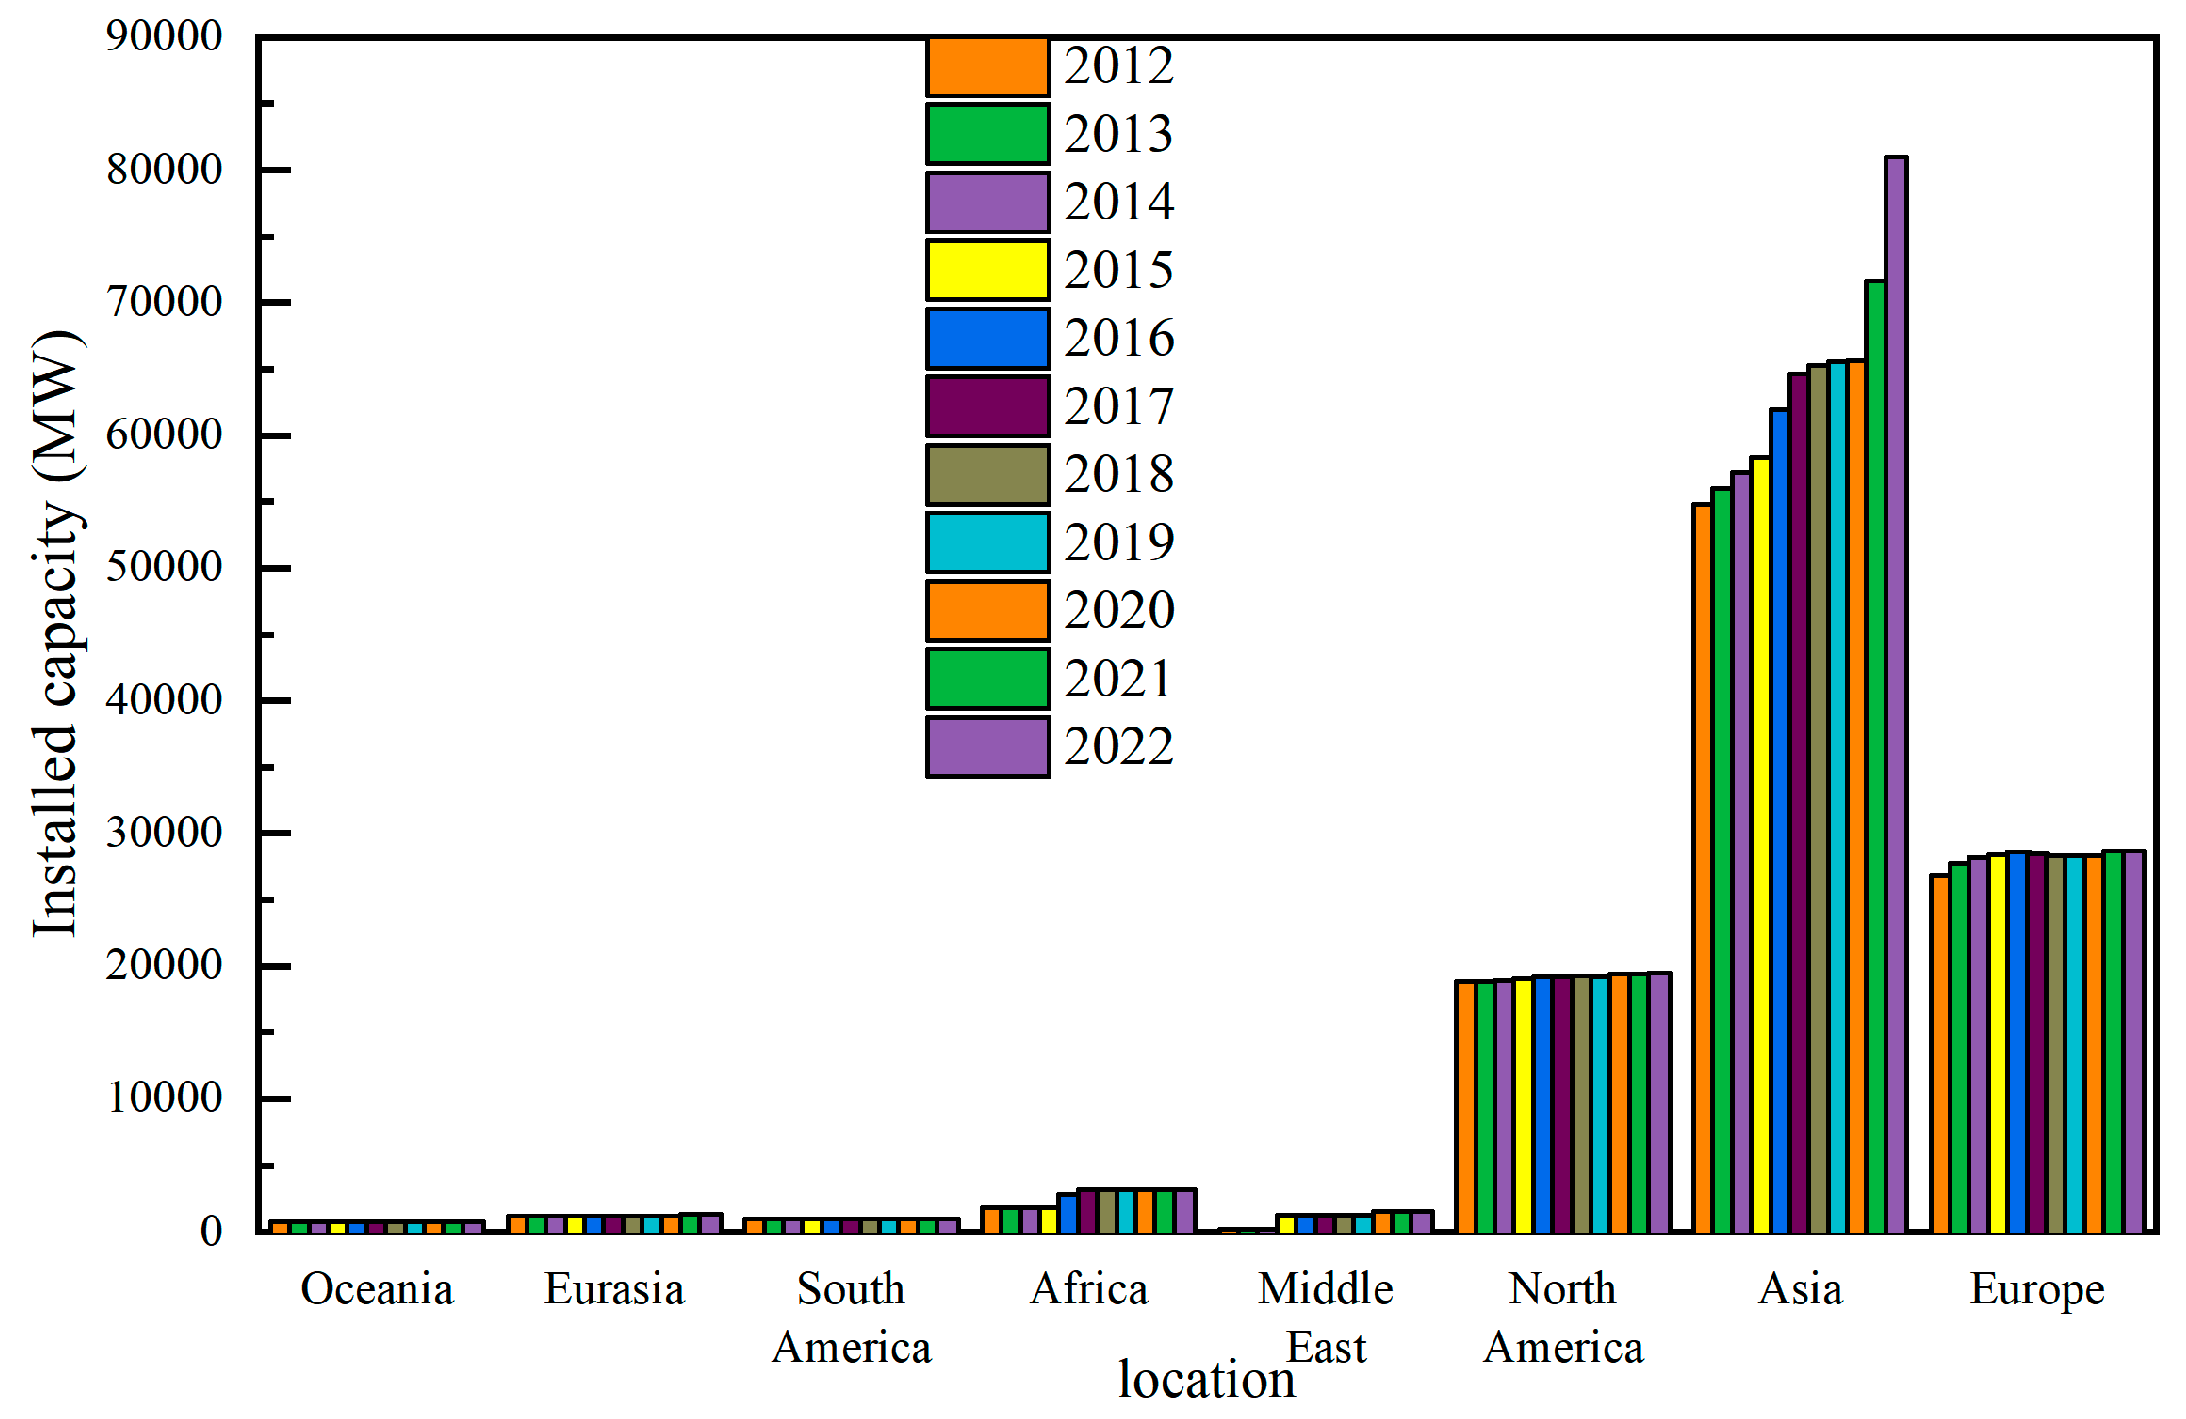
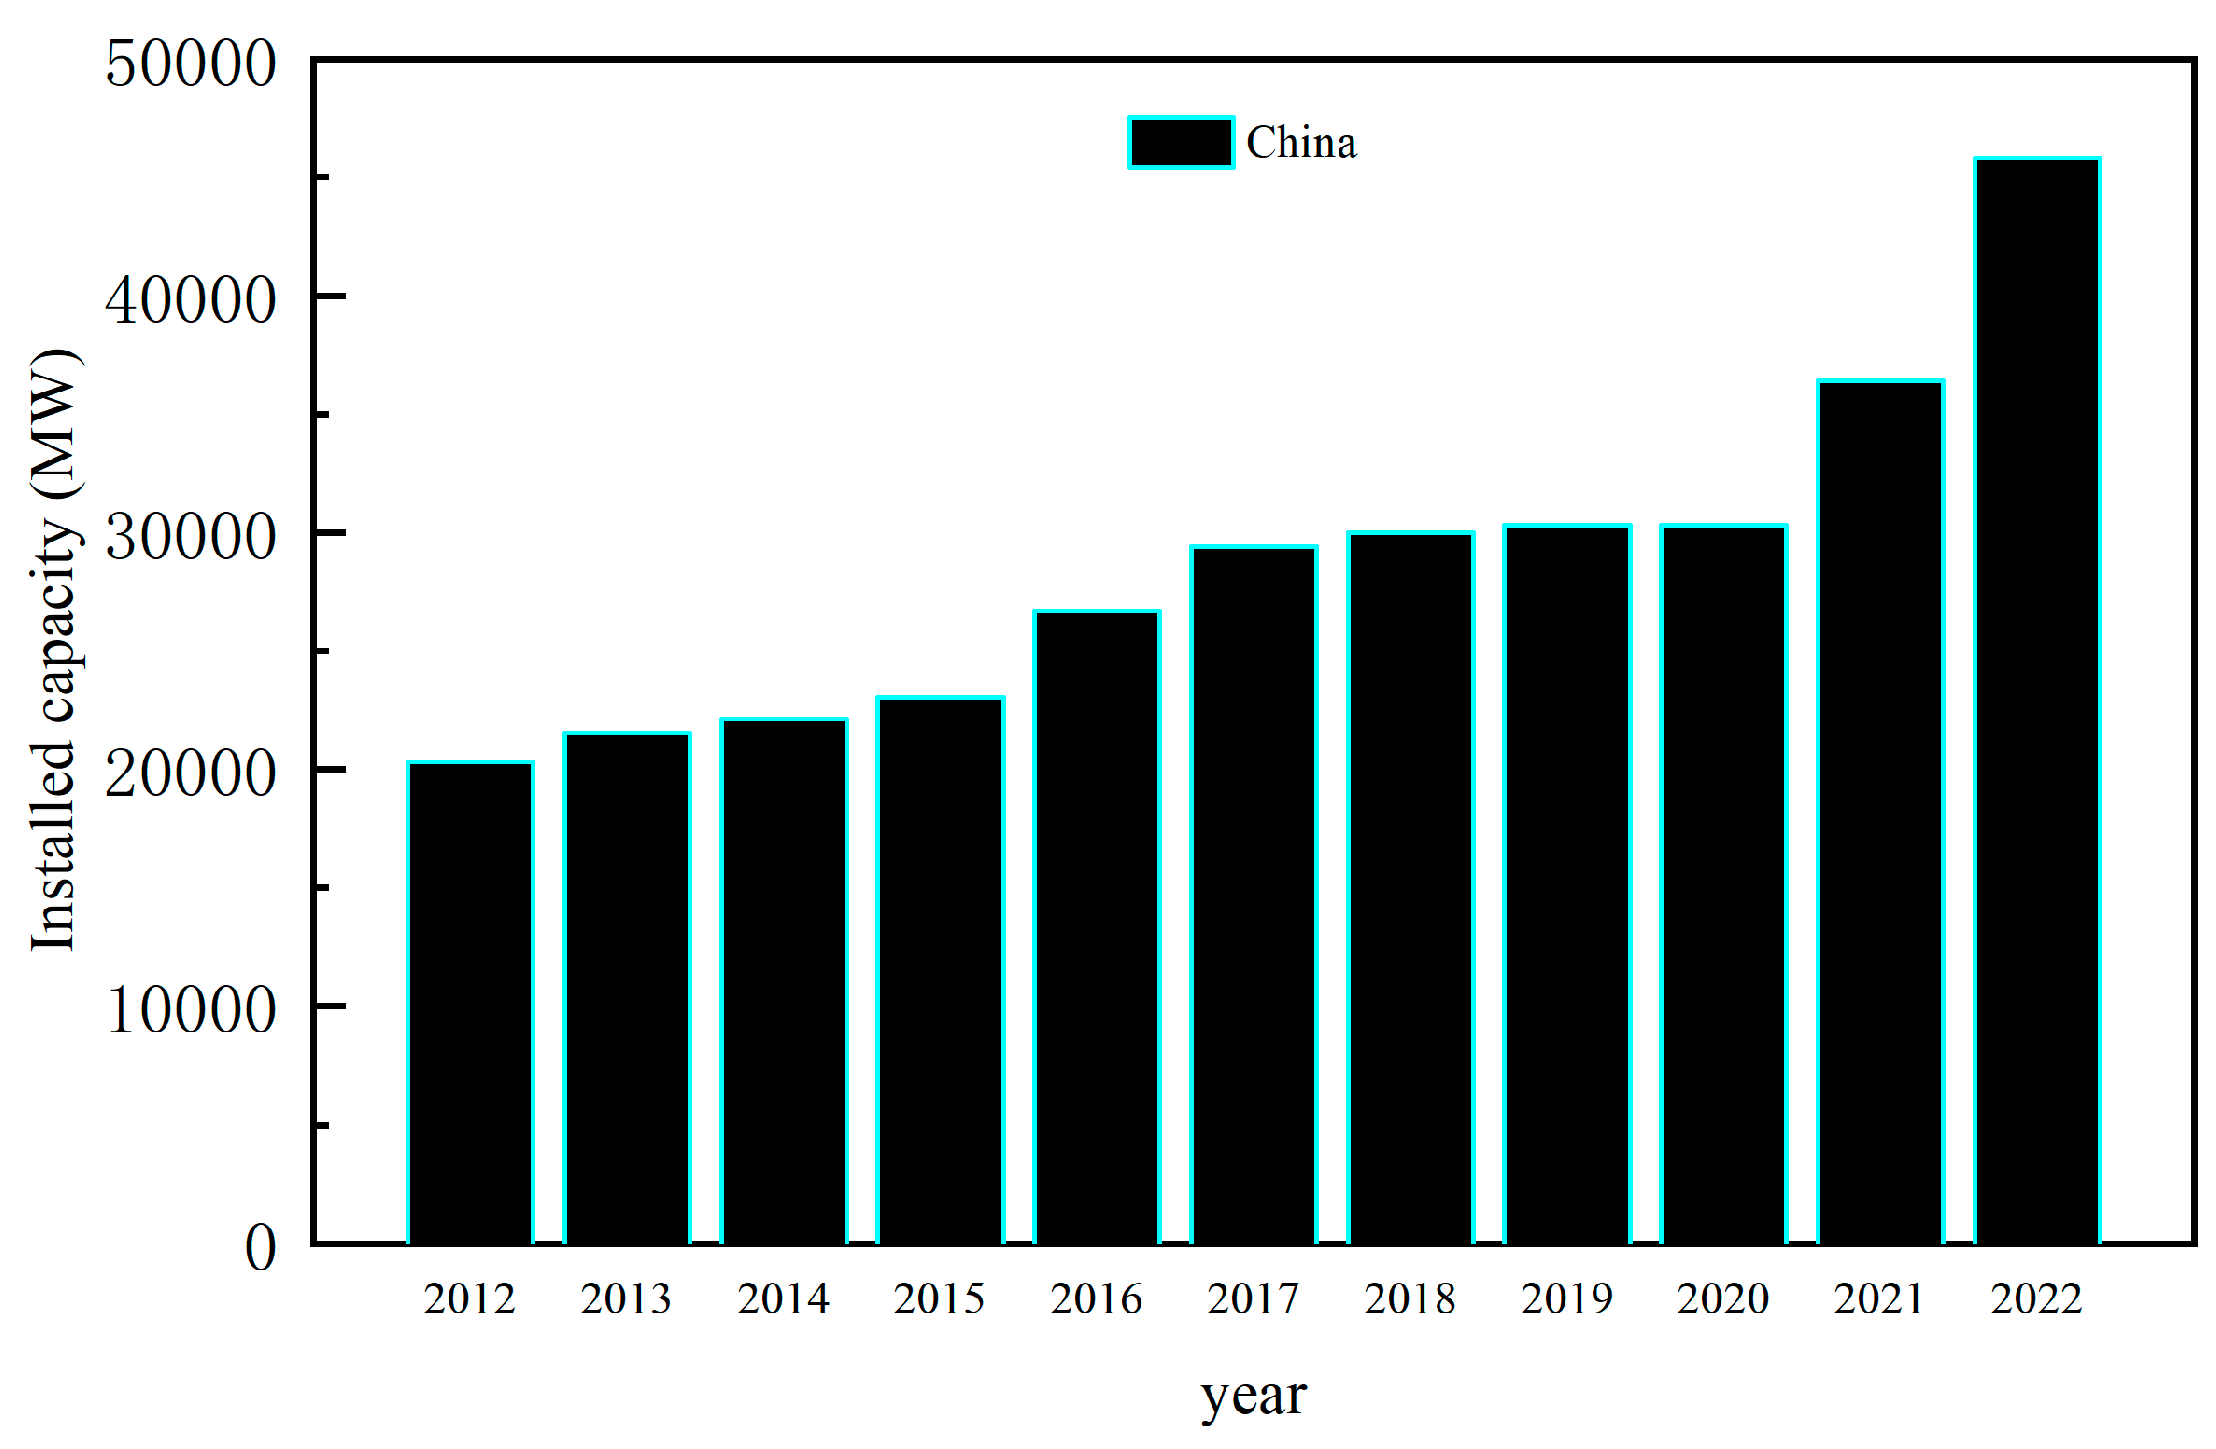
In recent years, there has been a growing global emphasis on PSPS, as evidenced by the annual increase in installed capacity depicted in
Figure 1 and
Figure 2. It is envisaged that these power stations will play a pivotal role in advancing the dual-carbon strategy and fostering the adoption of clean energy in the foreseeable future.
PSPS play a crucial role in China's electric power system by facilitating grid peak shifting, frequency regulation, phase adjustment, and accident standby [
1]. However, the operational complexity of these power stations poses safety hazards and affects unit efficiency after their completion. The power plants have previously experienced safety incidents [
2,
3,
4]. These issues arise from the interconnection between different unit components during the operation process of the power plant and are exacerbated by high head fall-induced mechanical vibrations. The propagation of these vibrations through units, pipelines, and mountains reduces the structural stability of mechanical equipment. Consequently, performance parameters cannot be maintained within specified upper and lower limits simultaneously. Moreover, low-frequency noise resulting from this vibration dissemination diminishes residents' quality of life in surrounding areas. Therefore, ensuring safe operation of PSPS is not only essential for national grid security and electricity consumption but also vital for safeguarding physical and mental health in proximity to these facilities.
The vibration source of the diversion pipe in a PSPS is complex, primarily stemming from vibrations generated during unit operation due to hydraulic, mechanical, and electrical factors [
5]. According to relevant studies, the hydraulic factor is the primary cause of these vibrations [
6], which mainly result from uneven flow between the guide vane and runner. The region without blades between the movable guide vane and runner is referred to as the bladeless area [
7]. During unit operation, this bladeless area generates multiple overlapping pulsating pressures with a main frequency approximately equal to the passing frequency of the runner blades (referred to as blade frequency - calculated by multiplying the number of runner blades by speed frequency) [
8]. This high-frequency pressure pulsation is transmitted upstream through the water hammer effect, resulting in vibration along the pipeline. Therefore, one approach to reducing the vibration magnitude of the diversion pipe is by mitigating the water hammer effect. Based on a numerical model of hydraulic vibration, Gao conducted a study on the hydraulic vibration of the diversion tunnel at pilot power station. She concluded that incorporating a surge chamber could reduce oscillation amplitude and proposed that increasing air had a significant impact on decreasing system pressure head and natural vibration frequency [
9]. Chen utilized finite element software to simulate cushion pipe thickness and elastic modulus for water diversion pipelines. The results demonstrated that increasing cushion pipe thickness while decreasing elastic modulus achieved better vibration reduction effects [
10]. Han applied boundary conditions with pressure along each stage of an extended water pipeline and solved the fundamental equation of water hammer using feature-difference method. The findings indicated that appropriately extending pump start time intervals benefited all components within the water transmission system; however, minimizing air pump intervals effectively reduced project costs, thus necessitating a balanced relationship between these two factors [
11]. Masoud Babaei et al. utilized the finite element method to conduct an analysis on the natural frequencies of functionally graded graphene sheets (GPL) in a different distributions mode, while considering various material parameters and boundary conditions. The findings revealed that FG-X and FG-O types exhibited the maximum and minimum natural frequencies. This method holds significant reference for numerical simulation of surface constructions.
Previous studies have primarily focused on numerical simulations of pulsating pressure propagation inside diversion pipes and the factors that induce it. However, limited field monitoring and data analysis have been conducted to support surface ambient vibration, resulting in insufficient reliability and practicality. This is particularly problematic for residents living near PSPS facilities as pipeline vibrations can spread through mountains to the surface, potentially causing unbearable ambient vibrations. Using CLS-PSPS as an example, this paper analyzes regional ambient vibrations related to diversion pipes based on measured data, providing valuable guidance for future PSPS construction.
2. Research object and test arrangement
2.1. Research object
The CLS-PSPS (formerly known as Tianhuangping Second PSPS) is situated in Tianhuangping Town, Anji County, Zhejiang Province. It stands as the largest PSPS in East China, boasting a maximum generating head of 756.5 m. The pivotal structure of the power station comprises the upper reservoir, lower reservoir, water conveyance system, underground plant cavern group, and ground switching station. The water conveyance system is designed with three tunnels and six machines spaced approximately 27~51m apart for diversion tunnels and featuring single pipe lengths ranging from 2738.1~2810.3m each; It accommodates six units of generator units equipped with mixed-flow reversible pump turbine generators rated at 350MW each, resulting in a total installed capacity of 2,100MW (6×350MW). Refer to
Table 1 for basic parameters. In order to obtain ambient vibration data concerning the diversion pipeline during power station operations, we carried out nine days' worth of vibration monitoring.
2.2. Measurement point layout
The test primarily focuses on the diversion pipeline area of CLS PSPS .The principles for arranging measurement points are as follows:①In the diversion pipeline area, it is important to cover as many pipeline sections along the diversion pipeline as possible. Additionally, suitable locations should be selected to arrange monitoring points at intervals of 50-100m perpendicular to the direction of the pipeline. This facilitates subsequent analysis of vibration propagation and ensures rationality in analysis. If there are changes in diversion pipeline material or cross-section, or if faults exist in the mountainous region, emphasis should be placed on testing in those areas. ②Within the plant area, measurement points need to be positioned near unit-related equipment with appropriate protective measures implemented for this region.③Vibration mainly affects residential areas and therefore relevant measurement points need to be arranged accordingly.
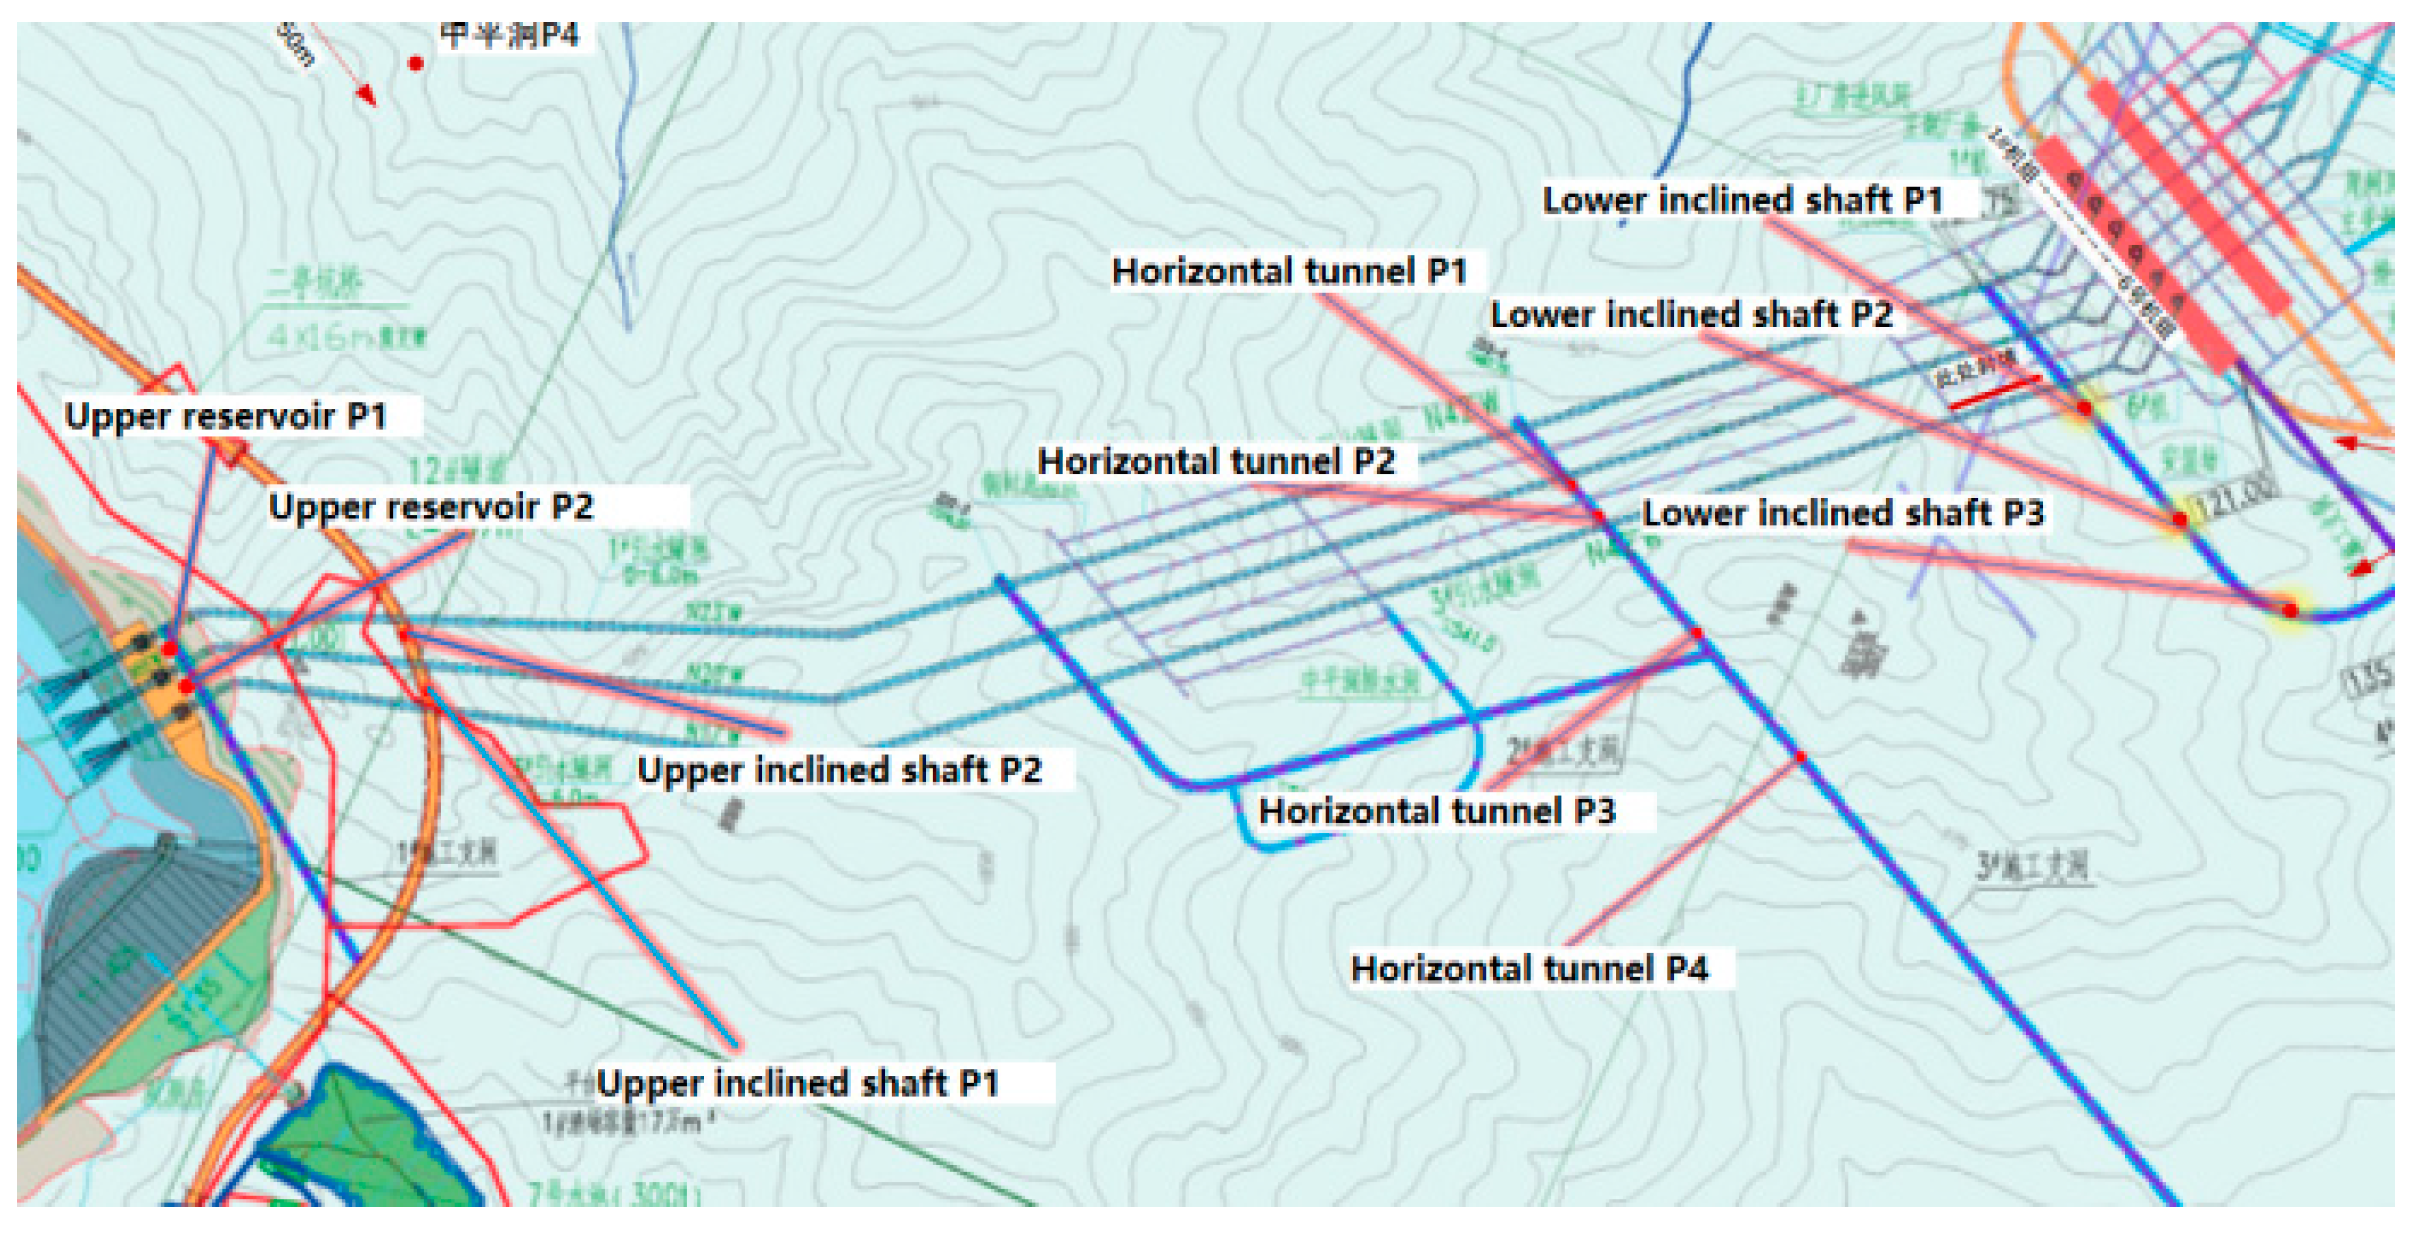
According to the description provided in the relevant geological data, the measurement points are positioned within the designated areas of the power station. Please refer to
Table 2 and
Figure 3 for a detailed illustration of their specific arrangement. It is worth noting that all measurement points have been equipped with vibration acceleration sensors.
2.3. Test Conditions
After nine days of data collection, data sorting, and analysis, the different operating conditions of six units in the power station have been classified. The primary test scenarios include pumping conditions for single, four, and five machines under varying load stability levels ,and power generation conditions for single, two, and three machines under consistent load stability are examined. Furthermore, shutdown condition serves as background reference condition to compare with the aforementioned scenarios. All relevant working conditions are presented in the table below.
2.4. Main frequency of vibration
According to relevant research findings, during unit operation, pressure pulsations generated within this bladeless area predominantly propagate upstream in the form of pressure waves [
13]. These pressure pulsations primarily correspond to the passing frequency of water pump turbine runner blades, with a majority exhibiting dominant frequencies that are integer multiples of the lobe frequency. The specific calculation formula for this phenomenon is presented below.
The rotor speed of the unit, denoted as n
H, is a crucial parameter in this study. Z
1 represents the number of rotor blades, K typically denotes the integer coverage coefficient of the rotor blade path to the guide vanes [
14]. In other words, K can be obtained by rounding off the ratio between the number of rotor blades and active guide vanes. For CLS-PSPS:
2.5. Vibration evaluation standard
There is currently no globally unified standard for evaluating ambient vibration and noise, including specific standards for the diversion pipe area of PSPS. The existing research on vibration and noise in this area primarily relies on urban area noise and vibration standards. The regional ambient vibration control standards for the diversion pipe of CLS-PSPS are mainly based on GB10070-88 [
15] standard of vibration in urban area environment.
Table 4 presents the standard values of vertical Z-vibration levels in various urban areas. The subsequent analysis also considers Z(vertical) as a reference.
According to the regional characteristics of CLS-PSPS, the vibration standards for residential, cultural, and educational areas are applied in the primary zones, while certain areas adopt the vibration standards for mixed areas. (A "mixed area" refers to a general commercial and residential area or an industrial, commercial, light traffic, and mixed residential area.) The level of vibration acceleration is defined as 20 times the logarithm base 10 of the ratio between acceleration and baseline acceleration, expressed as VAL in decibels. The following formula illustrates this.
Where, a, is the effective value of vibration acceleration. a0=10-6m/s2,is the base acceleration.
According to the vertical vibration level standards of various urban areas, the daytime vibration in the diversion pipe area during normal operation of CLS-PSPS should not exceed 70dB (0.316gal), while the nighttime vibration should not exceed 67dB (0.224gal). The vibration levels in specific regions should not exceed 75dB (0.562gal) during the daytime and 72dB (0.398gal) at nighttime, and 1 gal = 1cm/s2.
2.6. Vibration inducement
In the operational process of a pumped storage hydropower plant, there exist five fundamental conditions (shutdown, power generation and phase control, operation of power generation, pumped storage, and pumped phase control) along with twelve specific conditions. The transitions between these conditions can result in increased vibrations within the plant structure. It is theoretically expected that no vibrations occur during the shutdown condition; Therefore, the non-shutdown conditions were compared with the shutdown conditions.
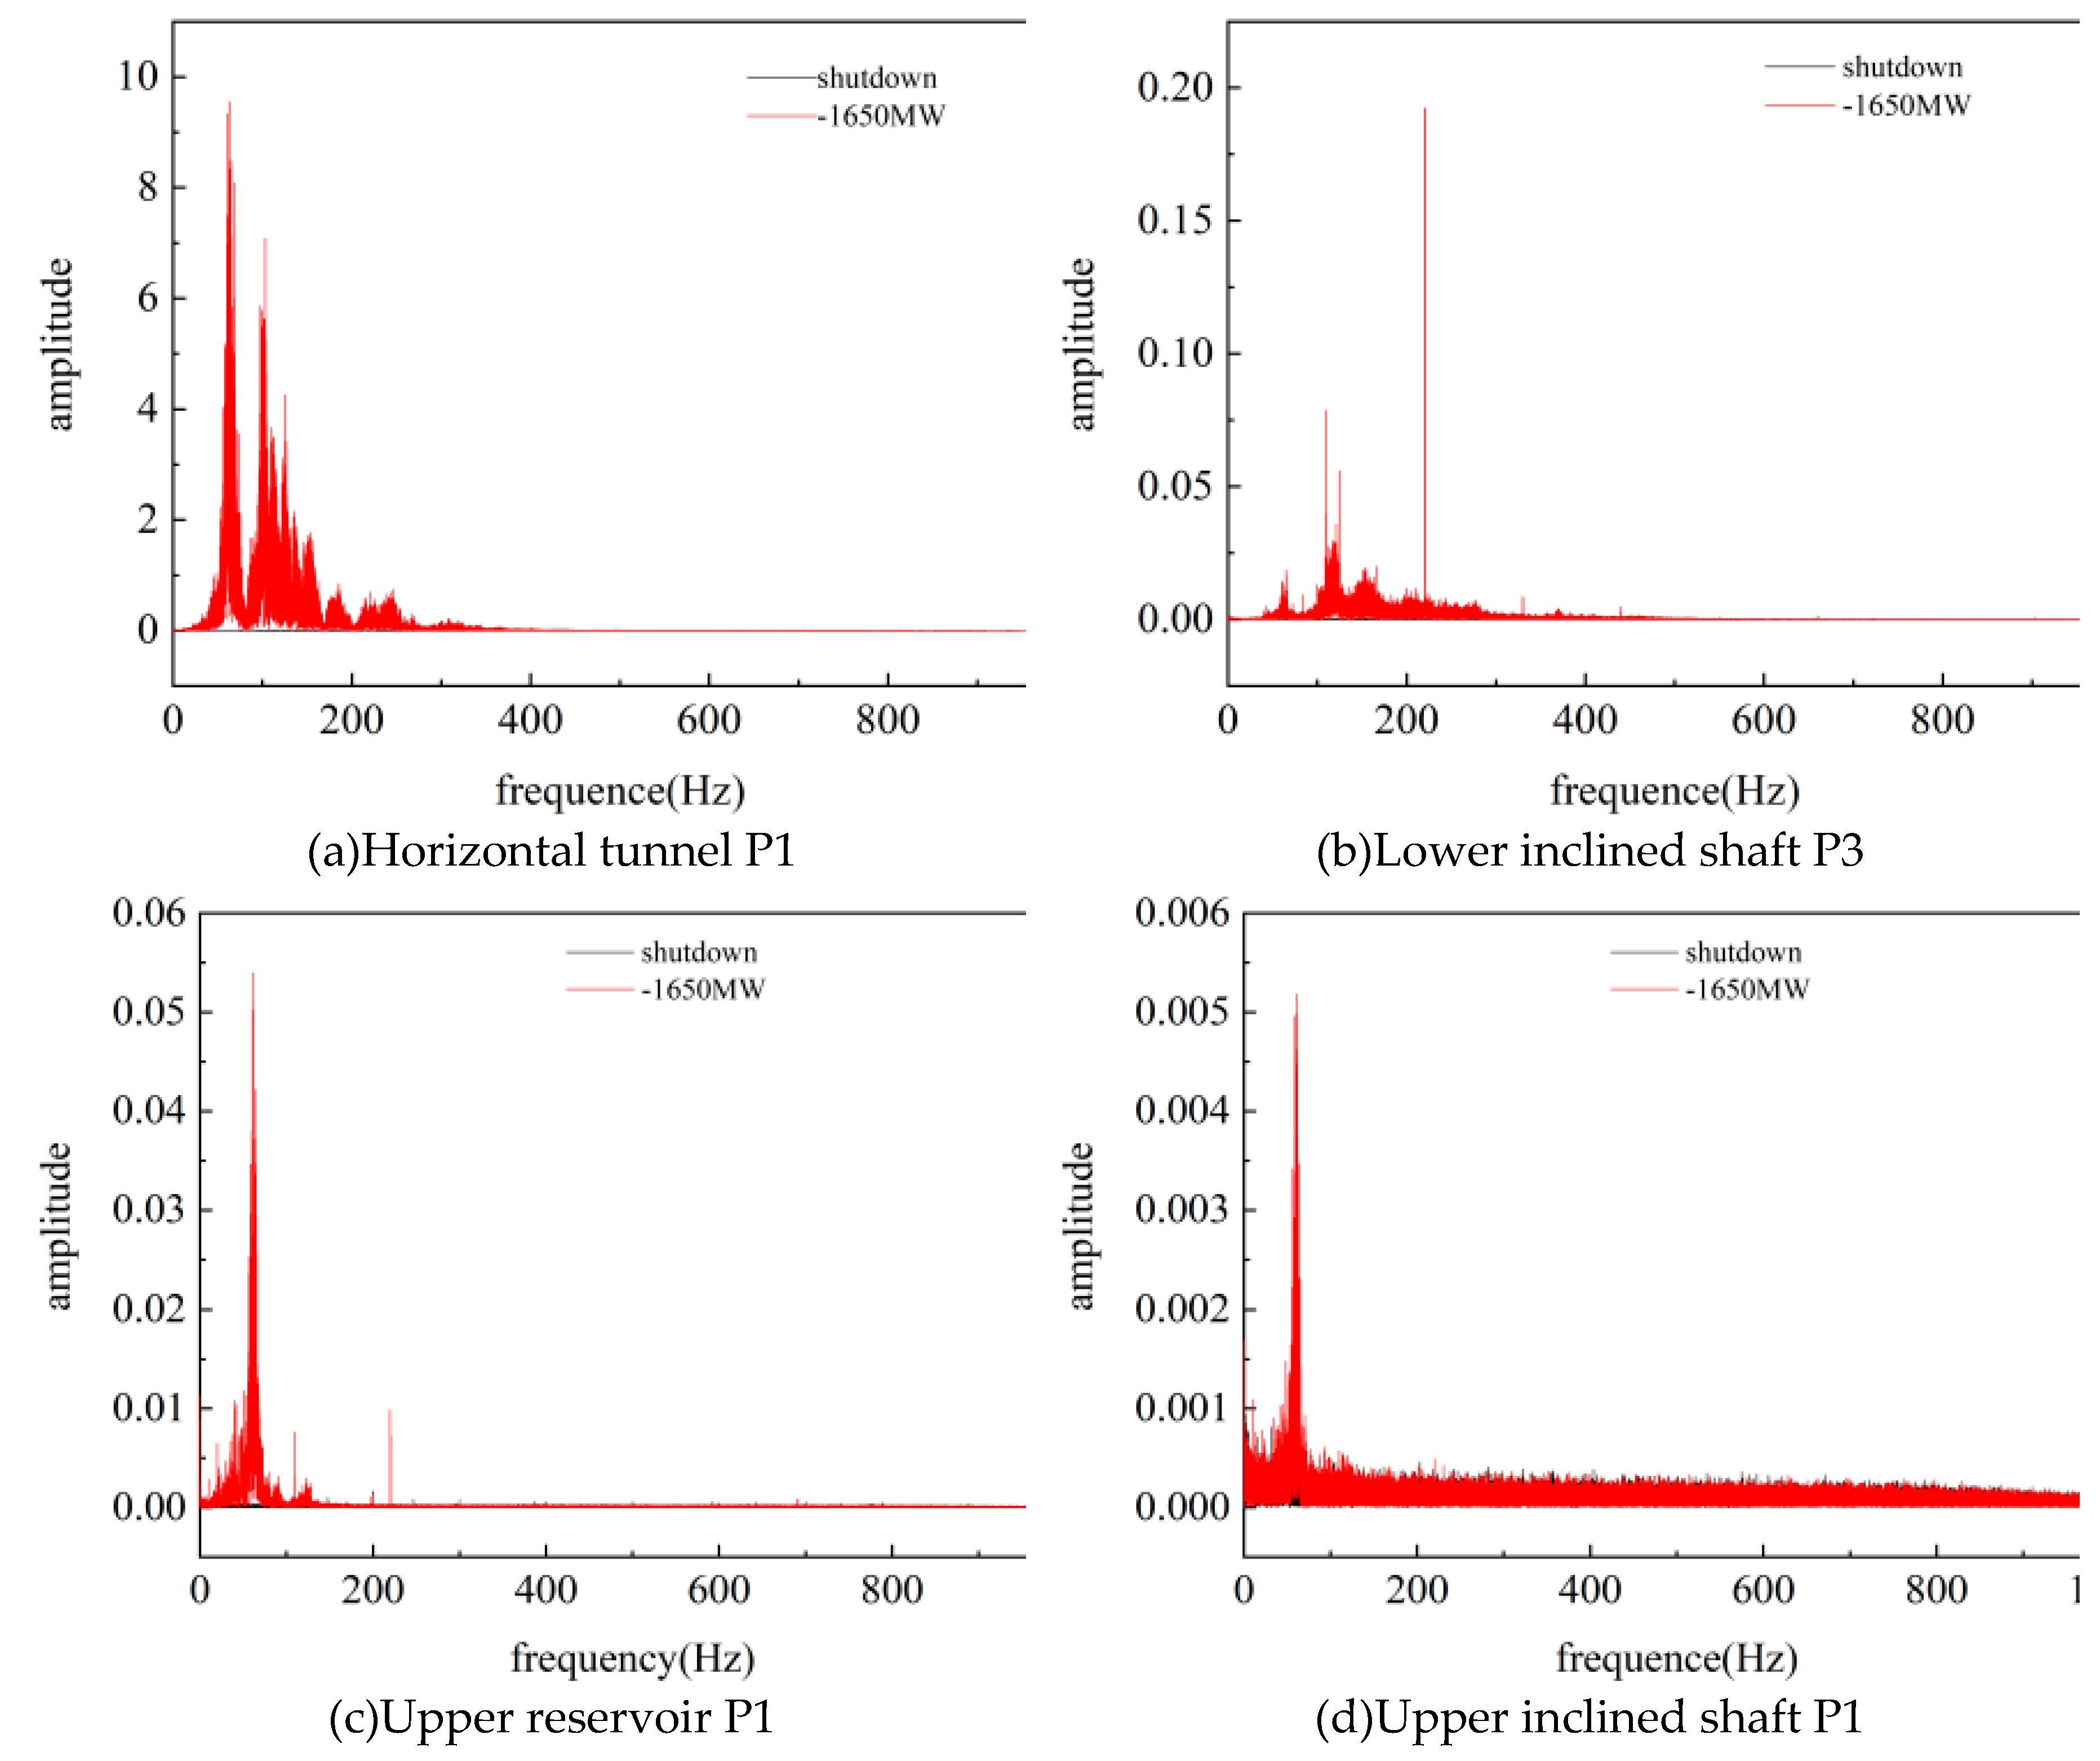
Before the test, a portable vibration calibrator is utilized to perform calibration on the acceleration sensor, in order to minimize measurement errors during testing and facilitate comparison with the shutdown conditions. The measured data was processed using a Butterworth filter to attenuate irrelevant frequency components, and the detrend function was applied to remove data trend items and reduce external environment interference. Subsequently, the Z-direction vibration acceleration spectrum diagram, time history, and average vibration accelerometer were obtained for each measurement point in
Figure 4:
The above results indicate that under the shutdown condition, the z(vertical) vibration acceleration of each measurement point is negligible, and the frequency spectrum closely resembles white noise. Under the pumping condition, however, the Z(vertical) vibration acceleration at each measurement point significantly increases compared to the shutdown condition. Moreover, a dominant frequency emerges in the frequency spectrum which aligns with vibrations induced by an inhomogeneous flow field of the worm shell, including one-fold and two-fold frequencies. This comparison highlights that ambient vibrations resulting from unit operation primarily contribute to these observed and analyzed vibration signals. Additionally, when analyzing data under power generation conditions, it was found that the vibration intensity spectrogram resembled that of pumping conditions; Therefore, further elaboration is unnecessary.
3. Ambient vibration analysis
3.1. Ambient vibration characteristics of water diversion pipeline area
The pumped storage power station is located in mountainous regions characterized by intricate topography, diverse geomorphological types, varied geological formations, significant lithological variations within the mountains, and poor engineering geological properties of the geotechnical body. Moreover, the water diversion pipeline is buried at considerable depths along an extensive route, which can have a notable impact on the propagation of vibrations. Therefore, this chapter primarily aims to analyze the influence of Z (vertical) vibrations originating from ground surfaces. This analysis encompasses studying the propagation laws of ground and pipeline vibrations as well as developing a unit model for assessing their effects.
3.2. Ground vibration
3.2.1. Arrangement of measuring points
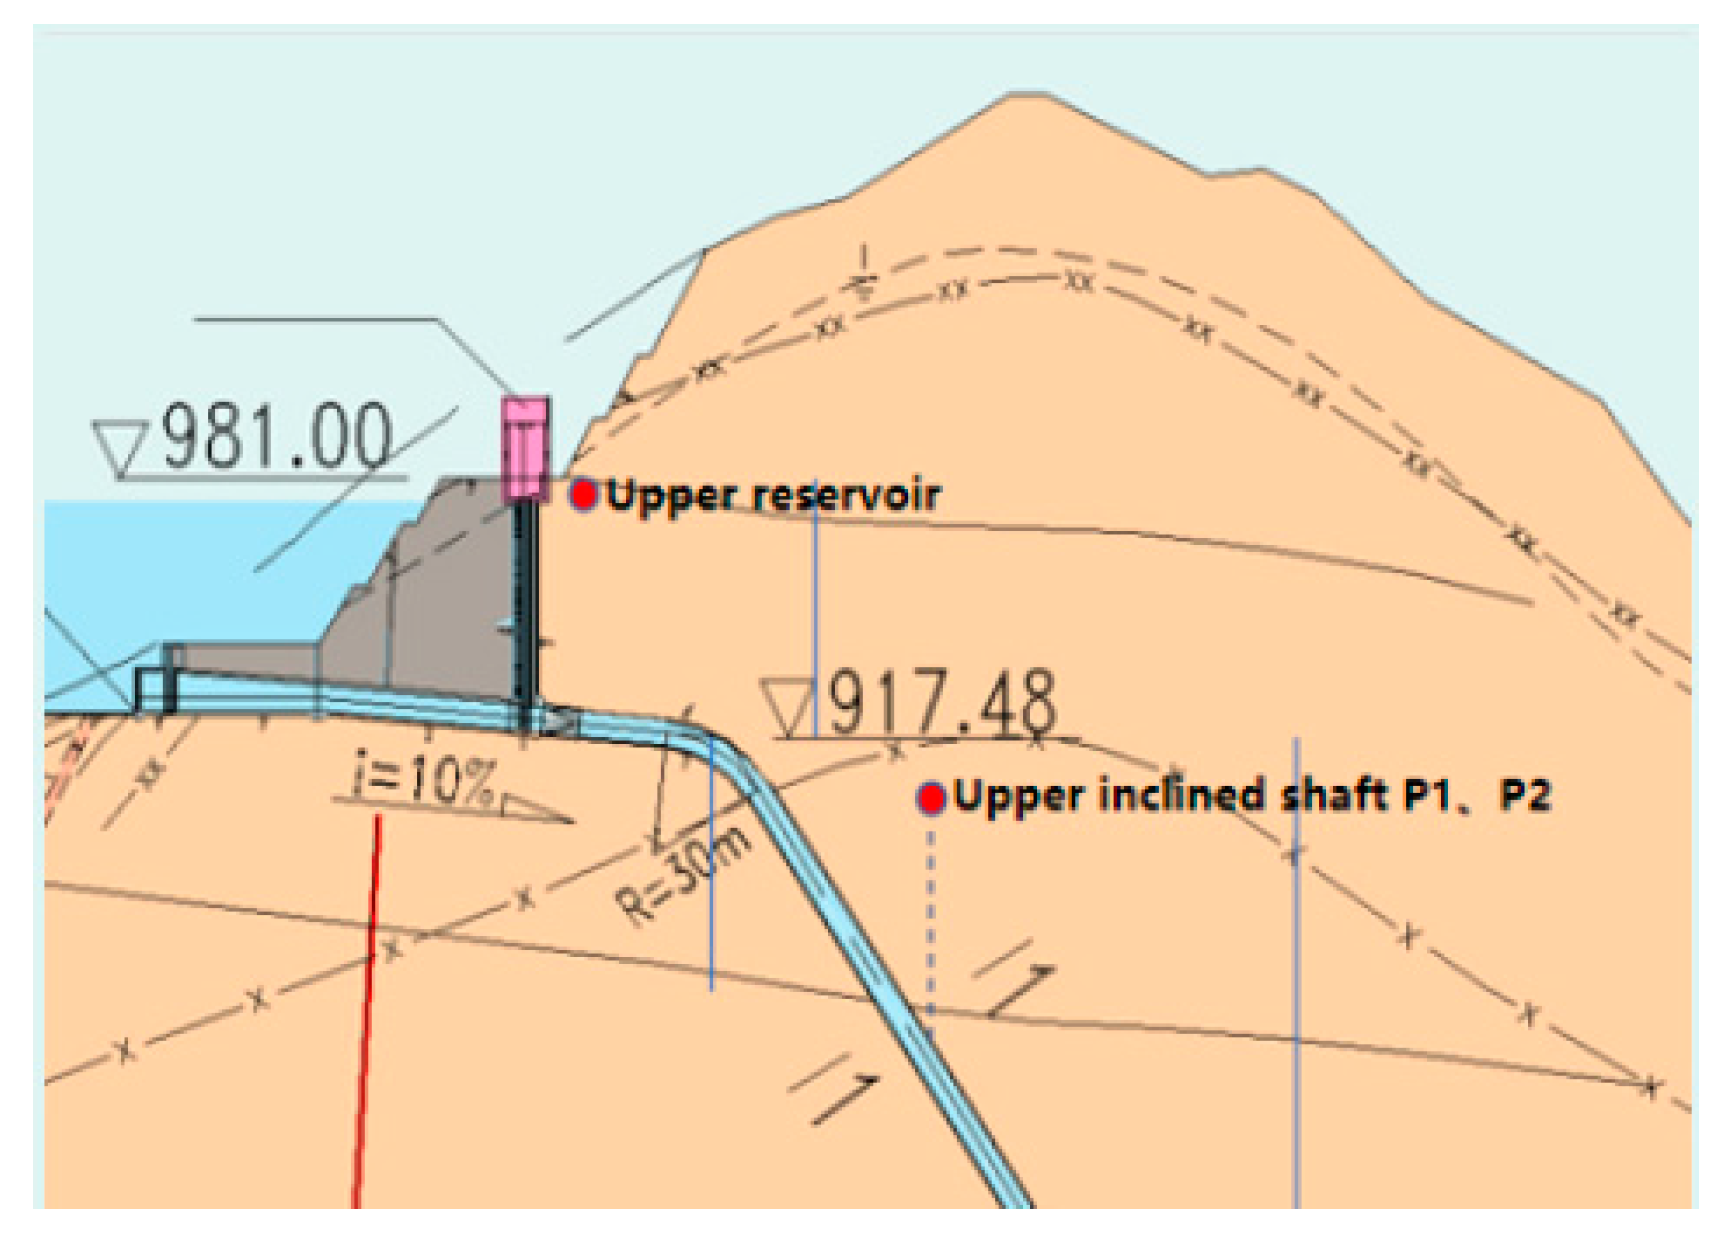
The measuring points in this test, including upper inclined shaft P1, upper inclined shaft P2, and the upper reservoir measuring points, are ground-based measurements located near the upstream side of the pipeline with a similar relative position.
Figure 5 illustrates their precise locations.
Considering the intricate operational dynamics of power plant units, frequent variations in working conditions, and inter-unit interactions, this study examines the following two aspects: ① The impact of total pumping power on vibration levels across different pipe sections. ②The propagation patterns of vibrations at various pipe sections under rated power.
3.2.2. The influence of total pumping power on vibration at different pipe segments
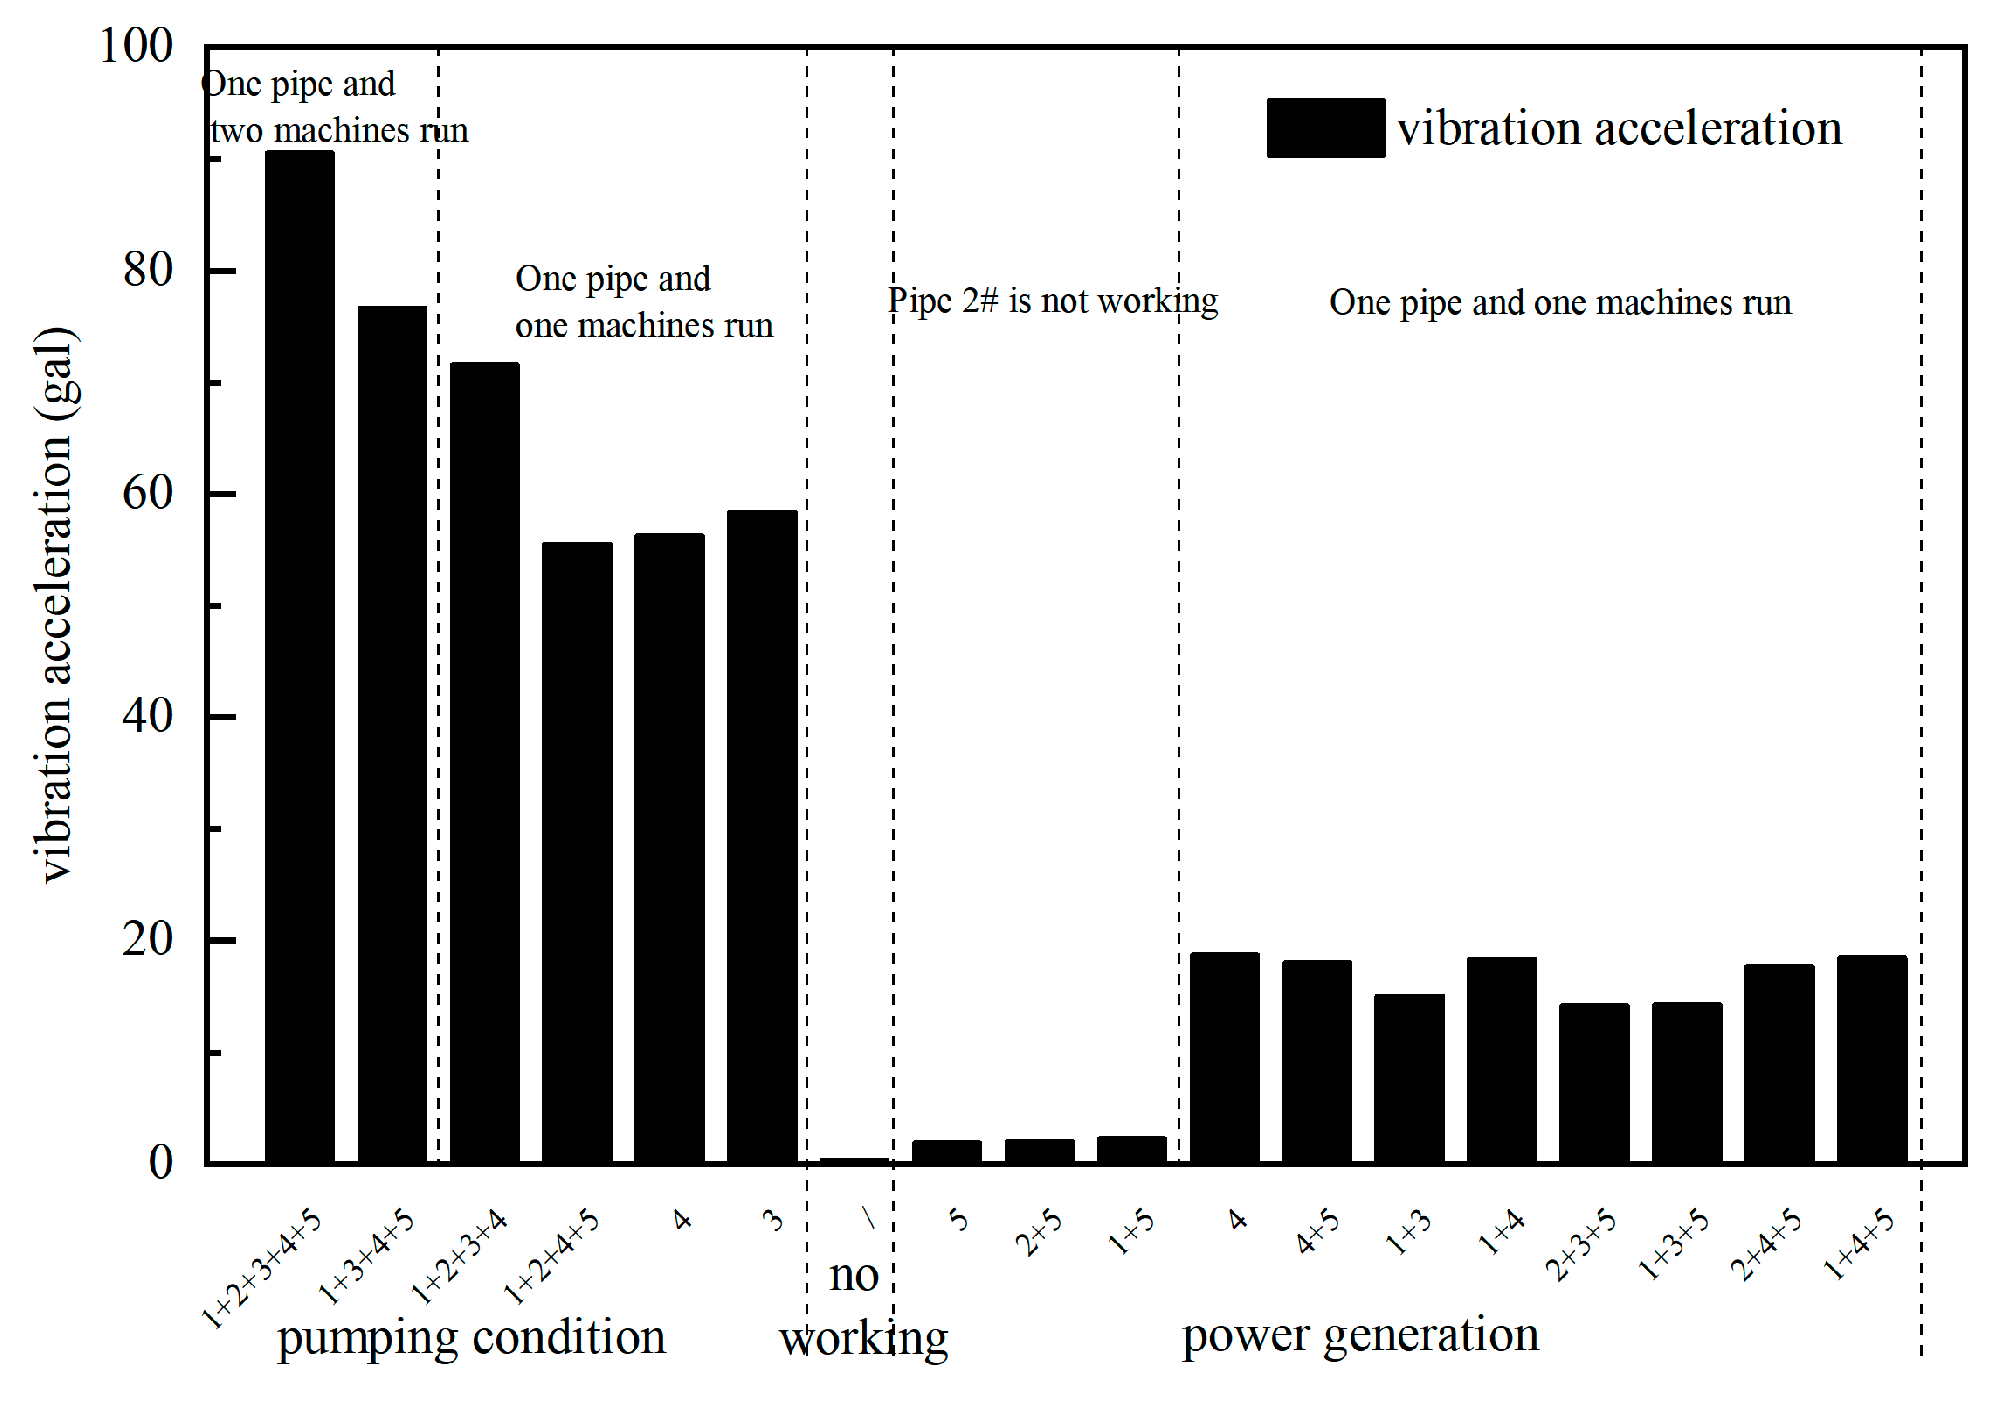
The vibration acceleration of upper reservoir P1, P2, and upper inclined shaft P1, P2 was analyzed and calculated for different total pumping power levels.The corresponding numerical values are presented in
Figure 6.
3.2.3. Vibration propagation law at different pipe segments under rated power
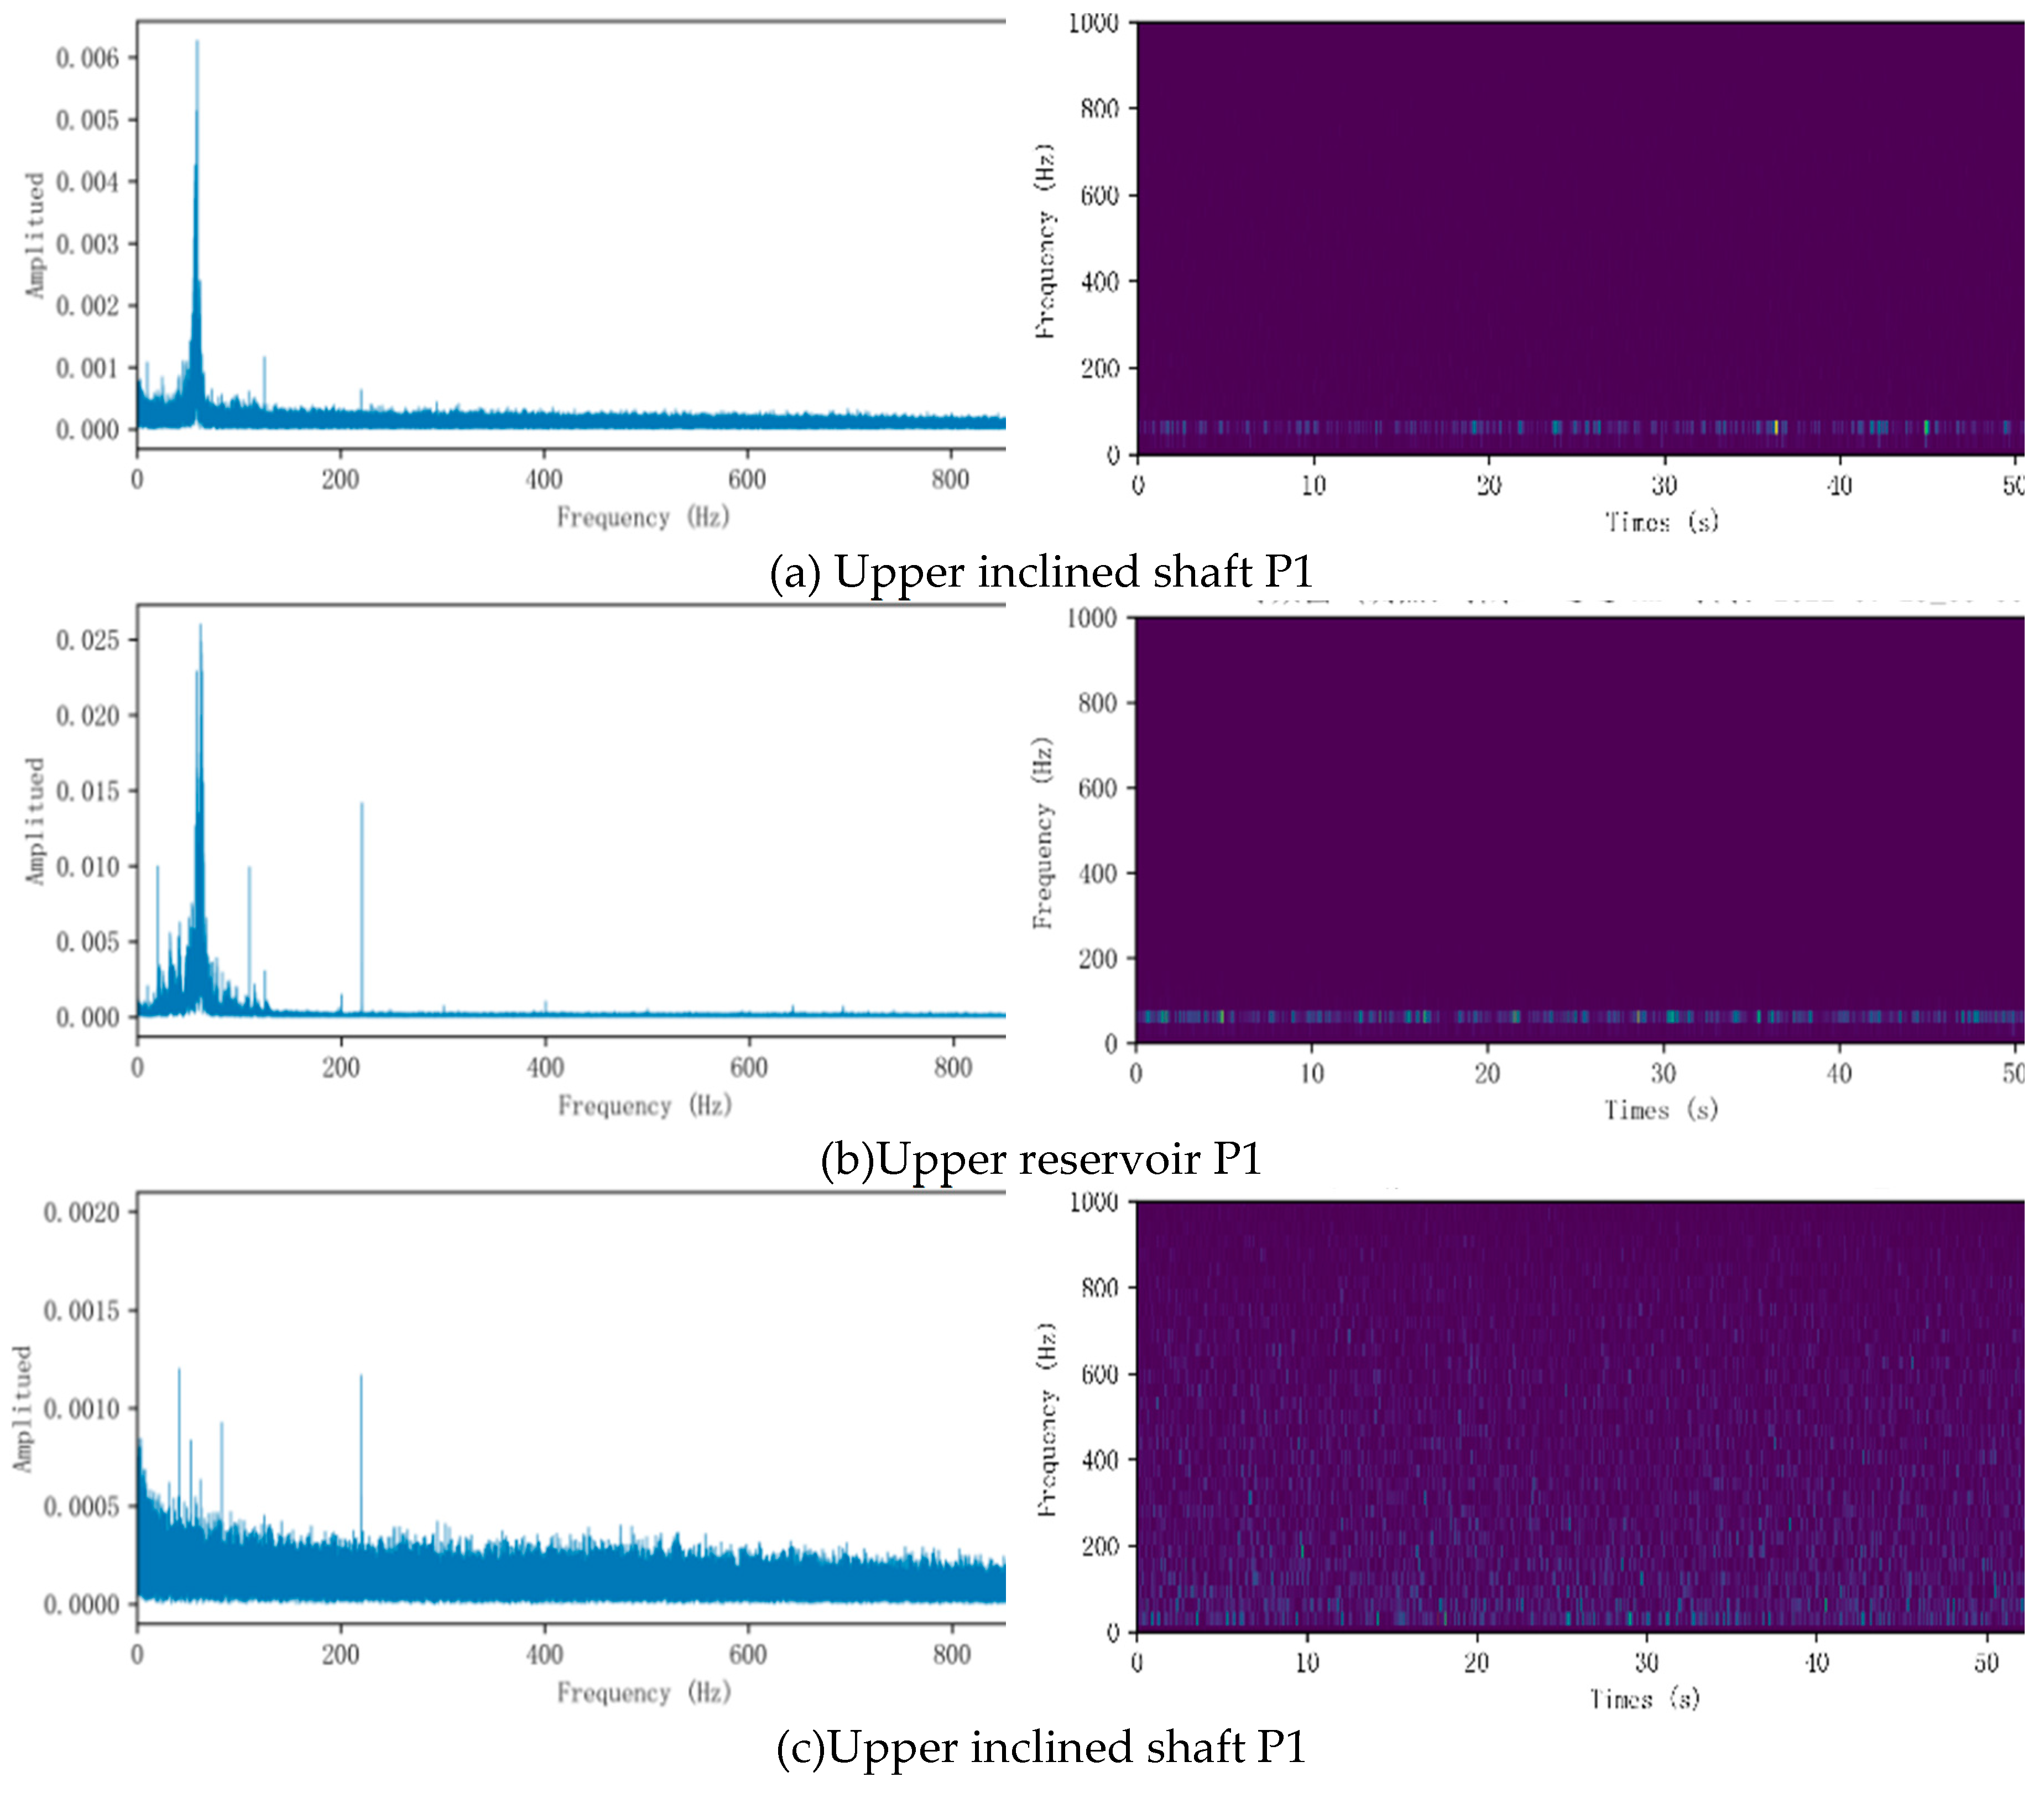
The vibration intensity generated by upper inclined shaft P1 and upper reservoir P1 was analyzed for the pumping in condition 2(1-2-4-5#, -1380MW) as well as the generating in condition 17 (1#4#5#, 1050MW). The spectrum diagram reflects the consistency between the analysis data and actual conditions, while the time-frequency diagram reveals the internal relationship between frequency and power. The calculation results are presented in
Figure 7.
3.2.4. Summary
Based on the vibration acceleration depicted in
Figure 6,①under power generation conditions, as the full-field power increases, the vibration levels near the upper reservoir and upper inclined shaft remain below 0.1 gal, which is comparable to shutdown condition. This suggests that a significant portion of the vibration energy generated during unit operation is attenuated when it propagates towards the vicinity of the upper reservoir, rendering ground vibrations caused by unit operation negligible at this location.②Under pumping conditions, however, both measurement points at the upper reservoir experience increased vibrations with an increasing number of pumping units, even several times higher than those observed during power generation conditions. Additionally, under pumping conditions, vibrations at both measurement points near upper reservoir also increase with an increasing number of pumping units and are even several times higher than those observed during power generation conditions.
3.3. Pipeline vibration
3.3.1. Arrangement of measuring points
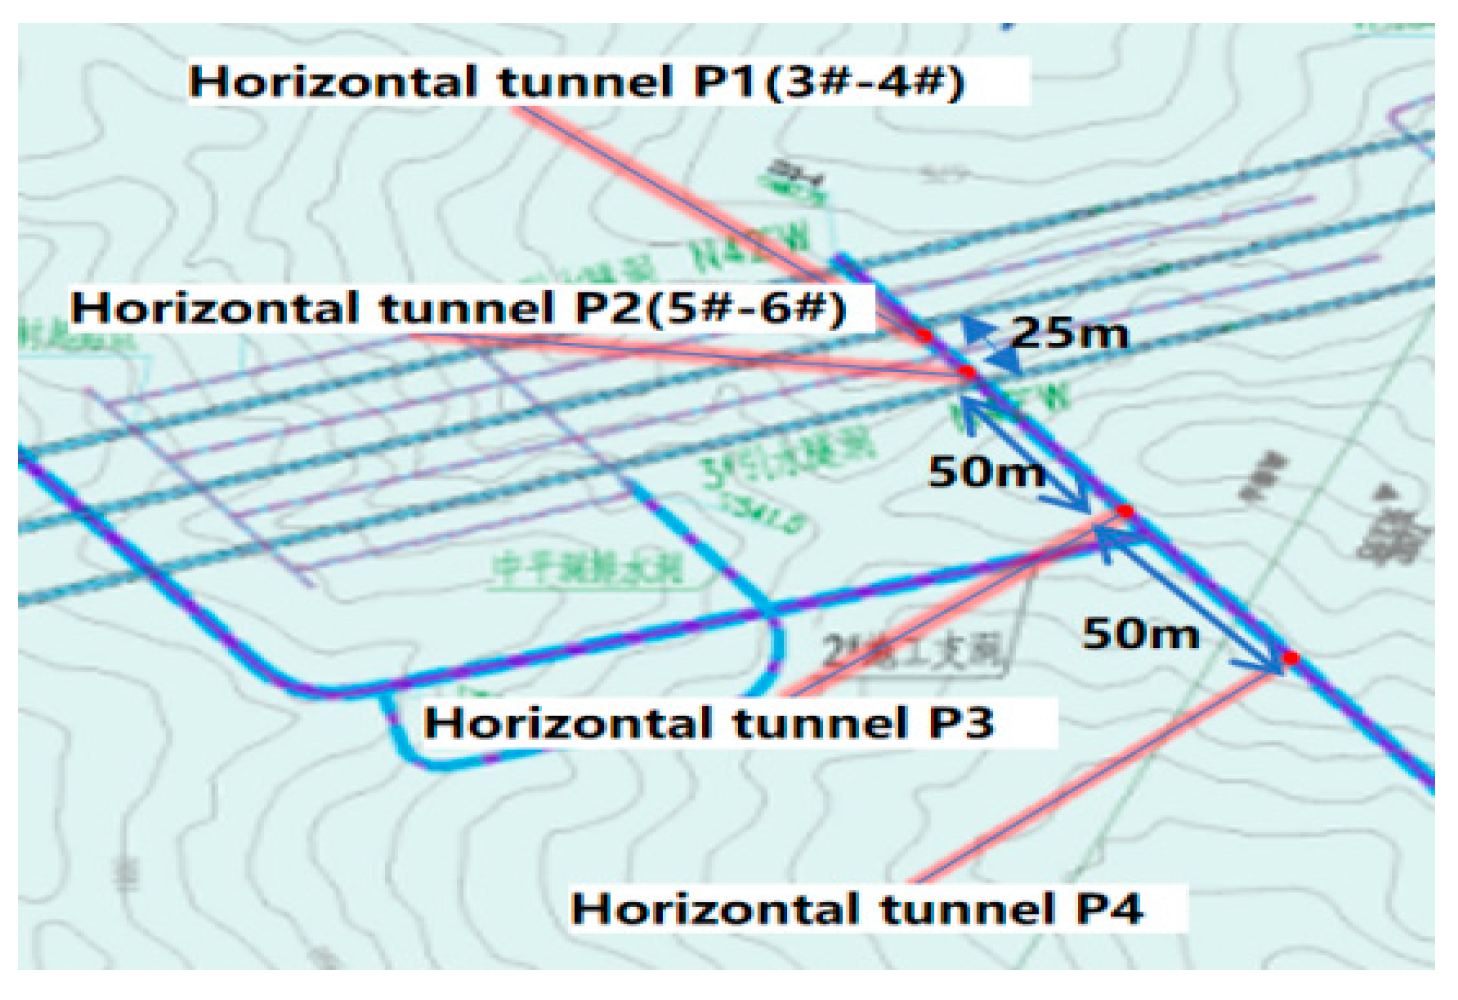
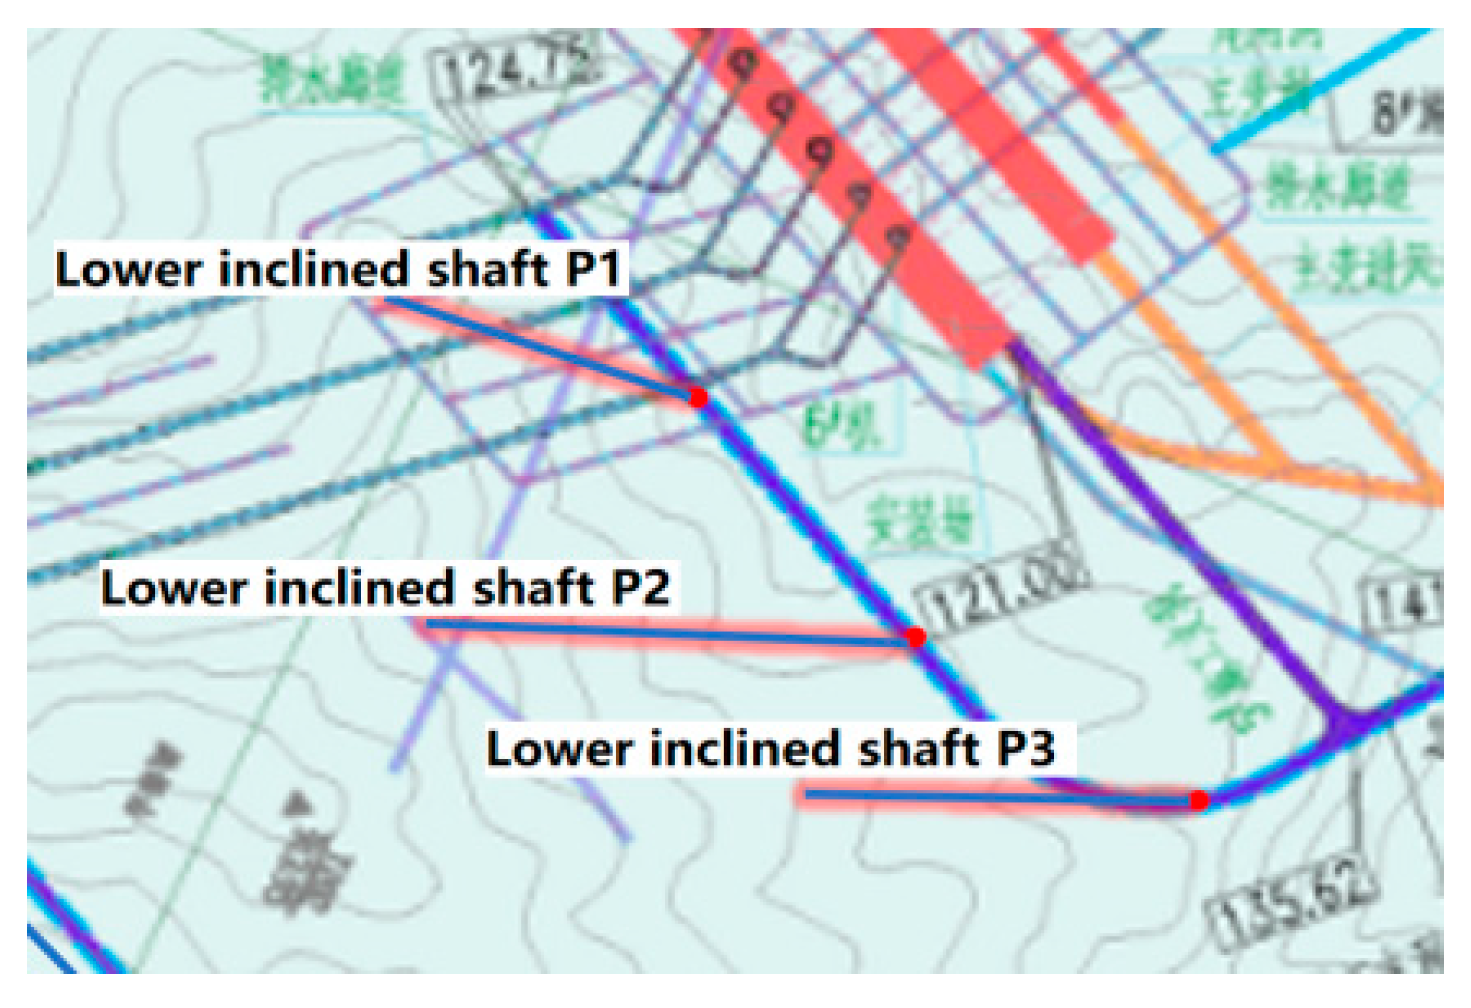
As depicted in
Figure 8, a small section of exposed steel lining is present in the latter half of the middle flat section of CLS-PSPS’s diversion pipeline for the purpose of facilitating maintenance. Access to this section can be obtained through the 3# construction branch. Furthermore, as shown in
Figure 9, proximity to the upstream side of the high-pressure fork pipe in the lower flat section can be reached via the 4# construction branch. The end of the branch is in close proximity to the currently obstructed 3# diversion pipeline (which corresponds to units 5# and 6#), making it unfeasible to directly install vibration monitoring points on the diversion pipeline. Measuring points P1 and P2 within horizontal tunnel are directly connected with units 3#-4#’s and units 5#-6#’s respective diversion pipelines, experiencing negligible external interference. The collected data during testing originates solely from vibrations generated by these pipelines during unit operation.
3.3.2. Self-vibration of P1 pipeline in Horizontal tunnel
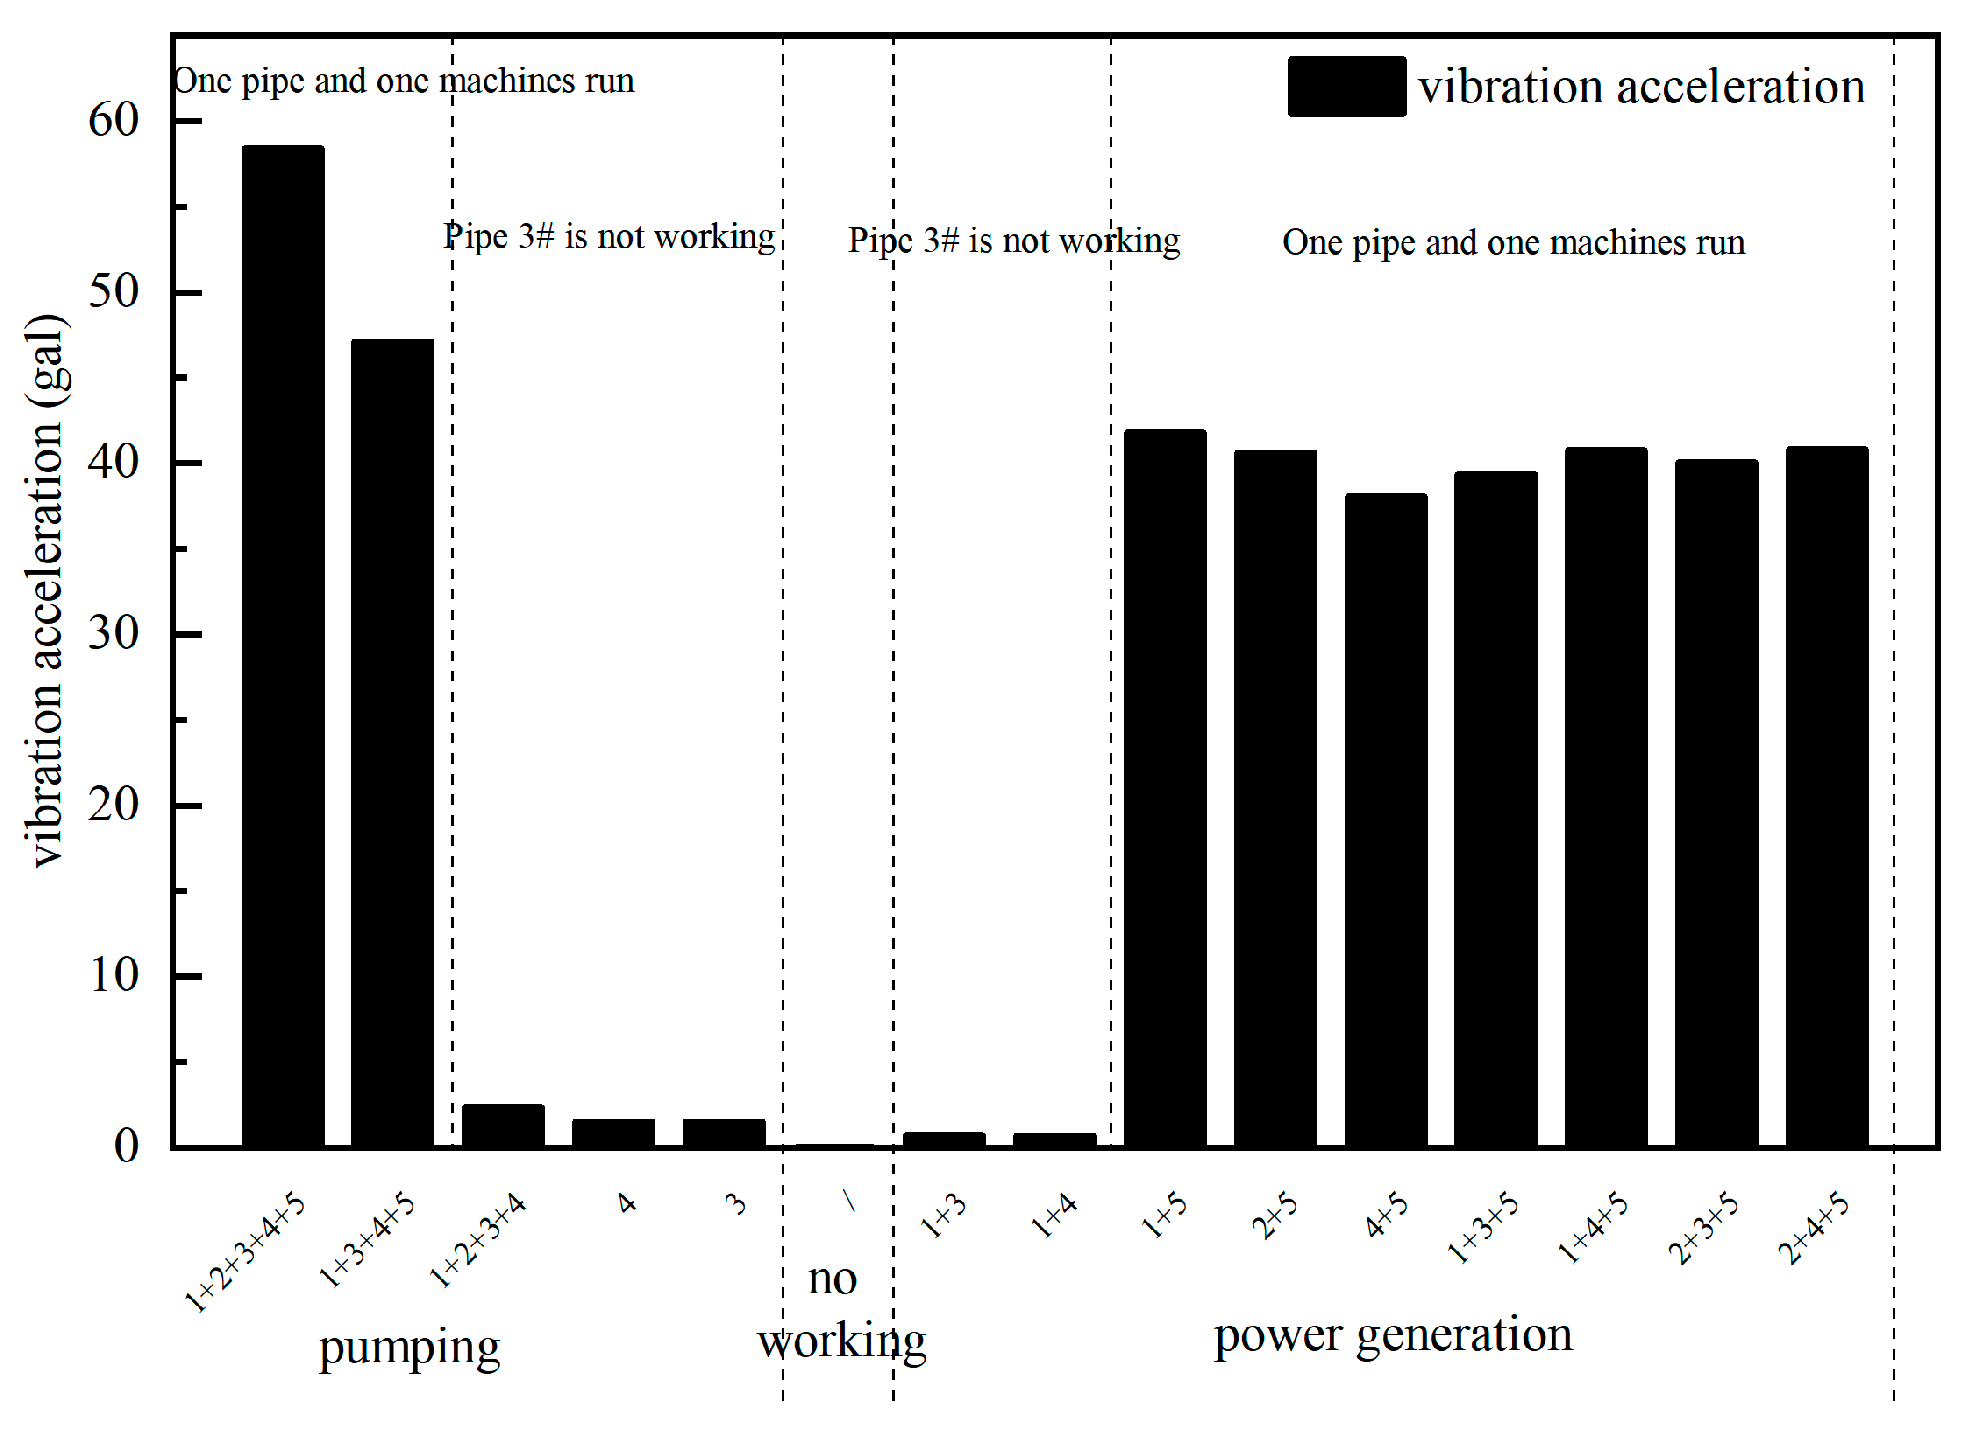
To assess the potential resonance effects among multiple units and their impact on test results, an analysis was conducted at the P1 measurement point in horizontal tunnel, focusing on pumping and power generation conditions. The 3# or 4# units were operated individually, in combination with other units, and collectively with all units. Additionally, a reference comparison was made under simultaneous shutdown conditions. The specific test results are presented in
Figure 10.
3.3.3. Self-vibration of P2 pipeline in Horizontal tunnel
Considering the same situation as horizontal tunnel P1, the classification is not elaborated the specific test results are presented in
Figure 12:
3.3.4. Summary
Based on the analysis results, it can be concluded that:
In general, the vibration intensity under pumping conditions is significantly higher than that under power generation conditions. Under the same operational condition, the pipeline experiences approximately three times greater vibration intensity during pumping compared to power generation. As depicted in
Figure 11, the vibration spectrum of the pipeline under pumping conditions exhibits a relatively complex pattern with substantial energy concentrated within the frequency range of 50~150Hz; whereas under power generation conditions, the spectrum appears simpler and indicates concentrated vibration energy at a main frequency around 125Hz.
Dual operation condition leads to an increase in pipeline vibration strength by approximately 20% to 50% compared to single operation condition.
When units corresponding to pipelines #3 and #4 are not operated but adjacent pipelines are started up, vibrations generated near those pipelines are significantly higher than background ambient vibrations after shutdowns have been completed. However, when analyzing unit operation parameters' influence on pipeline vibrations, propagated vibrations from adjacent pipelines can be disregarded as they are smaller compared to vibrations generated by their respective unit operations for individual pipelines.
A comparison of the vibration spectra between pumping and power generation conditions (Fig 13) reveals that both scenarios exhibit dominant frequency components at 220Hz in the pipeline's vibration spectrum, along with a secondary component around 110Hz, indicating concentrated vibration energy for Unit 5# regardless of operational mode (pumping or power generation). The noticeable disparity in vibrations observed for the water diversion pipes of Units 2# and 3# can be attributed to differences in manufacturers between Units 1#~4# and Units 5#~6#.
3.4. Vibration distribution law along the pipeline
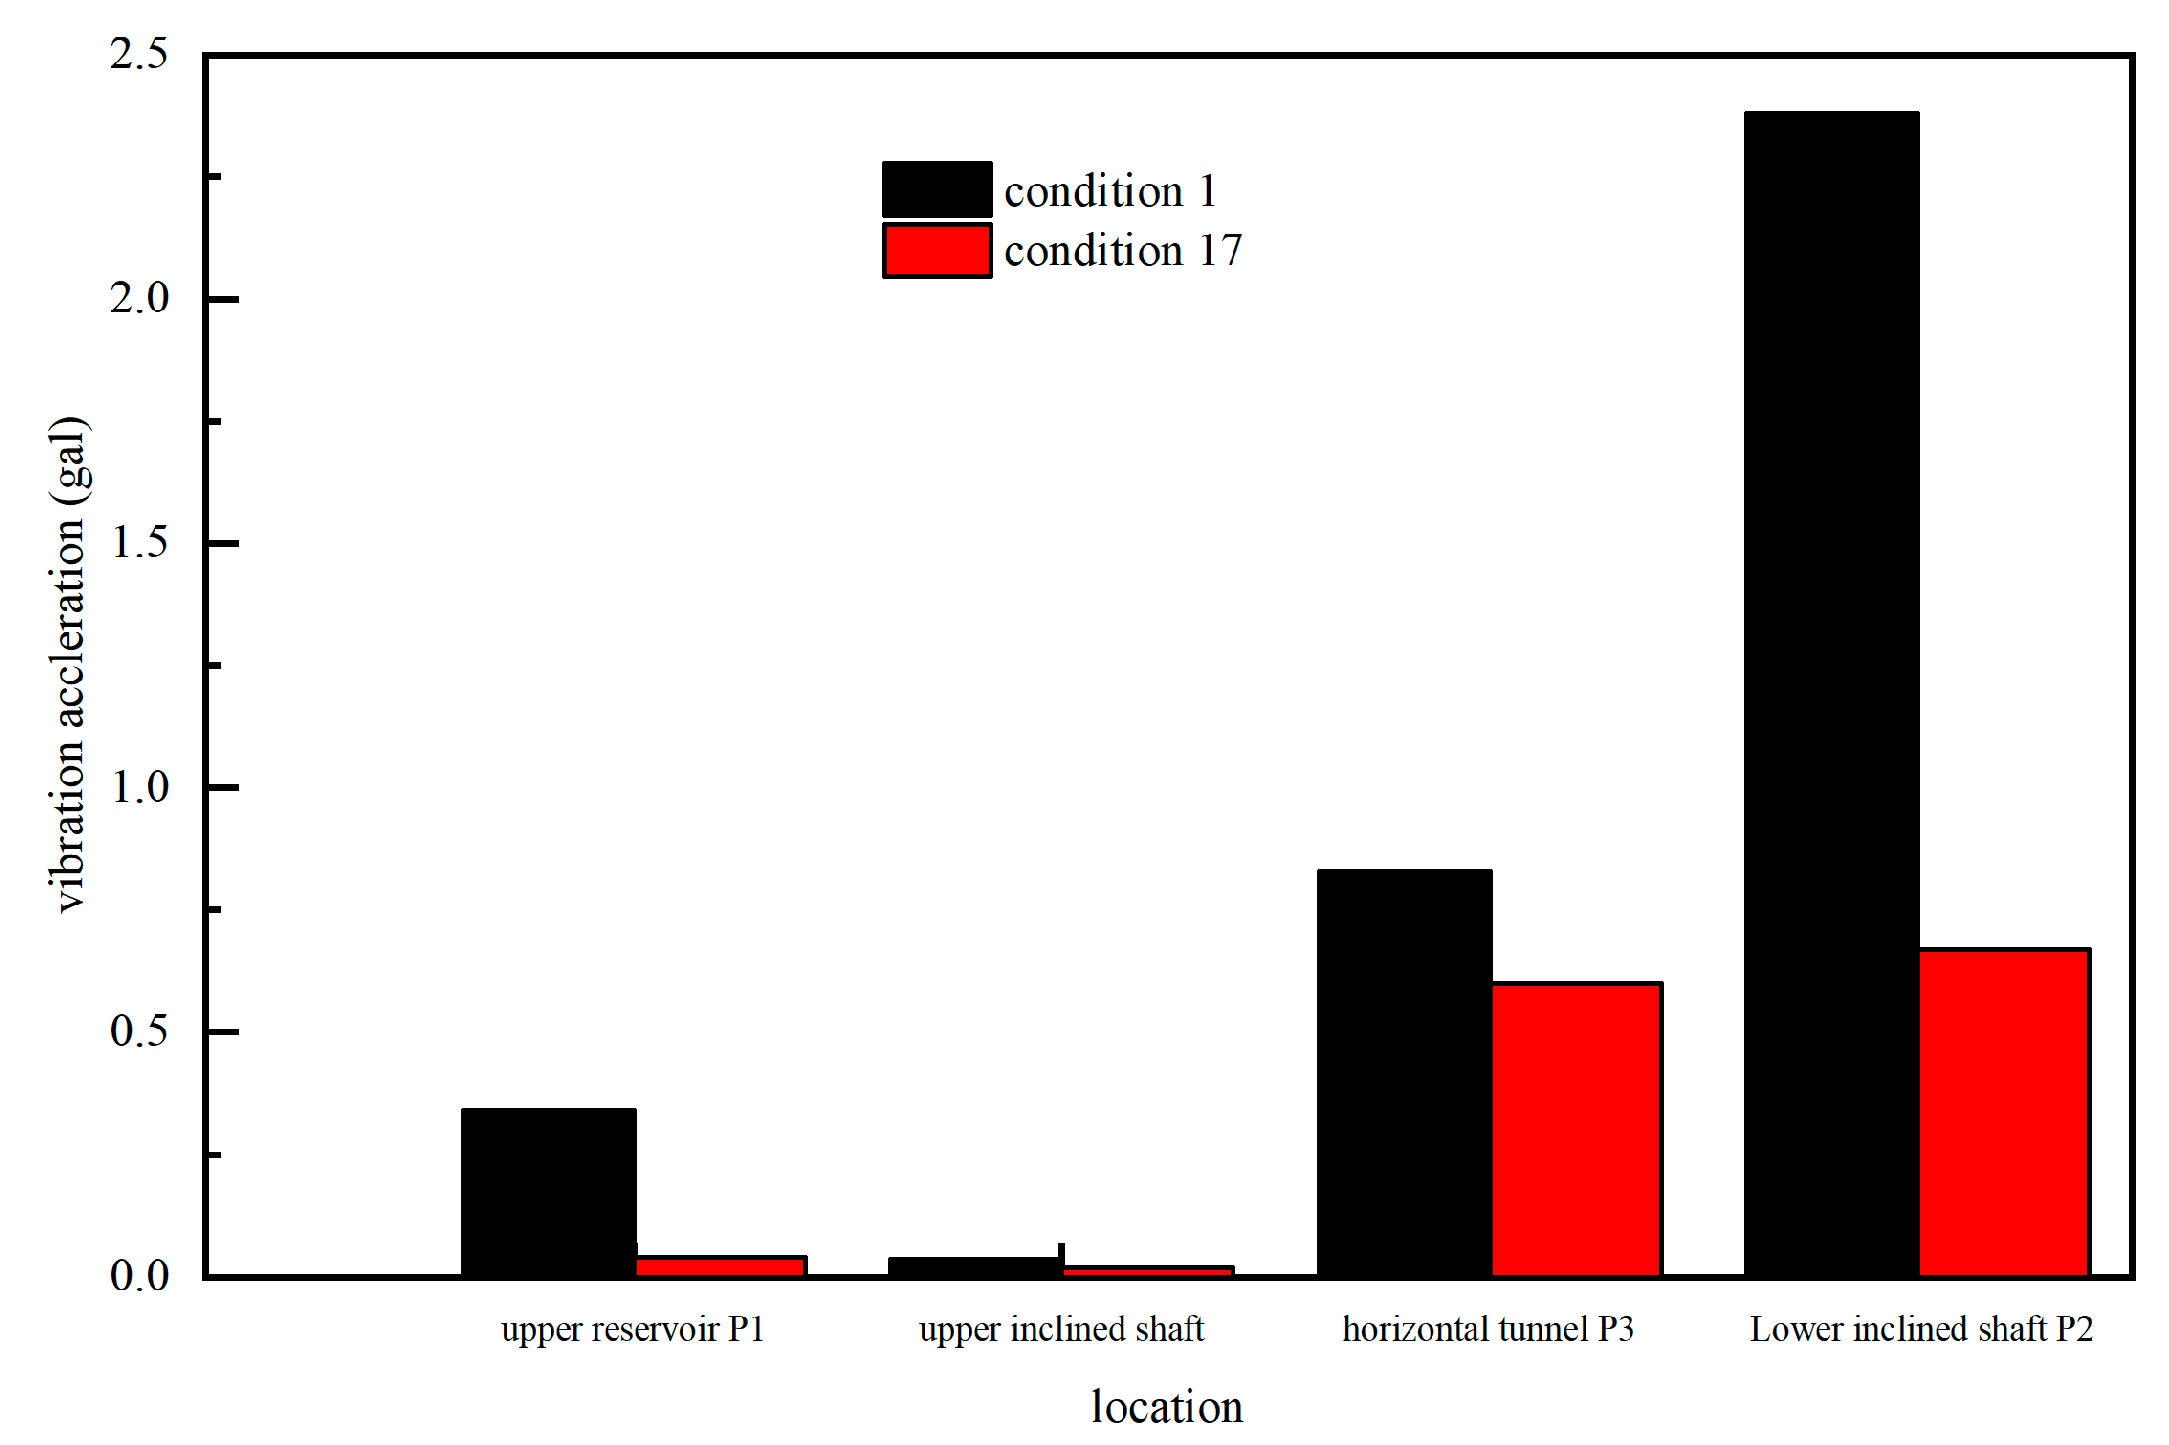
Based on the analyzed data, the vibration distribution pattern along the pipeline is summarized. Subsequent analysis is conducted for working condition 1 (five units pumping, -1650MW) and working condition 17 (three units power generation, 1050MW), and the corresponding results are illustrated in
Figure 14.
The root mean square of vibration acceleration at four measurement points was primarily selected for comparison in this study.These measurement points were positioned in increasing proximity to the vibration source, specifically upper inclined shaft P1, upper reservoir P1, horizontal tunnel P3, and lower inclined shaft P2.The minimum distance between the four measurement points and the water inlet pipe was approximately 50m. As illustrated in
Figure 14, when considering equidistant locations from the pipeline, closer downstream positions exhibited higher levels of vibration due to the actual vibration source originating from the unit runner. The vibration acceleration of the measuring point P1 in the upper reservoir is higher compared to that of the measuring point in the upper inclined well ,due to its closer proximity to the units of the upper reservoir and a shorter distance between it and the diversion pipe. Vibration during pumping conditions exceeded that observed during power generation.
3.5. Effect of unit type on vibration of diversion piping
It is noteworthy that the units of Power Station are supplied by two prominent manufacturers, namely Dong fang Motor and Voith, respectively, which:
The 1#~4# units, supplied by Dong fang Motor, are equipped with a combination of 5 long blades and 5 short blades, corresponding to the number of movable guide vanes being 16. The rotational speed of these units is set at 500 r/min. Additionally, the 1#~2# units share the same diversion pipeline (designated as the 1# pipeline), while the 3#~4# units share another diversion pipeline (designated as the 2# pipeline).
The turbine units, supplied by Voith, are equipped with 11 blades and 20 movable guide vanes. The rotational speed is set at 600 revolutions per minute, and the units numbered 5 and 6 share 3# diversion pipe.
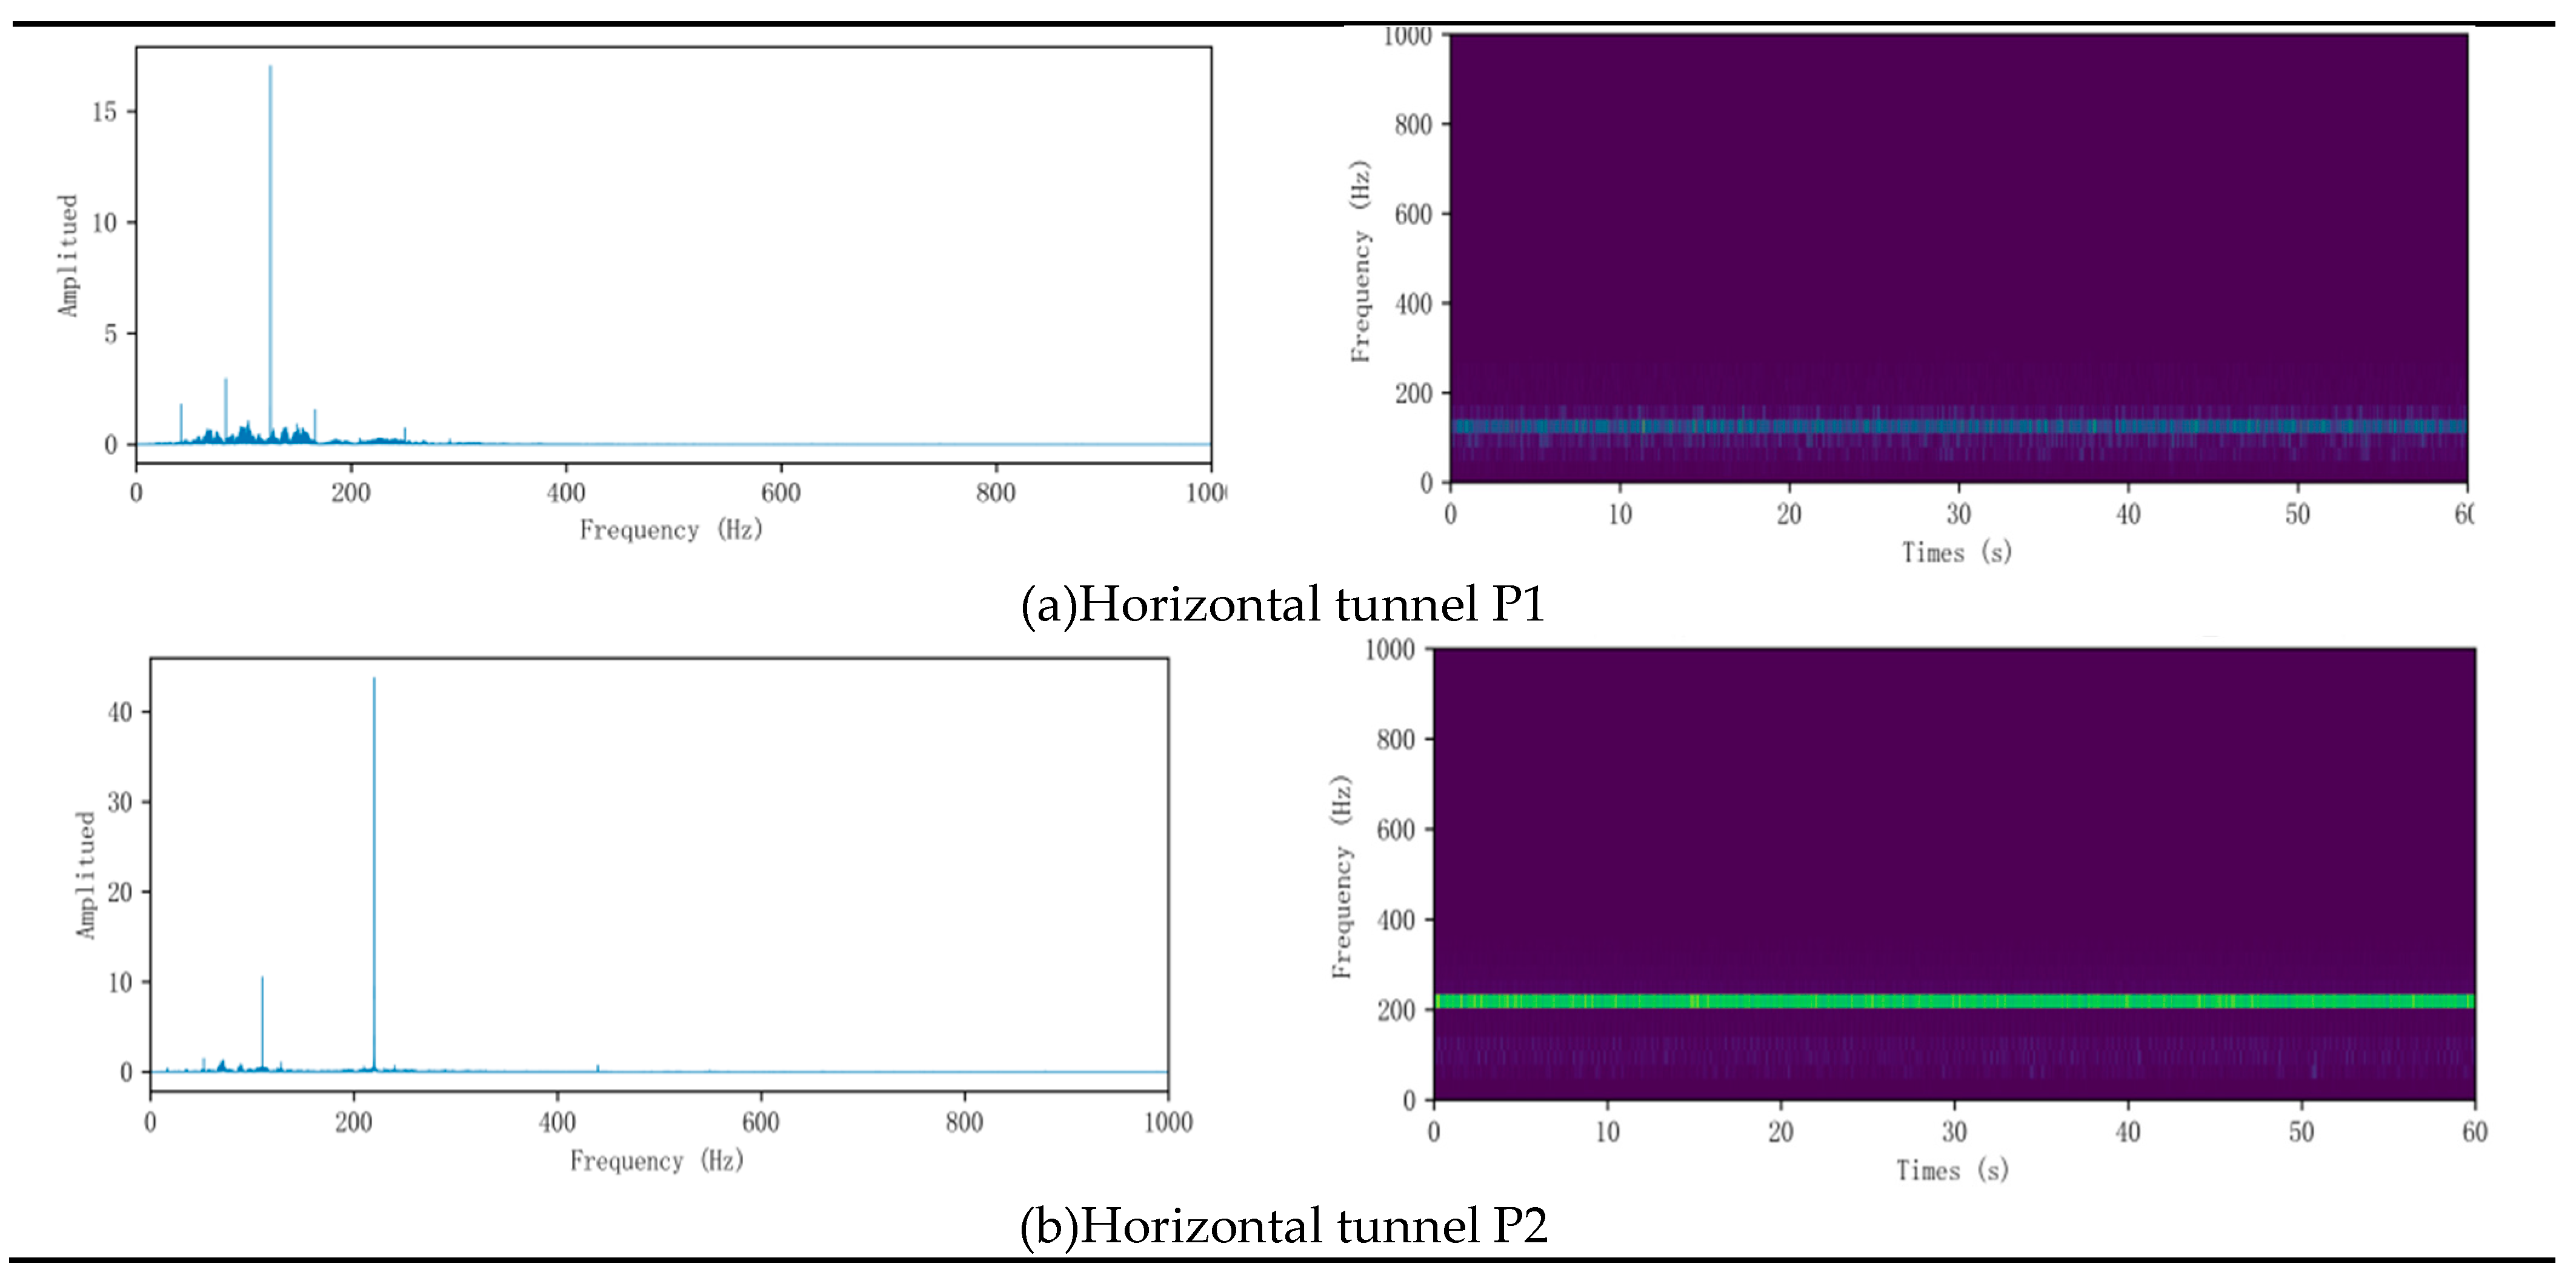
Given that different unit models may have varying effects on vibration under identical working conditions, a brief analysis of various units was conducted in working condition 13 (1# and 4# power generation, 700MW) and working condition 12 (1# and 5# power generation, 700MW). The specific results are presented in
Figure 15.
The following conclusions can be inferred from the aforementioned results: ① The vibration frequency resulting from the operation of the long and short blade type unit corresponding to the No.2 diversion pipeline exhibits a complex pattern, distributed within the frequency range of 50~300Hz, accompanied by several distinct frequency components such as 58Hz, 125Hz, and 166Hz; in contrast, the vibration frequency of the pipeline caused by the high-speed unit corresponding to the No.3 diversion pipeline is predominantly concentrated at 220Hz, displaying a stable and clearly visible dominant frequency in the time-frequency diagram. Furthermore, it is observed that pipe vibrations induced by operating unit #5 exhibit higher intensity levels, indicating discernible influences on diversion pipeline vibrations due to different types of units.
4. Conclusion
Under the shutdown condition, the Z(vertical) vibration acceleration at each measuring point is negligible, exhibiting a spectrum closely resembling white noise. Conversely, under pumping conditions, the Z(vertical) vibration acceleration significantly surpasses that shutdown condition, with a distinct dominant frequency evident in the spectrum diagram. These findings unequivocally indicate that ambient vibrations induced by unit operation constitute the primary source of vibration.
In the reinforced concrete section, the vibration acceleration significantly increases under pumping conditions compared to power generation conditions, as evidenced by root mean square vibration acceleration analysis, spectrum diagram examination, and time-frequency diagram evaluation. Under power generation conditions, the vibration at each measuring point near the upper reservoir and upper inclined shaft remains below 0.1gal with increasing total power output, indicating proximity to shutdown condition.
Steel lining +C20 backfill concrete section, ①The vibration intensity under pumping conditions is significantly higher than that during power generation.; ②Compared to single operation, the vibration intensity of the pipeline increases by approximately 20% to 50% during dual operation.③The propagated vibration from adjacent pipelines is negligible when analyzing the influence of unit operating parameters on pipeline vibration, as it is smaller compared to the generated vibration.④The ground measuring points' vibration acceleration primarily depends on the distance from the source of vibrations.
①The operational vibration frequency of the long and short blade type unit corresponding to the 2# water diversion pipeline exhibits a relatively intricate pattern, with frequencies distributed within the range of 50~300Hz, accompanied by several distinct frequency components such as 58Hz, 125Hz, and 166Hz. Conversely, the primary vibration frequency induced by the high-speed unit corresponding to the 3# water diversion pipeline predominantly concentrates at a stable and clearly visible frequency of 220Hz in the time-frequency diagram. ②The vibration intensity of the water pipeline caused by the operation of unit 5# is higher, indicating that different unit models exert a certain influence on pipeline vibration.
Author Contributions
Resources, Ji-Jian Lian; Writing—original draft preparation, Lin-Rui Zuo; Writing—review and editing, Xiao-Qun Wang; Investigation, Lu Yu;
Funding:This research was supported by Hebei Natural Science Foundation (No. E2023402015), the National Natural Science Foundation of China (No. U21A20164, No. U20A20316);
Conflicts of Interest
The authors declare no conflict of interest.
References
- Basic terminology of pumped storage power station. 2018, State Administration for Market Supervision and Administration; Standardization Administration of China.
- Xue, J.; Duan, Z.; Qin, Y. Cause analysis of structural cracks in a factory building of Guangzhou pumped storage power station. Guangdong Water Resour. Hydropower 2017, 12, 22–26. [Google Scholar]
- Peng, T. Vibration monitoring of underground powerhouse structure of Shisanling pumped storage power station. Hydropower Autom. Dam Monit. 2005, 5, 49–52. [Google Scholar]
- Lin, Z. The accident analysis of the pressure steel pipe in Yanfeng hydropower Station and the detrimental effects of hydraulic vibration are examined. Guangdong Hydropower Technol. 1988, 2. [Google Scholar]
- Cui, Q. Vibration Testing and Analysis of the Underground Structure of a Large Pumped Storage Power Station. Ph.D. Dissertation, Wuhan University, Wuhan, China, 2019. [Google Scholar]
- Chen, J.; Wang, F.; Ma, Z. Vibration response analysis of the underground structure in a large pumped storage power station. J. Water Resour. Archit. Engine 2013, 11, 78–81. [Google Scholar]
- Li, J.; et al. The study focuses on investigating pressure pulsation in the bladeless region of a pump turbine. J. Eng. Thermophilic 2021, 42, 1213–1223. [Google Scholar]
- Lian, J.; Wang, H.; Qin, L. The Research Focuses on The Structural Design of a Hydropower Station; China Water & Power Press: BeiJing, China, 2007. [Google Scholar]
- Gao, R. Analysis and Study on Hydraulic Vibration Characteristics of Complex and Long Pilot Power Station. MA Thesis, Tianjin University, Tianjin, China, 2019. [Google Scholar]
- Chen, J. The Present Study Focuses on Investigating the Vibration Characteristics of Water Diversion Pipelines in Pumped Storage Power Stations. MA Thesis, Tianjin University, Tianjin, China, 2022. [Google Scholar]
- Han, K.; Ding, F.; Ma, Z. The numerical analysis of water hammer in the pumping station of a long-distance pressurized water conveyance project. Adv. Sci. Technol. Water Resour. 2020, 40, 69–75. [Google Scholar]
- Masoud, B.; Faraz, K. Mehran Soltani Tehrani; Amin Hamzei; Ehsan Mohtarami; Kamran Asemi. Three dimensional free vibration analysis of functionally graded graphene reinforced composite laminated cylindrical panel. Proc. Inst. Mech. Eng. Part L: J. Mater. Des. Appl. 2022, 236, 1501–1514. [Google Scholar]
- Yang, X.; Lian, J.; Zhang, Z. Theoretical analysis of the attenuation characteristics of high-frequency pressure vibration in pumped storage power station. J. Energy Storage 2023, 72, 108341. [Google Scholar] [CrossRef]
- Wang Wanpeng, et al. Study on the source of multiple leaf frequency strong vibration in pumped storage power station. Water Resour. Hydropower Eng. 2021, 52. [Google Scholar]
- GB 10070-1988. Standard of vibration in urban area environment [S]. State Environmental Protection Agency,1988.12.
Figure 1.
Trend chart of installed capacity of PSPS by region from 2012 to 2022.
Figure 1.
Trend chart of installed capacity of PSPS by region from 2012 to 2022.
Figure 2.
Trend chart of installed capacity of China's PSPS from 2012 to 2022.
Figure 2.
Trend chart of installed capacity of China's PSPS from 2012 to 2022.
Figure 3.
Overview of survey point locations.
Figure 3.
Overview of survey point locations.
Figure 4.
Shutdown condition - Vibration spectrum diagram of each measuring point during the operation of 5 units under pumping conditions.
Figure 4.
Shutdown condition - Vibration spectrum diagram of each measuring point during the operation of 5 units under pumping conditions.
Figure 5.
Diagram illustrating the location of measuring points for the upper reservoir and upper inclined shaft.
Figure 5.
Diagram illustrating the location of measuring points for the upper reservoir and upper inclined shaft.
Figure 6.
The impact of total pumping power on the vibration acceleration of measurement points, such as the upper inclined shaft and upper reservoir, is examined.
Figure 6.
The impact of total pumping power on the vibration acceleration of measurement points, such as the upper inclined shaft and upper reservoir, is examined.
Figure 7.
Vibration spectrum and time-frequency analysis diagrams generated in different sections of the pipe under identical operational conditions.
Figure 7.
Vibration spectrum and time-frequency analysis diagrams generated in different sections of the pipe under identical operational conditions.
Figure 8.
Position diagram of measuring point in the horizontal tunnel.
Figure 8.
Position diagram of measuring point in the horizontal tunnel.
Figure 9.
Position diagram of measuring point in lower inclined shaft.
Figure 9.
Position diagram of measuring point in lower inclined shaft.
Figure 10.
Root mean square of vibration acceleration at P1 measuring point in Horizontal tunnel.
Figure 10.
Root mean square of vibration acceleration at P1 measuring point in Horizontal tunnel.
Figure 11.
The comparison of frequency spectra between pumping and power generation conditions in the diversion pipeline of units 3#-4#.
Figure 11.
The comparison of frequency spectra between pumping and power generation conditions in the diversion pipeline of units 3#-4#.
Figure 12.
The root mean square of vibration acceleration at the measuring point P2 in the horizontal tunnel.
Figure 12.
The root mean square of vibration acceleration at the measuring point P2 in the horizontal tunnel.
Figure 13.
The frequency spectrum of pumping and power generation conditions in the intake pipe of unit 5#-6# is compared.
Figure 13.
The frequency spectrum of pumping and power generation conditions in the intake pipe of unit 5#-6# is compared.
Figure 14.
Distribution of vibrations along the pipeline.
Figure 14.
Distribution of vibrations along the pipeline.
Figure 15.
Acceleration spectra (left) and time-frequency diagrams (right) depicting the inherent vibration of the pipe during operation across various units.
Figure 15.
Acceleration spectra (left) and time-frequency diagrams (right) depicting the inherent vibration of the pipe during operation across various units.
Table 1.
Fundamental unit parameter.
Table 1.
Fundamental unit parameter.
| Main parameters of pump turbine |
Main parameters of generator motor |
| argument |
unit |
Numerical value |
argument |
unit |
Numerical value |
| Number of runner blades |
- |
10(1-4#)11(5-6#) |
Rated power |
MW |
389/350MW |
| Rated power of water turbine |
MW |
357 |
Rated speed |
r/min |
500 (1-4#)600 (5-6#) |
Table 2.
Positioning of the station.
Table 2.
Positioning of the station.
| No. |
name |
remark |
No. |
name |
remark |
| 1 |
Upper reservoir P1 |
|
7 |
horizontal tunnel P3 |
Construction of lateral tunnel ground in the middle horizontal section |
| 2 |
Upper reservoir P2 |
|
8 |
horizontal tunnel P4 |
| 3 |
Upper inclined shaft P1 |
The influence of the vehicle is amplified |
9 |
Lower inclined shaft P1 |
|
| 4 |
Upper inclined shaft P2 |
|
10 |
Lower inclined shaft P2 |
|
| 5 |
Horizontal tunnel P1 |
3#4#units |
11 |
Lower inclined shaft P3 |
|
| 6 |
Horizontal tunnel P2 |
5#6#units |
Table 3.
Pumping conditions.
Table 3.
Pumping conditions.
Serial
number |
Working conditions (MW) |
| 1# |
2# |
3# |
4# |
5# |
6# |
Gross
power |
| 1 |
-330 |
-330 |
-330 |
-330 |
-330 |
|
-1650 |
| 2 |
-340 |
-340 |
|
-340 |
-360 |
|
-1380 |
| 3 |
-340 |
|
-340 |
-340 |
-340 |
|
-1360 |
| 4 |
-340 |
-340 |
-340 |
-340 |
|
|
-1360 |
| 5 |
|
|
|
-340 |
|
|
-340 |
| 6 |
|
|
-340 |
|
|
|
-340 |
| 7 |
Shutdown condition |
0 |
| 8 |
|
|
|
350 |
|
|
350 |
| 9 |
|
|
|
|
350 |
|
350 |
| 10 |
|
|
|
350 |
350 |
|
700 |
| 11 |
|
350 |
|
|
350 |
|
700 |
| 12 |
350 |
|
|
|
350 |
|
700 |
| 13 |
350 |
|
|
350 |
|
|
700 |
| 14 |
350 |
|
350 |
|
|
|
700 |
| 15 |
|
350 |
|
350 |
350 |
|
1050 |
| 16 |
|
350 |
350 |
|
350 |
|
1050 |
| 17 |
350 |
|
|
350 |
350 |
|
1050 |
Table 4.
Standards for vertical vibration levels in different urban areas.
Table 4.
Standards for vertical vibration levels in different urban areas.
| The scope of application |
Daytime(dB) |
Nighttime(dB) |
| Special residential area |
65 |
65 |
| Residents, cultural and educational areas |
70 |
67 |
| Mixed area, central business area |
75 |
72 |
| Industrial concentration area |
75 |
72 |
| Both sides of the traffic trunk road |
75 |
72 |
| Both sides of the main railway line |
80 |
80 |
|
Disclaimer/Publisher’s Note: The statements, opinions and data contained in all publications are solely those of the individual author(s) and contributor(s) and not of MDPI and/or the editor(s). MDPI and/or the editor(s) disclaim responsibility for any injury to people or property resulting from any ideas, methods, instructions or products referred to in the content. |
© 2023 by the authors. Licensee MDPI, Basel, Switzerland. This article is an open access article distributed under the terms and conditions of the Creative Commons Attribution (CC BY) license (http://creativecommons.org/licenses/by/4.0/).
