
Submitted:
12 December 2023
Posted:
13 December 2023
You are already at the latest version
Abstract
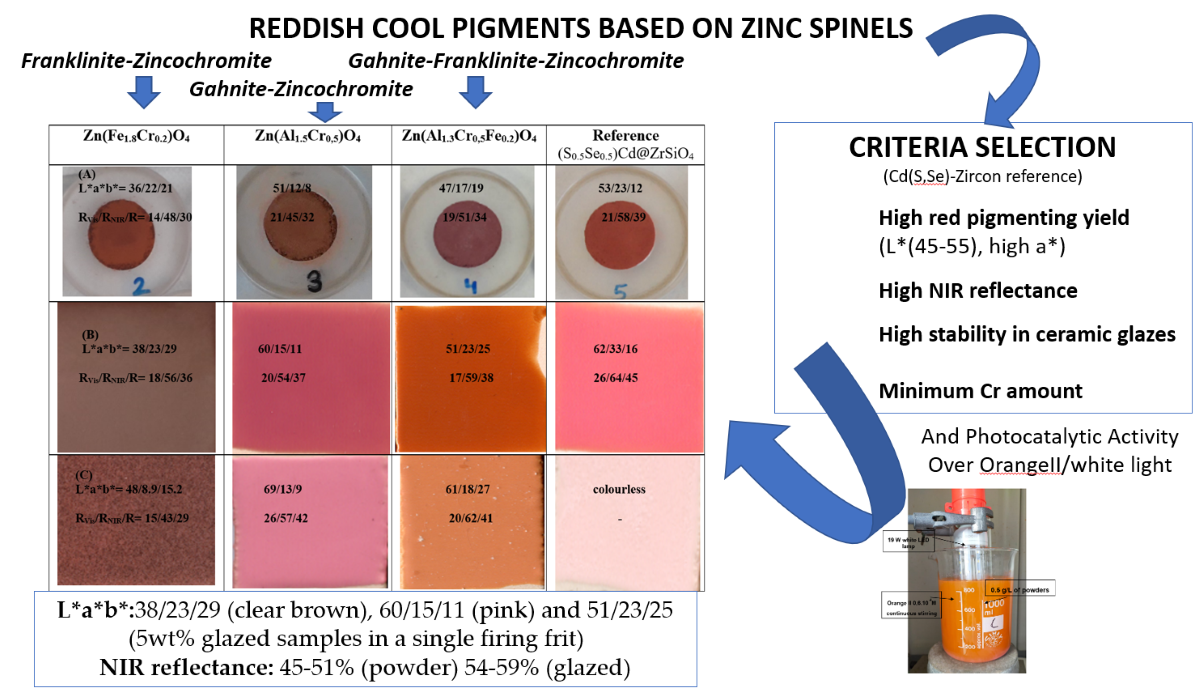
Franklinite-Zincochromite-Gahnite solid solutions have been prepared by ceramic or coprecipitation method and its pigmenting capacity as cool ceramic pigments in different glazes (double and single firing frits and porcelain frit) was studied. XRD, UV-Vis-NIR diffuse reflectance, CIEL*a*b* colour analysis, bandgap measurement and the photocatalytic activity over the Orange II azoic dye were carried out for the characterization of samples. Following criteria of high red colouring capacity and high NIR reflectance at minimum Cr amount, Zn(Fe1.8Cr0.2), Zn(Al1.5Cr0.5) and Zn(Al1.3Cr0.5Fe0.2)O4 turn out to be the optimal compositions for an intense reddish cool pigment. All powders show a direct semiconductor behaviour with bandgap around 2 eV, falling in the visible range (620 nm), and according to literature, the associated photocatalytic activity over Orange II with visible light irradiation is moderate in all cases, but the Franklinite-Zincochromite Zn(Fe1.8Cr0.2) stands out.
Keywords:
cool pigment
; ceramic pigment
; spinel
; photocatalysis
; glazes
1. Introduction
Spinel ferrites are a material with wide technological applications such as a magnetic fluid, drug delivery material, magnetic recording material and pigments. Red spinel has been considered a gemstone, but until fairly modern times, it was not differentiated from the rare “ruby” (Cr-corundum solid solution) that can be distinguished by x-ray test which is the best method to differentiate between spinel and ruby [1]. The spinel AB2O4 (SG. Fd-3m) is built by O2- ions in cubic closed-packed array and the A and B ions occupying the interstices in the structure. In the normal structure the A ion occupy one-eighth of the tetrahedral sites and the A ion one-half of the octahedral sites. On the inverse spinel all A ions and one-half of the B ions have exchanged places. Usually the crystal field stabilization energy (CFSE) of the transition metals present is used to explain the cation distribution on the spinel structure. J.K. Burdett [2] proposed the use of the relative sizes of the s and p atomic orbitals of the two types of atoms to determine their site preference, because the dominant stabilizing interaction in the solids is not the crystal field stabilization energy but the σ-type interactions between the metal cations and the oxide anions. Only in cases where this size-based approach indicates no preference for one structure over another do crystal field effects make any difference.
Spinel forms gems of all colors, but the “Ruby Spinel”, a bright red spinel [3] is the most valuable gem. Spinel gems are based in the presence of chromophores (Cr, Fe, V, Mn...) of different compositions, as the spinels based on zinc such as Gahnite ZnAl2O4, Franklinite or ZnFe2O4 and Zincochromite ZnCr2O4.
Franklinite is a normal spinel which is paramagnetic in the bulk form, but exhibits ferrimagnetic behaviour in nanocrystalline thin film format. A large room temperature magnetization and narrow ferromagnetic resonance linewidth have been achieved by controlling thin films growth conditions [4]. However, Tanaka et al. [5] have prepared, using the hydrothermal method, nanoparticles of zinc ferrite and reported that although the bulk zinc ferrite is an antiferromagnetic material having a Neel temperature around 10 K. The reason that zinc ferrites, which have a small magnetization value at bulk sizes, have a large magnetization value at room temperature is that zinc ferrite nanoparticles exhibit super paramagnetism. Because of their high opacity, zinc ferrites are used as magenta ceramic pigments [6], which requiring heat stability, and shows high corrosion-resistant coatings in paints. The corrosion protection increases with the concentration of zinc ferrite [7]. On the other hand, considering eco-friendly requirements, Calbo et al. [8] reported black ceramic pigments based on Ni(Fe,Cr)2O4 spinels, which include toxic and hazardous elements such as Ni, Cr, prepared by ceramic method and optimised to reduce toxic and hazardous components replacing toxic by inert elements such as Mg and Zn minimising the content of Cr. Thereby, Schwarz et al. [9] shows that MFe2O4 (M= Ca ,Zn) pigments, can be prepared from industrial wastes of metallurgical slag from the production of non-ferrous metals and two types of AMD (acid mine drainage) sludge: one of natural origin (Fe-sediment) and the second one synthetically prepared from AMD (Fe-precipitate. Due to the high Pb content in pigments from the slag (0.67–1.10 wt.% Pb in pigments), utilisation of these pigments in coatings is problematic. Ferrite pigments from the AMD sludge, mainly that with zinc ferrite, have promising application in anticorrosive paints but optimisation of the preparation process is required.
Gahnite (ZnAl2O4) crystallizes under normal conditions in a normal spinel structure. It is a stable material with a high melting temperature. This material has attracted a lot of attention in recent years because of its multifunctional applications such as phosphors, hydrogen generation, catalyst, transparent conducting oxide (TCO), gas sensing, and water gas shift. Although this material is a normal spinel, like materials in the spinel family, this material always has a degree of inversion which depends greatly on the method and the growth conditions and it varies from 0.01 to 0.35. This means that it is important to study the effect of the degree of inversion on the properties of this material [10]. Thereby, Granone et al. [11] have studied the effect of degree of inversion on the electrical properties of zinc ferrite and they showed that the electrical conductivity of ZnFe2O4 increases with the increasing of the degree of inversion. Quintero et al. [12] have studied the effect of inversion on the magnetic properties of this material.
Zincochromite (ZnCr2O4) can be obtained by solid state reaction from oxides or carbonates sintering at elevated temperatures 1400°C several hours. Peng et al. [13] synthesise nanoparticles of zincochromite by hydrothermal route with average particle size of <5 nm. The ZnCr2O4 nanoparticles have a direct band gap about 3.46 eV and exhibit blue emission in the range of 300–430 nm, cantered at 358 nm when excited at 220 nm. Furthermore, the nanoparticles show apparent photocatalytic activities for the degradation of methylene blue under UV light irradiation. Thereby, Mousavi et al. [14] synthesized nanostructures through co-precipitation method. It was found that particle size and morphology of the products could be greatly influenced for parameters such as such as alkaline agent, pH value and capping agent type. The superhydrophilicity and the photocatalytic activity of ZnCr2O4 nanoparticles over anionic dyes such as Eosin-Y and phenol red under UV light irradiation are confirmed. In this case, ZnCr2O4 nanoparticles exhibit a paramagnetic behaviour although bulk ZnCr2O4 is antiferromagnetic, this change in magnetic property can be ascribed to finite size effects. Chen et al. [15] use a coprecipitation method and used (EXAFS) to investigate the change of the inversion parameter vs the annealing temperature. The inversion parameter decreases with increasing annealing temperature: at 750 °C has a normal spinel structure, like bulk ZnCr2O4 but at 300°C is 24%.
Cool pigments show high reflectance in the NIR range (750–2500 nm), which helps keep the interior of buildings cool on sunny days, avoiding energy expenditure on conditioning air. When light hits, both diffuse and specular reflections act: diffuse reflection is considered to be the result of subsurface scattering. The Kubelka–Munk (K-M) transform of the measured diffuse reflectance is approximately proportional to the absorption, and hence to the concentration of light absorbent species associated to charge transfer and d-d transitions of metal ions in lattice environments or also to stretching and deformation modes of functional groups (vibrations of supported species) [16]. Buildings contribute to climate change with their greenhouse gas emissions (e.g., 30% of the total emitted by the U.S.) associated with their primary energy consumption (36% of the total in the U.S.) [6]. Determination of the Solar Reflectance for exterior materials (wall, roof and floor) reveals the ability of a surface to reflect solar radiation, reducing the increase in temperature caused by the incidence of solar radiation on the surface. The reflectance of a specific surface depends largely on the colour in the visible range, light colours are cool and dark colours are warm. However visible light is only a 43% of the solar light, approximatively 50% of the solar radiation falls in the near infrared radiation (NIR) range, and it is not direct dependent of the colour. Coloured surfaces should use high NIR pigment to save in air conditioning consumption and attenuate the urban heat island (UHI) effect [17].
Photocatalysts utilize light energy to carry out oxidation and reduction reactions. When selecting a photocatalyst, the band gap of the material determines the wavelength of light that can be absorbed. Many of the photocatalysts that are commonly used have wide band gaps (>3.1 eV) and are capable of utilizing only a small portion of sunlight. In order for a photocatalyst to effectively absorb visible solar energy a maximum band gap of 3.1 eV (400 nm) is required. TiO2 has a wide band gap (3.03 eV rutile and 3.18 eV anatase) and can therefore absorb only a small portion of sunlight. There are two approaches in which visible light irradiation can be utilized by photocatalysts: (a) to dope a UV active photocatalyst with elements which narrows the band gap (C,S,N,Si or heavy metals Co, Ag, Pt, Ru…are used as dopants for TiO2) [18] , (b) development of materials that have a narrow band gap which falls in the visible range, such as ferrites ZnFe2O4, ZnCr2O4 or Zn(Al,Fe)2O4. [19].
In effect, ferrites offer several advantages as photocatalyst: (a) have a band gap capable of absorbing visible light, (b) the spinel crystal structure, which enhanced efficiency due to the available extra catalytic sites, (c) their magnetic properties, when ferrites are used alone as photocatalysts or in combination with others, they can therefore be easily separated from the reaction mixture, (d) to enhance the production of reactive oxygen species, oxidants such as H2O2 are add to the reaction mixture for a Fenton-type system, thereby its use as solid iron compounds to replace soluble Fe2+ in traditional Fenton-type systems. Ferrites could remove some of the limitations that occur in traditional Fenton systems such as no sludge formation, operations at neutral pH, and the possibility of recycling the iron compounds, (e) combined with TiO2, the composite photocatalyst that are formed show higher efficiency as a film in which a TiO2 film is doped with ferrites or as a single nanoparticle with the ferrite acting as a magnetic core and the TiO2 as a shell, the composites become effective under visible light irradiation, whereas TiO2 alone is effective only under UV light . [19].
In this paper Franklinite-Zincochromite Zn(Fe,Cr)2O4, Gahnite-Zincochromite Zn(Al,Cr)2O4 and the three spinel Zn(Al,Fe,Cr)2O4 solid solutions were studied as cool ceramic pigments, following criteria of high colouring capacity and high NIR reflectance at minimum Cr amount. The resulting optimal compositions were studied as photocatalyst over Orange II azoic dye with visible light.
1. Materials and methods
2.1. Samples Preparation
Solid state or ceramic procedure and ammonia coprecipitation route were used for the synthesis of the ceramic pigments. In the ceramic method (CE), precursors, oxides or carbonates, supplied by ALDRICH, with a particle size between 0.3–5 µm were mechanically homogenized in an electric grinder (20,000 rpm) for 5 min. The mixture was fired at the corresponding temperatures and soaking times. In the coprecipitation method (CO), soluble precursors, nitrates of the corresponding cations, supplied by ALDRICH, for to prepare 10 g of the final product were solved in 200 mL of water, then ammonia 30% was dropped maintaining 70°C the temperature in continuous stirring until gelation of the mixture. The gel is aged during 24 h at room temperature and dried in oven at 110°C. Finally, the dried gels were fired at the corresponding temperatures and soaking times.
2.2. Samples Characterization
X-ray Diffraction (XRD) was carried out on a Siemens D5000 diffractometer using Cu Kα radiation (10–70° 2θ range, scan rate 0.02 °2θ, 4 s per step and 40 kV and 20 mA conditions). From XRD results the volume of the cubic cell is calculated using the equation (1):
where d is interplanar distance of the (hkl) lattice plane, obtained from Braggs’ law, and a is the cubic cell edge.
L*a*b* colour parameters of powders and glazed samples were measured following the CIE-L*a*b* (“Commission Internationale de l’Éclairage”) colorimetric method using a X-Rite SP60 spectrometer, with standard lighting D65 and 10° observer. In this method, L* is a measure of lightness (100 = white, 0 = black) and a* and b* of colour parameters (-a* = green, +a* = red, -b* = blue, +b* = yellow) [20].
UV-Vis-NIR spectra of both fired powder and glazed samples were collected using a Jasco V670 spectrometer through diffuse reflectance technique, which gives data in absorbance using arbitrary units (A) or in reflectance units (R (%)). Using the Kubelka–Munk transformation model, the bandgap of the samples was estimated using the Tauc method [21]. The total solar reflectance R, the solar reflectance in the NIR range RNIR or the solar reflectance in the Vis range are evaluated from UV-Vis-NIR spectra through the diffuse reflectance technique, as the integral of the measured spectral reflectance and the solar irradiance divided by the integral of the solar irradiance is in the range of 350 to 2500 nm for R, 700 to 2500 nm for RNIR or 350–700 nm for RVis as in the equation (2):
where r(λ) is the spectral reflectance (Wm−2) measured by UV-Vis-NIR spectroscopy and i(λ) is the standard solar irradiation (Wm−2 nm−1) according to the American Society for Testing and Materials (ASTM) Standard G173-03.
The photoactivity of powders was evaluated by the degradation of the azo dye Orange II (OII) in an aqueous solution. The photocatalytic tests were carried out by adding a catalyst loading of 0.5 g/l to an OII solution of 0.6 10-4 mol/L, which was prepared by dissolving Orange II (C16H11N2NaO4S) in a pH 7.42 phosphate buffer medium (NaH2PO4, H2O 3.31 g and Na2HPO4.7H2O 33.77 g solved in 1 litter of water). The irradiation source was a white LED lamp (Philips, 19 W, 1300 lumens) with an estimated irradiance of 70 mW/cm2. Before measurement, the suspensions were stirred in the dark for 15 min to reach sorption/desorption equilibrium. The evolution of the reaction was followed by sampling every 15 minutes. Orange II concentrations in different samples were determined using UV-Vis spectroscopy at 485 nm. Commercial TiO2 Degussa P25 (Eg=3.15 nm that falls out of visible range [22]) was used as a reference for comparison with home-prepared samples; likewise, the test with red reference supplied by FERRO SP ((S0.5Se0.5)Cd@ZrSiO4) was also carried out.
Photocatalytic degradation followed the Langmuir-Hinshelwood model of heterogeneous catalysis, which considers the reaction between two species adsorbed on the catalyst (adsorbates), versus the so-called Eley-Rideal model, which postulates the reaction between an adsorbate and an incoming molecule [23].
Microstructure characterization of samples was carried out by Scanning Electron Microscopy (SEM) using a JEOL 7001F electron microscope and a Transmission Electron Microscopy (TEM) using a 2000 kV JEOL JEM 2100 (following conventional preparation and imaging techniques). The chemical composition and homogeneity of the samples was determined by semi-quantitative elemental analysis with an EDX analyser (supplied by Oxford University) attached to the SEM microscope.
2.3. Application of Pigments
The colouring capacity of the pigments was studied in three matrices: (a) 5wt.% glazed in double firing frit with some lead (6wt.% PbO) 1000°C, (b) 5wt.% glazed in single firing frit 1080°C, (c) 5wt.% glazed in porcelain single firing frit 1200°C.
3. Results and Discussion
4.1. Franklinite-Zincochromite Zn(Fe2-xCrx)O4 solid solutions
Figure 1 shows the Franklinite-Zincochromite Zn(Fe2-xCrx)O4 solid solutions synthesized at 1000ºC/3h and 5wt% glazed in a single fire frit (1080°C) and a porcelain single firing frit (1200°C), with indication of the corresponding CIEL*a*b* values. Red powders with a* higher than 20 were obtained, except for x=2, corresponding to pure zincochromite, which shows a grey shade. Glazed samples also show red shades (a* between 17-23) except for x=0 (pure franklinite, yellow coloured) and x=2 (pure zincochromite, grey coloured). In the porcelain frit at 1200°C, all samples show dark behaviour with low red parameter, indicating the unstabilization of the pigments at this temperature and aggressive glaze medium. The best red colour in the single firing frit at 1080°C was x=0.2 sample with L*a*b*=37.5/23.4/28.9.
Figure 2 shows the X-ray diffractograms (XRD) of Franklinite-Zincochromite Zn(Fe2-xCrx)O4 solid solutions synthesized at 1000ºC/3h with the evolution of the volume of cubic cell of the corresponding spinel with x enclosed. A single phase associated to the corresponding cubic spinel is detected in all samples, except for x=1.8 that exhibits weak peaks associated to ZnO. It can be observed that the diffraction peaks shift to higher °2ϴ degrees associated to a decrease of the interplanar distances d in equation (1), in accordance with the replacing of Fe3+ (Shannon-Prewit radius in octahedral site=1.03Å) by the smaller Cr3+ (0.755 Å); then a decrease of the cubic cell edge of the spinel with x is detected. In effect, from equation (1), the cell volume evolution with x, enclosed in Figure 2, shows that the cell volume decreases progressively with x accomplishing rigorously the Vegard’s law, except for the x=1.8, in agreement with the presence of residual ZnO in its XRD diffractogram, that can be explained by a reduction of some Fe3+ to Fe2+ which is located in tetrahedral site of spinel (Shannon-Prewit radius in octahedral site=0.77Å) replacing Zn2+ (0.74 Å) that attenuates the decreases associated to the replacement of Fe3+ by Cr3+ [24].
Figure 3 shows the UV-Vis-NIR diffuse reflectance spectra of Franklinite-Zincochromite Zn(Fe2-xCrx)O4 solid solutions. In the case of fired powders at 1000ºC/3h (Figure 3A), all spectra are similar, except for x=1.8 and 2 associated to ZnO segregation and in the x=1.8 and the absence of iron in x=2 (pure zincochromite). The reflectance decreases with x from 30% for x=2 to 80% for x=0 in the NIR range. For x=0 sample (franklinite) two intense absorbance bands (minimums of reflectance) centred at 1180 and 770 nm with a wide band of absorption between 400-500 nm appears, associated with the transitions 6A1g(S) → 4A1g,4E(G), which overlaps with the charge transference band at 400–500 nm of Fe(III) in octahedral coordination. The entrance of chromium shifts lo lower wavelength the band at 1180 nm and two bands at 720 and 680 nm appears. Finally for x=2 (zincochromite) the bands at 1180 and 790 nm disappears, and minimums of reflectance are detected at 680, 570, 440 and 250 nm respectively associated to octahedral Cr(III). The bands at around 770 and 1200 nm are typical characteristics of the zinc ferrite, which are attributed to 6A1g(S) → 4T2g(G) and 6A1g(S) → 4T1g(S) for d-d electron transition of Fe3+. These Fe3+ bands overlap with those of Cr3+ in octahedral coordination, namely: (a) three main parity-forbidden transitions (4A2(4F) → 4T2(4F) at 570 nm and 4A2(4F) → 4T1(4F) at 440 nm, which are partially overlapped, and 4A2(4F) → 4T2(4P) at 240 nm, which overlaps with Cr3+-O2− charge transfer), (b) two weak Cr3+ spin-forbidden transitions (4A2(4F) → 2T1(2G) and 4A2(4F) → 2E(2G) that overlap at 670 and 710 nm [6,17].
In the case of 5wt.% glazed samples in a single fire frit 1080ºC (Figure 3B), The performance is similar to that of powders, although the evolution of the intensities in the NIR range shows the highest reflectance for x = 0.5 and 1 samples, the NIR reflectance of pure franklinite (x=0) significatively decreases in the glaze.
In effect, the RNIR reflectance measurements (enclosed in Figure 1) of Zn(Fe2-xCrx)O4 solid solutions (1000ºC/3h) and 5wt.% glazed samples in a single fire frit 1080ºC show the decrease of RNIR with x in powders, but show certain overlapping in values for x=1, 0.5 and 0.2 in glazed samples. Considering the criteria of high colouring capacity and high NIR reflectance at minimum Cr amount, the x=0.2 sample results the optimal composition for a cool pigment based on Franklinite-Zincochromite system.
4.2. Gahnite-Zincochromite Zn(Al2-xCrx)O4 solid solutions
Figure 4 shows the characterization of Gahnite-Zincochromite Zn(Al2-xCrx)O4 solid solutions synthesized by the ammonia coprecipitation method (CO) described above with L*a*b* and RVis/RNIR/R values enclosed. Zn(NO3)2.6H2O, Al(NO3)3.6H2O and Cr(NO3)3.9H2O were used as precursors of Zn, Al and Cr respectively. The raw dried gels show a homogeneous appearance with a purple-blue colour that intensifies with the chromium amount (L* decreases, a* greenish and b* blueish). Powders fired at 1000°C/1h show that the colour intensifies (L* decreases) and reddish (a* increases) with chromium amount.
The samples 5wt.% glazed in double firing frit with some lead (6wt.% PbO) of 1000ºC (Figure 4C) show that the colour intensifies (L* decreases) and reddish (a* increases) with chromium amount, producing interesting red shades in samples between x=0-2 and 0.5. Lower chromium amounts give light colours and x=0.75 sample produces a dark grey colour. The glazing in single firing frit 1080°C and porcelain single firing frit 1200°C give the best colour for x=0.5 sample.
Figure 5 shows the X-ray diffractograms (XRD) of Gahnite-Zincochromite Zn(Al2-xCrx)O4 solid solutions with the evolution of the volume of the cubic cell of the corresponding spinel with x. Only peaks associated to the corresponding cubic spinel are detected. It can be observed that the diffraction peaks shift to lower °2ϴ degrees associated to an increase of the interplanar distances d in equation (1), in accordance with the replacing Al3+ (Shannon-Prewit radius in octahedral site=0.675Å) by the bigger Cr3+ (0.755 Å); therefore. an increase of the cubic cell edge of the spinel with x is espected. In effect, the cell volume evolution with x, enclosed in Figure 5, shows that the cell volume increases progressively with x accomplishing rigorously the Vegard’s law in the studied range x=0-0.75 [22].
Figure 6 shows the UV-Vis-NIR absorbance spectra of Gahnite-Zincochromite Zn(Al2-xCrx)O4 solid solutions synthesized by ammonia coprecipitation fired at 1000ºC/1h. Clearly the absorbance increases with the amount of chromium x. Intense bands centred at 240, 430, 570 and 700 nm respectively are observed, which are associated to Cr3+ in octahedral coordination, namely: (a) three main parity-forbidden transitions (4A2(4F) → 4T2(4F) at 570 nm and 4A2(4F) → 4T1(4F) at 430 nm, which are partially overlapped, and 4A2(4F) → 4T2(4P) at 240 nm, which overlaps with Cr3+-O2− charge transfer), (b) two weak Cr3+ spin-forbidden transitions (4A2(4F) → 2T1(2G) and 4A2(4F) → 2E(2G) that overlap at around 700 nm [6,17].
The bands shift to higher wavelength with the amount of chromium x in the sample, indicating a weakness of the crystal field associated to entrance of the bigger Cr3+ (0.755 Å), replacing Al3+ (Shannon-Prewit radius in octahedral site=0.675Å) in a small and constrained lattice of ZnAl2O4. The progressive increase of absorbance and shifting to red wavelength intensifies the colour and the a* parameter increases, but at x=0.75 the absorption is excessive and the colour darken producing dark brown shades as is observed in Figure 4.
The NIR reflectance of samples (enclosed in Figure 4 for powder and 5wt.% glazed in double firing 1000°C) is relatively high, with values higher than 45%, and the sample x=0.5 shows the higher value.
Following the criteria of high colouring capacity and high NIR reflectance at minimum Cr amount, the x=0.5 sample results the optimal composition for a cool pigment based on Gahnite-Zincochromite system. In Figure 7 is showed the microstructure of this optimal sample. Figure 7A shows the morphology by TEM of nanoparticles around 25 nm forming the raw gel. Figure 7B shows the SEM image and EDX composition mapping analysis of the particles of the same sample fired at 1000°C/1h: rough aggregates of particles of 1-3 µm can be observed in which the distribution of the Zn, Al and Cr appears homogeneous.
4.3. Gahnite-Zincochromite-Franklinite Zn(Al1.5-xCr0,5Fex)O4 solid solutions
In order to optimize the ternary system with Al, Cr and Fe, compositions based on the above optimal sample, Zn(Al1.5-xCr0,5Fex)O4 x=0-0.3 were synthesised. Figure 8A shows the image (x40) of raw dried gels which show a homogeneous appearance with a purple-blue colour for x=0 and reddish progressively with the iron addition. Powders fired at 1000°C/1h show that the colour intensifies (L* decreases) and reddish (a* increases) with iron amount.
The 5wt.% glazed samples in a single firing frit which maturate at 1080°C (Figure 8C) show that the colour slightly intensifies (L* decreases one point) and reddish (a* increases) with iron amount, producing interesting red shades in samples from pink of x=0 to red x=0.2, the sample x=0.3 darkens and the a* value drops slightly. On the other hand, in the samples 5wt.% glazed in a porcelain firing frit which maturate at 1200°C (Figure 8D) the colour intensifies (L* decreases) and reddish (a* increases) with iron amount up to the sample x=0.3, which darkens and the red a* value falls. The glazing in single firing frit 1080°C and porcelain single firing frit 1200ºC give the best colour for x=0.2 sample (Zn(Al1.3Cr0,5Fe0.2)O4).
Figure 9 shows the XRD diffractograms of Zn(Al1.5-xCr0,5Fex)O4 coprecipitated samples fired at 1000°C/1h: only peaks of the corresponding spinel are detected. Figure 10 shows the UV-Vis-NIR diffuse reflectance spectra of the same Zn(Al1.5-xCr0.5Fex)O4 samples. The absorbance increases with x. Bands at 240, 450-500, 570, 670, 710, 780 (shoulder) and 1200 nm can be observed: as discussed above for Franklinite-Zincochromite samples, bands centred at 1200 and 780 nm with the wide band of absorption between 400-500 nm are associated with the transitions 6A1g(S) → 4A1g,4E(G), which overlaps with the charge transference band at 400–500 nm of Fe3+ in octahedral coordination. These Fe3+ bands overlap with those of Cr3+ in octahedral coordination: (a) three main parity-forbidden transitions (4A2(4F) → 4T2(4F) at 570 nm and 4A2(4F) → 4T1(4F) at 440 nm, which are partially overlapped, and 4A2(4F) → 4T2(4P) at 240 nm, which overlaps with Cr3+-O2− charge transfer), (b) two weak Cr3+ spin-forbidden transitions (4A2(4F) → 2T1(2G) and 4A2(4F) → 2E(2G) that overlap at 670 and 710 nm [6,17].
Associated to the UV-Vis-NIR reflectance spectra, the RNIR of samples enclosed in Figure 8 shows a slightly increase with the iron amount, from 46 to 52% in powders and around 58% for all samples with iron addition.
Considering the criteria of high colouring capacity and high NIR reflectance at minimum Cr amount, the x=0.2 sample results the optimal composition for a cool pigment based on Franklinite-Gahnite-Zincochromite system.
Figure 11A shows the TEM images of the gel of this optimal sample. In this case the amorphous gel shows homogeneous cubic nanoparticles with edge between 50-90 nm. On the other hand, Fig 11B shows the particles of powder fired at 1000°C/1h: fine cubic particles with an edge around 1 µm can be observed.
4.4. Smmary of optimized samples compared with a reference
Figure 12 shows the summary of the three reddish optimized samples in the analysed systems compared with cadmium sulfoselenide encapsulated in zircon ((S0.5Se0.5)Cd@ZrSiO4) considered the best red ceramic pigment [28], but considered toxic due to the presence of sulfoselenide The colour of powders (Fig 12A) changes from an intense red (L*=32 and a*=22) for Franklinite-Zincochromite, to a lighter pink shade for Gahnite-Zincochromite sample and Franklinite-Zincochromite-Gahnite system (L*=51 and 47, a*=12 and 18 respectively) which are higher intense (lower L*) but lower reddish (lower a*) than cadmium sulfoselenide in zircon reference (L*=53, a*=23). In glazed samples at relative low temperature (Fig 12B) the evolution is similar, and the spinel colours (with intense clear brown, pink and red shades respectively) show higher intensity and lower reddish shade than the red reference, however in porcelain frit at higher temperature (1200°C), the reference is colourless (Figure 12C).
Figure 13 compare the UV-Vis-NIR diffuse reflectance spectra of the optimized samples (A powders samples and B glazed samples at low temperature) that shows those already discussed above bands of absorption (minimum of reflectance) associated to Cr3+ in octahedral coordination, overlapped with the bands of Fe3+ in the same coordination when is present. NIR reflectance is high in all powders (between 45-51%) but slightly lower than reference (RNIR=58). In the case of glazed samples, the RNIR of samples and reference are similar (in the range 54-60%).
Figure 14 shows the Tauc plots for the three optimized powders that shows a direct semiconductor behaviour with bandgap very similar, around 2.0 eV (corresponding to visible light of 620 nm), the sulfoselenide zircon reference shows a bandgap of 1.77 eV. Figure 15 displays the photodegradation test of Orange II with the optimized powders and in Table 1 summarise the photodegradation parameters of the test. The results indicate a poor activity of all samples, only Cr-ZnFe2O4 shows a value lower than 300 min of the half degradation time t1/2, and in addition, cyclability is not good and samples loss the activity (t1/2>400 min) in the third cycle.
In accordance with Casbeer et al. [26], the moderate results obtained with the microparticles of the studied high NIR reflective reddish pigments and the relative success of Cr-franklinite, can be explained because, although ferrites result effective when have been applied as photocatalysts alone, is as nanoparticles, in composite with other photocatalysts as well as with other oxidants such as H2O2, its activity is more efficient. Thereby, Zhu et al. [27] reports that magnetic zinc ferrite fine nanoparticles, synthesized by a soft chemical solution process, showed high activity, good reusability and easy separation ability for visible-light-induced Orange II degradation, but in an integrated ZnFe2O4/PMS (peroxymonosulfate, 2KHSO5·KHSO4·K2SO4, OXONE) aqueous system.
3. Conclusions
Franklinite-zincochromite-gahnite solid solutions have been prepared by ceramic or coprecipitation method and its pigmenting capacity as cool ceramic pigments in different media (double and single firing frits and porcelain frit) was studied. Following the criteria of high red colouring capacity and high NIR reflectance at minimum Cr amount, Zn(Fe1.8Cr0.2), Zn(Al1.5Cr0.5) and Zn(Al1.3Cr0.5Fe0.2)O4 result the optimal compositions for an intense reddish cool pigment based on Franklinite-Zincochromite, Gahnite-Zincochromite and Franklinite-Zincochromite-Gahnite systems respectively, showing CIEL*a*b* around L*a*b*=38/23/29 (clear brown), 60/15/11 (pink) and 51/23/25 (red) respectively in 5wt% glazed samples in a single firing frit. The NIR reflectance of the optimized samples is high, reaching values between 45-51% in powder and 54-59% in glazed samples. All powders show direct semiconductor behaviour with bandgap around 2 eV which falls in the visible range (620 nm). Its associated photocatalytic activity over the azoic pigment Orange II with white visible light irradiation is moderate in all cases, and the result with Franklinite-Zincochromite Zn(Fe1.8Cr0.2) stands out, but in accordance with literature it should be necessary reduce the particle size, forms composites with other photocatalysts, as well as with other oxidants such as H2O2 to increase its photocatalytic activity, but then the pigmenting capacity would be limited.
Author Contributions
The individual contributions are provided by the following statements “Conceptualization, Guillermo Monrós; methodology, Guillermo Monrós, Mario Llusar; software, José A. Badenes, Guillermo Monrós, Carolina Delgado; validation, Guillermo Monrós, Carolina Delgado; formal analysis, Guillermo Monrós; investigation, José A. Badenes, Guillermo Monrós, Mario Llusar; resources, José A. Badenes, Guillermo Monrós.; data curation, X.X.; writing—original draft preparation, Carolina Delgado, Guillermo Monrós, Mario Llusar; writing—review and editing, Guillermo Monrós, Carolina Delgado; visualization, José A. Badenes, Guillermo Monrós; supervision, Guillermo Monrós; project administration, Guillermo Monrós; funding acquisition, Guillermo Monrós, Mario Llusar. All authors have read and agreed to the published version of the manuscript.”.
Funding
This research was funded by Universitat Jaume I. The authors gratefully acknowledge the financial support of Universitat Jaume I (UJI-B2021-73 project).
References
- Prim, S.R.; García, A.; Galindo, R.; Cerro, S.; Llusar, M.; Folgueras, M.V.; Monrós, G. Pink ceramic pigment based on chromium doped M(Al2-xCrx)O4, M=Mg, Zn, normal spinel. Ceram. Int. 2013, 39, 6981–6989. [Google Scholar] [CrossRef]
- Burdett, J.K.; Price, G.L.; Price, S.L. Role of the crystal-field theory in determining the structures of spinels, J. Am. Chem. Soc. 1982, 104, 92–95. [Google Scholar] [CrossRef]
- Read, P.G, in Gemmology, third ed., page 289, 2005.
- Bohra, M.; Prasad, S.; Kumar, N.; Misra, D. S.; Sahoo, S. C.; Venkataramani, N.; Krishnan, R. “Large room temperature magnetization in nanocrystalline zinc ferrite thin films”. Appl. Phys. Lett. 2006, 488 (26): 262506. Bibcode:2006ApPhL..88z2506B. [CrossRef]
- Tanaka, K.; Katsuta, M.; Nakashima, S.; Fujita, K; J. Jpn. Soc. Powder Powder Metall. 2004. 52(4), 221–227.
- Monrós, G; Badenes, J.A.; Llusar, M; Ecofriendly High NIR Reflectance Ceramic Pigments Based on Rare Earths Compared with Classical Chromophores Prepared by DPC Method, Ceramics. 2022, 5(4), 614-641. [CrossRef]
- Ayana, Y. M. A.; El-Sawy, S. M.; Salah, S. H. Zinc-ferrite pigment for corrosion protection. Anti-Corrosion Methods and Materials. 1997, 44 (6): 381–388. [CrossRef]
- Calbo, J.; Sorlí, S.; Llusar, M.; Tena, M. A.; Monrós, G. Minimisation of toxicity in nickel ferrite black pigment, British Ceramic Transactions, 2004, 103:1, 3-9. [CrossRef]
- Schwarz, M., Veverka, M., Michalková, E. et al. Utilisation of industrial waste for ferrite pigments production. Chem. Pap. 66, 248–258 (2012). [CrossRef]
- Lahmer, M.A.The effect of degree of inversion on the electronic and optical properties of ZnAl2O4: A first-principles study, Computational Condensed Matter. 2023, 37, e00857. [CrossRef]
- L.I. Granone, R. Dillert, P. Heitjans, D.W. Bahnemann, Effect of the degree of inversion on the electrical conductivity of spinel ZnFe2O4, ChemistrySelect 4 (2019) 1232–1239. [CrossRef]
- J.J. Melo Quintero, K.L. Salcedo Rodríguez, C.E. Rodríguez Torres, L.A. Errico, Ab initio study of the role of defects on the magnetic response and the structural, electronic and hyperfine properties of ZnFe2O4, J. Alloy, Compd 775 (2019) 1117. [CrossRef]
- Peng, C.; Gao, L. Optical and Photocatalytic Properties of Spinel ZnCr2O4 Nanoparticles Synthesized by a Hydrothermal Route, 2008, 9,7, 2388-2390. [CrossRef]
- Mousavi, Z.; Soofivand, F.; Mahdiyeh Esmaeili-Zare,M.; Salavati-Niasari, M.; Bagheri, S. ZnCr2O4 Nanoparticles: Facile Synthesis, Characterization and Photocatalytic Properties. Sci Rep 6, 2016, 20071. [CrossRef]
- Chen, S.; Wu, Y.; Peixin, C.; Chu, W.S. Cation Distribution in ZnCr2O4 Nanocrystals Investigated by X-ray Absorption Fine Structure Spectroscopy 2013, The Journal of Physical Chemistry C, 2013, 117(47):25019–25025. [CrossRef]
- Kortüm, G. Reflectance Spectroscopy, Principles, Methods, Applications; Springer: Berlin/Heidelberg, Germany, 1969; ISBN 978-3-642-88071. [Google Scholar]
- Monrós, G. Scheelite and Zircon: Brightness, Color and NIR Reflectance in Ceramics; Nova Science Publishers: New York, NY, USA, 2021; ISBN 978-1-53619-332-9. [Google Scholar]
- Reddam H. A,; Elmail, R.; Cerro, S.; Monrós G.; Reddam Z.A.; Coloma-Pascual, F, Synthesis of Fe, Mn and Cu modified TiO2 photocatalysts for photodegradation of Orange II, Boletín de la Sociedad Española de Cerámica y Vidrio, 2020, 29:138-148. [CrossRef]
- Casbeer, E.; Sharma, V.K.; Li, X. Synthesis and photocatalytic activity of ferrites under visible light: A review, Separation and Purification Technology 87 (2012) 1–14. [CrossRef]
- CIE Comission International de l´Eclairage. Recommendations on Uniform Color Spaces, Colour Difference Equations, Psychometrics Colour Terms; Bureau Central de la CIE: Paris, France, 1978 (accessed on 14 September 2022.
- Tauc, J; Grigorovici. R.; Vancu, A. Optical Properties and Electronic Structure of Amorphous Germanium, Phys. Status Solidi, 1996,15:627–637. [CrossRef]
- Konstantyinou I.K.; Albanis T.A. TiO2-assisted photocatalytic degradation of azo dyes in aqueous solution: kinetic and mechanistic investigations. A review, Applied Catalyst B: Environmental, 2004, 49, 1-14. [CrossRef]
- Ohtani, B.; Prieto-Mahaney, O. O.: Li, D.: aAbe, R. What is Degussa (Evonik) P25? Crystalline composition analysis, reconstruction from isolated pure particles and photocatalytic activity test, Journal of Photochemistry and Photobiology A: Chemistry 2010,216,2–3,179-182. [CrossRef]
- Zen, E., Validity of Vegard’s law. American Mineralogist, 1956, 41 (5-6), 523-524.
- Ohtani, B.; Prieto-Mahaney, O. O.: Li, D.: aAbe, R. What is Degussa (Evonik) P25? Crystalline composition analysis, reconstruction from isolated pure particles and photocatalytic activity test, Journal of Photochemistry and Photobiology A: Chemistry 2010,216,2–3,179-182. [CrossRef]
- Casbeer, E.; Sharma, V.K.; Li, X. Synthesis and photocatalytic activity of ferrites under visible light: A review, Separation and Purification Technology 2012,87,1–14. [CrossRef]
- Zhu, K.; Wang, J.; Wang, Y.; Jina, C.; Ganeshrajaa, A.S. Visible-light-induced photocatalysis and peroxymonosulfate activation over ZnFe2O4 fine nanoparticles for degradation of Orange II, Catal. Sci. Technol., 2016,6, 2296-2304. [CrossRef]
- Lambies, L.V.: Rincon, L.J.M. Mechanism of formation of a zircon-cadmium sulfoselenide pigment. Trans J Br Ceram Soc 1981,80,105-108.
Figure 1.
Franklinite-Zincochromite Zn(Fe2-xCrx)O4 solid solutions: (A) powders synthesized at 1000ºC/3h (B) 5wt.% glazed powders in a single fire frit 1080ºC, (C) 5wt.% glazed powders in a single firing porcelain frit 1200ºC, with indication of the corresponding CIEL*a*b* values.
Figure 1.
Franklinite-Zincochromite Zn(Fe2-xCrx)O4 solid solutions: (A) powders synthesized at 1000ºC/3h (B) 5wt.% glazed powders in a single fire frit 1080ºC, (C) 5wt.% glazed powders in a single firing porcelain frit 1200ºC, with indication of the corresponding CIEL*a*b* values.

Figure 2.
X-ray diffractograms (XRD) of Franklinite-Zincochromite Zn(Fe2-xCrx)O4 solid solutions synthesized at 1000ºC/3h with the evolution of the volume of cubic cell of the corresponding spinel with x.
Figure 2.
X-ray diffractograms (XRD) of Franklinite-Zincochromite Zn(Fe2-xCrx)O4 solid solutions synthesized at 1000ºC/3h with the evolution of the volume of cubic cell of the corresponding spinel with x.
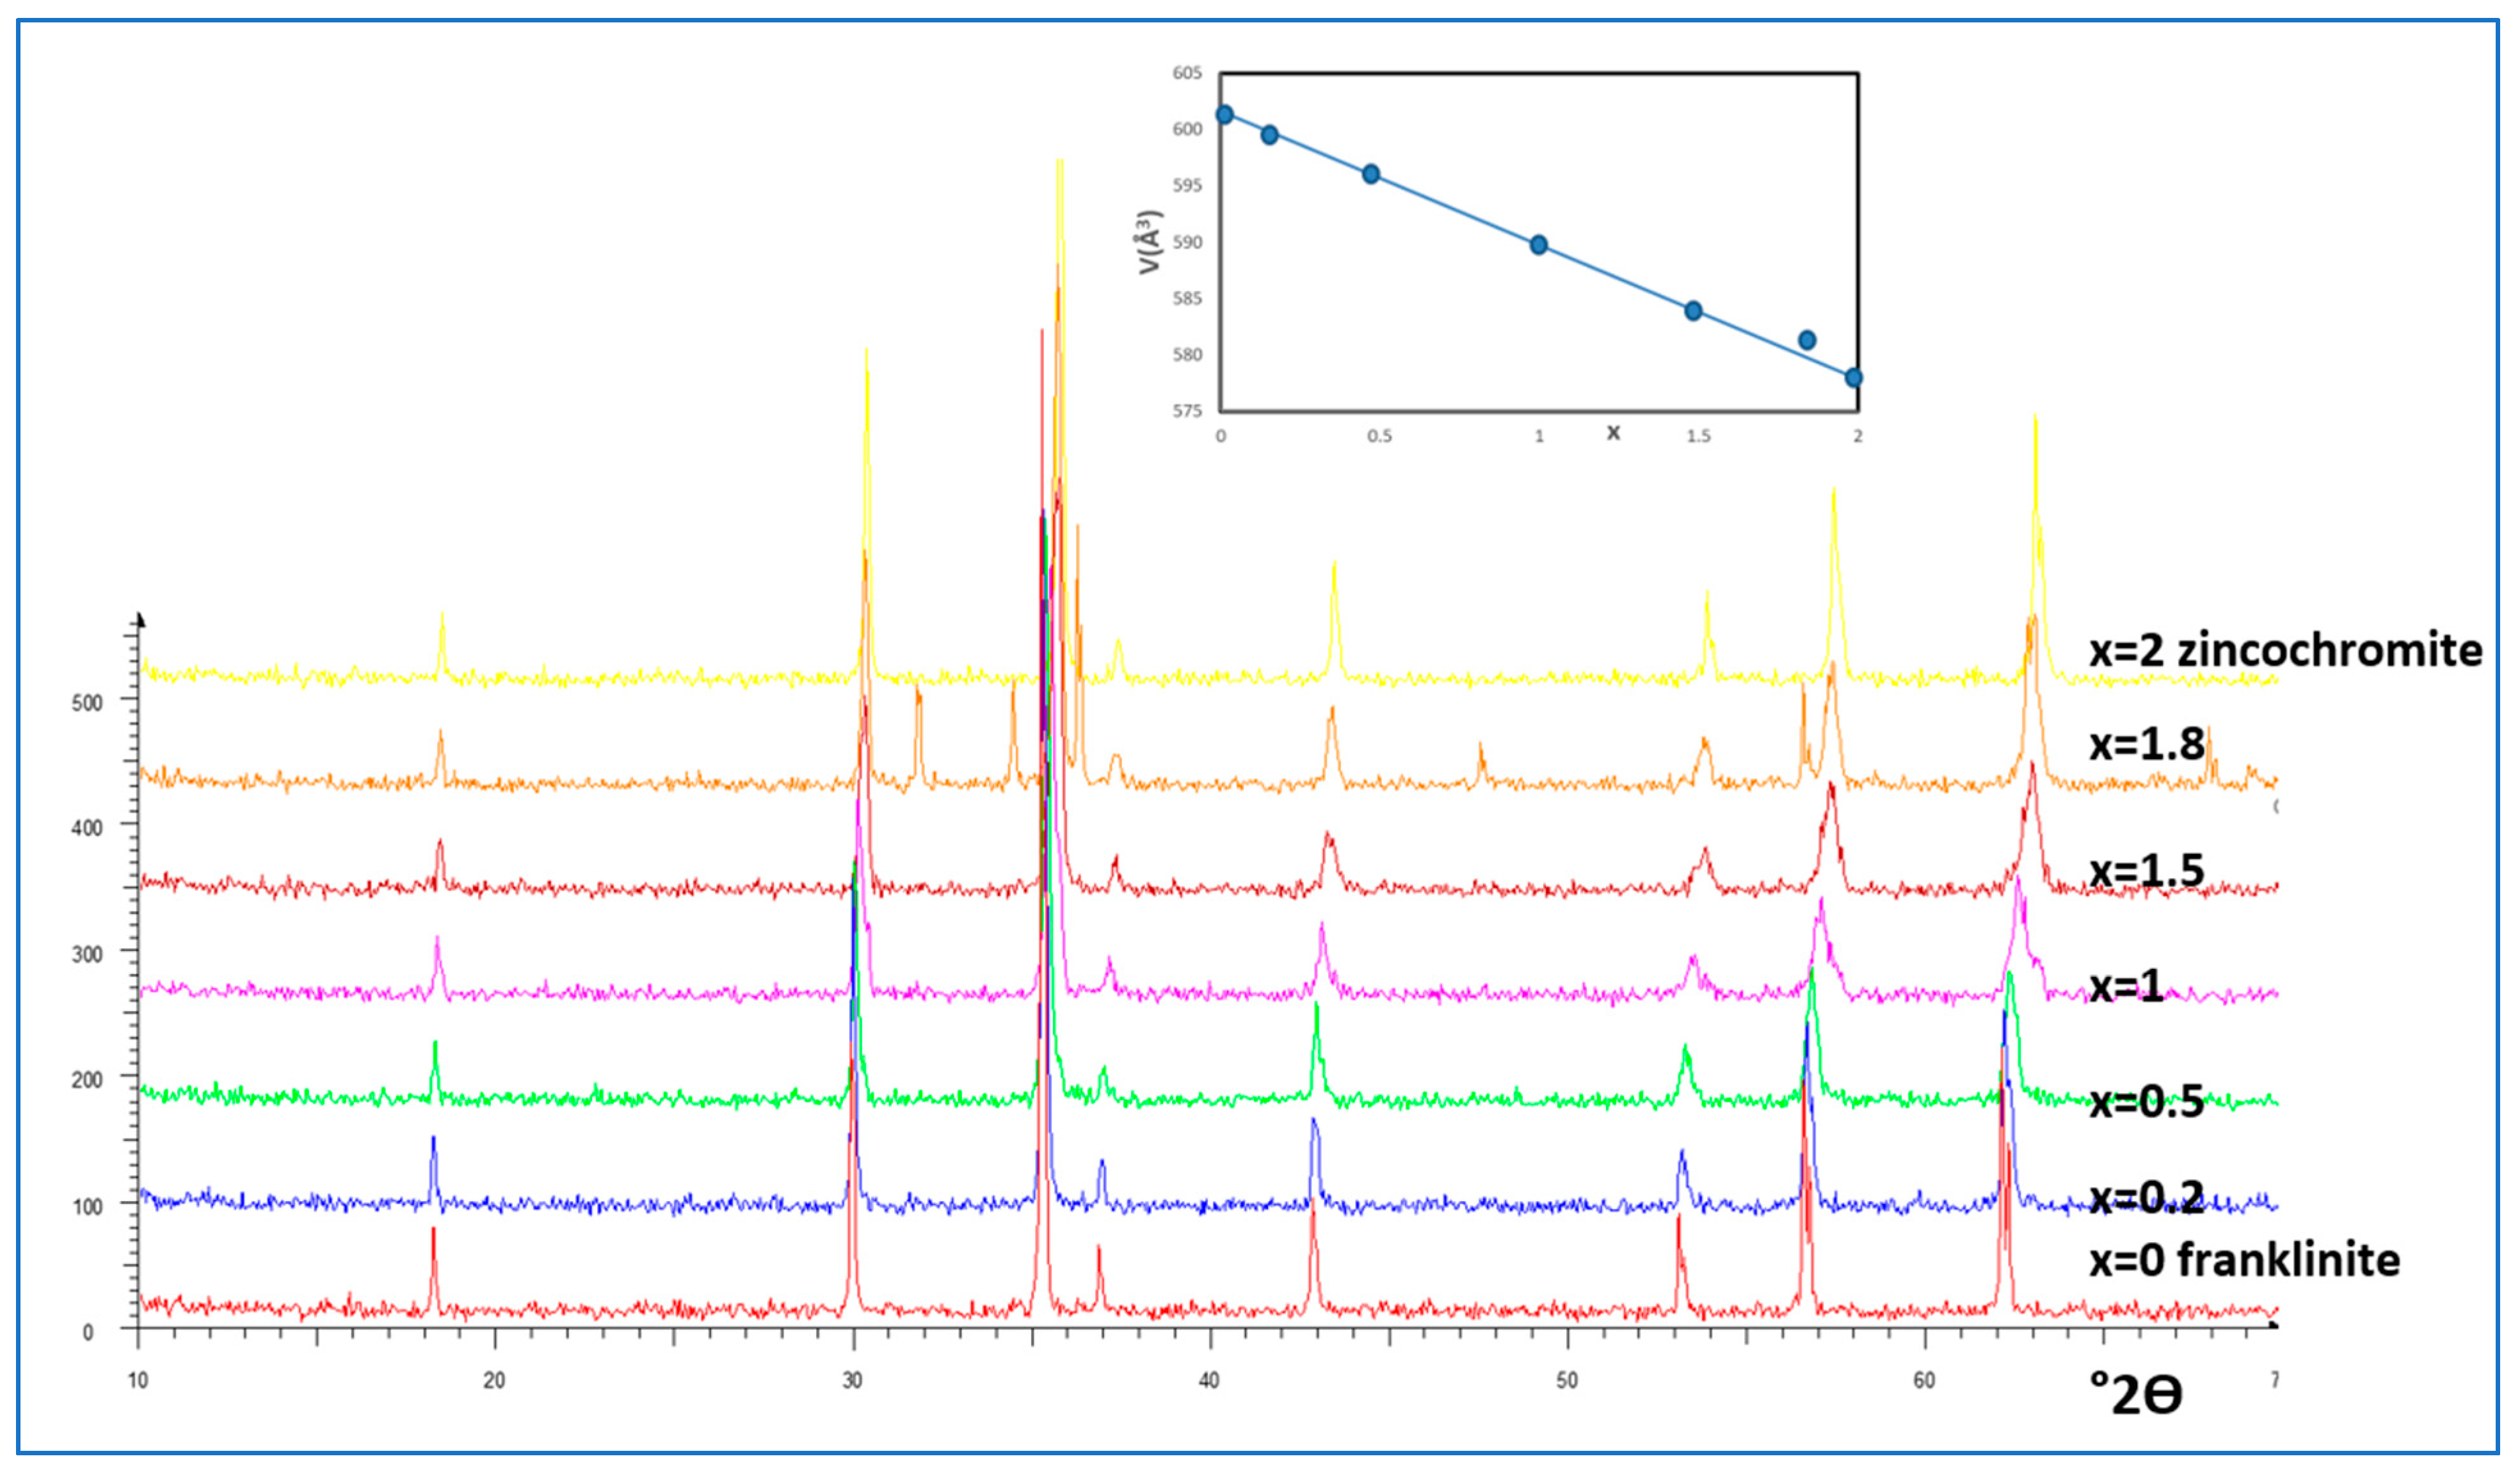
Figure 3.
UV-Vis-NIR diffuse reflectance spectra of Franklinite-Zincochromite Zn(Fe2-xCrx)O4 solid solutions; (A) fired powders 1000ºC/3h, (B) 5wt.% glazed in a single fire frit 1080ºC.
Figure 3.
UV-Vis-NIR diffuse reflectance spectra of Franklinite-Zincochromite Zn(Fe2-xCrx)O4 solid solutions; (A) fired powders 1000ºC/3h, (B) 5wt.% glazed in a single fire frit 1080ºC.

Figure 4.
Gahnite-Zincochromite Zn(Al2-xCrx)O4 solid solutions synthesized by ammonia coprecipitation: (A) raw dried gels, (B) powders fired at 1000°C/1h, (C) 5wt.% glazed in double firing frit with some lead (6wt.% PbO) 1000°C, (D) 5wt.% glazed in single firing frit 1080°C, (E) 5wt.% glazed in porcelain single firing frit 1200°C, with indication of the CIEL*a*b* values.
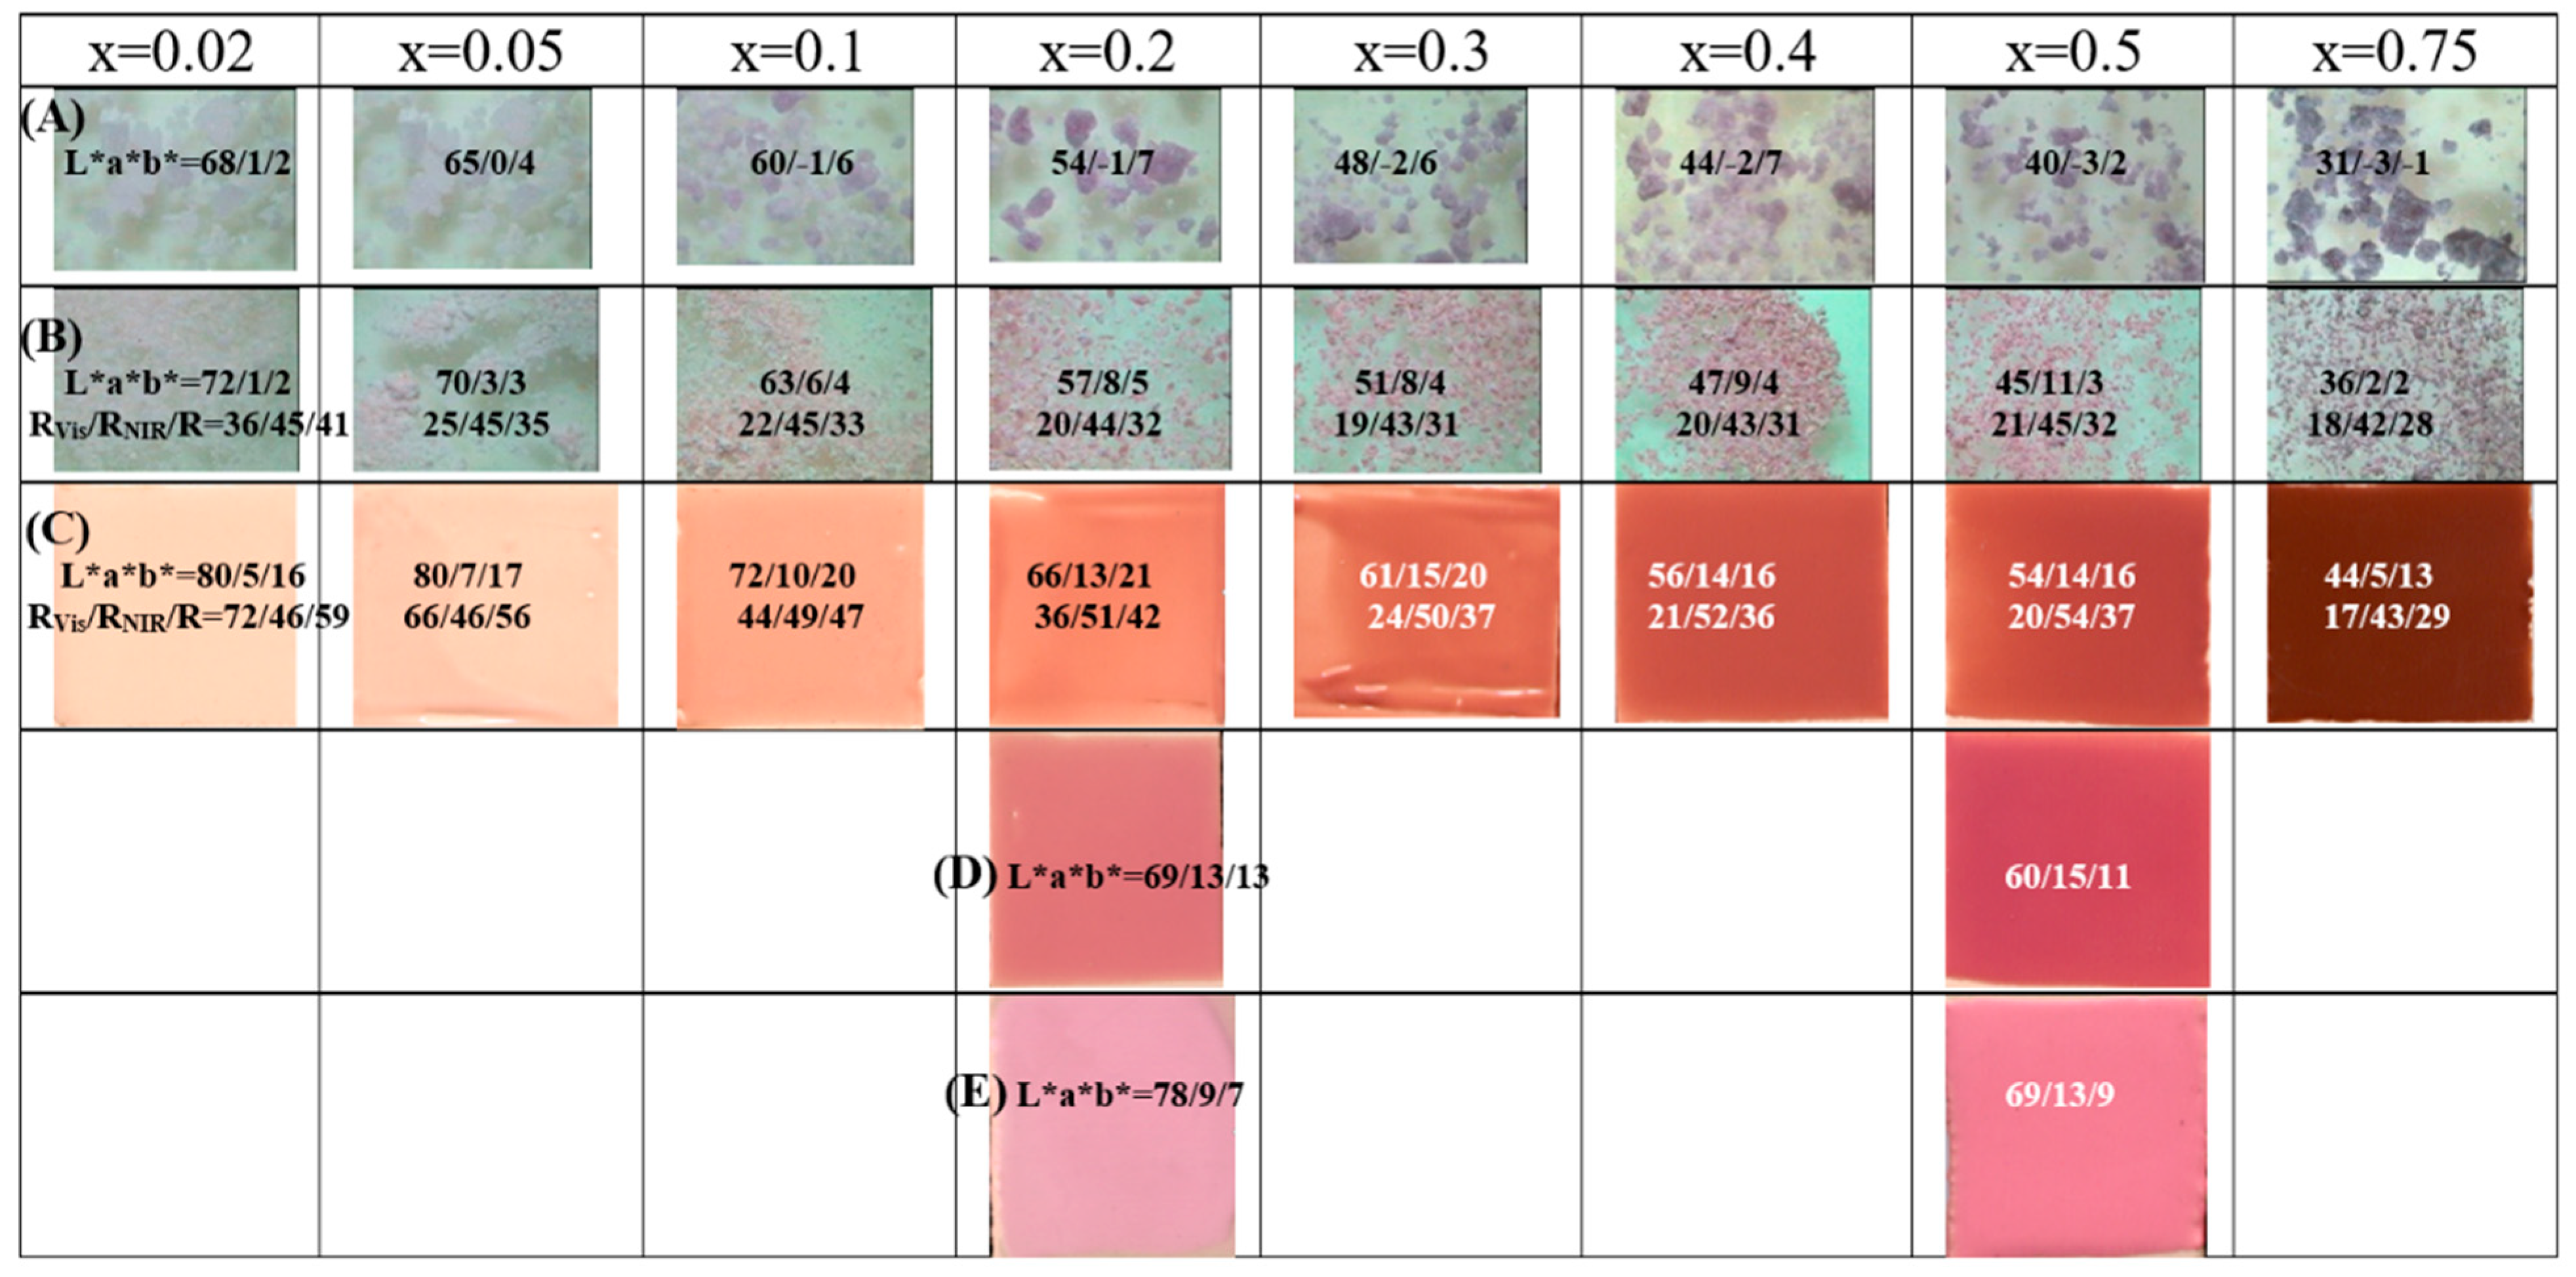
Figure 5.
X-ray diffractograms (XRD) of Zn(Al2-xCrx)O4 solid solutions synthesized at 1000ºC/1h with the evolution of the volume of cubic cell of the corresponding spinel with x.
Figure 5.
X-ray diffractograms (XRD) of Zn(Al2-xCrx)O4 solid solutions synthesized at 1000ºC/1h with the evolution of the volume of cubic cell of the corresponding spinel with x.
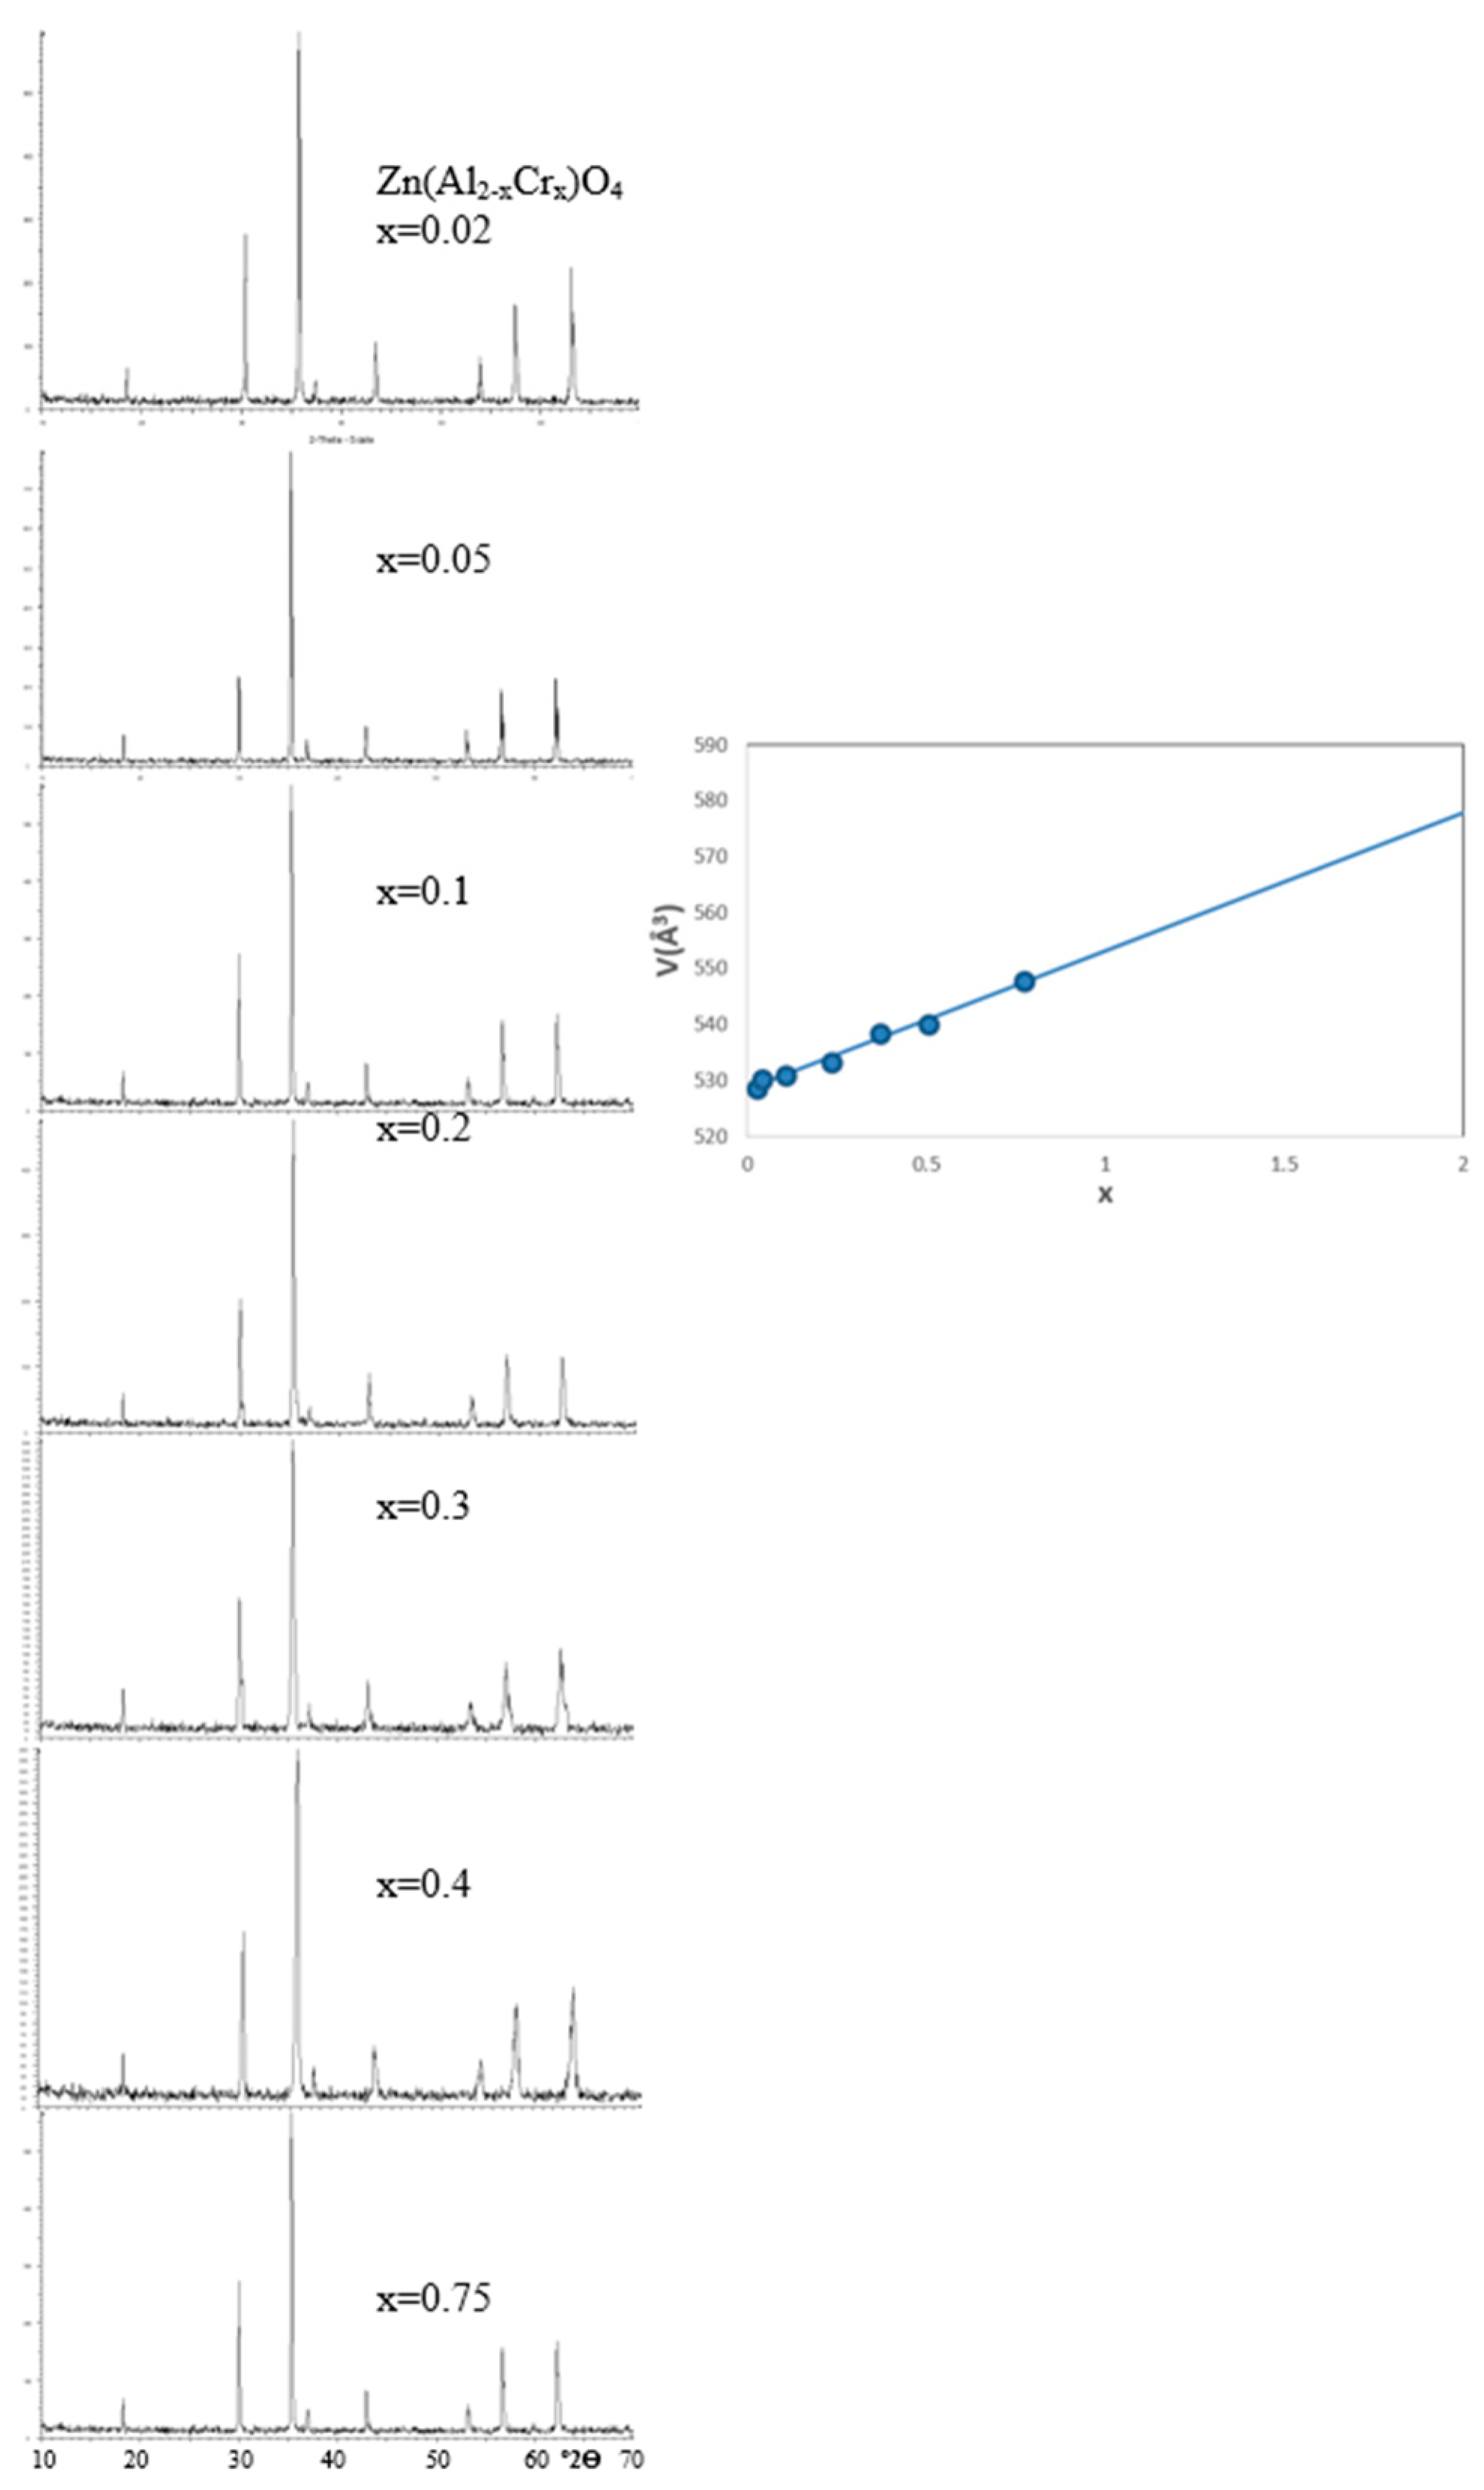
Figure 6.
UV-Vis-NIR spectra of Gahnite-Zincochromite Zn(Al2-xCrx)O4 solid solutions synthesized by ammonia coprecipitation fired at 1000ºC/1h.
Figure 6.
UV-Vis-NIR spectra of Gahnite-Zincochromite Zn(Al2-xCrx)O4 solid solutions synthesized by ammonia coprecipitation fired at 1000ºC/1h.

Figure 7.
(A) TEM micrographs of raw gel of coprecipitated sample Zn(Al2-xCrx)O4 x=0.5, (B) SEM and EDX composition mapping of the same sample fired at 1000°C/1h.
Figure 7.
(A) TEM micrographs of raw gel of coprecipitated sample Zn(Al2-xCrx)O4 x=0.5, (B) SEM and EDX composition mapping of the same sample fired at 1000°C/1h.
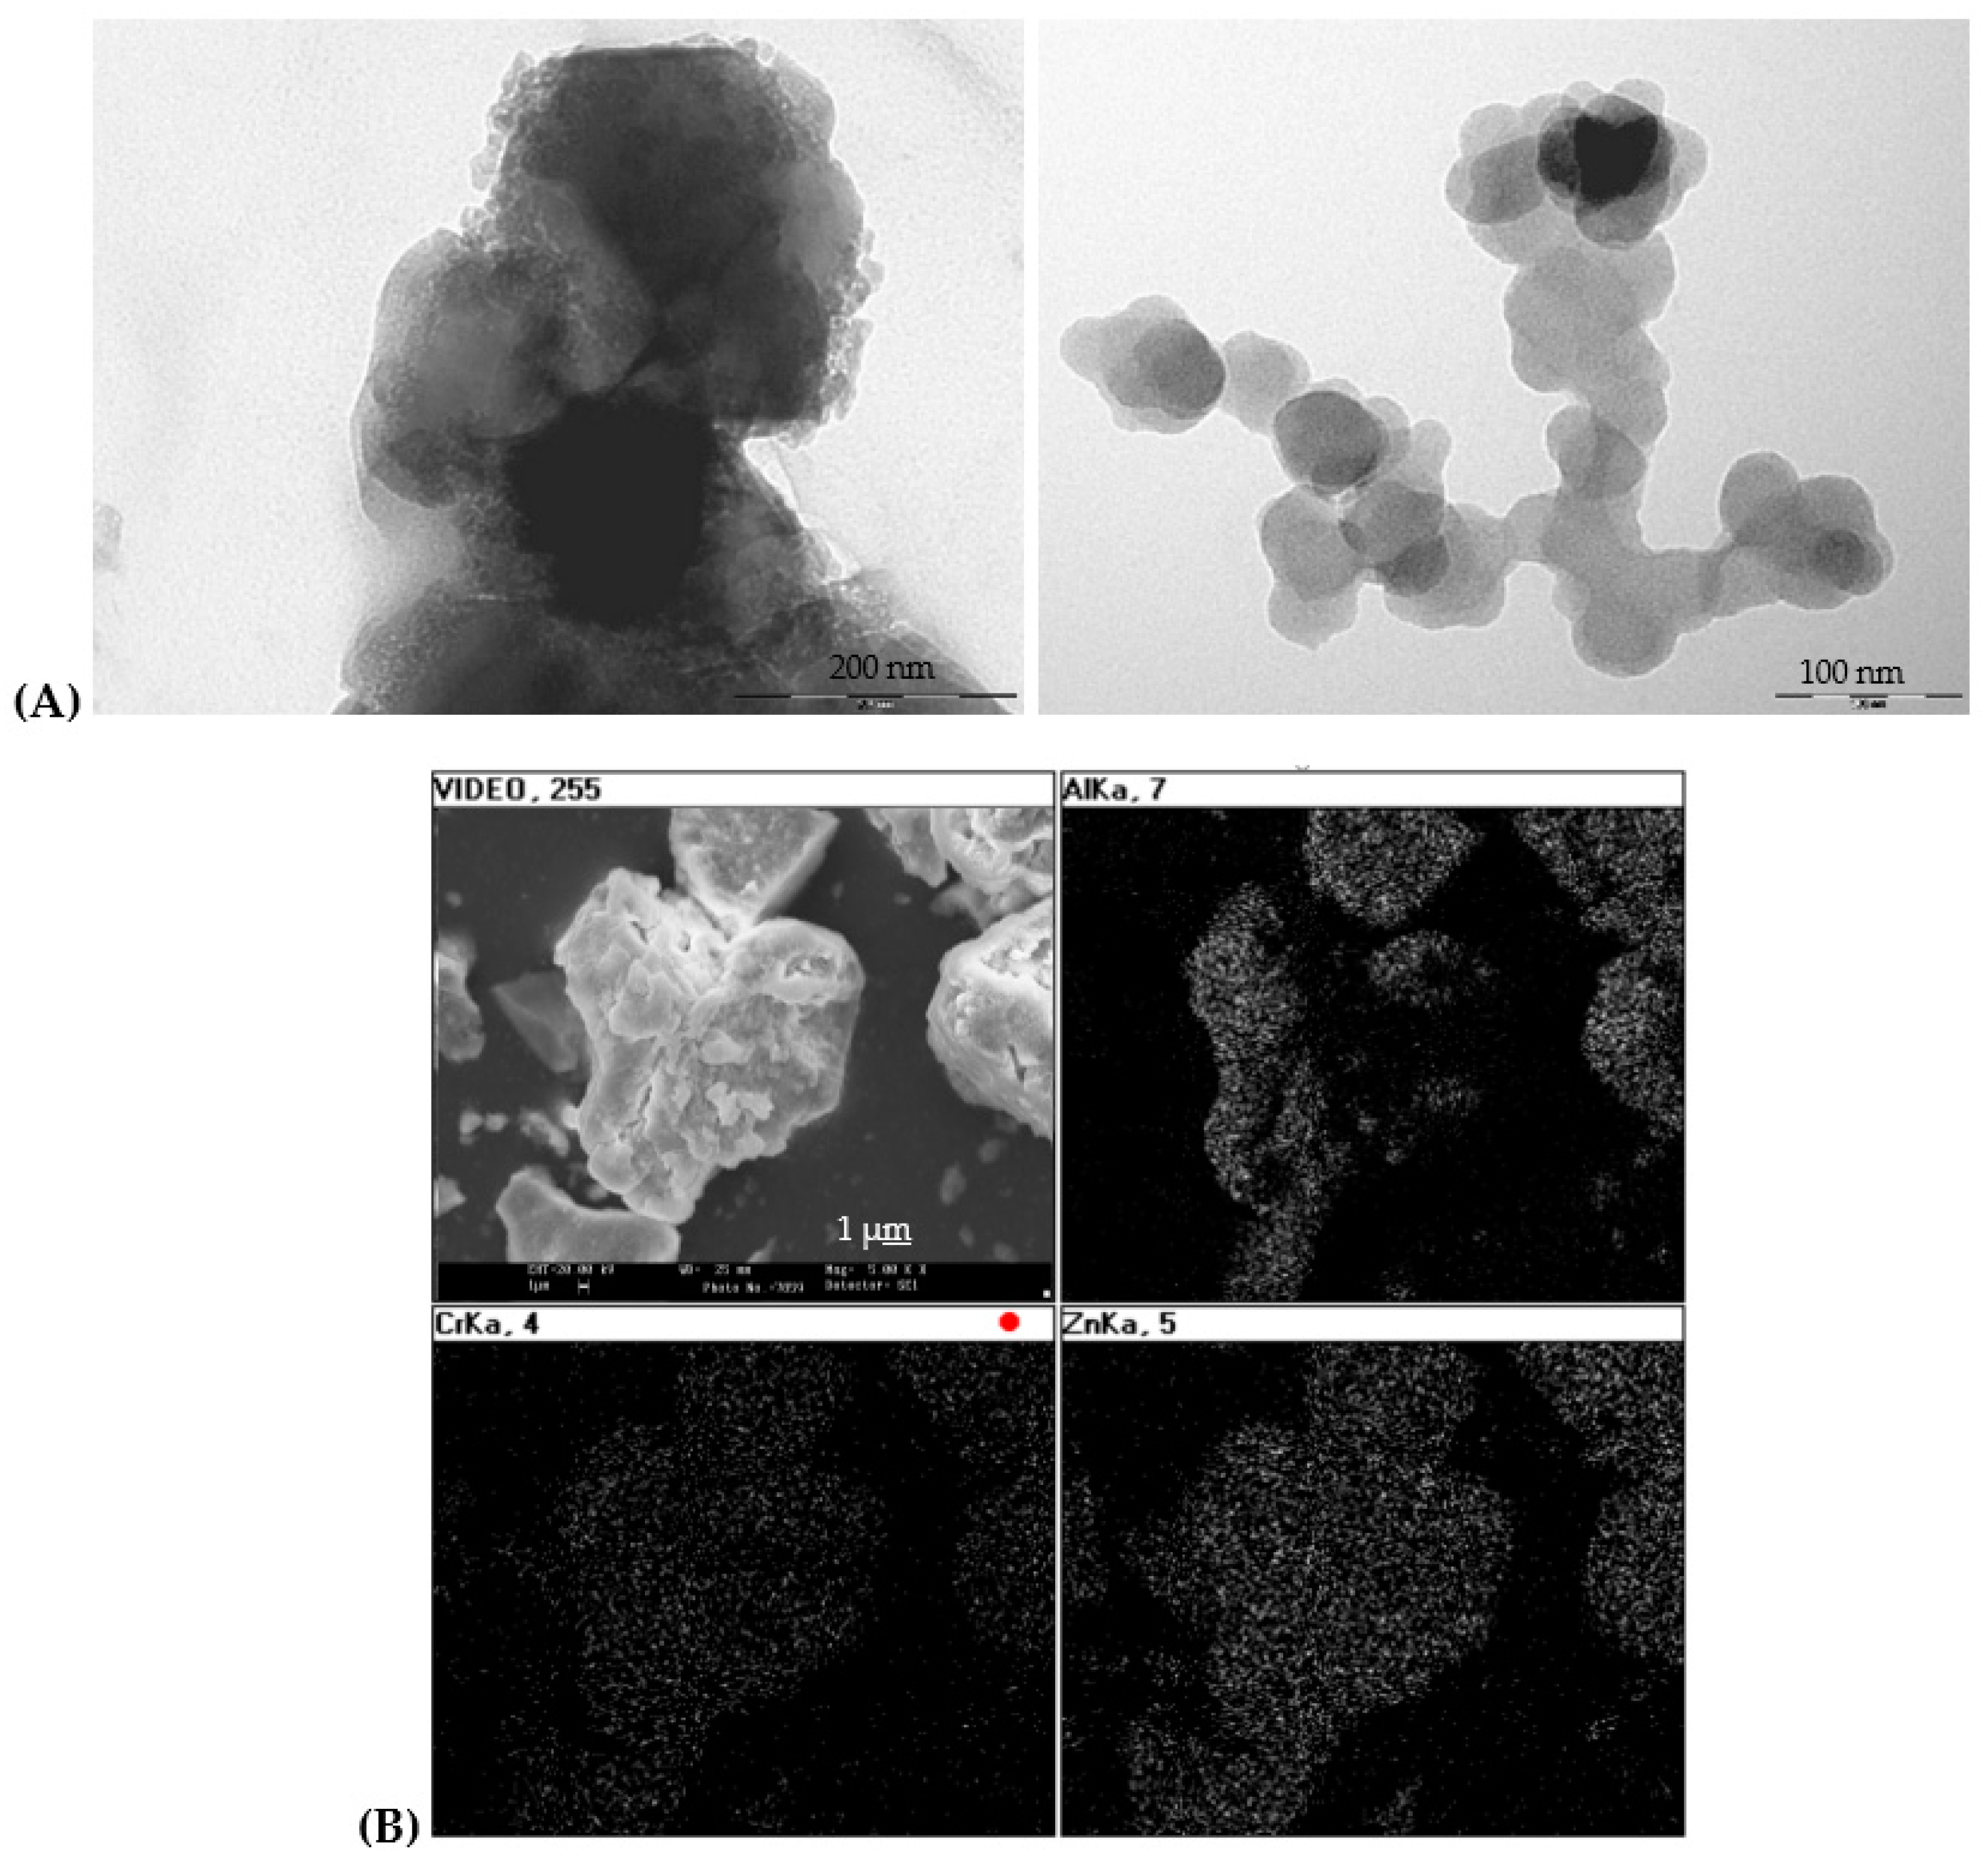
Figure 8.
Gahnite-Zincochromite-Franklinite Zn(Al1.5-xCr0,5Fex)O4 solid solutions: (A) raw dried gels, (B) fired powders 1000°C/1h, (C) 5wt.% glazed samples in a single firing frit 1080°C, (B) 5wt.% glazed samples in a porcelain single firing frit 1200°C. L*a*b* and reflectance values of samples are included.
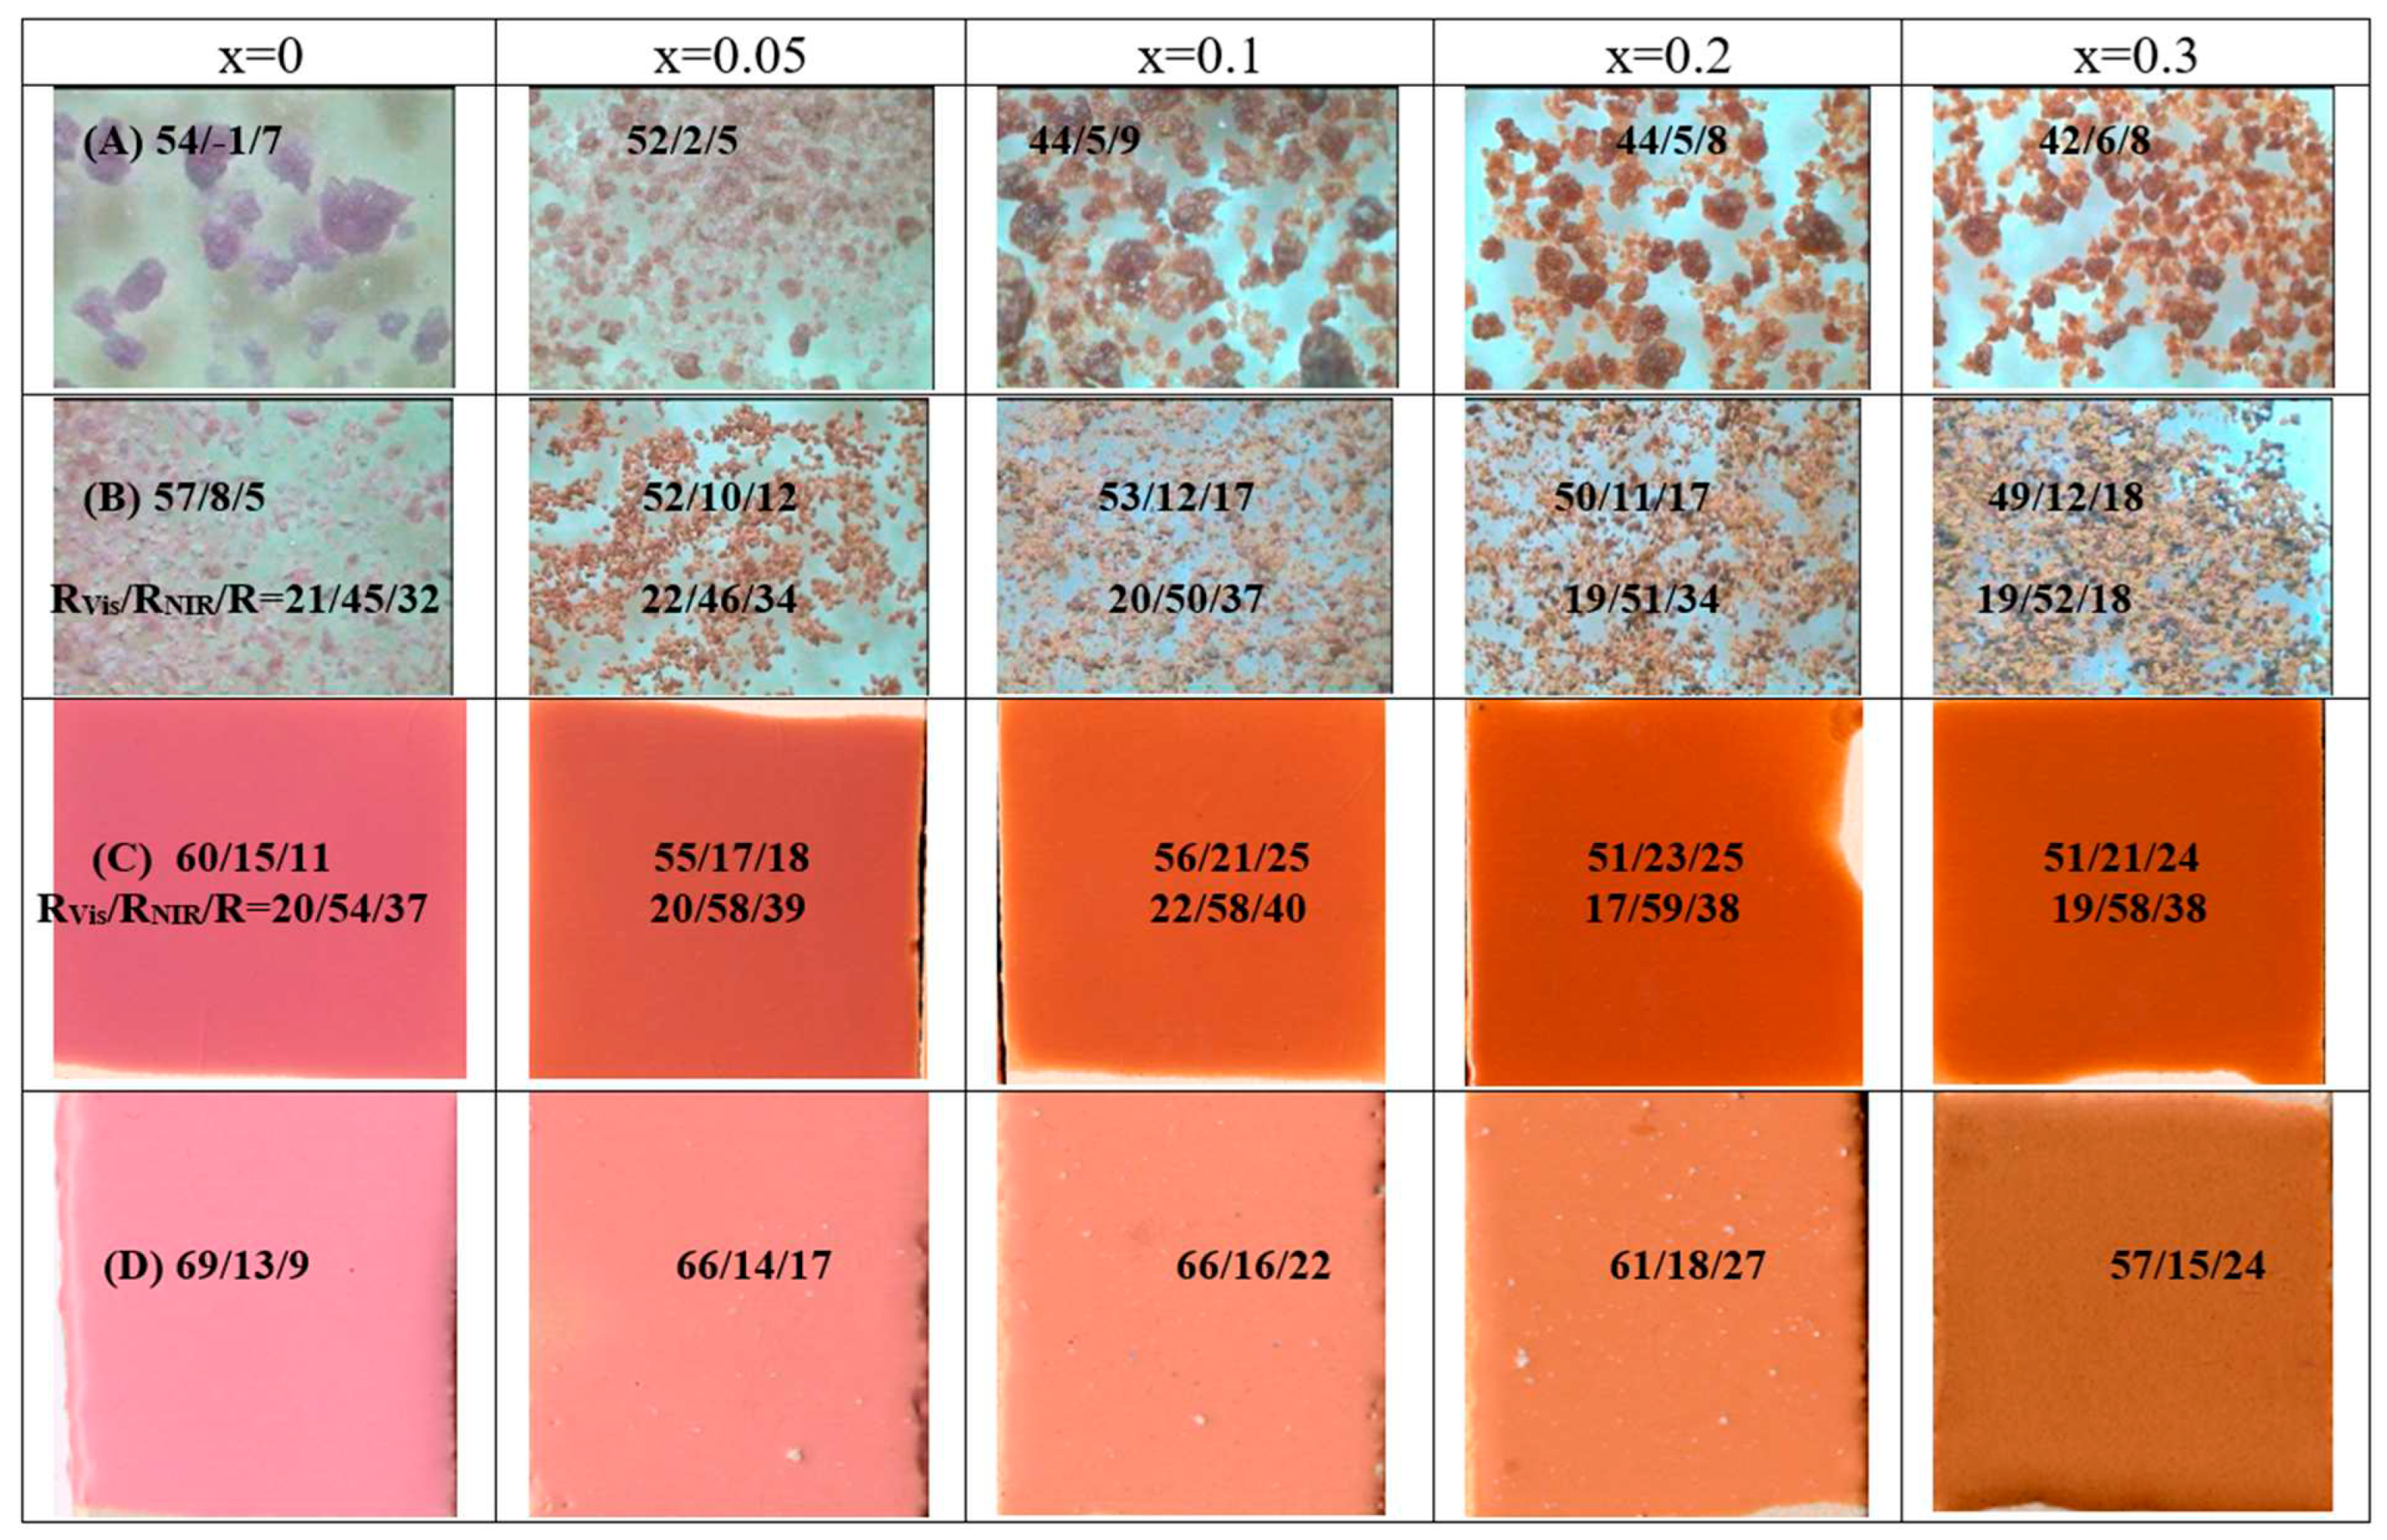
Figure 9.
XRD of Zn(Al1.5-xCr0,5Fex)O4 coprecipitated samples fired at 1000ºC/1h.
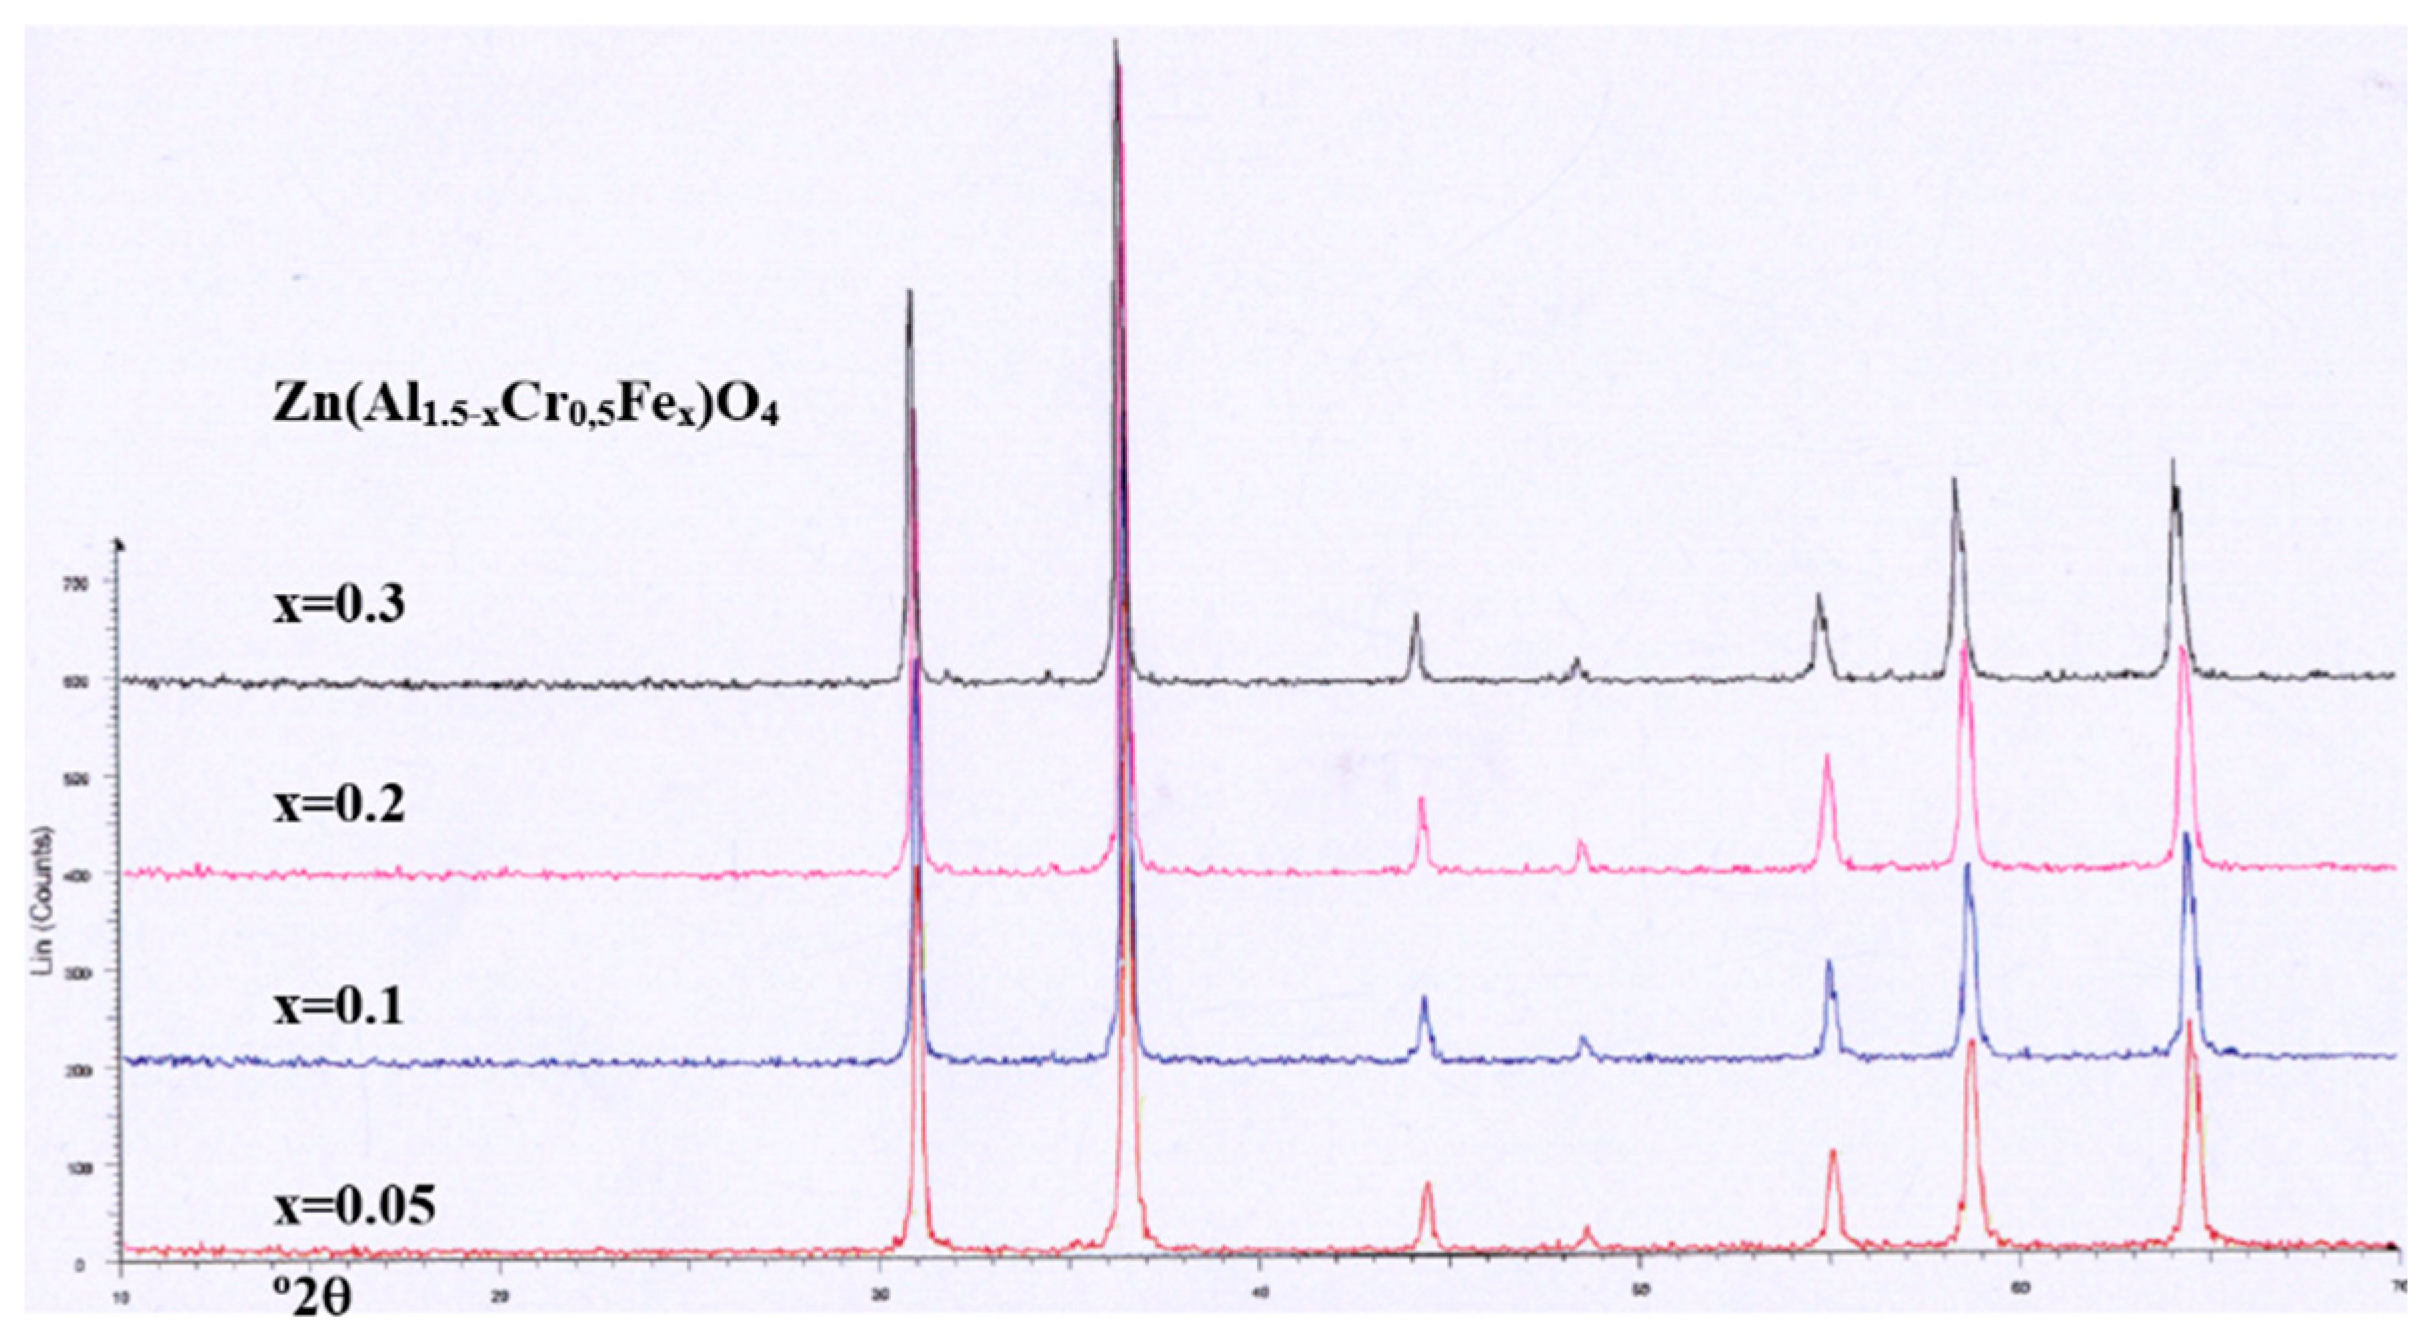
Figure 10.
UV-Vis-NIR diffuse reflectance spectra of Zn(Al1.5-xCr0.5Fex)O4 glazed coprecipitated samples fired at 1000ºC/1h in single firing frit 1080ºC.
Figure 10.
UV-Vis-NIR diffuse reflectance spectra of Zn(Al1.5-xCr0.5Fex)O4 glazed coprecipitated samples fired at 1000ºC/1h in single firing frit 1080ºC.
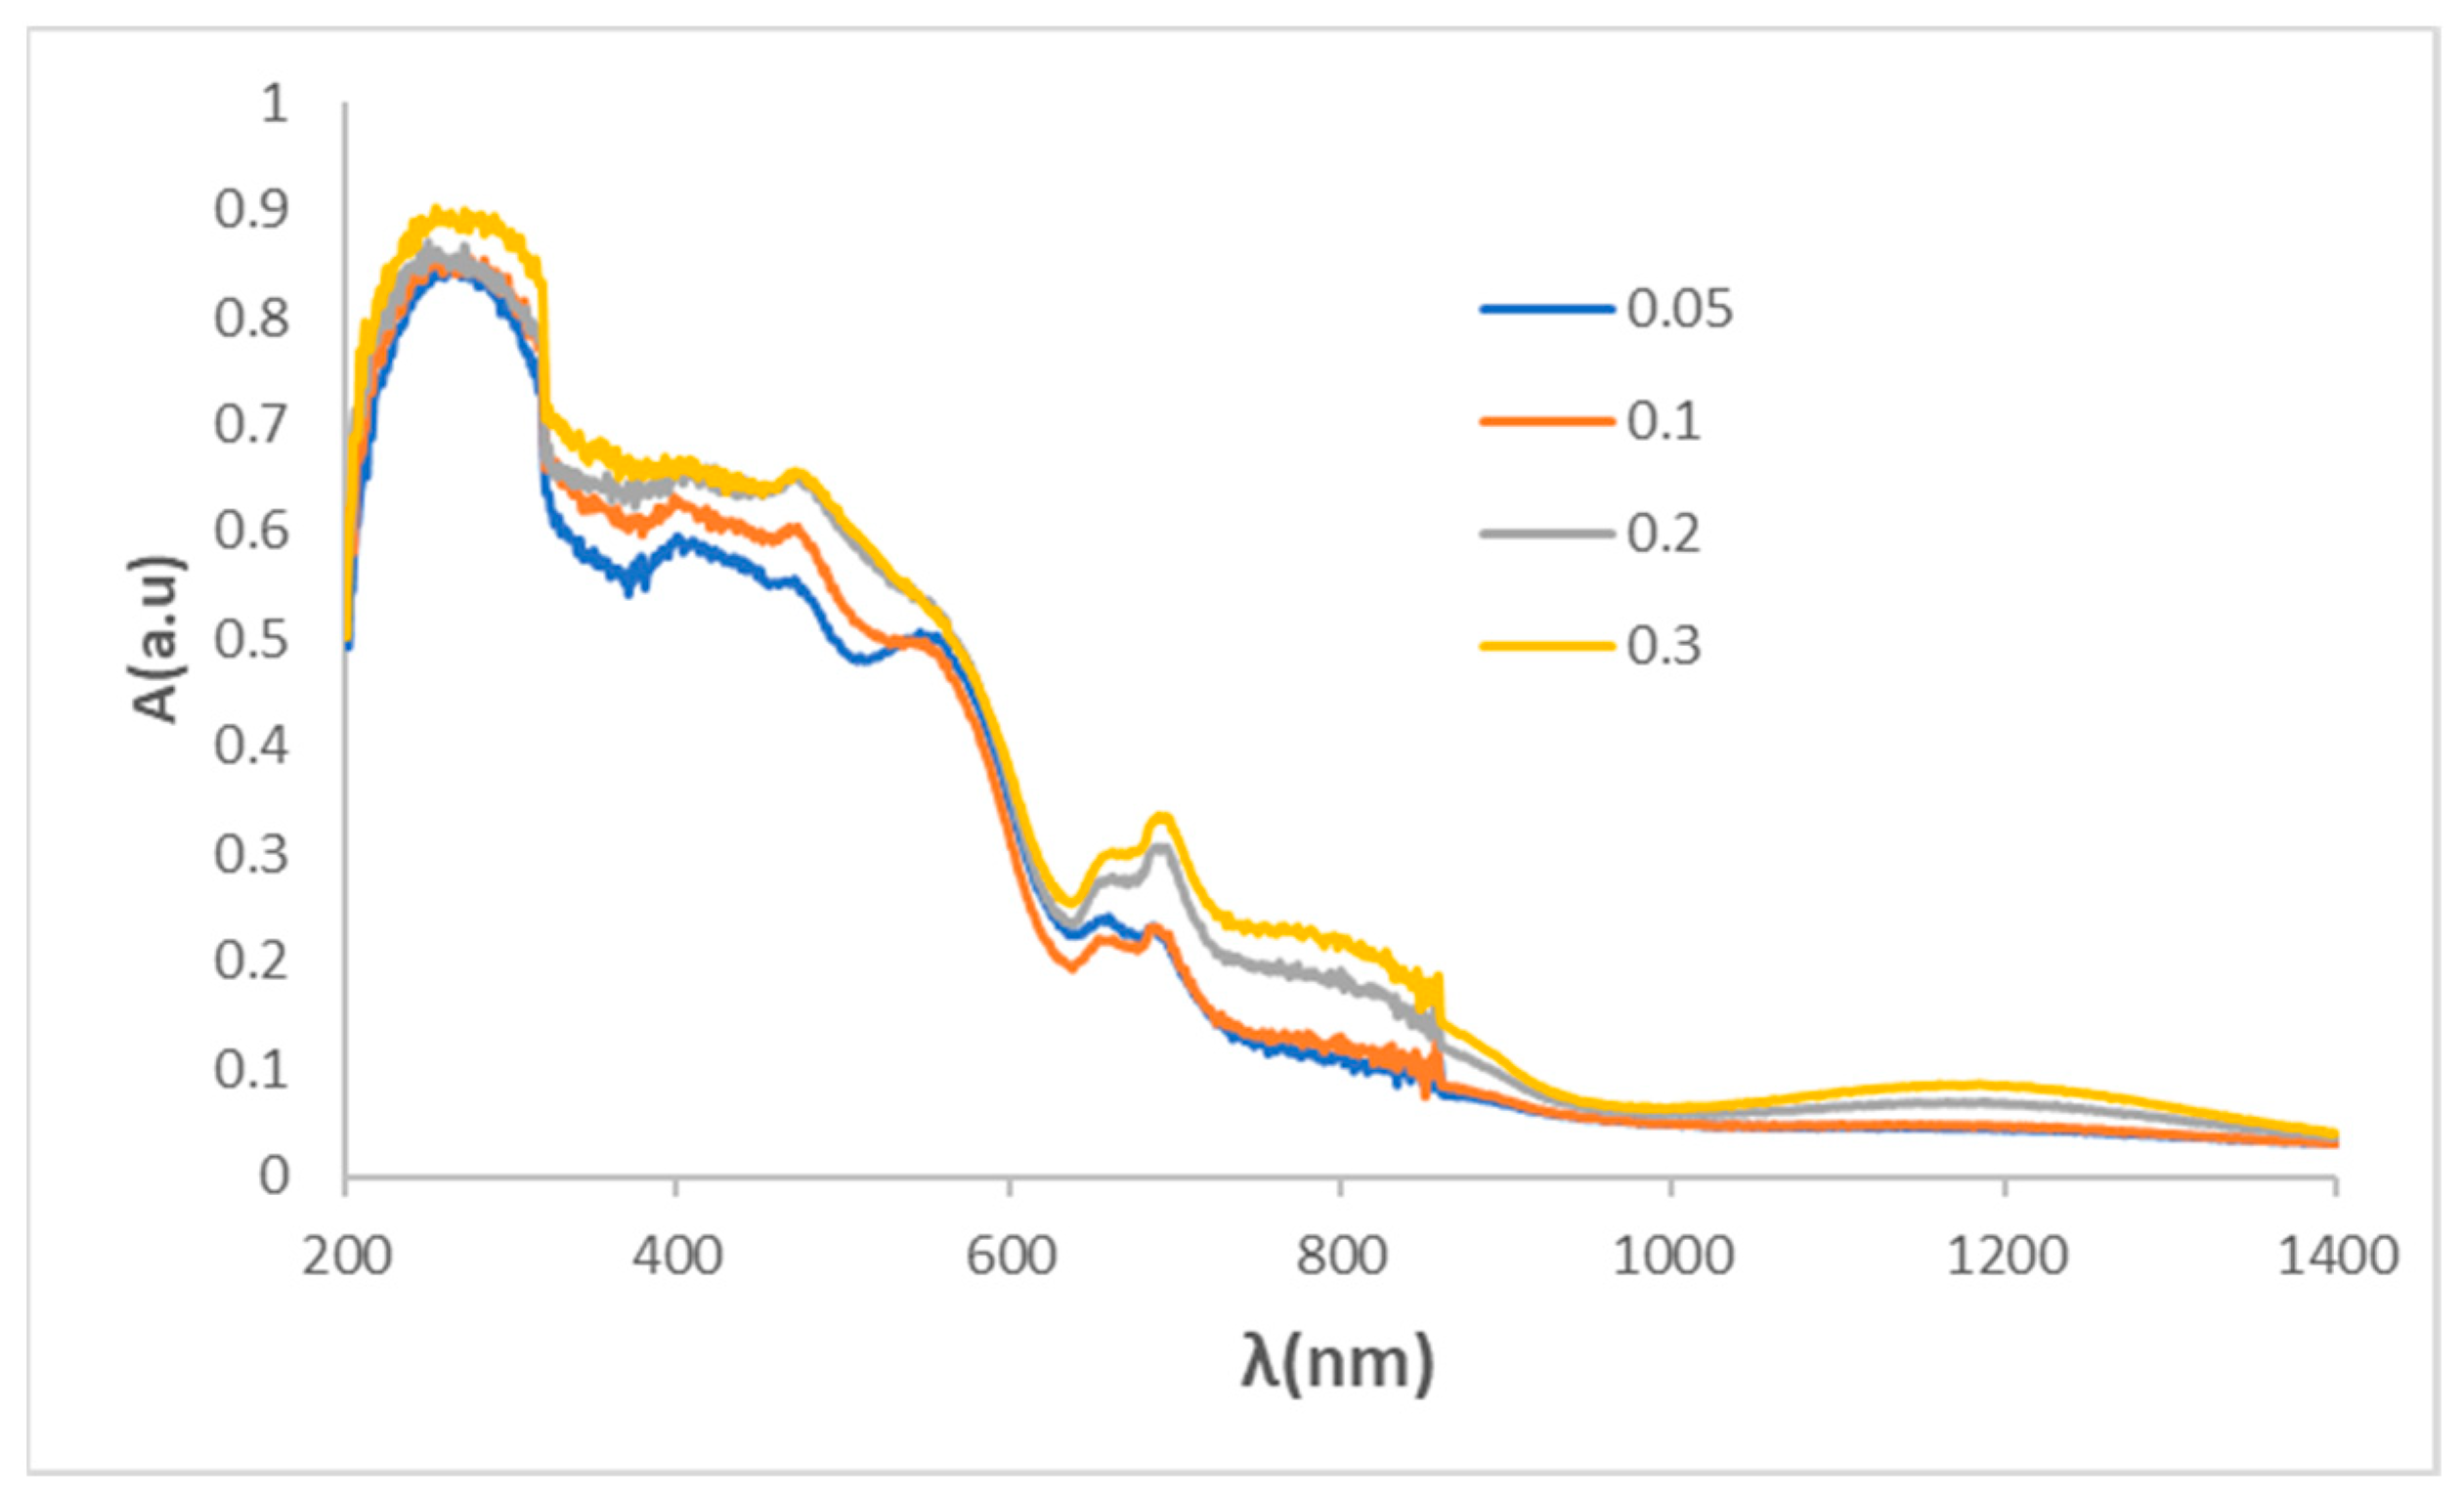
Figure 11.
(A) TEM micrographs of raw gel nanoparticles of the optimal coprecipitated sample Zn(Al1.3Cr0.5Fe0.2)O4. (B) SEM micrograph of the same sample fired at 1000ºC/1h.
Figure 11.
(A) TEM micrographs of raw gel nanoparticles of the optimal coprecipitated sample Zn(Al1.3Cr0.5Fe0.2)O4. (B) SEM micrograph of the same sample fired at 1000ºC/1h.
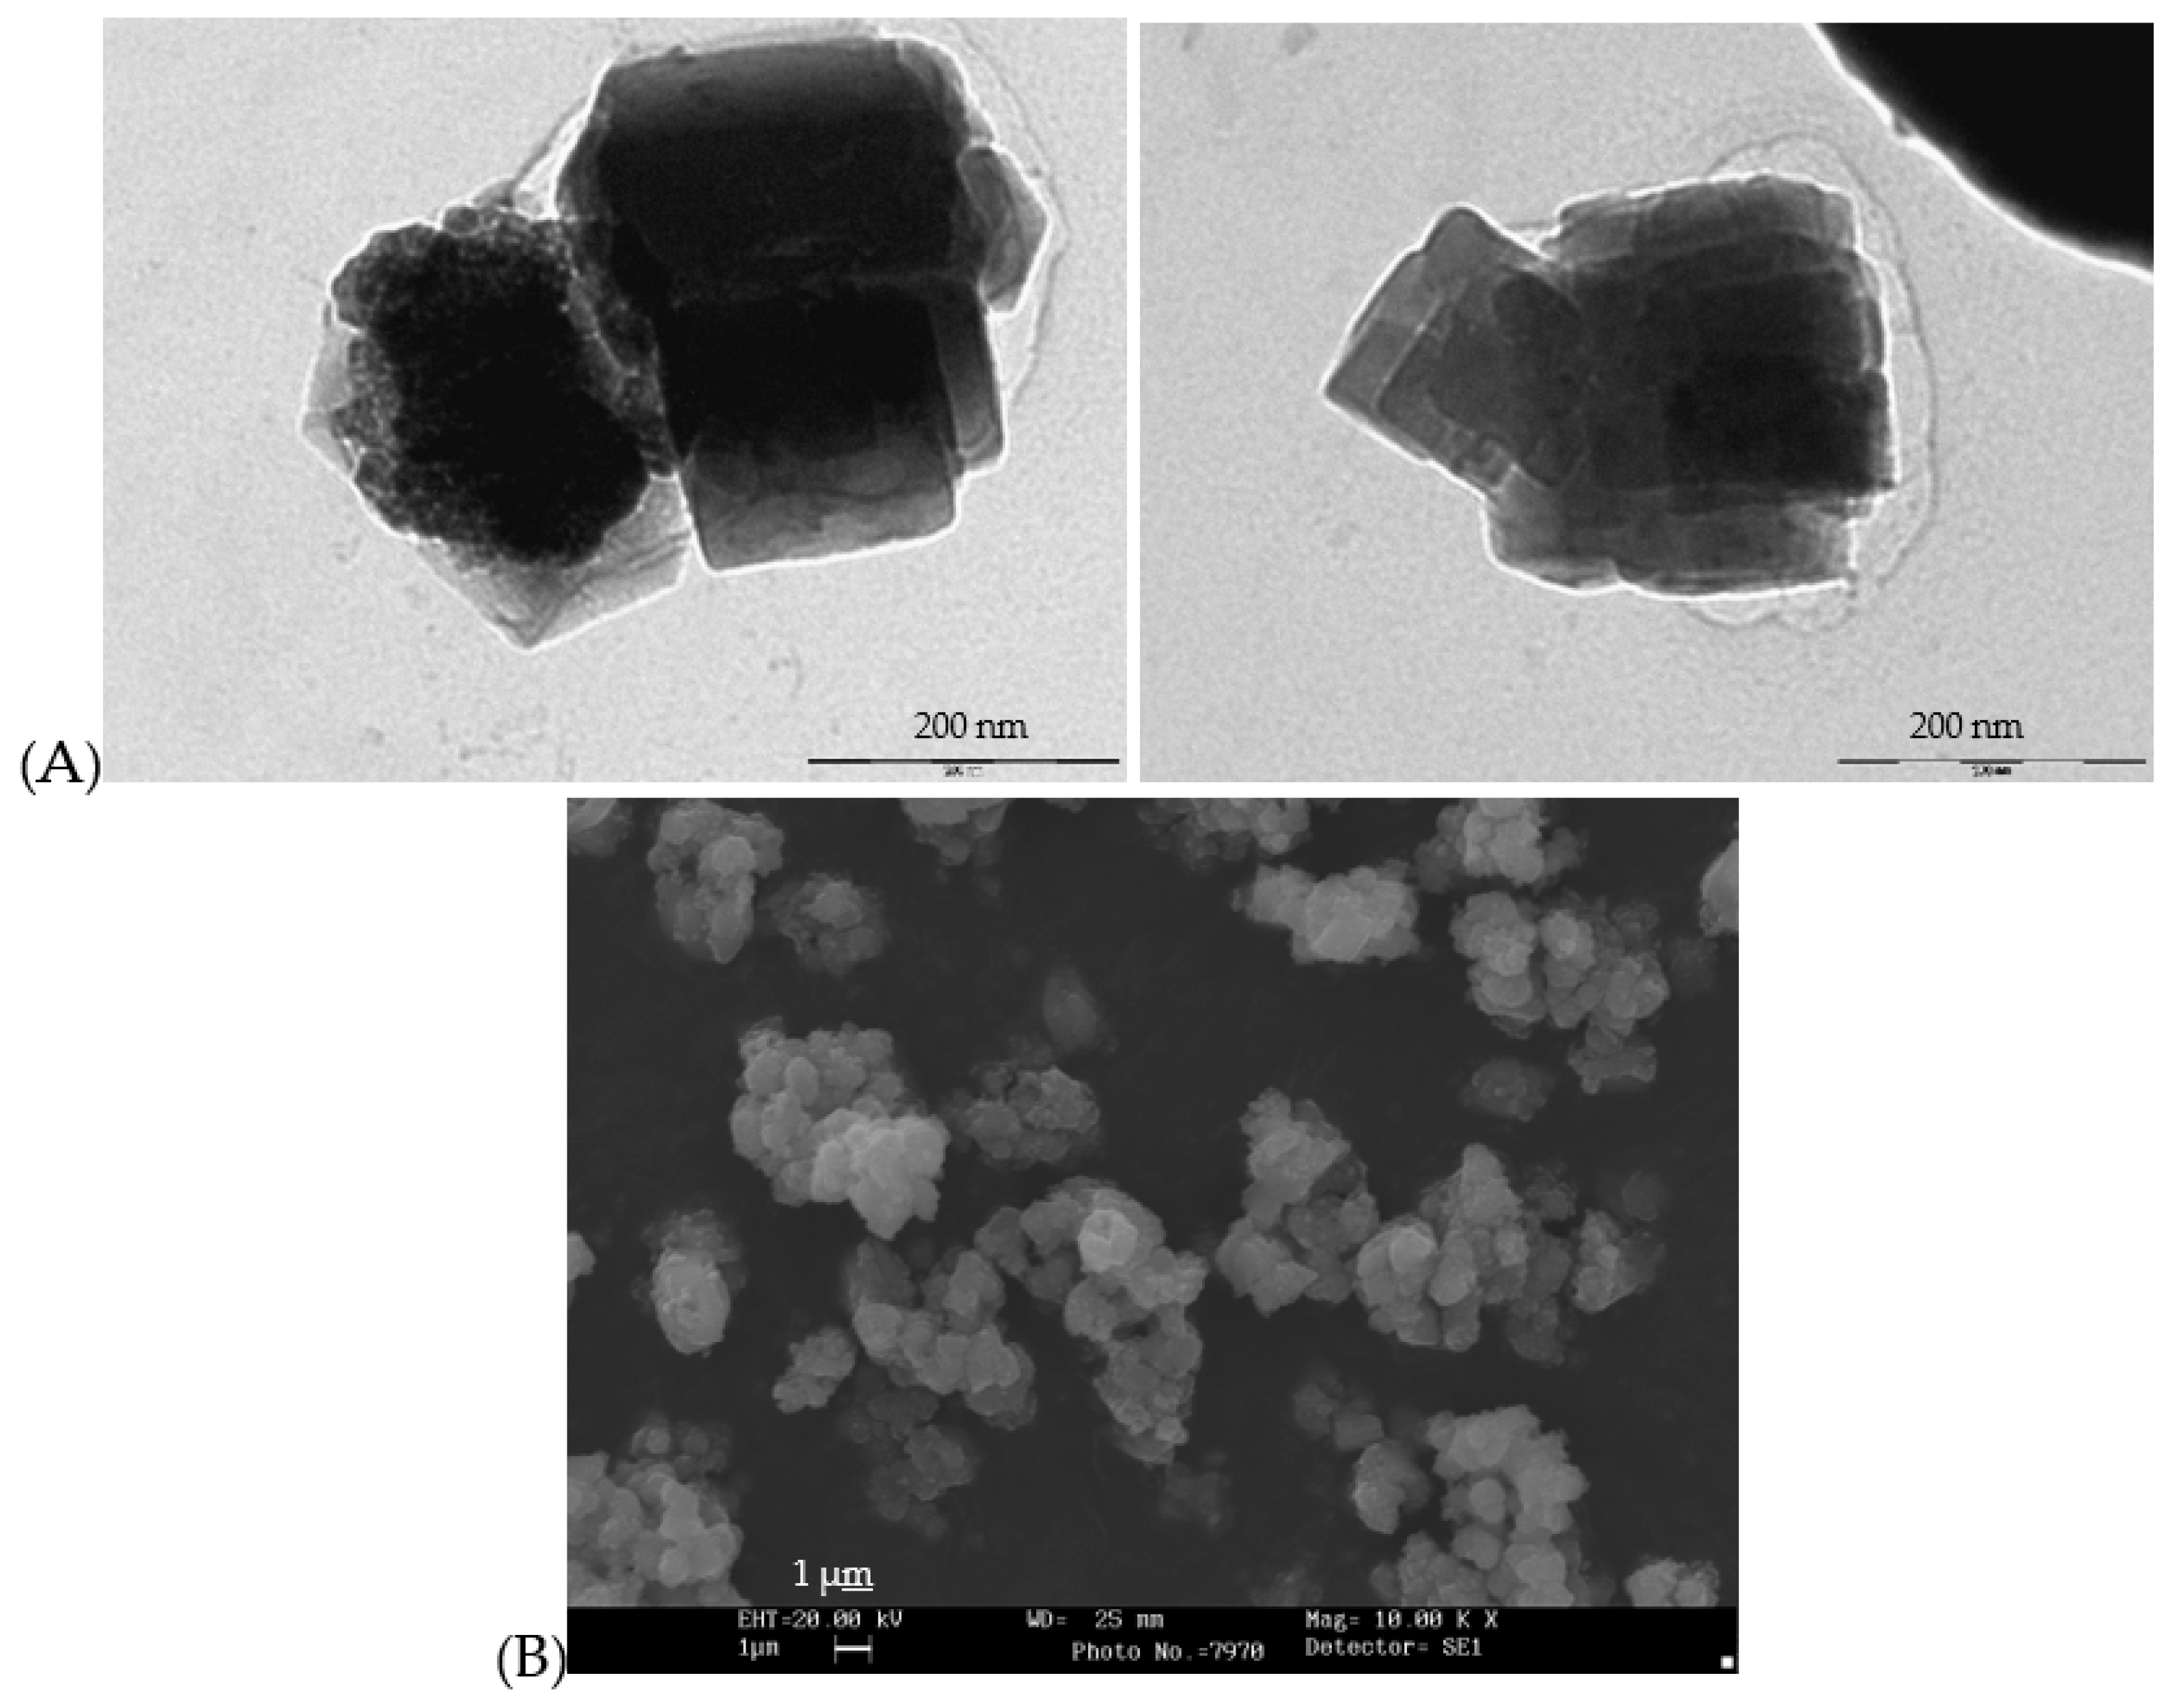
Figure 12.
Summary of the three reddish optimized samples compared with a commercial cadmium sulfoselenide encapsulated in zircon ((S0.5Se0.5)Cd@ZrSiO4): (A) powders, (b) 5wt.% glazed in single firing frit 1080°C, (C) 5wt.% glazed in porcelain single firing frit 1200°C.
Figure 12.
Summary of the three reddish optimized samples compared with a commercial cadmium sulfoselenide encapsulated in zircon ((S0.5Se0.5)Cd@ZrSiO4): (A) powders, (b) 5wt.% glazed in single firing frit 1080°C, (C) 5wt.% glazed in porcelain single firing frit 1200°C.
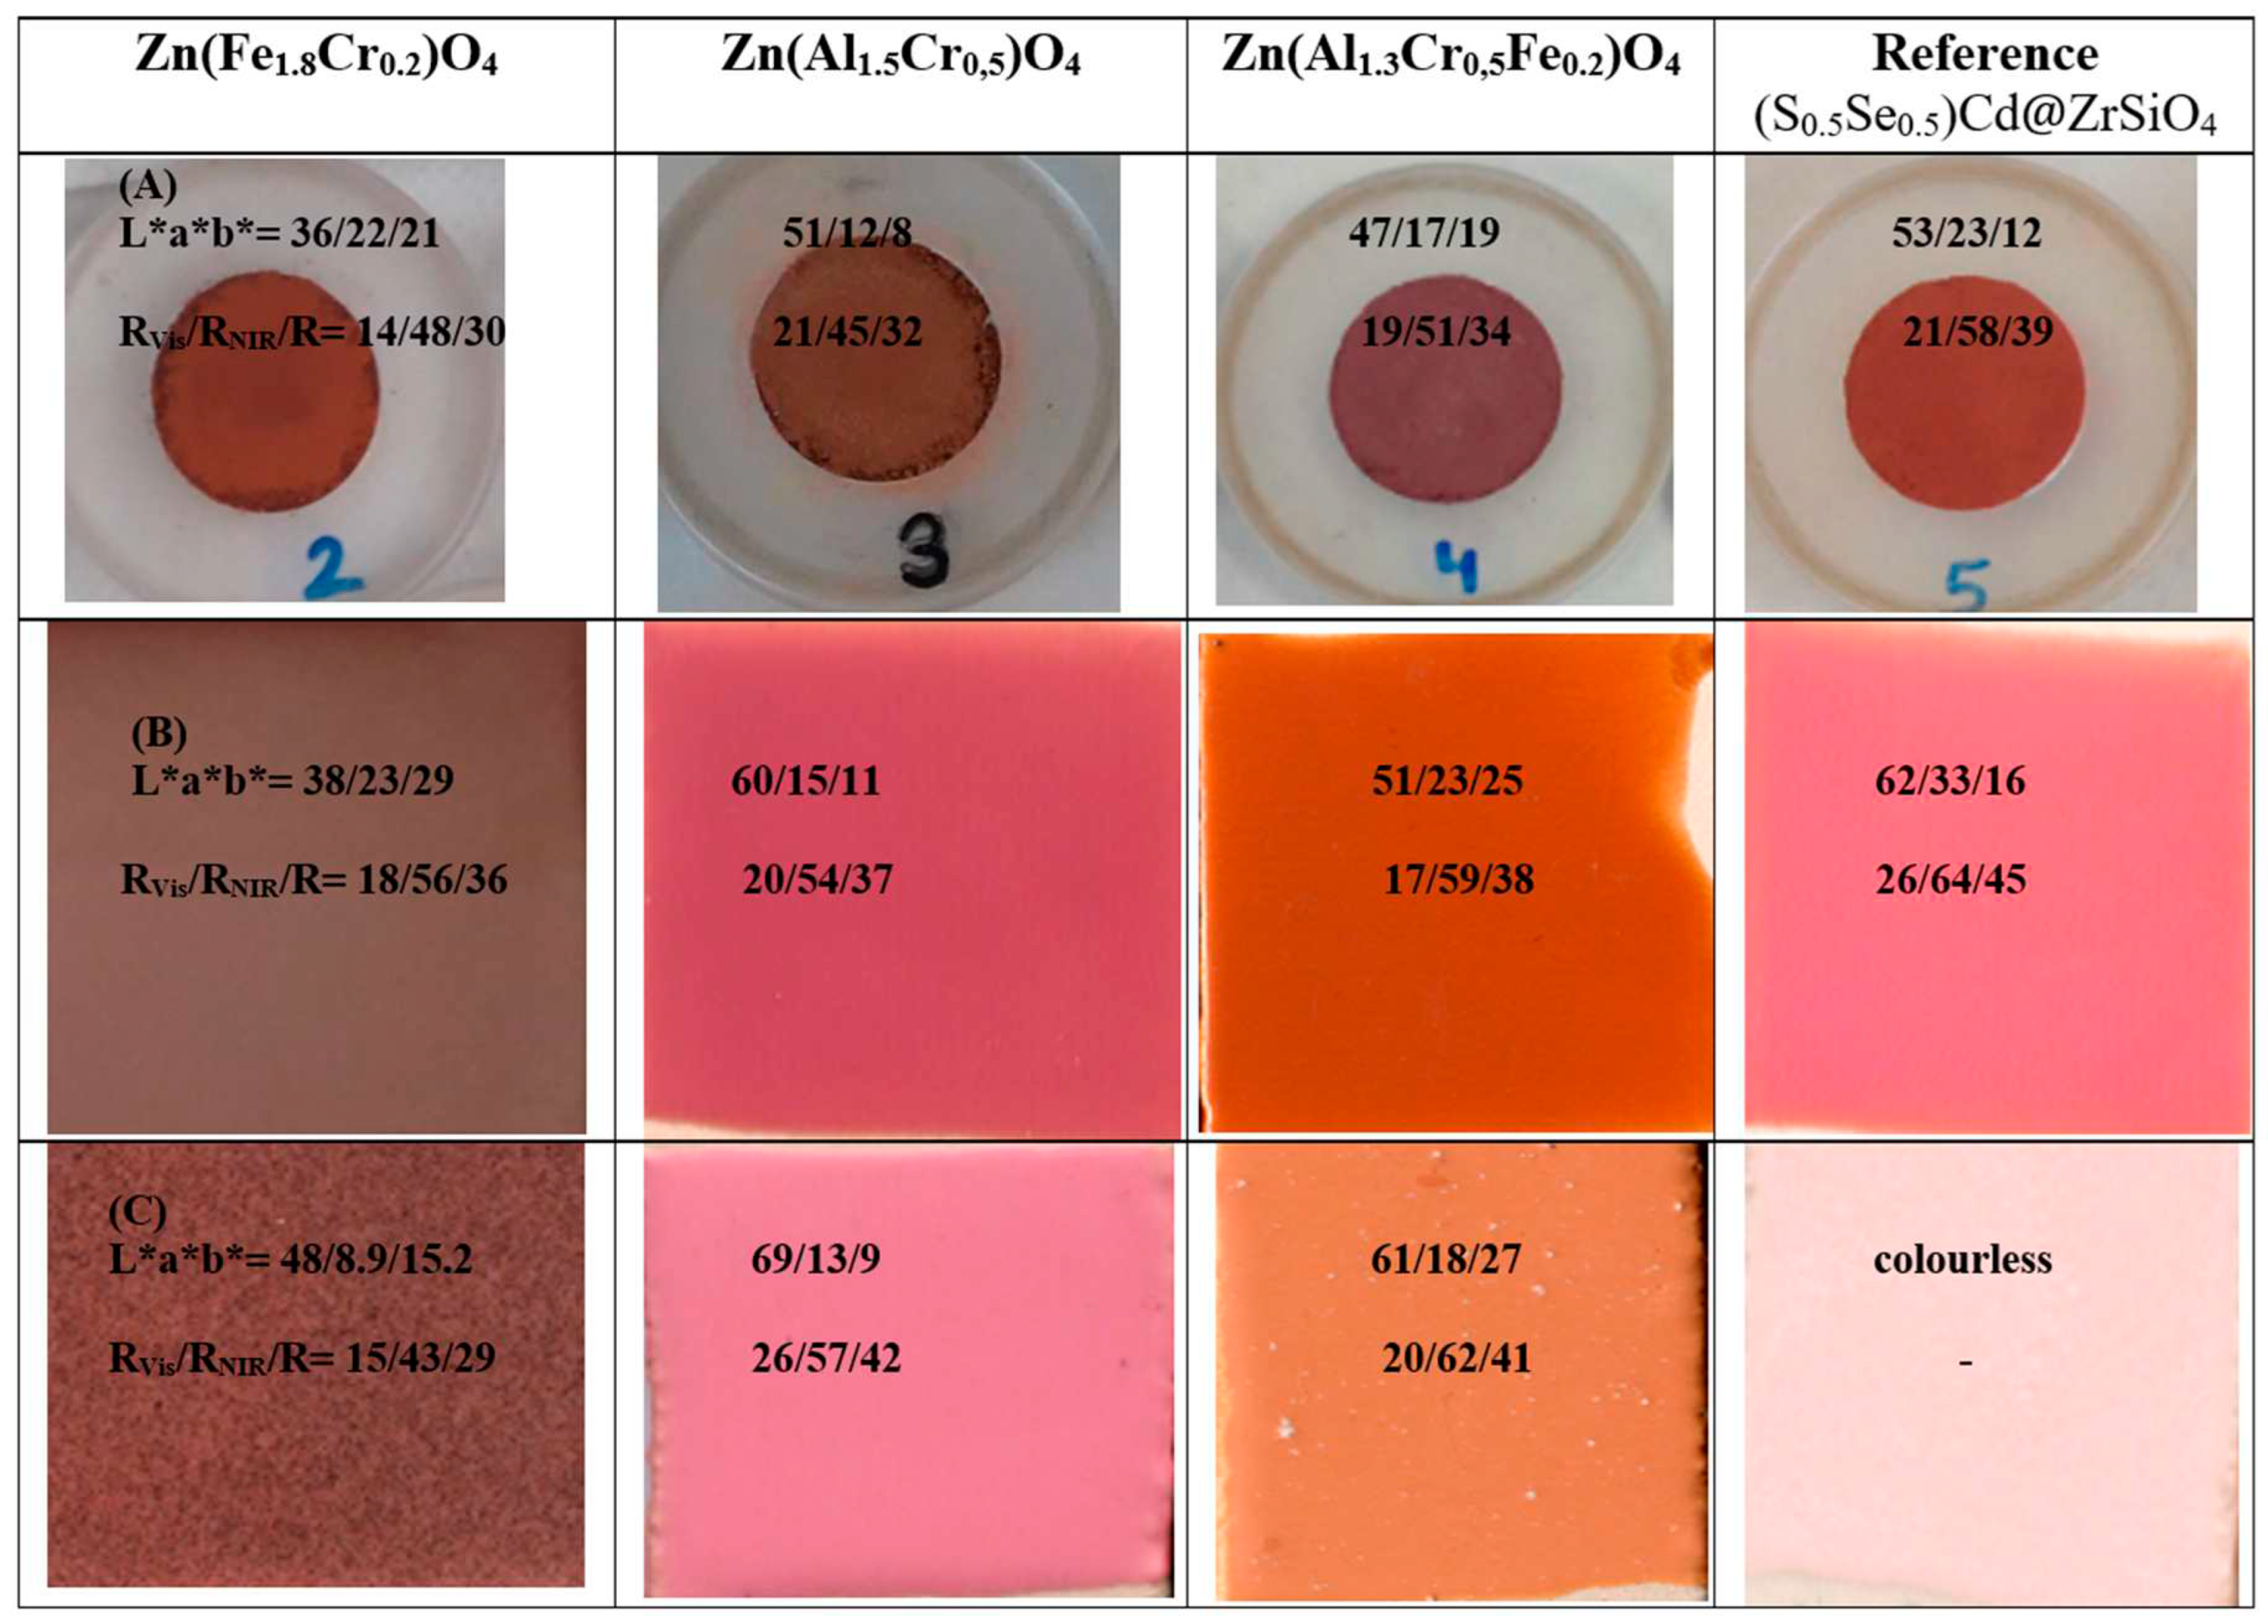
Figure 13.
UV-Vis-NIR diffuse reflectance spectra of optimized samples: (A) powders, (B) glazed samples in single firing frit.
Figure 13.
UV-Vis-NIR diffuse reflectance spectra of optimized samples: (A) powders, (B) glazed samples in single firing frit.
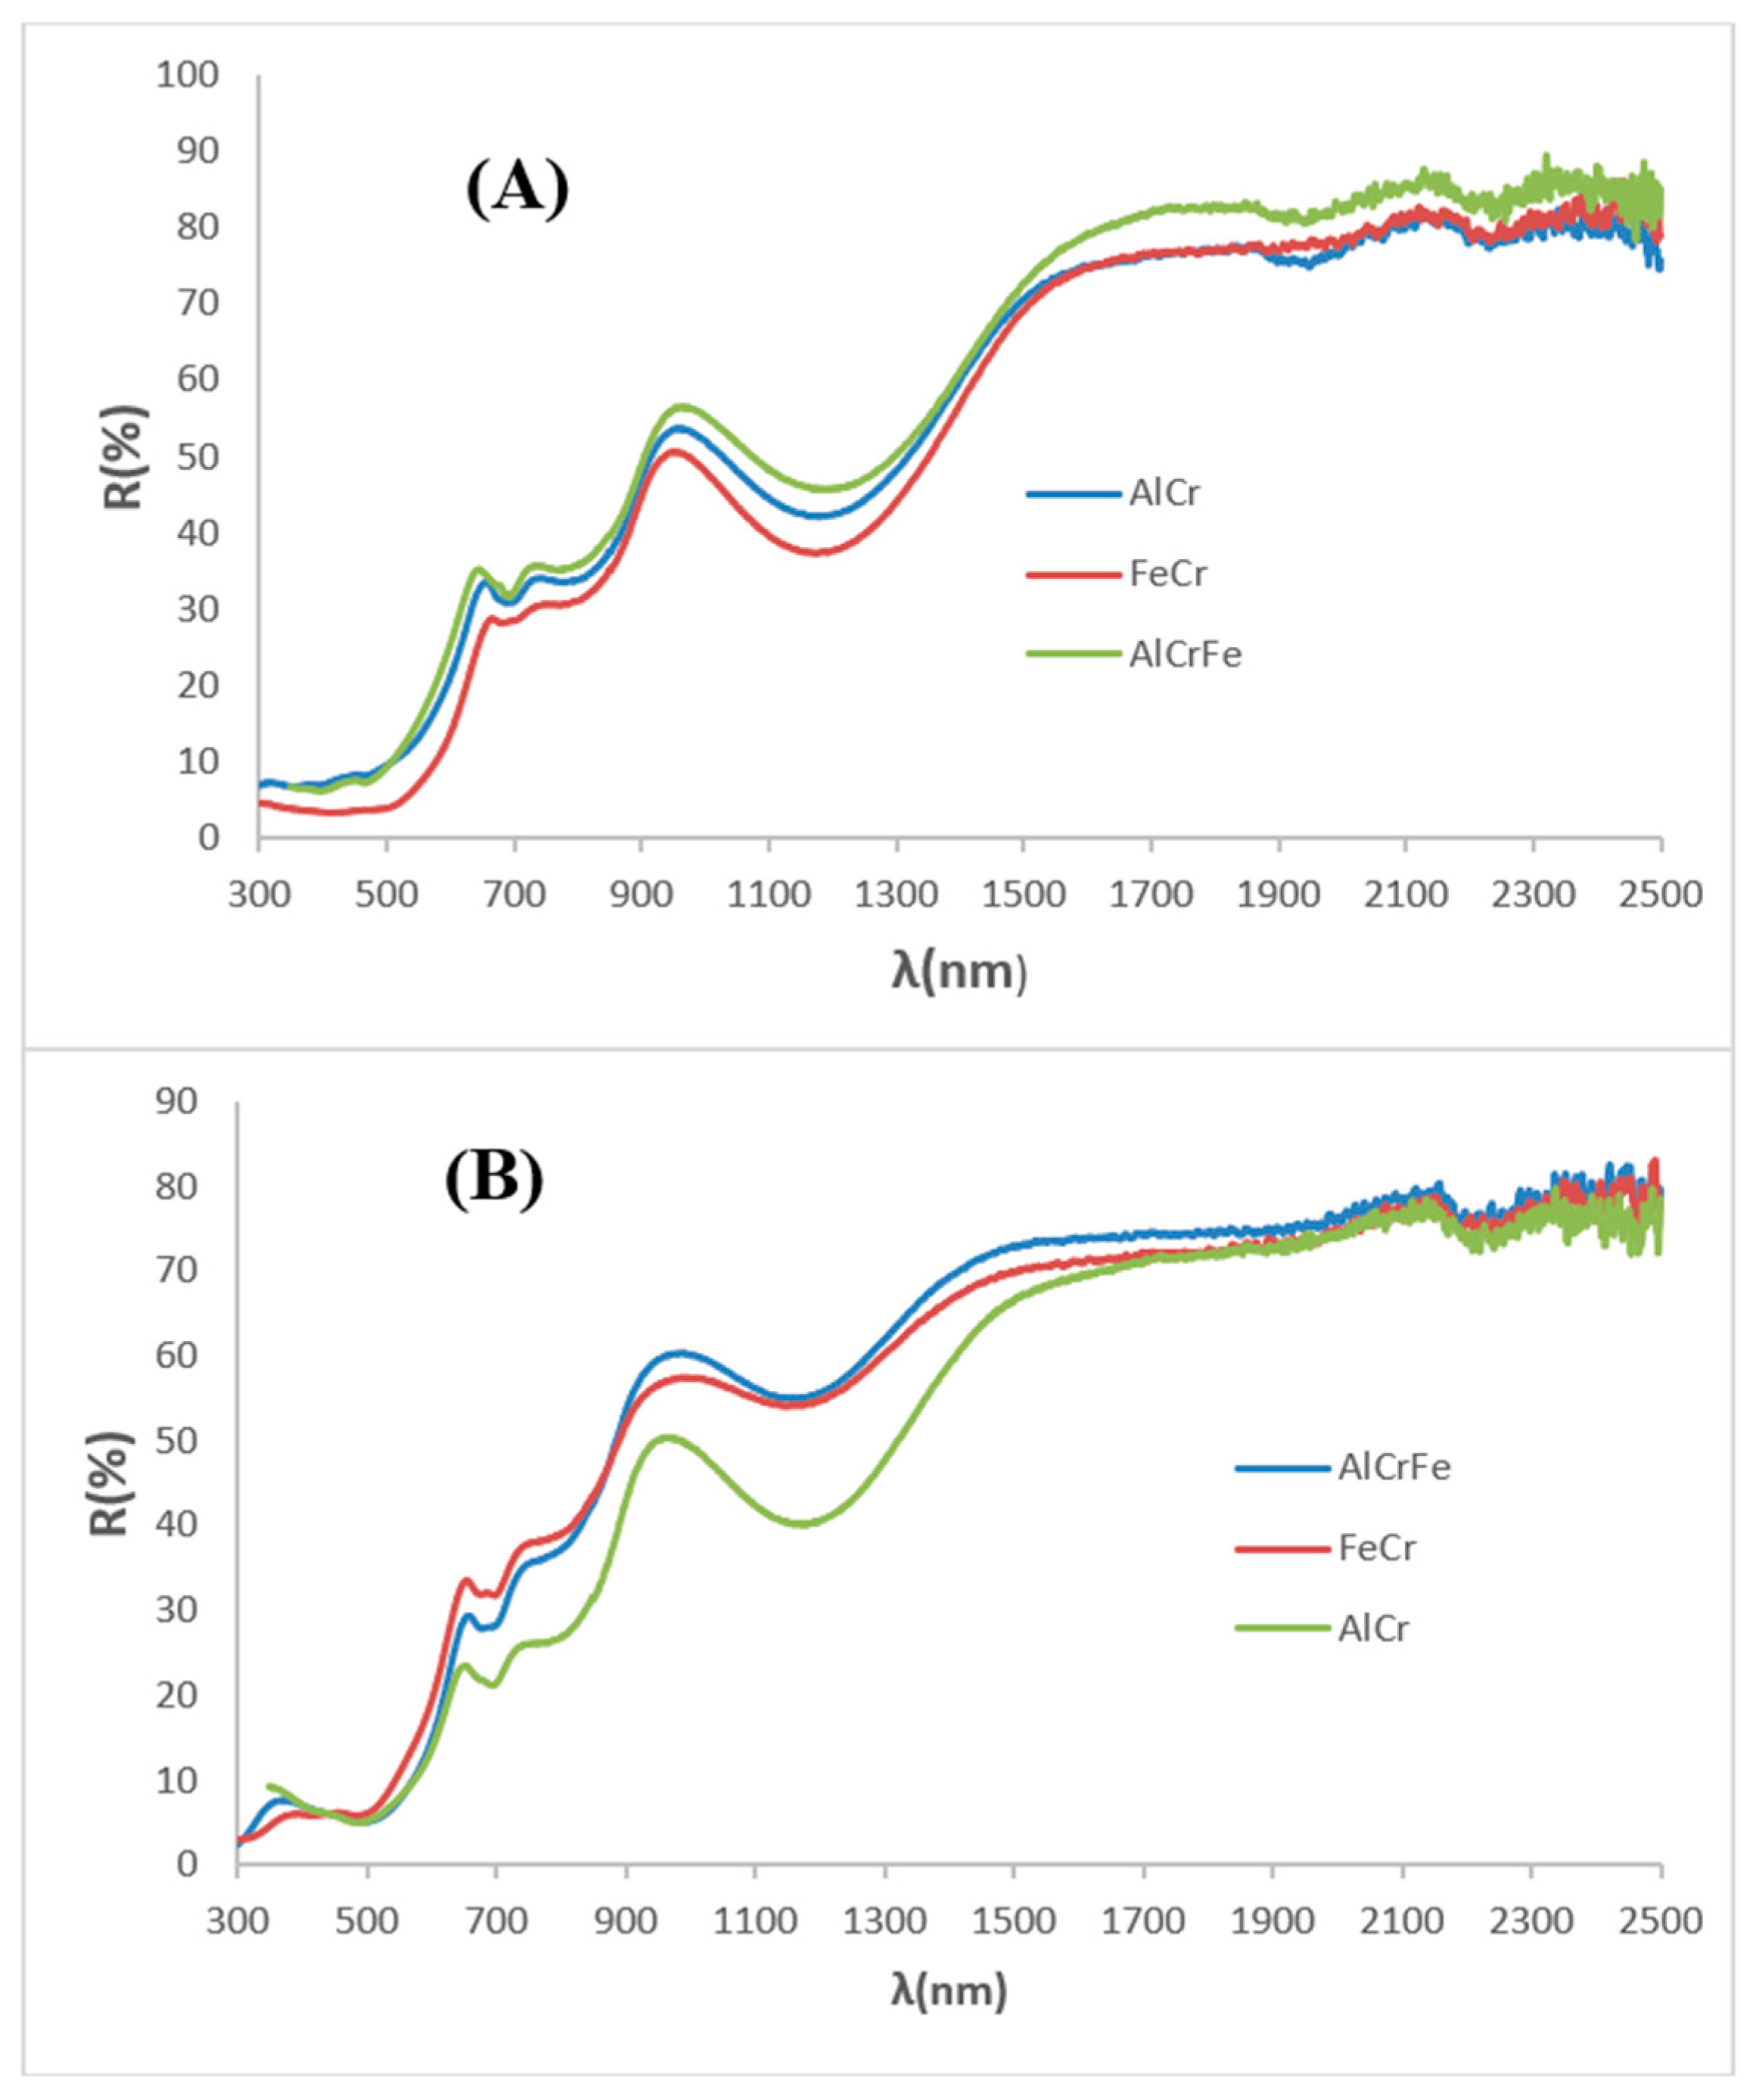
Figure 14.
Tauc plots of optimized samples.
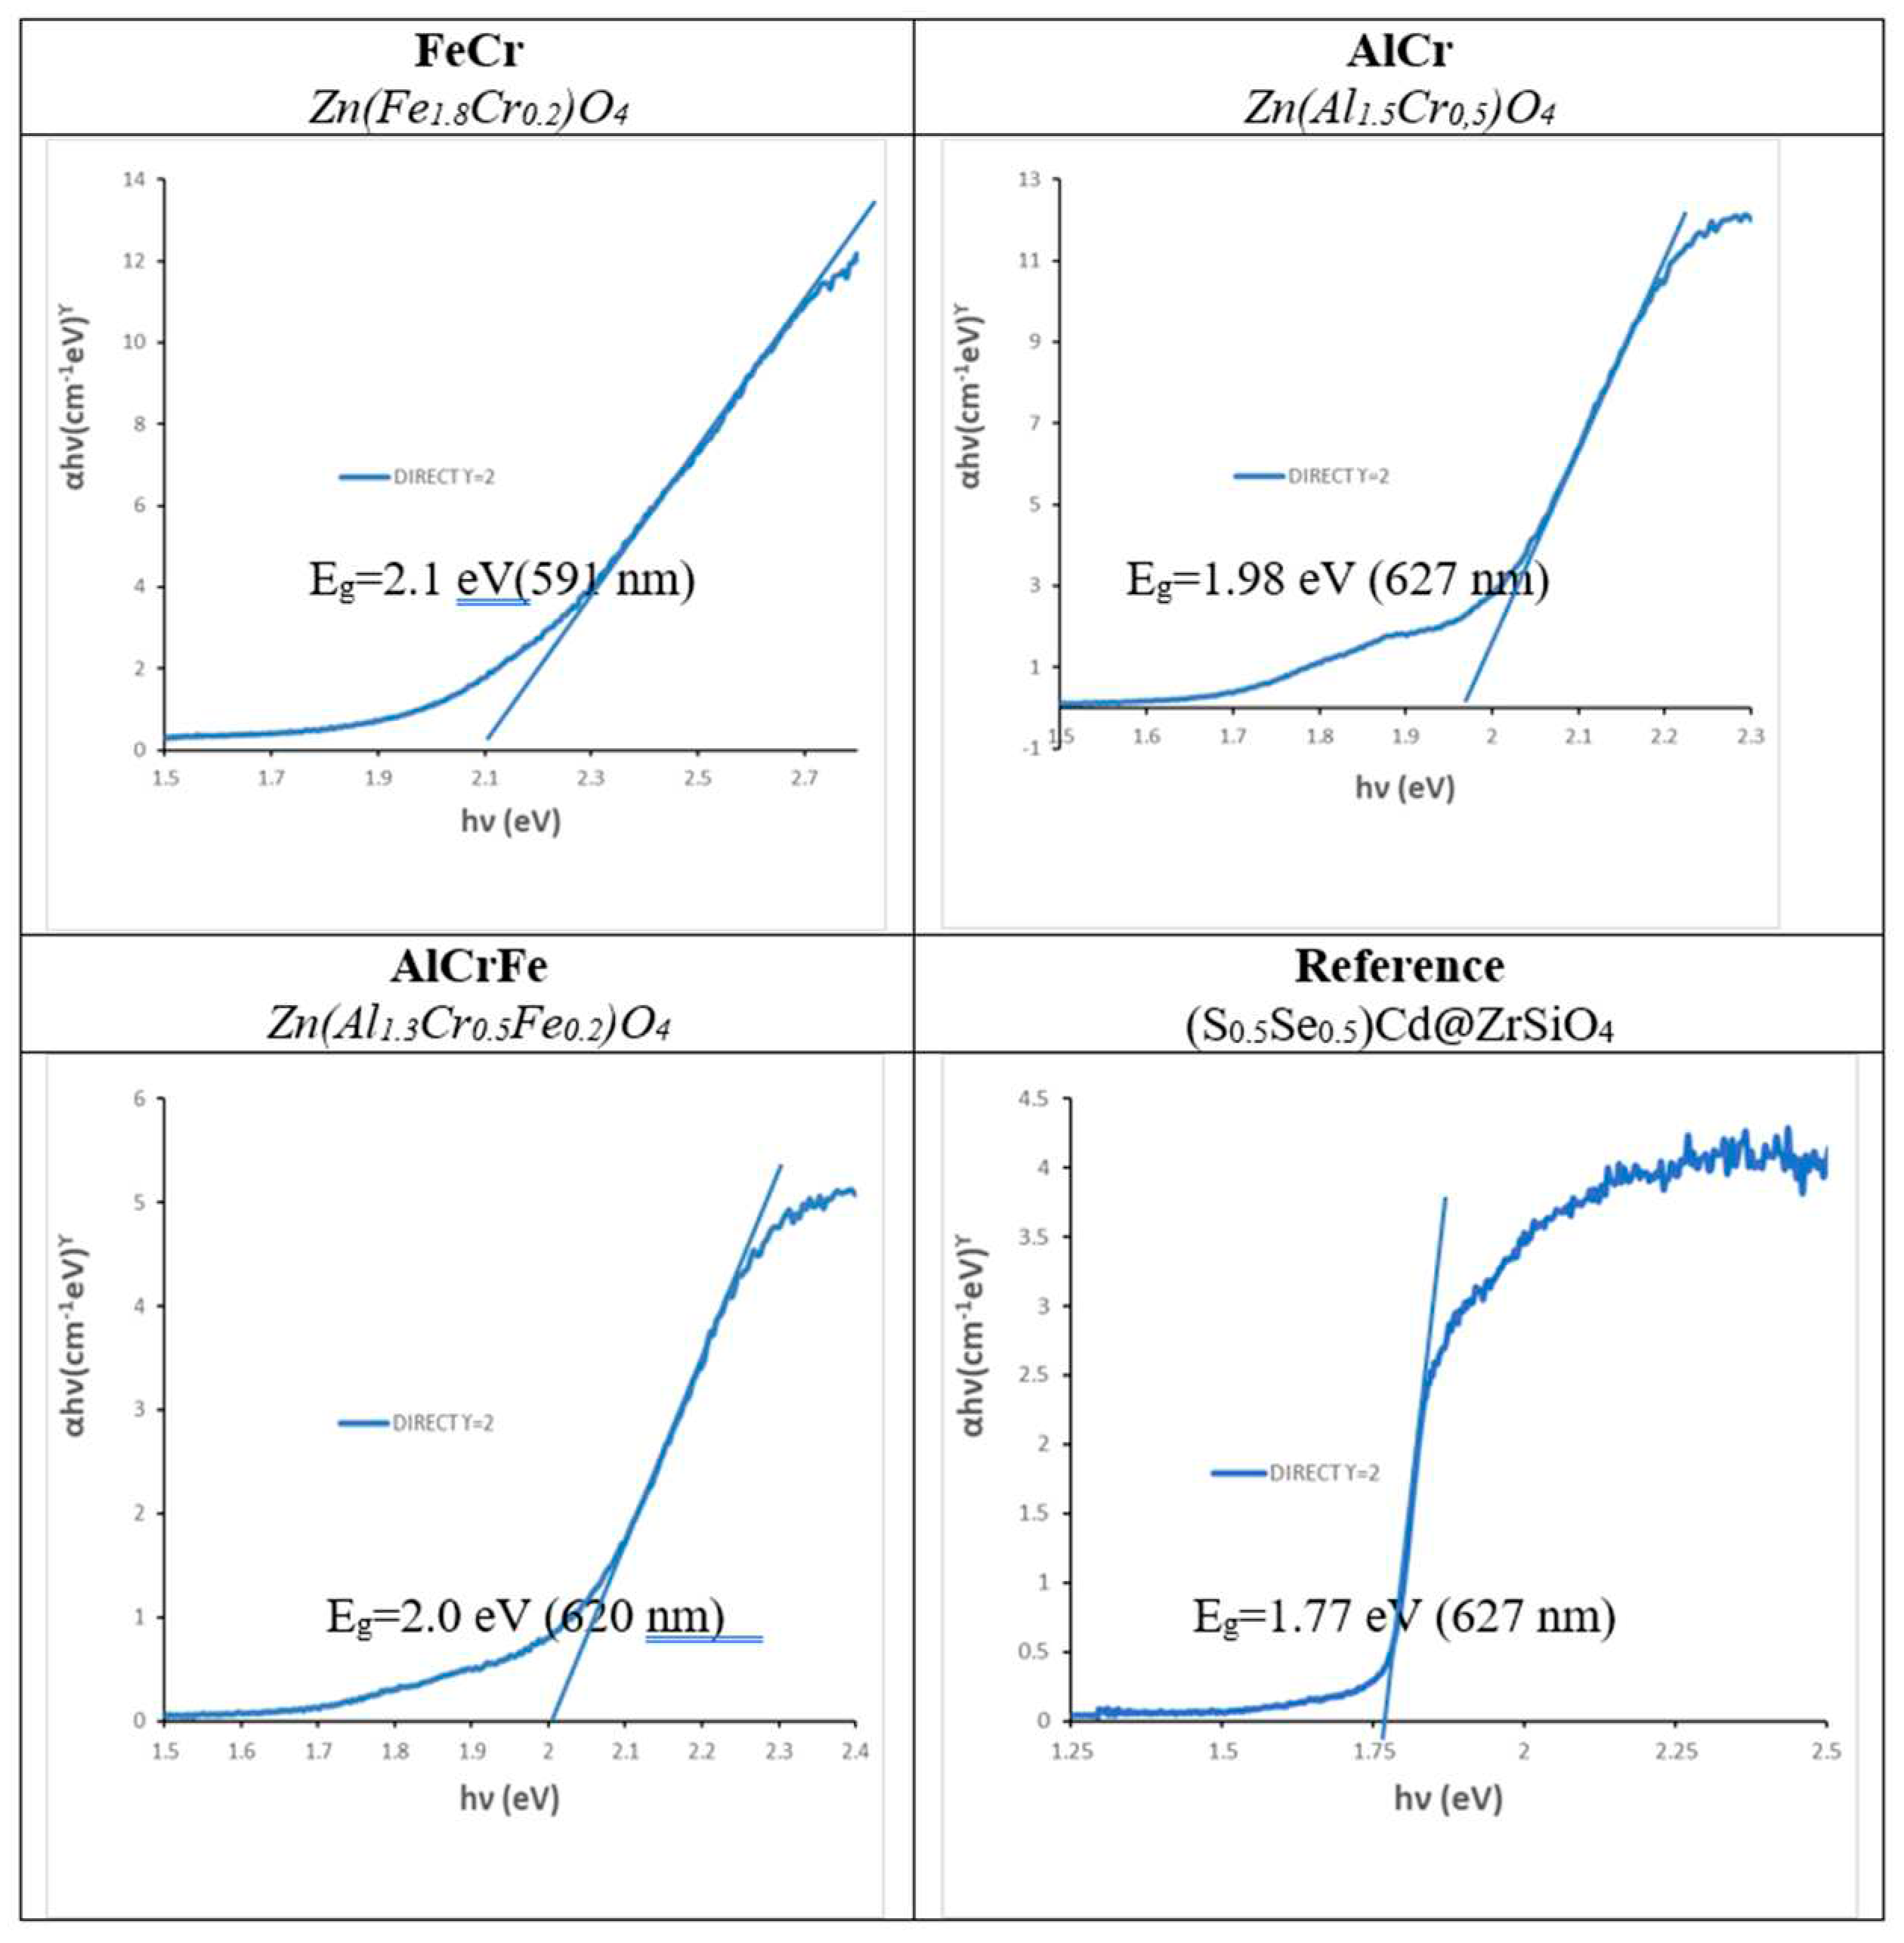
Figure 15.
Photodegradation test of Orange II with the optimized powders (image of reactor enclosed).
Figure 15.
Photodegradation test of Orange II with the optimized powders (image of reactor enclosed).
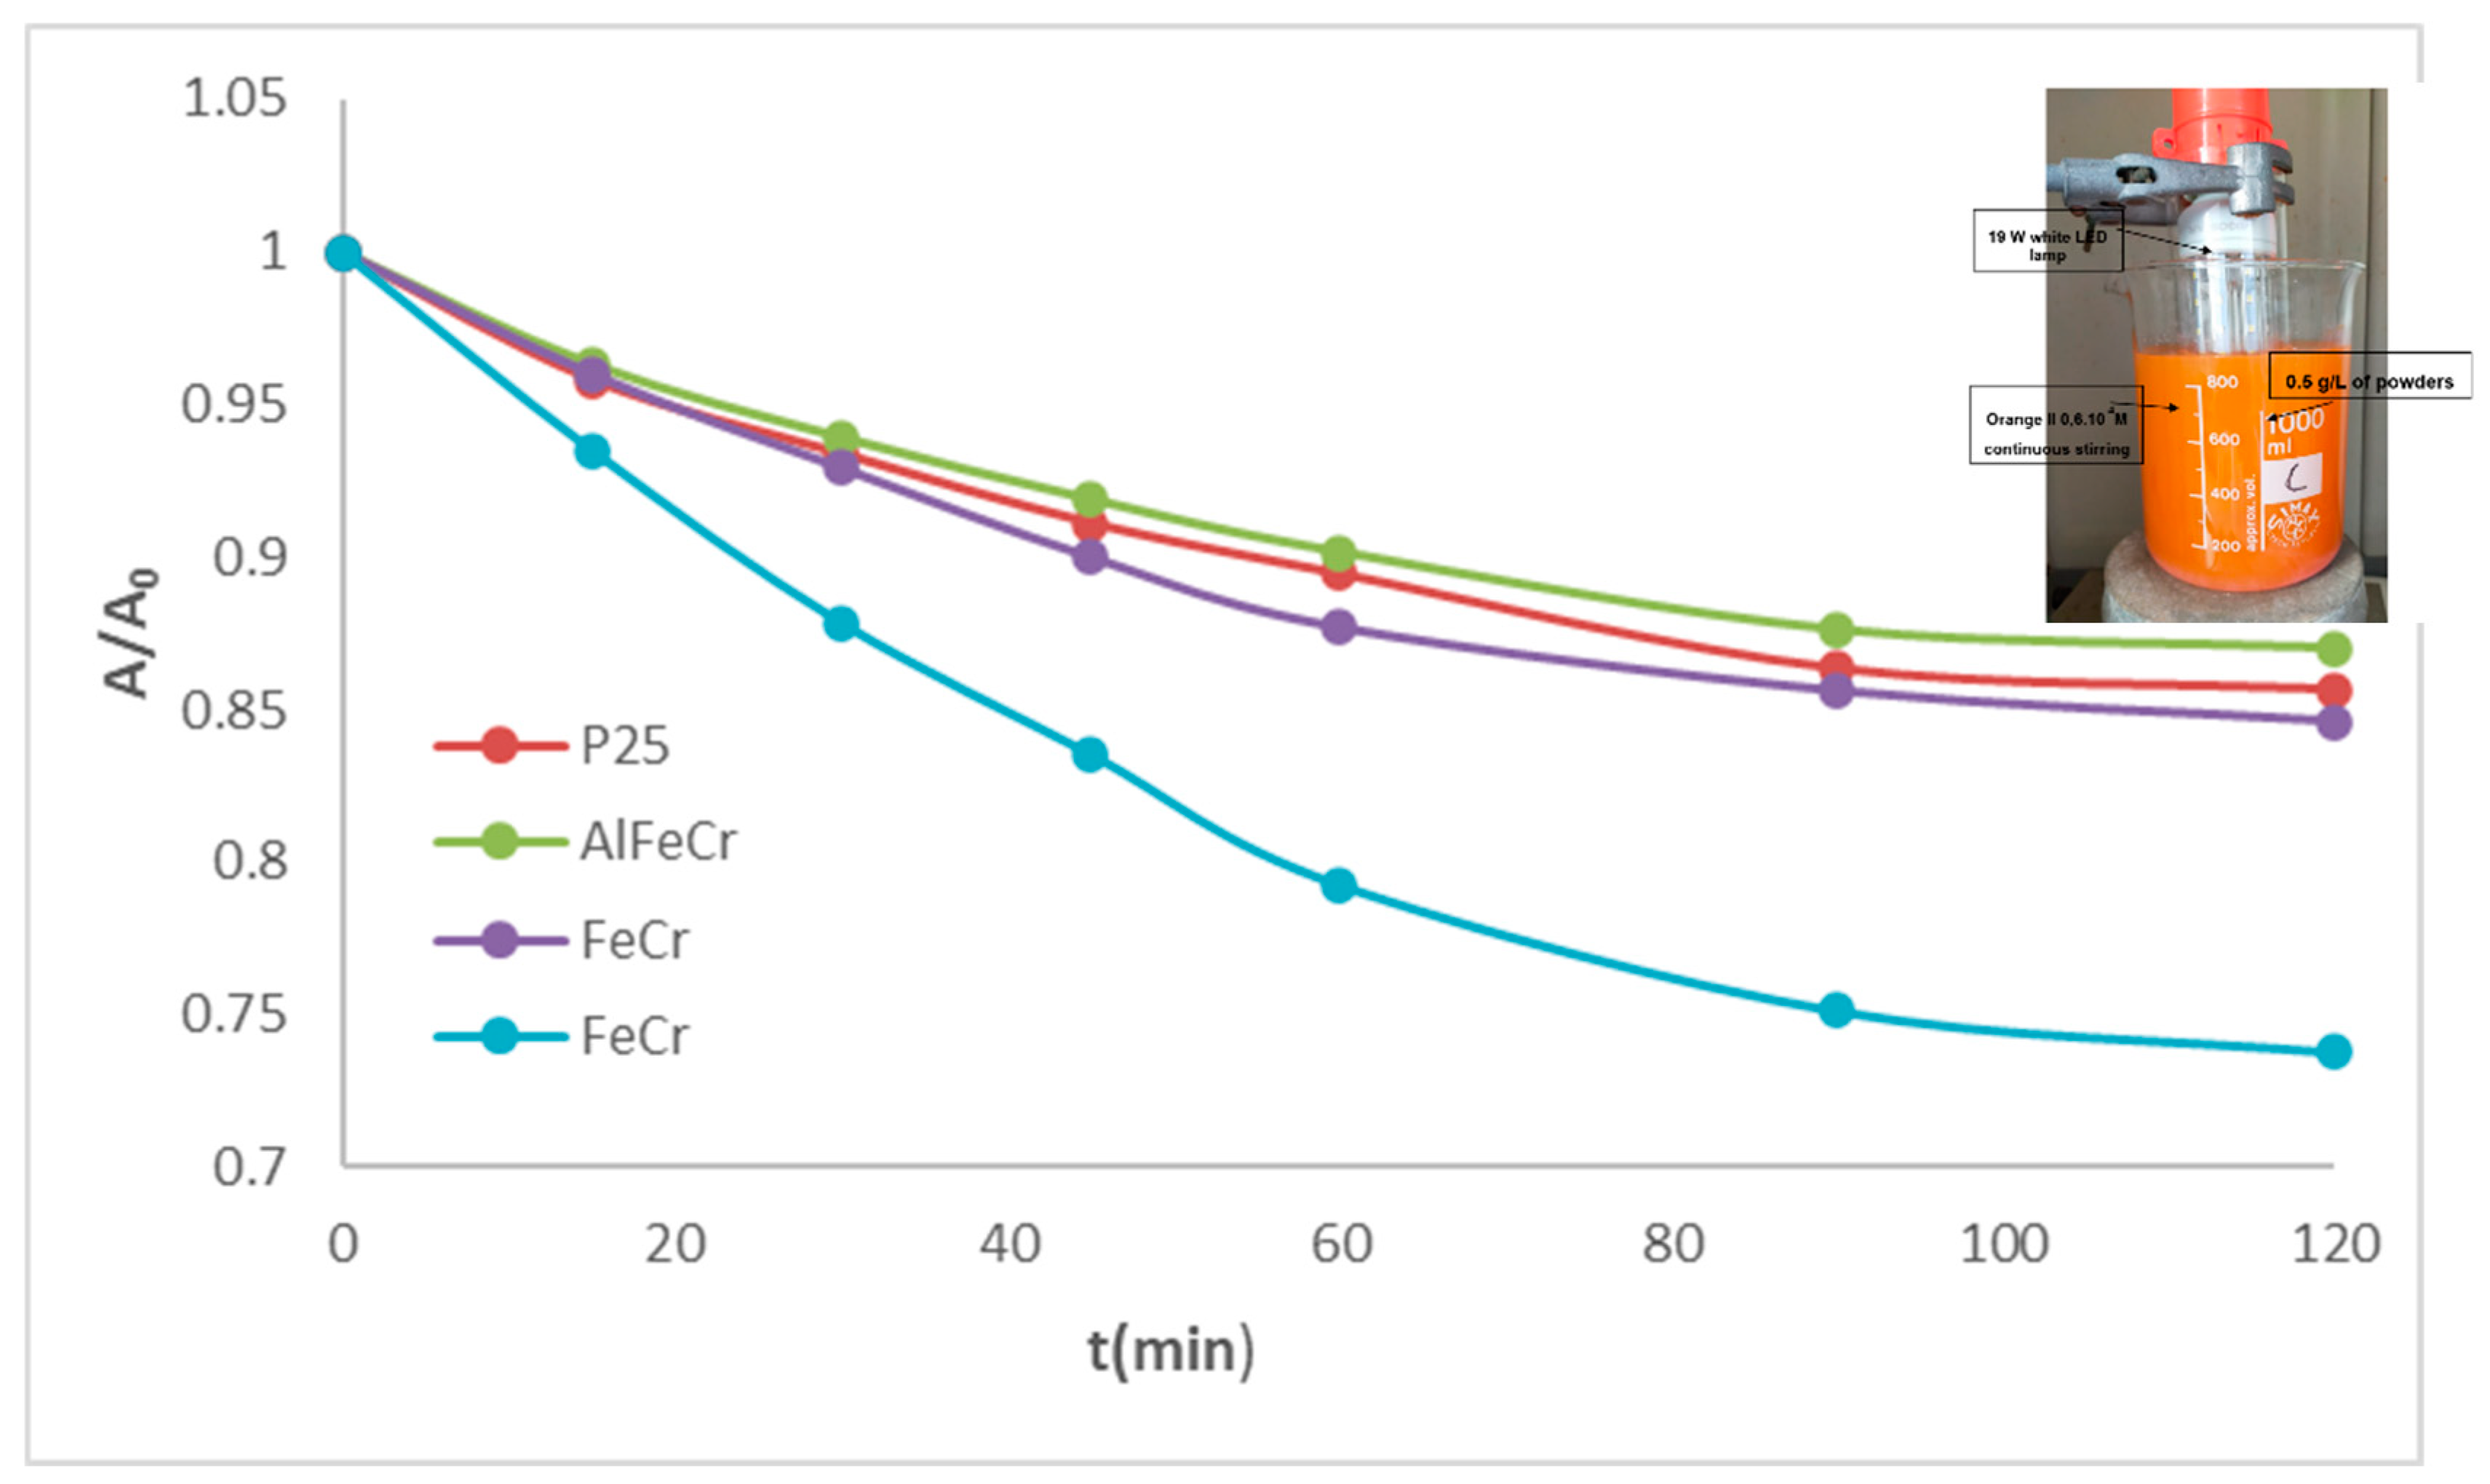

Table 1.
Photodegradation parameters of the test over Orange II of the optimized powders with visible light.
Table 1.
Photodegradation parameters of the test over Orange II of the optimized powders with visible light.
| Eg(eV) | t1/2(min) | R2 | |
| P25 | 3.15 | 408 | 0.9871 |
| Zn(Fe1.8Cr0.2) | 2.10 | 213 | 0.8341 |
| Zn(Al1.5Cr0.5) | 1.98 | 346 | 0.9679 |
| Zn(Al1.3Cr0.5Fe0.2)O4 | 2.00 | 433 | 0.8177 |
| ((S0.5Se0.5)Cd@ZrSiO4 | 1.77 | 267 | 0.9870 |
Disclaimer/Publisher’s Note: The statements, opinions and data contained in all publications are solely those of the individual author(s) and contributor(s) and not of MDPI and/or the editor(s). MDPI and/or the editor(s) disclaim responsibility for any injury to people or property resulting from any ideas, methods, instructions or products referred to in the content. |
© 2023 by the authors. Licensee MDPI, Basel, Switzerland. This article is an open access article distributed under the terms and conditions of the Creative Commons Attribution (CC BY) license (http://creativecommons.org/licenses/by/4.0/).
Copyright: This open access article is published under a Creative Commons CC BY 4.0 license, which permit the free download, distribution, and reuse, provided that the author and preprint are cited in any reuse.


