
Submitted:
11 December 2023
Posted:
12 December 2023
You are already at the latest version
Abstract
The pressing process and density profile of particleboards produced with addition of waste wood containing phenol-formaldehyde (PF) resin was presented. The particles were melamine-urea-phenol-formaldehyde (MUPF) resinated. Recovered particles were obtained from post-industrial waste plywood. The press closing time recorded during the pressing of mats containing only recovered particles in the core layer (100%), at a unit pressure of 3 MPa, in which the face layer rate was 50%, resin load for face and core layer was 12% and 10% was shorter by 29% than for the industrial particle mats. Regardless of the level of variability of independent factors the overheating time of mats to a temperature of 100 °C, containing recovered particles was 10% - 20% shorter than the time of overheating mats with industrial particles. The greatest impact (52%) on maximum density of the face layer of particleboards was demonstrated by the content of the recovered particles and the resin load (32%). The maximum density area of the face layer was located closer to the surface in particleboards produced with a higher (80%, 100%) content of the recovered particles, a higher (i.e. 12% and 10%, respectively, for face and core layer) resin load, a lower (35%) face layer rate and a higher (3 MPa ) unit pressure.
Keywords:
density profile
; particleboard
; pressing
; recovered particles
; recycling
; resin
1. Introduction
The generation of various types of waste is an inseparable phenomenon that accompanies the woodworking process. According to the waste hierarchy indicated in the Directive 2008/98/EC of the European Parliament and of the Council of 19 November 2008 on waste and repealing certain Directives [1] in the field of waste management, firstly, it is necessary to prevent generation of waste, then prepare for reuse, recycle, and only at the end implement other recovery methods, i.e. energy recovery or disposal. It should be noted that energy recovery and the reprocessing into materials that are to be used as fuels or for backfilling operations, collecting waste in landfills is not a form of recycling.
There are a number of factors distinguishing a given type of board from the group of wood materials. An important parameter in relation to particleboards is the resin load or, in relation to layered materials, the glue rate. In the case of particleboards, the resin load is 8 - 10%, while in the case of medium density fibreboard (MDF) 8 - 12% [2]. Amino resins (i.e. urea-formaldehyde (UF) resin, melamine-urea-formaldehyde (MUF) resin are usually used for the production of particleboard and MDF. From group of layered materials in most European countries are produced and used plywood, while in Scandinavian countries, Canada and the United States laminated veneer lumber (LVL). Depending on the purpose, plywood is made on the basis of UF or PF resin, LVL mainly using PF and melamine-formaldehyde (MF) resins. The glue rate used in the production of plywood is in the range of 160 - 200 g × m-2, and in the production of LVL 220 - 250 g × m-2 [3,4]. With the indicated application of the glue 160 - 200 g × m-2, its consumption is 110 - 140 kg × m- 3, of which 70 - 90 kg × m-3 is resin, and the rest other chemical agents (i.e. filler, hardener). Calculated on the weight of completely dry wood, the dry weight of the resin is 12 - 15% [5]. The fact that layered materials contain the most resin, e.g. UF, is reflected in the nitrogen content in the interior plywood waste [6].
Amino and phenolic synthetic resins are not classified as hazardous agents. Only the formaldehyde formed during the decomposition, mainly of UF resins, is classified as a category 3 carcinogen, i.e. a substance with a possible carcinogenic effect on humans, as there is limited evidence of such an impact [7]. On this basis, the permissible content of formaldehyde in the boards or its emission from the boards was determined [8]. Currently, wood materials are produced in the formaldehyde emission class (hygienic class) E1; E0.5 or higher Super E0. Therefore, wood waste, both industrial and as well as post-consumer products containing synthetic resins, do not belong to hazardous materials and can be subjected to various forms of recovery.
Knowledge about the possibility of managing wood waste, in particular "contaminated" with synthetic resins in the production of wood materials, is incomplete [9,10,11,12,13,14,15]. There is a lack of data on the pressing process of mats containing recovered particles “contaminated” with resin and the characteristics of the density profile of the particleboards. The pressing operation is the most important stage of the particleboard production process. It determines the physical and mechanical properties of the particleboards [5,16,17]. During the pressing process, 5 phases of temperature changes inside the mat can be distinguished [18,19]: I - heat transfer from the press heating plates to the core of the mat (no temperature increase); II - heating the core layer of the mat until the water begins to evaporate (rapid temperature increase); III - evaporation of water until the boiling point of water inside the mat is reached (slow temperature increase); IV - steam escape from the mat (constant temperature); V - further heating caused by heat conduction through the particles (very slow temperature increase). In the process of pressing particleboards, the heating of the mat usually ends in phase IV. Taking into account changes in the pressing pressure course, the following phases can be distinguished [5,20]: I - closing the press, II - pressure increase (pressing the mat to the required thickness), III - maintaining the maximum pressure, IV - pressure reduction , V - unloading the mat (pressure reduction to zero), VI - opening the press.
It is generally assumed that the course of the mat pressing operation has a significant impact on the density distribution on the cross-section of the particleboards and, consequently, on their properties [21,22,23]. In the literature on the subject, the most frequently analyzed parameters of the density profile are the maximum density of the face layer, minimum density of the core layer, the distance between the maximum density area of the face layer and the particleboard surface [21,22,24]. In industrial conditions, an important indicator defining the "correct" density profile is the ratio of the minimum density of the core layer to the medium density of the particleboard. It is generally assumed that it should not be less than 85%. The relationships between the course of the pressing operation and the density profile of the particleboards constitute the basis for the analysis of phenomena shaping the physical and mechanical properties of particleboards [5,25,26]. The problem of using recycled particles in the production of particleboards is rarely analyzed. The research conducted by Laskowska and Mamiński [5] shows that the PF-covered particles to be poorly bondable material in comparison to the UF-covered ones in UF-bonded particleboards. Therefore, there is a need to verify the possibility of using this type of waste in the production of MUPF-bonded particleboards in order to determine their suitability for particleboard production. There is a lack of data on the characteristics of the pressing process and mats containing recycled particles. For this reason, the aim of the research was to analyze the pressing process and selected properties of mats containing recovered particles.
2. Materials and Methods
2.1. Waste Wood with Synthetic Resin
The subject of research was post-industrial waste wood containing synthetic resin. The waste PF-bonded pine (Pinus sylvestris L.) plywood were obtained from two plants in Poland. The material in the amount of 0.5 tonne was generated in the edging operations. The plywood specification was as follows: thickness 7 mm, 12 mm, 16 mm and 22 mm; density 660 kg × m-3; moisture content 6%. The plywood was composed of the odd number of veneers 1.4 mm, 1.8 mm, 2.2 mm or 2.5 mm thick. The industrial binder formulations contained about 30% solid additives i.e. rye flour. 1 m3 of plywood contained 75 kg of binder that made ca. 14% of dry wood weight.
2.2. Particles from Waste Plywood
Shredding of waste plywood was carried out in accordance with the methodology presented by Laskowska and Mamiński [14]. A wood shredder with 10 mm, 14 mm, 25 mm and 38 mm mesh screens and a constant knife-counter knife gap 2.21 mm was used. The particles obtained from a 14–mm mesh screen exhibited properties (fractional composition, dimensions, particle thickness distribution) closest to those found for the industrial virgin particles for core layer [14]. Therefore, this type of recovered particles was used in the study. The face and core layer industrial particles were obtained from a particleboard plant in Poland. Their fractional compositions were typical as for industrial applications and presented in study Laskowska and Mamiński [14].
2.3. Particleboards Preparation
Three-layer particleboards 16-mm thick with density 650 kg×m-3 were prepared. Particleboards were bonded with MUPF resin. The MUPF resin used for the tests, at the temperature of 20 °C ± 2 °C, was characterized by a viscosity of 390 mPa×s (100 rpm, spindle 64). Viscosity was determined using a Brookfield digital viscometer. The dry matter content of the MUPF resin was 65% according to EN 827:2005 [27]. The adhesive formulation was presented in Table 1.
The choice of a particular variant of the adhesive formulation was made on the basis of its gel time, which was set at 210 s - 220 s for the face layers and 110 s - 120 s for the core layer of the mat. The gel times of the resins for the mat were selected so as to enable the curing of the glue in the center of the mat within the specified pressing time, and at the same time prevent the glue from curing in the face layers before reaching the assumed board thickness. These conditions were met by the adhesive formulation given in Table 1.
The production of particleboards was carried out based on the Taguchi plan. Experiment plan for the production of particleboards was presented in Table 2. Conducting an experiment based on the assumptions of the adopted method allows for obtaining repeatable and reliable test results. Moreover, it is possible to predict, determine and define interactions between factors [28]. Regular analysis of variables, based on the Taguchi method, includes a number of stages. As part of this work, the impact of selected factors, the so-called independent factors from the technological and material group on the particleboards properties, interactions between the factors were characterized.
The face layer rate was set at 35% and 50%, which means, that the face/core layer rate was set at 17.5%/65% and 25%/50%. MUPF-resin load was 12% and 10%, respectively, for face and core layer or 10% and 8%, respectively, for face and core layer. The content of the recovered particles in the core layers was 20%, 60% or 100%. The boards made of industrial particles only were used as the reference. Then sixteen variants of the boards were produced. Nine particleboards of each variant were prepared. The parameters of the hot pressing mats were as follows: unit pressure was set at 2 MPa or 3 MPa, platen temperature 180 °C, time 300 s.
2.4. Particleboards Properties
2.4.1. Pressing Process Parameters
Mat core temperature, pressure and thickness were monitored in real time with accuracy ± 0.01 °C, ± 0.01 MPa and ± 0.01 mm, respectively. Temperature in the mat core was monitored by a Fe-CuNi thermocouple.
2.4.2. Density Profile
Particleboards density (MD) was determined according to EN 323:1993 [29]. The analysis of the particleboard density profile was based on four parameters: the maximum density of the face layer (DMaxFL), the distance between the maximum density area of the face layer and the particleboard surface (ADMaxFL), minimum density of the core layer (DMinCL), the ratio of the minimum density of the core layer to the medium density (DMinCL/MD).
The distribution of density over the thickness of the particleboard samples was determined using a laboratory device for measuring density profiles (Laboratory Density Analyzer DA-X) manufactured by GreCon Inc. (Tigard, OR, USA), which determines the density using X-rays. The tests were conducted on samples with a length and width of 50 mm × 50 mm, at a measurement speed of 0.05 mm × s-1. Density values were measured every 0.02 mm of the thickness of the particleboard samples.
2.5. Statistical Analysis
The statistical analysis of results was carried out with the use of the STATISTICA Version-13.3 software of StatSoft, Inc. (TIBCO Software Inc., Palo Alto, CA, USA). The analysis was based on the t-test or the ANOVA (Fischer's F-test), with a significance level (p) of 0.050. On the basis of the sum of squares (SS), the percentual impact (the so-called Factor Influence) of the analysed factors (i.e. content of the recovered particles, resin load, face layer rate, unit pressure) on the particleboards properties was calculated. The boards made of industrial particles only were used as the reference (control). The statistical analysis of the differences between the experimental grades and the reference was carried out at a significance level of 0.050.
3. Results
3.1. Influence of Selected Factors on Pressing of Mats Containing PF-Covered Particles
Changes in the values pressing pressure, temperature inside the mat and the thickness of the mat were shown in Figure 1. Due to the large group of tests (variants), it was divided into four subgroups that differ in the levels of independent factors. The markings in the legend and in the description of individual graphs refer to the sample number from the experimental design (Subsection 2.3, Table 2). The letter M was placed before the sample numbers as a symbol of the resin used to particleboards production.
Significant differences were found in the course of mat pressing depending on the level of independent factors. The greatest differentiation in the course of the pressing curves was observed in the phase III - maintaining the maximum pressure and in the phase IV - pressure reduction. As a result, different press closing times were obtained. Differences in the curves of pressure, mat core temperature and mat thickness were visible during the pressing of the mats bearing recovered particles and the industrial particle mats (red line in the figure of each analyzed subgroups). Out of the four subgroups of mats with recovered particles, the shortest press closing times were recorded during the pressing of mats at a unit pressure of 3 MPa, in which the face layer rate was 50%, MUPF-resin load for face and core layer was 12% and 10%, respectively (Figure 1a). In this subgroup, significant differences in press closing times were noted between the industrial particle mats (M_1) and the mats with recovered particles in the entire range of 20%, 60%, 100% (M_5, M_9, M_13, respectively). However, there were no such differences in the press closing times between the mats containing 20% (M_5) or 60% (M_9) of recovered particles and the mats containing 100% of recovered particles in the core layer (M_13). For example, for the industrial particle mats (M_1) the press closing time was 35 s, and for mats containing only recovered particles in the core layer (M_13) it was 25 s, i.e. it was shorter by 29%.
The longest press closing times were obtained during the mats pressing at a unit pressure of 2 MPa, in which the face layer rate was 50%, and the resin load for face and core layer was 10% and 8%, respectively (Figure 1c). Under these conditions, the press closing time for the industrial particle mats (M_3) was 80 s, and for the mats with recovered particles in the entire range of 20%, 60%, 100% (M_7, M_11, M_15) 72 s, 45 s, 45 s, respectively. This shows that an increase in the share of recovered particles resulted in a shortening of the press closing time by up to 40%.
Simultaneously with the changes in pressing pressure, changes in mat core temperature occurred. Taking into account the phenomenology reported by Graser [18] and Bolton et al. [19], the greatest differences between the temperature curves in the core of individual mats occurred in the phase II - heating of the layer in the mat core until the water began to evaporate.
The shortest mat heating time were obtained when pressing mats at a unit pressure of 3 MPa, in which the face layer rate was 50%, and resin load for face and core layer was 12% and 10%, respectively (Figure 1a). For this subgroup of mats, the shortest press closing times were also obtained. The time of heating the industrial particle mats (M_1) to a temperature of 100 °C was 150 s, and the mats with 20% (M_5), 60% (M_9) and 100% (M_13) of recovered particles were shorter by 10%, 20% and 20% respectively.
In the remaining subgroups (Figure 1b, 1c, 1d), the time of heating the industrial particle mats to a temperature of 100 °C, similarly to the subgroup shown in Figure 1a, was approximately 150 s. However, the time of heating the mats in these subgroups, regardless of the content of the recovered particles (20% - 100%), was approximately 10% shorter than the time of heating the industrial particle mats.
The conducted research shows that the course of the mat pressing depended mainly on the level of the unit pressure and the content of the recovered particles. As a result of the greater pressure exerted on the pressed mat, it thickened faster. In the mats pressed at a higher (3 MPa) unit pressure, the water vapor generated moved to the core faster than in the mats pressed at a lower (2 MPa) pressure. The increase in the content of the recovered particles in the core layer of mats favored these phenomena. Due to the different dimensions and higher bulk density of recovered particles compared to industrial particles [14], the core layer of these mats was characterized by a larger amount of free spaces. Thanks to this, water vapor as an energy carrier had "easier" access to the center of the mat [19,30,31,32,33]. This resulted in shorter times for overheating the mats and shorter times for achieving the assumed particlebord thickness. Additionally, the dynamics of overheating of the mats could have been influenced by a higher (i.e. 12% and 10%, respectively, for face and core layer) resin load. Then, the particles in the mat had higher moisture content, which resulted in a larger amount of water vapor generated during the pressing operation and a faster heat transfer to the center of the mat [5,31,34]. In general, it can be stated that regardless of the level of variability of independent factors, i.e. resin load, face layer rate, unit pressure, the overheating time of mats containing recovered particles was 10 - 20% shorter than the time of overheating mats with industrial particles. It can also be generally assumed that regardless of the level of variability of factors, i.e. content of the recovered particles, resin load, face layer rate, the assumed thickness of particleboards manufactured at a pressure of 3 MPa was achieved in a time twice as short as in the case of particleboards manufactured at a pressure 2 MPa.
3.2. Influence of Selected Factors on the Density Profile of Particleboards
The medium density (MD) of particleboards (all variants) was 655 kg × m-3. The obtained values were close to the board density of 650 kg × m-3 assumed in the tests. The medium density of individual particleboard variants was in the range of 652 - 659 kg × m- 3. The differences between the density of particleboards produced in different variants did not exceed 2%. Therefore, changes in the density of the particleboards should not affect their properties and boards of different variants can be compared with each other.
The analysis of the density profile of boards made with MUPF resin are presented in Table 3. The conducted research shows that the density of individual layers of particleboards varied significantly depending on the level of variability of the factors examined.
The maximum density of the face layer (DMaxFL) of particleboards was in the range of 860 - 926 kg × m-3 (average 902 kg × m-3), with the lowest value recorded in variant 15 and the highest in variant 2 (Table 3). The area of maximum density of the face layers (ADMaxFL) was located on average at a distance 0.87 mm from their surface. The smallest distance (0.59 mm) was obtained by particleboards of variants 9 and 13, and the largest (1.28 mm) by variant 3. Minimum density of the core layer (DMinCL) was in the range of 519 - 564 kg × m-3 (average 538 kg × m-3). The lowest DMinCL value was for variant 3, the highest for variant 16. DMinCL accounted for 83% of the MD of particleboards. The data in Table 3 show that only for particleboards made in variants 14 and 16 DMinCL/MD was higher than the required 85%.
Examples of density profiles of particleboards were shown in Figure 2. The group of particleboards was divided into four subgroups differing in the levels of analyzed factors. The numbers in the legend of individual graphs refer to the sample number from the experimental plan (Subsection 2.3, Table 2). The letter M was placed before the sample numbers as a symbol of the resin used to particleboards production.
The density distribution on the cross-section of the particleboards have the shape of the letter "U" (Figure 2). The "borders" between the area of the face layers and the area of the core layer were clearly outlined. The diversity of the density distribution on the cross-section of the particleboards was greater, the higher the particles moisture, and thus the shorter the time of overheating and compression the mat to the assumed thickness. With more MUPF resin (higher resin load i.e. 12% and 10%, respectively, for face and core layer), greater amounts of water were introduced. The particles in the mat had higher moisture content, which resulted in a larger amount of water vapor generated during the pressing operation and faster heat transfer to the center of the mat [31,34,35].
The research shows that the density of individual layers (face and core) of the boards was influenced by independent factors and their level. The results of the analysis of variance for selected factors and interactions between factors influencing DMaxFL, ADMaxFL, DMinCL of particleboards are presented in Table 4.
The greatest impact (52%) on DMaxFL of particleboards was demonstrated by the content of the recovered particles. The second most important factor influencing the DMaxFL was the resin load (32%). It should be noted that the indicated factors were responsible for approximately 80% of the variability of DMaxFL. The influence of the studied factors on DMaxFL of particleboards was shown in Figure 3.
In the Figure 3a was presented that an increase in the content of the recovered particles resulted in lower DMaxFL values of the particleboards. The significant effect of the content of the recovered particles on the DMaxFL resulted mainly from the fact that recovered particles were characterized by a higher bulk density compared to industrial particles. These differences were amounted to about 100 kg × m-3 (58%) and were statistically significant [14]. Depending on the content of the recovered particles in the core layer, the formed mats were 10 - 20 mm less thick compared to the mats of industrial particles (control variant). The temperature of 100 °C was reached faster inside the mats containing the recovered particles than in the mats containing industrial particles. This was due to the larger amount of free spaces between the recovered particles in the mats. Thanks to this, water vapor, as a carrier of thermal energy, moved deeper into the mat faster and its core layer was heated faster [30,34]. As a result, the recovered particles "plasticized" faster than industrial particles. Therefore, these particles provided less resistance to the face layers of the particleboards than industrial particles, which resulted in lower DMaxFL. The DMaxFL of particleboards made of industrial particles was 910 kg × m-3, and of particleboards in which recovered particles accounted for 100% was 877 kg × m-3 (a decrease of 4%).
The conducted research shows that the factor significantly influencing the DMaxFL of the particleboards was the resin load (Figure 3b). The DMaxFL of particleboards containing larger amounts of MUPF resin (i.e. 12% and 10%, respectively, for face and core layer) was higher by 3% compared to the DMaxFL of particleboards containing smaller amounts of resin (i.e. 10% and 8%, respectively, for face and core layer). These relationships resulted from the fact that resins have a higher density than wood particles. Increasing the resin load in the particleboard was equivalent to reducing the amount of wood particles in the particleboard mass, and thus in the particle mass of individual particleboard layers. As a result, higher DMaxFL values were obtained in particleboards made of particles with a higher resin load.
From the group of analyzed independent factors, the content of the recovered particles had the greatest impact on the DMinCL. The influence of this factor was 45%. The factors - the face layer rate and the unit pressure had a similar impact on the DMinCL of the particleboards (19% and 15%, respectively). The data in Table 4 show that the conducted research failed to determine the causes of 18% of the DMinCL variability of particleboards. It should be assumed that there are other factors, apart from those examined, that significantly influence the DMinCL e.g. press shelf temperature, pressing time. The influence of factors on the DMinCL of particleboards was shown in Figure 3.
In the Figure 3a was shown that an increase in the content of the recovered particles in the particleboards resulted in a higher DMinCL. Similarly to the previously described DMaxFL relationships, these changes were caused by the higher bulk density of the recovered particles compared to industrial particles and the course of the mat pressing. The recovered particles with a higher density, partially compacted, were subject to "additional" compression during mat. The core layer of mats containing the recovered particles was heated faster, resulting in a greater degree of their compaction. As a result, the DMinCL of particleboards made with 100% of the recovered particles was 5% higher than the DMinCL of boards made from industrial particles.
The DMinCL of the particleboards was significantly influenced by the face layer rate (Figure 3c). The DMinCL of particleboards made with a 35% share of face layers was 3% higher compared to the DMinCL of particleboards made with a 50% share of face layers. A smaller (35%) share of face layers was equivalent to a larger (65%) share of the core layer of the particleboards. There were more the recovered particles in this core layer of the particleboards. These relationships confirm the observations formulated in the context of analyzing the impact of the content of the recovered particles on the DMinCL of particleboards.
It was shown that the particleboards were characterized by differences in DMinCL depending on the level of the unit pressure (Figure 3d). The DMinCL of particleboards made at a pressure of 3 MPa was 3% higher than the DMinCL of particleboards made at a pressure of 2 MPa. Depending on the level of unit pressure, the press closing time varied. At a higher (3 MPa) pressing pressure of the mats, the press closing time was shorter than at a lower (2 MPa) pressing pressure. During the shorter closing time of the press, the particles of the face layers were rapidly compacted. However, the particles of the core layer resisted the denser particles area of the face layers and, as a result, were less compressed. At a lower (2 MPa) pressing pressure of the mats, a longer press closing time was achieved, during which the mat was more uniformly overheated. As a result, the particles of the core layer were more susceptible to compaction and offered less resistance to the particles area of the face layers, which consequently resulted in a higher DMinCL of the particleboards.
The conducted research shows (Figure 4) that all analyzed factors had a significant impact on the ADMaxFL of particleboards. The unit pressure had the greatest impact (58%) on the ADMaxFL of the particleboards (Table 4). The second most important factor influencing the ADMaxFL was the resin load (26%). The above-mentioned factors in total were responsible for approximately 80% of the variability of this value. In relation to ADMaxFL, the following interactions were also statistically significant: content of the recovered particles x resin load and content of the recovered particles x face layer rate (p < 0.050).
The increase in the amount of the recovered particles in the core layer of the particleboards had a positive effect on ADMaxFL (Figure 4a). Literature data show that the greatest loads in a three-layer particleboard are carried by the face layers, and the closer to the surface of the particleboard, the greater its ability to bear loads [36]. The ADMaxFL of particleboards containing 20%, 60%, 100% of recovered particles in the core layer was 4%, 13%, 10% lower, respectively, compared to the ADMaxFL of particleboards made of industrial particles. As in the case of DMaxFL, the presented dependencies resulted from the course of the mat pressing operation. The more recovered particles were in the core layer, the less thick the mats were. In mats of smaller thickness, the densification of the face layers occurred faster than in mats of greater thickness, in which the particles of the core layer provided greater resistance to the particles of the face layers. As a result of the occurring phenomena, ADMaxFL was located closer to the surface in boards produced with a higher content of the recovered particles.
In Figure 4b was shown that in particleboards containing larger amounts of MUPF resin (i.e. 12% and 10%, respectively, for face and core layer), ADMaxFL was approximately 20% lower than in particleboards made with a smaller amount of resin (i.e. 10% and 8%, respectively, for face and core layer). In particleboards with a higher resin load, a larger surface of adhesive joints was created, and thus a more "compact" particle zone of the face layer. The zone of these particles offered greater resistance to the pressure exerted on the pressed mat than the zone of particles covered with a smaller amount of resin. This resulted in the formation of a larger DMaxFL moved closer to the particleboard surface.
The difference in the ADMaxFL value of the particleboards was also influenced by the face layer rate (Figure 4c). In particleboards with 50% face layers, ADMaxFL was 16% higher than in particleboards with 35% face layers. The significant impact of the share of face layers on ADMaxFL resulted from the thickness they occupied in the mat. In mats with a larger (50%) share of face layers, there were fewer (50%) particles in the core layer compared to mats with a smaller (35%) share of face layers (share in the core layer 65%). As a result, the particles of the core layer offered less resistance to the particles of the face layers, which resulted in a more uniform density of the particles of the face layers and the formation of a zone of maximum density of the face layers moved further from the particleboard surface.
The conducted research showed that the particleboards were characterized by differences in ADMaxFL depending on the level of the unit pressure (Figure 4d). Increasing the pressure during pressing the mats resulted in a lower ADMaxFL. In particleboards manufactured at 3 MPa, ADMaxFL was 29% lower than in particleboards manufactured at 2 MPa. These dependencies were the result of the course of the operation of pressing the mats and the resulting press closing time [5,19,37,38]. As a result of the greater pressure (3 MPa) exerted on the pressed mat, the face layers rapidly thickened, resulting in lower ADMaxFL. However, at lower pressing pressure (2 MPa), longer press closing times were achieved, which is equivalent to a longer time to obtain the assumed particleboard thickness. At lower pressure, during a longer closing time of the press, the entire mat gradually overheated, and thus the individual layers of particles became more evenly compacted. As a result, ADMaxFL in particleboards produced at a lower (2 MPa) pressing pressure was located further from the particleboard surface than in particleboards produced at a higher (3 MPa) pressing pressure. In the case of ADMaxFL, interactions: content of the recovered particles × resin load for face and core layer and content of the recovered particles × face layer rate were significant. However, these interactions showed differences only between ADMaxFL industrial particleboards. It should be assumed that the properties of recovered particles, i.e. higher bulk density, lower specific surface area than industrial particles, resulted in the "extinction" of the interactions in the case of ADMaxFL produced particleboards.
In general, it can be concluded that ADMaxFL was located closer to the surface in particleboards produced with a higher (80%, 100%) content of the recovered particles, a higher (i.e. 12% and 10%, respectively, for face and core layer) resin load, a lower (35%) face layer rate and a higher (3 MPa ) unit pressure.
4. Conclusions
The shortest press closing times were recorded during the pressing of mats at a unit pressure of 3 MPa, in which the face layer rate was 50%, resin load for face and core layer was 12% and 10%, respectively. For the industrial particle mats the press closing time was 35 s, and for mats containing only recovered particles in the core layer it was 25 s, i.e. it was shorter by 29%. Regardless of the level of variability of independent factors, i.e. resin load, face layer rate, unit pressure, the overheating time of mats containing recovered particles was 10% - 20% shorter than the time of overheating mats with industrial particles. The assumed thickness of particleboards manufactured at a pressure of 3 MPa was achieved in a time twice as short as in the case of particleboards manufactured at a pressure 2 MPa.
The greatest impact (52%) on the maximum density of the face layer of particleboards was demonstrated by the content of the recovered particles and resin load (32%). The influence of the content of the recovered particles on the minimum density of the core layer was on the level of 45%. The factors - the face layer rate and the unit pressure had a similar impact on the minimum density of the core layer of the particleboards (19% and 15%, respectively). All analyzed factors had a significant impact on the distance between the maximum density area of the face layer and the particleboard surface of particleboards. The unit pressure (factor influence 58%) and the resin load (factor influence 26%) in total were responsible for approximately 80% of the variability of this density parameter value.
Author Contributions
Conceptualization, A.L.; methodology, A.L.; formal analysis, A.L.; investigation, A.L.; resources, A.L.; data curation, A.L.; writing—original draft preparation, A.L.; writing—review and editing, A.L.; visualization, A.L.; supervision, A.L.; project administration, A.L.; funding acquisition, A.L.
Funding
Institute of Wood Sciences and Furniture, Warsaw University of Life Sciences—SGGW.
Institutional Review Board Statement
Not applicable.
Informed Consent Statement
Not applicable.
Data Availability Statement
The data presented in this study are available on request from the corresponding author.
Conflicts of Interest
The authors declare no conflict of interest.
References
- Directive 2008/98/EC of the European Parliament and of the Council of 19 November 2008 on waste and repealing certain Directives, OJ L 312, 22.11.2008.
- Deppe, H. - J.; Ernst K. MDF - Mitteldichte Faserplatten. DRW - Verlag Weinbrenner GmbH & Co., Leinfelden – Echterdingen, Germany, 1996.
- Baldwin, R.F. Plywood and veneer - based products: manufacturing practices. Miller Freeman Books, San Francisco, United States, 1995.
- Nicewicz, D.; Borysiuk, P.; Starecki, A. Ćwiczenia z technologii tworzyw drzewnych [Exercises in wood-based materials technology]. WULS- SGGW, Warsaw, Poland, 2009.
- Laskowska, A.; Mamiński, M. Properties of particleboard produced from post-industrial UF- and PF-bonded plywood. European Journal of Wood and Wood Products 2018, 76, 427–435. [Google Scholar] [CrossRef]
- Wróblewska, H.; Czajka, M. The influence of compost obtained from composite wood waste and post - used wood on plant growth. 3rd European COST E31 Conference: Management of Recovered Wood. May 2 – 4, 2007, Klagenfurt, Austria, Proceedings, 293 - 307.
- Regulation of the European Parliament and of the Council (EC) No. 1272/2008 of 16 December 2008, OJ L 353, 31.12.2008.
- EN 13986:2004+A1:2015. Wood-based panels for use in construction - Characteristics, evaluation of conformity and marking; European Committee for Standardization, Brussels, Belgium.
- Andrade, P.I.; Araújo, S. de O.; Neiva, D.M.; Vital, B.R.; Oliveira Carneiro, A. de C.; Gominho, J.; Pereira, H. Strength properties and dimensional stability of particleboards with different proportions of thermally treated recycled pine particles. Holzforschung 2016, 70 (5), 467 - 474, DOI: 10.1515/hf-2015-0090. [CrossRef]
- Czarnecki, R.; Dziurka, D.; Łęcka, J. The use of recycled boards as the substitute for particles in the centre layer of particleboards. Electronic Journal of Polish Agricultural Universities (EJPAU) 2003, 6(2):#01, http://www.ejpau.media.pl/volume6/issue2/wood/art-01.html, [Accessed on 6 December 2023].
- Demirkir, C.; Çolakoğlu, G. Formaldehyde emission from particleboards manufactured with waste materials from plywood industry. Holz als Roh- und Werkstoff 2007, 65 (6), 483 - 484. [CrossRef]
- Yang, T. - H.; Lin, Ch. - J.; Wang, S. - Y.; Tsai, M. - J. Characteristics of particleboard made from recycled wood-waste chips impregnated with phenol - formaldehyde resin. Building and Environment 2007, 42 (1), 189 - 195. [CrossRef]
- Kurowska, A.; Zbieć, M.; Borysiuk, P.; Kopecký, Z.; Rousek, M. Machineability of OSB boards manufactured with addition of fine fraction of waste particles. Wood machining and processing – product and tooling quality development/ed. by Górski J. and Zbieć M., WULS - SGGW Press, Warsaw, 2010, 91 – 109.
- Laskowska, A.; Mamiński, M. The properties of particles produced from waste plywood by shredding in a single-shaft shredder. Maderas. Ciencia y tecnología 2020, 22 (2), 197 - 204. [CrossRef]
- Lee, S.H.; Lum, W. Ch.; Boon, J. G.; Kristak, L.; Antov, P.; Pędzik, M.; Rogoziński, T.; Taghiyari, H. R.; Lubis, M. A. R.; Fatriasari, W.; Yadav, S. M.; Chotikhun, A.; Pizzi, A. Particleboard from agricultural biomass and recycled wood waste: a review. Journal of Materials Research and Technology 2022, 20, 4630–4658. [Google Scholar] [CrossRef]
- Wong, E.D.; Zhang, M.; Wang, Q.; Kawai, S. Effects of mat moisture content and press closing speed on the formation of density profile and properties of particleboard. Journal of Wood Science 1998, 44, 287–295. [Google Scholar] [CrossRef]
- Benthien, J.T.; Ohlmeyer, M.; Schneider, M.; Stehle, T. Experimental Determination of the Compression Resistance of Differently Shaped Wood Particles as Influencing Parameter on Wood-Reduced Particleboard Manufacturing. European Journal of Wood and Wood Products 2018, 76, 937–945. [Google Scholar] [CrossRef]
- Graser, M. Temperaturverlauf in industriell gefertigten Spanplatten während des Preßvorgangs, festgestellt durch Meßsonden [Thermocouple-monitored temperature distribution in particleboards manufactured under industrial pressing conditions]. Holz Zentralblatt 1962, 88 (137), 6 - 8 (Beilage 4).
- Bolton, A.J.; Humphrey, P.E.; Kavvouras, P.K. The hot pressing of dry - formed wood - based composites. Part III. Predicted vapour pressure and temperature variation with time, compared with experimental data for laboratory boards. Holzforschung 1989, 43(4), 265 – 274. [CrossRef]
- Kehr, E.; Schölzel, S. Untersuchungen über das Pressdiagramm zur Herstellung von Spanplatten [Studies on the press diagram for the production of particleboard]. Drevársky Výskum 1965, 3, 133–181. [Google Scholar]
- Suzuki, S.; Miyamoto, K. Effect of manufacturing parameters on the linear expansion and density profile of particleboard. Journal of Wood Science 1998, 44 (6), 444 – 450. [CrossRef]
- Wong, E. D.; Zhang, M.; Wang, Q.; Kawai, S. Formation of density profile and its effects on the properties of particleboard. Wood Science and Technology 1999, 33 (4), 327 - 340. [CrossRef]
- Cai, Z.; Wu, Q.; Lee, J.N.; Hiziroglu, S. Influence of board density, mat construction, and chip type on performance of particleboard made from eastern redcedar. Forest Products Journal 2004, 54 (12), 226 - 232.
- Gamage, N.; Setunge, S.; Jollands, M.; Hague, J. Properties of hardwood saw mill residue - based particleboards as affected by processing parameters. Industrial Crops and Products 2009, 29 (1), 248 - 254. [CrossRef]
- Murayama, K.; Kukita, K.; Kobori, H.; Kojima, Y.; Suzuki, S.; Miyamoto, K. Effect of Face-Layer Moisture Content and Face–Core–Face Ratio of Mats on the Temperature and Vapor Pressure Behavior during Hot-Pressing of Wood-Based Panel Manufacturing. Journal of Wood Science 2021, 67, 42. [Google Scholar] [CrossRef]
- Kawai, S.; Sasaki, H. Production technology for low-density particleboard I-Forming a density gradient and its effect on board properties. Mokuzai Gakkaishi, J. Jpn. Wood Res. Soc.
- EN 827:2005 Adhesives - Determination of conventional solids content and constant mass solids content; European Committee for Standardization, Brussels, Belgium.
- Morin F., Wandelt P. (1998) Statystyczna kontrola i regulacja procesów w przemyśle celulozowopapierniczym. Cz. 3. Przegląd Papierniczy, SIGMA NOT, Montreal – Łódź.
- EN 323 (1993) Wood-based panels—Determination of density. European Committee for Standardization, Brussels.
- Li, Y.; Dai, Z.; Hu, Ch.; Tu, D.; Yun, H. Optimisation of particle distribution and performance in three-layer tubular particleboards using response surface methodology. Journal of Building Engineering 2023, 108256. [Google Scholar] [CrossRef]
- Humphrey, P.E.; Bolton, A.J. The hot pressing of dry - formed wood - based composites. Part II. A simulation model for heat and moisture transfer, and typical results. Holzforschung 1989, 43 (3), 199 – 206.
- Hata, T.; Kawai, S.; Sasaki, H. Production of particleboard with steam-injection. Part 2: Computer simulation of temperature behavior in particle mat during hotpressing and steam-injection pressing. Wood Science and Technology 1990, 24 (1), 65 - 78.
- Thoemen, H.; Humphrey, P.E. Hot pressing of wooaHot pressing of wood - based composites: selected aspects of the physics investigated by means of simulation. In: Proceedings of the 5th European Panel Products Symposium, October 10 - 12, 2001, Llandudno Wales U.K., pp 38 – 49.
- Dukarska, D.; Rogozinski, T.; Antov, P.; Kristak, L.; Kmieciak, J. Characterisation of wood particles used in the particleboard production as a function of their moisture content. Materials 2022, 15(1), 48. [Google Scholar] [CrossRef] [PubMed]
- Cai, Z.; Muehl, J.H.; Winandy, J.E. Effects of panel density and mat moisture content on processing medium density fibreboard. Forest Products Journal 2006, 56, 20–25. [Google Scholar]
- Keylwerth, R. Zur Mechanik der mehrschichtigen Spanplatten [On the mechanics of multi-layer particleboard]. Holz als Roh- und Werkstoff 1958, 16 (11), 419 - 430.
- Rofii, M.N.; Yamamoto, N.; Ueda, S.; Kojima, Y.; Suzuki, S. The Temperature Behaviour inside the Mat of Wood-Based Panel during Hot Pressing under Various Manufacturing Conditions. Journal of Wood Science 2014, 60, 414–420. [Google Scholar] [CrossRef]
- Benthien, J.T.; Ohlmeyer, M. Effects of Flat-Shaped Face Layer Particles and Core Layer Particles of Intentionally Greater Thickness on the Properties of Wood-Reduced Particleboard. Fibers 2020, 8(7), 46. [Google Scholar] [CrossRef]
Figure 1.
Pressure, mat core temperature and mat thickness curves recorded in real-time upon pressing.
Figure 1.
Pressure, mat core temperature and mat thickness curves recorded in real-time upon pressing.
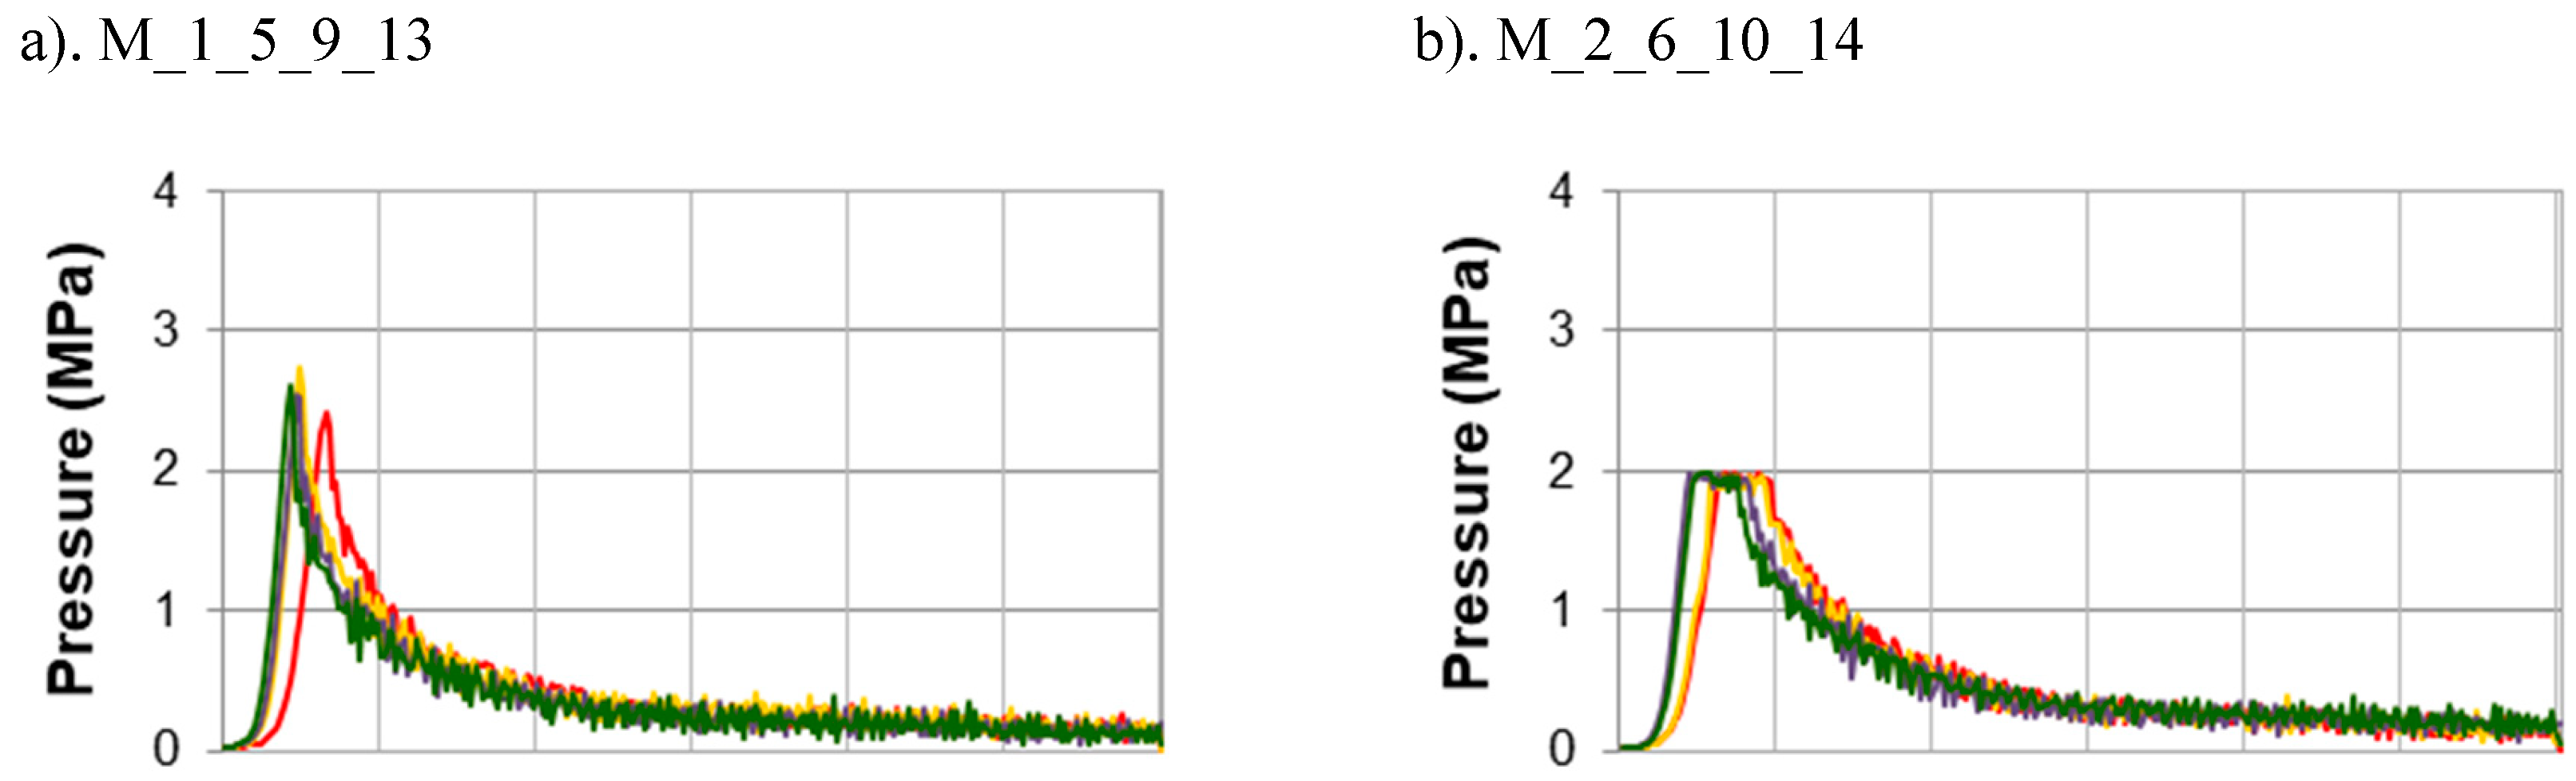
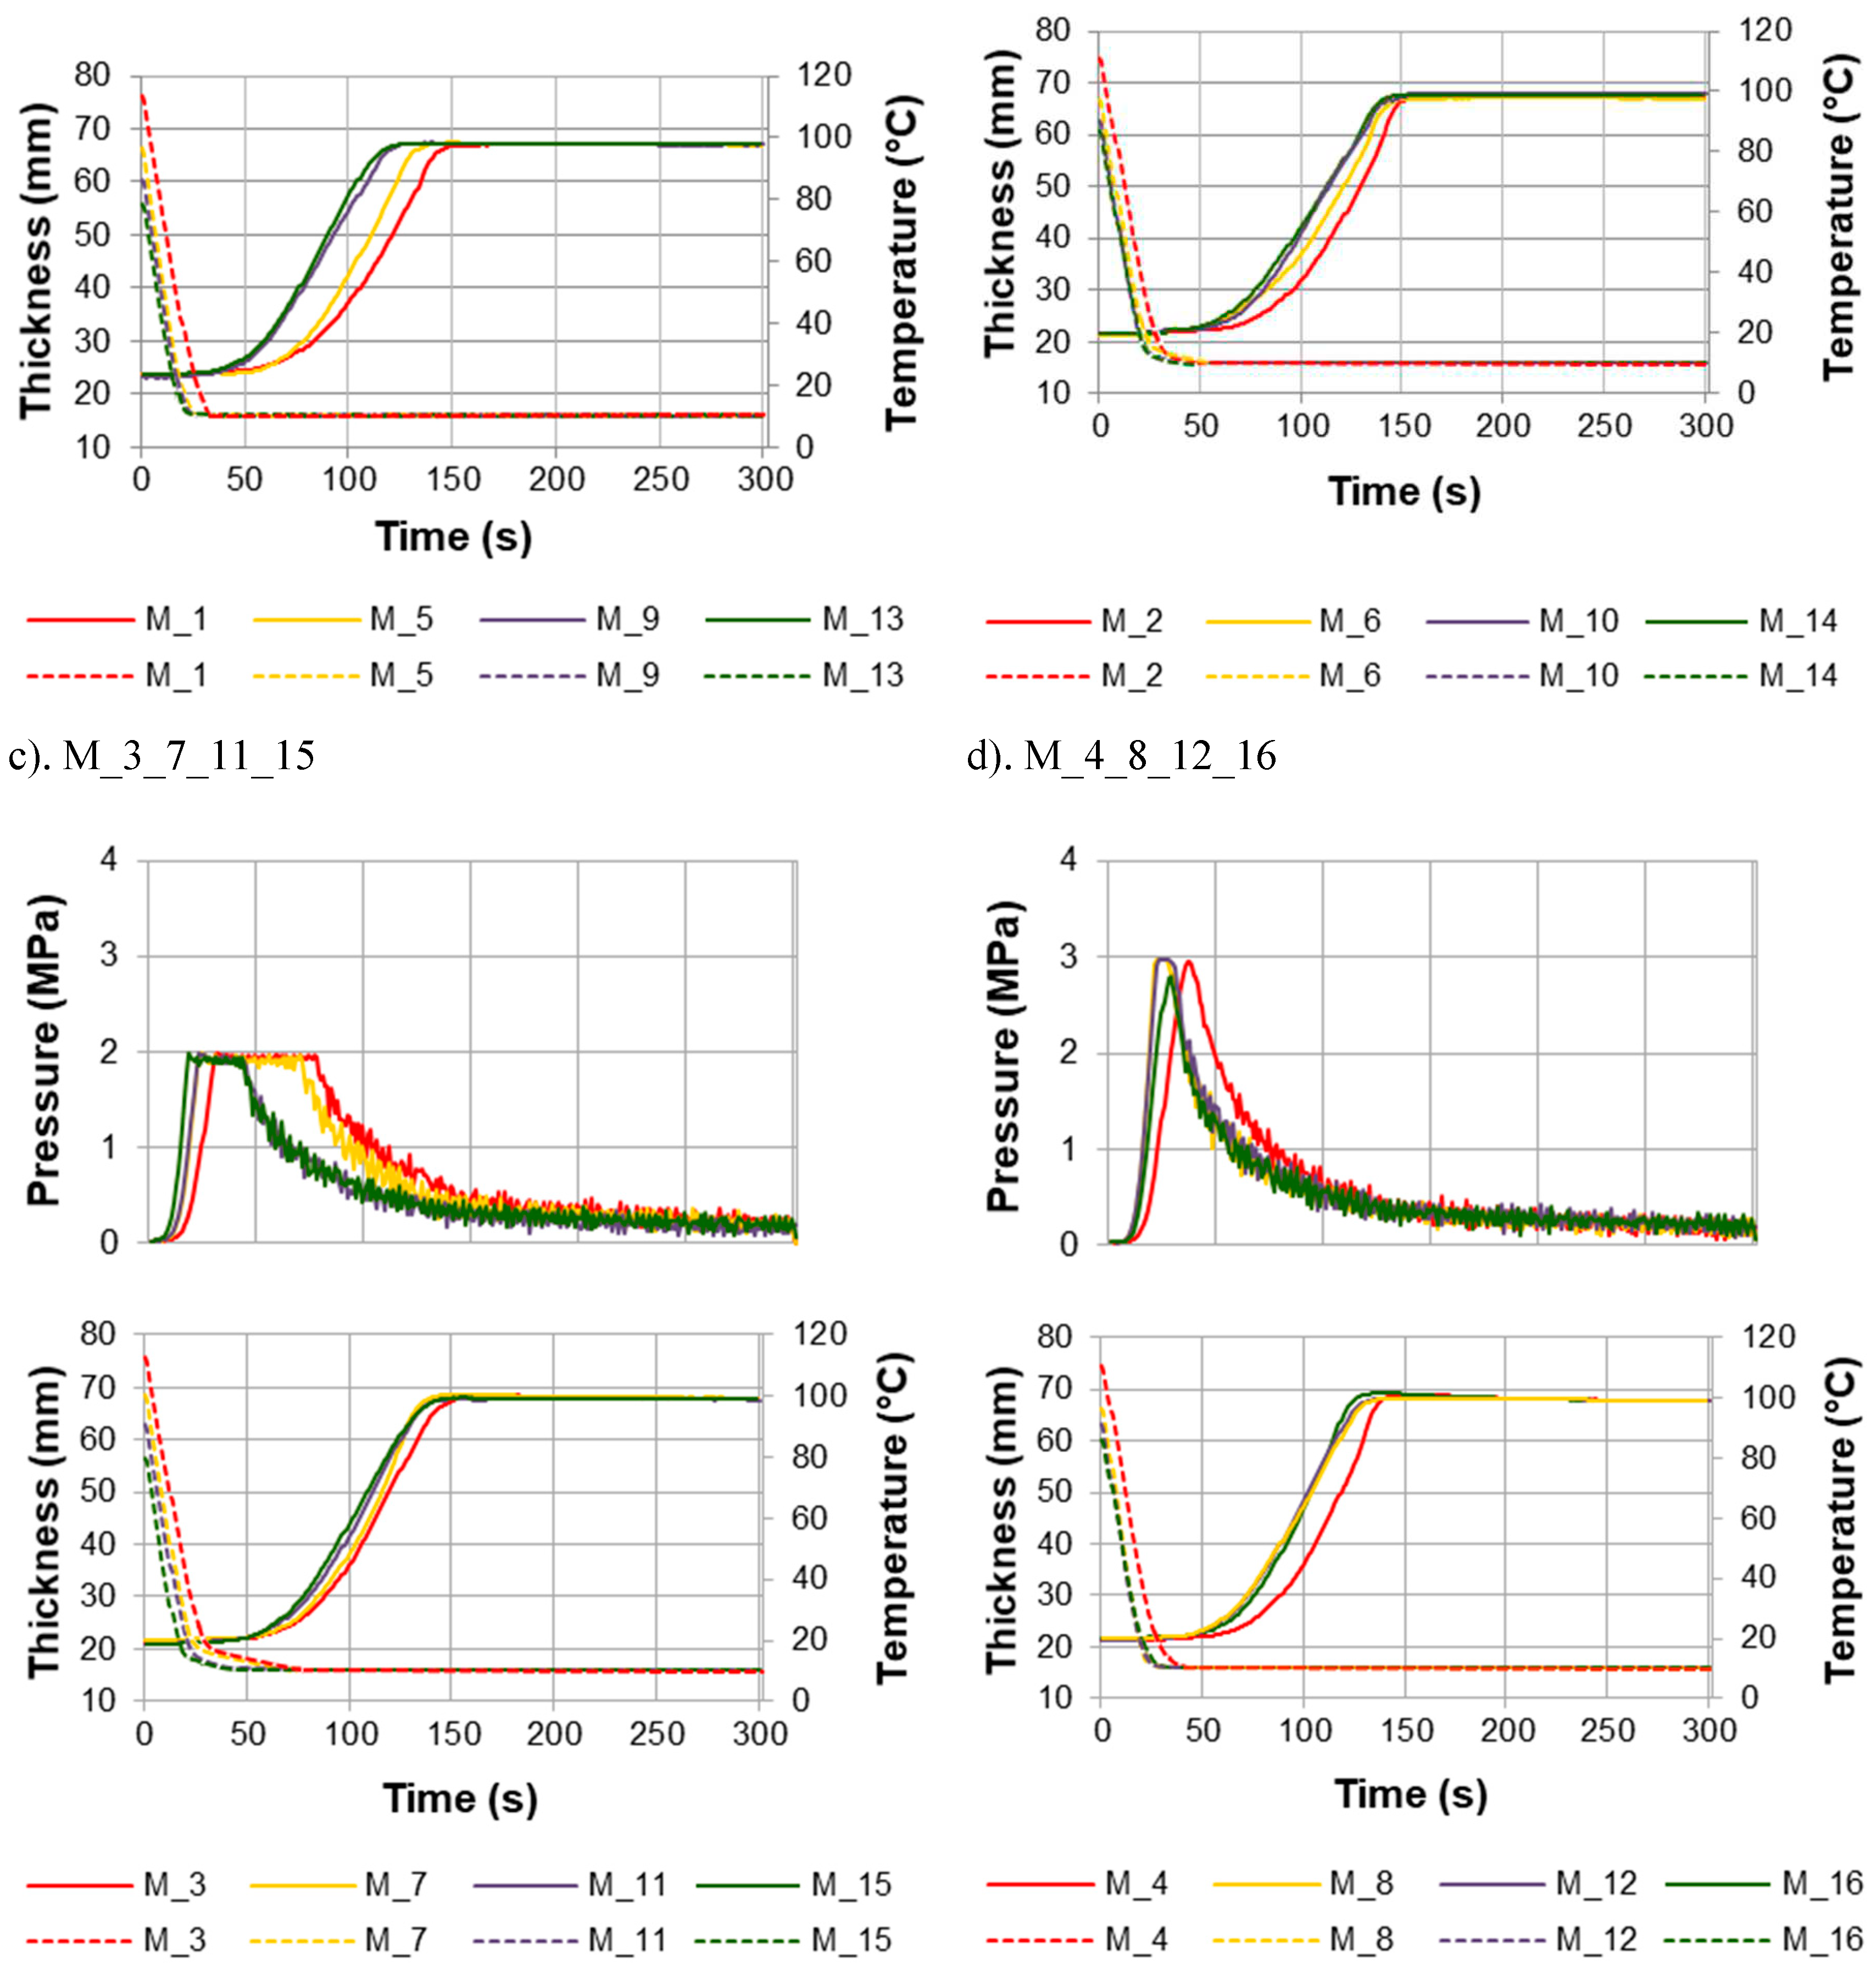
Figure 2.
Density profiles of particleboards containing recovered particles.
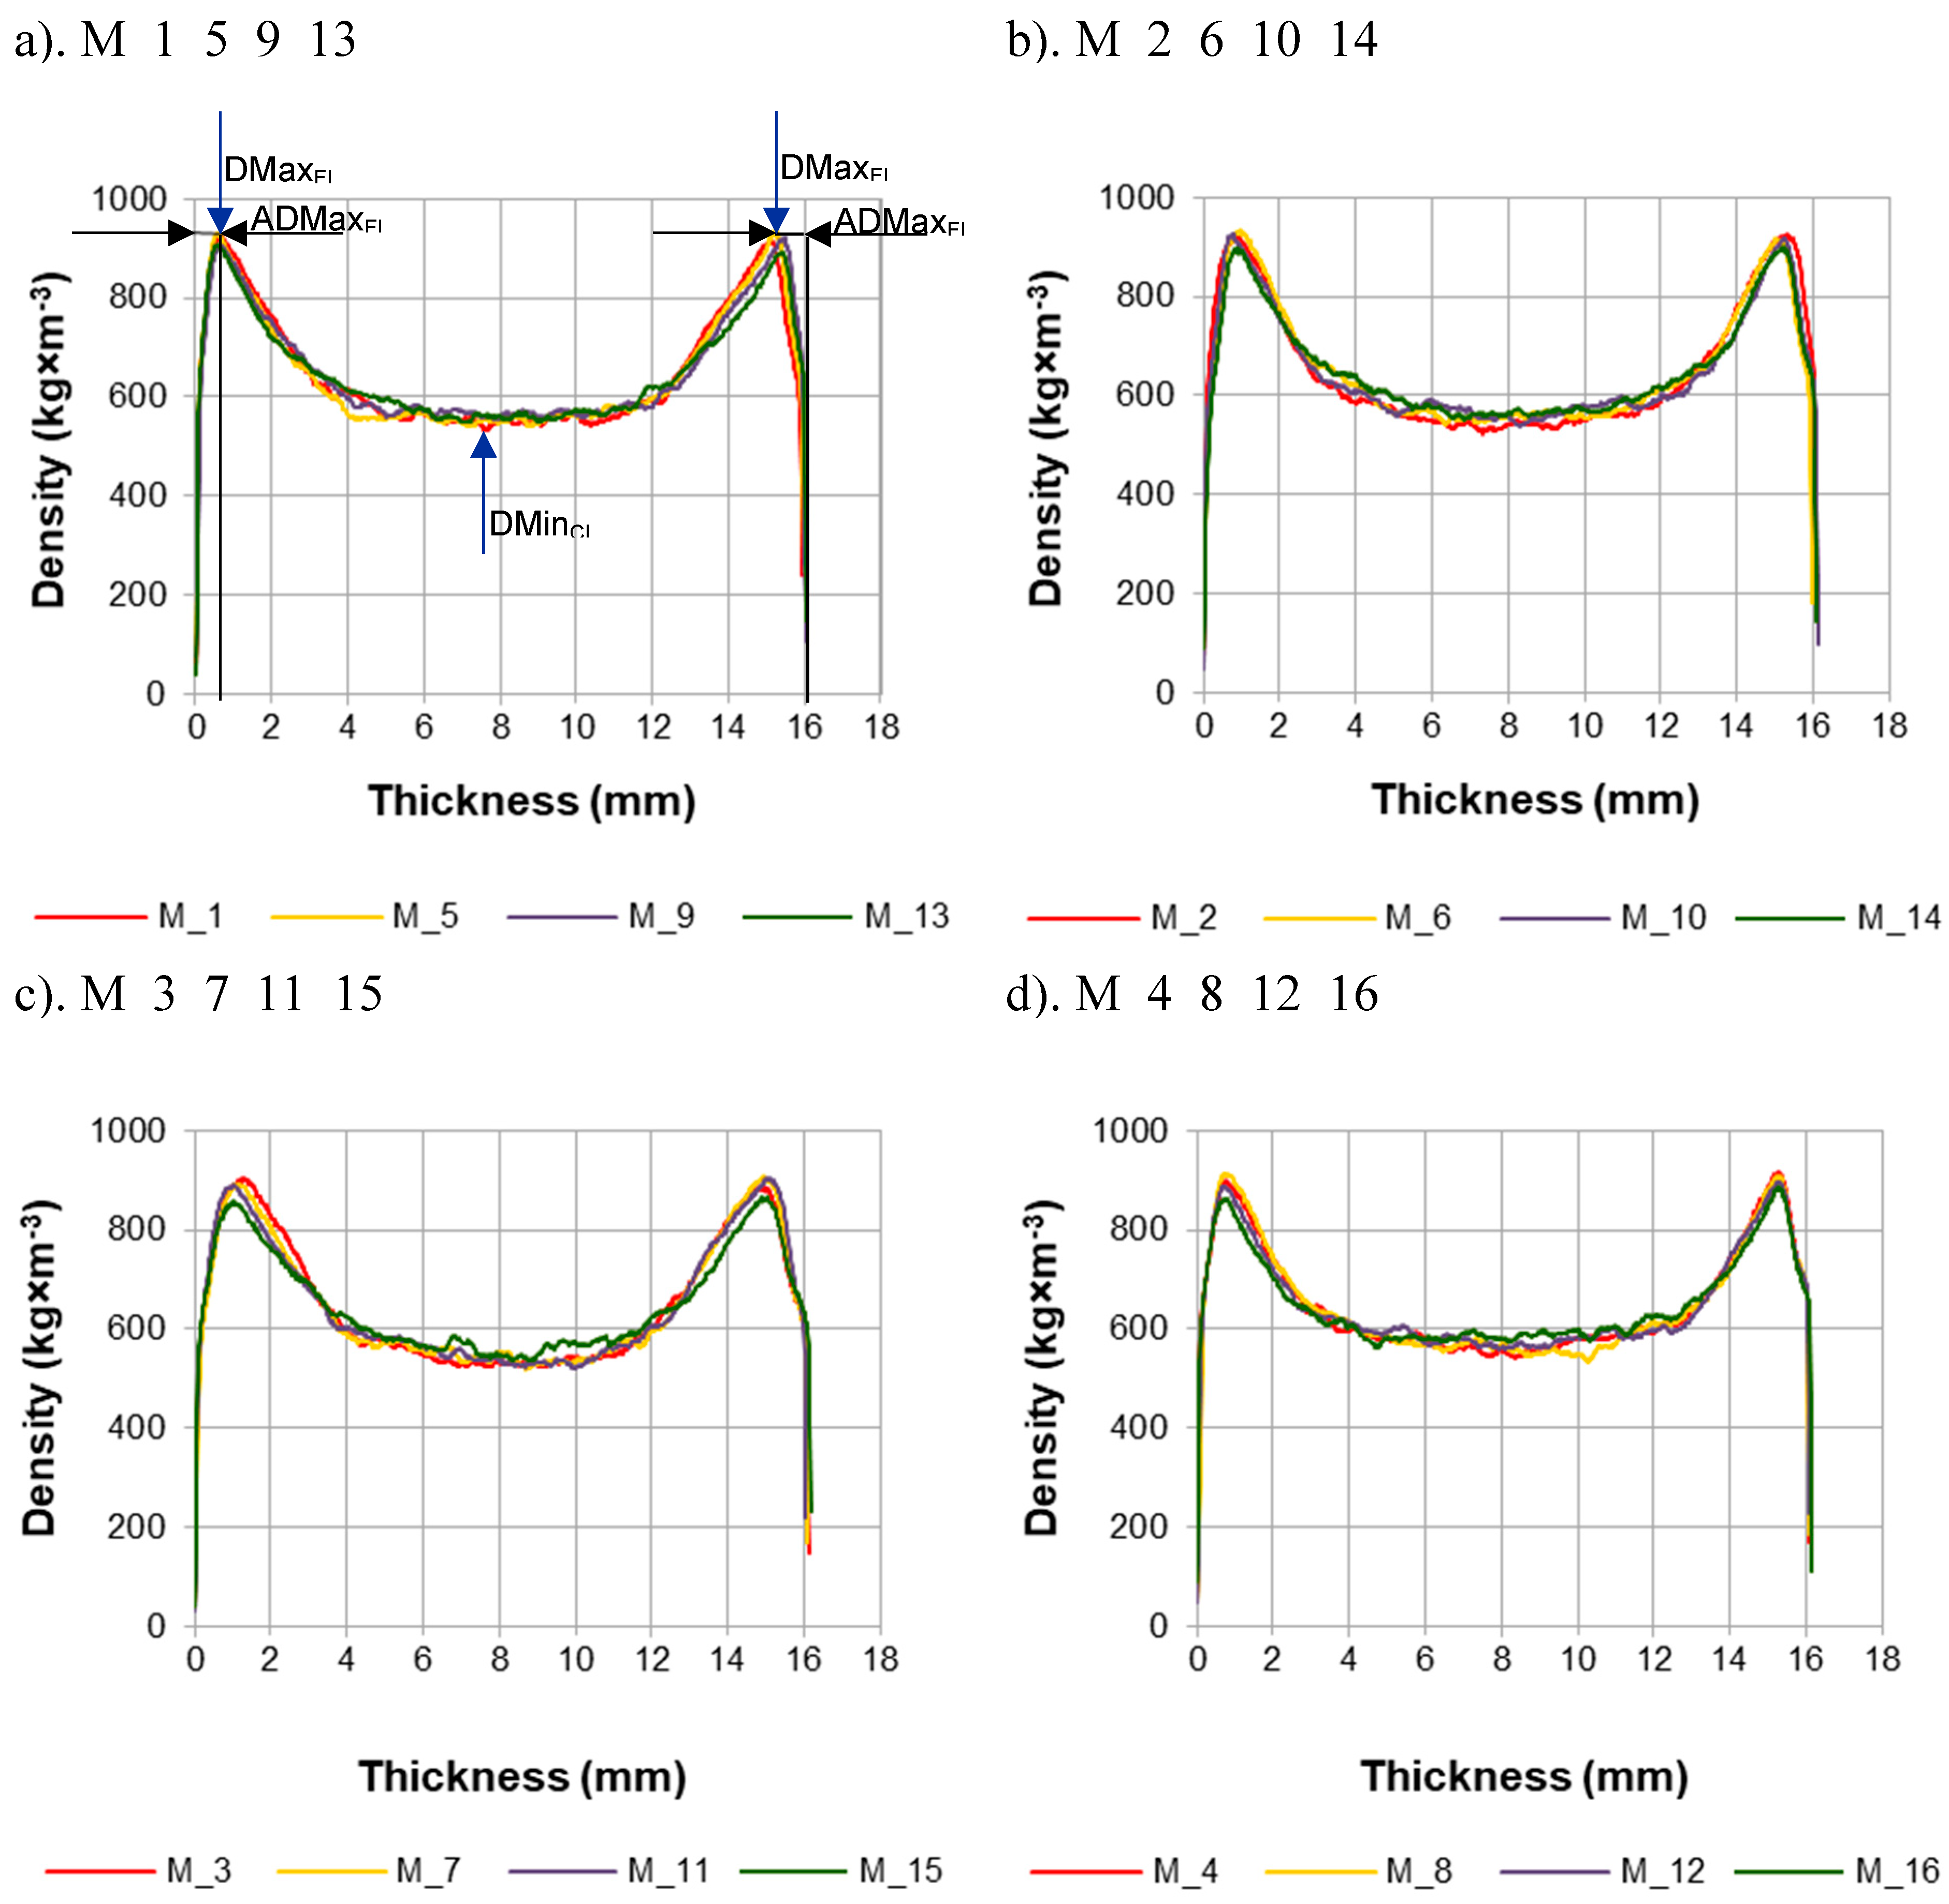
Figure 3.
The influence of selected factors on the maximum density of the face layer (DMaxFL) and minimum density of the core layer (DMinCL) of particleboards containing recovered particles.
Figure 3.
The influence of selected factors on the maximum density of the face layer (DMaxFL) and minimum density of the core layer (DMinCL) of particleboards containing recovered particles.
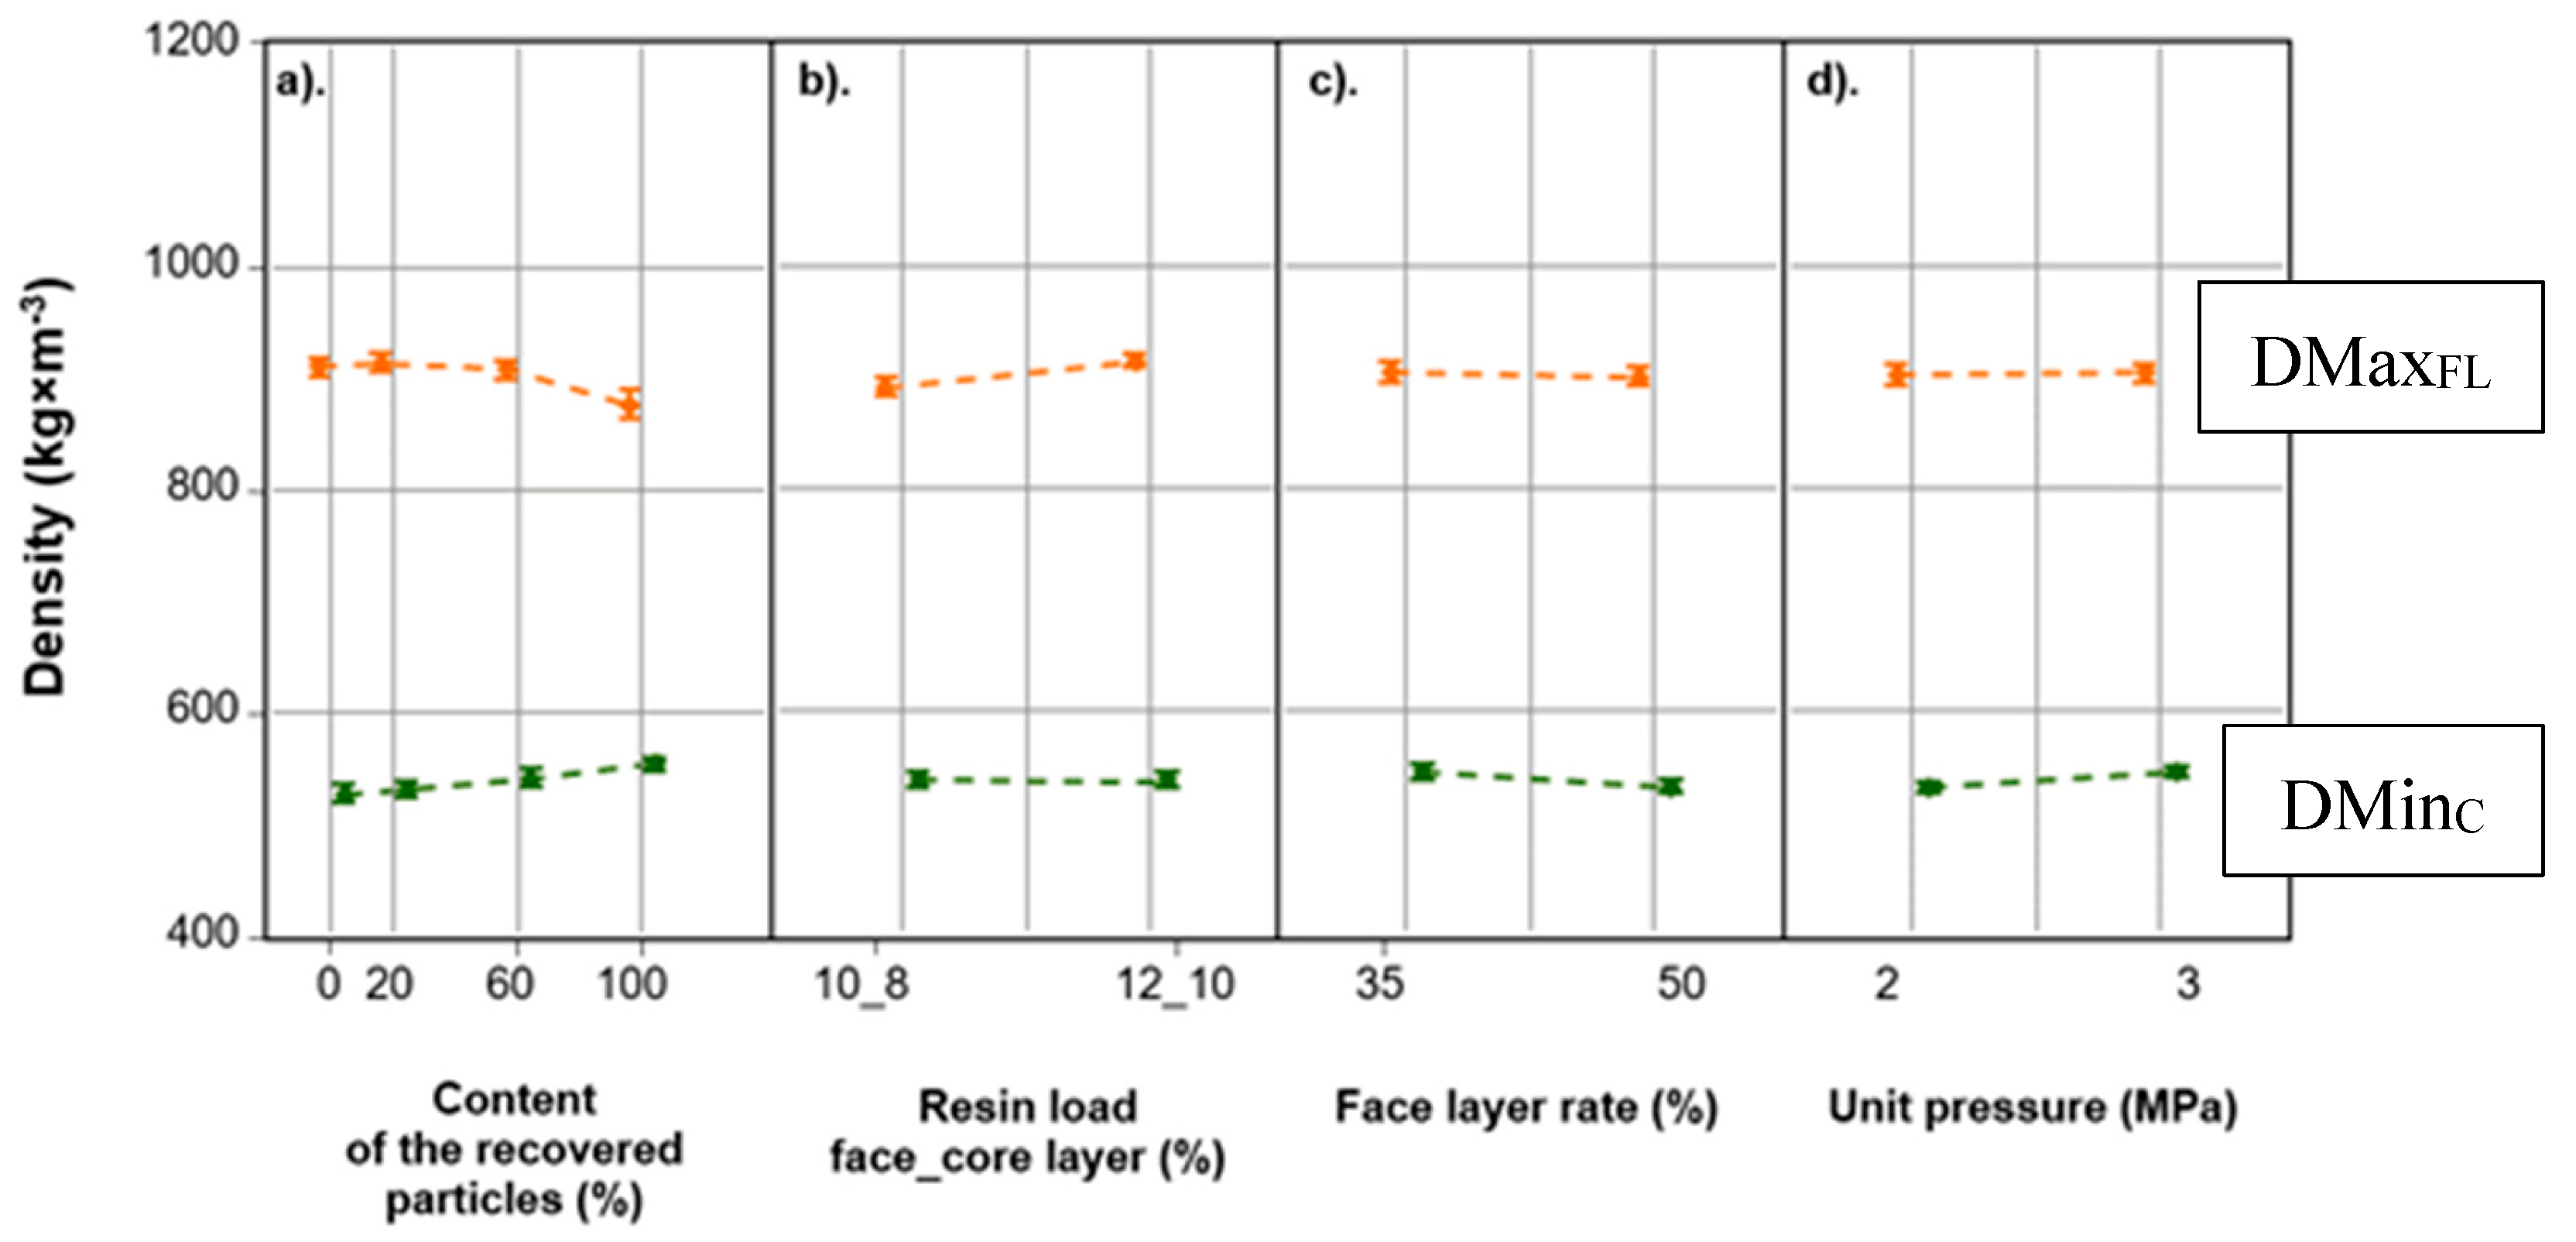
Figure 4.
The influence of selected factors on the distance between the maximum density area of the face layer and the particleboard surface (ADMaxFL).
Figure 4.
The influence of selected factors on the distance between the maximum density area of the face layer and the particleboard surface (ADMaxFL).
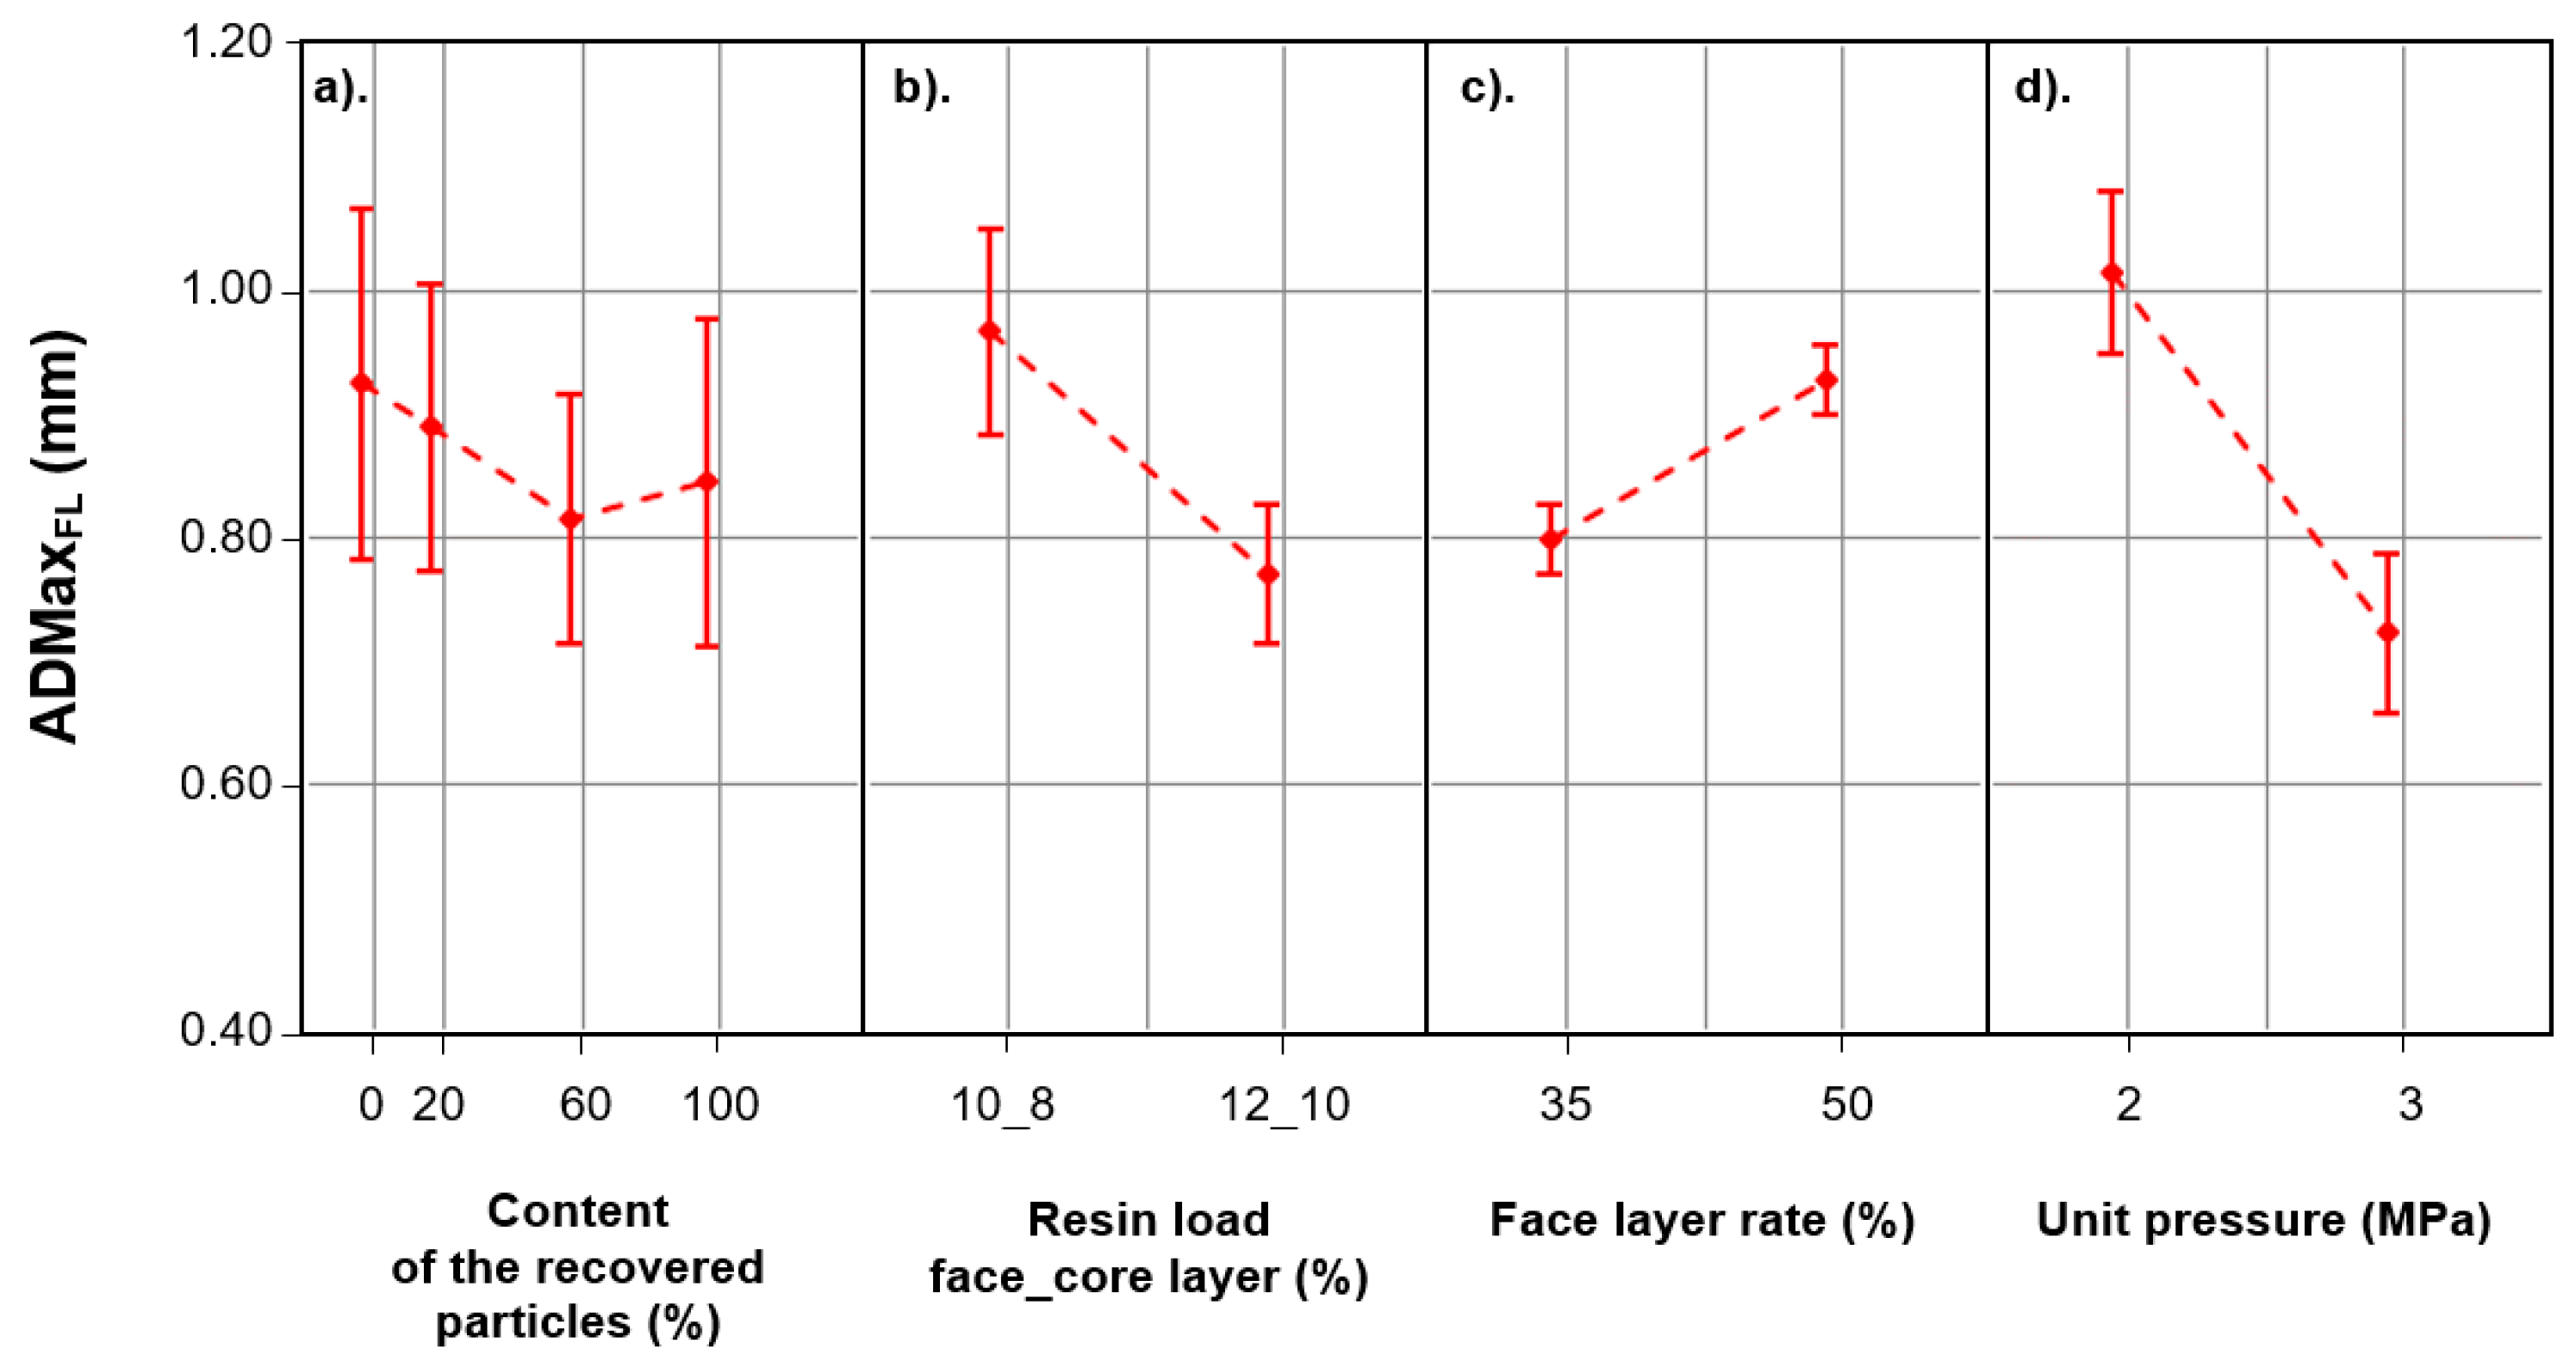

Table 1.
MUPF adhesive formulation.
| Component | Face Layer (ppw) |
Core Layer (ppw) |
|---|---|---|
| MUPF | 50.0 | 50.0 |
| 10% aq. (NH4)2SO4 | 3.0 | 7.0 |
| water | 12.0 | 8.0 |
Table 2.
Experiment plan for the manufacture of particleboard with the addition of recovered particles.
Table 2.
Experiment plan for the manufacture of particleboard with the addition of recovered particles.
| Variant | Content of the Recovered Particles (%) |
Resin Load Face_Core Layer (%) |
Face Layer Rate (%) |
Unit Pressure (MPa) |
|---|---|---|---|---|
| 1 | 0 | 12_10 | 50 | 3 |
| 2 | 0 | 12_10 | 35 | 2 |
| 3 | 0 | 10_8 | 50 | 2 |
| 4 | 0 | 10_8 | 35 | 3 |
| 5 | 20 | 12_10 | 50 | 3 |
| 6 | 20 | 12_10 | 35 | 2 |
| 7 | 20 | 10_8 | 50 | 2 |
| 8 | 20 | 10_8 | 35 | 3 |
| 9 | 60 | 12_10 | 50 | 3 |
| 10 | 60 | 12_10 | 35 | 2 |
| 11 | 60 | 10_8 | 50 | 2 |
| 12 | 60 | 10_8 | 35 | 3 |
| 13 | 100 | 12_10 | 50 | 3 |
| 14 | 100 | 12_10 | 35 | 2 |
| 15 | 100 | 10_8 | 50 | 2 |
| 16 | 100 | 10_8 | 35 | 3 |
Table 3.
Density profile parameters of particleboards with MUPF resin (DMaxFL - the maximum density of the face layer, DMinCL - minimum density of the core layer, ADMaxFL - the distance between the maximum density area of the face layer and the particleboard surface, DMinCL/MD - the ratio of the minimum density of the core layer to the medium density).
| Variant | Content of the Recovered Particles (%) |
Resin Load Face_Core Layer (%) |
Face Layer Rate (%) | Unit Pressure (MPa) | DMaxFL | DMinCL | ADMaxFL | DMinCL/MD |
|---|---|---|---|---|---|---|---|---|
| (%) | (%) | (%) | (MPa) | (kg × m-3) | (kg × m-3) | (mm) | (-) | |
| 1 | 0 | 12_10 | 50 | 3 | 917 (7) | 522 (10) | 0.72 (0.04) | 80 (1) |
| 2 | 0 | 12_10 | 35 | 2 | 926 (3) | 523 (11) | 0.87 (0.07) | 80 (2) |
| 3 | 0 | 10_8 | 50 | 2 | 894 (4) | 519 (6) | 1.28 (0.06) | 80 (1) |
| 4 | 0 | 10_8 | 35 | 3 | 903 (5) | 542 (12) | 0.83 (0.03) | 84 (2) |
| 5 | 20 | 12_10 | 50 | 3 | 923 (12) | 529 (12) | 0.71 (0.03) | 81 (2) |
| 6 | 20 | 12_10 | 35 | 2 | 924 (10) | 532 (10) | 0.91 (0.09) | 82 (1) |
| 7 | 20 | 10_8 | 50 | 2 | 899 (3) | 520 (3) | 1.15 (0.06) | 80 (1) |
| 8 | 20 | 10_8 | 35 | 3 | 912 (6) | 543 (9) | 0.78 (0.06) | 84 (1) |
| 9 | 60 | 12_10 | 50 | 3 | 917 (4) | 544 (12) | 0.59 (0.05) | 84 (1) |
| 10 | 60 | 12_10 | 35 | 2 | 920 (4) | 541 (5) | 0.87 (0.02) | 83 (1) |
| 11 | 60 | 10_8 | 50 | 2 | 900 (10) | 522 (3) | 1.01 (0.02) | 80 (2) |
| 12 | 60 | 10_8 | 35 | 3 | 895 (3) | 556 (3) | 0.79 (0.01) | 85 (1) |
| 13 | 100 | 12_10 | 50 | 3 | 893 (7) | 552 (2) | 0.59 (0.03) | 85 (1) |
| 14 | 100 | 12_10 | 35 | 2 | 891 (11) | 556 (5) | 0.89 (0.01) | 86 (1) |
| 15 | 100 | 10_8 | 50 | 2 | 860 (6) | 542 (5) | 1.13 (0.03) | 84 (1) |
| 16 | 100 | 10_8 | 35 | 3 | 864 (22) | 564 (6) | 0.77 (0.06) | 87 (2) |
| Average value for all variants |
902 (21) | 538 (16) | 0.87 (0.19) | 83 (2) | ||||
Table 4.
Analysis of variance for selected factors and interactions between factors influencing DMaxFL, ADMaxFL, DMinCL of particleboards (SS – sum of squares, Df – degrees of freedom, MS – variance, F - Fisher's F-test, p - significance level, X - factor influence).
Table 4.
Analysis of variance for selected factors and interactions between factors influencing DMaxFL, ADMaxFL, DMinCL of particleboards (SS – sum of squares, Df – degrees of freedom, MS – variance, F - Fisher's F-test, p - significance level, X - factor influence).
| Properties. | Factor/Interaction | Statistical Measures | |||||
|---|---|---|---|---|---|---|---|
| DMaxFL | SS | Df | MS | F | p | X | |
| Content of the recovered particles (1) | 10499 | 3 | 3500 | 46.07 | 0.000 | 52 | |
| Resin load for face and core layer (2) | 6460 | 1 | 6460 | 85.04 | 0.000 | 32 | |
| Face layer rate (3) | 189 | 1 | 189 | 2.49 | 0.124 | 1 | |
| Unit pressure (4) | 18 | 1 | 18 | 0.24 | 0.626 | 0 | |
| (1) × (2) | 256 | 3 | 85 | 1.12 | 0.354 | 1 | |
| (1) × (3) | 195 | 3 | 65 | 0.86 | 0.473 | 1 | |
| (1) × (4) | 178 | 3 | 59 | 0.78 | 0.513 | 1 | |
| Error | 2431 | 32 | 76 | 12 | |||
| DMinCL | SS | Df | MS | F | p | X | |
| Content of the recovered particles (1) | 5242 | 3 | 1747 | 27.58 | 0.000 | 45 | |
| Resin load for face and core layer (2) | 14 | 1 | 14 | 0.22 | 0.641 | 0 | |
| Face layer rate (3) | 2168 | 1 | 2168 | 34.22 | 0.000 | 19 | |
| Unit pressure (4) | 1722 | 1 | 1722 | 27.18 | 0.000 | 15 | |
| (1) × (2) | 235 | 3 | 78 | 1.23 | 0.313 | 2 | |
| (1) × (3) | 16 | 3 | 5 | 0.08 | 0.968 | 0 | |
| (1) × (4) | 154 | 3 | 51 | 0.81 | 0.498 | 1 | |
| Error | 2027 | 32 | 63 | 18 | |||
| ADMaxFL | SS | Df | MS | F | p | X | |
| Content of the recovered particles (1) | 0.086 | 3 | 0.029 | 13.35 | 0.000 | 5 | |
| Resin load for face and core layer (2) | 0.466 | 1 | 0.466 | 217.21 | 0.000 | 26 | |
| Face layer rate (3) | 0.043 | 1 | 0.043 | 19.85 | 0.000 | 2 | |
| Unit pressure (4) | 1.024 | 1 | 1.024 | 477.09 | 0.000 | 58 | |
| (1) × (2) | 0.020 | 3 | 0.007 | 3.06 | 0.042 | 1 | |
| (1) × (3) | 0.053 | 3 | 0.018 | 8.27 | 0.000 | 3 | |
| (1) × (4) | 0.010 | 3 | 0.003 | 1.51 | 0.231 | 1 | |
| Error | 0.069 | 32 | 0.002 | 4 | |||
Disclaimer/Publisher’s Note: The statements, opinions and data contained in all publications are solely those of the individual author(s) and contributor(s) and not of MDPI and/or the editor(s). MDPI and/or the editor(s) disclaim responsibility for any injury to people or property resulting from any ideas, methods, instructions or products referred to in the content. |
© 2023 by the authors. Licensee MDPI, Basel, Switzerland. This article is an open access article distributed under the terms and conditions of the Creative Commons Attribution (CC BY) license (http://creativecommons.org/licenses/by/4.0/).
Copyright: This open access article is published under a Creative Commons CC BY 4.0 license, which permit the free download, distribution, and reuse, provided that the author and preprint are cited in any reuse.


