Submitted:
11 December 2023
Posted:
12 December 2023
You are already at the latest version
Abstract
This work develops a new method for vector data augmentation. The proposed method applies the Principal Component Analysis (PCA) and determines the Eigenvectors of a set of training vectors for a Machine Learning (ML) method and uses them to generate the distilled vectors. The training and the PCA distilled vectors have the same dimension. The user chooses the number of vectors to be distilled and augmented to the set of training vectors. A statistical approach determines the lowest number of vectors to be distilled such that when augmented to the original vectors the extended set trains a ML classifier to achieve a required accuracy. Hence, the novelty of this study is, the distillation of vectors with the PCA method and their use to augment the original set of vectors. The advantage that comes from the novelty is that it increases the statistics of ML classifiers. To validate the advantage, we conducted experiments with four public databases and applied four classifiers: Neural Network, Logistic Regression, Support Vector Machine with linear and polynomial kernels. For the purpose of augmentation, we conduct several distillations including nested (double distillation). The latter notion means that new vectors were distilled from already distilled vectors. We train the classifiers with three sets of vectors: original vectors; original augmented with vectors distilled by PCA; original augmented with distilled and double distilled, by PCA, vectors. The experimental results are presented in the paper, and they confirm the advantage that the PCA distilled vectors increase the classification statistics of ML methods, if the distilled vectors augment the original training vectors.
Keywords:
data
; distillation
; augmentation
; classification
; machine learning
1. Introduction
A fundamental problem in the field of data classification with supervised machine learning (ML) is the shortage and/or imbalanced training data [1,2]. For example, the training set of the public image database ISIC2020 [3] contains only 584 malignant images and approximately 33,126 benign. Such a large class imbalance leads to overfitting [4] which impacts the prediction accuracy of a classifier. It holds because the model is biased toward the class with larger set of samples. In the example given above, the ML classifier may produce a large number of False Negatives (Type 1 Error) which will indicate a poor performance of the model.
A natural way to tackle the problem of imbalanced classes and data shortage is to fill up the gap with additional data but in many practical cases, the process of obtaining additional real data is time consuming and expensive. Hence, other sources and/or approaches of data generation should be explored and used. One approach is to artificially produce data which will have the same characteristics as the original data and after the augmenting of the training data with the artificial one the entire set will increase the statistical outcomes of a ML method. An approach that produces artificial data is to apply geometric transformations on a certain part of the training images and augment the original training set with the transformed set of images. Typical geometric image transformations are rotation, translation, flipping [6] or cropping [7]. Another set of techniques that generate images for the purpose of training data augmentation are Gaussian blur, image sharpening, smoothing, [5] or noise injection [6].
In recent years, a method was developed to embed vector field (VF) into an image [8]. This method augments the set of image features with VF features like singular points and trajectories. Augmenting the set of features in every image of an image database increases the learning capabilities of the ML methods and leads to the increase of its classification abilities. This claim was successfully validated with the help of a new Sparce Representation Classification in the Quaternion Wavelet domain method [9] and a new convolutional NN (CNN) [10]. They classified several publicly available image databases and the corresponding image databases with embedded VFs with real [9] and complex [10] singular points shapes as well as image databases populated with a Gaussian noise.
One may observe that the methods listed above produce new data on the base of existing data. Also, the VF embedding methods [8,10] augment the set of image features with VF features but none of them changes the main theme of (keep the subjects that belong to) the images, in the case of image data.
On the other hand the data distilation methods based on NNs may generate a new data or images which do not resemble the original sets at all, but are still useful for training data augmentation. Another useful way to generate new images on the basis of existing, for the purpose of training data augmentation, is to use NN. In paper [11] the authors used GAN architecture to generate synthetic images to resolve the problem of limited data availability for three different classes. For the purpose of augmentation, the authors of paper [12] develop and implement a CNN to determine the likelihood of an object category to be present inside a box that encompasses a given neighborhood. Further, the method finds suitable locations on images to place new objects.
A comprehensive survey on the recent methods of data distillation, including application of NN, is given in [13]. The authors provide detailed description of multiple data distillation techniques based on the concept of "meta-model", "gradient", "distribution", "trajectory" and "factorization" matching.
In the present paper we propose the novel idea to apply the PCA method for vector data distillation from existing training data [15]. The generalized idea is to use the Eigenvectors from the covariance matrix of the training vectors with the greatest magnitudes, as data augmenting vectors. We conducted a set of experiments with four publicly available databases. We applied on them three classifiers a NN, a support vector machine (SVM) and Logistic Regression. The experimental results are shown in the paper and they confirm the advantage that augmenting the training set with PCA distilled vectors leads to the increase of the classification statistics.
The rest of the paper is organized as follows: in its first subsection, section two describes the new method for data distillation with the PCA, while the second subsection section three introduces a statistical method [16] that determines lower bound of the number of distilled vectors necessary to augmented the set of training vectors in order to provide certain accuracy of classification; section three presents the four classifiers implemented to validate the new distillation method; next section describes the original datasets along with the augmented vector datasets; finally, sections 5 and 6 describe our results and discuss on the novelties and the advantages of the new vectors distillation method.
2. Vectors Distilation with Principal Component Analysis (PCA)
The PCA [14,15] is a commonly employed technique to decrease dimensionality of a given data. It is achieved through mapping the high-dimensional dataset into a lower-dimensional space while preserving the important features of the dataset. PCA has numerous applications to data visualization, feature extraction, and data compression. In the present paper we propose a new application of the PCA and employ the method to generate new data ordered from top to bottom according to its importance. To augment the original data, we select the most representative vectors from the top. We apply statistical method to estimate the minimum number of vectors to be selected.
2.1. Principal Components and the Projection Matrix
Assume we are given a set of training vectors , where . Hence, every training vector consists of k variables, which we will call also features for and . Therefore, the matrix of the database . Then, we denote the vector of the feature with and introduce it as . Further, we denote the mean of the feature (variable) vector , which is a column of , with , and the rank of with .
- Data normalization: is the first step of the calculation and we subtract the mean of each feature vector from the corresponding vector entries. This is done to ensure that the data is centered around zero. It means that, the mean of every feature vector is 0. The equation for data normalization with the help of the feature vector mean is:where is the feature value, where , of the feature (variable) vector, for , and is the mean of this feature vector.
-
Covariance matrix: measures the statistical relationship between the features in the entire dataset [15]. For this purpose we develop the equation below and calculate the entry of the features’ covariance matrix of the training data matrix :It follows from Eq. 2, the covariance matrix of the features is of the form:Now we calculate the Eigenvectors and the Eigenvalues of the covariance matrix of the database features as follows:where we denote the identity with .
-
Projection: At the present step we construct the matrix whose columns are the normalized Eigenvectors of the covariance matrix of the dataset features:where every Eigenvector , and r is the rank of . Also, let us arrange the vector columns from left to right according to the decreasing Eigenvalue of the corresponding Eigenvector. We consider the largest one of them at the left most position, if we think of the Eigenvalues as a decreasing sequence of consecutive numbers. The matrix is applied to project the training dataset onto the new subspace spanned by the Eigenvectors . The equation that conducts the projection is [15]:where is the new low-dimensional representation of the i-th training sample , where is a vector row in whose rank .We consider that an Eigenvector is stronger than another one if the former has a bigger Eigenvalue than the latter. Hence, we select from the strongest components (Eigenvectors) , which appear as the top m rows of the matrix. Using the strongest components, as vector columns, we construct the matrix which transforms (maps) the original dataset into , which we call the transformed data:
2.2. Finding the Distilled Vectors
We conduct the inverse projection with the matrix which maps the transformed data :
into the modified original dataset , such that . Note that the modified original data belongs to the original featere space and has the same kardinality n as the initial original data. Now, among the modified training data set we determine the images of the m strongest components (Eigenvectors) we selected from . In order to do so, we use the consequtive numbers of their positions in Eq.4. We call the set of m modified vectors in as the set of distillated vectors from the original training vectors . We augment the set of initial original training vectors with the set of distilled vectors and use the union as a training set of a ML classifier. One immediate advantage of this kind of augmentation is to enlarge a class in case of big disproportion between two classes.
2.3. Minimum Number Training Samples (MNTS)
The present subsection provides an algorithm to determine the minimum number of training samples [16] m needed to be distilled, out of the total number of training samples n, such that the original samples augmented with the distilled samples train a classifier to provide an accuracy a. MNTS
- Assume we are looking for an accuracy . Follows that and the confidence level ;
- Using the confidence level C we determine from the standard normal distribution table [17];
- Select the success and failure rate and denote them respectively with p and q and calculate m from
- Consider a training set with two classes (the number of benign and the number of malignant ) total number of samples.
- Calculate ,
- and are respectively the number of malignant and the number of benign distilled vectors. , such that .
3. Classifiers Applied for Experimental Validation
In the present section we describe three classifiers we use to validate our method for distillation and augmentation, and the advantage that comes from it. The novelty is that using the training vectors of a ML algorithm the PCA method generates (distills) vectors which increase the classification statistics of the ML method if the original training set is augmented with the distilled set.
3.1. Logistic Regression (LR)
Logistic Regression is a statistical technique employed to model the relation between dependent variables. In the case of binary classification, it models the probability of an observation belonging to a particular class. Given a dataset with n observations and k independent variables , the logistic regression model can be represented as:
where Y is the binary dependent variable with outcomes "0" or "1". is the training data matrix with n rows (samples-training vectors) and k columns (variables). are the coefficients or parameters estimated by the model and is the natural logarithm of the odds ratio of the probability of to the probability of . The logistic function or sigmoid function is used to convert the linear combination of independent variables and coefficients into a probability between 0 and 1:
To evaluate the coefficients of the model, the maximum likelihood estimation algorithm [23] is used. The goal is to maximize the likelihood of observing the dataset if the model is given. This could be done by minimizing the negative log-likelihood:
Where, is the ground truth label for the training vector , while is the predicted probability of for this vector. The parameters for can be estimated using optimization algorithms such as gradient descent [24] or Newton’s method.
3.2. Support Vector Machine (SVM)
The SVM is a useful ML tool for vectors classification [21,22]. The method was developed and gained popularity during the nineties of the 20th century [21] and is applied mainly for binary classification but multi-class SVMs could be built as well. Unlike the NNs which provide accurate classification if thousands or hundreds of thousands of training samples are used, the SVMs are effective classifiers if hundreds of training samples are available. In the present study, we employ binary SVM to classify medical vector data. For the purpose of SVM training, we use two kinds of data, original and original data augmented with PCA distilled data.
Following the concepts from [21,22] we define the binary SVM as the function given below and:
In Eq. 13 the symbol denotes the label of the training sample , is the unknown sample subject to classification, while is the Lagrange multiplier associated with the support vector such that and is a bias. Further, with we denote the kernel of the SVM. Examples of the most used kernels are the: linear, polynomial, radial basis function (RBF), Gaussian, and sigmoid kernels. For the purpose of our experimental validation, of the advantage of this study, we will use the linear and the polynomial kernels. The latter is defined below:
where . Hence we difine a SVM with linear (SVML) kernel for and a SVM with polynomial (SVMP) kernal for .
3.3. Neural Network (NN)
In recent years the NN became the most used classifier because of its reliability, repeatability, and the opportunity to highly increase the performance statistics. Note that the image is a 2D signal and could be presented in the form of 1D signal or as a sequence. Despite this, we could roughly divide the NNs to those which are designed to work with images [20] and those designed to work with signals and sequences of numbers [18,19]. A well-established representative of the first kind is the convolutional NN (CNN)[20], while examples of the second kind include the long-short term memory NNs (LSTM) [18,19]. The main hyperparameters of a NN consist of: architecture, input, hidden, output layers, activation functions, loss function, optimization method, and training process. The architecture of a NN typically consists of multiple interconnected layers, each containing a set of neurons or nodes. The arrangement and number of layers, as well as the number of neurons in each layer, vary depending on the specific problem and desired model complexity [18,19,20]. The NN model we use consists of two hidden layers and an output layer. Each hidden layer has 512 and 256 neurons, respectively, and uses the ReLU activation function. The output layer has 1 neuron with the Sigmoid activation function. The equations used in the two hidden layers are described as follows:
Here, and represent the matrices of weights for the first and second hidden layer respectively, denotes the matrix of the input data. The terms and represent matrices of biases term for the first and second hidden layers respectively. While and denote the pre-activation calculations of the two hidden layers. Further and represent the ReLU calculated outputs of the first and the second layers respectively.
In what concerns the output layer that calculates the vector of predicted values we implement the following equations:
In Eq. (17) represents the vector of weights for the output layer, denotes the vector of biases, while represents the pre-activation output of the output layer, while represents the vector of predicted output calculated by Sigmoid activation function .
During the training process, we apply the Adam optimizer to update the matrix and vector parameters , , , , , and . The loss function used is binary cross-entropy, and the model’s accuracy is measured using the accuracy metric.
4. Validation Datasets and Training of the Models
4.1. Original Datasets
In the present section we describe the four datasets of feature vectors we used to validate that augmenting the training dataset with PCA distilled vectors imroves the statistical outcomes of a ML classifier.
- The first one we call Skin Lesion (SL) Dataset which comprises 162 observations (samples S) of 5D feature vectors () extracted by an active contour in [26] from skin lesion images with a ground truth [25]. The SL dataset contains 100 benign samples (skin lesion feature vectors labeled by B) and 62 malignant observations (labeled by M).
- The Diabetes (D) Dataset [27] consists of 768 feature vectors with a dimension 8 (). The vectors are distributed in two sets labeled by P if the corresponding vector indicates Diabetes. Otherwise, the vector is labeled by N, which means that the vector indicates NON-Diabetes. The class P which suggests Diabetes consists of 268 vectors, while the class N contains 500 vectors of dimension 8.
- The Heart Disease (HD) Dataset [28] consists of 1025 feature vectors of dimension 13 features. The data samples are distributed in two classes and . The N samples in the HD datasets are 499 while the P are 526.
- Breast Cancer (BC) Dataset [29] contains total of 569 feature vectors (observations) of dimension 30D . Out of them 347 labeled as benign-B while the remaining 212 are determined, by the medical experts, to be malignant-M.
A read of the above databases information shows that all databases are binary. In three of the cases, the two classes are disbalanced. The benign (negative class) contains almost twice more feature vectors than the malignant (positive) class.
4.2. Augmentation of the Original Training Data
For the validating experiments we will use the following split of the original data: 90% will be used for training and 10% for testing. Then we will distill vectors from the selected training set and will augment this set with the distilled vectors. Hence, we construct three kinds of augmentations. For the purpose of distillation, we apply the method from section 2.3 to determine the minimum number of training samples (MNTS) to be distilled and used to augment the original training samples such that they train a classifier to provide an accuracy of . In Table 1 are present the experimental results of classifying the 10% testing data with the three models, introduced above and, trained by the augmented data and the same models trained by the original data.
Augmented Dataset 1: Is created from the SL dataset using a testing/training split of 10%/90 %, where we keep the proportion same as it is in the original SL dataset. Therefore, we have 90 B, and 56 M vectors for training as well as 10 B, and 6 M for testing. Next, using PCA we distill the 26 vectors from the selected 90% (90 B, and 56 M ) training original vectors such that the proportion is preserved. The cardinality of the distilled vectors is 26 and is determined by the MNST approach and consists of 16 B and 10 M. Next, we add the distilled vectors to the original 90 B and 56 M training samples. Then, we train our classifiers to learn from the augmented training set and tested the models on the remaining 10% B and 10% M original vectors.
Augmented Dataset 2: Is for the SL dataset as well. In this augmentation we randomly select 90% of the entire original data for training and use the remaining 10% original data for testing. It means that in the selected training vectors the proportion is not necessary to be as in the entire original SL dataset. Further, in the distilled set of 26 vectors, the ratio equals the ratio of the randomly selected training vectors.
Augmented Datasets 3: Analogously to the case of SL dataset, we use 90% randomly selected samples for training from each class and distill, from the training samples, 101, 151 and 201 new vectors for each of the datasets D, HD and BC. Note, that in the distilled sets the proportion M/B or P/N is the same as in the original dataset. Then, for each of these datasets we create an augmented training set of the form: Original + 101-PCA-d, Original + 151-PCA-d, & Original + 201-PCA-d:. With Original we denote the randomly selected 90% original vector samples, which consist of 90% of the M (P) and 90% of the B (N) samples. The sets of are distilled from the 90% Original vectors with the help of the PCA method described in Section 2 . Therefore, for each of the original datasets D, HD and BC we develop three augmented datasets for training. Then we train the models and test them on the remaining 10% of the original data.
Augmented Datasets 4: Further, we respectively distilled 51, 77, and 101 samples from the 101, 151, and 201 samples, distilled earlier with the help of the same PCA method, described in Section 2. In the double distilled three sets of vectors, the proportion M/B or P/N is kept the same as in the initially distilled dataset. With the help of these new and nested distillation we create three augmented training sets of the form: Original + (101 + 51)-PCA-d, Original + (151 + 76)-PCA-d, & Original + (201 + 101)-PCA-d, for each of the original datasets D, HD, and BC. Therefore, we developed nine training augmented datasets and tested them on the remaining 10% of the original data.
4.3. Model Training
Since the SL data is very small we designed a slightly different NN than the one described in Section 3.3. The modified NN is designed with the Keras Sequential API, and contains two fully connected layers. The first layer comprises 10 neurons and implements the ReLU activation function, while the second layer consists of one neuron with the Sigmoid activation function. The model uses the Adam optimizer for 100 epochs with a batch size of 32 in order to be trained with the very small sample set of 100 and 106 samples.
As for the classification of the other three datasets we applied the neural network presented in Section 3.3. The model also includes two Dropout layers with a rate of 0.5 to reduce overfitting. The input dimension is set to 8. The model is compiled with the Adam optimizer and uses the binary cross-entropy loss function.
Recall that the advantage of this study is that augmenting the training data with PCA distilled vectors increases classification statistics. The next model we use to validate this advantage is the logistic regression model described in Section 3.1. We define this classifier again with the Scikit-Learn library as a LogisticRegression object. The model uses a maximum of 1000 iterations to ensure convergence.
The last model we implemented to validate our approach is the Support Vector Machine (SVM). We design this classifier with the help of the Scikit-Learn library and make the SVM works with two kernels: linear and polynomial degree 2. Further we set the machine’s regularization strength C= 1.
For the NN model, the accuracy score is calculated using the evaluate() method with the testing data. For the logistic regression and SVM models, the accuracy score is calculated using the score() method with the testing data. The confusion matrix is also calculated for each model using the confusion_matrix() function from ScikitLearn.
4.4. Cross-Validation
To fairly validate the classification statistics of the three classifiers we implement the Monte Carlo cross-validation approach. It randomly splits the entire set of samples into training and test samples and repeats the slitting m times. For each split, a sample appears in exactly one of the sets training or testing. The mean of the m experiments is calculated for each evaluating statistics. In our experiments, we set m=10 and show the results in Table 1, Table 2, Table 3, Table 4, Table 5, Table 6, Table 7, Table 8, Table 9, Table 10, Table 11, Table 12 and Table 13 for the SL and HD datasets. The advantage of applying the Monte Carlo cross-validation comes from the fact that the approach decreases the variance of the split sample error estimate and the proportion of the training-test random splits does not depend on the number on the selected number m.
4.5. Classification Metrics
Accuracy, sensitivity, and specificity are commonly used metrics to evaluate the effectiveness of a classification model. Below is a description of each metric along with their equations. The notations used are TP = True Positives, TN = True Negatives, FP = False Positives, and FN = False Negatives
- Accuracy : Accuracy measures the overall correctness of the model’s predictions by calculating the ratio of correctly predicted instances to the total number of instances.
- Sensitivity (True Positive Rate): Sensitivity, also known as recall or true positive rate, measures the model’s ability to correctly identify positive instances out of all the actual positive instances.
- Specificity (True Negative Rate): Specificity calculates the model’s ability to correctly identify negative instances out of all the actual negative instances.
5. Experimental Results
To validate that augmenting a training set of vectors with vectors distilled from them by the PCA method increases classification statistics, we conducted experiments applying NN, SVM and LR classifiers on the four databases of feature vectors: skin lesion SL [25,26]; diabetes D [27]; heart disease HD [28]; breast cancer BC [29]. For this purpose, we designed different setups for the training datasets as described in Section 4.2. The classification results obtained are presented in various tables throughout the present section. In the reporting tables, we show two types of accuracy for each experiment. The first percentage represents the model’s accuracy for one iteration, while the 2nd percentage indicates the mean accuracy of the Monte Carlo cross-validation approach for 10 experiments. The bold percentages in all the tables indicate the best results. We presented our results in three separate tables for the classification metrics mentioned in Section 4.5 for each dataset.
In Figure 1 are shown the curves of the loss function for the NN model on the SL data. One may observe that the curves of the loss functions for the training processes with original and Augmented Dataset 1 resemble each other. On the other hand, the curves of the loss functions for the two validation processes are very different. The curve for the validation process when the NN was trained with the original vectors is convex from below. It speaks about possible divergence after the 100 epochs. While the curve for validation when the NN was trained with the Augmented Dataset 1 is steadily decreasing, which suggests a classification improvement if more than 100 epochs are conducted.
In Table 1, we represented the comparison of classification statistics of different classifiers for the SL dataset and its augmentations mentioned in Section 4.2. The total number of samples in the original dataset is 162 and we split it to 90% vs 10% for training and testing. Studying Table 1 one can tell that the mean accuracy of the LR has significantly increased from 71% to 82% for Augmented dataset 2. Failure in the remaining classifiers may have occurred due to the fact that the total sample size is too ls mall. In some instances, the sensitivity has increased which indicates that the model’s ability to detect malignant samples has increased due to the augmentation. The Specificity of the LR model has increased by 5% which indicates a better ability of the model to detect benign lesions if Augmented Data 1 are used. Also, the Sensitivity of the NN classifier for the Augmented Data 1 increased twice, while the SVML increased the same statistics with 5% for the training Augmented Data 2. Furthermore, the results show that the augmented training data balances the Sensitivity/Specificity ratio, which tells that the classifiers are balanced according to the recognition of TP and TN samples. While in the case of the original data the ability of the NN and the LR to recognize benign samples is twice as big as the recognition of malignant samples.
Note that the SL dataset is small having only 168 samples. We continue the experimental validation with relatively larger feature vectors databases: D which contains 768 feature vectors of 8D, with ration P/N 268/500 [27]; heart desies HD which contains 1025 feature vectors of 13D, with ration P/N 499/526 [28]; breast cancer BC which contains 569 feature vectors of 30D, with ration P/N 212/347 [29].
The results from D data classification with the four classifiers are presented in Table 2, Table 3 and Table 4. We apply the NN, the LR and the SVM with linear and polynomial degree 2 kernels and denote the classifiers with SVML and SVMP respectively. The classifiers are trained with Original, Original + -PCA-d and Original + -PCA-d datasets which are described in Section 4.2. One may notice that the training with the augmented data improved the classification accuracy if compared with the training by the original data. For the NN and SVMP the highest increase came for the 10-fold (the right column in Table 2) with the single augmentation by 101 distilled vectors. For the LR the highest results come with the double augmentation of and distilled vectors, while for the SVML the highest outcome is obtained with .
On the other hand, the outcomes about Sensitivity and Specificity show high results for the former statistics and twice smaller for the latter. It tells that the augmentations did not balance the classification models as it did in the case of the SL dataset in Table 1.
As mentioned above we conducted distillation-augmentation experiments using the heart disease HD [28] dataset as well. Recall it contains 1025 feature vectors of dimension 13D. Out of them there are 499 positive (P) vectors and 526 negatives (N). The former vectors indicate heart disease, while the latter indicate heathy samples. The four classifiers are trained again with the following types of sets Original, Original + -PCA-d and Original + -PCA-d. The number denotes the number of vectors distilled from the Original training vectors, while denotes the number of vectors distilled from the already distilled vectors. The experimental results, with 90% of the P and 90% of the N randomly selected samples for training, are shown in Table 5, Table 6, Table 7. One may tell from there that the average accuracy increased for all classifiers when they were trained with the augmented set Original + -PCA-d, which contains double distillation. The Sensitivity increased only for the SVMP because it is already at the maximum for the Original training data for the other classifiers. The specificity increased (significantly for LR, SVML and SVMP) for all classifiers if trained with augmented sets that contain single and double distillated data. Another important achievement obtained with the HD dataset and the used distillation-augmentations is that all classifiers are balanced according to Sensitivity/Specificity ratio.
With the help of the heart disease HD [28] dataset we conducted a second set of experiments decreasing the number of randomly selected original vectors for training to 70%. Now the testing vectors are the remaining 30% of the feature vectors. All other activities such as distilations and augmentations are the same as in the case of 90% selected original feature vectors for training. The obtained results of classification with the four chosen classifiers are shown in Table 8, Table 9 and Table 7.
A study of the results in the above tables show that selecting 70% of Original HD feature vectors for training, distillation and augmentation keeps the same trends of increasing the classification statistics as in the case of 90% selection. Moreover, one may observe that with the 70:30% split the Specificity for all classifiers increased when trained with Original+151-PCA-d dataset. In summary, the augmentation of the original training set with distilled vectors from this set increases the classification statistics and makes the classifiers balanced. Only that, the classification statistics in the 70% split are smaller than the classification statistics in the 90% case.
We conducted the final set of experiments with the BC dataset which contains 569 feature vectors of 30D, with ratio P/N 212/347 [29]. For training we randomly selected, ten times, 90% of the P and 90% of the negative samples. Every time, from every selection of training samples, we distilled 101, 151 and 201 vectors with same dimensions as the original training vectors. From every distilled set we distilled 51, 77, and 101 vectors respectively as a second distillation. The experimental results with the Original and the augmented training sets Original + -PCA-d and Original + -PCA-d are reported in Table 11, Table 12, Table 13. Recall with we denote a set of vectors distilled during the first distillation, while denotes set of vectors from the second distillation.
A study of the results show the significant increase of the classification accuracy of the NN for the augmented set Original+101-PCA-d and for the SVML classifier with the augmented set Original+151-PCA-d . In what concern the LR and SVMP the their highest results with the latter augmented set are same as the accuracy of classification with the Original training data set. The reason is that the accuracies of the latter data set are high enough and there is no room for further increase. Same observation and conclusion hold for the Specificity of the NN and the Sensitivities of the LR and SVMP classifiers. The last two statistics exhibit a significant increase for the remaining classifiers when trained with augmented datasets. Moreover, the ration Sensitivity/Specificity is well balanced leading to the highest Balanced Accuracy = (Sensitivity + Specificity)/2.
6. Discussion
The present paper develops a method for vector data augmentation through distillation. The method is based on the principal component analysis (PCA) [14,15]. Its difference with the extension we developed for vector data distillation is that former method maps the set of original vectors to a set of vectors with smaller dimension and same cardinality. On the other hand, the latter one maps the original set of vectors to a set of vectors with same dimensions as the original set but with a smaller cardinality.
The extended PCA for distillation is unproductive if the matrix in Eq. 7 is 1-orthogonal. Note, by definition the matrix is 1-orthogonal if and only if , where is the identity matrix. Therefore, if is 1-orthogonal Eqs. 7 and 8 will map the original training dataset into itself and distilled vectors will not be generated. To remedy the problem, we select strongest vectors, instead of m, as it is shown above Eq. 7.
The novelty of the present study is the development and use the extended PCA for distillation of vectors from given set of vectors, such that the distilled vectors have same dimensions as the original vectors.
The advantage that comes from the proposed novelty is that adding the PCA distilled vectors to the original vectors, from which the former ones were distilled, we receive a new training set. This new set trains a classifier such that its model has statistics higher than the statistics of the model trained only with the original dataset.
We validated the advantage by applying four classifiers NN, LR, SVML, SVMP on four different datasets of vectors SL, D, HD, BC. Every experimental result is produced by the Monte-Carlo 10-fold cross-validation where we randomly select 10 times 10% of the samples for testing while the remaining 90% are used for training. Then the average is taken. For every selection the augmented vectors are distilled from the set of selected training vectors. We conducted a second (nested) distillation from every set of vectors generated during the first distillation. The experimental results are shown in Table 1 to Table 13 where we compare the outcomes after training with original vectors only and the outcomes after training with augmented datasets. It is evident that the latter outcomes are higher and better balanced if compared with the former.
Our future work continues with enlarging classes which have small cardinalities. In certain datasets exsist a big difference between the number of samples in the different classes. Hence, we will conduct distillations from the samples of the class with smallest cardinality and will augment this class to increase its cardinality. For this purpose, we will investigate the number of consecutive distillations which provide meaningful and useful sample vectors.
Author Contributions
Conceptualization, Nikolay Metodiev Sirakov (NMS), Tahsin Shahnewaz (TS), and Arie Nakhmani (AN); methodology, NMS and AN; software, TS and AN; validation, TS; formal analysis, NMS, TS, and AN; data curation, TS; writing- NMS; review and editing-TS, and AN; supervision - NMS and AN. All authors have read and agreed to the published version of the manuscript.
Funding
This research received no external funding.
Data Availability Statement
The link below provides access to a web page, where the reader may find: original datasets of Diabetes, Heart Disease and Breast Cancer; the code for the NN, LR, SVM-linear, SVM-polynomial 2 classifiers to classify the Heart Disease data augmented with 151 PCA distilled vectors; the Excel file that contains the 151 vectors distilled from a selection of 90%, original vectors for training; the Matlab code that generates the 151 distilled vectors. https://github.com/nakhmani/PCA-augmentation/wiki .
Conflicts of Interest
The authors declare no conflict of interest.
Abbreviations
The following abbreviations are used in this manuscript:
| ML | machine learning |
| VF | vector field |
| NN | neural network |
| CNN | convolutional NN |
| LSTM | long short time memory |
| NMTS | minimum number training samples |
| SVM | support vector machine |
| SVML | SVM with linear kernel |
| SVMP | SVM with polynomial kernel second degree |
| LR | logistic regression |
| SL | skin lesion |
| D | diabetes |
| HD | heart disease |
| BC | breast cancer |
| B | benign |
| M | malignant |
| P | positive |
| N | negative |
| TP | true positive |
| TN | true negative |
| FP | false positive |
| FN | false negative |
References
- Leevy, Joffrey L and Khoshgoftaar, Taghi M and Bauder, Richard A and Seliya, Naeem. A survey on addressing high-class imbalance in big data, Journal of Big Data 2018, 5, 1, 1–30. 5, 1.
- Ngo, Long H and Luong, Marie and Sirakov, Nikolay M and Viennet, Emmanuel and Le-Tien, Thuong. Skin lesion image classification using sparse representation in quaternion wavelet domain, Signal, Image and Video Processing 2022, 16, 7, 1721–1729.
- International Skin Imaging Collaboration. SIIM-ISIC 2020 Challenge Dataset. Internat. Skin Imaging Collaboration. Available online; (accessed May, 2023). [CrossRef]
- Baiyang Wang and Diego Klabjan. Regularization for Unsupervised Deep Neural Nets, ArXiv 2016, abs/1608.04426.
- Sajjad, M. and Khan, S. and Muhammad, K. and Wu, W. and Ullah, M. and Baik, S. W. Multi-grade brain tumor classification using deep CNN with extensive data augmentation, Journal of Computational Science 2019, 30, 174–182. [Google Scholar]
- Connor Shorten and Taghi, M. Khoshgoftaar. J of Big Data-Springer, 2019; 6. [Google Scholar] [CrossRef]
- Zhun Zhong, Liang Zheng, Guoliang Kang, Shaozi Li, and Yi Yang. Random erasing data augmentation. In Proc. of the AAAI Conference on Artificial Intelligence (AAAI), 2020.
- Chen, M and Sirakov, N. M. Poisson Equation Solution and its Gradient Vector Field to Geometric Features Detection, In Lecture Notes in Computer Science 11324 D. Fagan et al. Eds.; Springer Nature, 2018, pp. 36-48.
- Sirakov, N.M. , Bowden, A., Chen, M., Ngo, L.H., Luong, M. J of Computational and Applied Mathematics, 2024. [Google Scholar] [CrossRef]
- Igbasanmi, O. and Sirakov, N. M. and Bowden, A. CNN for Efficient Objects Classification with Embedded Vector Fields, Studies in Computational Intelligence F. P. G. Marquez, A. A. Hameed, July 21-22, 2023, 2023, Electronic ISSN 1860–9503, Print ISSN 1860. [Google Scholar]
- Karakanis, S. and Leontidis, G. Lightweight deep learning models for detecting COVID-19 from chest X-ray images, Computers in Biology and Medicine 2021, 130:104181. 130:104181.
- Dvornik, N and Mairal, J. and Schmid, C. Modeling Visual Context is Key to Augmenting Object Detection Datasets, Proc. of the European Conference on Computer Vision (ECCV), 2018, pp. 364-380.
- Sachdeva, N. and McAuley, J. arXiv preprint arXiv:2301.04272, arXiv:2301.04272, 2021, 1-19.
- Hotelling, H. 1933; 24.
- Abdi, H. and Williams, L. J. Wires Computational Statistics, 4: Statistics, 2010, 2, 2010. [Google Scholar] [CrossRef]
- Manal, A. Estimating sample size and confidence interval, Master Thesis, Supervisor N.M.Sirakov, Texas AM University-Commerce, March 2013. [Google Scholar]
- Standard Normal Distribution Table. Available online: https://www.simplypsychology.org/z-table.html (accessed on 17.10.2023).
- Kandhare, P.G. , Ambalavanan, N., Travers, C.P., Carlo, W.A., Sirakov, N.M., Nakhmani, A. Biomedical Signal Processing and Control, Elsevier, 2023; 80. [Google Scholar] [CrossRef]
- P. G. Kandhare, A. Nakhmani, N. M. Sirakov, Deep learning for location prediction on noisy trajectories, Pattern Analysis and Applications, Springer 2023, 26, 107–122. [CrossRef]
- Igbasanmi, O. , Sirakov, N.M., Bowden, A. 21 July 2023; -22. [Google Scholar]
- Vapnik, V. The nature of statistical learning theory. Springer: New York, US, 1995.
- Mete, M. , Sirakov, N.M. Computerized Medical Imaging and Graphics-Elsevier, 2012; 36. [Google Scholar] [CrossRef]
- Meng, X.L. , Rubin, D.B. Maximum likelihood estimation via the ECM algorithm: A general framework, Biometrika, Oxford University Press 1993, 80, 2, pp. 80, 2.
- Gradient Descend Method, Available at: https://www.geeksforgeeks.org/gradient-descent-algorithm-and-its-variants/, (last accessed on 20.10. 2023.
- Argenziano, G. , Soyer, H.P., Giorgi, V De. Dermoscopy: A Tutorial, 2000. [Google Scholar]
- Sirakov, N. M. , Mete, M., Selvaggi, R., Luong, M. New accurate automated melanoma diagnosing systems, in Inter. Conf. Healthcare Informatics (ICHI), Oct 2015, pp. 374–379.
- Kahn, M. Diabetes. UCI Machine Learning Repository. (last accessed on 27.10.2023). [CrossRef]
- Detrano, R. , Jánosi, A., Steinbrunn, W., Pfisterer, M., Schmid, J., Sandhu, S., Guppy, K., Lee, S., Froelicher, R., Heart Disease. UCI Machine Learning Repository, 1998. [CrossRef]
- Street, W. , Wolberg, W., MangasarianBreast, O. Cancer Wisconsin (Diagnostic). UCI Machine Learning Repository, 1995. [CrossRef]
Figure 1.
(a) Training and Validation Loss Curves of the Original Skin Lesion Data (b) Training and Validation Loss Curves of the Augmented Data 1.
Figure 1.
(a) Training and Validation Loss Curves of the Original Skin Lesion Data (b) Training and Validation Loss Curves of the Augmented Data 1.
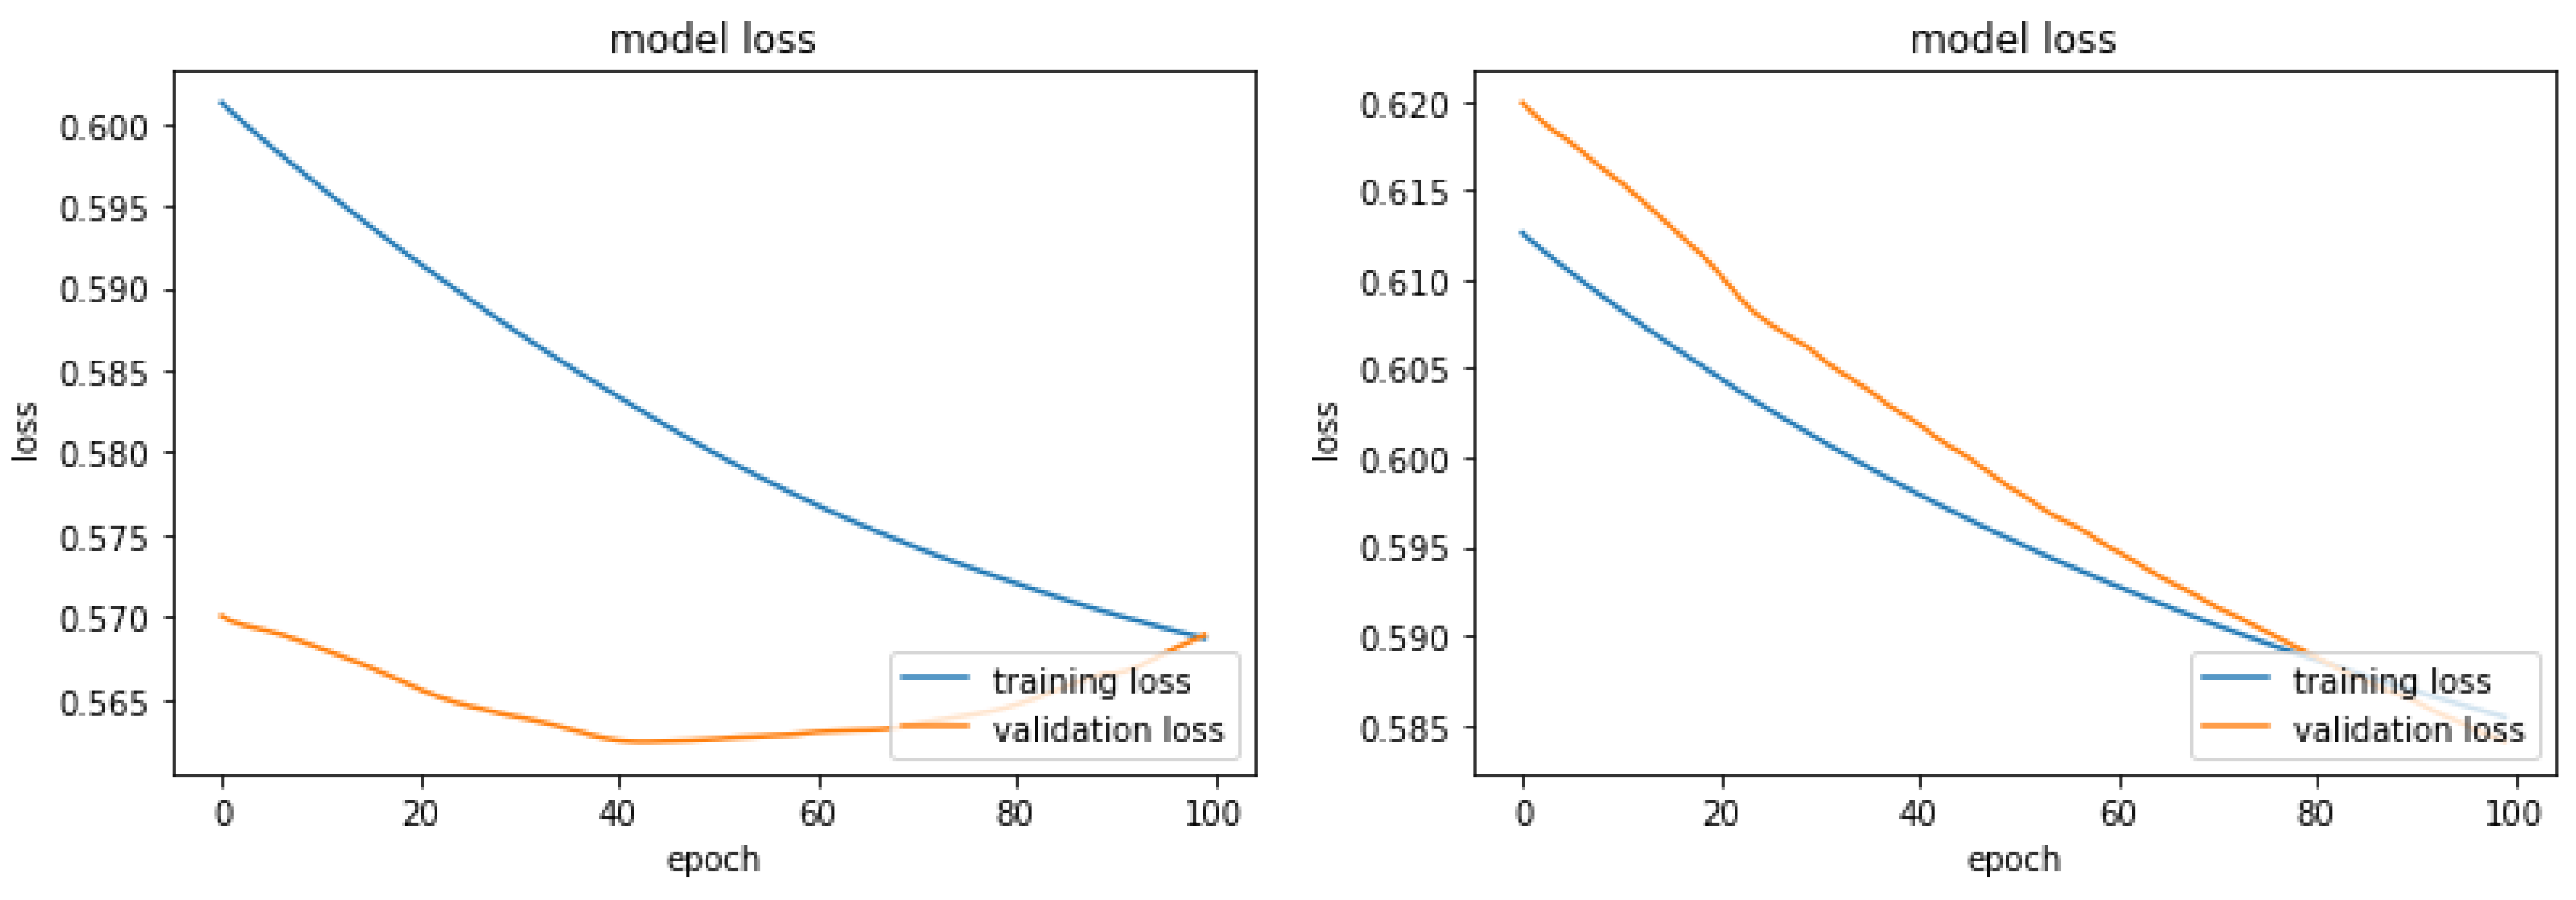

Table 1.
Comparison of Accuracy, Sensitivity, and Specificity (Skin Lesion Data).
| Original skin lesion data | NN | LR | SVML |
|---|---|---|---|
| Accuracy | 88%, 79% | 88%,71% | 88%, 88% |
| Sensitivity | 50% | 33% | 86% |
| Specificity | 100% | 81% | 90% |
| Augmented Data 1 | NN | LR | SVM |
| Accuracy | 94%,75% | 76%,76% | 76%,76% |
| Sensitivity | 100% | 70% | 70% |
| Specificity | 86% | 86% | 86% |
| Augmented Data 2 | NN | LR | SVM |
| Accuracy | 82%, 78% | 82% , 82% | 82% , 82% |
| Sensitivity | 91% | 91% | 91% |
| Specificity | 60% | 60% | 60% |
Table 2.
Comparison of Classification Accuracy of Four Classifiers Trained on 90% of the Original D Data and Various Augmentations, Tested on 10% of the Original D Data. The left column shows the highest result from the 10-fold experiments, while the right one shows their average.
Table 2.
Comparison of Classification Accuracy of Four Classifiers Trained on 90% of the Original D Data and Various Augmentations, Tested on 10% of the Original D Data. The left column shows the highest result from the 10-fold experiments, while the right one shows their average.
| Training Data | NN | LR | SVML | SVMP |
|---|---|---|---|---|
| Original | 76%, 75% | 73%, 70% | 70%, 70% | 70%, 70% |
| Original + 101-PCA-d | 84%,82% | 77%, 77% | 74%,74% | 82% , 82% |
| Original + (101 + 51)-PCA-d | 84%,79% | 78%,78% | 78%,78% | 78% , 78% |
| Original + 151-PCA-d | 78%,77% | 73%,73% | 74%,74% | 80% , 80% |
| Original + (151 + 77)-PCA-d | 82%,79% | 78%,78% | 64%,64% | 67% , 67% |
| Original + 201-PCA-d | 78%,75% | 67%,67% | 73%,73% | 73% , 73% |
| Original + (201 + 101)-PCA-d | 77%,75% | 70%,70% | 70%,70% | 73% , 73% |
Table 3.
Comparison of Classification Sensitivity of Different Classifiers Trained on 90% of the Original D Data and Various Augmentations, Tested on 10% of the Original D Data. The single column shows the average of the 10-fold experiments.
Table 3.
Comparison of Classification Sensitivity of Different Classifiers Trained on 90% of the Original D Data and Various Augmentations, Tested on 10% of the Original D Data. The single column shows the average of the 10-fold experiments.
| Training Data | NN | LR | SVML | SVMP |
|---|---|---|---|---|
| Original | 52% | 56% | 68% | 67% |
| Original + 101-PCA-d | 77% | 48% | 30% | 37% |
| Original + (101 + 51)-PCA-d | 81% | 56% | 26% | 56% |
| Original + 151-PCA-d | 52% | 41% | 30% | 56% |
| Original + (151 + 77)-PCA-d | 74% | 52% | 19% | 22% |
| Original + 201-PCA-d | 44% | 22% | 33% | 33% |
| Original + (201 + 101)-PCA-d | 52% | 41% | 41% | 22% |
Table 4.
Comparison of Classification Specificity of Different Classifiers Trained on 90% of the Original D Data and Various Augmentations, Tested on 10% of the Original D Data. The single column shows the average of the 10-fold experiments.
Table 4.
Comparison of Classification Specificity of Different Classifiers Trained on 90% of the Original D Data and Various Augmentations, Tested on 10% of the Original D Data. The single column shows the average of the 10-fold experiments.
| Training Data | NN | LR | SVML | SVMP |
|---|---|---|---|---|
| Original data | 93% | 83% | 72% | 72% |
| Original + 101-PCA-d | 88% | 92% | 94% | 94% |
| Original + (101 + 51)-PCA-d | 86% | 90% | 88% | 90% |
| Original + 151-PCA-d | 94% | 90% | 98% | 94% |
| Original + (151 + 77)-PCA-d | 86% | 92% | 88% | 92% |
| Original + 201-PCA-d | 96% | 94% | 94% | 94% |
| Original + (201 + 101)-PCA-d | 90% | 86% | 98% | 90% |
Table 5.
Comparison of Classification Accuracy of Different Classifiers Trained on 90% of the Original HD Data and Various Augmentations, Tested on 10% of the Original HD Data. The left column shows the highest result from the 10-fold experiments, while the right one shows their average.
Table 5.
Comparison of Classification Accuracy of Different Classifiers Trained on 90% of the Original HD Data and Various Augmentations, Tested on 10% of the Original HD Data. The left column shows the highest result from the 10-fold experiments, while the right one shows their average.
| Training Data | NN | LR | SVML | SVMP |
|---|---|---|---|---|
| Original | 98%, 95% | 83%, 86% | 83%, 83% | 66%, 83% |
| Original + 101-PCA-d | 97%,96% | 87%, 87% | 88%,88% | 86% , 86% |
| Original + (101 + 51)-PCA-d | 97%,96% | 90%,90% | 91%,91% | 86% , 91% |
| Original + 151-PCA-d | 97%,95% | 86%,86% | 86%,86% | 83% , 84% |
| Original + (151 + 76)-PCA-d | 98%,95% | 83%,83% | 83%,83% | 88% , 83% |
| Original + 201-PCA-d | 90%,89% | 86%,86% | 85%,85% | 83% , 83% |
| Original + (201 + 101)-PCA-d | 91%,90% | 83%,83% | 83%,83% | 83% , 83% |
Table 6.
Comparison of Classification Sensitivity of Different Classifiers Trained on 90% of the Original HD Data and Various Augmentations, Tested on 10% of the Original HD Data. The single column shows the average of the 10-fold experiments.
Table 6.
Comparison of Classification Sensitivity of Different Classifiers Trained on 90% of the Original HD Data and Various Augmentations, Tested on 10% of the Original HD Data. The single column shows the average of the 10-fold experiments.
| Training Data | NN | LR | SVML | SVMP |
|---|---|---|---|---|
| Original | 100% | 96% | 98% | 69% |
| Original + 101-PCA-d | 100% | 94% | 94% | 94% |
| Original + (101 + 51)-PCA-d | 96% | 94% | 96% | 85% |
| Original + 151-PCA-d | 100% | 85% | 89% | 87% |
| Original + (151 + 76)-PCA-d | 98% | 85% | 83% | 87% |
| Original + 201-PCA-d | 100% | 96% | 96% | 98% |
| Original + (201 + 101)-PCA-d | 91% | 87% | 92% | 89% |
Table 7.
Comparison of Classification Specificity of Different Classifiers Trained on 90% of the Original HD Data and Various Augmentations, Tested on 10% of the Original HD Data. The single column shows the average of the 10-fold experiments.
Table 7.
Comparison of Classification Specificity of Different Classifiers Trained on 90% of the Original HD Data and Various Augmentations, Tested on 10% of the Original HD Data. The single column shows the average of the 10-fold experiments.
| Training Data | NN | LR | SVML | SVMP |
|---|---|---|---|---|
| Original | 96% | 79% | 71% | 64% |
| Original + 101-PCA-d | 94% | 80% | 82% | 78% |
| Original + (101 + 51)-PCA-d | 98% | 86% | 86% | 88% |
| Original + 151-PCA-d | 94% | 88% | 84% | 78% |
| Original + (151 + 77)-PCA-d | 98% | 80% | 84% | 90% |
| Original + 201-PCA-d | 86% | 76% | 74% | 68% |
| Original + (201 + 101)-PCA-d | 92% | 76% | 74% | 78% |
Table 8.
Comparison of Classification Accuracy of Different Classifiers Trained on 70% of the Original HD Data and Various Augmentations, Tested on 30% of the Original HD Data. The left column shows the highest result from the 10-fold experiments, while the right one shows their average.
Table 8.
Comparison of Classification Accuracy of Different Classifiers Trained on 70% of the Original HD Data and Various Augmentations, Tested on 30% of the Original HD Data. The left column shows the highest result from the 10-fold experiments, while the right one shows their average.
| Training Data | NN | LR | SVML | SVMP |
|---|---|---|---|---|
| Original | 94%, 92% | 84%, 84% | 85%, 81% | 69%, 81% |
| Original + 101-PCA-d | 89%,86% | 82%, 82% | 82%, 82% | 82%, 82% |
| Original + (101 + 51)-PCA-d | 92%,91% | 80%,80% | 80%,80% | 86% , 86% |
| Original + 151-PCA-d | 94%,93% | 85%,85% | 85%,85% | 85% , 85% |
| Original + (151 + 76)-PCA-d | 90%,88% | 84%,84% | 83%,83% | 82% , 82% |
| Original + 201-PCA-d | 92%,91% | 83%,83% | 83%,83% | 87% , 87% |
| Original + (201 + 101)-PCA-d | 92%,90% | 83%,83% | 84%,84% | 82% , 82% |
Table 9.
Comparison of Classification Sensitivity of Different Classifiers Trained on 70% of the Original HD Data and Various Augmentations, Tested on 30% of the Original HD Data. The single column shows the average of the 10-fold experiments.
Table 9.
Comparison of Classification Sensitivity of Different Classifiers Trained on 70% of the Original HD Data and Various Augmentations, Tested on 30% of the Original HD Data. The single column shows the average of the 10-fold experiments.
| Training Data | NN | LR | SVML | SVMP |
|---|---|---|---|---|
| Original | 92% | 93% | 56% | 76% |
| Original + 101-PCA-d | 93% | 89% | 91% | 89% |
| Original + (101 + 51)-PCA-d | 96% | 88% | 90% | 90% |
| Original + 151-PCA-d | 97% | 94% | 95% | 96% |
| Original + (151 + 76)-PCA-d | 91% | 92% | 93% | 93% |
| Original + 201-PCA-d | 93% | 87% | 86% | 91% |
| Original + (201 + 101)-PCA-d | 94% | 92% | 94% | 89% |
Table 10.
Comparison of Classification Specificity of Different Classifiers Trained on 70% of the Original HD Data and Various Augmentations, Tested on 30% of the Original HD Data. The single column shows the average of the 10-fold experiments.
Table 10.
Comparison of Classification Specificity of Different Classifiers Trained on 70% of the Original HD Data and Various Augmentations, Tested on 30% of the Original HD Data. The single column shows the average of the 10-fold experiments.
| Training Data | NN | LR | SVML | SVMP |
|---|---|---|---|---|
| Original | 96% | 82% | 36% | 63% |
| Original + 101-PCA-d | 85% | 74% | 73% | 75% |
| Original + (101 + 51)-PCA-d | 88% | 71% | 81% | 81% |
| Original + 151-PCA-d | 91% | 77% | 73% | 74% |
| Original + (151 + 76)-PCA-d | 88% | 76% | 72% | 71% |
| Original + 201-PCA-d | 90% | 79% | 81% | 83% |
| Original + (201 + 101)-PCA-d | 91% | 73% | 74% | 75% |
Table 11.
Comparison of Classification Accuracy of Different Classifiers Trained on 90% of the Original BC Data and Various Augmentations, Tested on 10% of the Original BC Data. The left column shows the highest result from the 10-fold experiments, while the right one shows their average.
Table 11.
Comparison of Classification Accuracy of Different Classifiers Trained on 90% of the Original BC Data and Various Augmentations, Tested on 10% of the Original BC Data. The left column shows the highest result from the 10-fold experiments, while the right one shows their average.
| Training Data | NN | LR | SVML | SVMP |
|---|---|---|---|---|
| Original | 89%, 87% | 100%, 95% | 65%, 65% | 98%, 98% |
| Original + 101-PCA-d | 100%,97% | 84%, 84% | 88%,88% | 86% , 86% |
| Original + (101 + 51)-PCA-d | 93%,90% | 84%,84% | 86%,86% | 88% , 88% |
| Original + 151-PCA-d | 90%,81% | 95%,95% | 98%,98% | 98% , 98% |
| Original + (151 + 77)-PCA-d | 95%,95% | 81%,81% | 86%,86% | 90% , 90% |
| Original + 201-PCA-d | 97%,94% | 95%,95% | 97%,97% | 97% , 97% |
| Original + (201 + 101)-PCA-d | 88%,84% | 93%,93% | 97%,97% | 93% , 93% |
Table 12.
Comparison of Classification Sensitivity of Different Classifiers Trained on 90% of the Original BC Data and Various Augmentations, Tested on 10% of the Original BC Data. The single column shows the average of the 10-fold experiments.
Table 12.
Comparison of Classification Sensitivity of Different Classifiers Trained on 90% of the Original BC Data and Various Augmentations, Tested on 10% of the Original BC Data. The single column shows the average of the 10-fold experiments.
| Training Data | NN | LR | SVML | SVMP |
|---|---|---|---|---|
| Original | 100% | 79% | 47% | 94% |
| Original + 101-PCA-d | 100% | 100% | 100% | 100% |
| Original + (101 + 51)-PCA-d | 100% | 95% | 95% | 95% |
| Original + 151-PCA-d | 100% | 100% | 100% | 100% |
| Original + (151 + 76)-PCA-d | 100% | 100% | 100% | 100% |
| Original + 201-PCA-d | 100% | 95% | 95% | 95% |
| Original + (201 + 101)-PCA-d | 100% | 100% | 100% | 100% |
Table 13.
Comparison of Classification Specificity of Different Classifiers Trained on 90% of the Original BC Data and Various Augmentations, Tested on 10% of the Original BC Data. The single column shows the average of the 10-fold experiments.
Table 13.
Comparison of Classification Specificity of Different Classifiers Trained on 90% of the Original BC Data and Various Augmentations, Tested on 10% of the Original BC Data. The single column shows the average of the 10-fold experiments.
| Training Data | NN | LR | SVML | SVMP |
|---|---|---|---|---|
| Original | 83% | 100% | 73% | 100% |
| Original + 101-PCA-d | 100% | 75% | 81% | 78% |
| Original + (101 + 51)-PCA-d | 89% | 77% | 80% | 83% |
| Original + 151-PCA-d | 83% | 92% | 97% | 97% |
| Original + (151 + 76)-PCA-d | 94% | 69% | 78% | 83% |
| Original + 201-PCA-d | 94% | 94% | 97% | 97% |
| Original + (201 + 101)-PCA-d | 81% | 89% | 94% | 89% |
Disclaimer/Publisher’s Note: The statements, opinions and data contained in all publications are solely those of the individual author(s) and contributor(s) and not of MDPI and/or the editor(s). MDPI and/or the editor(s) disclaim responsibility for any injury to people or property resulting from any ideas, methods, instructions or products referred to in the content. |
© 2023 by the authors. Licensee MDPI, Basel, Switzerland. This article is an open access article distributed under the terms and conditions of the Creative Commons Attribution (CC BY) license (http://creativecommons.org/licenses/by/4.0/).
Copyright: This open access article is published under a Creative Commons CC BY 4.0 license, which permit the free download, distribution, and reuse, provided that the author and preprint are cited in any reuse.


