
Submitted:
09 December 2023
Posted:
12 December 2023
You are already at the latest version
Abstract
The cultivation of pea pods spans across various regions and climates with a global production of around 20 million tons. The pea peel wastes, which make up 30–40% of the total weight of the peas, are freely available in large quantities. The biomass used was characterized via ultimate, proximate, and structural analysis obtaining a 20,2 %w of cellulose and 17,4 %w of hemicellulose which via valorization processes can be transformed into platform chemicals. Hydrothermal valorization presents itself as a clean form of treatment of said wastes, ranging from 120 – 180 ºC (LHW) to 180 to 260 ºC (HTC). The use of LHW can lead to the production of sugars (up to 70%w yield) and levulinic acid (4 %w yield) while the use of HTC leads to Formic acid (40 %w) and levulinic acid (4 %w yield). The use of LHW for longer times favors the production of HMF and Furfural. The use of homogeneous catalysts (H2SO4, CH3COOH, KOH and NaHCO3) was implemented and their selectivity described. Solid fractions of LHW and HTC were characterized via FTIR and elemental analysis and the change in their structure described as they shift from biomass to biochar. Optimal conditions for each platform chemical were reported for best utilization of the peapod waste.
Keywords:
Peapods
; hydrothermal valorization
; platform chemicals
; catalysts
; HTC
; LHW
1. Introduction
Thermochemical processes such as combustion, pyrolysis, torrefaction, gasification, liquid hot water extraction (LHW), hydrothermal carbonization (HTC), liquefaction (HTL), or gasification (HTG) are one of the most common methods used to chemically transform biomass into energy and chemical products by using heat in biorefineries [1] Among all thermochemical processes, HTC has gained considerable attention due to its inherent advantages such as the use of water as a reaction medium, which explains why there is no need to dry the biomass at the beginning of processing, reaction times in the range of 5 min to several hours, lower reaction temperatures (in the range 180 – 280 °C) compared to other thermochemical processes, which also means that is a safer process to conduct experimentally, and the high yield obtention of carbonaceous solids [2].
HTC also known as hydrous pyrolysis, is carried out by heating a mixture of biomass with a specific ratio of water under subcritical conditions to potentially make a practical variety of products such as hydrochar, high carbon content products, value-added products that varies between platform chemicals, fuels, carbon nanospheres, low-cost adsorbents, and soil amenders [3,4]. This process has not been commercialized yet because there are several challenges that must be overcome before, pointing up the main challenge, which is the development of a feeding system that feeds the mixture of biomass with water against the high pressure of the reactor. The most common biomasses used for HTC processes are the organic fraction of municipal solid waste (MSW), sewage sludge, agro-industrial waste, and nontraditional feedstock sources such as wet animal manures, human waste, sewage sludges, in addition to aquaculture and algal residues [4,5].
The HTC process is commonly used as a pretreatment stage integrated with other thermochemical processes, which, in continuous operation, would promote the development of biorefineries [6]. Biorefinery is defined as the facility, plant, or cluster of facilities that integrates sustainable biomass conversion processes to produce value-added marketable products like food, feed, materials, chemicals, and energy such as fuels, power, or heat [7,8]. The aim of the technological process in biorefinery is to jointly apply thermochemical, biochemical, mechanical/physical, and chemical processes to depolymerize and deoxygenate the biomass components, in this case, the pea pod waste so value-added products are made by a biorefinery approach [9].
Liquid hot water pretreatment, also known as autohydrolysis, is a method used to improve the enzymatic hydrolysis of biomass, leading to the production of free sugars. This process involves treating the biomass with hot water at elevated pressures, which helps to break down the hemicellulose and reduce the recalcitrance of the material. The use of liquid hot water pretreatment has been studied for various types of biomasses, including sugarcane bagasse, poplar, and Italian green pepper waste, to valorize these materials for the production of biofuels and other value-added chemicals [10,11]. The effectiveness of this pretreatment method has been attributed to its ability to enhance the saccharification of polysaccharides, particularly cellulose, into glucose, making it a promising approach for the efficient utilization of biomass resources [11].
Pea pod production plays a crucial role worldwide, supplying a significant portion of the global vegetable market and contributing to the sustenance of millions of people. Peas are one of the most cultivated legumes, renowned for their nutritional value, sweet flavor, and versatility in culinary applications. The cultivation of pea pods spans across various regions and climates, making them accessible to both developed and developing countries with a global production of around 20 million tons [11]. Peas are rich in essential vitamins, minerals, and dietary fiber, promoting good health and supporting balanced diets [12]. In the other hand, pea wastes produced in large quantities during industrial processing have a negative impact on the environment and can release hazardous gases [13]. The pea peel wastes, which make up 30–40% of the total weight of the peas, are freely available in large quantities [13]. Consequently, a variety of techniques are needed to transform these wastes into valuable goods with high nutritional value. Pea pod waste has been used for cellulolytic enzyme production, as well as a feed for goat bucks [14], ruminants [15], and as a source of dietary fiber [16], [17]. From a hydrothermal point of view, the valorization of pea pods has been researched, obtaining monosaccharides and polysaccharides [18], polyphenols [19,20], and hydrochar [21].
The scope of this paper is to analyze the different processes that take place in hydrothermal valorization of pea pods by modifying variables such as time, temperature and catalysts, to finally describe the behavior of the biomass by adjusting it to a kinetic model and focusing on the byproducts of best economic and energetic valorization.
2. Materials and Methods
2.1. Characterization
2.1.1. Proximate Analysis
2.1.1.1. Moisture
Report NREL/TP-510-42621 was used. 1 gram of biomass (milled) was put in a crucible and dried at 105ºC until constant weight. Equation 1 was used for calculating the moisture. For statistical proposes this was done by triplicate.
2.1.1.2. Ash
Report NREL/TP-510-42622 was followed. 1 gram of both of pea pod was weighted, put in a crucible, and inserted in a muffle furnace at 575 °C for 180 minutes. It was allowed to cool, and it was weighted. For statistical proposes this was done by triplicate and equations 2 was used.
2.1.1.3. Volatile Matter
Report ISO-18123-2015 was used as a guide. 1 gram of dried (milled) pea pod was added in a crucible, then a ramp to 900ºc in the muffle furnace was programmed and the biomass was introduced for 7 minutes. The weight loss equals the volatile matter content and is calculated with the equation 3.
2.1.1.4. Fixed Carbon
According to ASTM D 3172 – 89, the fixed carbon is a mathematical value corresponding to equation 4.
2.1.2. Ultimate Analysis (C H O N Analysis)
Report NREL/TP-510-42620 was used as a guide alongside a Thermo Scientific FLASH 2000 Series Organic Elemental Analyzer.
2.1.3. Structural Analysis (Lignin, Hemicellulose, and Cellulose)
The process used is reported in the procedure in Methods for Dietary Fiber, Neutral Detergent Fiber, and Nonstarch Polysaccharides in Relation to Animal Nutrition. The fiber in neutral detergent, fiber in acid detergent and lignin were measured.
2.2. Hydrothermal essays
2.2.1. Liquid hot water (Temperatures from 120-180 ºC)
A 100 mL batch reactor was set to different temperatures (ranging from 120°C to 180°C) and times (1-5 hours) with 5 grams of peapods and 45 grams of water. Autogenous pressure was generated. Then, the reactor was cooled, and the samples were filtered in order to separate the liquid and solid phases. The solid phase was washed and later analyzed via elemental analysis, and infrared spectroscopy. The pH and conductivity of the liquid phase were measured as a preliminary follow up. Finally, the liquid samples were sent to an HPLC-RI (High-Performance Liquid Chromatography with refractive index detection) for the identification and quantification of the present chemical species.
The set of experiments are presented in Table 1.
2.2.2. Hydrothermal carbonization (180-260 ºC).
A 500 mL batch reactor was set to different temperatures (ranging from 180 to 260 ºC) and times (1-5 hours) with 10 grams of peapods and 90 grams of water (Table 2). Autogenous pressure was generated. Then, the reactor was cooled, and the samples were filtered to separate the liquid and solid phases and they were characterized as previously done in LHW.
2.3. Analysis of the solid phase
2.3.1. Infrared spectroscopy -ATR
The solid phase was cleaned with water, ethanol, and acetone, dried at 115 ºC for 30 minutes and analyzed by ATR on a Nicolet iS10 Spectrometer Thermo Fisher Scientific.
2.3.2. Elemental analysis
The same process implemented for the ultimate essay of the biomass was used for all the solid phases produced in each hydrothermal essay.
2.4. HPLC Quantification and Characterization
The HPLC-RI method development and optimization involve a series of experiments to optimize parameters such as column choice, mobile phase composition, flow rate, and temperature. Validation ensures accuracy, precision, specificity, and robustness by testing the method's performance using appropriate standards and samples. The final method consisted of a mobile phase of 0.005 M H2SO4, a flow rate of 0.5 mL/min, and a Shodex SH1821 column set in a 60 ºC oven. It can be a valuable tool for the separation and quantification of compounds in various applications, providing reliable and accurate analytical results. A Hitachi Elite LaChrom chromatograph coupled to a Hitachi L-2490 refractive index detector at 40 ºC was used. In this case, the idea is to separate the most expected by-products in the valorization of cellulosic and hemicellulosic biomass. These include glucose and xylose, highly polar monosaccharide sugars (with six and five carbon atoms respectably), a simple organic acid, levulinic acid, HMF (5-Hydroxymethylfurfural), and furfural. Glucose and xylose are polar sugars that elute early in the chromatogram. Formic acid and levulinic acid are polar acids that elute later. HMF, less polar than acids but more polar than furfural, elutes next, and furfural, the least polar, elutes last. These compounds have distinct chemical properties, making HPLC an excellent choice for their separation. In the Figure 1, the separation of the standards is shown. Sugars are not completely separated so the reports given in this research the reports will be given as “sugars” not individually. Table 3 shows the retention times of the standards.
2.5. Condition optimization
2.5.1. Use of catalysts
In order to optimize the operation conditions, the implementation of homogeneous catalysts was suggested. Homogeneous acid and basic catalysts play a significant role in the hydrothermal valorization of biomass. In the hydrothermal liquefaction process, inorganic acid catalysts such as H2SO4 are extensively applied to facilitate the conversion of biomass into valuable products, including aviation fuel precursors [22]. Additionally, homogeneous basic catalysts, such as carbonates and hydroxides of alkali metals, have been studied for their role in the valorization of biomass feedstocks, including red macroalgae and livestock manure, to enhance biocrude oil and hydrochar production [23,24]. These catalysts promote the depolymerization and upgrading of biomass components under hydrothermal conditions, offering a sustainable approach to convert biomass into biofuels and chemicals [25]. In this research, solutions of H2SO4 0,02 M, CH3COOH 0,2M, KOH 0,02M and NaHCO3 0,2M were used instead of water in the biomass/water ratio 1:10 to improve the yield and selectivity of the biomass conversion.
2.5.2. Optimization based on platform chemicals.
After quantifying the platform chemicals in different hydrothermal ranges, times and using catalysts, a report of the conditions that produce an increase on the yield of each PC is given.
2.6. Kinetic overview of hydrolysis in LHW.
A preliminary analysis of the kinetics of the lignocellulosic biomass hydrolysis to sugars is presented via mathematical and graphical treatment of the data in order to determine the order of the reaction of each of the hydrothermal processes.
3. Results
3.1. Characterization of the biomass
3.1.1. Proximate analysis
The proximal essay shows the initial characteristics of the biomass (Table 4). Understanding the composition of biomass, including moisture content, ashes, volatile matter, and fixed carbon, is crucial for its valorization, particularly in hydrothermal processes. These components play a significant role in the formation of thermal products and the overall efficiency of the process. The presence of moisture in biomass affects the hydrothermal liquefaction process. Moisture content influences the heat capacity, thermal conductivity, and swelling behavior of biomass, which in turn affects the efficiency of the process and the properties of the final products [27]. Ashes are inorganic residues formed from the mineral components of biomass, such as Ca, K, Si, Mg, Al, S, Fe, P, Cl, and Na, as well as some trace elements like Mn and Ti [27]. The ash content in biomass can vary from less than 1%w for wood to as much as 12%w for straw and bagasse (sugar cane residue) [28]. The presence of ash affects the corrosiveness of the reaction mixture and the overall efficiency of the process. Volatile matter refers to the fraction of biomass that evaporates during the hydrothermal process. This fraction includes light and heavy compounds that may contribute to the formation of thermal products or be responsible for undesired reactions [28]. The composition of volatile matter can influence the yield and quality of the final products. Fixed carbon is the fraction of biomass that remains after the hydrothermal process. It consists of carbon-rich compounds, such as char, which can contribute to the formation of bio-oil or other value-added products [28]. The fixed carbon content can affect the efficiency of the process and the properties of the final products. By understanding the composition of biomass and optimizing the hydrothermal process conditions, it is possible to maximize the yield of valuable products, such as bio-oil, chemical platforms, or biochar, while minimizing the formation of undesired compounds.
The two sets of results show some differences in the volatile matter and fixed carbon content, with the second set of results showing higher values for both. The ash content is also slightly lower in the second set of results. The moisture content is similar in both sets of results. These differences in composition could impact the yield and quality of thermal products obtained from the hydrothermal valorization of pea pods and are caused by changes in the production of the peapods, such as weather, soil, and crop variety [29]. Understanding the composition of biomass is crucial for optimizing the valorization process and developing value-added products from biomass.
3.1.2. Ultimate analysis
The ultimate analysis of the peapod waste is presented in Table 5, with said results the O/C, H/C and C:N ratios are obtained. The O/C, H/C, and C:N ratios are important parameters in the characterization of organic compounds, including biomass and coal. The H/C ratio is a measure of the degree of saturation of a compound, with higher values indicating greater saturation. The O/C ratio reflects the oxygen content relative to carbon, and the N/C ratio indicates the nitrogen content relative to carbon. These ratios are commonly used in the Van Krevelen diagram (Figure 2), which is a graphical representation of the O/C versus H/C ratios of organic compounds [30]. This diagram is useful for classifying and comparing the composition of organic matter, including biomass and coal, and for understanding their origin and evolution. For example, in the case of coal, the H/C ratio shows a sharp decline in bituminous coals and anthracites, reflecting increased aromatization of the lignin structure during coalification. In the context of biomass, the O/C ratio is of great importance, as a high O/C ratio results in a low bulk energy density, highlighting the need to lower the oxygen content for efficient energy conversion [31]. Therefore, these ratios are crucial for understanding the properties and behavior of organic compounds, and for optimizing their utilization in various applications.
Figure 2 shows the characterization of the peapod waste as biomass and, its C/N ratio shows that it is appropriate to be used for processes of transformation using microorganism due to the ratio being higher than 24, the ideal microbial diet, and making it a slower relative decomposition rate. When comparing the results to other found in previous paper, the biggest different is the lower C/N ratio in previous research, and the higher O/C ratio, both due to the nature of the peapod.
3.1.3. Structural analysis
Table 6 presents de percentages obtained for hemicellulose, cellulose and lignin which are the main structures which will be later hydrolyzed into sugars and other platform chemicals (PC). In both the quantification done in this paper and the one from other researchers, hemicellulose and cellulose have a similar ratio, being cellulose the most significant one. On the other hand, the amount of lignin is low, which is a positive aspect for the obtention of sugar since lignin is known to be an inhibitor of sugar hydrolysis of hemicellulose and cellulose [32]. The presence of lignin in biomass can strongly interfere with the yields of sugars and furans produced from raw materials, while the delignified biomass provides significant improvement of product yields. Knowing the principal lignocellulosic structures present in the peapod waste, it is expected that valorization products from hemicellulose and cellulose will be obtained, such as HMF, Furfural, levulinic acid, sugars, and formic acid.
3.2. Valorization via Liquid hot water (Temperatures from 120-180 ºC)
Preliminarily, the acid and sugar production in the liquid phase was monitored with pH and conductivity measurements in reactions performed for 1 hour at different temperatures in the LHW range. Figure 3 shows the results obtained. Higher temperatures resulted in greater pH values, which, in addition to higher conductivity measurements, were correlated to the acid production but without a mayor change of its production.
Then, the reaction time was varied at the temperature of 180 °C to see if it is a crucial factor to consider. The results are shown in Figure 4. The conductivity measurements, which revealed more ions in the liquid phase at longer reaction periods, were consistent with the pH measurements, which showed that higher reaction times produced more acids than lower reaction times. Conversely, a reaction time of 1r produced the maximum amount of sugars as they are spicies that do not contribute to lower the pH or the amount of ions in solution.
3.2.1. Quantification of liquid fraction
The liquid phase analysis and quantification of the corresponding components were carried out with a HPLC-RI. As shown in Table 7 and Figure 5, the sugar yield varied between 36,9% and 70,0%w when reactions of 1 hour at 120 °C and 180 °C were performed, respectively, showing that the more energy provided via heat to the system thransforms in a higher hidrolysis of the lignocelullosic structures. Moreover, levulinic acid production was achieved only at the higher reaction temperatures, 170 °C and 180 °C. There wasn’t enough energy in the system to achieve the transformation of sugars in to other molecules, which later will be seen, can be achieve by longer reaction times, higher temperature or the use of catalysts.

Table 7.
Quantification of platform chemicals via LHW at 1 hour.
| Temperature (ºC) | Time (hours) | Concentration PC (g/L) | Yield*(%w) | |
| Sugars | Levulinic acid | |||
| 120 | 1 | 18,098 | 36,903 | |
| 130 | 1 | 18,258 | 37,228 | |
| 140 | 1 | 18,445 | 37,610 | |
| 150 | 1 | 27,594 | 56,265 | |
| 160 | 1 | 26,004 | 53,023 | |
| 170 | 1 | 30,450 | 0,336 | 62,089 |
| 180 | 1 | 34,818 | 0,577 | 70,001 |
*Based in lignocelullosic structure.
Figure 5.
Obtention of platform chemicals via LHW for 1 hour.
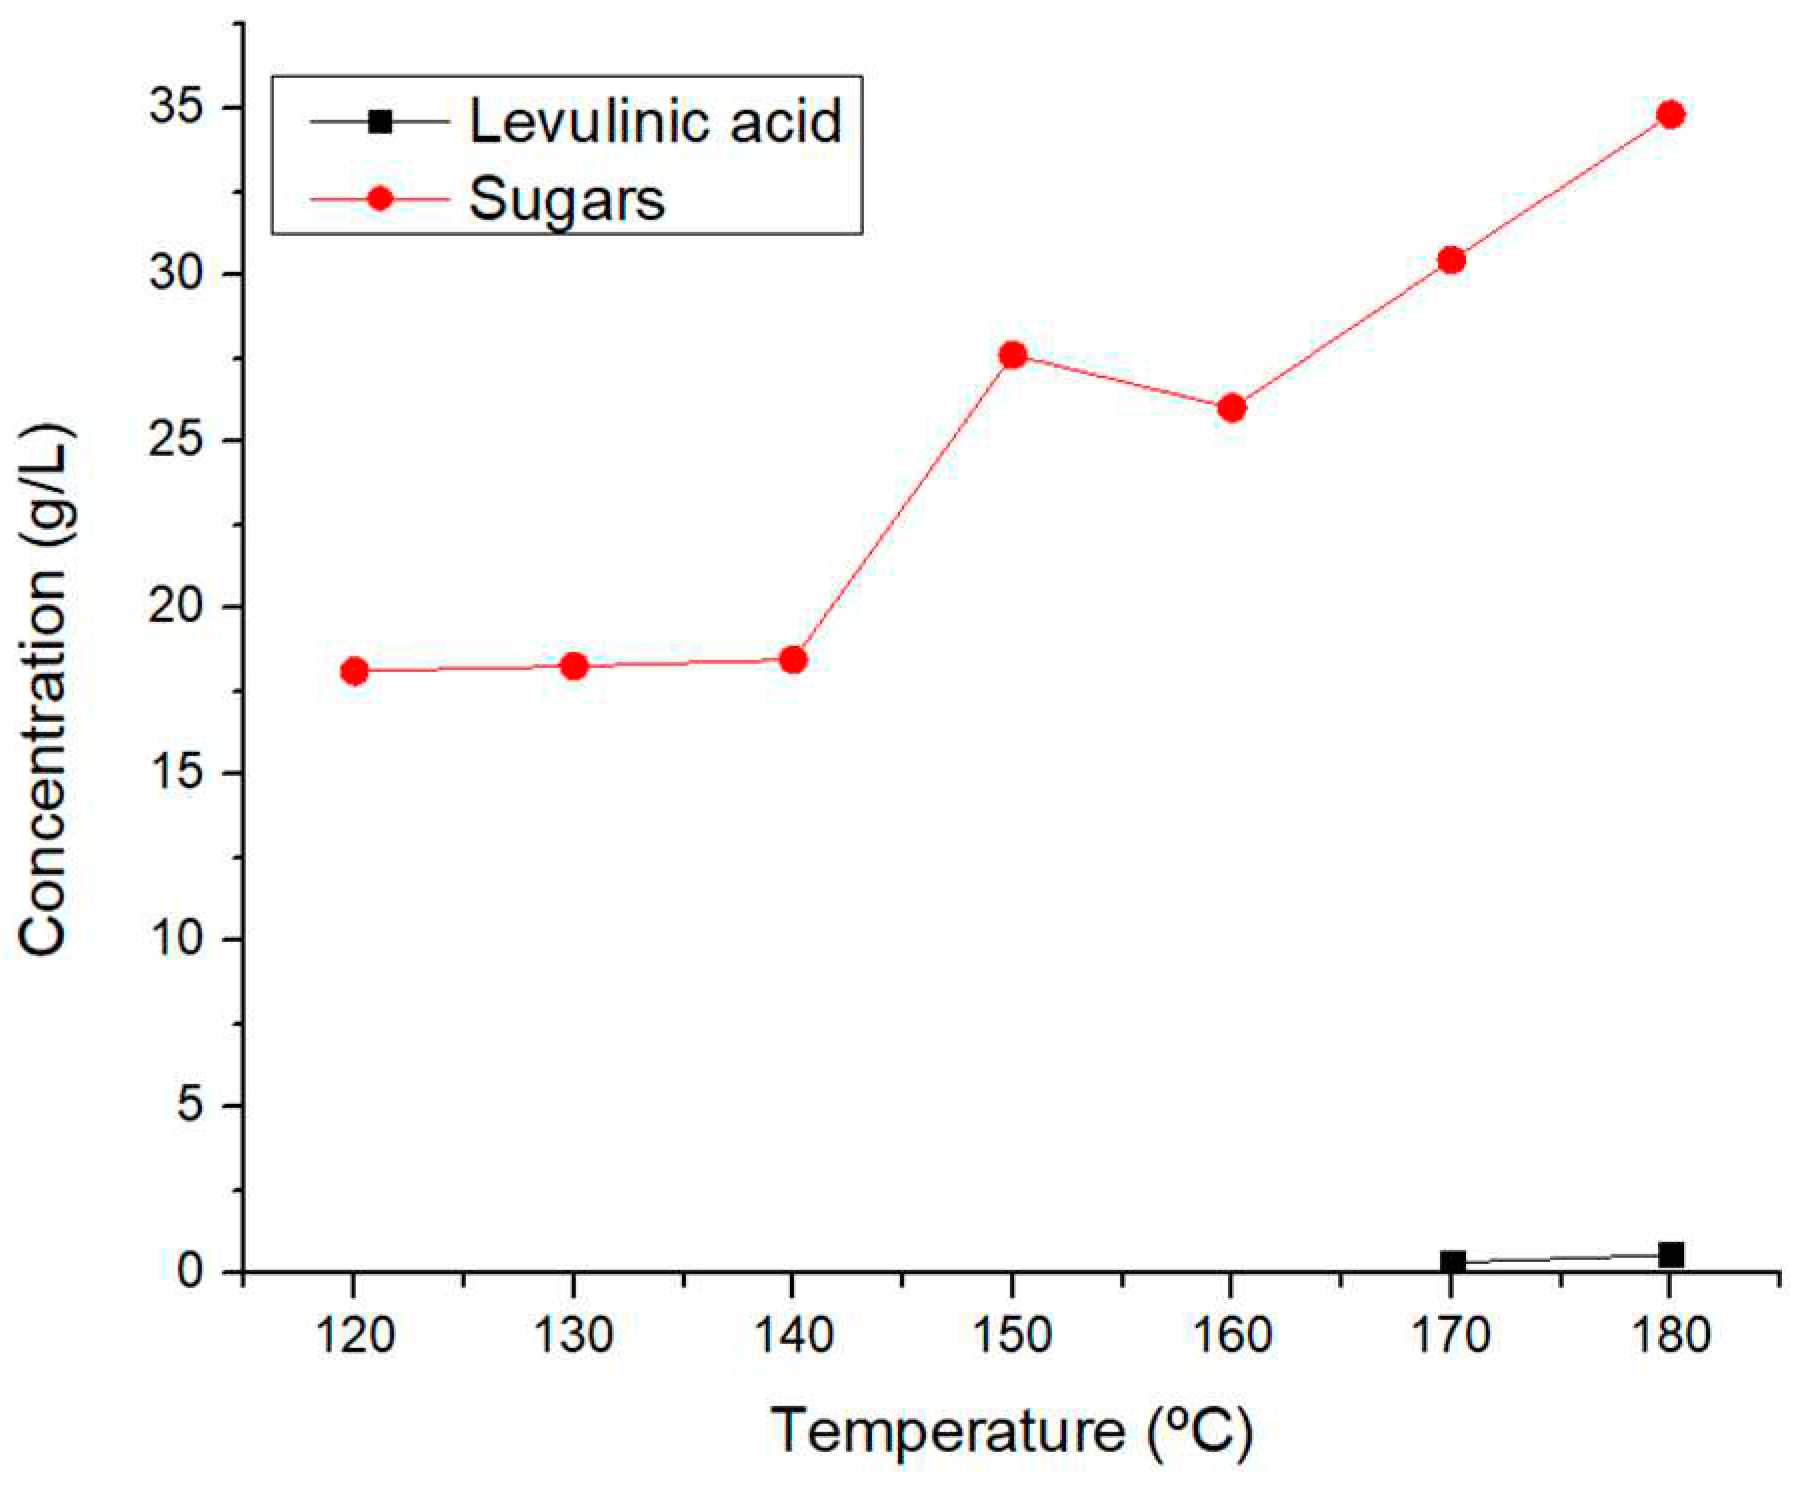
Table 8.
Quantification and yields of platform chemicals via LHW (180 ºC) for 1-4 hours.
| T (ºC) | Time (hours) | Concentration PC (g/L) | Yield (%w)* | ||||
| Sugars | Levulinic acid | Formic acid | HMF | Furfural | |||
| 180 | 1 | 34,818 | 0,577 | 70,001 | |||
| 180 | 2 | 26,341 | 1,063 | 2,392 | 0,299 | 62,284 | |
| 180 | 3 | 15,539 | 1,120 | 4,067 | 0,757 | 0,632 | 51,528 |
| 180 | 4 | 1,250 | 1,244 | 8,566 | 1,032 | 1,249 | 42,838 |
*Based in lignocelullosic structure.
Figure 6 shows that PC is obtained by the reaction of sugars from the lignocellulosic biomass, previously broken, and subsequent dehydration reactions of the sugars. The dehydration reactions, in the first place, can lead to products such as HMF or furfural depending on whether the sugar that underwent dehydration was glucose or xylose, respectively. The subsequent dehydration reactions lead to products such as levulinic and formic acid.
3.2.2. Kinetics of hydrolysis
A preliminary overview of the kinetics of the hydrolysis of the lignocelullosic biomass into sugars is presented in Figure 7, where the concentration of sugars vs the time of reaction is graphed as well as some mathematical transformation to propose a seudo order of reaction. In this, it can be seen that the transformation that best asimilates to a line is that of Order 1, which is a common model used to describe the enzymatic hydrolysis of lignocellulosic biomass into sugars. Studies have shown that this model accurately describes the hydrolysis of various biomasses under different pre-treatment conditions, indicating that the hydrolysis reaction appears to follow first-order kinetics. For example, the hydrolysis of cellulose and formation of glucose decomposition products catalyzed by formic acid, as well as the acid-catalyzed hydrolysis of cellobiose in an ionic liquid, have been shown to follow pseudo first-order kinetics.
3.2.3. Characterization of solid fraction
3.2.3.1. Infrared spectroscopy
On the other hand, the solid fraction was analyzed with FTIR spectroscopy. Figure 8 shows the comparison of the spectra acquired after 1 hour of reaction time at 120 °C. 160 °C, and 180 °C, and the biomas without reaction. The absorption bands correspond to functional groups of O-H (3284 – 3308 cm-1), C-H stretching of aliphatic groups (2919 – 2923 and 2853 cm-1), C=O (1705 cm-1), C=C of aromatic compounds (1608 – 1622 and 1516 cm-1), and C-O-C, C-O-H, and C-O vibrations predominantly of groups present in cellulose, hemicellulose and lignin (1500 – 1350 and 1300 – 1150 cm-1). The differences between the band absorption are related to the the concentration.
Moreover, the solid phase of the reaction at 180 °C at diferent reaction times was analyzed and the results are shown in Figure 9. It shows that longer reaction times can decrease the transmitance of the band asociated with cellulose, hemicellulose and lignin (1000-1500 cm-1), confirming that at higher reaction times, those structures are broken in order to form sugars.
3.2.3.2. Elemental analysis
In order to track the changes in the elemental composition of the biomass, the elemental analysis of the solid fractions obtained via LHW is presented in Table 9. It can be seen that there is not a significant change in the O/C and H/C ratio, due to the fact that the biochar obtained still has the characteristics of biomass (Figure 10) hence it doesn’t asimilate to properties of coal. The biggest change takes place at 170 ºC, where the amount of carbon increases, influencing de ratios of characterization.
Table 9.
Elemental analysis solid fractions of LHW.
| T (ºC) | Time (H) | %C | %H | %N | %O | O/C | H/C | C:N |
|---|---|---|---|---|---|---|---|---|
| Original | Original | 43,33 | 5,95 | 1,71 | 49,02 | 0,85 | 1,65 | 29,65 |
| 120 | 1 | 45,99 | 6,22 | 1,13 | 46,67 | 0,76 | 1,62 | 47,67 |
| 130 | 1 | 45,62 | 6,01 | 0,97 | 47,40 | 0,78 | 1,58 | 55,14 |
| 140 | 1 | 47,82 | 5,82 | 2,20 | 44,16 | 0,69 | 1,46 | 25,39 |
| 150 | 1 | 51,13 | 5,76 | 1,38 | 41,74 | 0,61 | 1,35 | 43,32 |
| 160 | 1 | 45,88 | 5,94 | 1,16 | 47,02 | 0,77 | 1,55 | 46,16 |
| 170 | 1 | 53,71 | 6,08 | 1,69 | 38,52 | 0,54 | 1,36 | 37,09 |
| 180 | 1 | 44,79 | 5,77 | 1,48 | 47,96 | 0,80 | 1,55 | 35,43 |
| 180 | 2 | 43,33 | 5,58 | 0,88 | 50,20 | 0,87 | 1,55 | 57,41 |
| 180 | 3 | 49,25 | 5,63 | 1,31 | 43,81 | 0,67 | 1,37 | 43,94 |
| 180 | 4 | 47,67 | 5,98 | 0,00 | 46,36 | 0,73 | 1,50 | - |
On the other hand, after the hydrotermal valorization proccesses, the C/N ratio varies towards the decrease of the decomposition rate via use of microorganisms, making the biochar obtained not optimal for procceses of microorganism diet for transformation or fermentation.
3.3. Valorization via hydrotermal carbonization (HTC).
Figure 11 shows the preliminay follow up of potential presence of acids or charged species as explained previously for LHW. The pH shows a minimun at 200 ºC, suggesting that the maximun yield of an specific acid is obtained under those conditions, this was later confirmed by the HPLC-IR quantification, where at 200 ºC a maximun of levulinic acid and a high concentration of formic acid are obatined. Similarly, Figure 11b shows that the conductivity of the system has a maximum in 200 ºC and after that it starts to decrease, this can be attributed to the lower yield of levulinic acid concentration in higher concentrations due to degradation to smaller molecules.
3.3.1. Quantification of liquid fraction
The preliminary follow up is confirmed by the quantification and yields obtained via HPLC-IR (Table 10). The highest total yield is obtained at 260 ºC due to a high concentration of formic acid and the presence of sugars and levulinic acid, as well as a higher amount of liquid fraction remaining after the hydrothermal processes which makes for more grams of PC obtained from the same amount of initial biomass.
At temperatures from 200 and 220 ºC HMF and Furfural are obtained, but the total yield is lower due to hydration reactions that take place to form previously mentioned PC. This makes for a lower amount of liquid fraction at the end of the hydrothermal reacton and hence, lower yields. The production of HMF, Furfural, Sugars and levulinic acid starts to decline at 220 ºC (Figure 12) due to the fact that sugar is being transformed in to the other PC but said compounds continue to react due to the high energy system and can’t stop in the desired products, and continue to hydrate and degradate into smaller molecules such as formic acid.
Table 10.
Quantification and yields of platform chemicals obtained via HTC.
| T (ºC) | Concentration PC (g/L) | Yield (%w) | ||||
| Sugars | Levulinic acid | Formic acid | HMF | Furfural | ||
| 200 | 0,720 | 1,908 | 7,868 | 0,523 | 0,447 | 44,182 |
| 220 | 0,520 | 1,621 | 8,299 | 0,046 | 47,541 | |
| 240 | 0,514 | 1,111 | 9,291 | 48,664 | ||
| 260 | 0,428 | 0,885 | 9,739 | 49,469 | ||
3.3.2. Characterization of solid fraction
3.3.2.1. Infrared spectroscopy
Figure 13, the IR spectrum of HTC solid fractions shows a bigger change compared to the previously presented Figure 8 and Figure 9. In this case, the band of O-H vibrations of H-bonded hydroxyl groups at around 3332 disapears due to the elimination of said functional groups to the liquid fraction. Similarly the signals in 1027 cm-1 (Symmetrical C-O-C, C-OH, C-O vibrations of cellulose, hemi-cellulose, and lignin), 1516 cm-1 (C=C-vibrations, indicative of lignin and aromatic C), 1625 cm-1 (C=C vibrations of aromatic compounds) and 1730 cm-1 (C=O vibrations of ketone, aldehyde and acid groups) disapear with higher temperatures, this due to the hidrolysis of the lignocelullosic structures and formation and PC and the initial obtention of biochar-like solids.
3.3.2.2. Elemental analysis
The elemental analysis of the solid fractions is reported in Table 11. By applying the valorization via HTC, an important increase on the percentage of carbon takes place, as well as a loss of oxygen from the initial biomass which is extrated into the liquid fraction. Said cahnges affect the O/C and H/C ratios for the characterization of the biomass.
Table 11.
Elemental analysis of solid fractions obtained via HTC.
| T (ºC) | %C | %H | %N | %O | O/C | H/C | C:N |
|---|---|---|---|---|---|---|---|
| 43,33 | 5,95 | 1,71 | 49,02 | 0,85 | 1,65 | 29,65 | |
| 200 | 60,88 | 5,72 | 1,42 | 31,98 | 0,39 | 1,13 | 50,02 |
| 220 | 72,10 | 4,32 | 1,09 | 22,49 | 0,23 | 0,72 | 77,17 |
| 240 | 76,12 | 4,11 | 1,1 | 18,67 | 0,18 | 0,65 | 80,73 |
| 260 | 78,81 | 3,43 | 0,88 | 16,88 | 0,16 | 0,52 | 104,48 |
In Figure 14, the final characterization of each solid fraction is shown, where, in contrast to the LHW process, the initial biomass undergoes important changes assimilating the structure of coals, lignites and peat. Coal, a form of carbonized biomass, is primarily used for energy production, contributing to over a quarter of global energy production. Lignites, which are intermediate stages in the formation of coal, can be used as a feedstock for the chemical industry and as a source of fuel. Peat is used in various applications, such as fuel, chemical production, and environmental remediation. In the context of biomass valorization, coal, lignite, and peat can serve as potential sources of carbon and energy, providing a basis for the development of new materials and chemicals derived from these biomass types. This shows that not only a valorization is taking place by the production of platform chemicals, but also for the obtention of solid fuels of interest in the industry.
3.4. Optimization and catalysts
3.4.1. Catalysts
The use of catalysts in the hydrothermal valorization of biomass is of significant importance. Catalysts play a crucial role in enhancing the efficiency of biomass conversion processes, such as hydrothermal liquefaction, by promoting the decomposition of complex organic molecules into simpler, more valuable compounds. They can improve the selectivity of product formation, increase reaction rates, and lower the operating temperatures and pressures required for the conversion process. Table 12 shows the comparisons of the obtention fo PC with and without catalysts. The use of H2SO4 as a catalyst breaks the glycosidic bonds in hemicellulose under relatively mild treatment conditions, resulting in the release of sugars and other hemicellulose components. The acid hydrolysis of lignocellulosic biomass with sulfuric acid is an efficient method for the generation of monomeric sugars, which can be further processed into biofuels, chemicals, and other value-added products. The highest concentration of sugars is obtained by the use of sulfuric acid as a catalyst in one hour, but it also produces HMF since 1 hour of reaction, aspect that is only achieved with this catalyst. After two hours of reaction, sulfuric acid leads to the formation of HMF and the decrease of sugars and levulinic acid.
The use of a weak acid catalyst (CH3COOH) changes the reaction process, leading mostly to the producion of formic acid since the first hour of reaction. After two hours of reaction time, the energy induced to the system degradates formic acid but allow the existent sugars to transform into levulinic acid, producing a great increase in the produccion of levulinic acid compared to the obtained without catalyst.
The use of both weak and strong basic catalysts in the first hour does not help with the hidrolysis process, producing a low concentration of sugars and an important concentration of fomic acid with NaHCO3. After increasing the time, KOH allows the formation of Fufural in 2 hours, which is not achieved without catalysts, but dicreases significantly the production of sugars. In the other hand NaHCO3 continues to increase the sugar production but also yields an important amount of formic acid selectibly.
Table 12.
Concentration and yields of platform chemicals obtained with catalysts.
| Time | Catalyst | Concentration PC (g/L) | Yield (%w) | ||||
| Sugars | Levulinic acid | Formic acid | HMF | Furfural | |||
| 1 | NO | 34,818 | 0,577 | 70,001 | |||
| 1 | H2SO4 | 36,363 | 0,785 | 0,619 | 59,668 | ||
| 1 | CH3COOH | 20,660 | 18,394 | 73,003 | |||
| 1 | KOH | 16,498 | 21,938 | ||||
| 1 | NaHCO3 | 13,876 | 9,976 | 43,144 | |||
| 2 | NO | 26,341 | 1,063 | 2,392 | 0,299 | 62,284 | |
| 2 | H2SO4 | 23,182 | 0,769 | 1,059 | 39,755 | ||
| 2 | CH3COOH | 14,518 | 5,152 | 1,097 | 53,488 | ||
| 2 | KOH | 1,791 | 1,896 | 9,351 | 0,761 | 1,146 | 50,178 |
| 2 | NaHCO3 | 20,753 | 23,953 | 81,427 | |||
3.4.2. Optimization
Figure 15 shows the optimal conditions for the production of sugars from pea pod waste, it shows that even tho the concentration of sugars obtained is the highest using H2SO4 as a catalysts, the amount of liquid phase obtained at 180 ºC 1h without catalyst is greater, making the yield bigger as well. At higher temperatures, and longer reaction times the sugars react to produce the other PC or undergo degradation which makes de yield decrease. The best conditions would then be at 180 ºC for one hour with H2SO4 as a catalyst or without it. If the processes is meant to be cleaner, the its suggested to not implement the catalyst as a good yield is obtained without the use of it.
The yield of fomic acid production is highly influenced by high temperatures and the use of catalysts, obtaining the best results under the conditions of 180 ºC, 2 hours and NaHCO3 as a catalyst, good yields are also achieved using CH3COOH as a catalyst at 180 ºC or at 260 ºC without a catalyst. It is suggested then, in order to achieve a good yield of formic acid, to use weak acid/basis as catalysts for the process for longer times, or, in case of the use of only water, higher conditions of HTC favor the degradation of other PC to formic acid.
Levulinic acid’s optimal conditions for production are reported in Figure 17. The use of a weak acid catalysts and longer reaction times (2h) favor the formation of levulinic acid remarkable. Temperatures over 200 ºC but under 260 ºC also produce high yields of levulinic acid without the need of catalysts, being 200 ºC the best condition. Over 260 ºC said acid starts to degrade into smaller molecules decreasing the yield.
Finally, Figure 18 shows the optimal conditions for HMF and furfural production. This platform chemicals can be higly unstable and precise conditions are needed for them to be produced. The use of catalysts help produce HMF and Furfural in shorter times but the yield is not the best posible, but, on the other hand, the use of higher reaction times at 180 ºC allow the obtention of higher yields due to the softer conditiones for the reactions to take place. At higher temperatures (220 – 260 ºC) the conditions are to strong for this PC to be stable and they degrade into other products that are not of interest.
4. Conclusions
It was concluded that the pea pod has a high content of volatile matter, which can be transformed into PC due to the presence of organic groups as well as an important amount of fixed carbon, which influences the production of biochar. As for the ultimate analysis it allowed the characterization of pea pod wastes as biomass according to the Van Krevelen diagram, its C/N ratio showed a potential valorization via microorganisms implementation. Moreover, the structural analysis presented 20% cellulose, 17% hemicellulose, and 5% lignin. The high content of cellulose and hemicellulose added to the low amount of lignin, are the best conditions due to the great presence of starting materials that could be transformed into PC and the low possibility of inhibition due to the lignin content.
Valorization via LHW lead to the formation of sugars and levulinic acid at temperatures of 170-180 ºC and the highest yield was obtained at 180 °C, 1h. Reactions at 180 °C for longer times caused the decrease of sugars due to their transformation to other platform chemicals, and the formation of formic acid, HMF and Furfural, being that the condition with the most variety of platform chemicals. The solid fraction produced in this range of hydrothermal valorization was charactetized as biomass and didn’t change a lot compared to the initial biomass.
HTC range of hydrothermal valorization caused a significant decrease in the production of sugars because of their complete transformation/degradation into other chemicals. Higher temperatures caused the decrease of levulinic acid, HMF and furfural as well and the increase of formic acid cause by the inestability of the previously mentioned compounds and their degradation into smaller PC such as formic acid. The solid fraction produced was characterized as peat, lignite and coal, which can be use a source energies as well and show a marked difference when compared to the initial biomass.
The use of catalysts help improve the yields of specific PC such as formic acid and levulinic acid to make the hydrothermal reactions more specific but in the case of sugars and HMF and Furfural, the use of catalysts is not necessary and higher yields can be obtained by longer time reactions but no catalysts. The optimal conditions for each platform chemical were also reported and described in order to provide a guide for the implementation of peapods as a source of new chemical products showing that each indiviual platform chemical requires for specific conditions that favor their production selectibly.
Author Contributions
Conceptualization, Daniel E. Galvis-Sandoval. and Alejandra S. Lozano-Pérez.; methodology, , Daniel E. Galvis-Sandoval and Alejandra S. Lozano-Pérez.; validation, Daniel E. Galvis-Sandoval.; formal analysis, Daniel E. Galvis-Sandoval.; investigation, , Daniel E. Galvis-Sandoval; resources, Carlos A. Guerrero-Fajardo.; data curation, Alejandra S. Lozano-Pérez and Daniel E. Galvis-Sandoval.; writing—original draft preparation, , Daniel E. Galvis-Sandoval and Alejandra S. Lozano-Pérez .; writing—review and editing, Carlos A. Guerrero-Fajardo.; supervision, Carlos A. Guerrero-Fajardo.; project administration, Carlos A. Guerrero-Fajardo.; funding acquisition, Alejandra S. Lozano-Pérez. All authors have read and agreed to the published version of the manuscript.
Funding
This research was funded by MINCIENCIAS, grant number Contrato de financiamiento de recuperación contingente No. 80740-101-2022.
Data Availability Statement
We encourage all authors of articles published in MDPI journals to share their research data. In this section, please provide details regarding where data supporting reported results can be found, including links to publicly archived datasets analyzed or generated during the study. Where no new data were created or where data is unavailable due to privacy or ethical restrictions, a statement is still required. Suggested Data Availability Statements are available in section “MDPI Research Data Policies” at https://www.mdpi.com/ethics.
Acknowledgments
We thank the Universidad Nacional de Colombia and the Departamento de Química-Facultad de Ciencias for their support and the possibility of using equipment and techniques that allowed the development of this article.
Conflicts of Interest
The authors declare no conflict of interest.
References
- Heidari, M.; Norouzi, O.; MacDermid-Watts, K.; Acharya, B.; Zhang, Y.; Dutta, A. Product evaluation of hydrothermal carbonization of biomass: semi-continuous vs. batch feeding. Biomass Convers Biorefin 2022, 12, 15–25. [Google Scholar] [CrossRef]
- Xiao, L.-P.; Shi, Z.-J.; Xu, F.; Sun, R.-C. Hydrothermal carbonization of lignocellulosic biomass. Bioresour Technol 2012, 118, 619–623. [Google Scholar] [CrossRef] [PubMed]
- Reza, M.T.; et al. Hydrothermal Carbonization of Biomass for Energy and Crop Production. Applied Bioenergy 2014, 1. [Google Scholar] [CrossRef]
- Libra, J.A.; et al. Hydrothermal carbonization of biomass residuals: a comparative review of the chemistry, processes and applications of wet and dry pyrolysis. Biofuels 2011, 2, 71–106. [Google Scholar] [CrossRef]
- Fiori, L.; Basso, D.; Castello, D.; Baratieri, M. Hydrothermal carbonization of biomass: Design of a batch reactor and preliminary experimental results. Chem Eng Trans 2014, 37, 55–60. [Google Scholar] [CrossRef]
- Heidari, M.; Norouzi, O.; MacDermid-Watts, K.; Acharya, B.; Zhang, Y.; Dutta, A. Product evaluation of hydrothermal carbonization of biomass: semi-continuous vs. batch feeding. Biomass Convers Biorefin 2022, 12, 15–25. [Google Scholar] [CrossRef]
- Takkellapati, S.; Li, T.; Gonzalez, M.A. An overview of biorefinery-derived platform chemicals from a cellulose and hemicellulose biorefinery. Clean Technol Environ Policy 2018, 20, 1615–1630. [Google Scholar] [CrossRef] [PubMed]
- Cherubini, F. The biorefinery concept: Using biomass instead of oil for producing energy and chemicals. Energy Convers Manag 2010, 51, 1412–1421. [Google Scholar] [CrossRef]
- Divercitytimes. Peas are small, spherical seeds, or seed pods, of the plant species Pisum sativum, typically green or yellow. Available online: https://divercitytimes.com/agriculture/crops-and-livestock/green-peas.
- Martín-Lara, M.A.; Chica-Redecillas, L.; Pérez, A.; Blázquez, G.; Garcia-Garcia, G.; Calero, M. Liquid Hot Water Pretreatment and Enzymatic Hydrolysis as a Valorization Route of Italian Green Pepper Waste to Delivery Free Sugars. Foods 2020, 9, 1640. [Google Scholar] [CrossRef]
- Li, M.; et al. The effect of liquid hot water pretreatment on the chemical–structural alteration and the reduced recalcitrance in poplar. Biotechnol Biofuels 2017, 10, 237. [Google Scholar] [CrossRef]
- Mateos-Aparicio, I.; Redondo-Cuenca, A.; Villanueva-Suárez, M. Broad bean and pea by-products as sources of fibre-rich ingredients: potential antioxidant activity measured in vitro. J Sci Food Agric 2012, 92, 697–703. [Google Scholar] [CrossRef] [PubMed]
- Vilariño, M.V.; Franco, C.; Quarrington, C. Food loss and Waste Reduction as an Integral Part of a Circular Economy. Front Environ Sci 2017, 5. [Google Scholar] [CrossRef]
- Wadhwa, M.; Kaushal, S.; Bakshi, M.P.S. Nutritive evaluation of vegetable wastes as complete feed for goat bucks. Small Ruminant Research 2006, 64, 279–284. [Google Scholar] [CrossRef]
- Wadhwa, M.; Bakshi, M. Vegetable wastes-a potential source of nutrients for ruminants. Indian Journal of Animal Nutrition 2005, 70–76. [Google Scholar]
- Garg, M. Nutritional Evaluation and Utilization of Pea Pod Powder for Preparation of Jaggery Biscuits. J Food Process Technol 2015, 6. [Google Scholar] [CrossRef]
- Belghith Fendri, L.; et al. Wheat bread enrichment by pea and broad bean pods fibers: Effect on dough rheology and bread quality. LWT 2016, 73, 584–591. [Google Scholar] [CrossRef]
- Belghith-Fendri, L.; et al. Identification of polysaccharides extracted from pea pod by-products and evaluation of their biological and functional properties. Int J Biol Macromol 2018, 116, 947–954. [Google Scholar] [CrossRef] [PubMed]
- Castaldo, L.; et al. Chemical Composition of Green Pea (Pisum sativum L.) Pods Extracts and Their Potential Exploitation as Ingredients in Nutraceutical Formulations. Antioxidants 2021, 11, 105. [Google Scholar] [CrossRef] [PubMed]
- Naqvi, S.A.Z.; et al. Proximate composition of orange peel, pea peel and rice husk wastes and their potential use as antimicrobial agents and antioxidants. Vegetos 2021, 34, 470–476. [Google Scholar] [CrossRef]
- Dong, X.; Guo, S.; Wang, H.; Wang, Z.; Gao, X. Physicochemical characteristics and FTIR-derived structural parameters of hydrochar produced by hydrothermal carbonisation of pea pod (Pisum sativum Linn.) waste. Biomass Convers Biorefin 2019, 9, 531–540. [Google Scholar] [CrossRef]
- Zhu, L.; Xu, H.; Yin, X.; Wang, S. H2SO4 assisted hydrothermal conversion of biomass with solid acid catalysis to produce aviation fuel precursors. iScience 2023, 26, 108249. [Google Scholar] [CrossRef] [PubMed]
- Shah, A.A.; et al. The Role of Catalysts in Biomass Hydrothermal Liquefaction and Biocrude Upgrading. Processes 2022, 10, 207. [Google Scholar] [CrossRef]
- Liu, Q.; et al. Fast hydrothermal liquefaction coupled with homogeneous catalysts to valorize livestock manure for enhanced biocrude oil and hydrochar production. Renew Energy 2022, 198, 521–533. [Google Scholar] [CrossRef]
- Quevedo-Amador, R.A.; Reynel-Avila, H.E.; Mendoza-Castillo, D.I.; Badawi, M.; Bonilla-Petriciolet, A. Functionalized hydrochar-based catalysts for biodiesel production via oil transesterification: Optimum preparation conditions and performance assessment. Fuel 2022, 312, 122731. [Google Scholar] [CrossRef]
- Mary, G.S.; Sugumaran, P.; Niveditha, S.; Ramalakshmi, B.; Ravichandran, P.; Seshadri, S. Production, characterization and evaluation of biochar from pod (Pisum sativum), leaf (Brassica oleracea) and peel (Citrus sinensis) wastes. International Journal of Recycling of Organic Waste in Agriculture 2016, 5, 43–53. [Google Scholar] [CrossRef]
- Lin, F.; Waters, C.L.; Mallinson, R.G.; Lobban, L.L.; Bartley, L.E. Relationships between Biomass Composition and Liquid Products Formed via Pyrolysis. Front Energy Res 2015, 3. [Google Scholar] [CrossRef]
- Padilla, R.; Koranchalil, S.; Nielsen, M. Homogeneous Catalyzed Valorization of Furanics: A Sustainable Bridge to Fuels and Chemicals. Catalysts 2021, 11, 1371. [Google Scholar] [CrossRef]
- Yahya, A.M.; et al. Comprehensive Characterization of Some Selected Biomass for Bioenergy Production. ACS Omega 2023, 8, 43771–43791. [Google Scholar] [CrossRef] [PubMed]
- Rivas-Ubach, A.; Liu, Y.; Bianchi, T.S.; Tolić, N.; Jansson, C.; Paša-Tolić, L. Moving beyond the van Krevelen Diagram: A New Stoichiometric Approach for Compound Classification in Organisms. Anal Chem 2018, 90, 6152–6160. [Google Scholar] [CrossRef]
- Larry Baxter, Leong Ip, Hong Lu, and Dale Tree. Distinguishing biomass combustion characteristics and their implicationsfor sustainable energy. Chemical Engineering, Jul. 2005.
- Daorattanachai, P.; Viriya-empikul, N.; Laosiripojana, N.; Faungnawakij, K. Effects of Kraft lignin on hydrolysis/dehydration of sugars, cellulosic and lignocellulosic biomass under hot compressed water. Bioresour Technol 2013, 144, 504–512. [Google Scholar] [CrossRef]
Figure 1.
Chromatographic design for platform chemicals (PC).
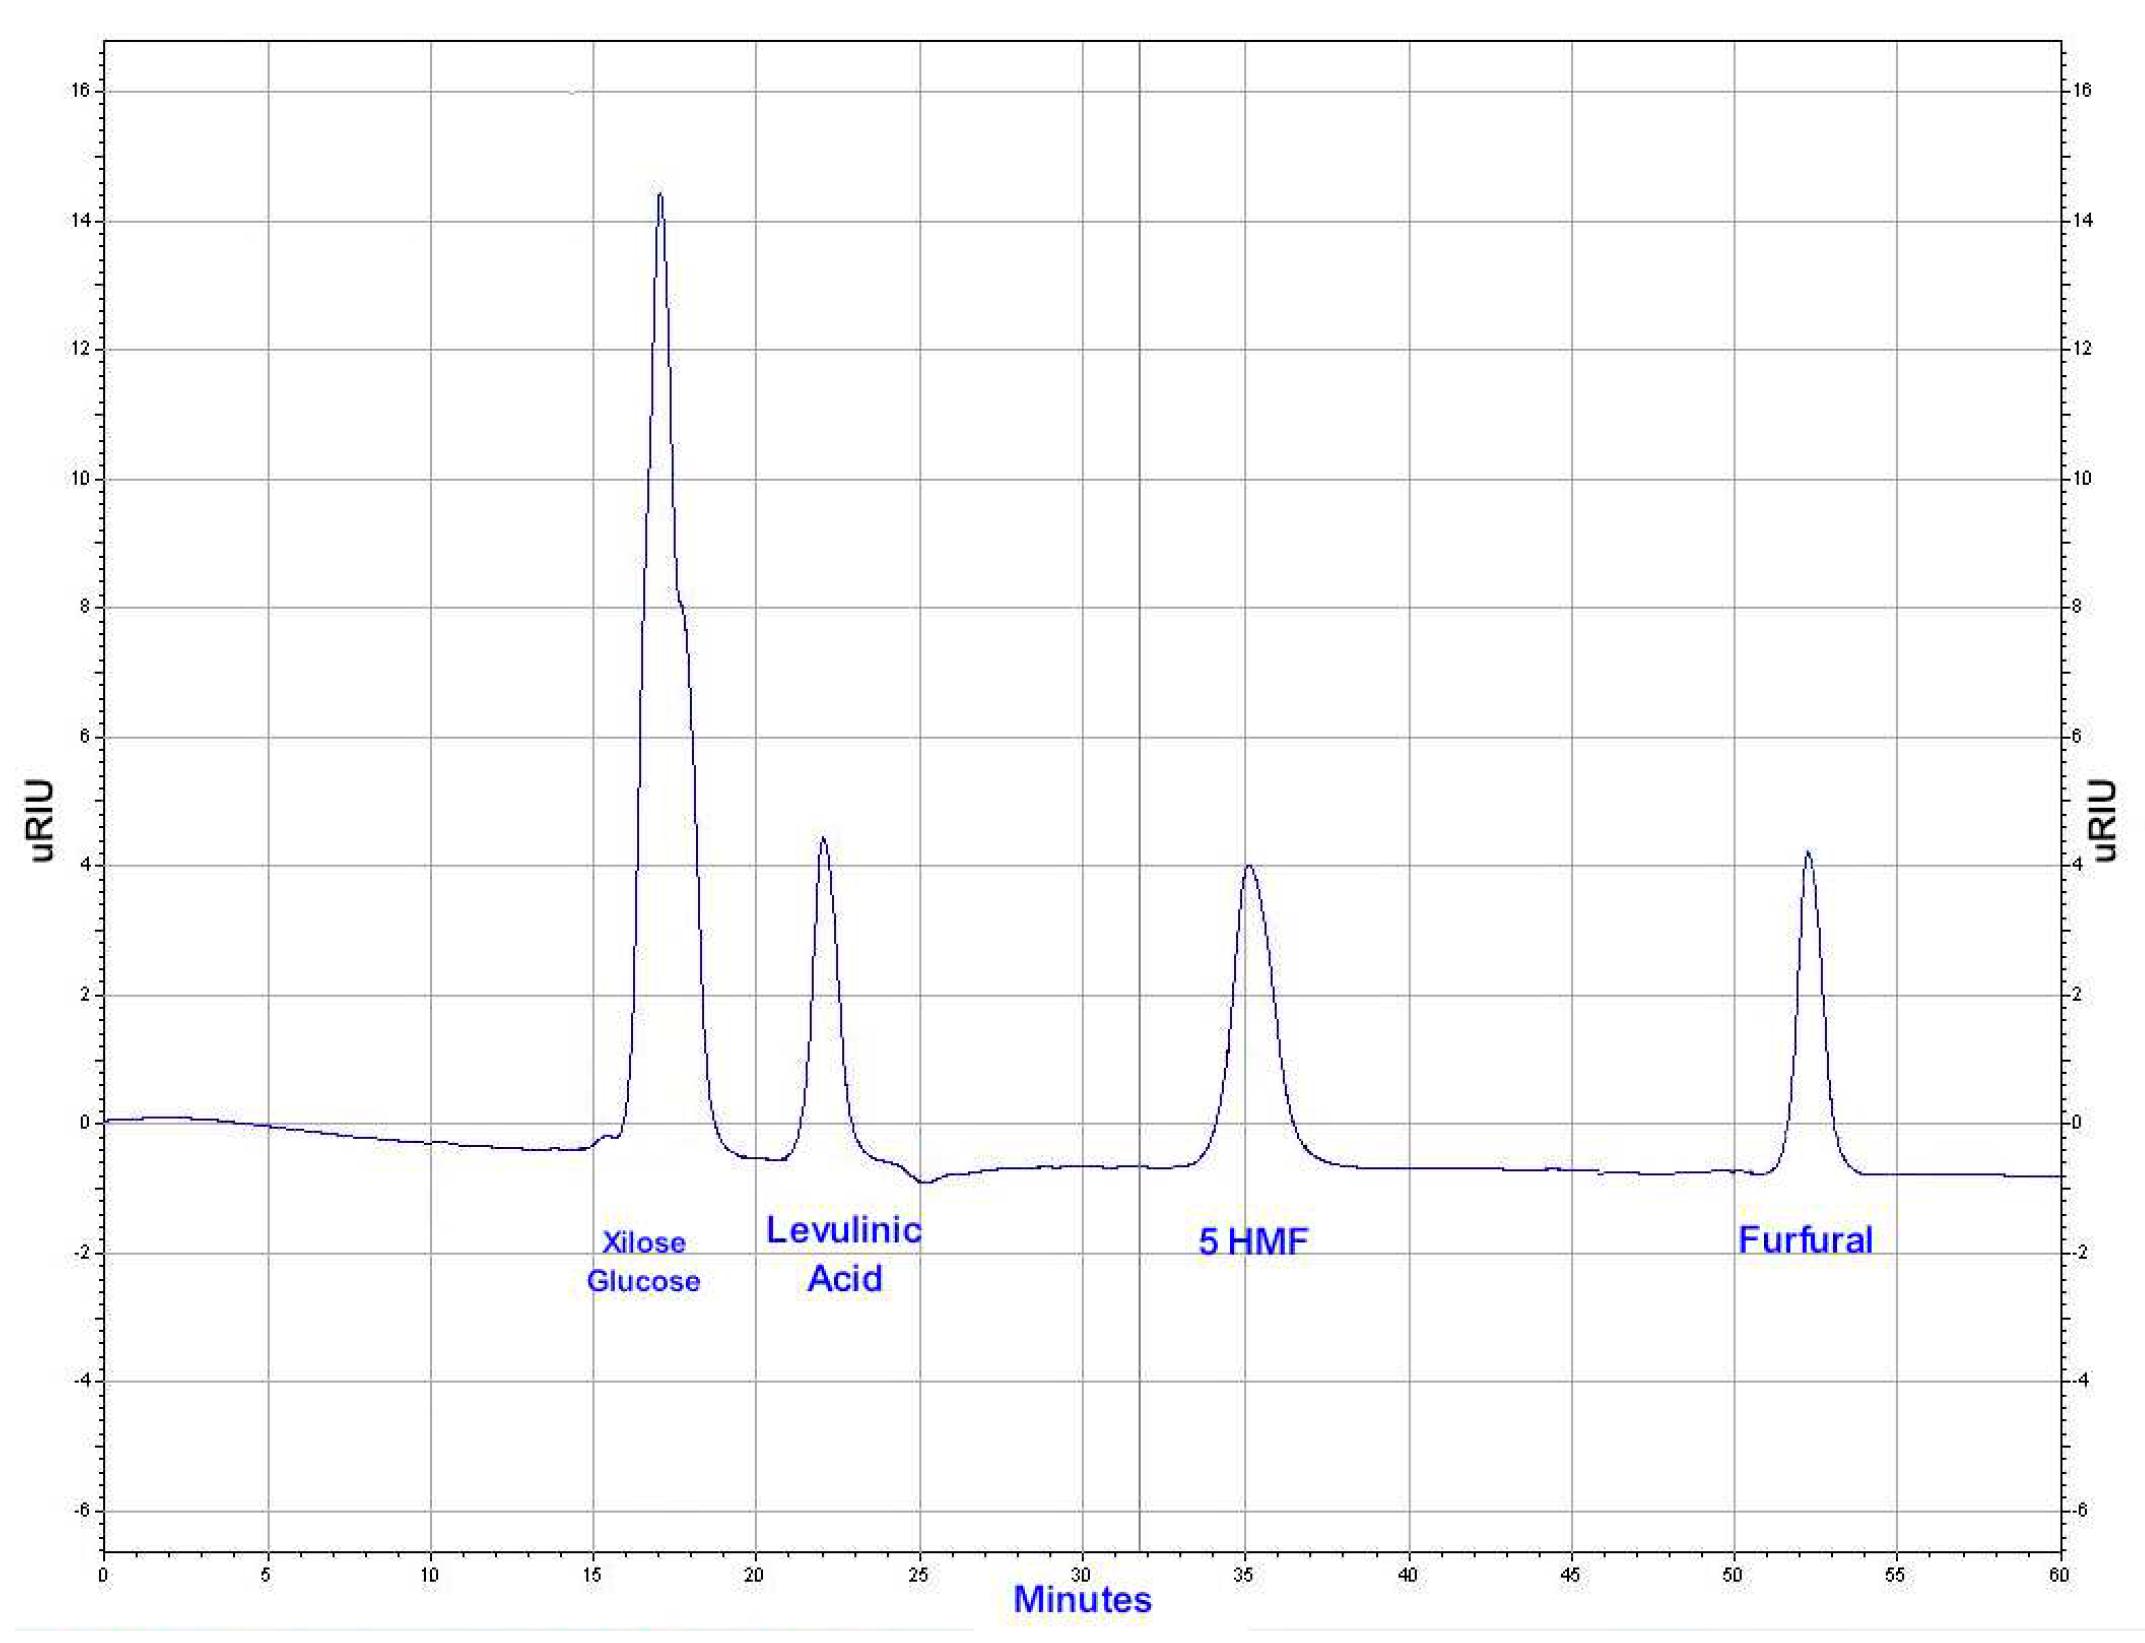
Figure 2.
Van Krevelen diagram and characterization of peapod waste.
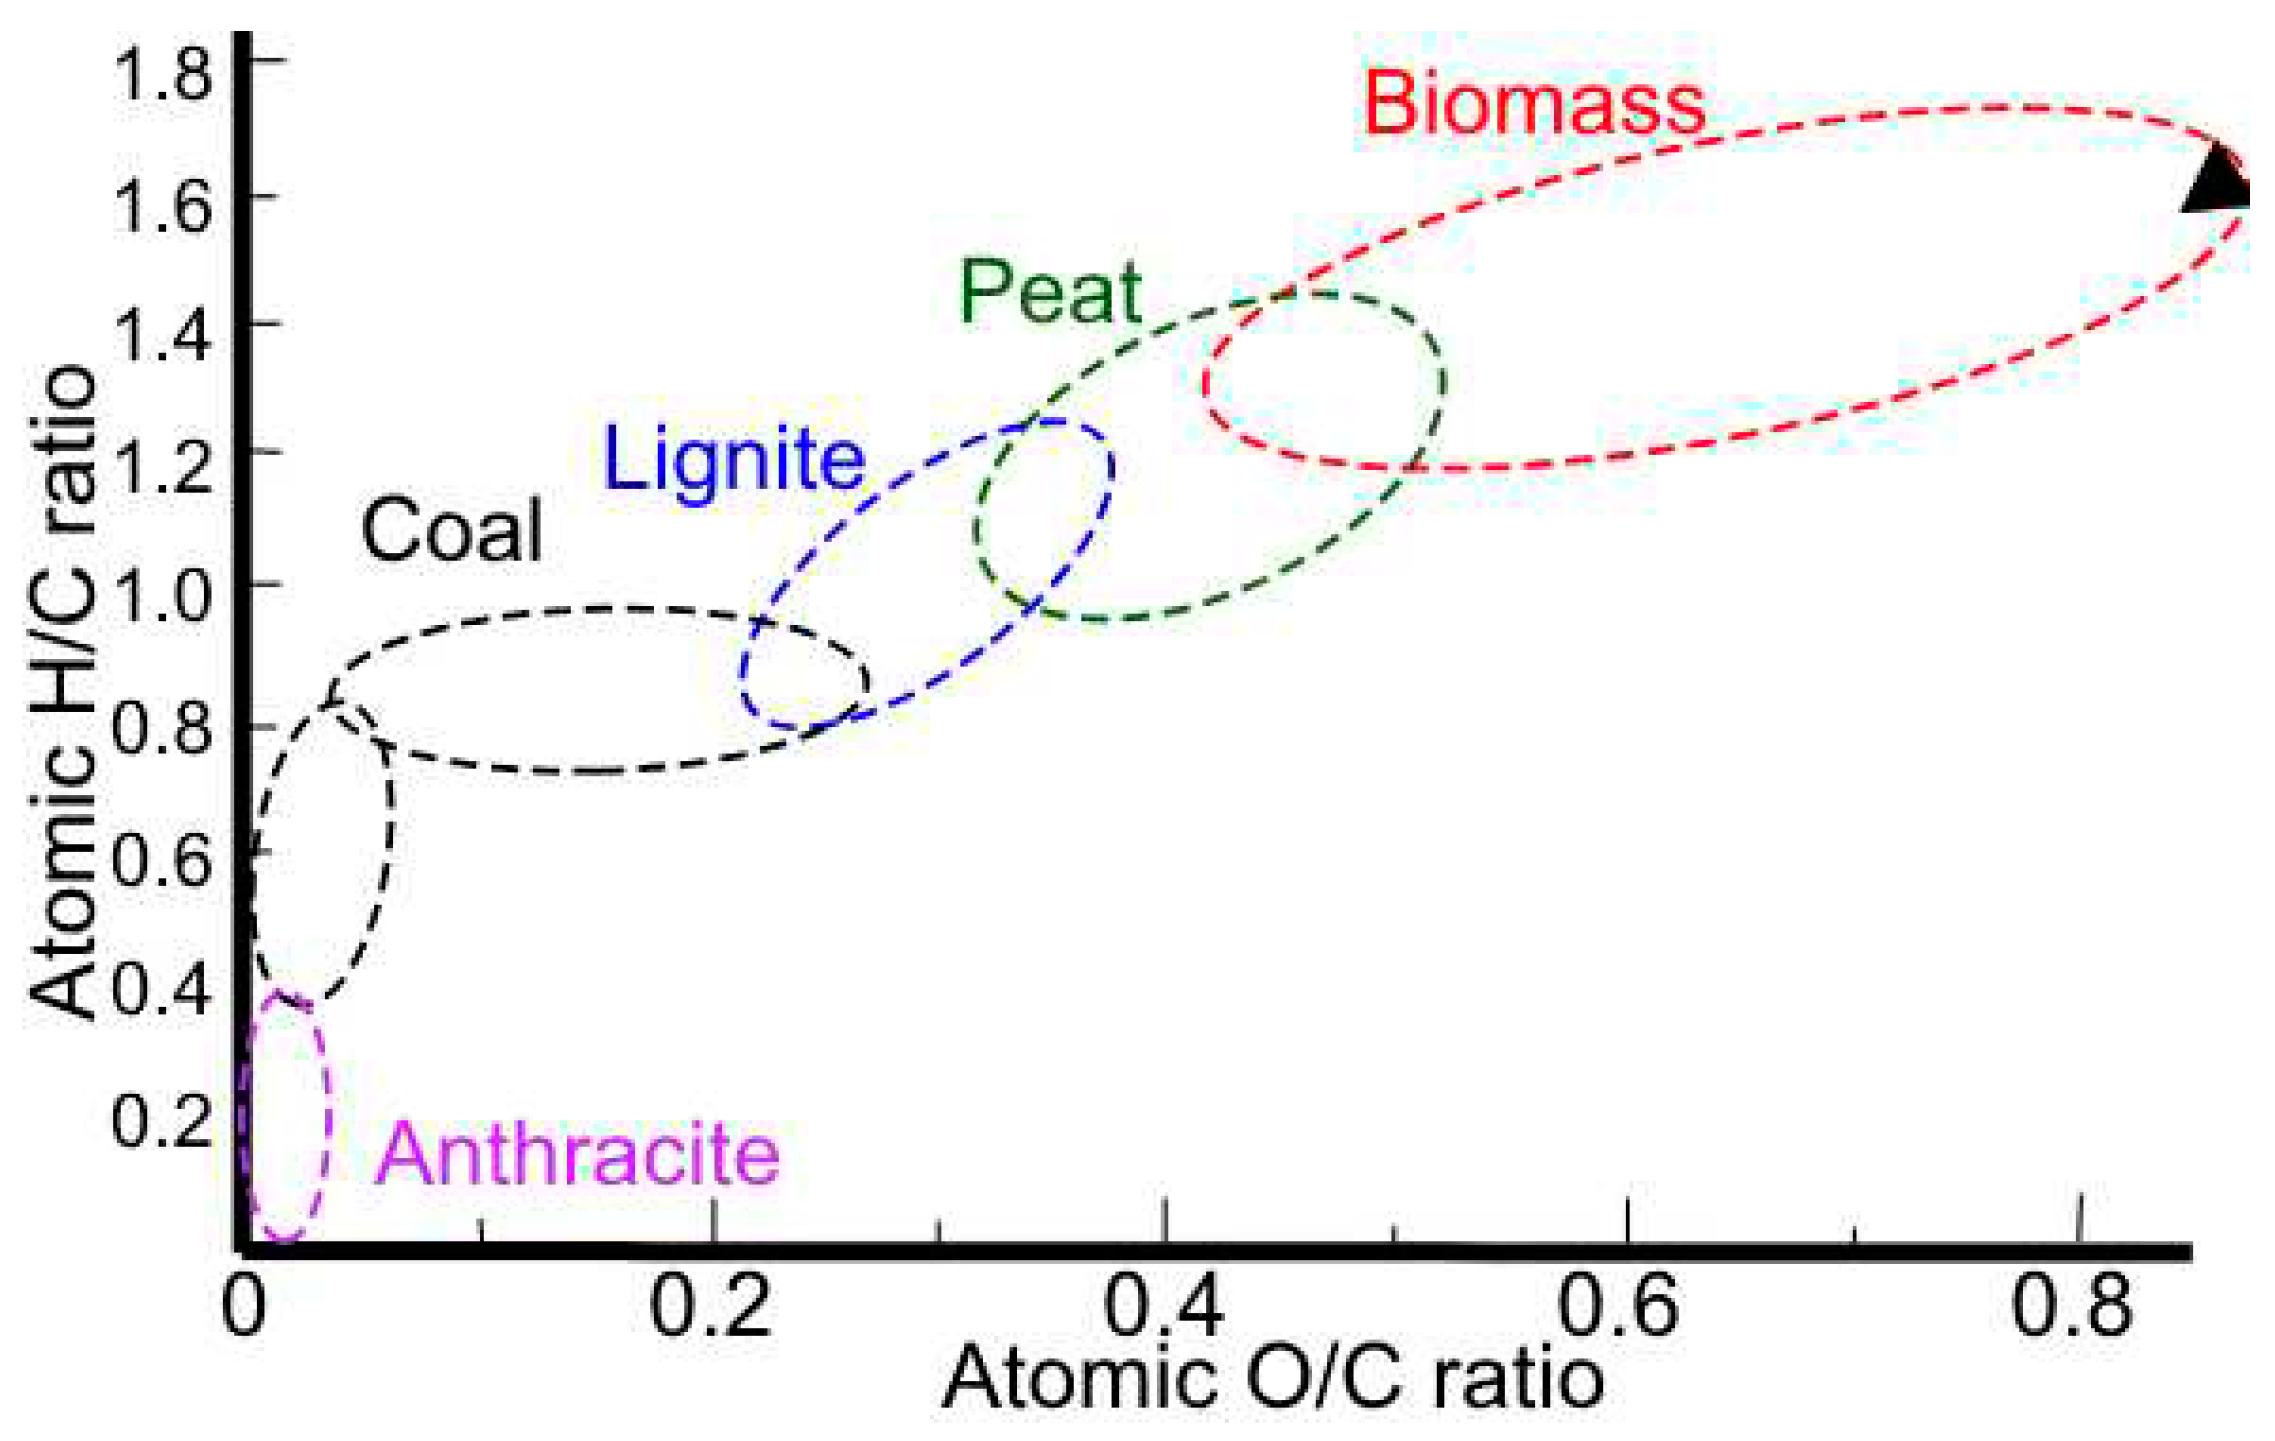
Figure 3.
Preliminary follow up of content of platform chemicals in reactions for 1 hour from 120 to 180 ºC.
Figure 3.
Preliminary follow up of content of platform chemicals in reactions for 1 hour from 120 to 180 ºC.
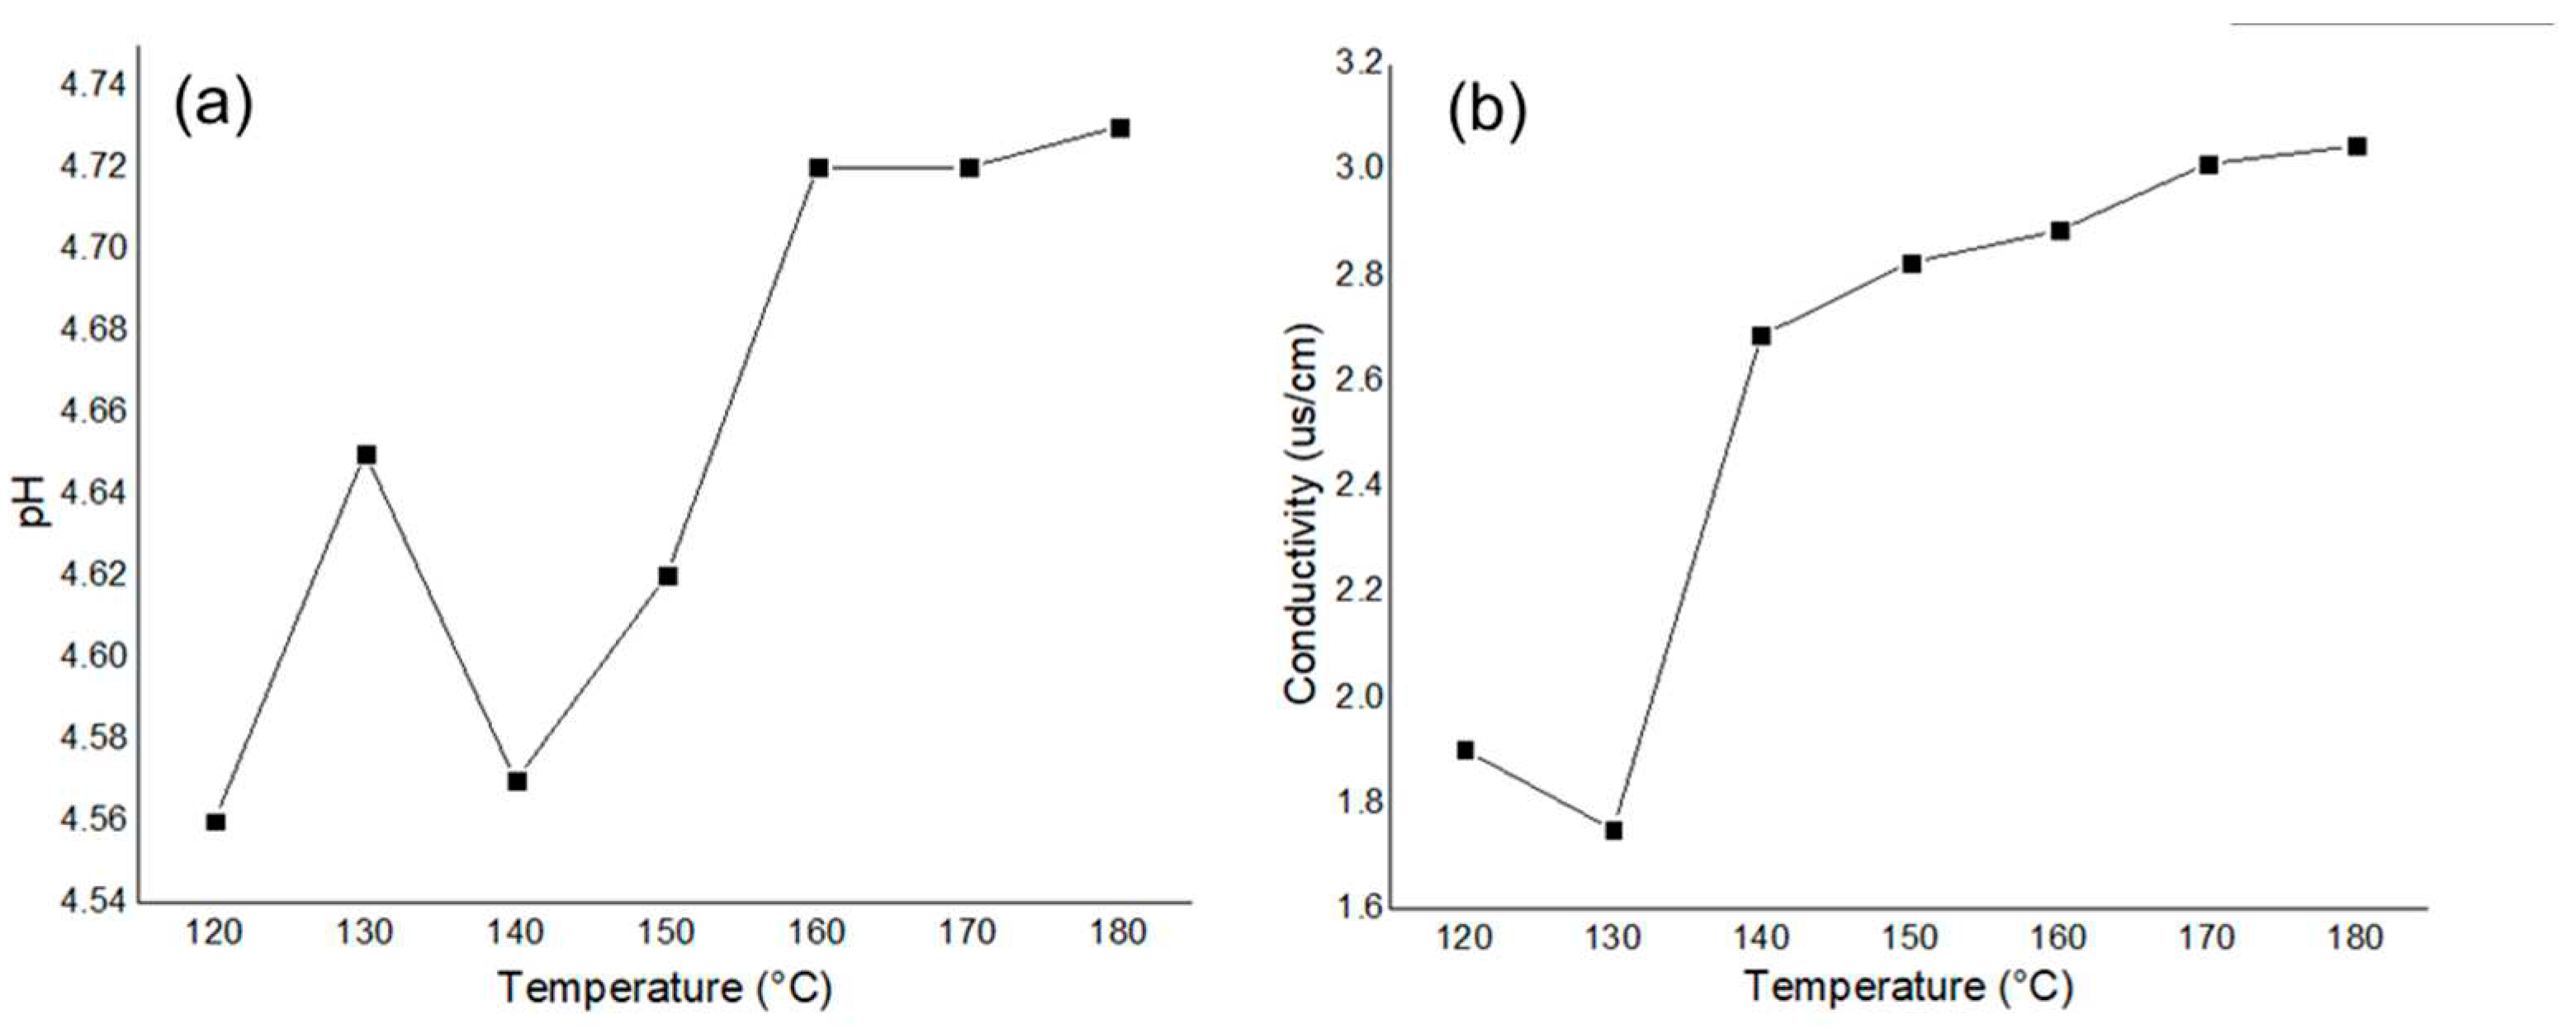
Figure 4.
Preliminary follow up of content of platform chemicals at 180 ºC for 1-4 hours.
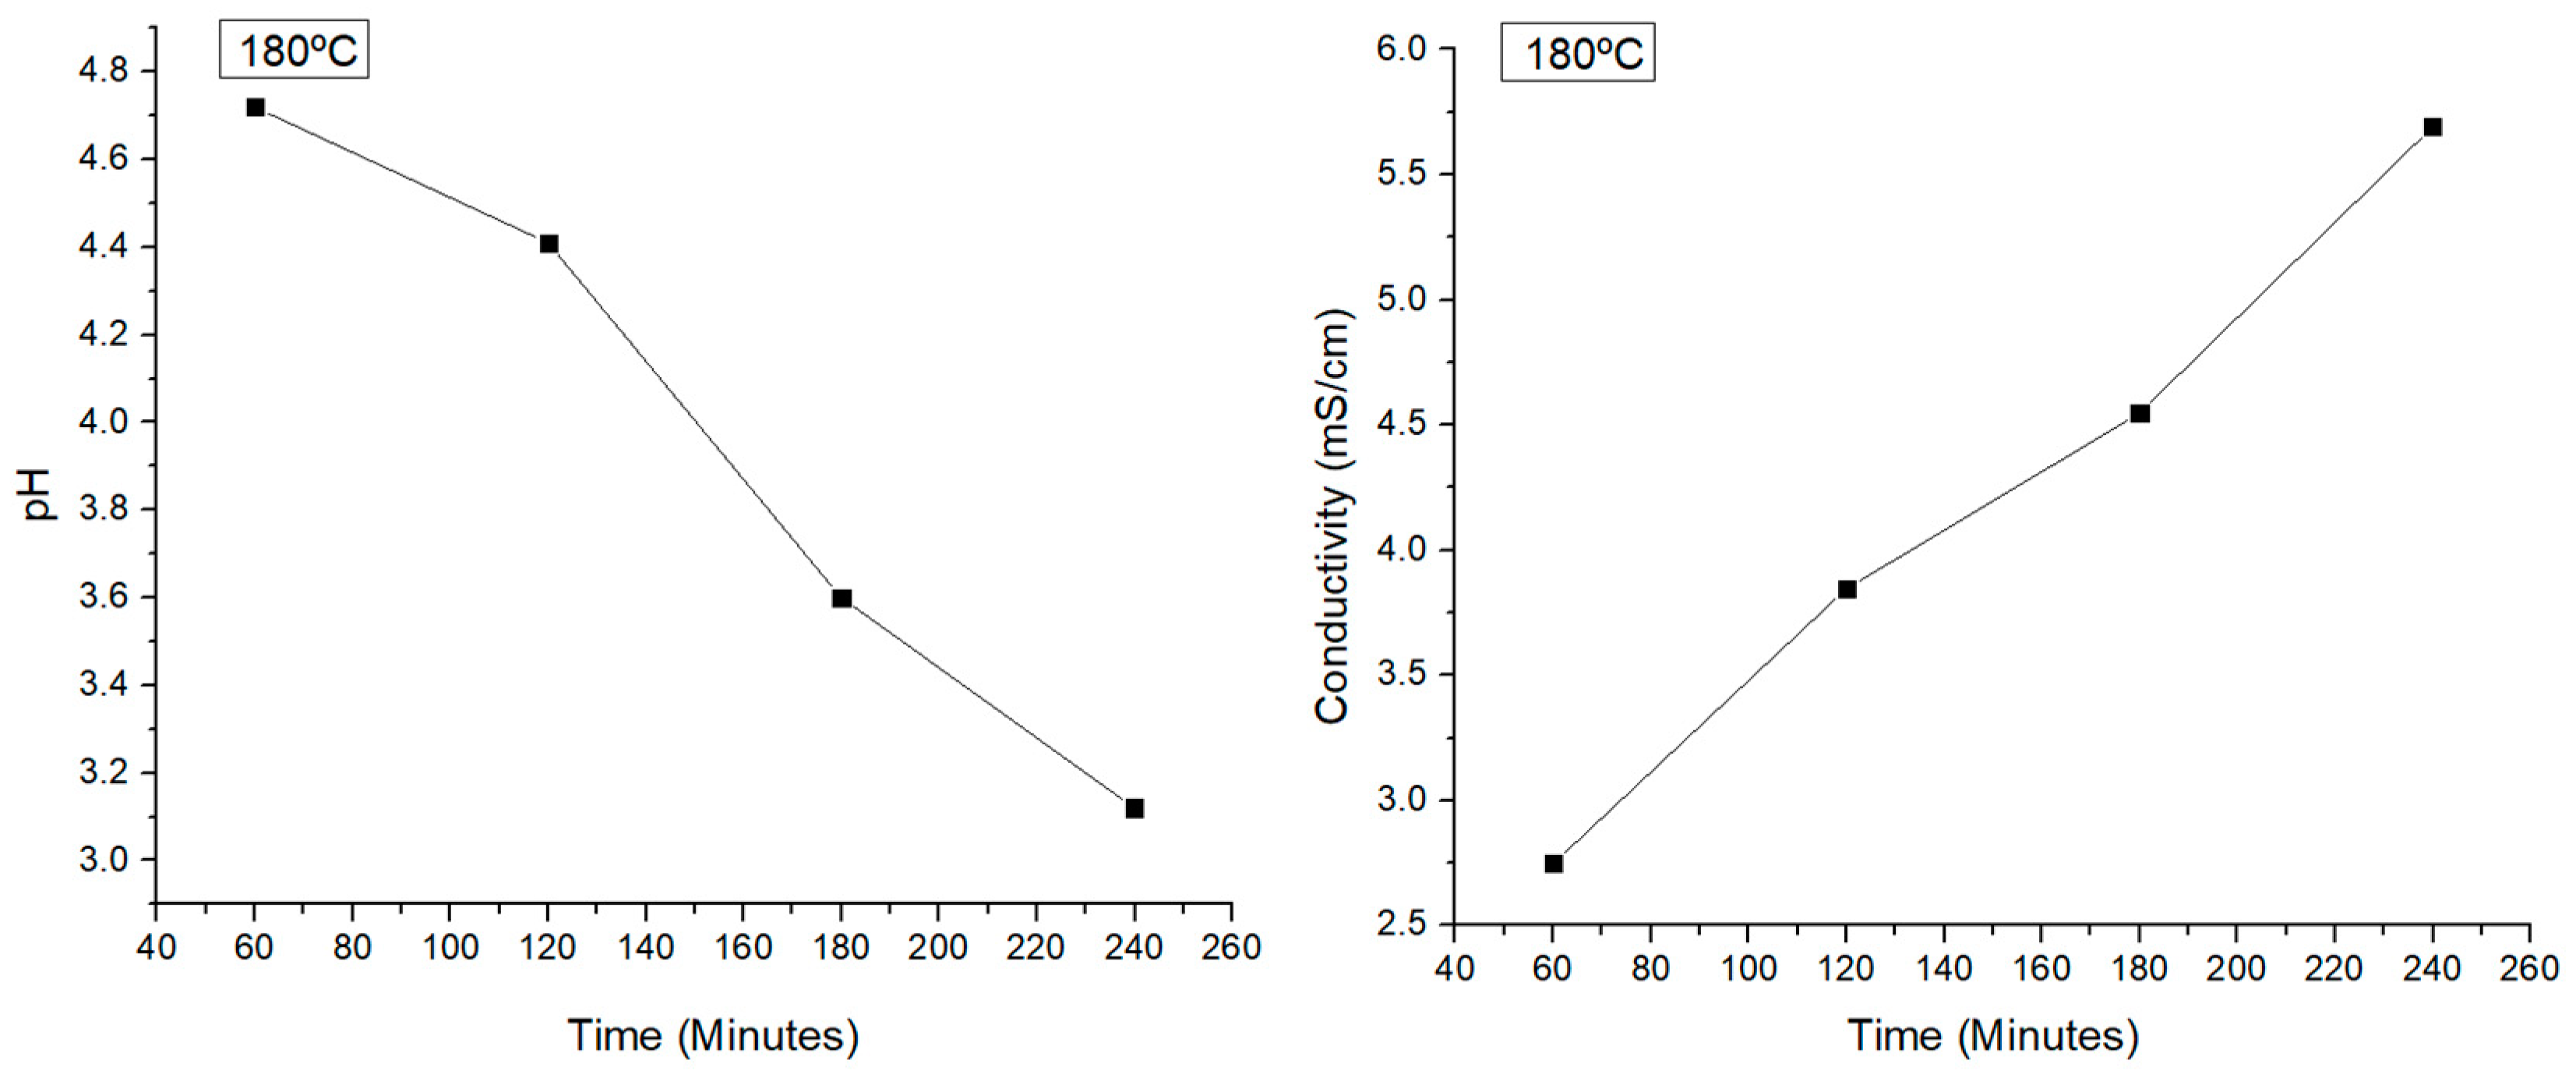
Figure 6.
Obtention of platform chemicals via LHW (180ºC) for 1-4 hours.
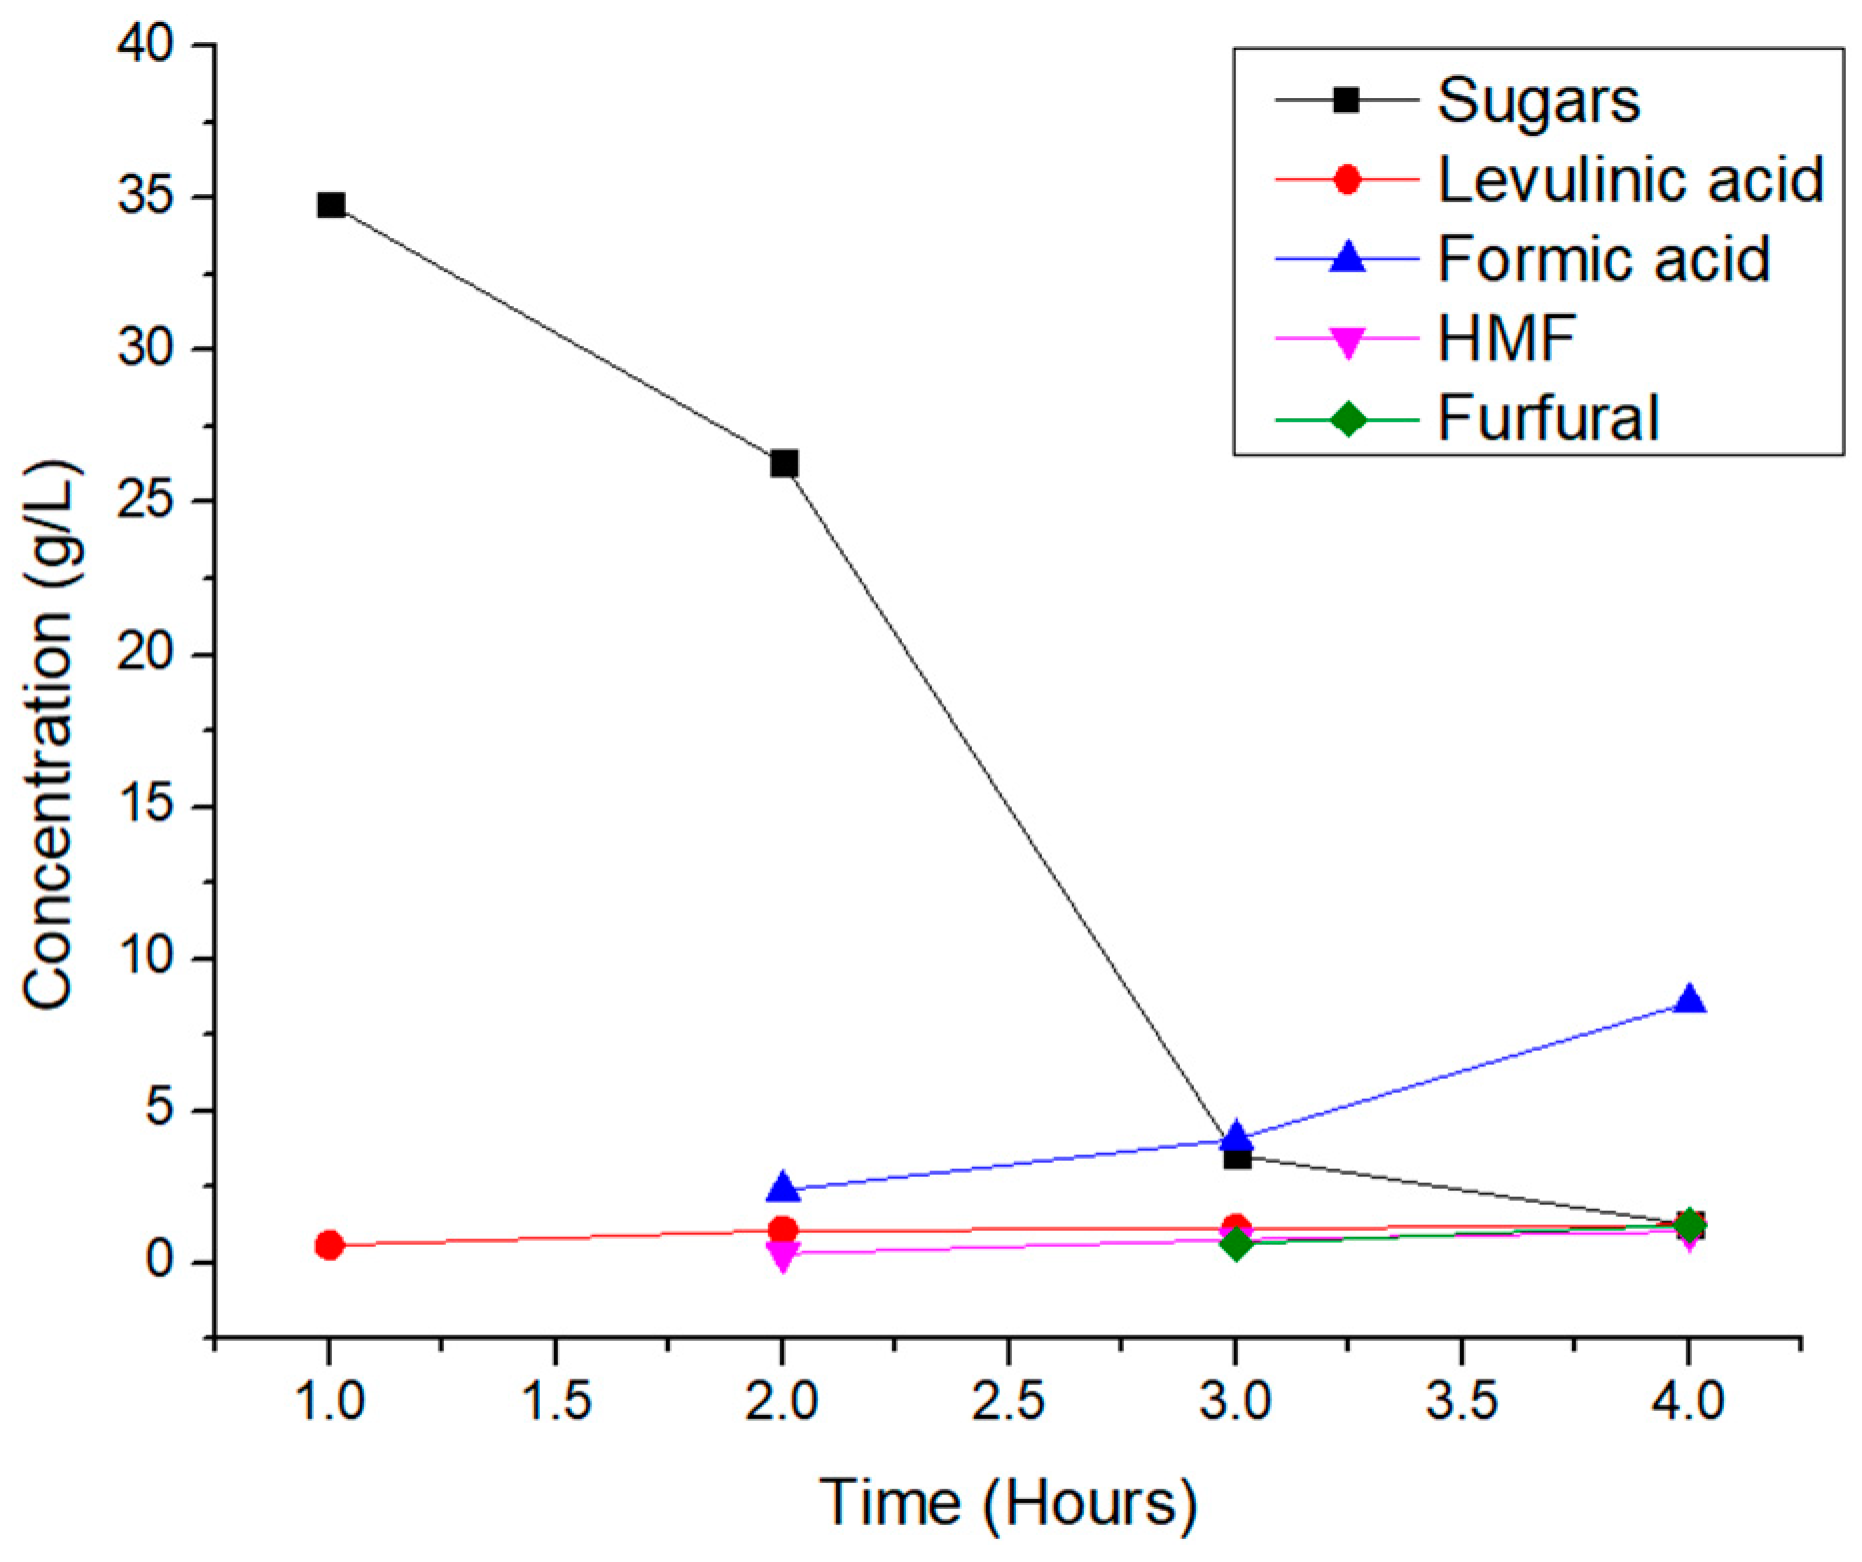
Figure 7.
Overview of the kinetics of the hydrolysis.
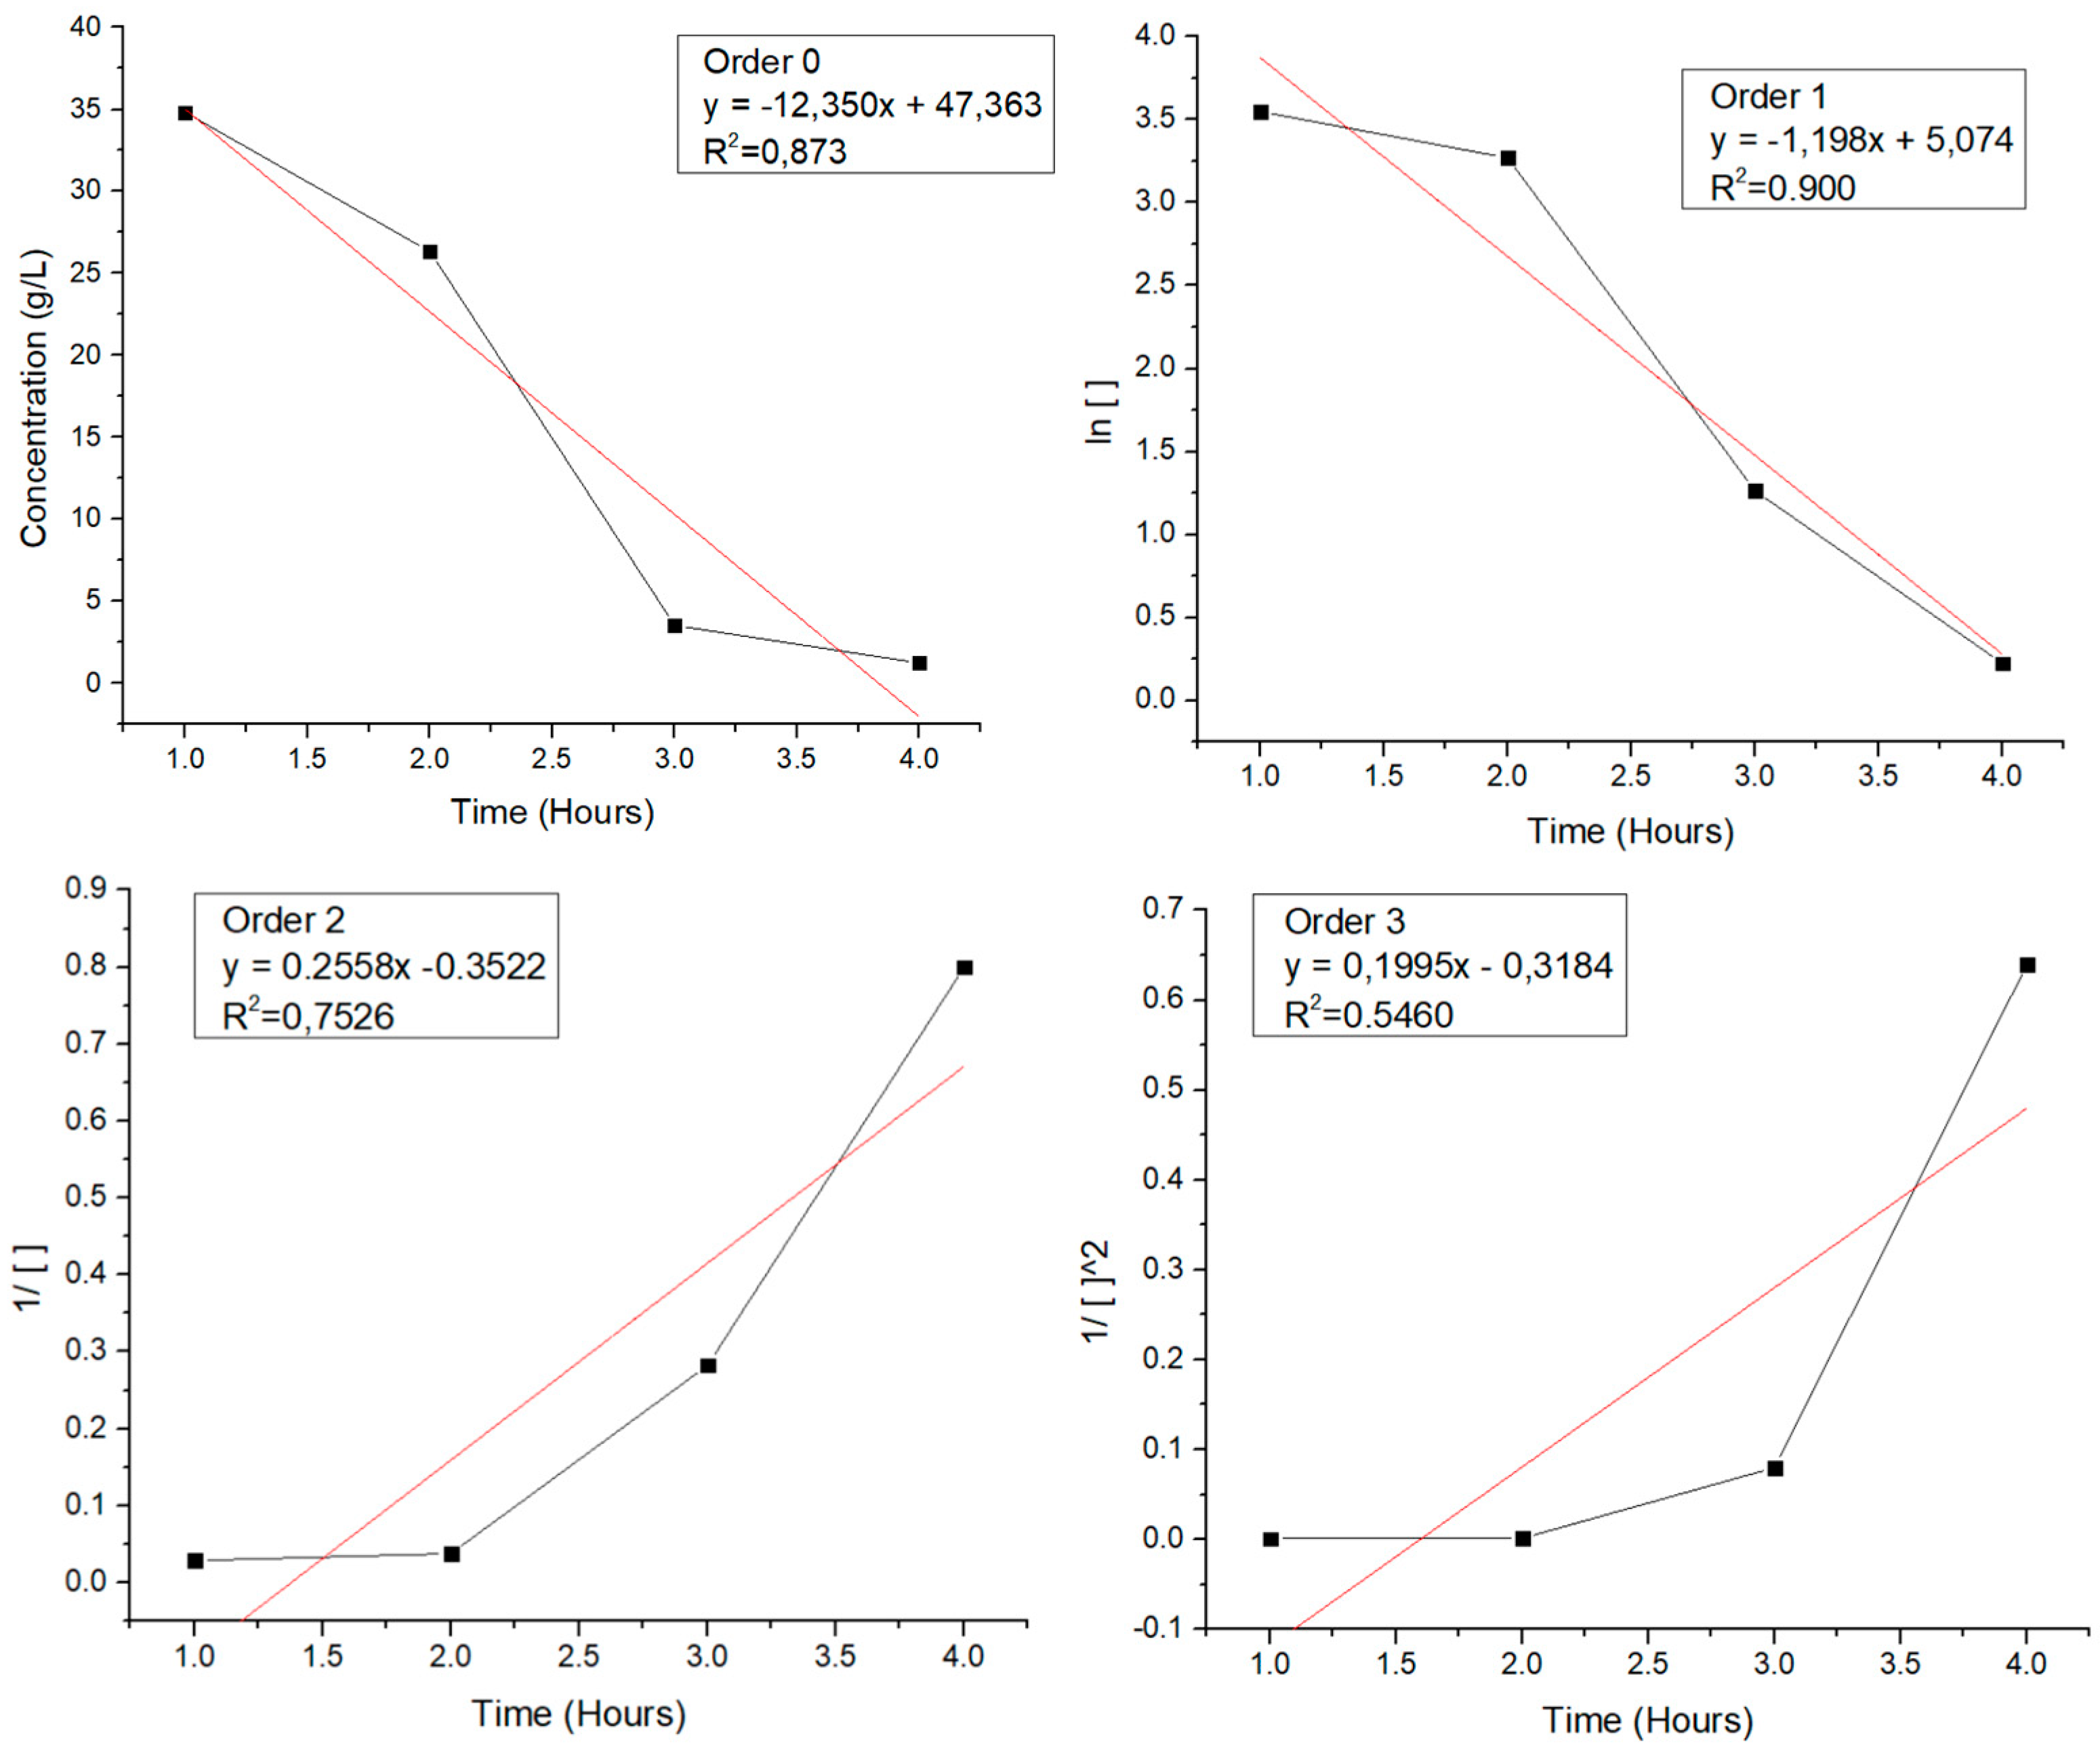
Figure 8.
Infared spectrum of LHW for 1 hour.
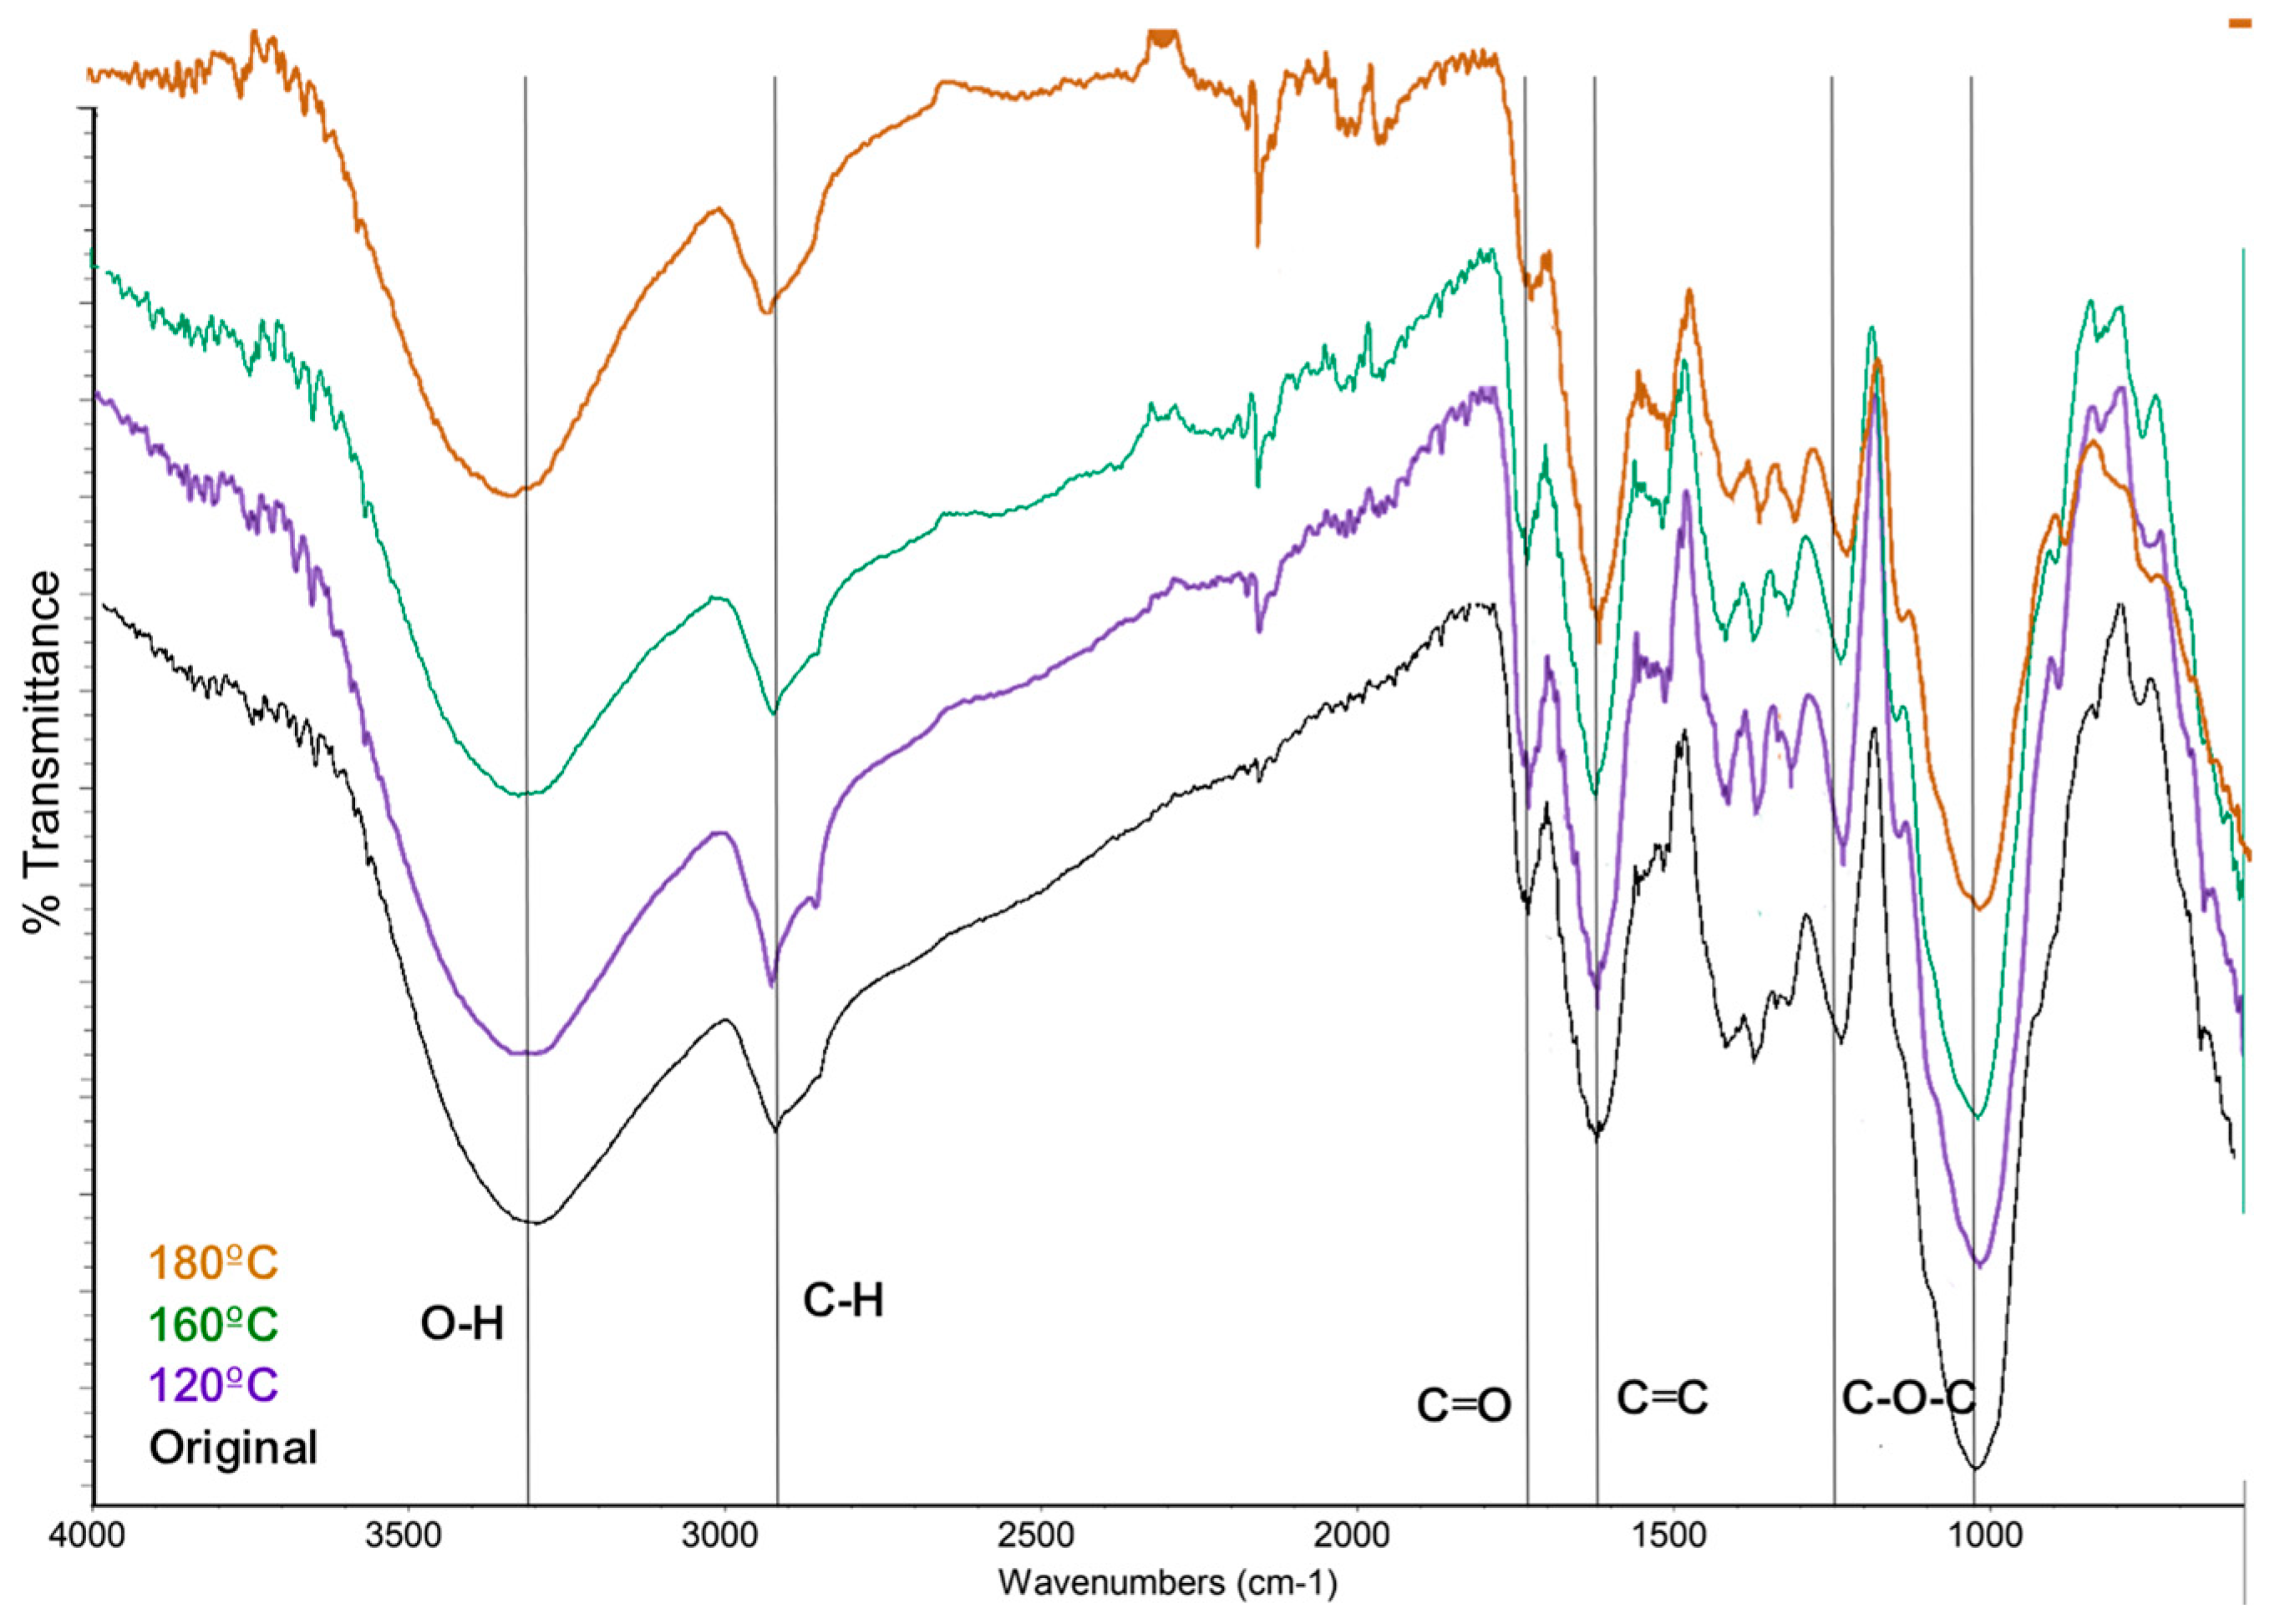
Figure 9.
Infrared spectrum of LHW at 180ºC for 1-3 hours.
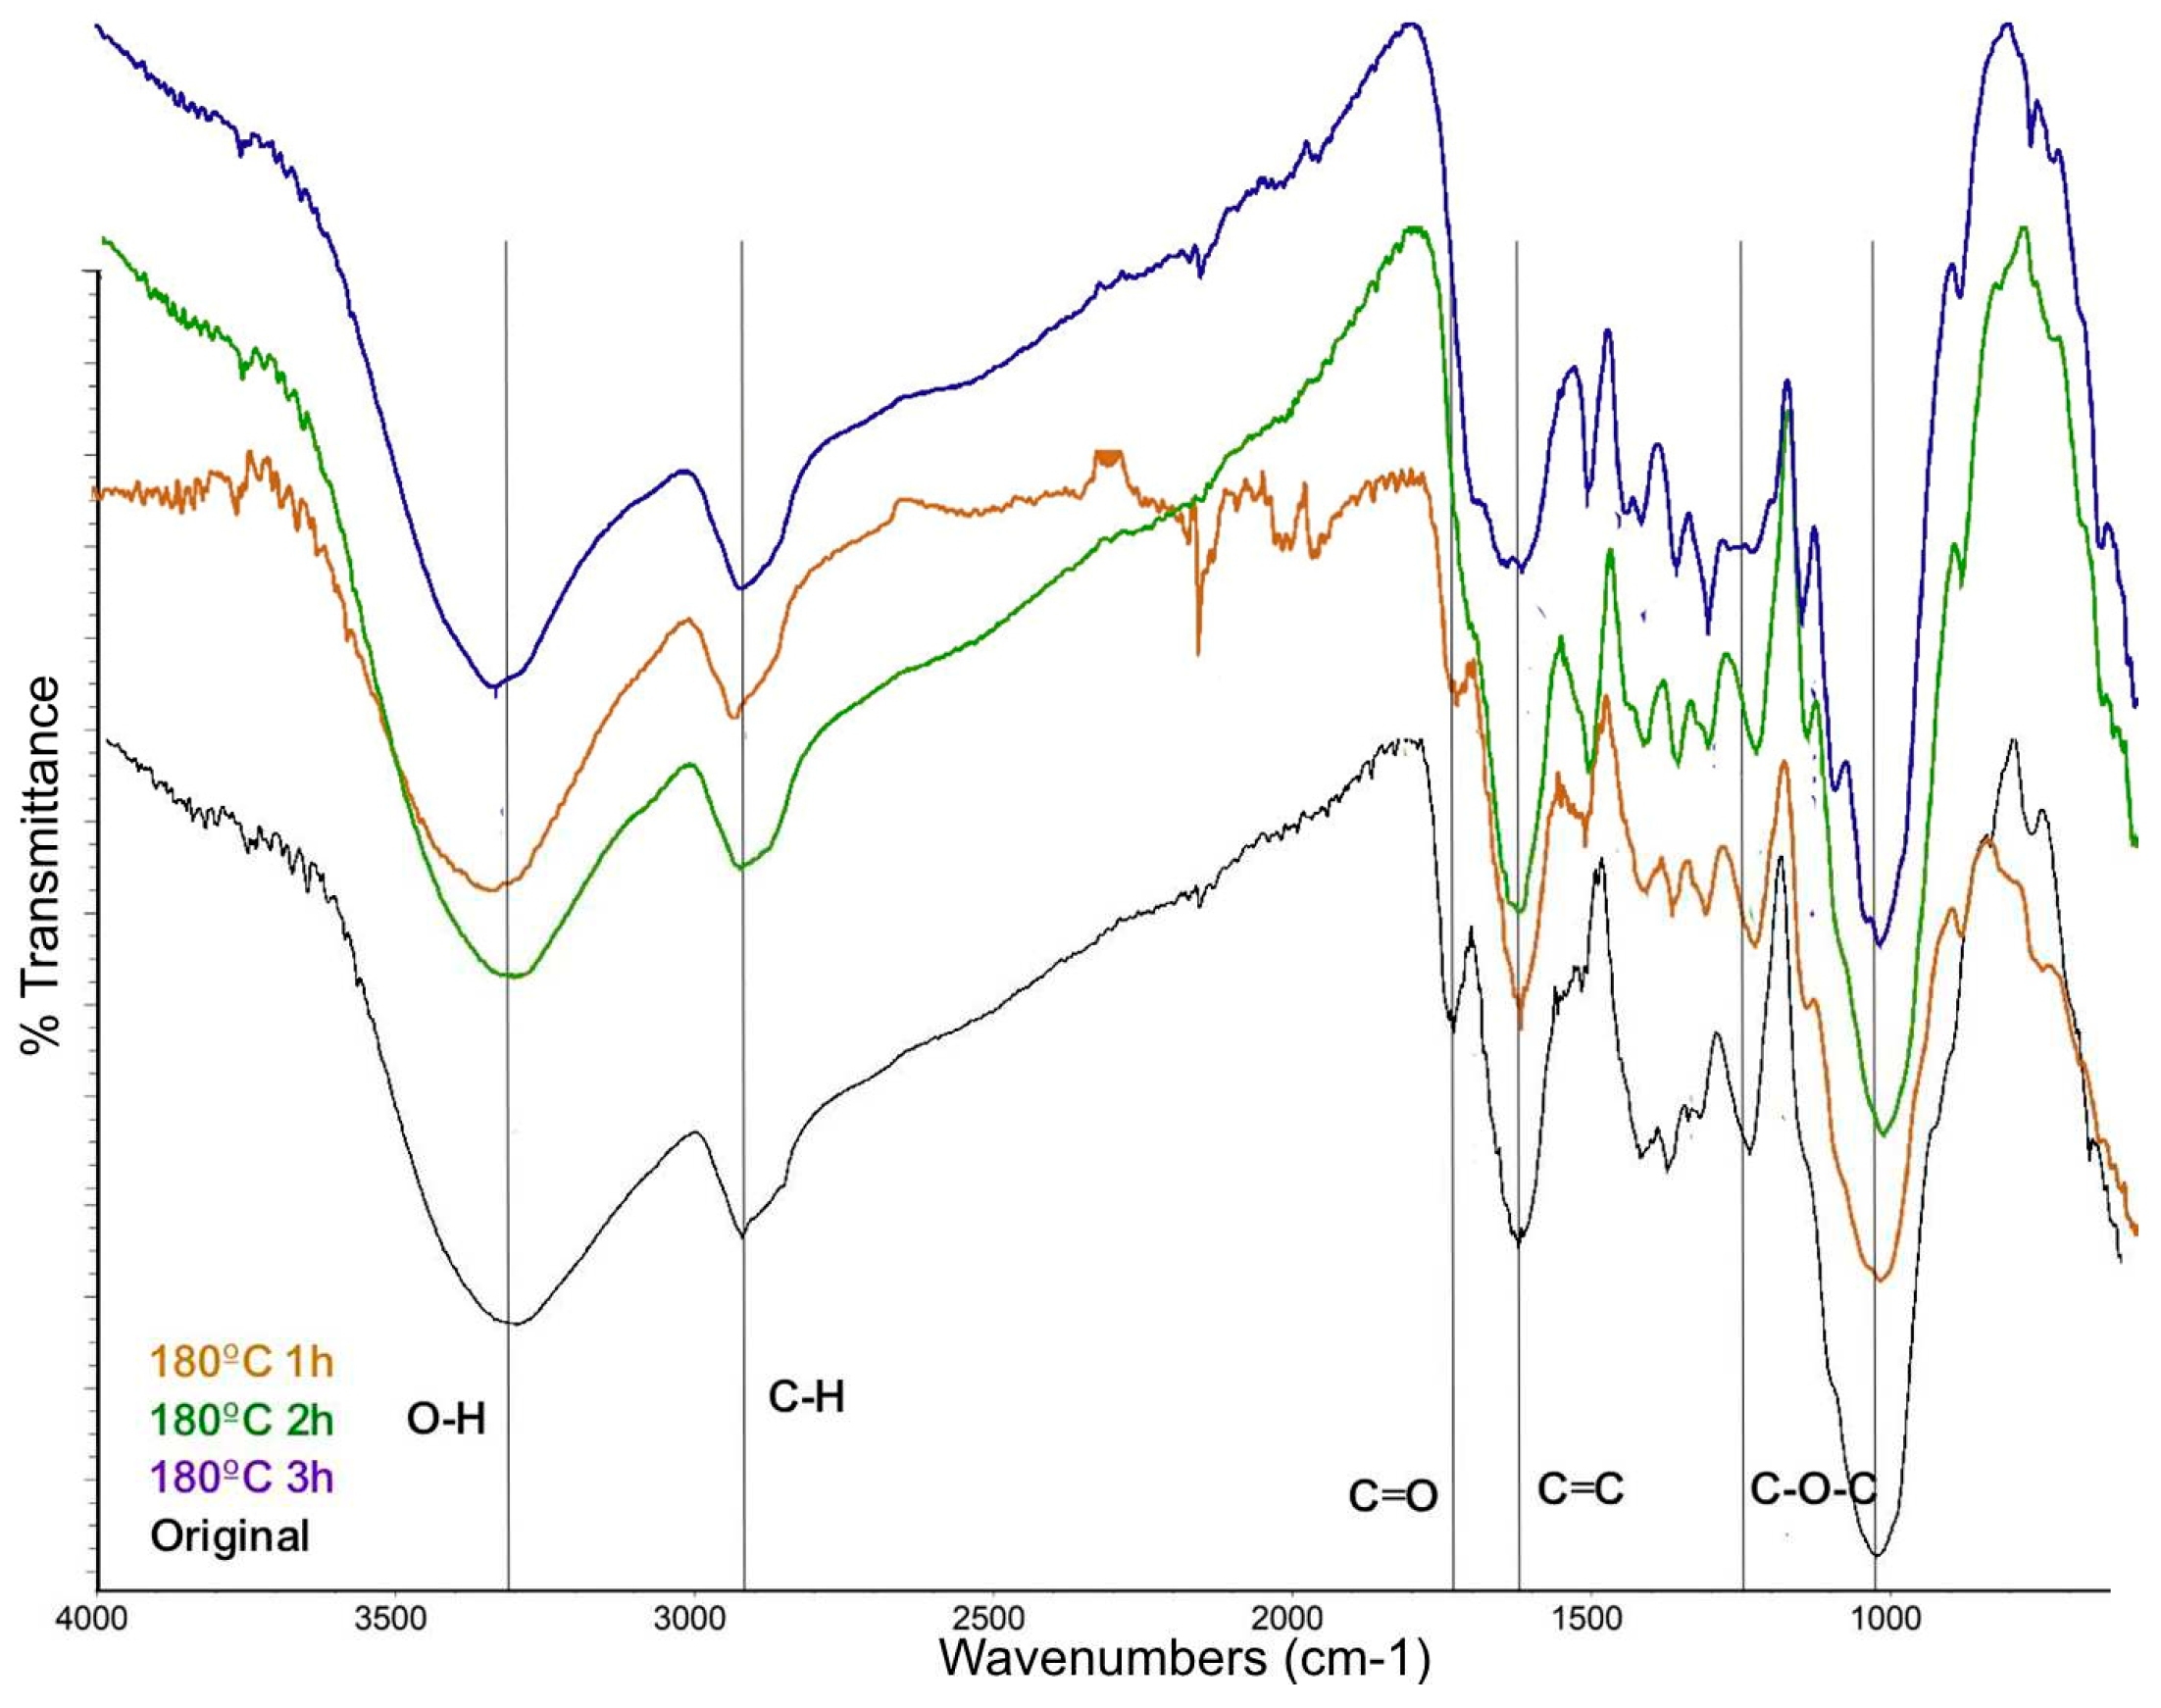
Figure 10.
Characterization of solid phase via van Krevelen diagram.
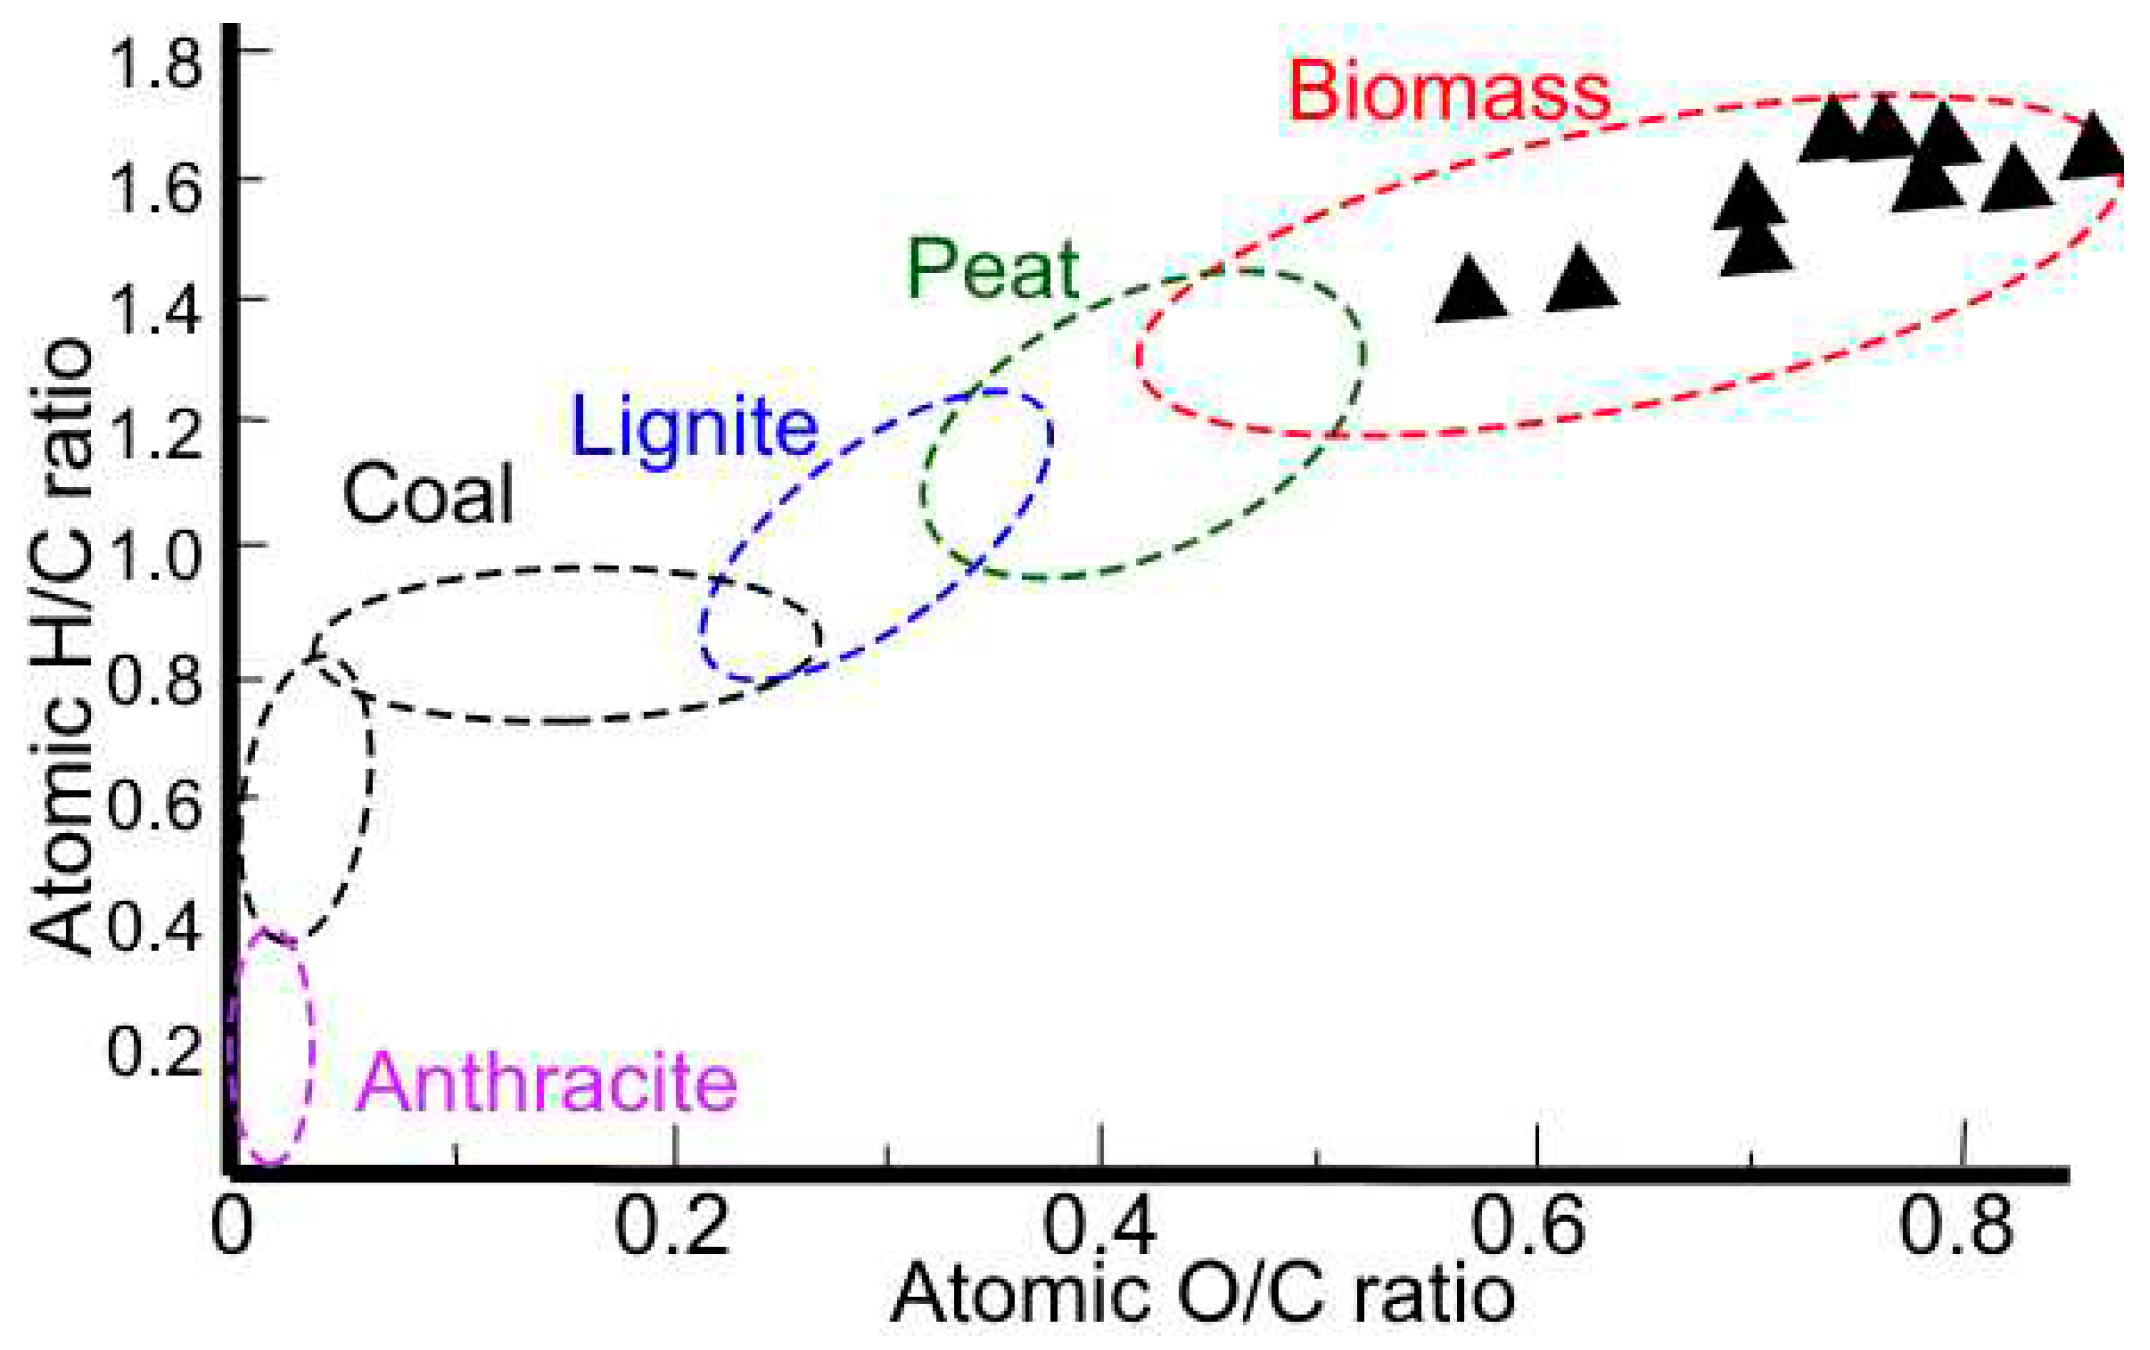
Figure 11.
Preliminary follow up of content of platform chemicals via HTC.
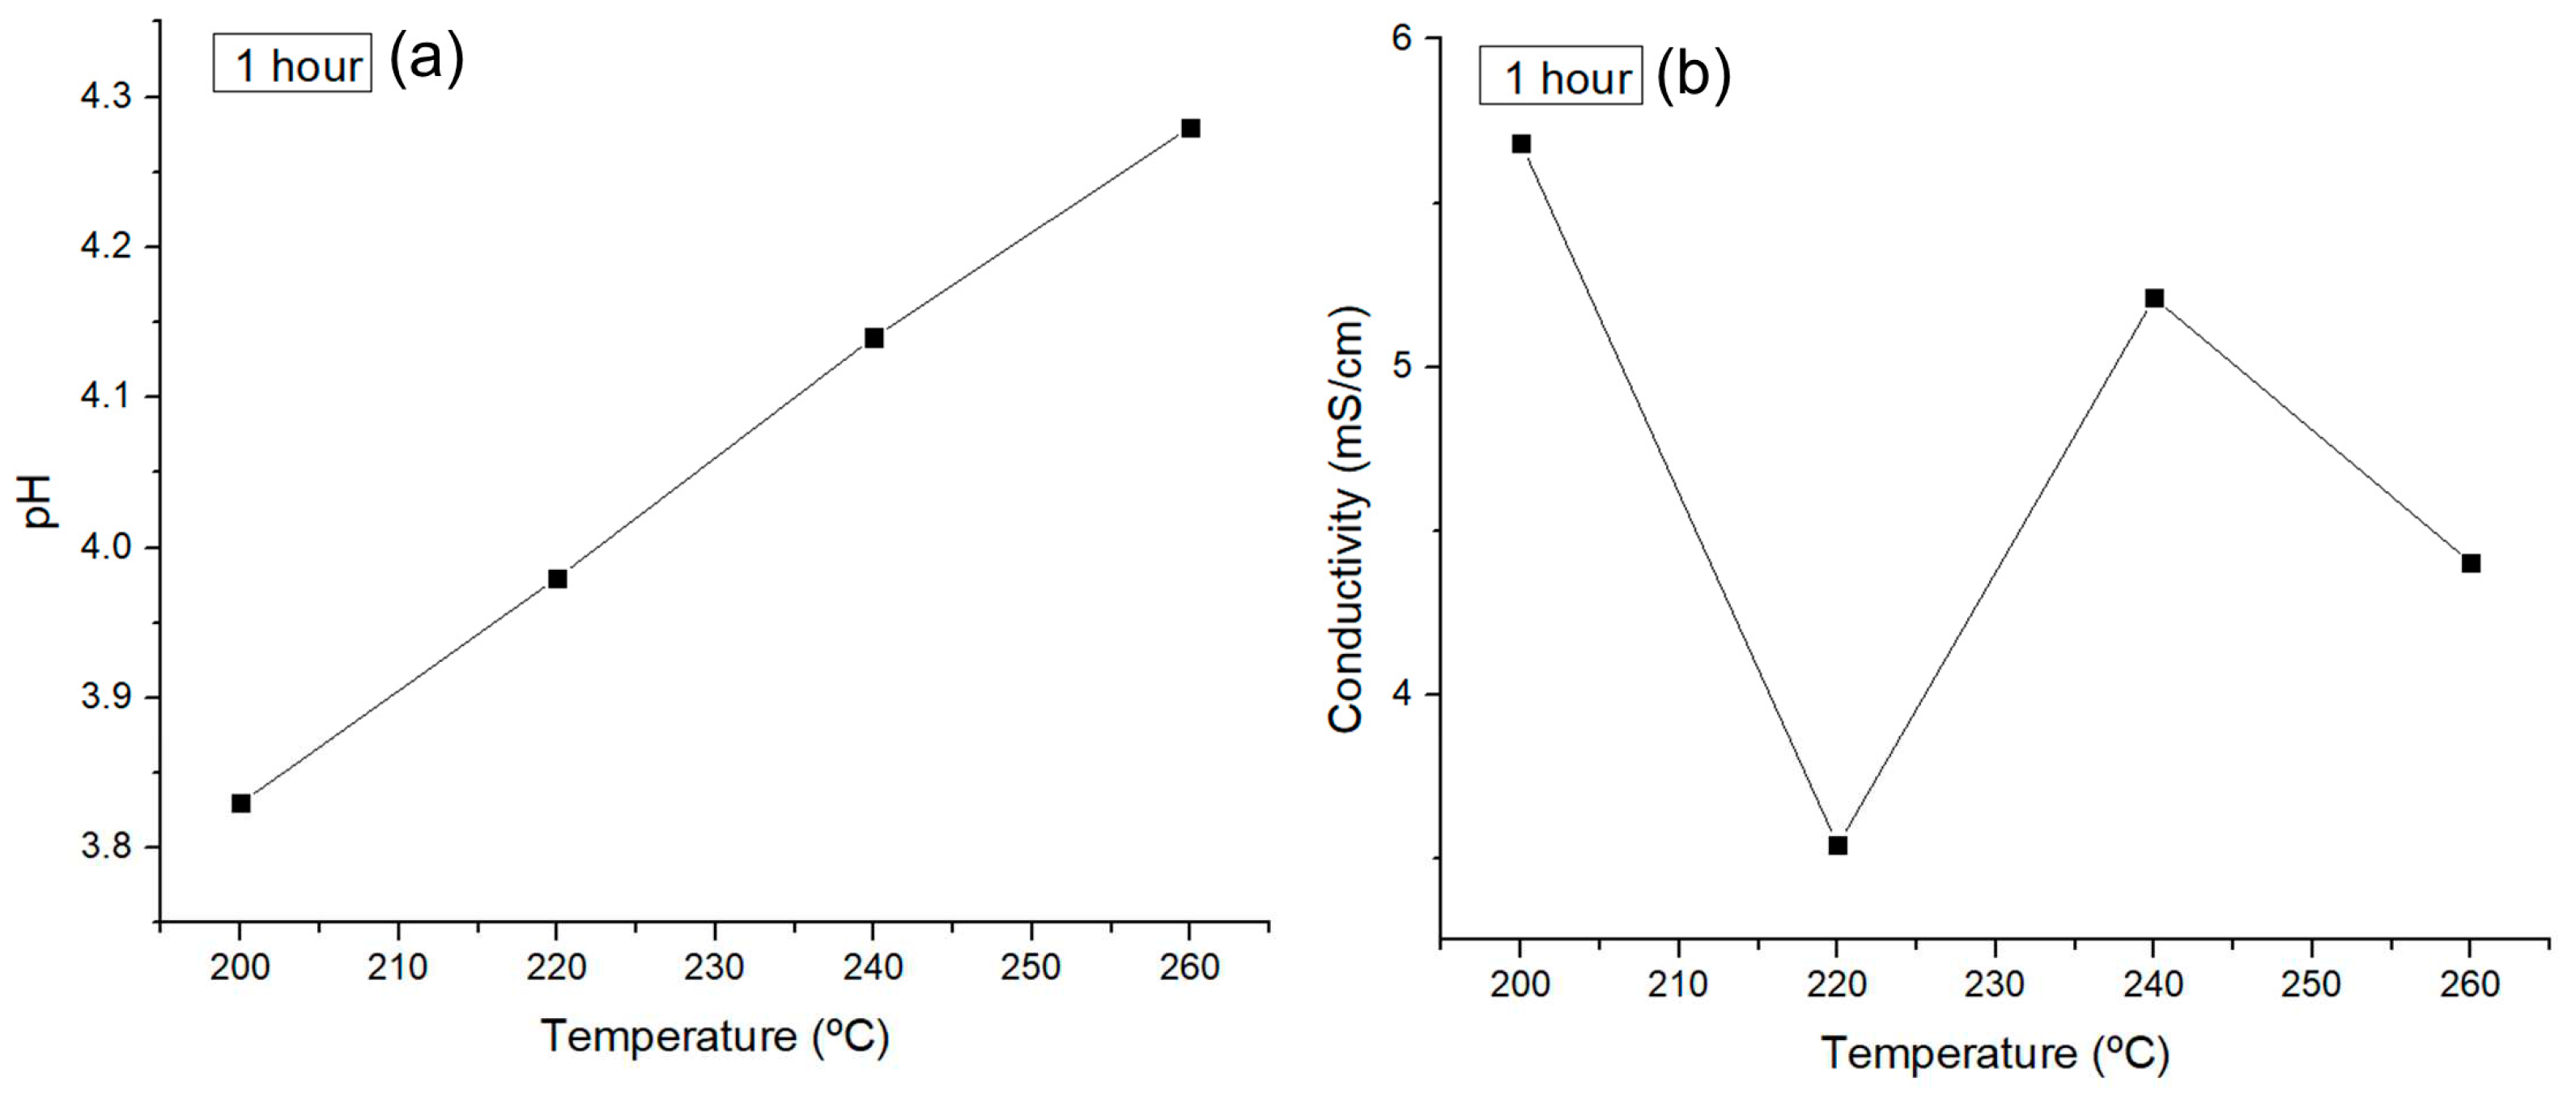
Figure 12.
Concentration of platform chemicals obtained via HTC.
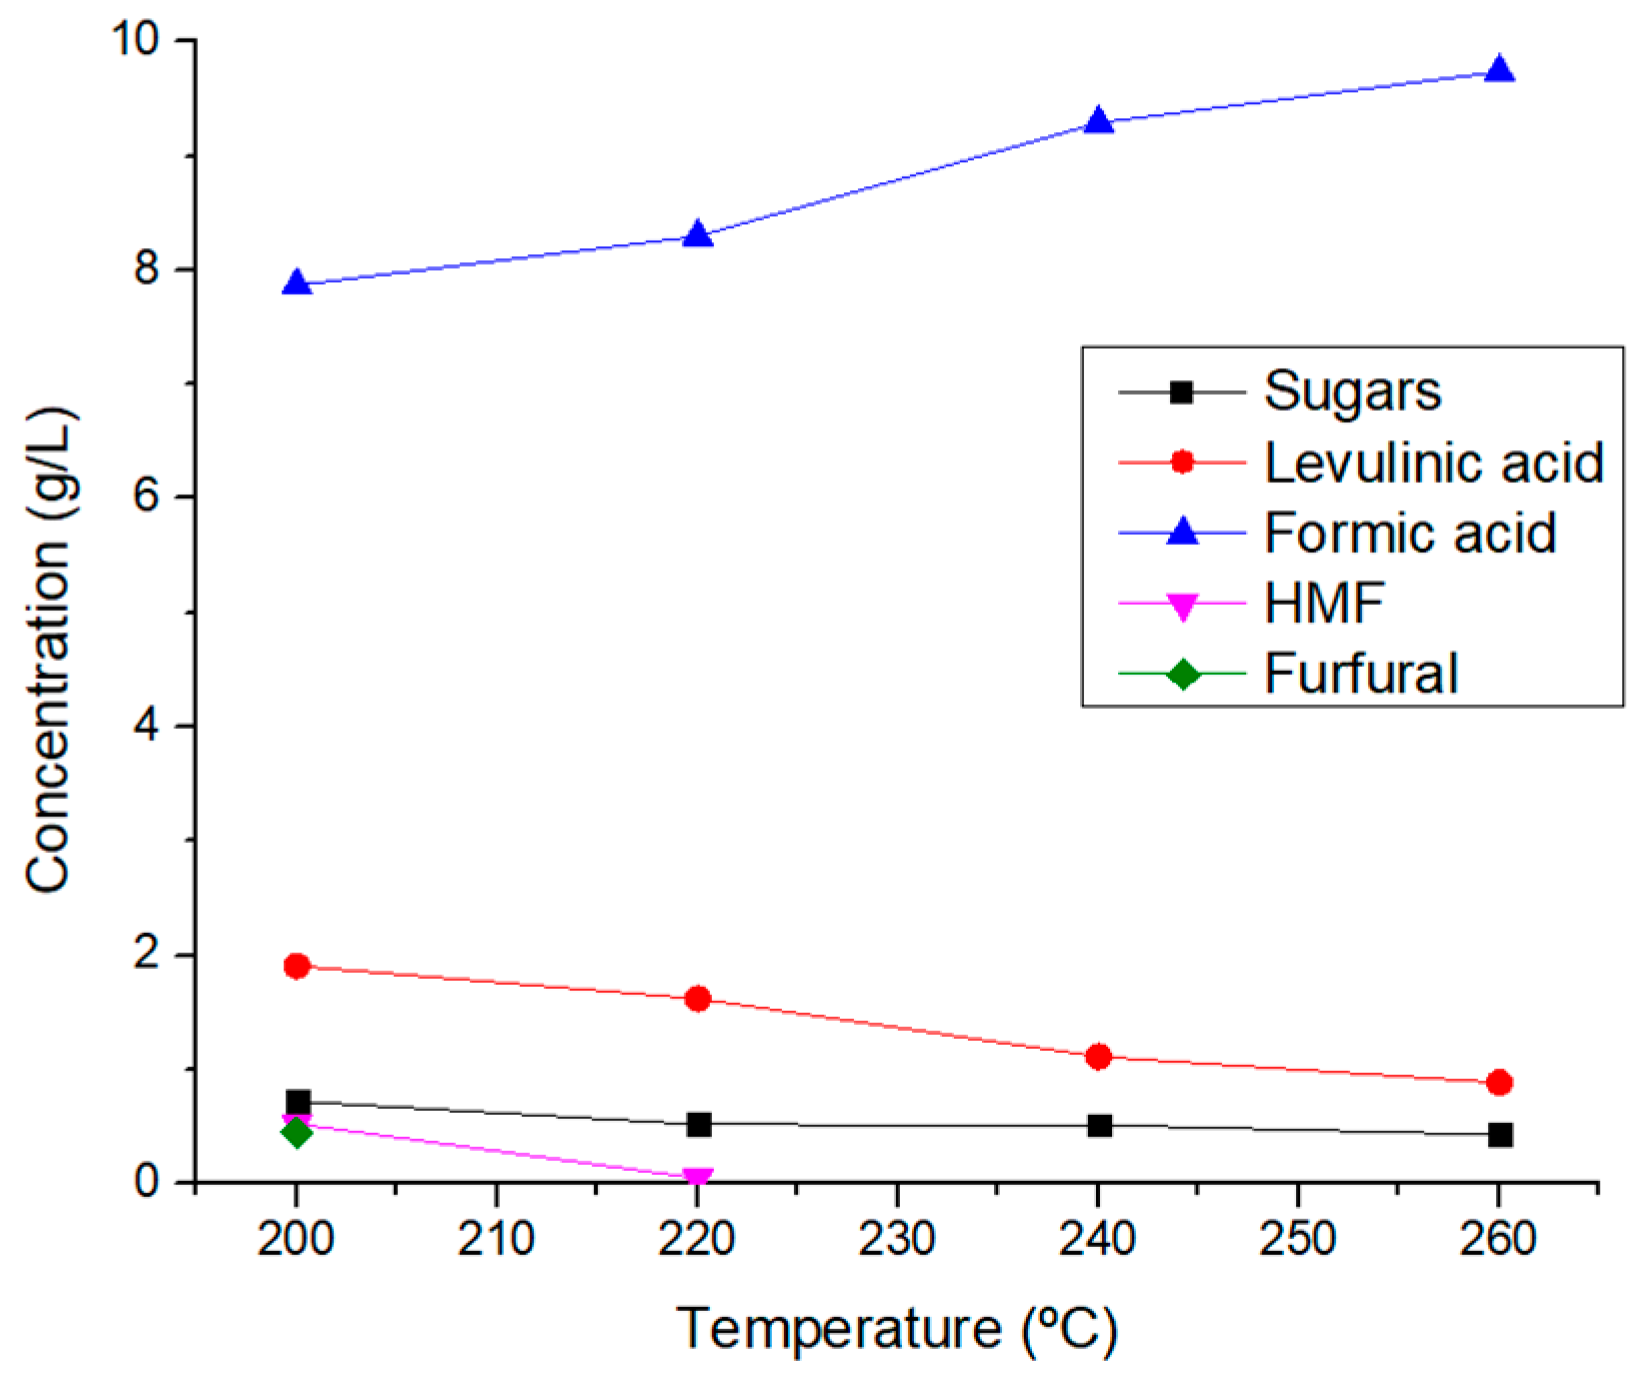
Figure 13.
Infrared spectrum of solid fractions obtained via HTC valorization.
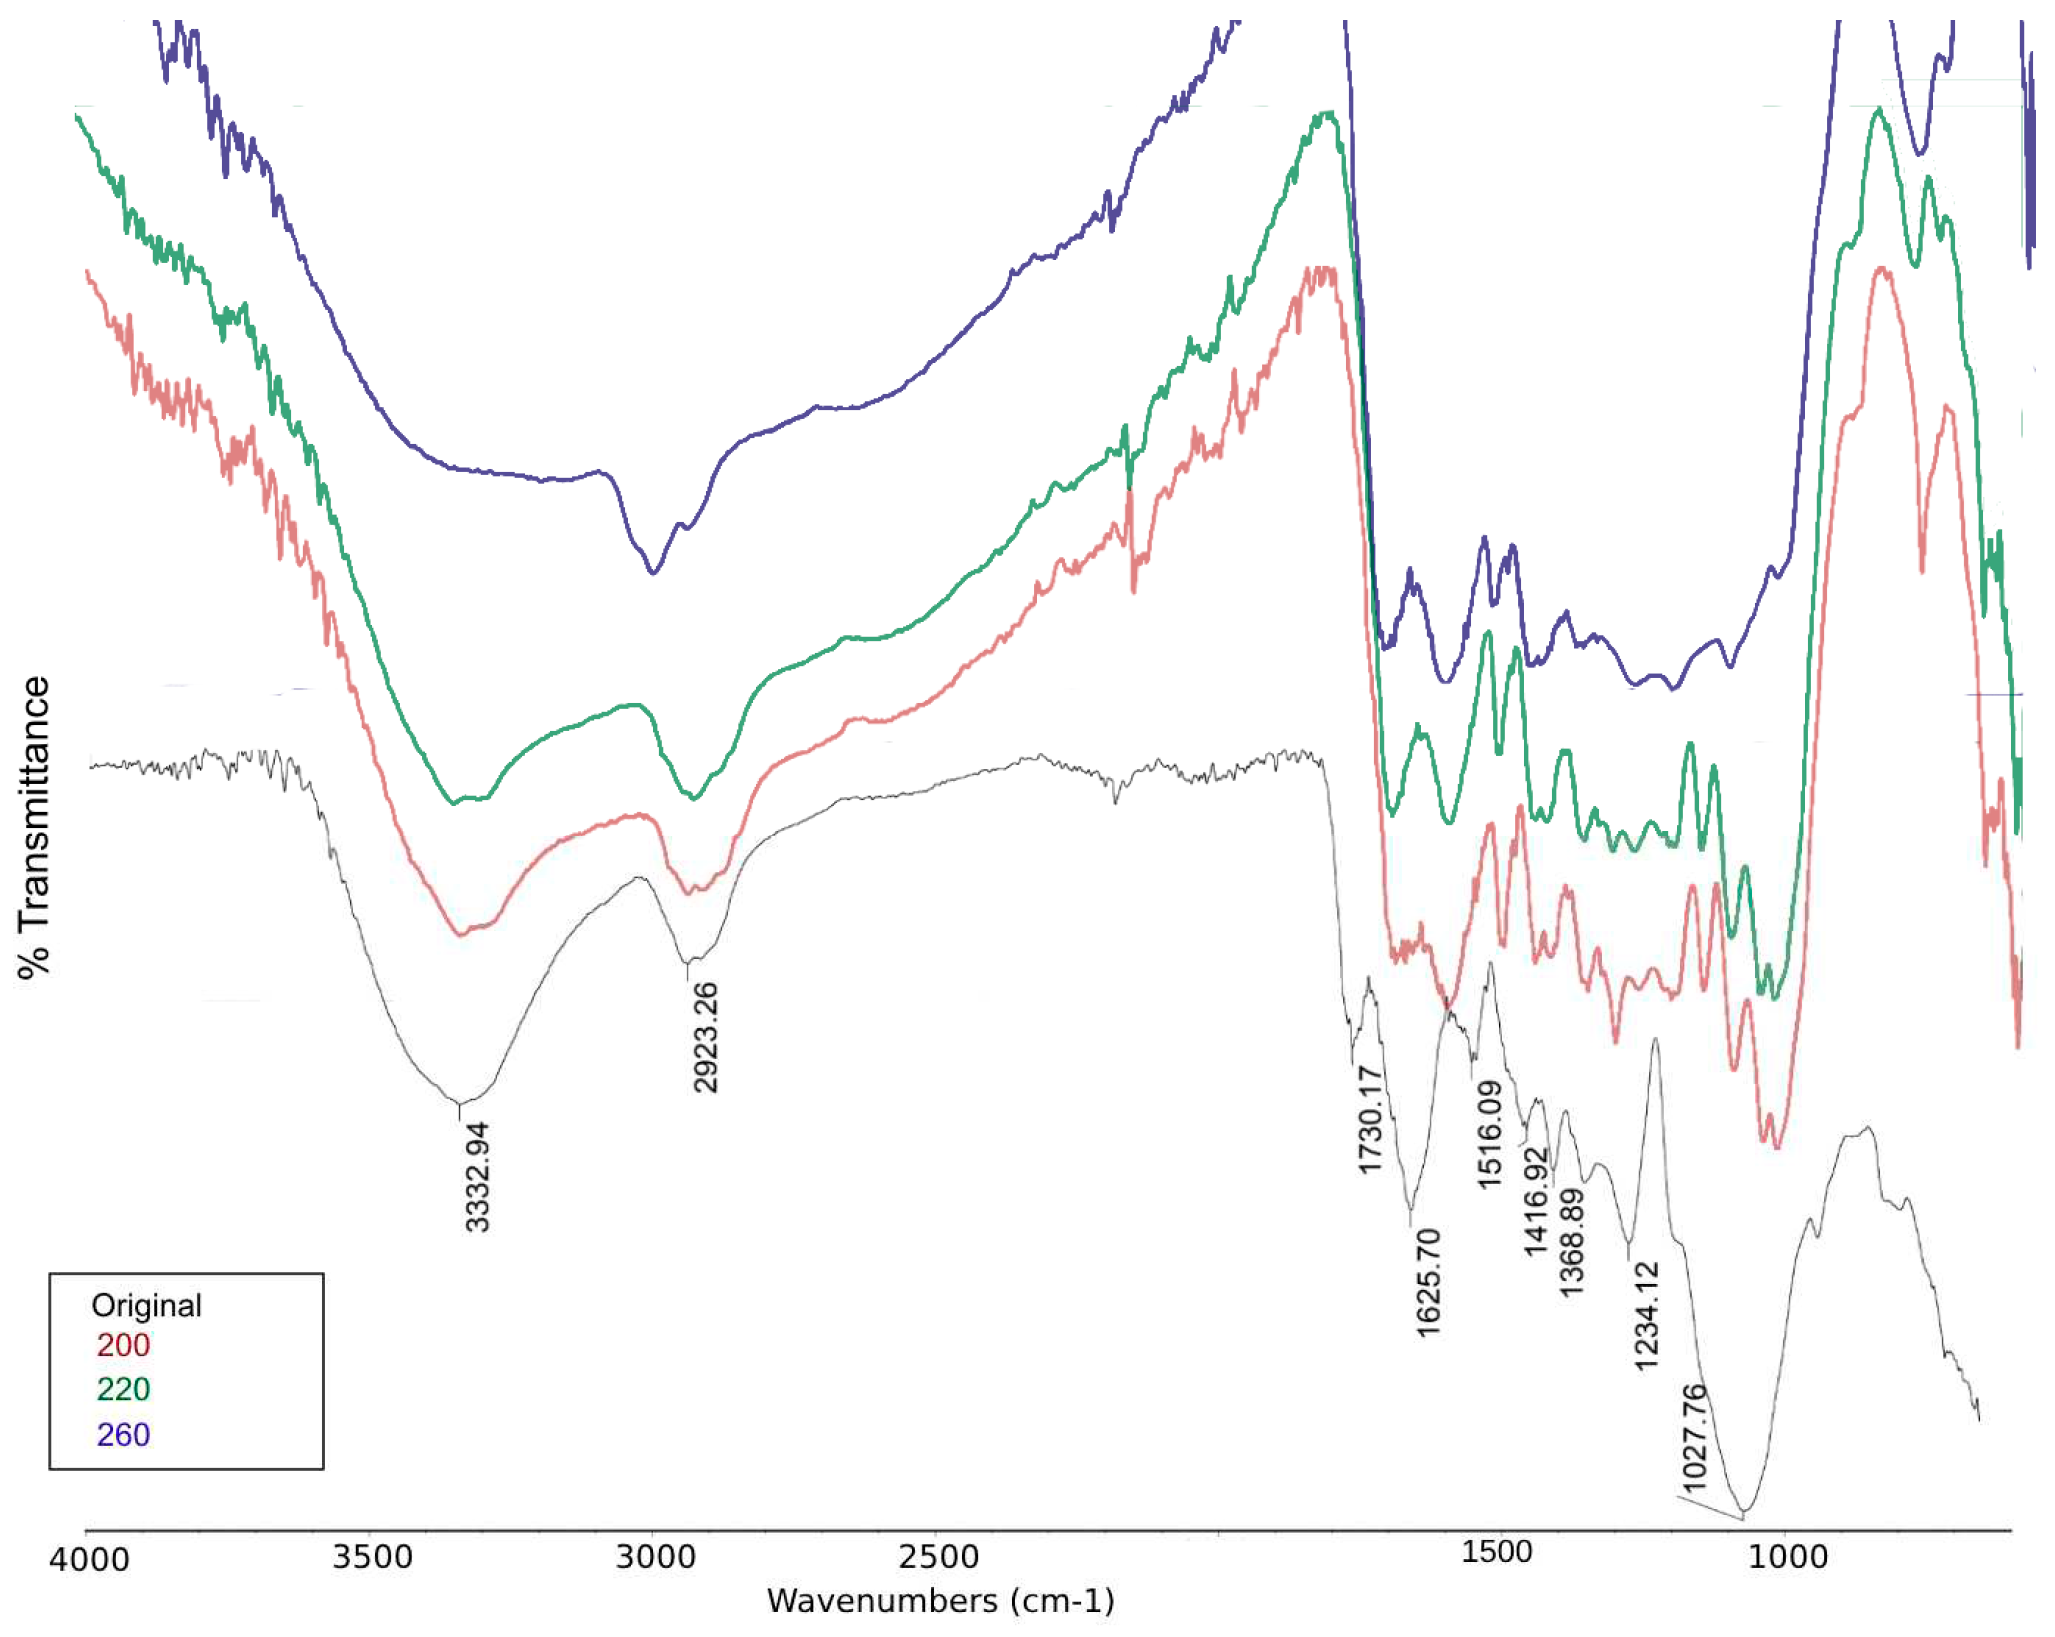
Figure 14.
Characterization of solid phase obtained by HTC via van Krevelen diagram.
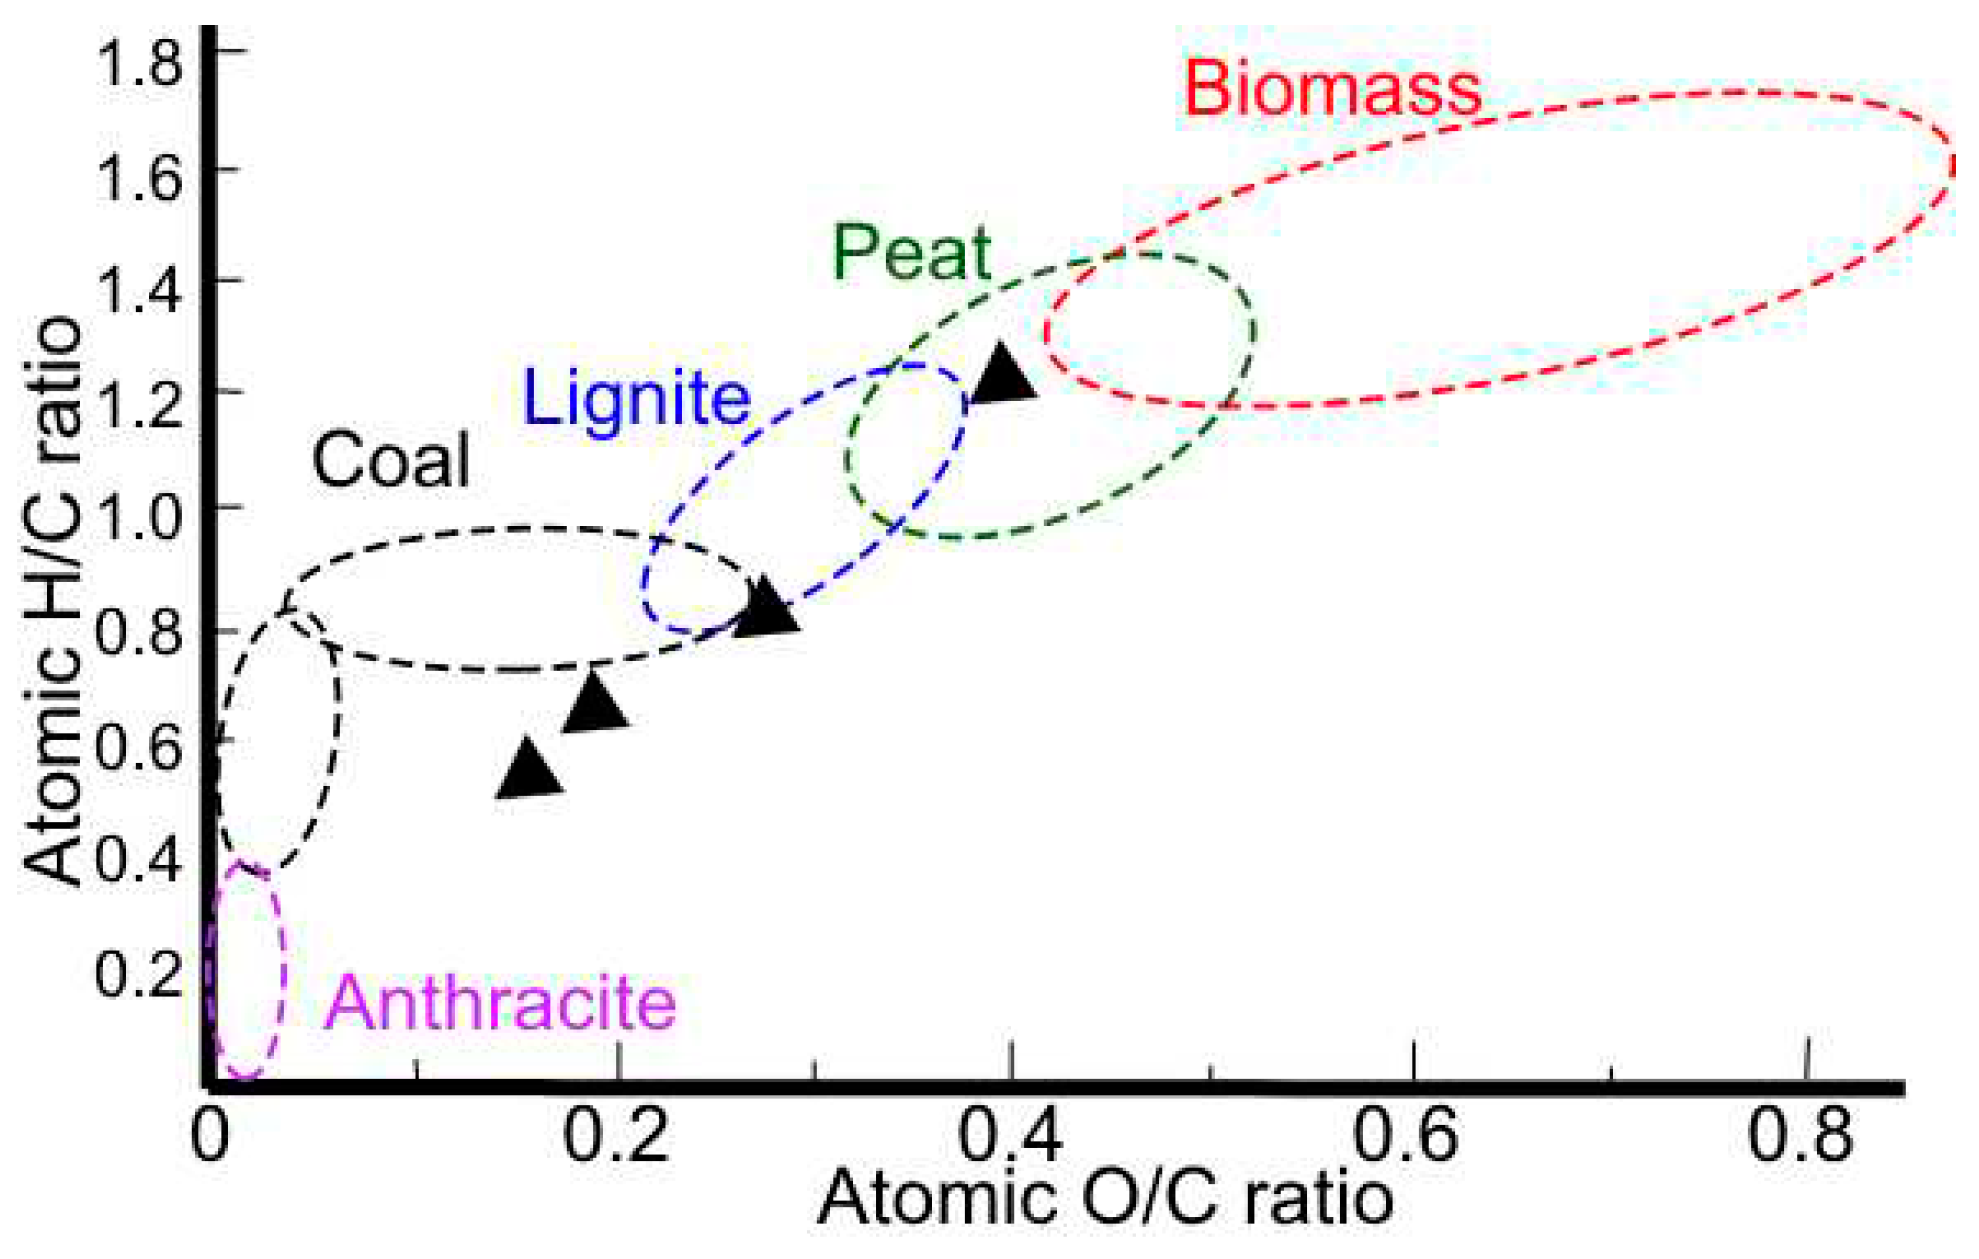
Figure 15.
Optimization of conditions (Temperature (ºC), Time (Hours), Catalysts) for obtention of sugars. *W/O = Without.
Figure 15.
Optimization of conditions (Temperature (ºC), Time (Hours), Catalysts) for obtention of sugars. *W/O = Without.
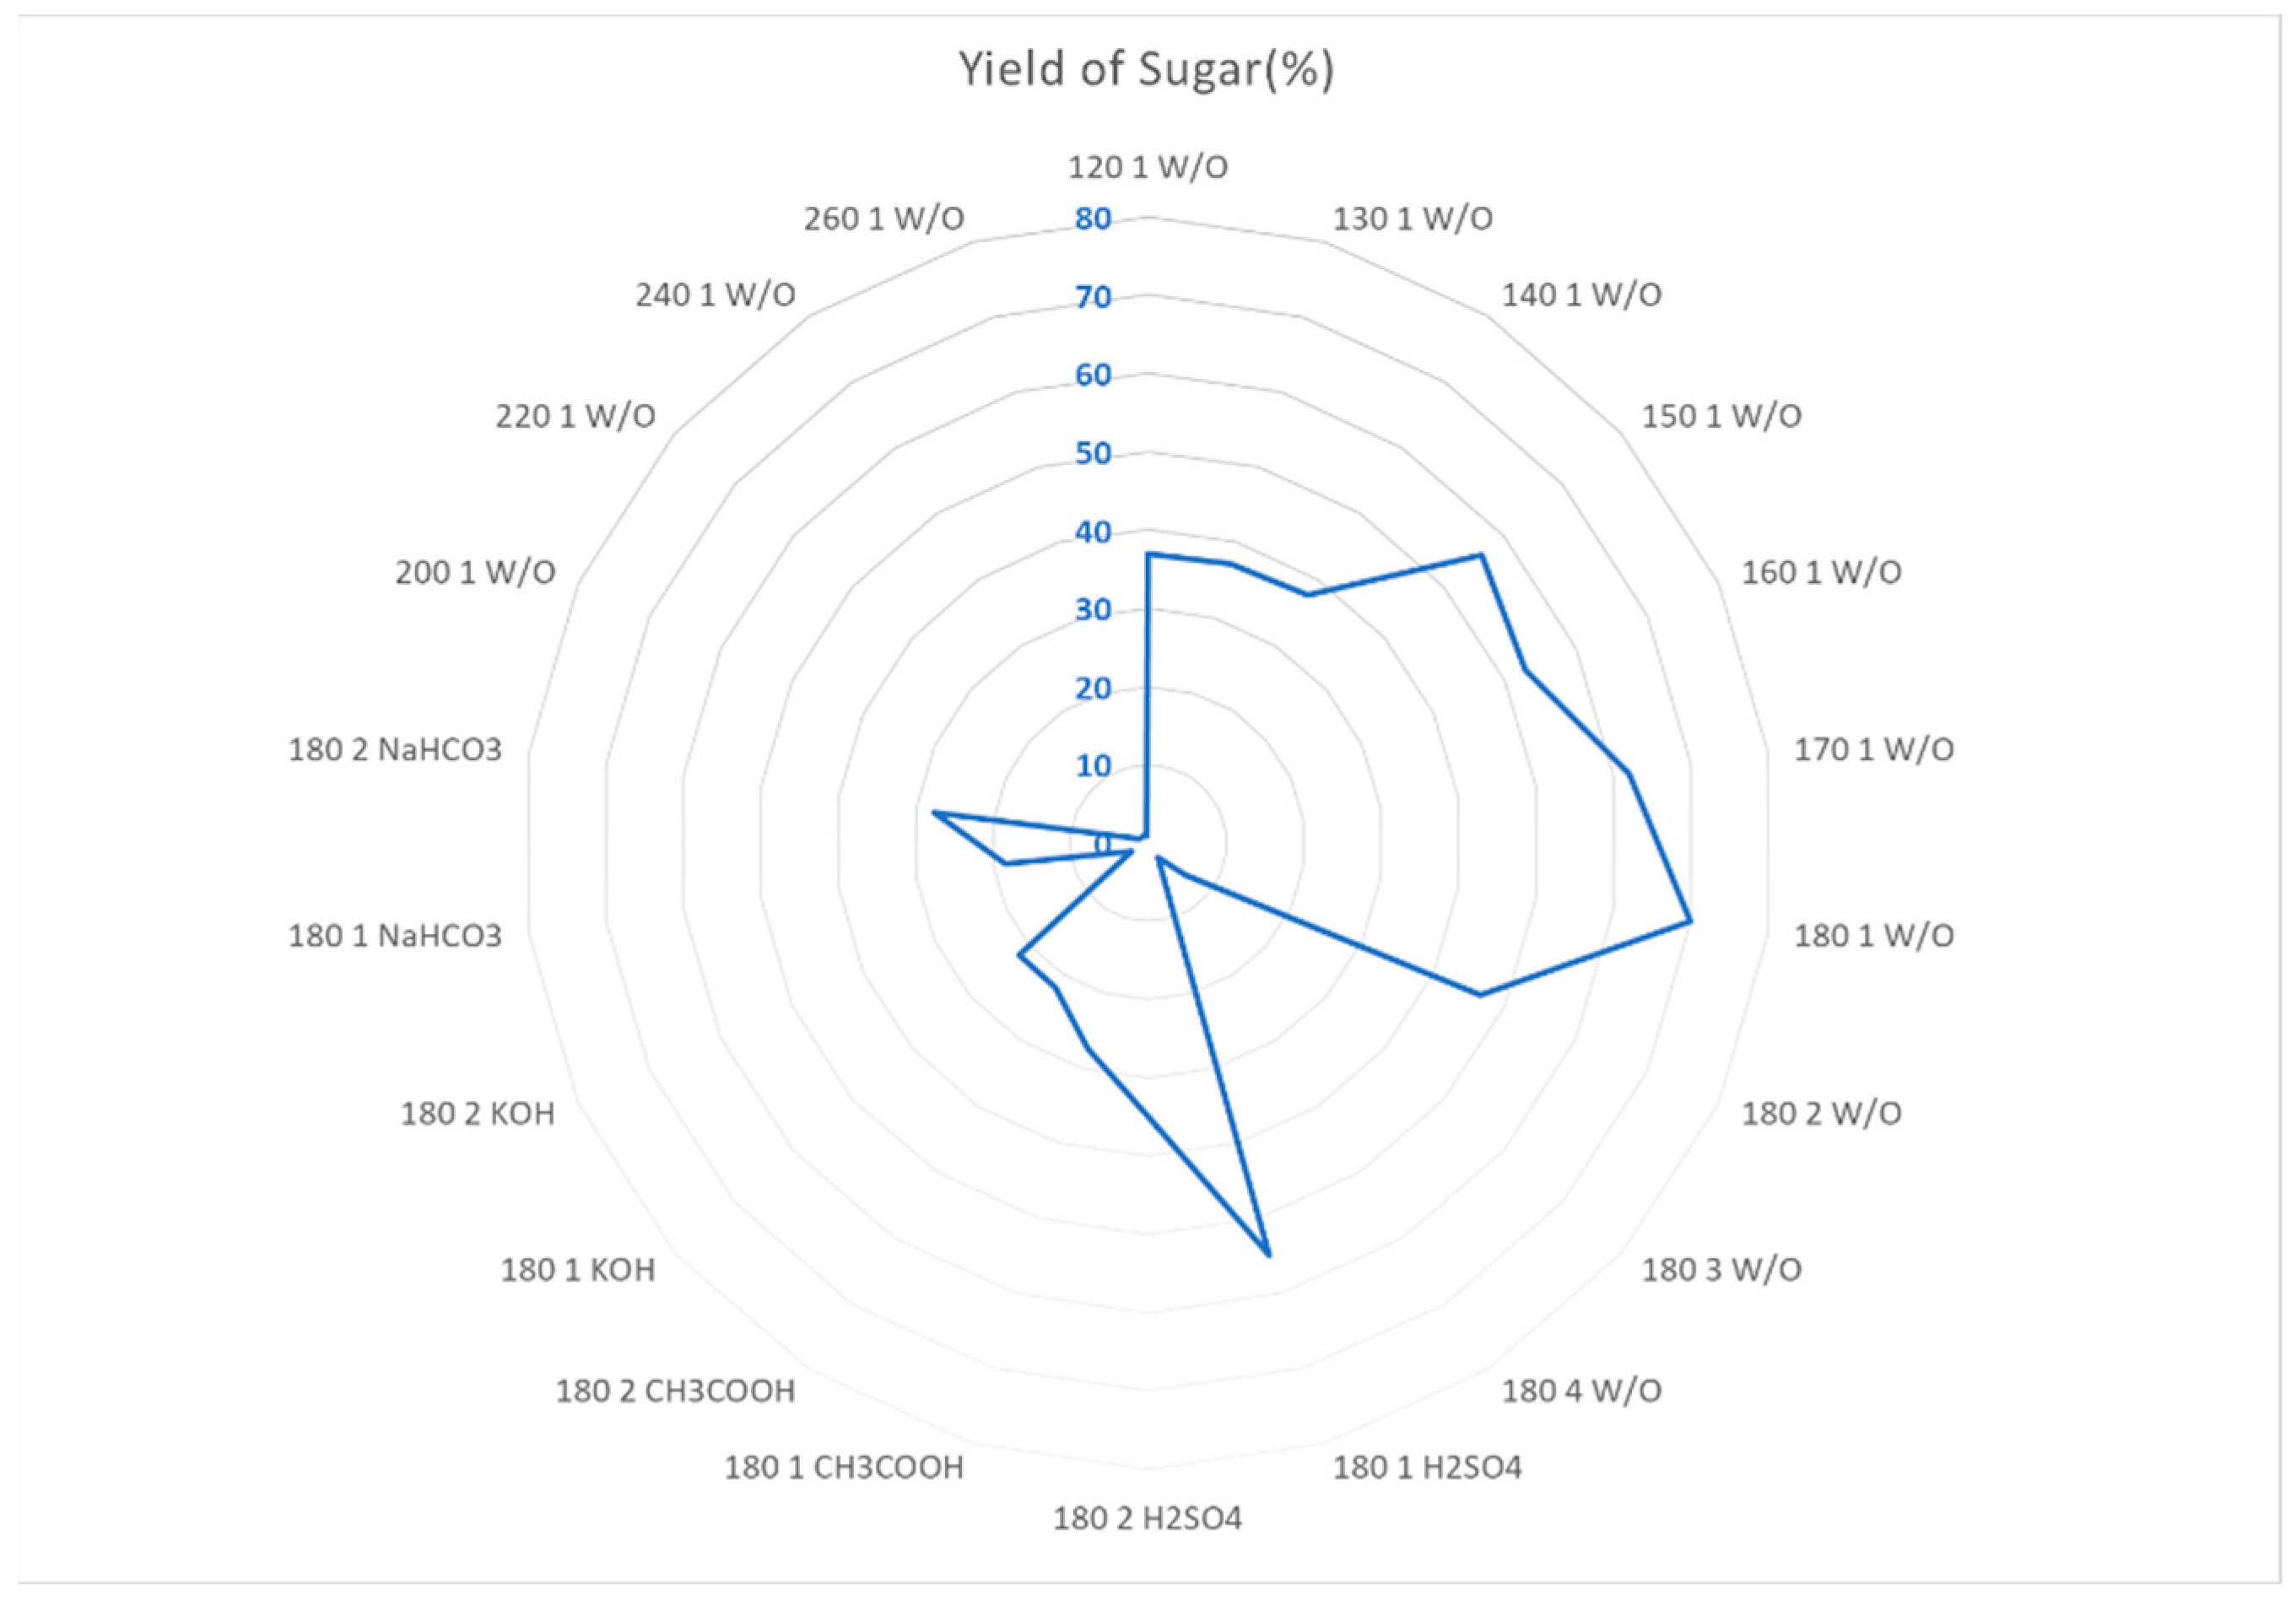
Figure 16.
Optimization of conditions (Temperature (ºC), Time (Hours), Catalysts) for obtention of formic acid. *W/O = Without.
Figure 16.
Optimization of conditions (Temperature (ºC), Time (Hours), Catalysts) for obtention of formic acid. *W/O = Without.
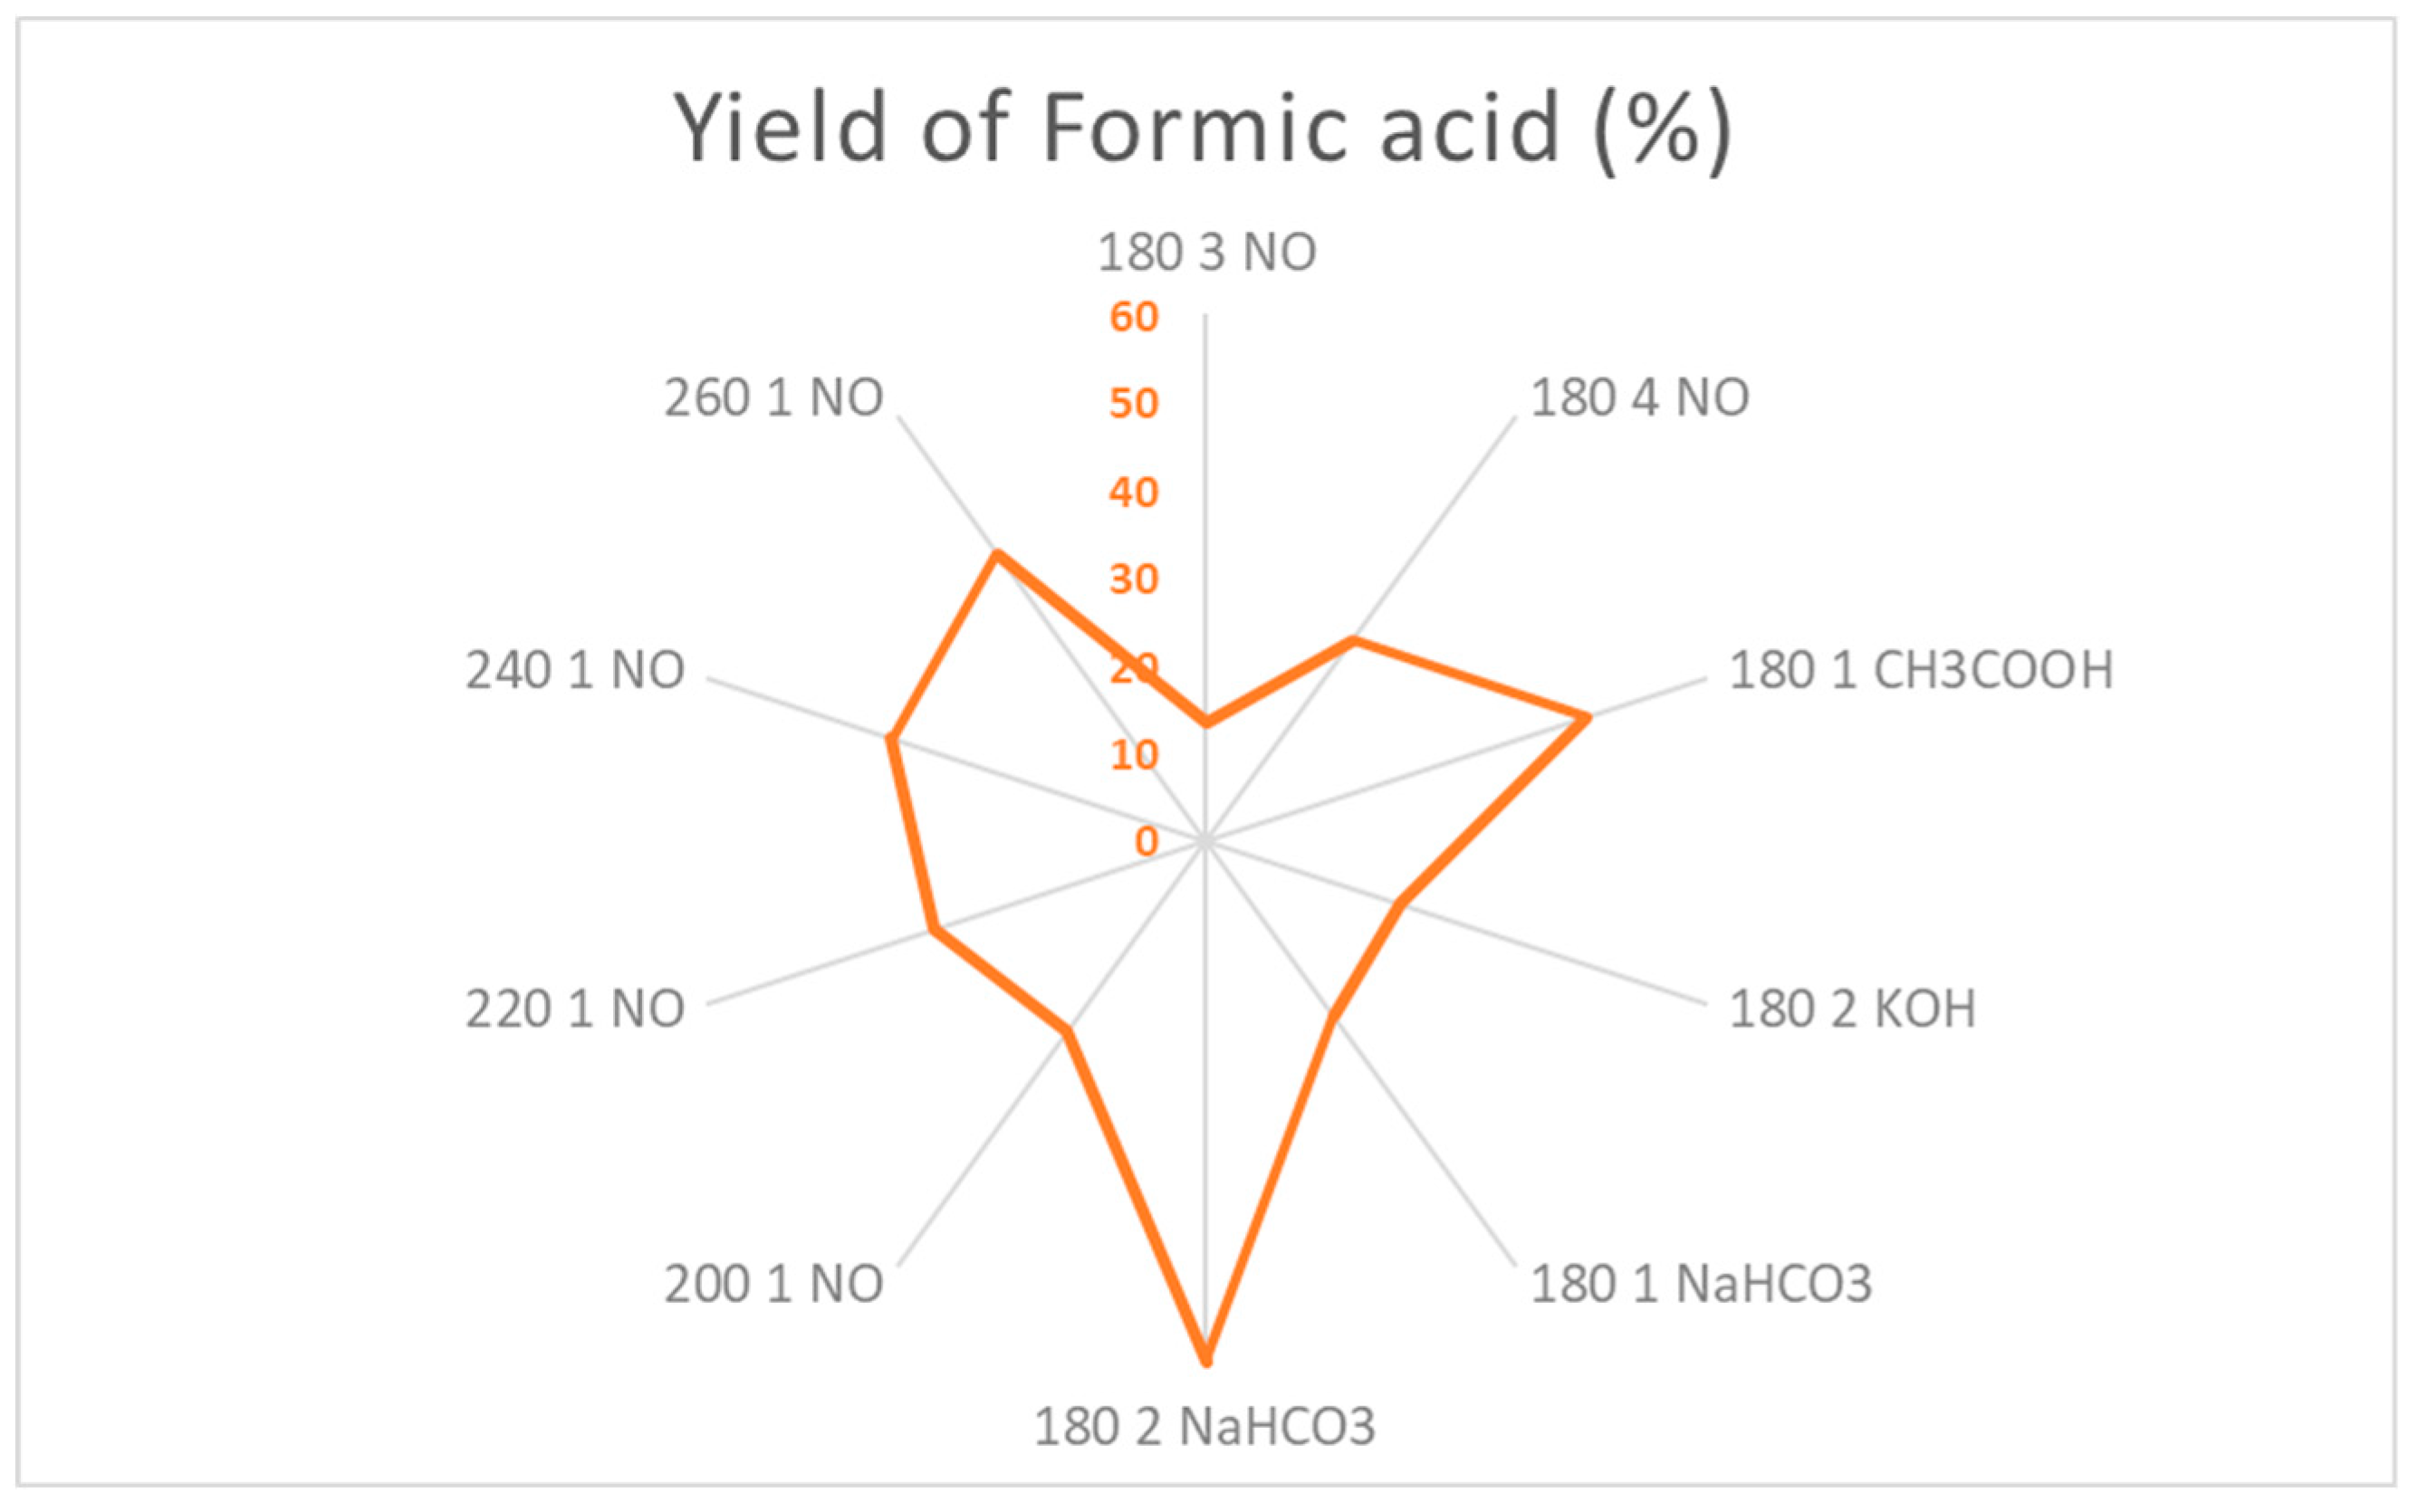
Figure 17.
Optimization of conditions (Temperature (ºC), Time (Hours), Catalysts) for obtention of levulinic acid. *W/O = Without.
Figure 17.
Optimization of conditions (Temperature (ºC), Time (Hours), Catalysts) for obtention of levulinic acid. *W/O = Without.
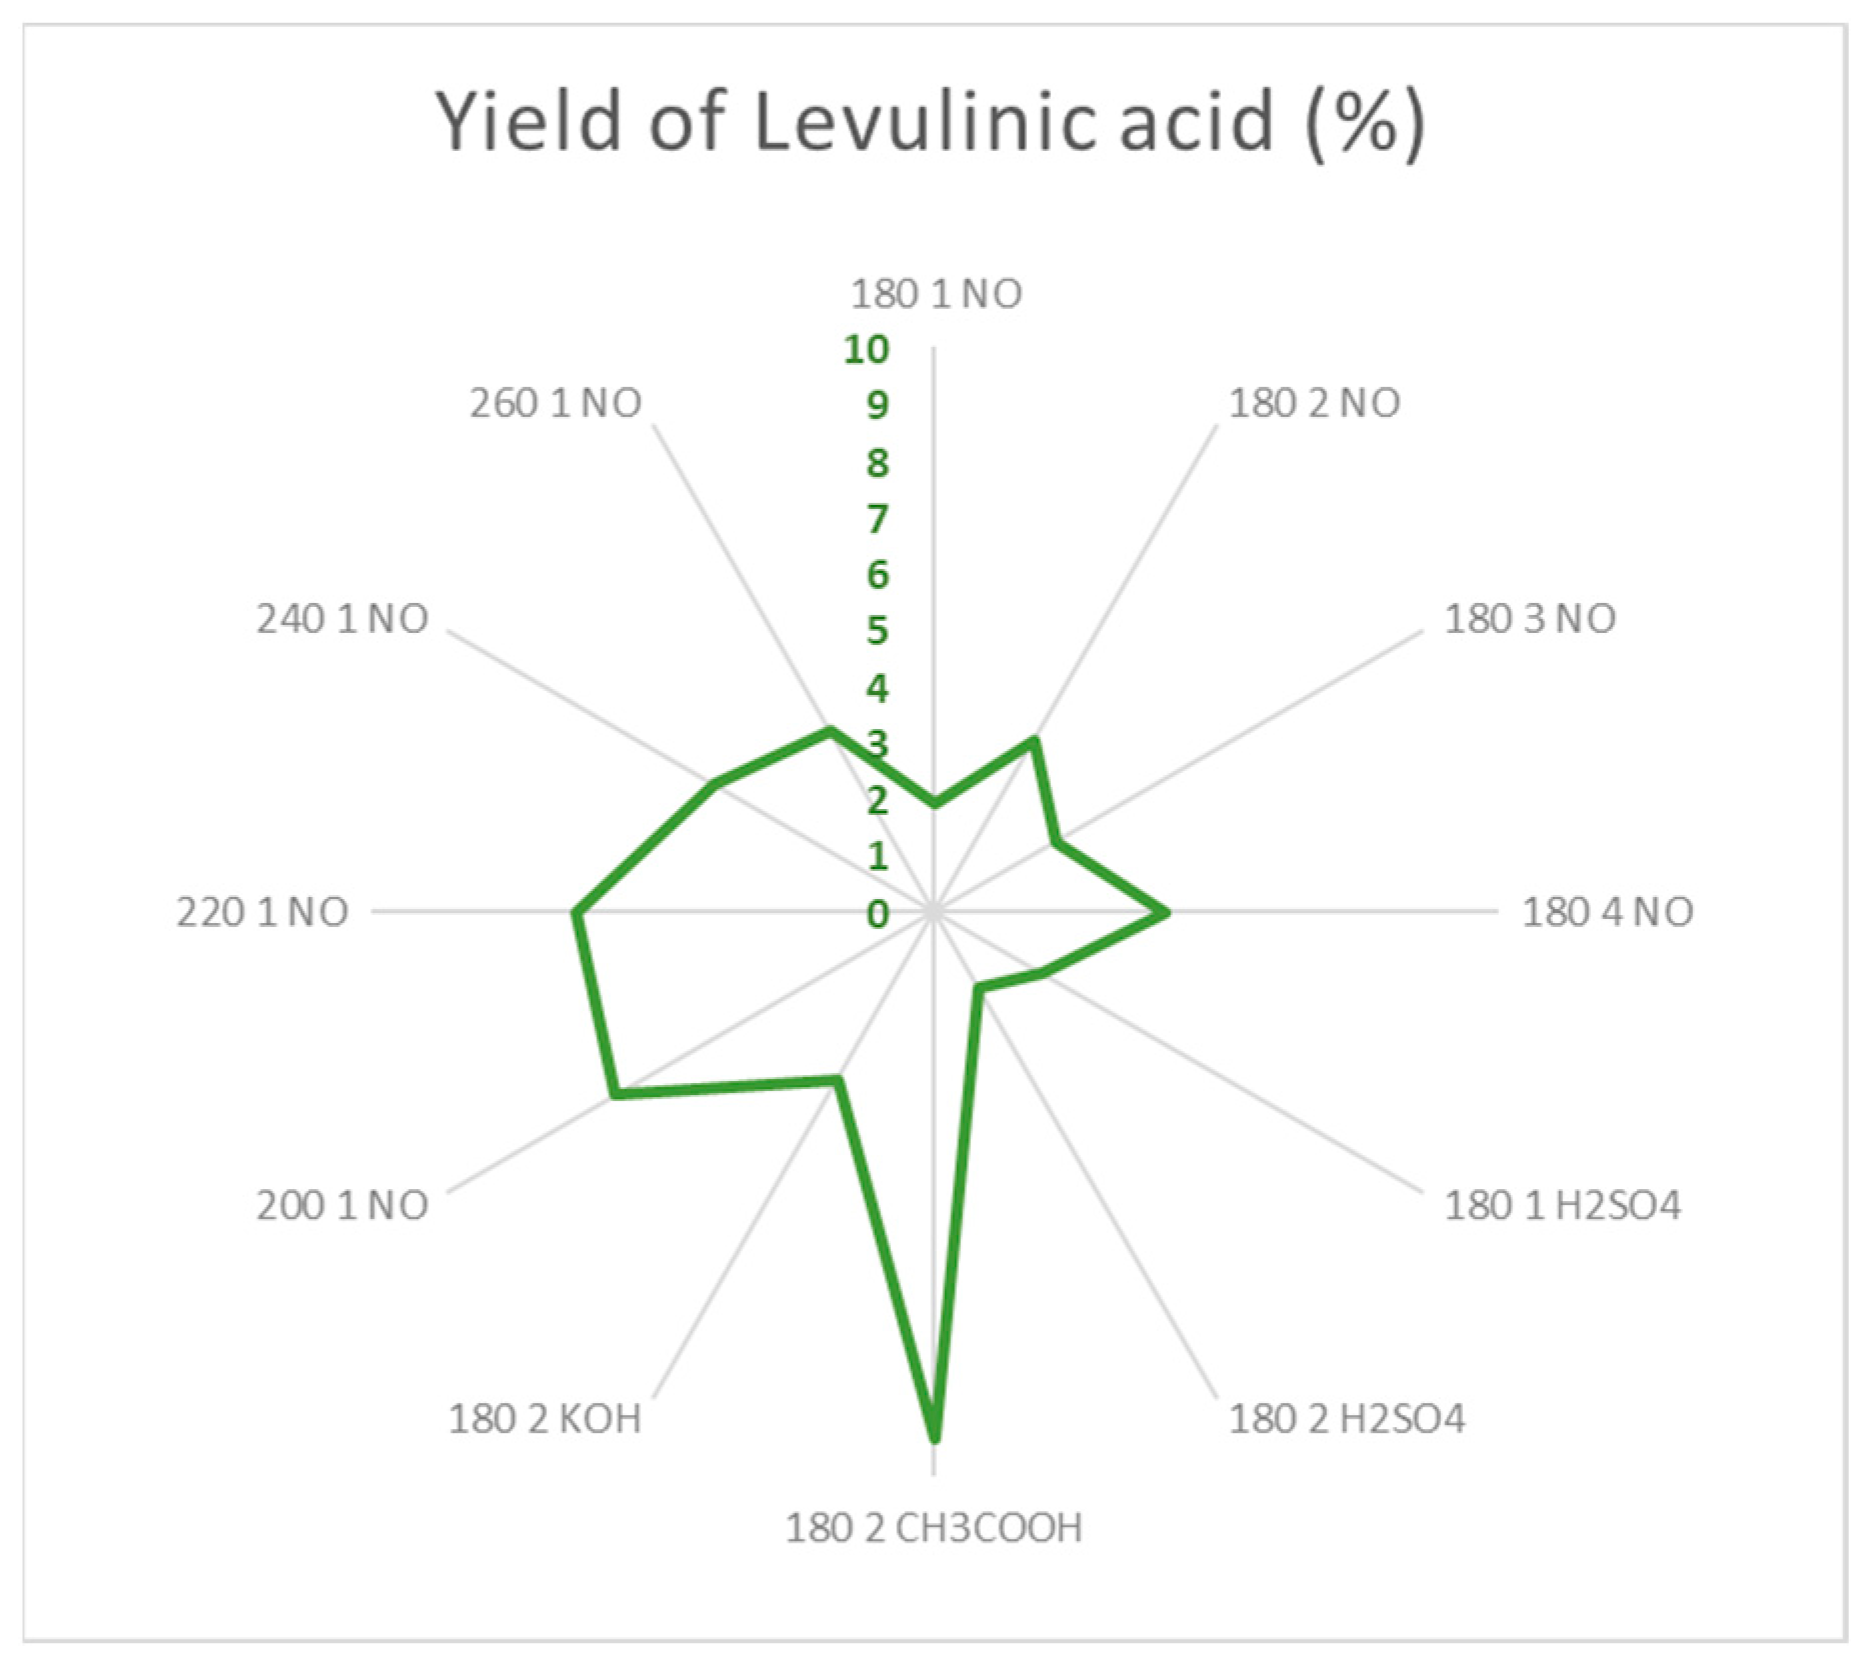
Figure 18.
Optimization of conditions (Temperature (ºC), Time (Hours), Catalysts) for obtention of HMF and Furfural. *W/O = Without.
Figure 18.
Optimization of conditions (Temperature (ºC), Time (Hours), Catalysts) for obtention of HMF and Furfural. *W/O = Without.
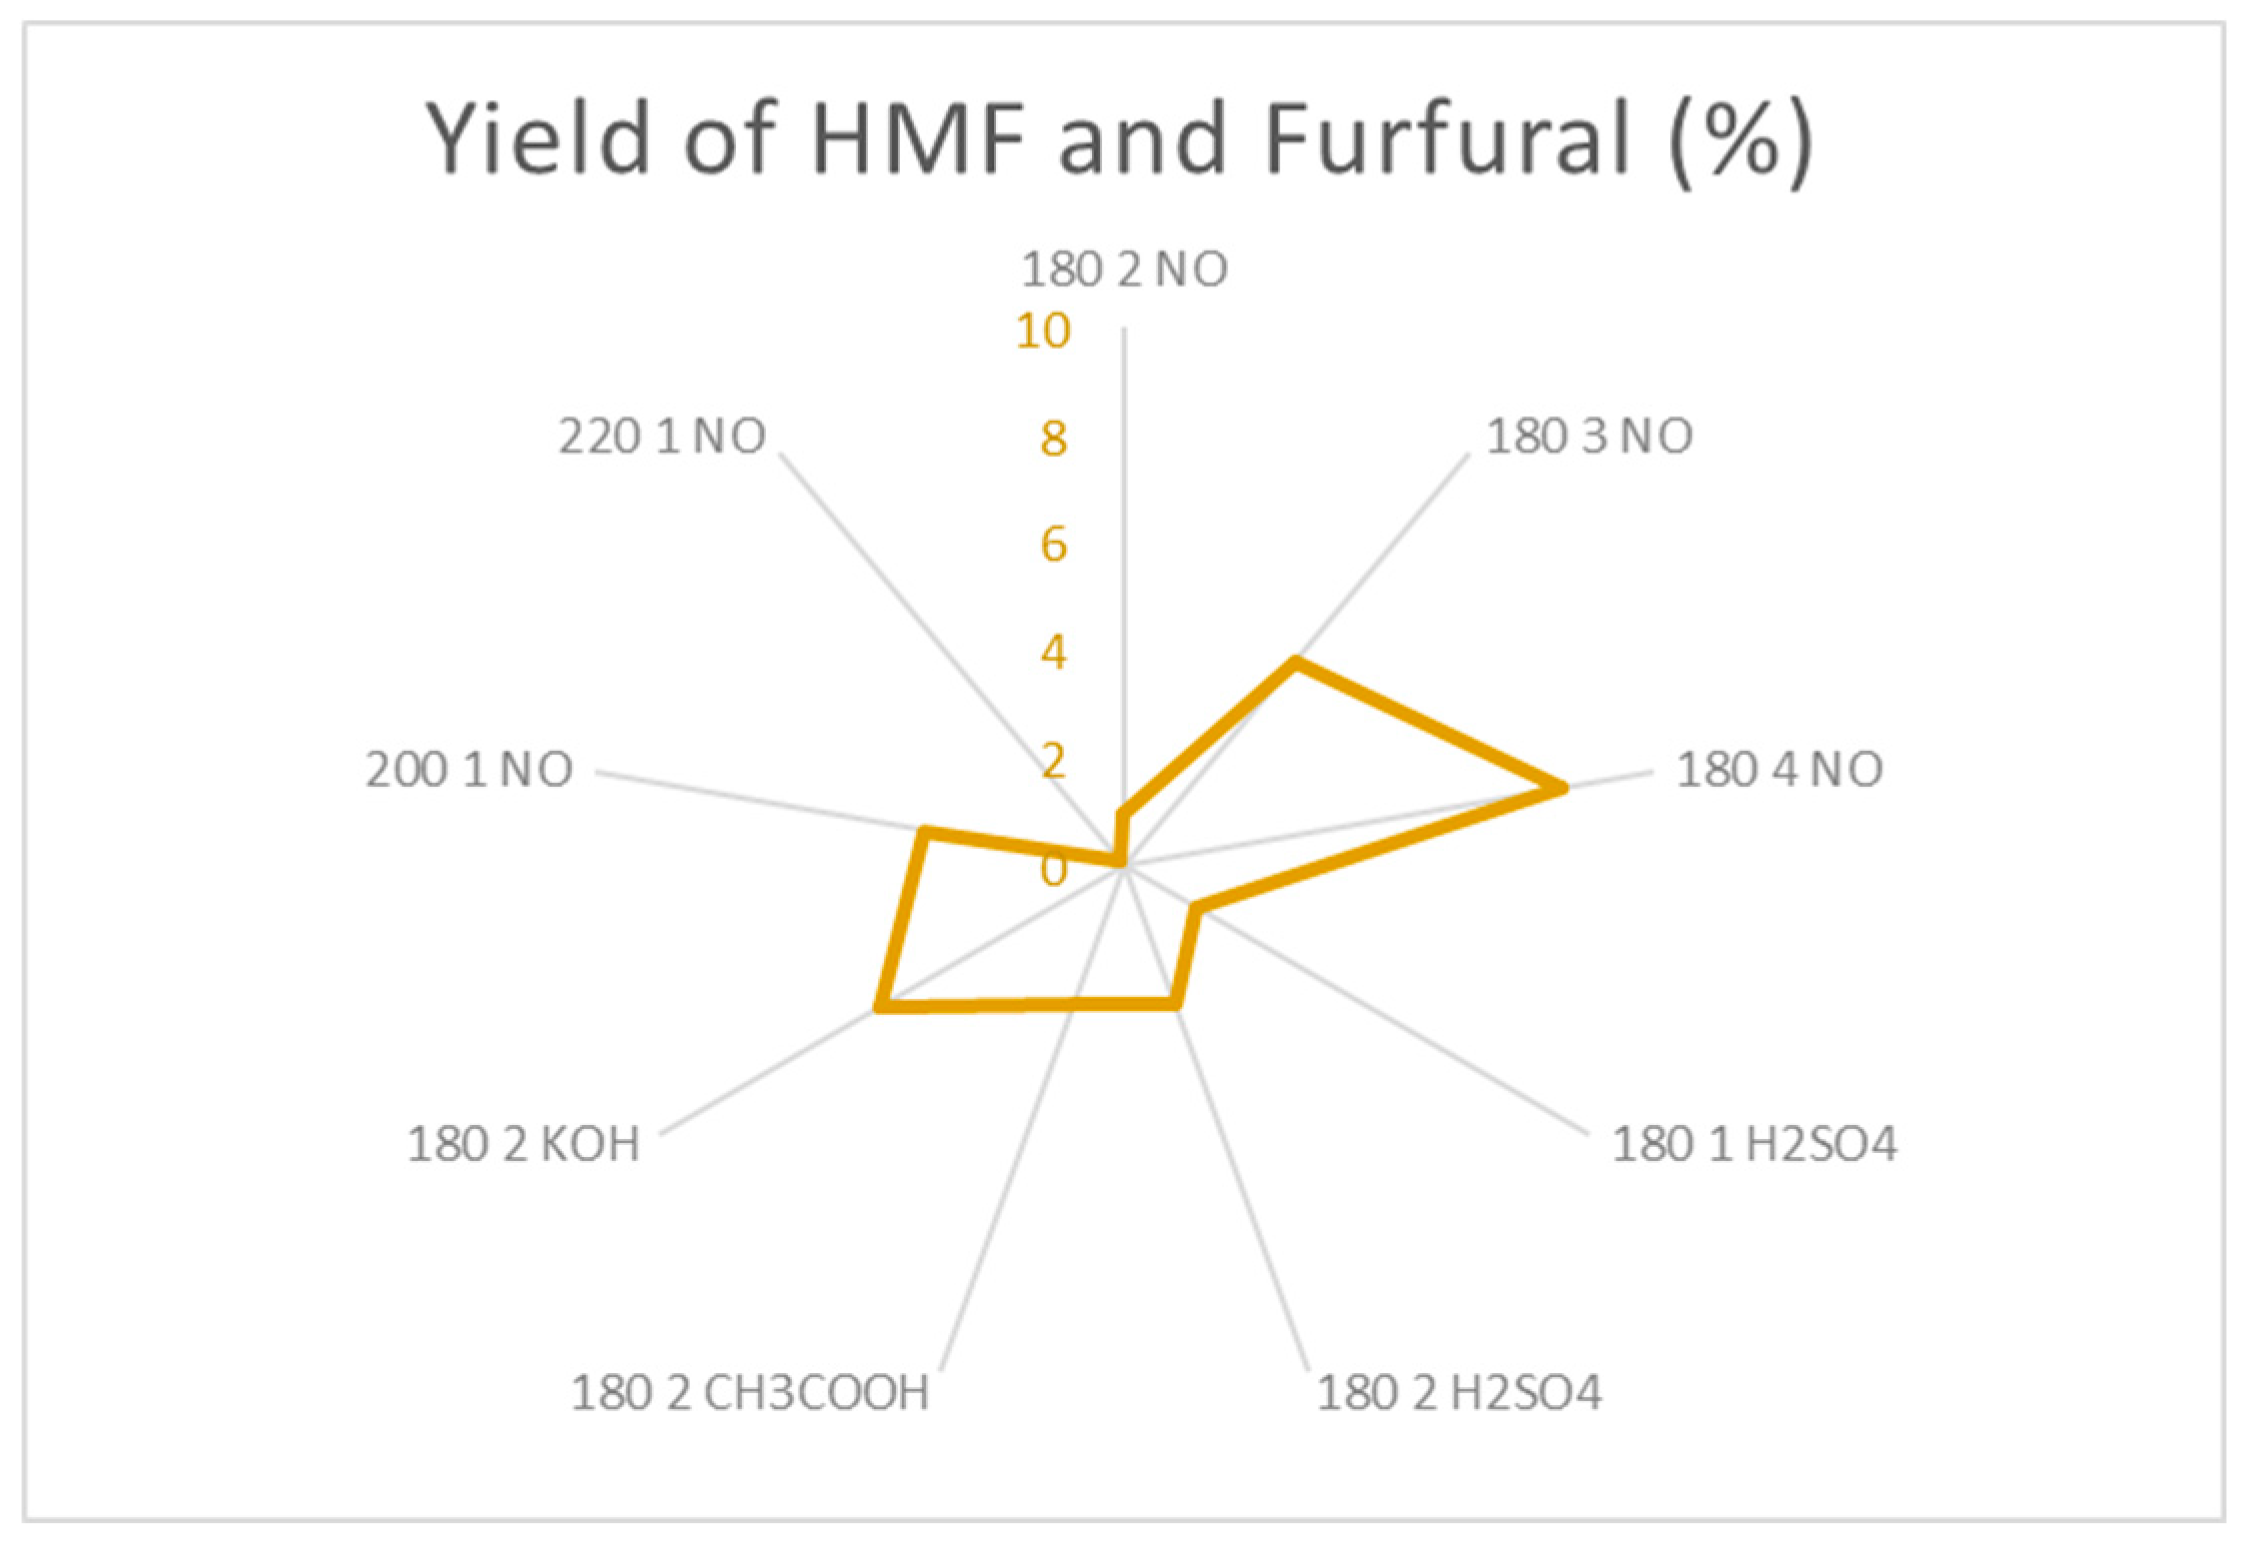
Table 1.
Set of experiments in the LHW range.
| Experiment | Time (Hours) | Temperature (ºC) |
|---|---|---|
| 1 | 1 | 120 |
| 2 | 1 | 130 |
| 3 | 1 | 140 |
| 4 | 1 | 150 |
| 5 | 1 | 160 |
| 6 | 1 | 170 |
| 7 | 1 | 180 |
| 8 | 2 | 180 |
| 9 | 3 | 180 |
| 10 | 4 | 180 |
| 11 | 5 | 180 |
Table 2.
Set of experiments in the HTC range.
| Experiment | Time (Hours) | Temperature (ºC) |
| 1 | 1 | 200 |
| 2 | 1 | 220 |
| 3 | 1 | 240 |
| 4 | 1 | 260 |
| 5 | 2 | 200 |
| 6 | 3 | 200 |
| 7 | 4 | 200 |
| 8 | 5 | 200 |
Table 3.
Retention time for separation of standards of PC.
| Standard | Retention time (minutes) |
|---|---|
| Glucose | 16,7971 |
| Xilose | 17,1698 |
| Formic Acid | 20,6158 |
| Levulinic Acid | 22,3054 |
| HMF | 35,2803 |
| Furfural | 51,3499 |
Table 4.
Proximate analysis of the pea pods waste sample.
| Essay | Result (%w)1 | Result (%w)2 |
|---|---|---|
| Moisture | 7,77 | 7,0 |
| Ashes | 4,22 | 3,5 |
| Volatile Matter | 74,18 | 78,0 |
| Fixed Carbon | 13,0 | 18,0 |
1Results obtained in the present paper 2Results reported for pea pods. [26].
Table 5.
Ultimate analysis of peapods.
| Element | Result (%w)1 | Result (%w)2 |
| Carbon | 43,3 | 39,32 |
| Hydrogen | 5,95 | 4,75 |
| Oxygen | 49,02 | 53,3 |
| Nitrogen | 1,71 | 2,40 |
| Sulphur | 0 | 0,23 |
| O/C Ratio | 0,85 | 1,02 |
| H/C Ratio | 1,65 | 1,45 |
| C/N Ratio | 29,65 | 19,11 |
1Results obtained in the present paper 2Results reported for pea pods [26].
Table 6.
Structural analysis of peapods in dry basis.
| Essay | Result (%w)1 | Result (%w)2 |
|---|---|---|
| Hemicellulose | 17,4 | 41,0 |
| Lignin | 5,0 | 3,0 |
| Cellulose | 20,2 | 45,0 |
1Results obtained in the present paper 2Results reported for pea pods [26].
Disclaimer/Publisher’s Note: The statements, opinions and data contained in all publications are solely those of the individual author(s) and contributor(s) and not of MDPI and/or the editor(s). MDPI and/or the editor(s) disclaim responsibility for any injury to people or property resulting from any ideas, methods, instructions or products referred to in the content. |
© 2023 by the authors. Licensee MDPI, Basel, Switzerland. This article is an open access article distributed under the terms and conditions of the Creative Commons Attribution (CC BY) license (http://creativecommons.org/licenses/by/4.0/).
Copyright: This open access article is published under a Creative Commons CC BY 4.0 license, which permit the free download, distribution, and reuse, provided that the author and preprint are cited in any reuse.


