Submitted:
05 December 2023
Posted:
06 December 2023
Read the latest preprint version here
Abstract
The agricultural industry places a high priority on crop protection, especially when it comes to protecting cotton crops against pink bollworm infestations. Rapid disease identification is essential for effective crop management at the same time. In order to overcome these difficulties, this study offers a thorough process for utilizing the Robot Operating System (ROS) to deploy an autonomous robot. The robot is intended to identify infestations of pink bollworm in addition to counting and tracking red Disease that impact cotton harvests. Drones are used to check the condition of cotton fields, and the autonomous robot's path planning component is closely related to this process. Large fields are photographed by these drones in multispectral mode, and the robot's course planning technique is done by calculating the Normalized Difference Vegetation Index (NDVI) based on these images. This approach ensures targeted surveillance and intervention, optimizing the use of resources. A customized dataset was created especially for this application to improve the robot's detecting abilities. The dataset was utilized to train a YOLOV8 model, a state-of-the-art object detection architecture. Performance characteristics of the trained model are impressive; it has a mean Average Precision (mAP) of 67.1%, Precision of 67.9%, and Recall of 61.8%. These metrics highlight how well the model works to precisely locate and measure interesting occurrences in the cotton fields. In order to address the particular challenges presented by pink bollworm infestations and crop diseases in the context of cotton cultivation, this research contributes a comprehensive solution for autonomous crop monitoring and protection by seamlessly integrating ROS, drones, NDVI calculations, and a robust detection model.
Keywords:
YOLO
; Object tracking and Counting
; Pink Bollworm
; ROS
; UGV
; Agricultural Robot
I. Introduction
Cotton, one of the world's most important cash crops, is critical to the global textile industry, and its production is a pillar of agricultural economies in many places. However, a wide range of pests and diseases are constantly attacking the cotton crop, devastating yields and lowering the quality of the cotton fibers. The detection of pests and diseases in cotton crops is a complex task that involves recognizing, tracking, and controlling a range of harmful insects, fungus, bacteria, and viruses. Inadequate detection can have dire implications, affecting the world's supply of this vital raw material and causing cotton growers to suffer significant financial losses.
A tiny, typically around 1/2 inch long and pinkish moth larva called the Pink Bollworm (Pectinophora gossypiella) has the potential to seriously harm cotton crops. The whole metamorphic life cycle of the pink bollworm includes the egg, larval, pupal, and adult stages. The larvae of the pink bollworm enter within the cotton bolls, feeding on the surrounding cotton fibers and seeds which reduces the cotton quality, yield loss, and cotton lint contamination can result from this feeding practice. Cotton producers must keep a close eye out for Pink Bollworm infestations since damage to cotton crops can be reduced with early diagnosis and effective control techniques.
In addition to lowering output and degrading cotton fiber quality, diseases can have a major effect on cotton crops. The kind of disease, the surroundings, and the methods used for managing it are some of the variables that affect how much of an impact there is. While certain verities may be more susceptible to disease, others may have developed to be more resistant to it. The type of cotton being farmed determines how a disease affects the crop. For the purpose of early detection and intervention, routine monitoring and looking for illness indicators are crucial. Early illness detection enables prompt treatment, which lessen the possible impact on yield.
Pesticides have been used widely and repeatedly, which has put selection pressure on the population of pests and encouraged the survival and procreation of those with innate resistance features. This has caused a population's tolerance to widely used insecticides to rise over time [1]. In order to encourage healthy cotton bolls to develop healthier and avoid wasting resources on infected cotton bolls, we would like to suggest a solution that includes removing cotton bolls affected with pink bollworm in their early stages.
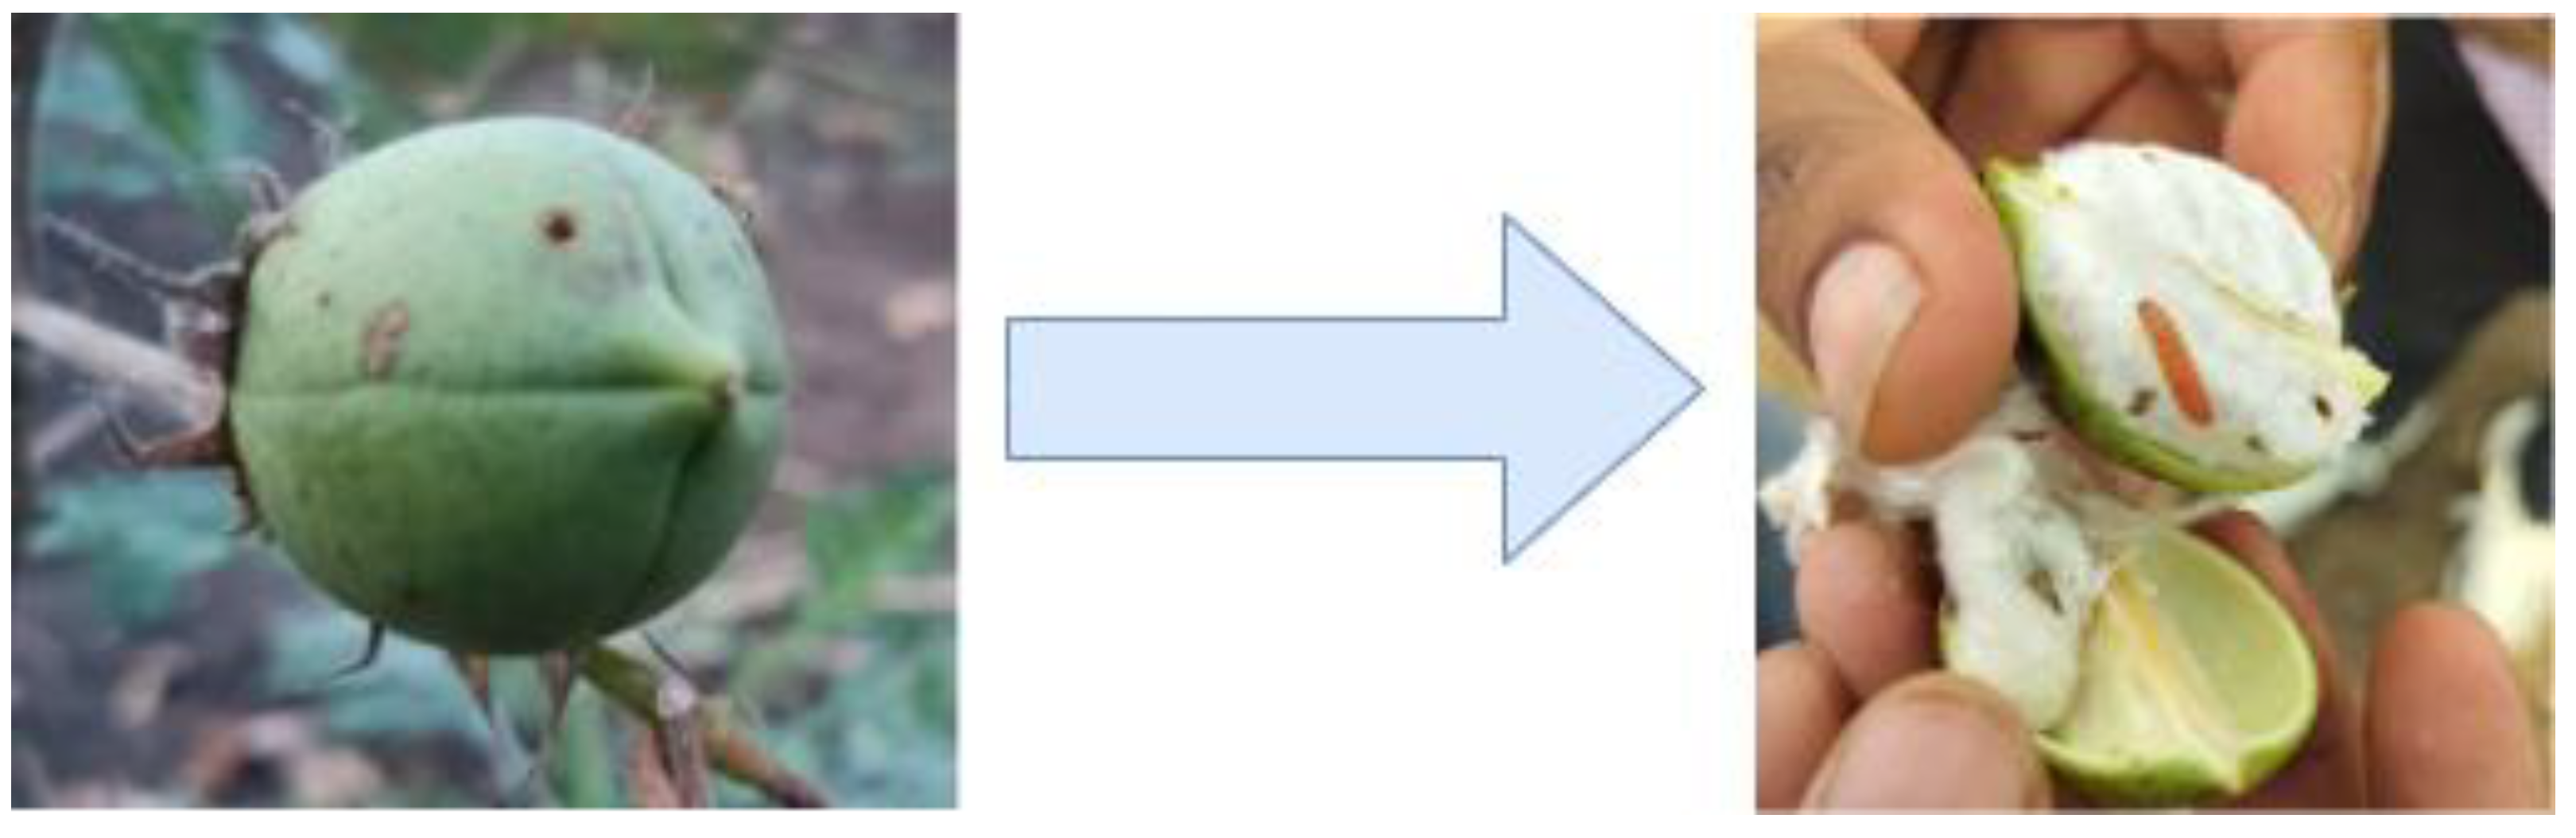
Figure 1.
External and internal view of the pink Bollworm’s infested cottoon boll.
The purpose of this research is to give farmers, early access to timely information so they can respond appropriately when crop problems first arise. By being proactive, this methodology offers to reduce any harm and guarantee a more profitable and healthier crop. By combining YOLO, autonomous robots, and on-field deployment, this research puts modern agriculture at the forefront of technology advancements, promoting effective and sustainable agricultural methods.
II. Literature Review
The researchers emphasized how transgenic crops that produce Bacillus thuringiensis (Bt) toxins might lessen the need for pesticides by killing several important insect pests [2]. As more of these Bt crops were planted, worries grew that pests would quickly develop tolerance to the toxins in the crops, limiting their utility. For eight years, the resistance of pink bollworms to Bt toxin was recorded. Although there was a delay, it has undergone strong selection to develop a resistance to Bt cotton.
A data-driven pest detection system was proposed and concluded that Predictive agriculture (PA) environments require early pest identification as a necessary first step in developing crop protection tactics [3]. YOLO-based Convolutional Neural Network (CNN) with a bespoke dataset was trained in a realistic outdoor setting, and on a holdout dataset, an average accuracy of about 94.5\% was observed. A thorough analysis of the detector performance was conducted, taking into account the impact of depth information and data augmentation methods.
A region-based end-to-end method called PestNet—which is divided into three main sections—was proposed for large-scale multi-class pest identification and classification using deep learning [4]. First, for feature extraction and augmentation, a novel module called channel-spatial attention (CSA) was suggested to be fused into the convolutional neural network (CNN) backbone. Based on feature maps that are generated from photos, the second is known as the region proposal network (RPN), and it is used to provide region proposals as possible pest places. The third component, position-sensitive score map (PSSM), was utilized for bounding box regression and pest classification in place of fully connected layers. According to the experimental results, the suggested PestNet surpasses state-of-the-art techniques in multi-class pest identification, with a mean average accuracy (mAP) of 75.46%.
The multi-robot system WAMbot was developed to recognize visual objects and move, explore, and map expansive urban settings [5]. The open-source Robot Operating System (ROS) software architecture is being used to standardize and enhance the WAMbot system. The main elements, or stacks, of the new WAMbot system [6] included an effective, frontier-based multi-robot exploration stack, a large-scale mapping stack that can create 500×500m global maps from over 20 robots in real-time, a navigation stack that combines centralized global planning with decentralized local navigation and an easy-to-use graph-based visual object recognition pipeline.
A mobile robot built on a Raspberry Pi was used to recognize objects using ROS [7]. For improved deep learning, a faster R-CNN algorithm is under consideration. A user-friendly interface was designed to facilitate the integration of front-end and back-end applications. Initially, a few ROS packages for the mobile robot must be created. After that, GPU-accelerated computation will be used to give the acquired environmental data for objective detection.
Precision is crucial for useful production measurements in agriculture [8]. Agricultural robots often have to be reconfigured for different applications or used for multiple applications at once, which can reduce reading accuracy. It is crucial to select trajectories that maximize maneuverability while optimizing measurement accuracy by accounting for the vehicle's changing dynamics. The ideal path connecting two locations for a husky robot that can be adjusted to take readings from any angle while adhering to the vehicle's dynamic limitations.
An agricultural field may have several processes monitored and automated by means of Internet of Things (IoT) systems, which utilize a variety of sensors[9] or the use of computer vision in agriculture for detection, harvesting, sorting and grading, machine navigation, and field robotics [10]. A brief discussion of the possible integration of deep learning with computer vision technologies through agricultural automation, computer vision may enhance small-scale farming through high performance and precision.
A study was conducted to assess the cotton picker's ergonomics by measuring their cardiopulmonary stress[11]. For small and marginal farmers, a pneumatic suction-based cotton boll picking equipment designed for one operator was developed and contrast the human cotton picking method's performance with that of the pneumatic suction cotton picking machine.
The Agribot was a sophisticated piece of mechatronic equipment designed to support precision agriculture operations[12]. It operates autonomously, utilizing well-coded, logical programming to carry out several operational tasks in the field. Robust, intelligent, low-cost sensors with robust signal interpretation are the most crucial qualities for Agribot applications. Important quality characteristics include Sensor Fusion, robust algorithms, and overall fast mechanism activation.
III. Methodology
We have collected our own dataset from two fields which are organic field and BT cotton field. The organic field consisted of a lot of pink Bollworm infected cotton bolls as it was an experimental field where cotton was naturally grown by providing the crops with only irrigation water and no pesticides.
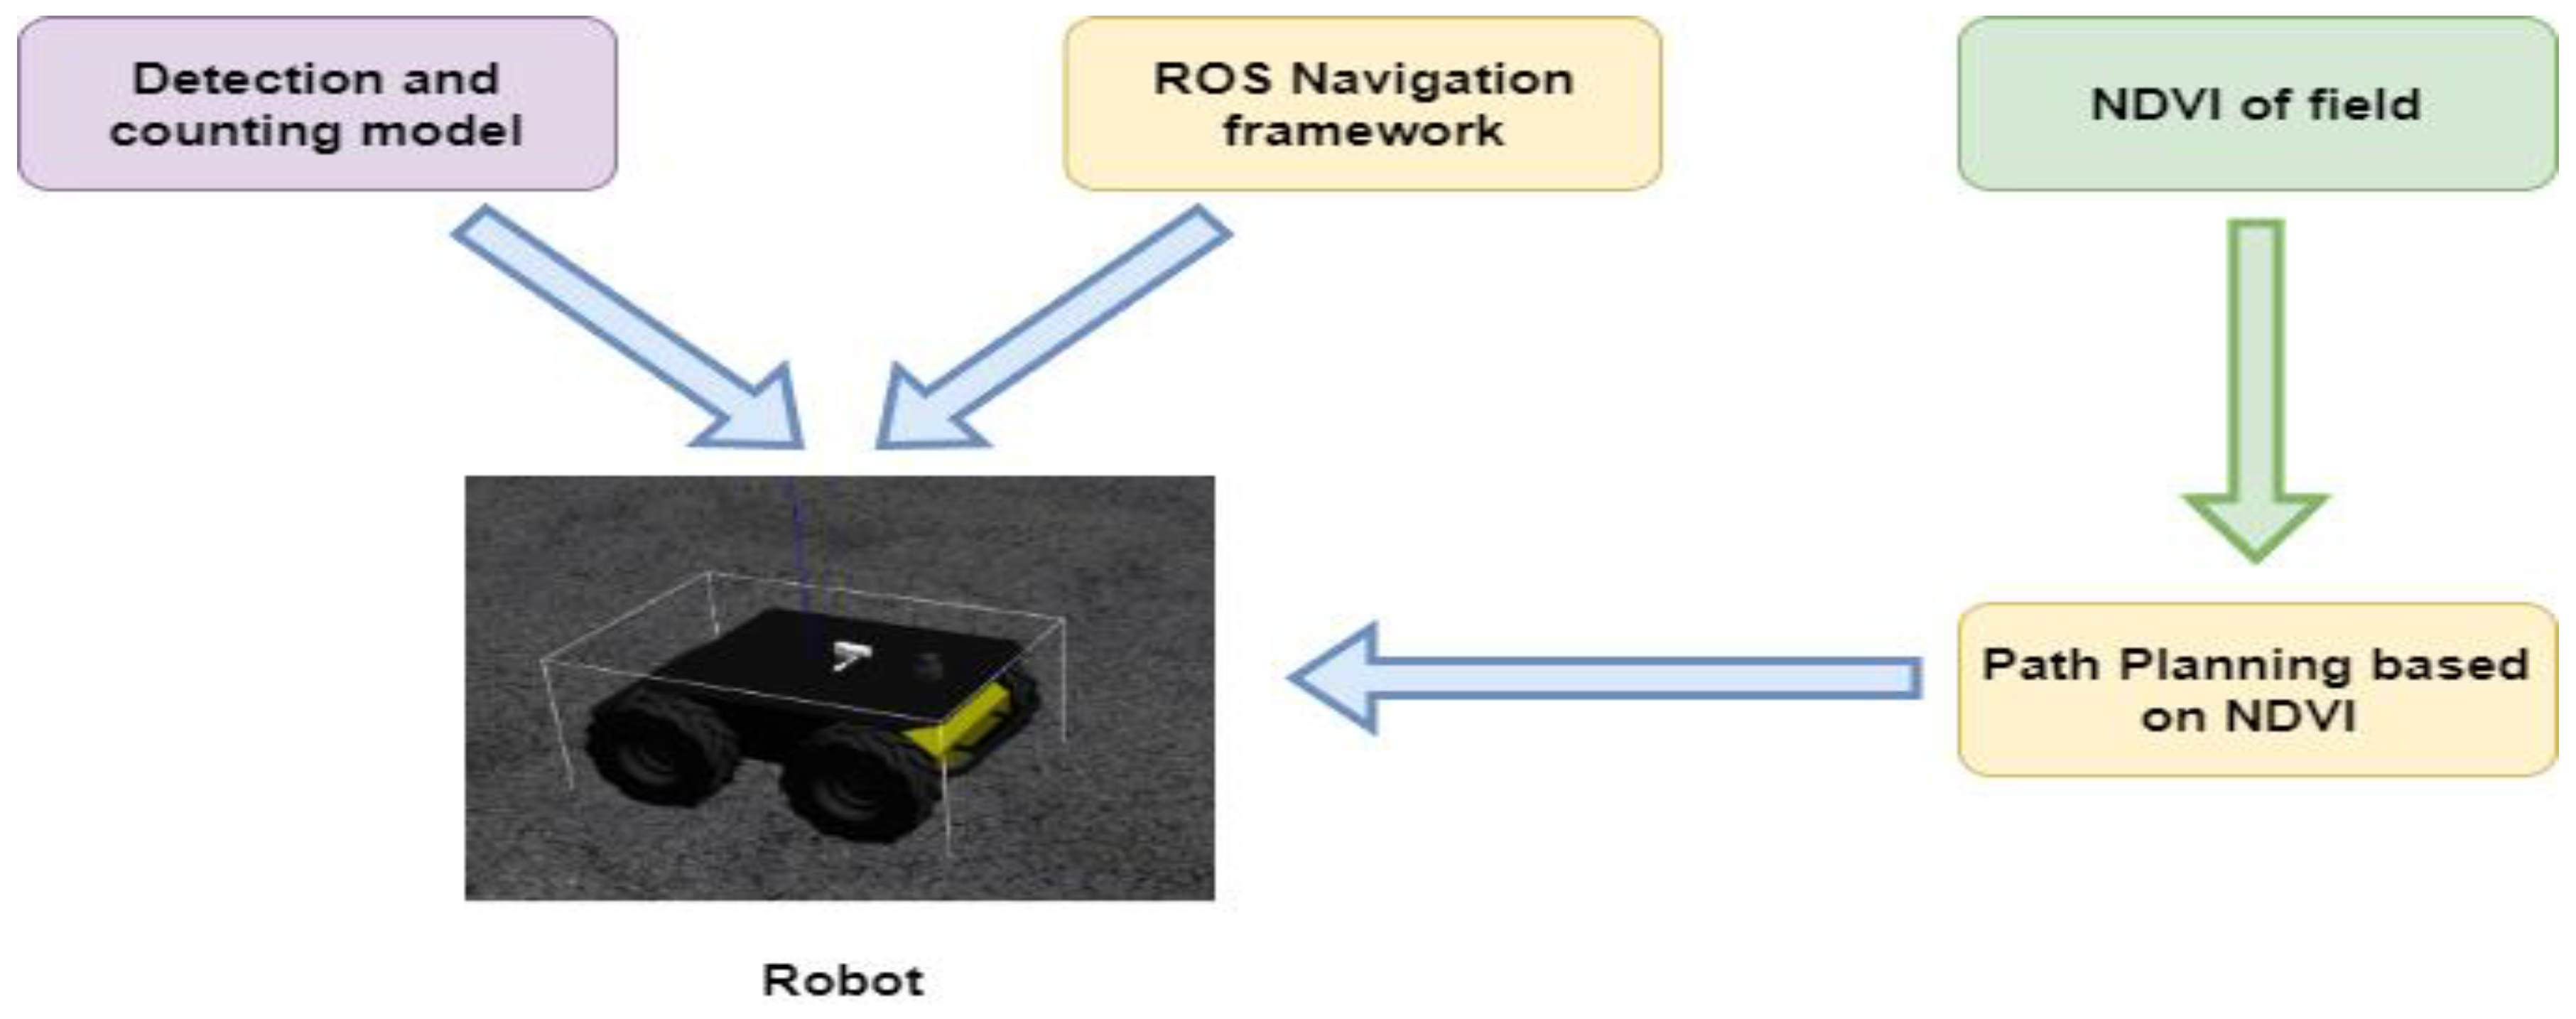
Figure 2.
The Overview of Proposed Methodology.
The proposed methodology includes the initial development of a deep learning model for detection and counting. This requires the dataset to be carefully labeled, a process efficiently done using Roboflow. Next, the labeled dataset is trained with YOLOv8, which currently is the state-of-the-art object detection model. The next step is to construct the model and then seamlessly integrate it into an autonomous Clearpath Husky robot. This robot can accurately count and identify cases of Red Disease, Pink Bollworms, and other components in cotton fields. Real-time detection capabilities are smoothly integrated with the ROS Navigation framework to improve the robot's overall functioning. Through this complex integration, a customized pipeline that not only greatly improves the robot's perceptual abilities but also its navigational capabilities, guaranteeing a comprehensive and effective approach to agricultural monitoring and management.
There are 6 classes for annotations.
["cotton flower", "cotton boll", "cotton", "pinkbollworm", "healthy leaf", "red disease"]
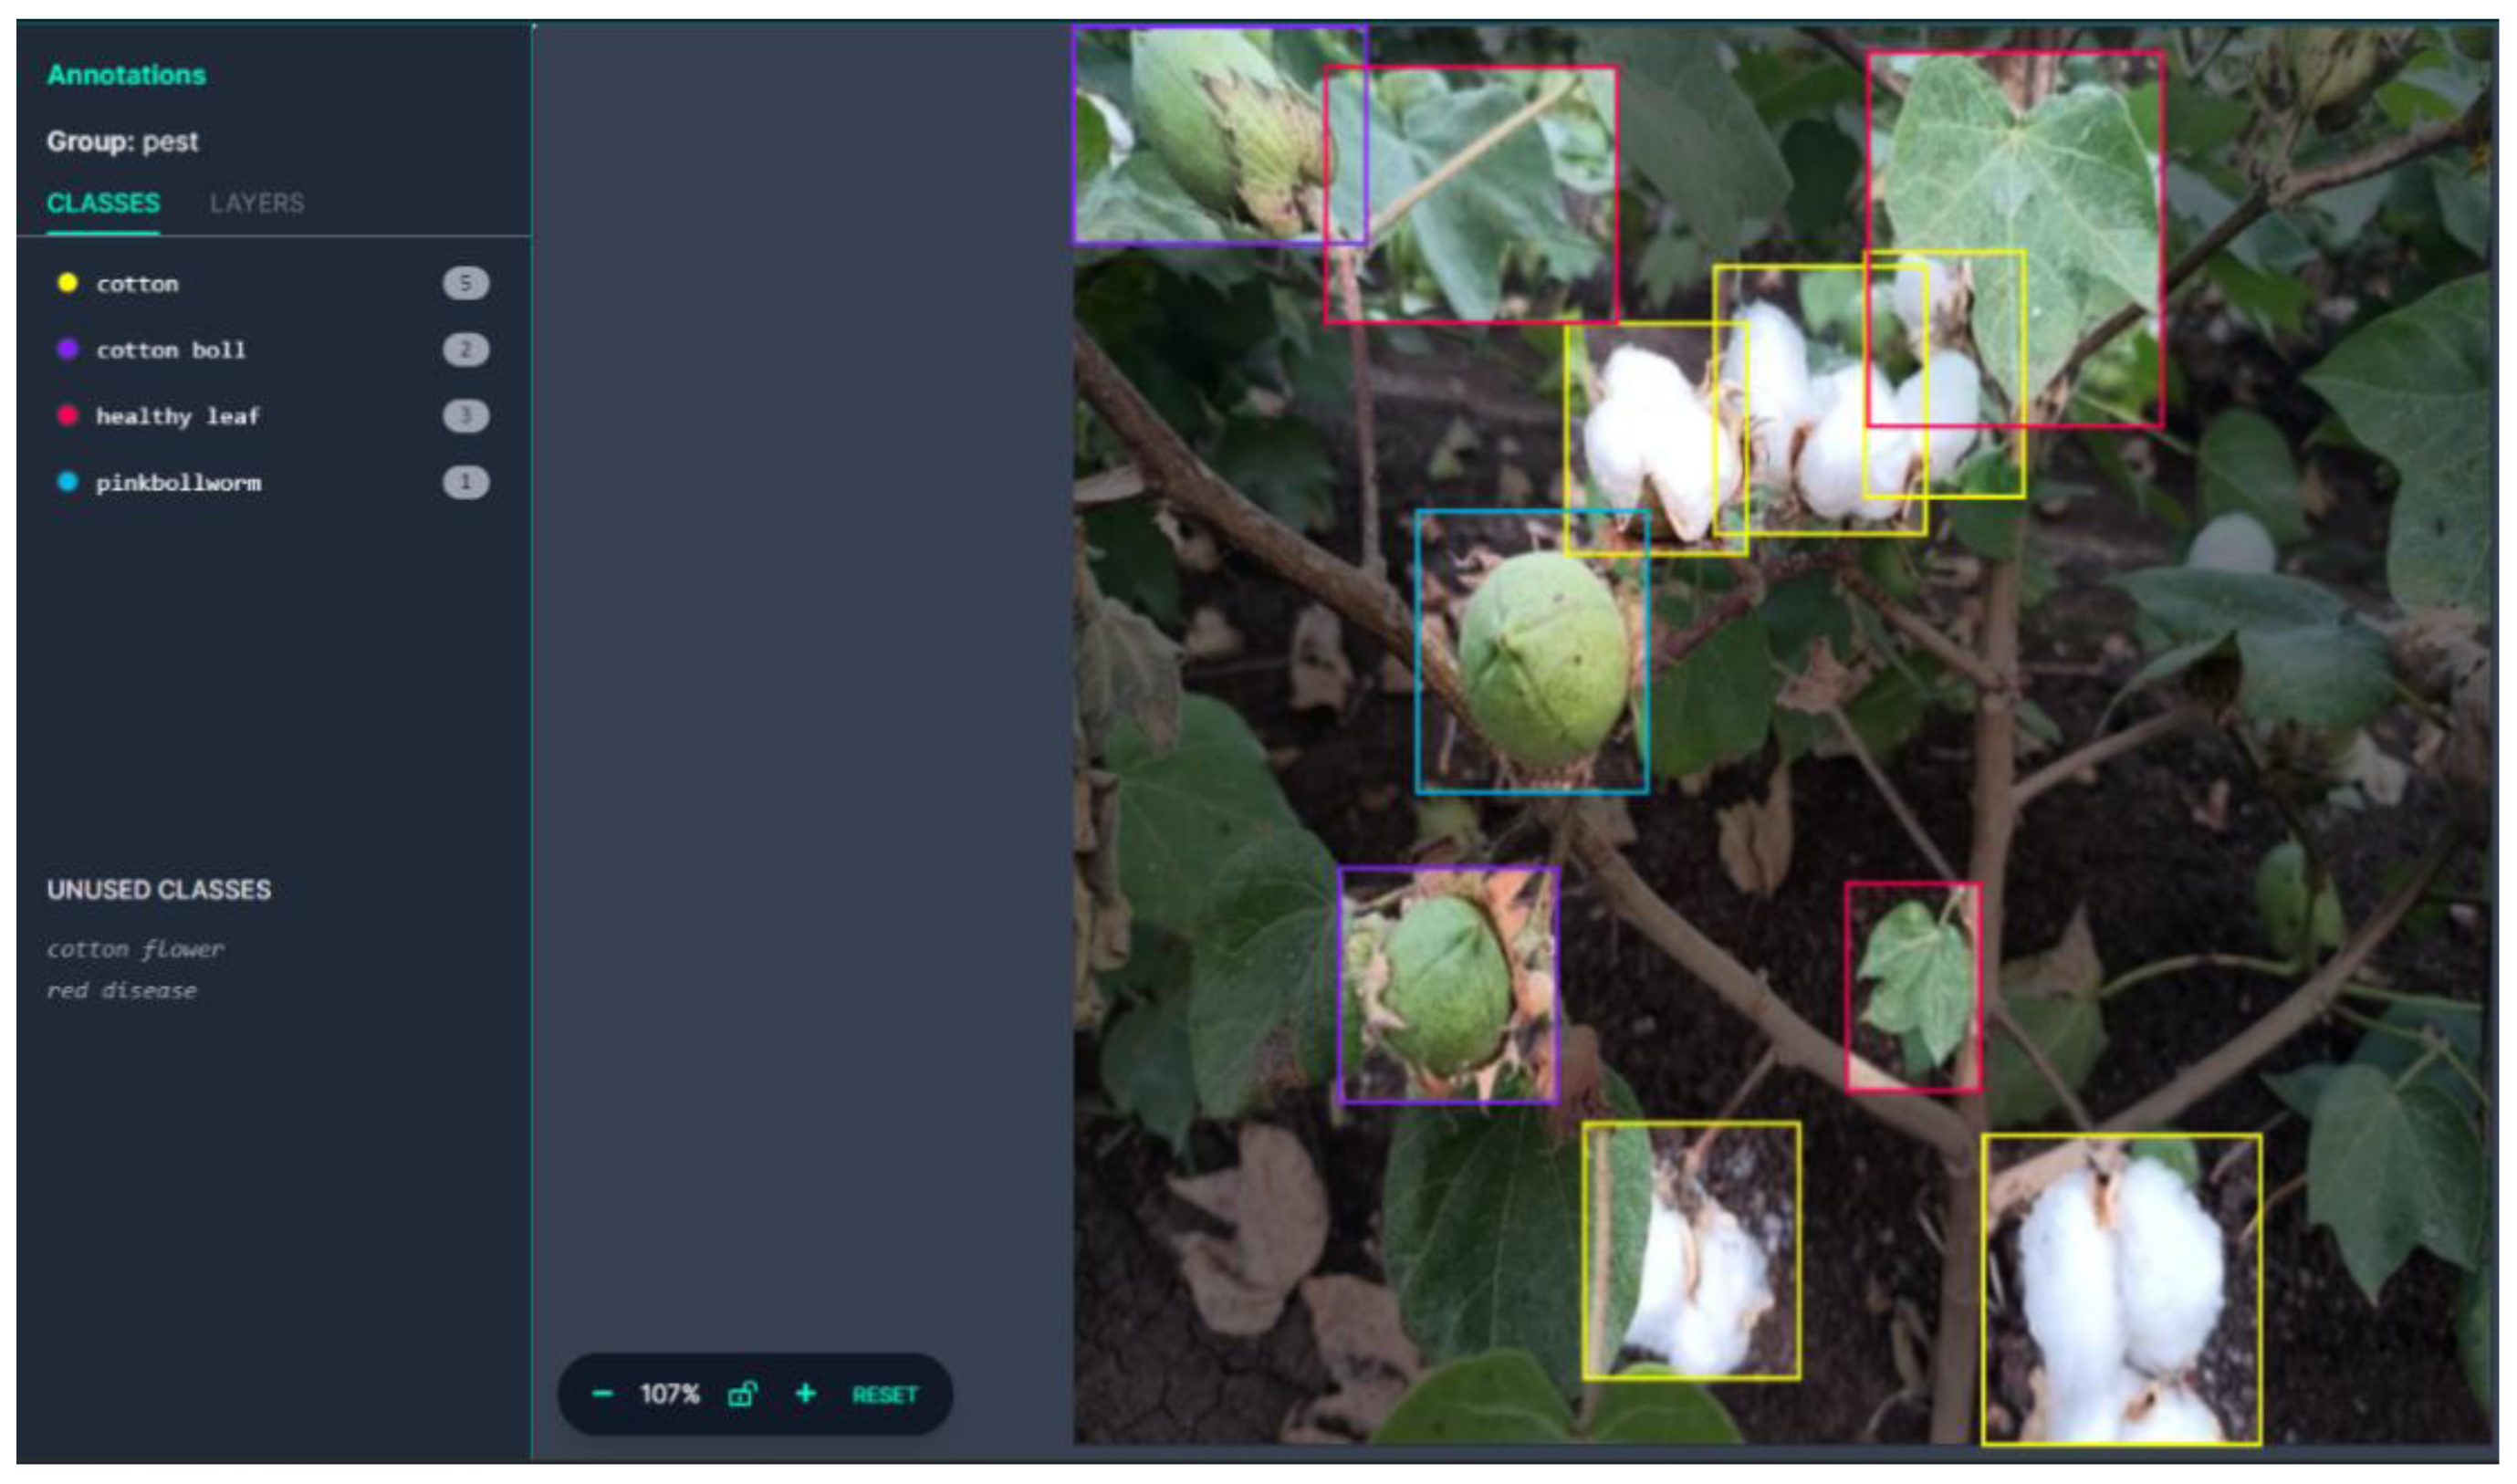
Figure 3.
Labelling of dataset using Roboflow.
We labelled the cotton bolls with holes on them as pink bollworms because, according to their characteristics, they live and grow inside cotton bolls and only emerge from them in cool environments. The tiny hole they leave on the boll during their first phase grows larger as the pest matures. The labels for the remaining classes are standard.
- A.
- Datasets –
Our own data was gathered using RGB cameras from two different types of fields: BT cotton fields, which were sprayed with pesticides, and organic cotton fields, which were not sprayed with pesticides. The dataset is made up of over a thousand RGB photos showing three different phases of cotton (flower, cotton boll, and matured cotton), as well as healthy and red disease-infested leaves and cotton bolls infected with pink bollworm.

Table 1.
Dataset Details.
| Train Images | 1006 |
| Valid Images | 34 |
| Test Images | 15 |
| Dimensions | 640 x 640 |
| Augmentation | Horizontal Flip |
Normalized Difference Vegetation Index (NDVI) is calculated by taking pictures of a target area at various wavelengths. So, we have collected the data using the Parrot Sequoia multi spectral camera, the dataset consists target fields in the red, green, red edge, and near-infrared (NIR) bands are recorded by the Parrot Sequoia camera from the drones.
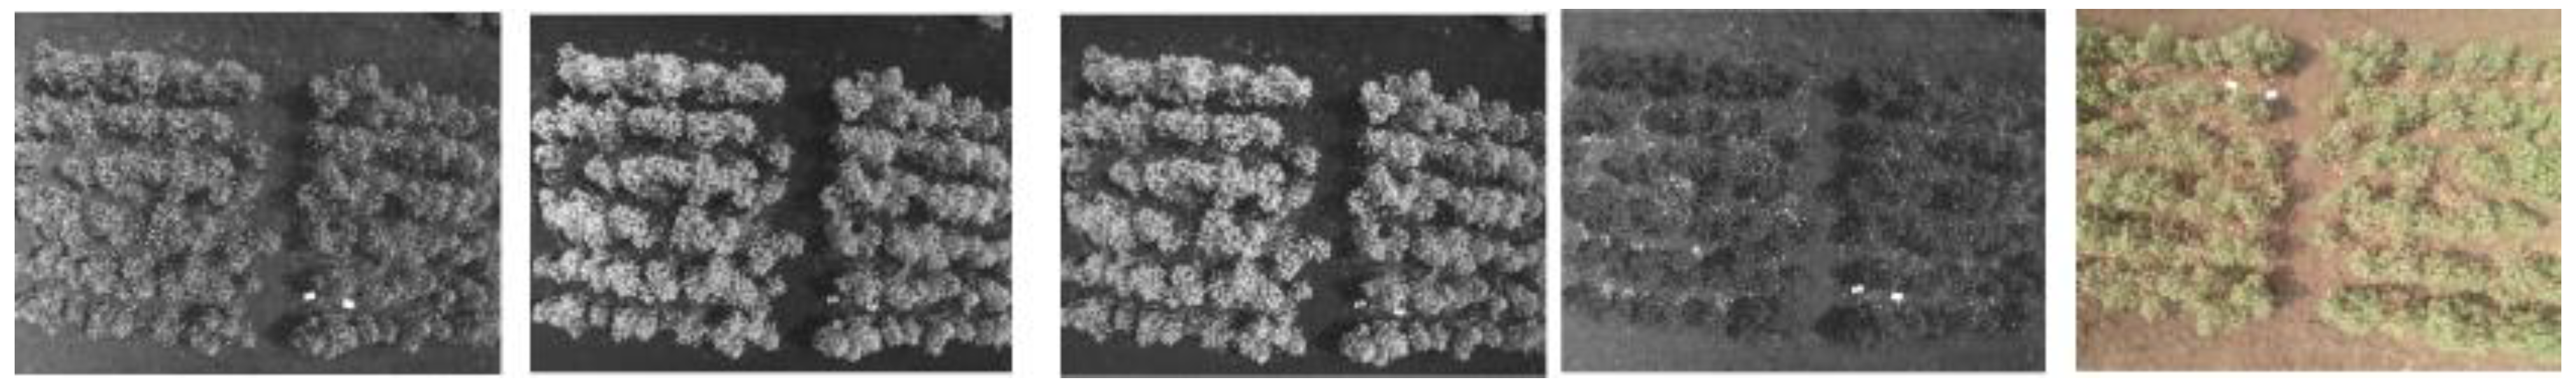
Figure 4.
Images collected by drone mounted multispectral camera.
- B.
- Deep Learning Model Architecture –
Our model was rigorously tested and labeled on the efficient Roboflow platform. The YOLOv8-S architecture was used for training at 25 epochs for reliable and accurate performance. In order to improve accuracy and dependability, supervision was also used for counting and tracking the objects that emerged.
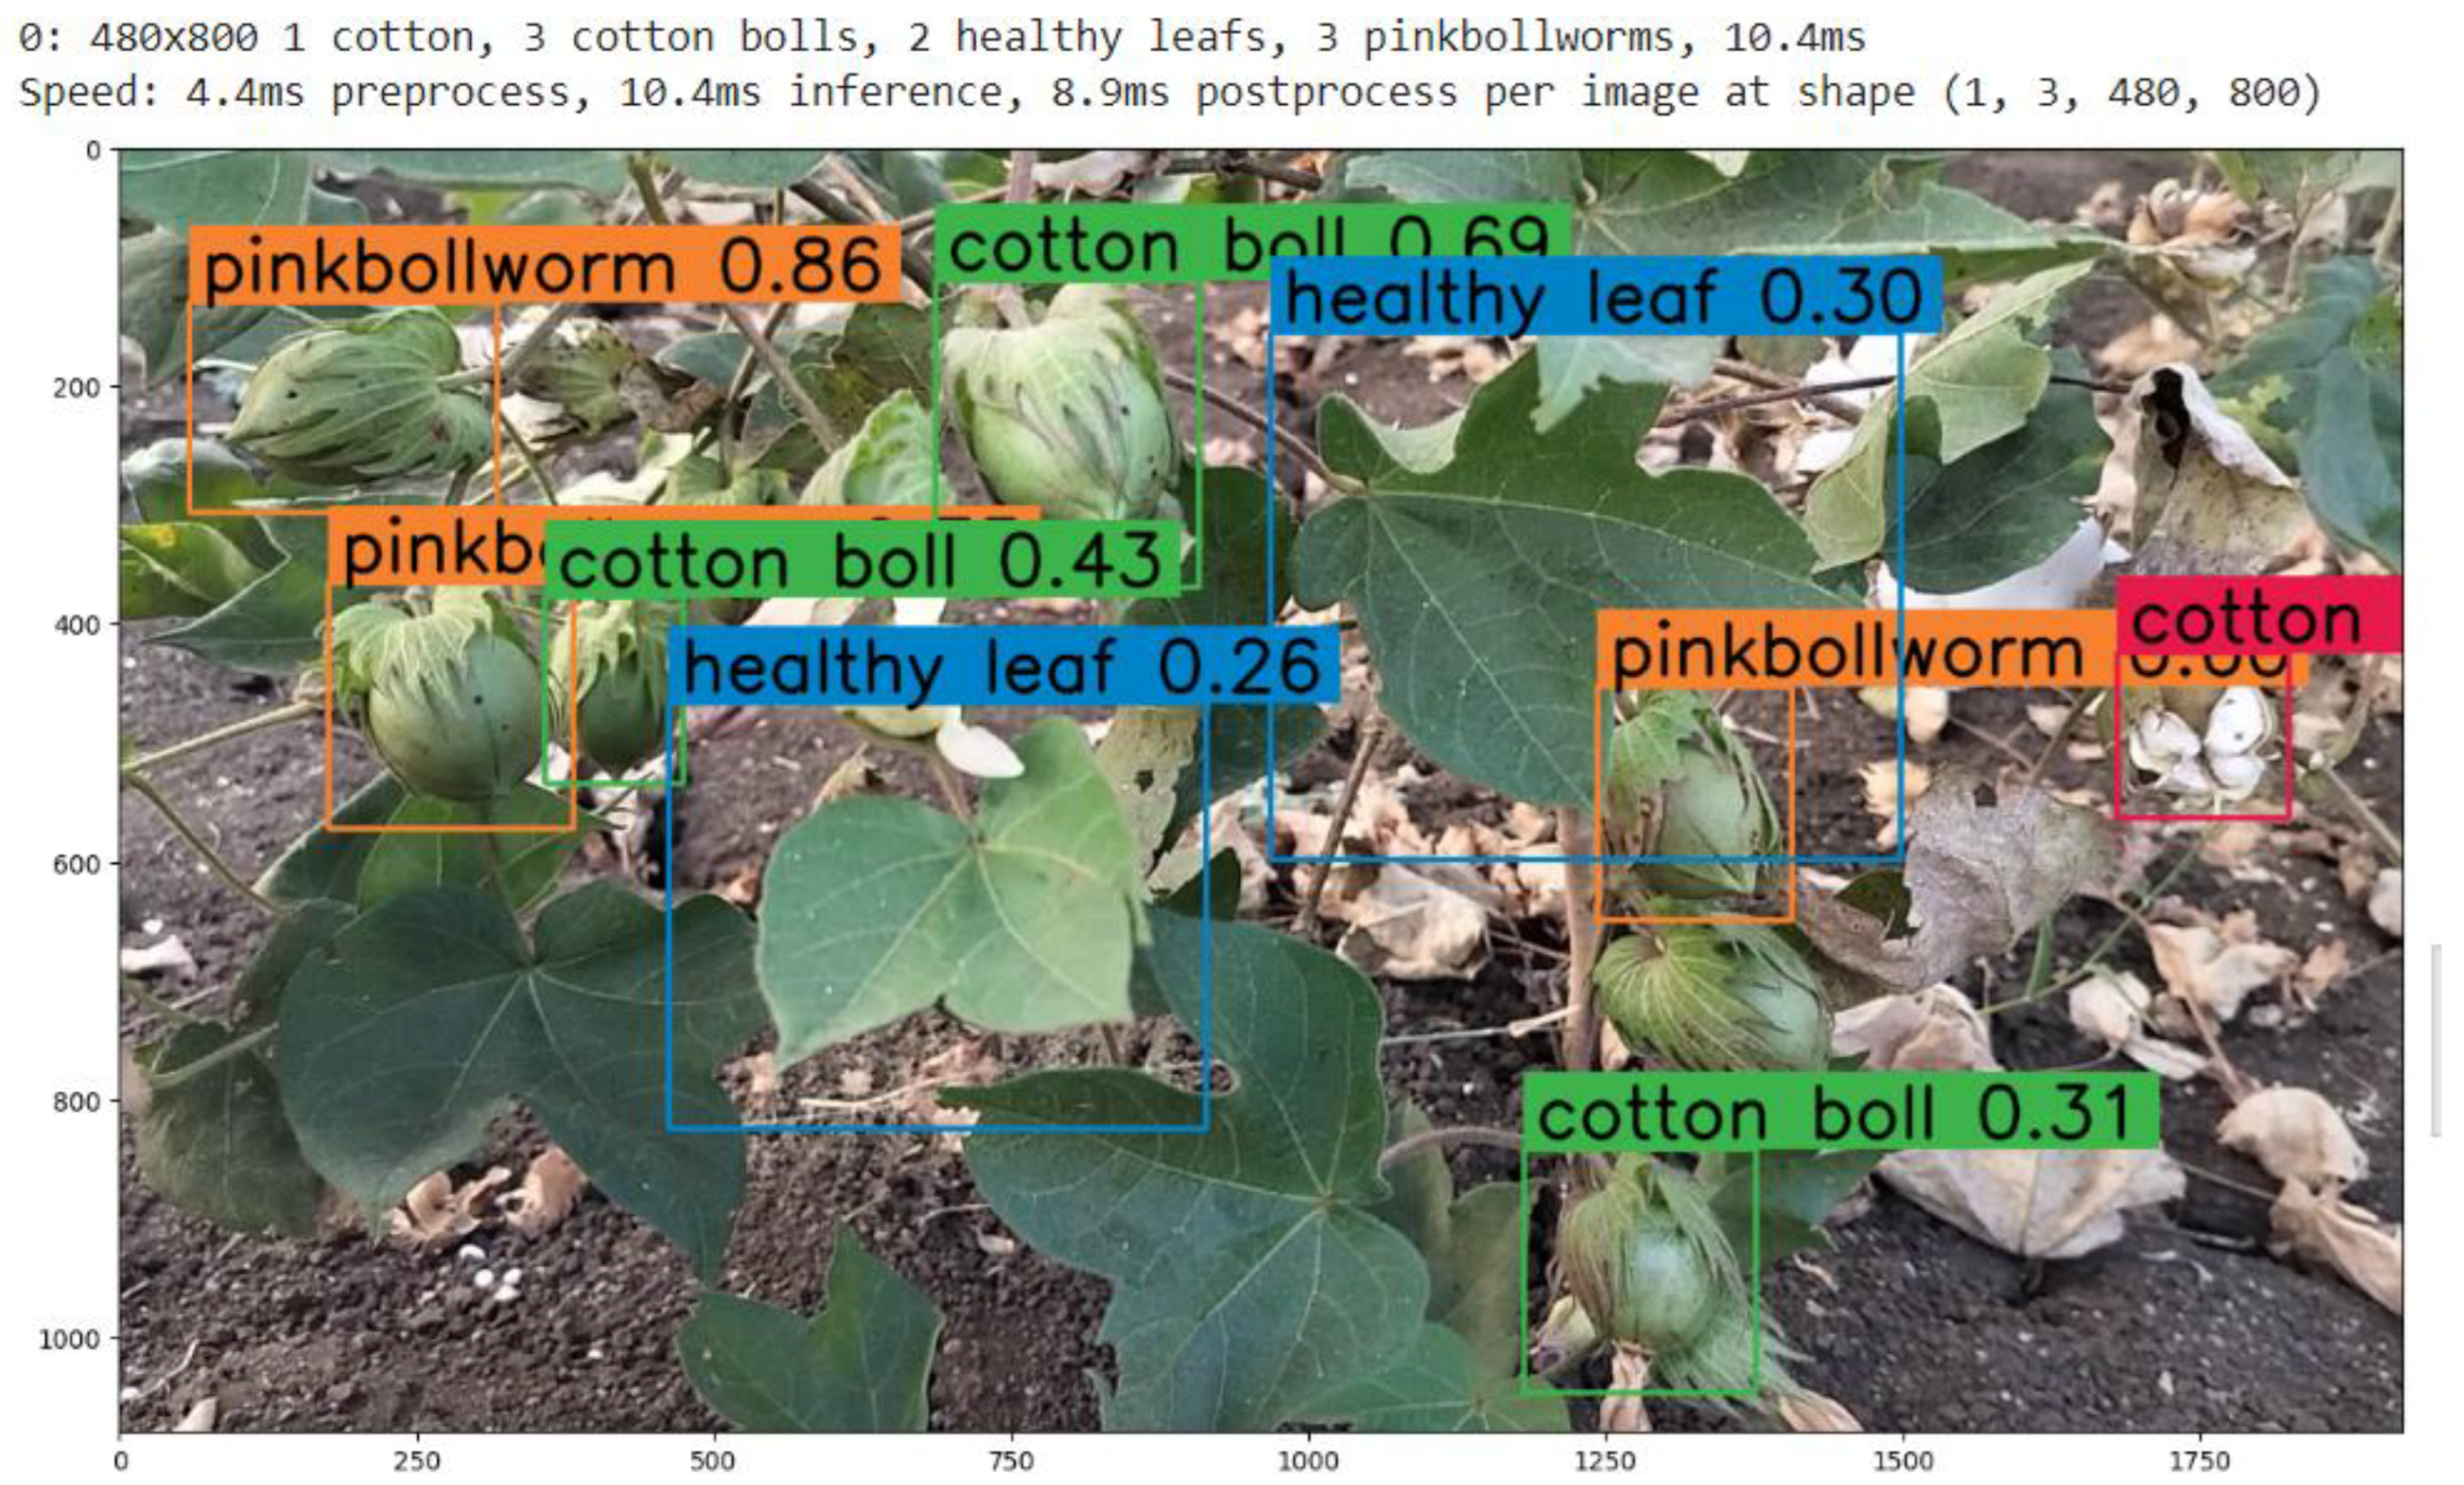
Figure 5.
Counting of the Object in the frame.
We selected YOLOV8-S from the available YOLOV8 variants. A backbone network is used by YOLOv8-S as the feature extractor. The extraction of hierarchical characteristics from the input image is the responsibility of the backbone. YOLOv8-S often uses the CSPDarknet53 [9] backbone architecture. To improve information flow, it has a CSP (Cross Stage Partial) connection. It's possible that YOLOv8-S has a neck architecture that combines characteristics from several sizes. In YOLOv8 variations, PANet (Path Aggregation Network) [10] is frequently employed for this purpose. For object detection, the detection head is in charge of estimating bounding boxes, class probabilities, and confidence ratings. A modified version of the YOLO head is used by YOLOv8-S, which makes multiple-scale predictions for bounding box coordinates, class probabilities, and confidence ratings.
Training the model involves utilizing targets such bounding box regression, class prediction, and objectness prediction. In order to introduce non-linearity, YOLOv8-S usually utilizes Leaky ReLU (Rectified Linear Unit) [11] activation functions. Non-maximum suppression (NMS) is used by YOLOv8-S to further refine and filter the final set of bounding box predictions once they are created. YOLOv8-S generates bounding boxes with corresponding class probabilities and confidence ratings based on an input picture. YOLOv8-S is trained utilizing methods like as backpropagation and stochastic gradient descent (SGD) on labeled datasets. This particular model can be effectively implemented on devices with constrained resources because to its high computational efficiency.
- C.
- Autonomous robot –
For a range of robotic applications, the autonomous Clearpath Husky robot is a robust and adaptable unmanned ground vehicle. Because of its characteristics, it's ideal for jobs like data collecting, mapping, and exploration in difficult areas. The robot can see and navigate its environment well since it is outfitted with a variety of sensors, such as a realsense camera and LiDAR. Constructed to smoothly interface with the Robot Operating System (ROS), allowing ROS packages and libraries to be used in the creation and implementation of sophisticated robotic applications. The Clearpath Husky is a dependable and flexible autonomous robotic platform because of its sturdy hardware, interoperability with ROS, and autonomous capabilities.
In order to ensure compatibility with ROS Noetic, we construct and configure the Clearpath Husky robot hardware and attached a LiDAR sensor for autonomous driving. Integrated sensor into the ROS Noetic framework by configuring their drivers and ensuring compatibility with ROS Noetic nodes. Created an environment map using the GMapping mapping solution, which is compatible with ROS Noetic. After that Utilized the AMCL (Adaptive Monte Carlo Localization) module from ROS Noetic to implement localization [12]. Object avoidance pretrained model and ROS navigation stack for ROS Noetic were used for path planning. Before deploying the robot, we tested it in a controlled environment and make sure the algorithms have been verified and improved using Gazebo simulation tools.
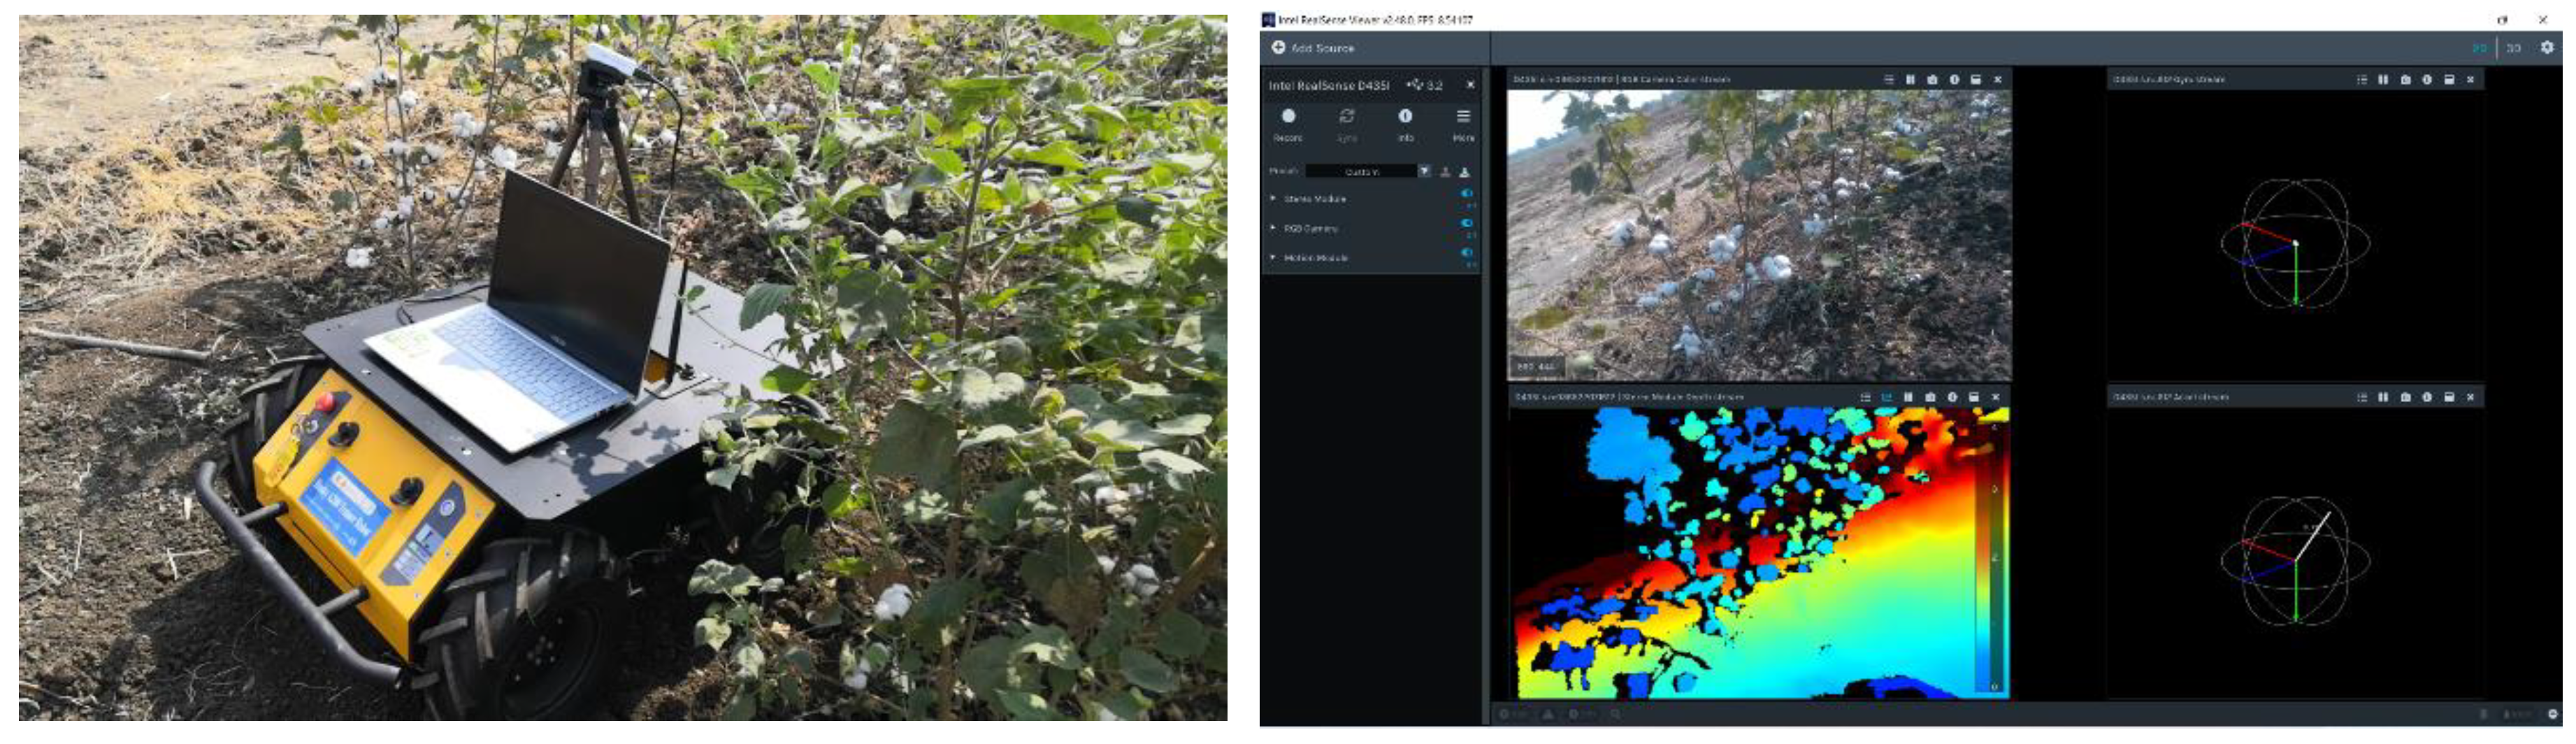
Figure 6.
Setup for detection and counting with depth camara.
For the purpose of calculating the NDVI, take pictures of the cotton fields using drones that are fitted with multispectral cameras. Incorporate this data into the robot's navigation system so that it can make well-informed decisions. Utilize our object detection model to discover and enumerate cases of illnesses or infestations of pink bollworms that impact cotton crops. Ascertain a smooth interface with the ROS architecture. Following a simulated test, Deploy the self-navigating Husky robot in actual cotton fields to enable it to independently traverse, gather information, while monitoring the agricultural conditions. Robot deployment data collection includes gathering information about environmental conditions (done by mapping), detection outcomes, and NDVI maps. This information will be analyzed to assist determine crop health and other issues.
- D.
- NDVI and Path planning –
The Normalized Difference Vegetation Index (NDVI) is a remote sensing tool that evaluates the density and overall health of plants. It is computed by first normalizing the difference between the visible red and near-infrared (NIR) reflectances of a plant by adding their total reflectances. Drones were used to capture multispectral photographs of the whole field at a height of around 25 meters in order to calculate the NDVI.
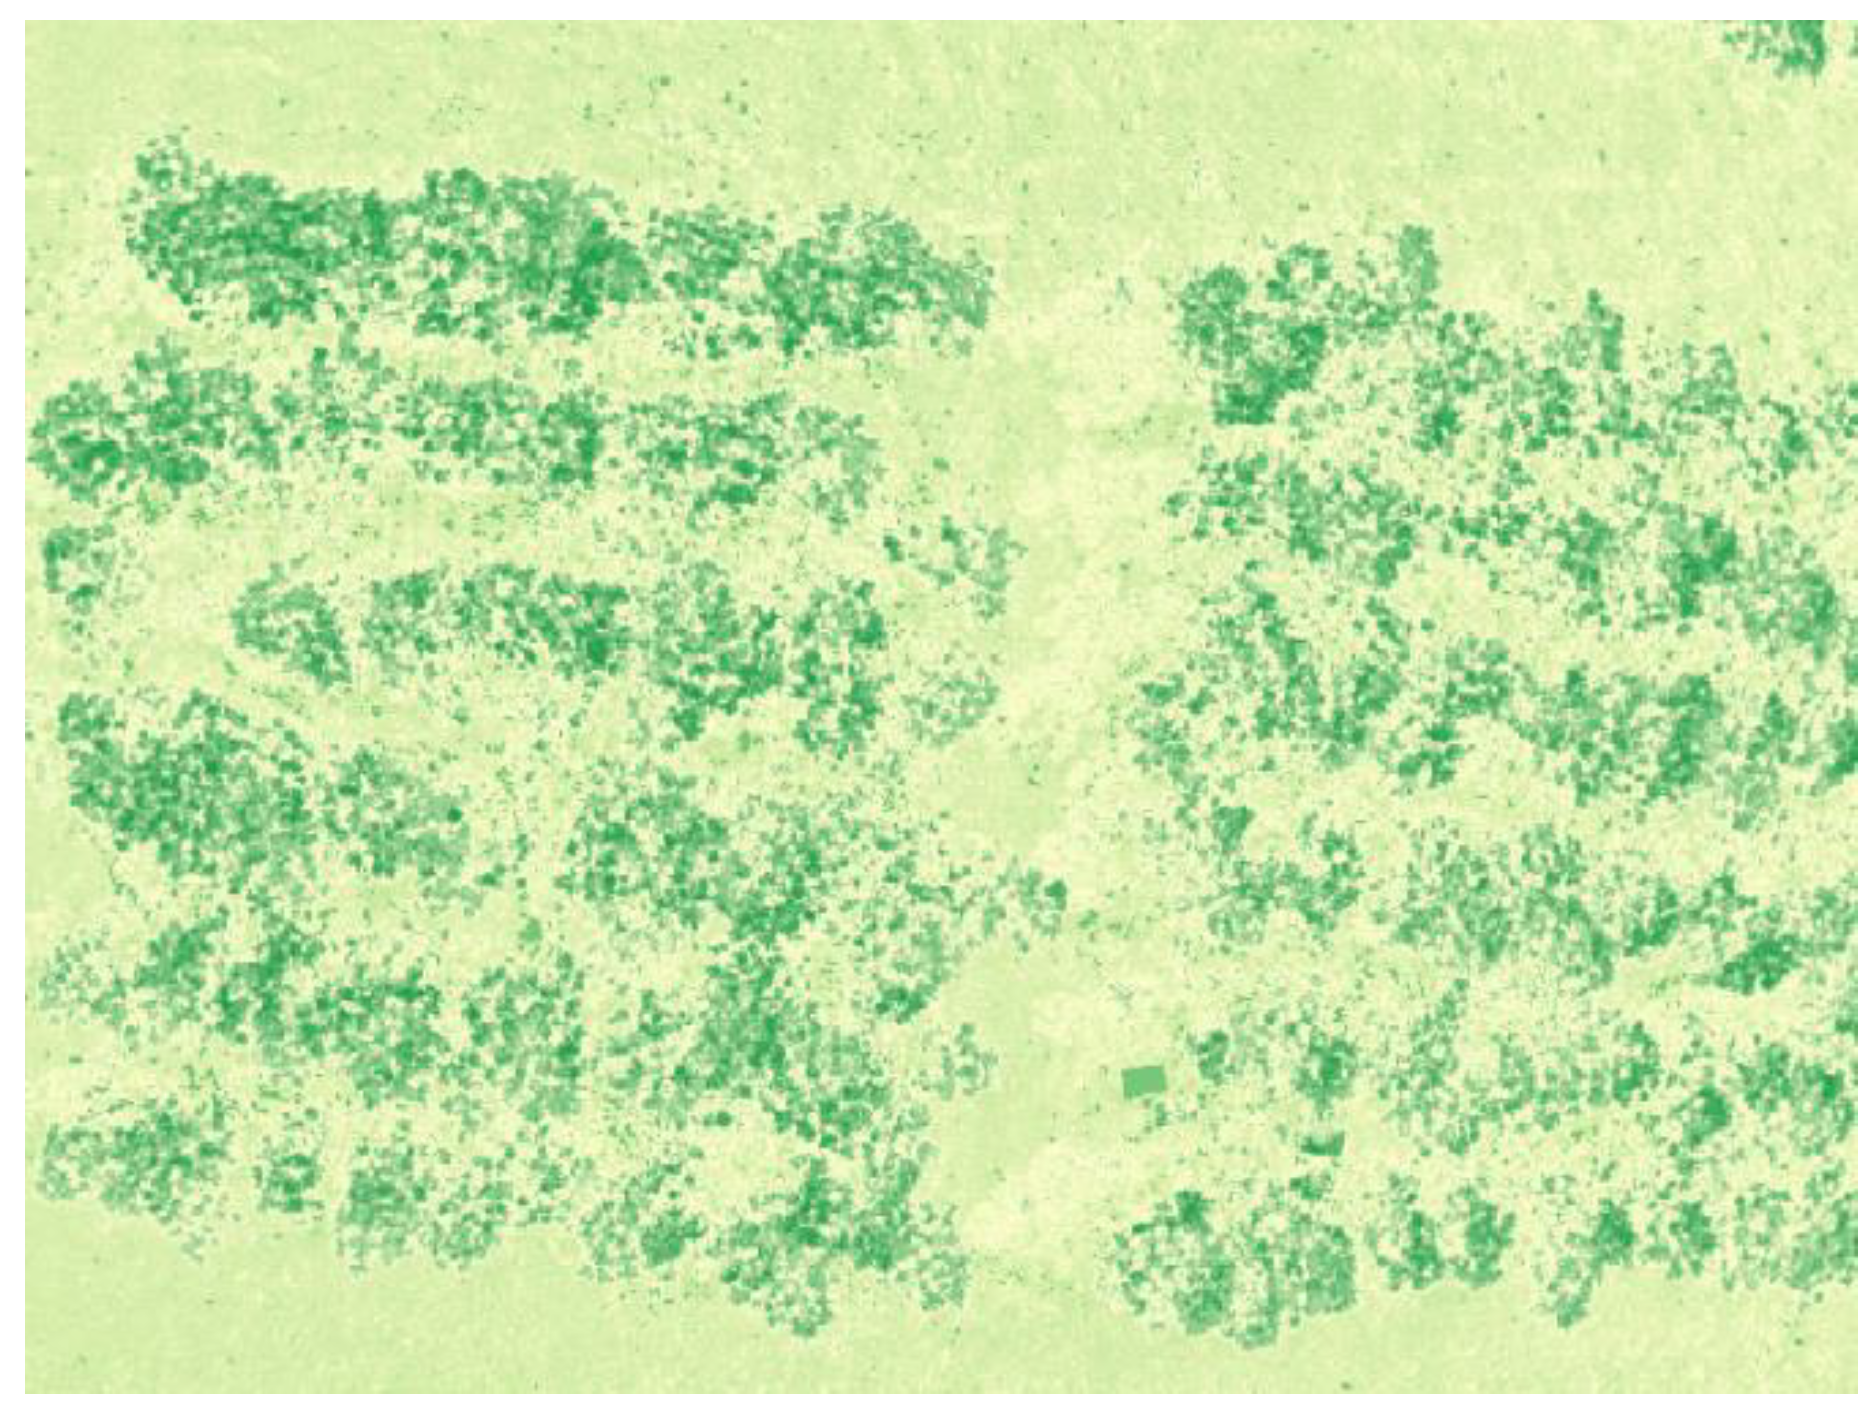
Figure 7.
NDVI of the Cotton Field we used for testing.
Path planning for the Husky robot depends on the NDVI calculation, which is accomplished using the Raster Calculator in QGIS. To ensure accurate detection and counting, the robot's speed is constrained to less than 0.5 m/s. For large-field scenarios, an effective route can be designed that gives priority to areas with healthy crops, then to areas with moderately healthy crops. This strategic approach allows the robot to optimize its scanning by detecting and counting in healthy crop regions initially, strategically bypassing unhealthy areas. The robot then goes back and carefully checks any areas it may have overlooked before, making sure the whole field is evaluated in a systematic and thorough manner. This path planning approach maximizes the robot's operating speed while concentrating on locations that may have problems, improving the effectiveness of agricultural monitoring.
IV. Results and Discussion
After being trained on a specially created dataset designed for accurate cotton crop monitoring, the YOLOv8 model showed encouraging results. The accuracy of the individual classes can be seen below in the Confusion Matrix (Figure 8). All of the cells in the matrix indicate how many examples there are of a certain type. Correct predictions are shown by diagonal elements (from top-left to bottom-right), whereas mistakes are indicated by off-diagonal elements. The confusion matrix may be used to a thorough evaluation of the model's performance across various object classes.
As visible in Figure 9 the graphs provide us various graphs and plots to visualize and assess its performance in object detection tasks which include The Loss Curve is a dynamic visual aid that illustrates the model's training progress by showing how accuracy increases with epochs via decreasing loss. A key factor in maximizing model convergence is the learning rate's evolution throughout training, which is illustrated by the learning rate curve. The precision-recall curve serves as an illustration of average precision (AP), highlighting the trade-off between recall and accuracy. Higher AP values imply better model performance. This assessment is further integrated across all classes by the mean Average Precision (mAP), which provides information about the overall efficacy of the model. With a balanced curve that denotes reliable object identification at all levels, the recall-precision curve graphically depicts the complex link between recall and accuracy. To help identify misclassifications, the Confusion Matrix offers a concise assessment of the model's classification performance. A thorough evaluation of the YOLO model's detection ability is provided by the ROC Curve, which compares the true positive rate to the false positive rate, and the F1 Score Curve, which shows the harmonic mean of accuracy and recall.
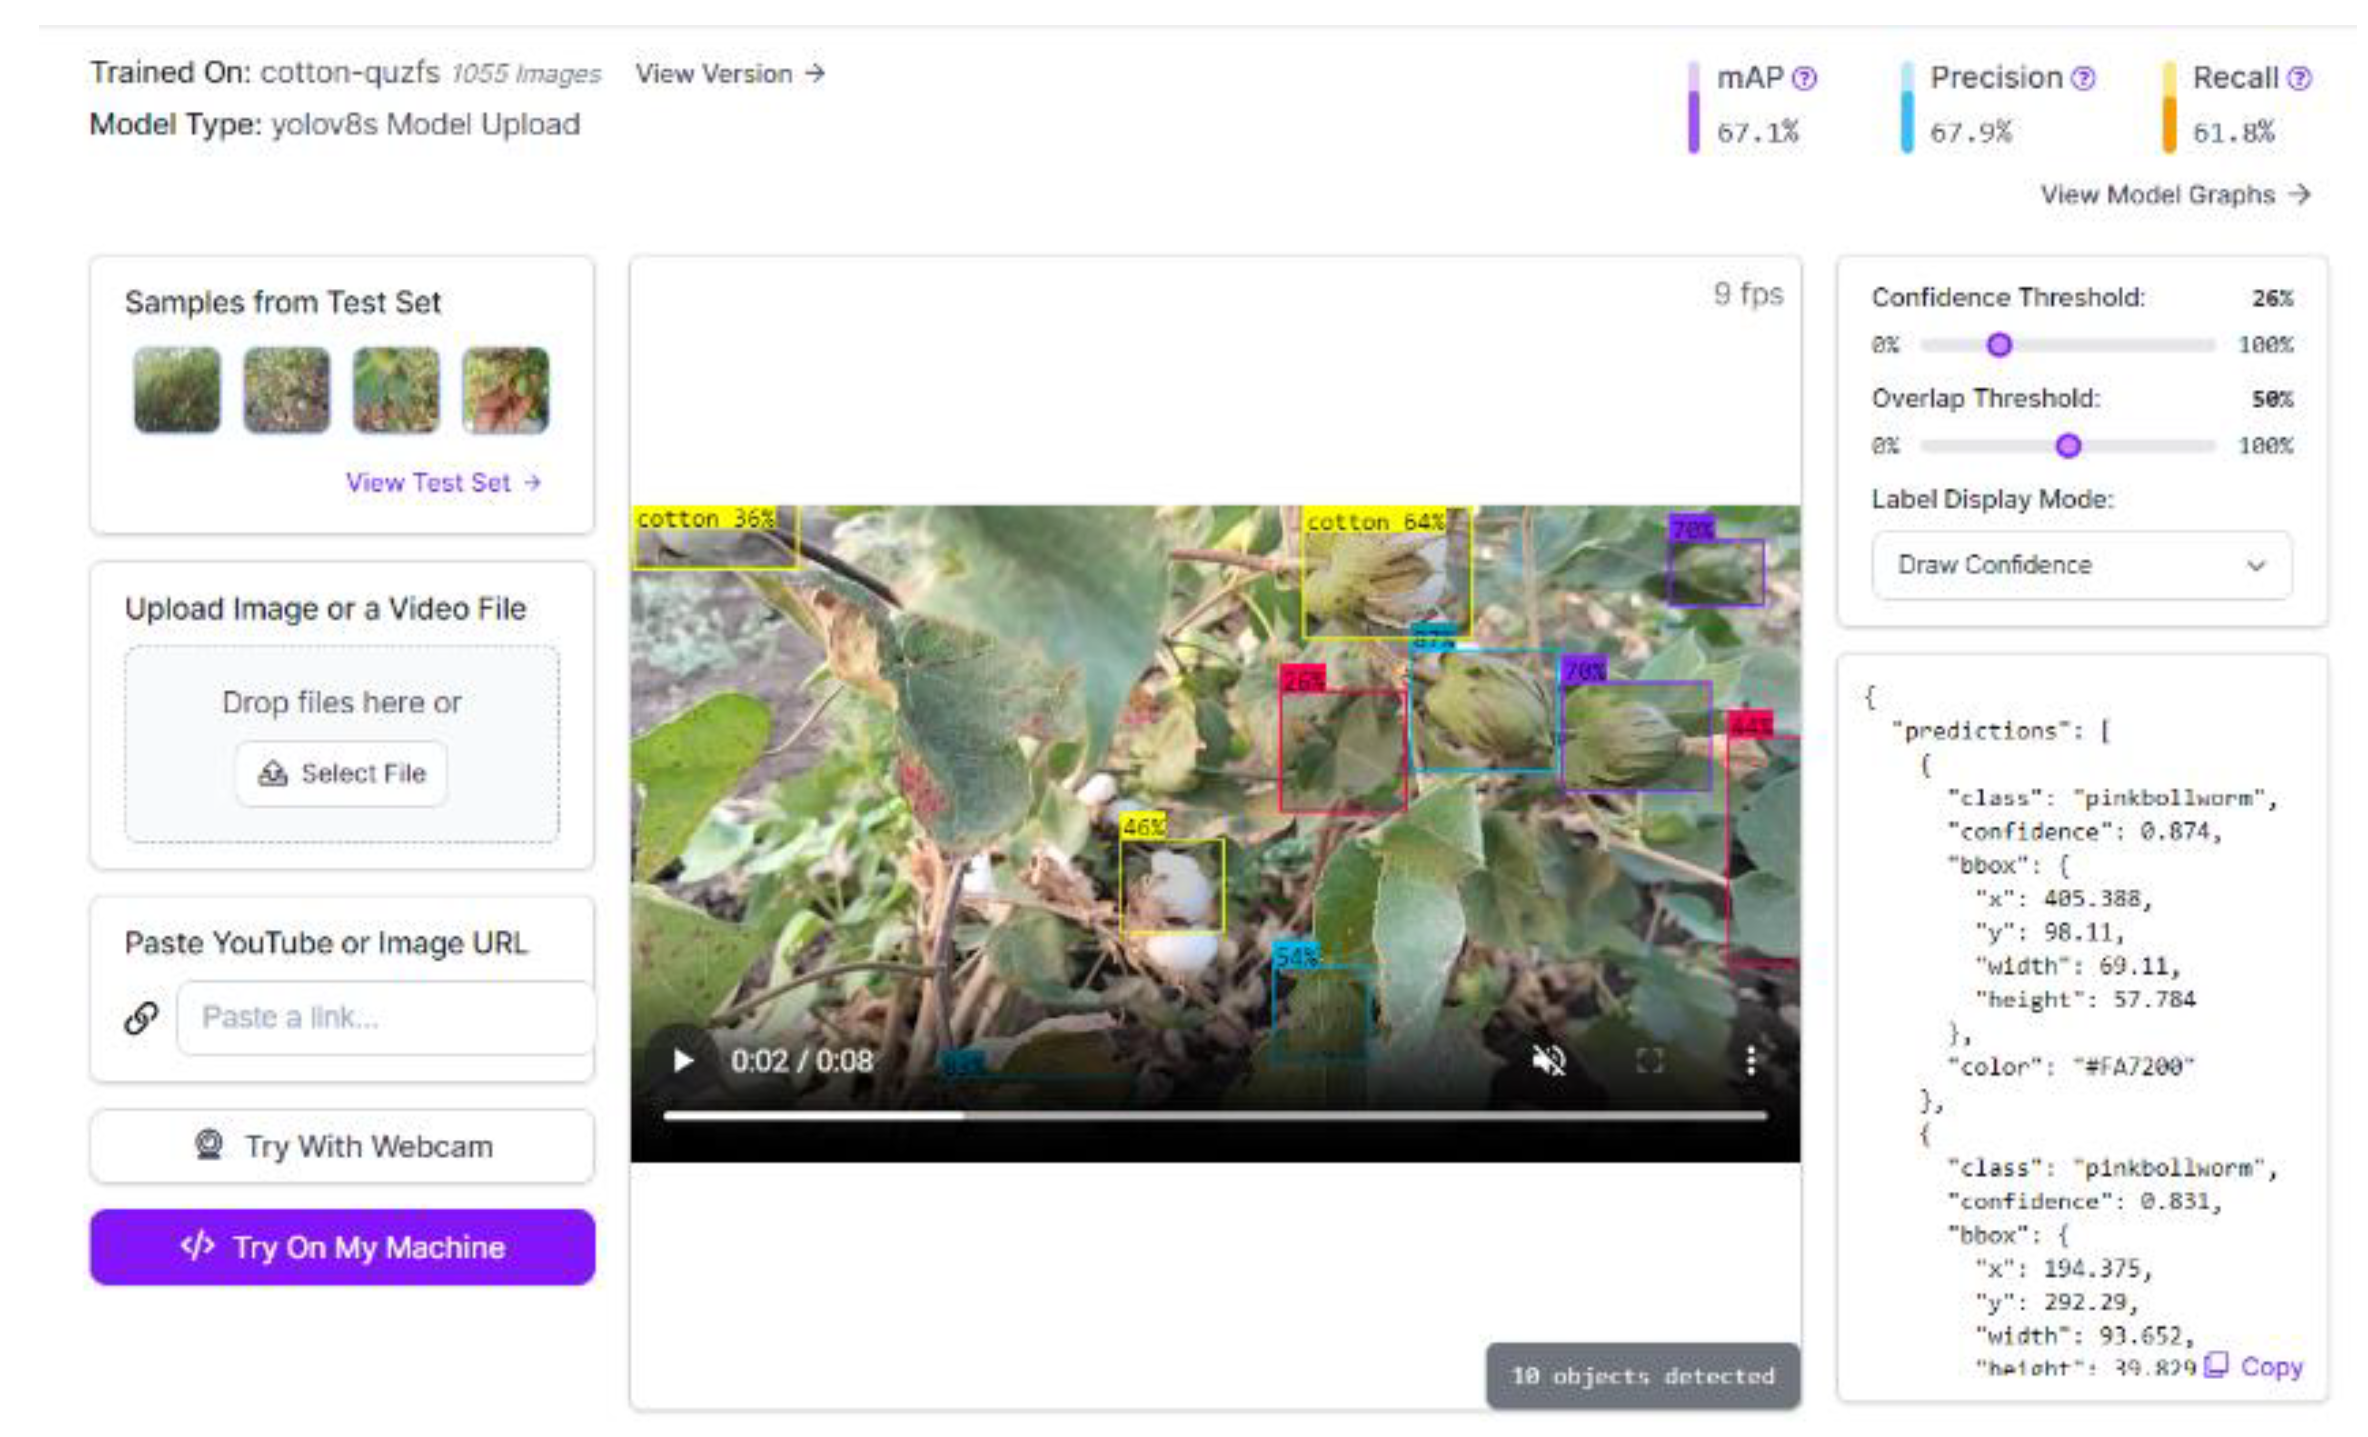
Furthermore, the resultant system's robustness and dependability were improved by using Roboflow for model testing (Figure 10). Metrics showing the model's balanced and efficient performance included a mean Average Precision (mAP) of 67.1\%, Precision at 67.9\%, and Recall at 61.8\%.
Through the integration of state-of-the-art technologies, such as drone-based multispectral photography, NDVI-based path planning, and YOLOv8 object recognition, this research provides an achievable solution. Deployed autonomous robot with an effective detection model helps farmers make fast and accurate decisions, potentially reducing losses from crop illnesses and pink bollworm infestations. The attained outcomes highlight the efficacy of the suggested approach, opening the door for developments in autonomous agricultural robots for crop management and protection.
V. Conclusion and future work
This research offers an effective solution to the critical problems of crop protection in the agriculture sector, including the vulnerability of cotton crops to pink bollworm infestations. An important step toward accurate and efficient crop management has been made with the deployment of an autonomous robot utilizing ROS that can count and monitor diseases affecting cotton crops and infestations of pink bollworm. The Detection model can improve by adding and training more data and also with more total number of iterations of all the training data to improve the overall performance of Model.
To sum up, the study establishes the foundation for a novel and useful strategy for crop protection. The suggested system has the potential to transform crop management techniques and promote sustainable agriculture through the integration of autonomous robots, multispectral photography, and sophisticated detection algorithms. The future work that has been detailed offers a path forward for improving and enhancing the autonomous system's capabilities, guaranteeing its applicability and influence in changing agricultural settings.
VI. ACKNOWLEDGMENT
We sincerely thank the National Agricultural Higher Education Project (NAHEP) for their indispensable assistance and providing of necessary materials. Critical sensors, drones, and the Clearpath Husky robot have all been made available to us, which has made our research efforts far more fruitful. Furthermore, the cooperative chance to work on the Husky ROS codes that NAHEP offered was crucial to our model's testing and verification processes and greatly enhanced its overall effectiveness.
References
- Tabashnik, Bruce E., et al. "Frequency of resistance to Bacillus thuringiensis in field populations of pink bollworm." Proceedings of the National Academy of Sciences 97.24 (2000): 12980-12984. [CrossRef]
- Tabashnik, Bruce E., Timothy J. Dennehy, and Yves Carrière. "Delayed resistance to transgenic cotton in pink bollworm." Proceedings of the National Academy of Sciences 102.43 (2005): 15389-15393. [CrossRef]
- Lippi, Martina, et al. "A yolo-based pest detection system for precision agriculture." 2021 29th Mediterranean Conference on Control and Automation (MED). IEEE, 2021.Liu, Liu, et al. "PestNet: An end-to-end deep learning approach for large-scale multi-class pest detection and classification." Ieee Access 7 (2019): 45301-45312. [CrossRef]
- Liu, Liu, et al. "PestNet: An end-to-end deep learning approach for large-scale multi-class pest detection and classification." Ieee Access 7 (2019): 45301-45312. [CrossRef]
- Boeing, Adrian, et al. "WAMbot: Team MAGICian’s entry to the Multi Autonomous Ground-robotic International Challenge 2010." Journal of Field Robotics 29.5 (2012): 707-728. [CrossRef]
- Reid, Robert, et al. "Cooperative multi-robot navigation, exploration, mapping and object detection with ROS." 2013 IEEE Intelligent Vehicles Symposium (IV). IEEE, 2013. [CrossRef]
- Chang, Yeong-Hwa, Ping-Lun Chung, and Hung-Wei Lin. "Deep learning for object identification in ROS-based mobile robots." 2018 IEEE International Conference on Applied System Invention (ICASI). IEEE, 2018. [CrossRef]
- Henninger, Helen, and Karl von Ellenrieder. "Generating maneuverable trajectories for a reconfigurable underactuated agricultural robot." 2021 IEEE International Workshop on Metrology for Agriculture and Forestry (MetroAgriFor). IEEE, 2021. [CrossRef]
- Deshmukh, Apurva R., Shweta B. Solanke, and Gopal U. Shinde. "IOT for precision Agriculture: A Review.".
- Khatri, Narendra, and Gopal U. Shinde. "Computer Vision and Image Processing for Precision Agriculture." Cognitive Behavior and Human Computer Interaction Based on Machine Learning Algorithm (2021): 241-263. [CrossRef]
- Tekale, D. D., and Gu Shinde. "Ergo technical evaluation of the pneumatic suction based cotton boll picking machine." Pharm. Innov 2 (2021): 97-101.
- Karad, S. C., Prabhat Kumar, and G. U. Shinde. " 7606 A REVIEW ON SENSOR BASED ROBOTIC AGRICULTURE: IMPROVING TRADITIONAL AGRICULTURE PRACTICES.".
- Mahasin, Marsa, and Irma Amelia Dewi. "Comparison of CSPDarkNet53, CSPResNeXt-50, and EfficientNet-B0 Backbones on YOLO V4 as Object Detector." International Journal of Engineering, Science and Information Technology 2.3 (2022): 64-72. [CrossRef]
- Wang, Kaixin, et al. "Panet: Few-shot image semantic segmentation with prototype alignment." proceedings of the IEEE/CVF international conference on computer vision. 2019.
- Chen, Yinpeng, et al. "Dynamic relu." European Conference on Computer Vision. Cham: Springer International Publishing, 2020. [CrossRef]
- Zhang, Baoxian, Jun Liu, and Haoyao Chen. "AMCL based map fusion for multi-robot SLAM with heterogenous sensors." 2013 IEEE International Conference on Information and Automation (ICIA). IEEE, 2013. [CrossRef]
Figure 8.
YOLO Confusion Matrix.
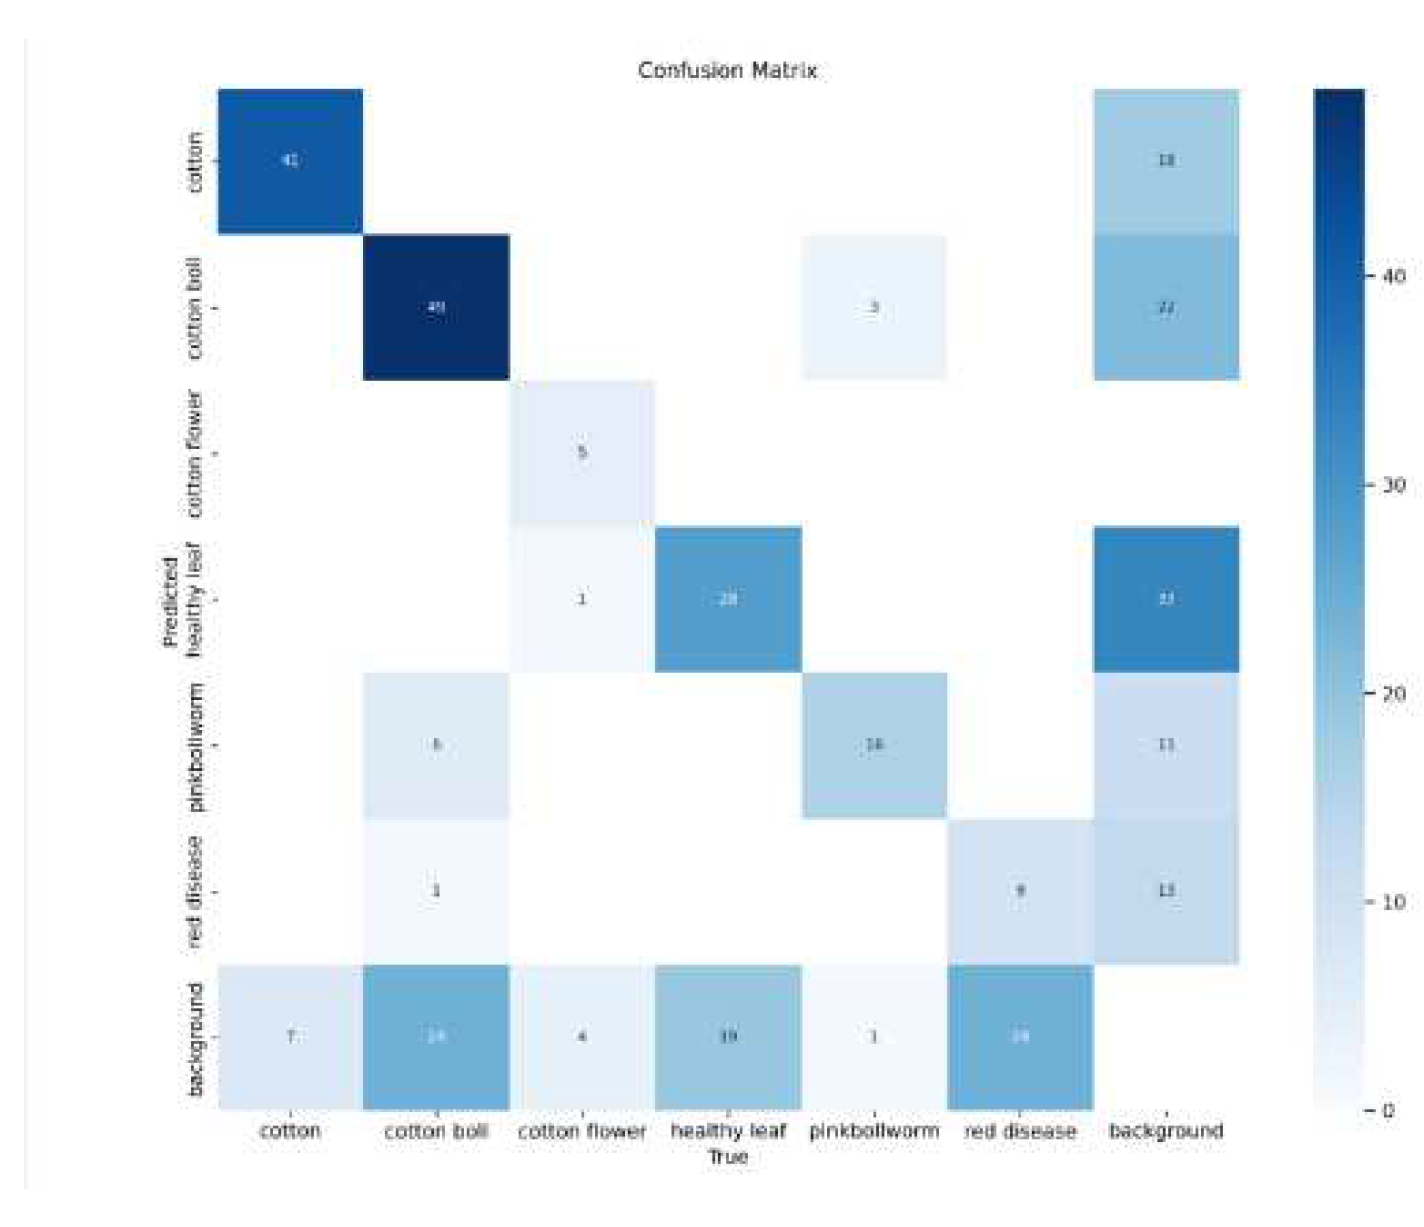
Figure 9.
YOLO Model Training graphs.
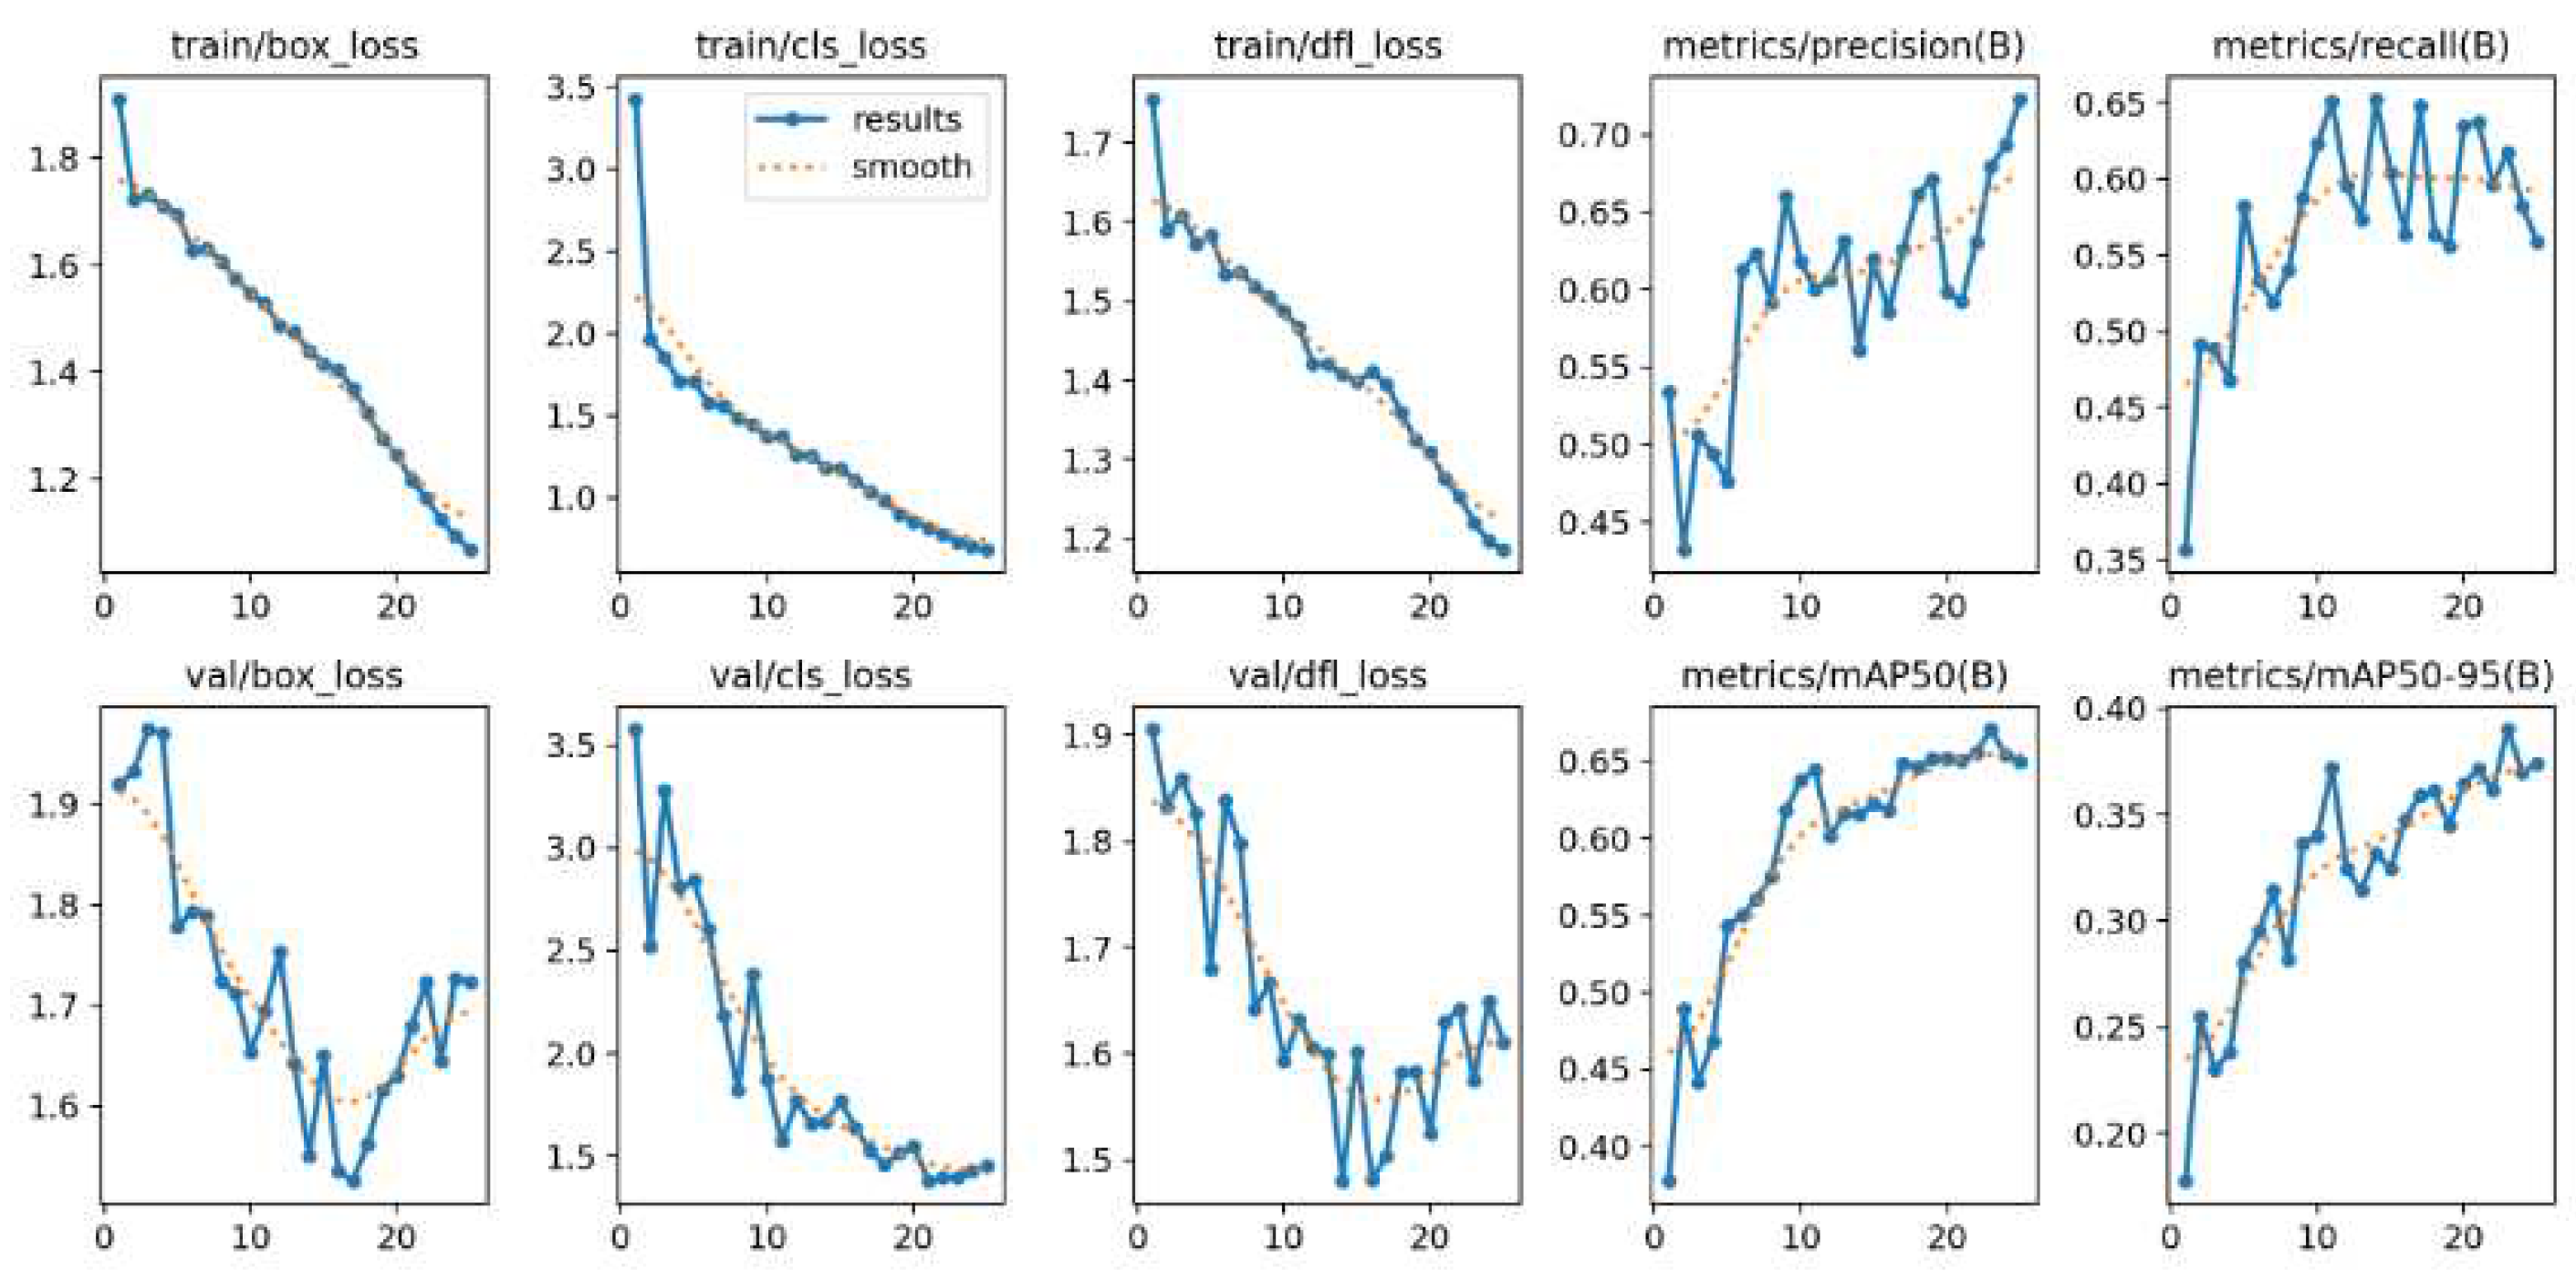
Figure 10.
Testing of YOLOv8 model at Roboflow.
Disclaimer/Publisher’s Note: The statements, opinions and data contained in all publications are solely those of the individual author(s) and contributor(s) and not of MDPI and/or the editor(s). MDPI and/or the editor(s) disclaim responsibility for any injury to people or property resulting from any ideas, methods, instructions or products referred to in the content. |
© 2023 by the authors. Licensee MDPI, Basel, Switzerland. This article is an open access article distributed under the terms and conditions of the Creative Commons Attribution (CC BY) license (http://creativecommons.org/licenses/by/4.0/).
Copyright: This open access article is published under a Creative Commons CC BY 4.0 license, which permit the free download, distribution, and reuse, provided that the author and preprint are cited in any reuse.


