
Submitted:
30 November 2023
Posted:
01 December 2023
You are already at the latest version
Abstract
In several emergency situations, during natural or human-caused disasters, frontline responders need to be able to communicate and collaborate to properly carry out the relief mission. Some countries are building their national Public Safety Mobile Broadband based on cellular LTE technology to provide fast, safe, and secure emergency services. Otherwise, in several emergency situations, the cellular antennas can be overloaded or partially damaged in manner to affect the group communication services. Since few last years, direct device-to-device (D2D) communications have been proposed by 3GPP as an underlay to Long Term Evolution (LTE) networks based on proximity, reuse, and hop gains. This paper focuses on the loosely coupled model based on D2D direct communication for Public Safety context. Many scenarios related to user membership and network management are detailed. Both “less cost” and “optimized tree” approaches are proposed, implemented, and their performance evaluated in terms of network updates number and resulting average Channel Quality Indicator (CQI). Other optimization approaches with different CQI threshold and optimization interval values have been implemented, simulated and their performance are compared with the “optimized tree”.
Keywords:
Public Safety Network
; D2D
; Proximity Service
; underlay networks
; loosely coupled 22 model
; network simulation
0. Background and motivations
Natural or man-made disasters like earthquakes, avalanches, floods, tsunamis, fire, massive pile-up or building collapse are occurring frequently in many places around the world. The need for communication services becomes very high during and after such events. In many cases, disaster scenario requires from rescue crew (firefighters, paramedics, police officers, etc.) to remotely interact with witnesses as well as with disaster survivors to coordinate together the rescue mission. In several emergency situations, the cellular antennas can be overloaded or partially damaged in a manner to prevent rescue teams from communicating.
The most famous Land Mobile Radio (LMR) technology have been extensively deployed in public safety contexts till now 1. With data rates around several hundreds of Kbps, LMR networks show limitations when it comes to supporting bandwidth-intensive applications. Thus, LMR technology is adapted to support Push-to-Talk (more known as Talkie-Walkie service) in addition to some tracking service for vehicle and terminal localization. Moreover, the LMR networks assigns a separated frequency range for each type of response team. As a result, firefighters will never be able to communicate with paramedics, for example. Therefore, attention is drawn to the use of cellular long-term evolution (LTE) technology and beyond as access network support for public safety. Such solution is known as Public Safety Mobile Broadband (PSMB) like the FirstNet in the United States, Emergency Service Network (ESN) in the United Kingdom, or SafeNet in South Korea 2. The operating principle of PSMB is to allocate a wide and low-frequency band (in the 700 MHz) which will be reserved exclusively for emergency situations. Unfortunately, the proposed frequency band can be saturated, or the disaster area might not be covered by the 4G/5G networks. Moreover, these solutions are proposed to be used by only professional registered first responders and there is no means for victims or disaster witnesses to take part, nor to collaborate by identifying survivors and their location for example. With the aim to provide extended LTE coverage to a large geographic area, some PSMB solution like FirstNet deploy aerostats from 300 meters height able to cover roughly 360 km². Otherwise, the slowness of aerostats movement speed (10 km/h) to join the disaster area combined with their sensitivity to the wind make their deployment not usually obvious. Some complementary PSMB mobile vehicles-based solution might also be deployed directly on the disaster area to create/extend coverage or even to increase existing network capacity using drones, light truck, or minivan able to carry equipment based on both LTE and Satellite. However, most emergency situations require very urgent action for rapid communication establishment between responders. Proposed solutions are not usually obvious to deploy since heavy logistics tasks are required and a considerable availability of qualified human resources is necessary to drive or command land/air vehicles. Moreover, the number and the diversity of the deployed equipment as well as the complexity of offering a new LTE-based network using another LTE Cell or Satellite make the use of such a solution very expensive to be deployed specially in countries with large territories and limited resources.
On the other hand, for a few years, the Third Generation Partnership Project (3GPP) introduced Device to Device (D2D) technology 3, that enables direct connection where data plane can be handled by User Equipments (UEs) without crossing the cellular network infrastructure. This D2D technology can be coupled with the Proximity Service (ProSe) 4 that provides many functions including discovery, communication, and relay mode. ProSe technology allows UEs in proximity to discover themselves and to establish direct communication channels as soon as cellular operators enable the public safety mode. D2D technology enables out-of-coverage UE to join the network through another UE that plays the role of relay. Compared to the proposed PSMB solutions, the deployment of D2D in public safety context offers mainly several benefits:
- Proximity profit with higher throughput, lower delays, and lower power consumption.
- Avoid overloading the central cellular antenna by dispatching media streams directly between participants.
- Extend cell range by using in-band D2D relay function to connect out-of-range devices.
This paper explores underlay networks models based on D2D by focusing on the loosely coupled topology. User membership and network management are studied, and some simulations are conducted to analyze the effects of user density and group connectivity as well as assessing optimization effect in terms of CQI and number of links update. The remaining of this paper is organized as follows: Section 1 provide survey of some existing solutions for public safety context, section 2 present an overview of the underlay D2D network based on ProSe service, while section 3 focuses on the loosely coupled model, section 4 includes material and methods used for simulations and section 5 presents the simulation results and comments followed by concluding remarks.
1. Related Works
To minimize the impact of possible cellular network overload, or coverage limitation, the research community and the industry have recently considered the deployment of Unmanned Aerial Vehicles (UAVs) during the rescue mission. The UAV can play a fundamental role in supporting new value-added services and applications. Among these, we can mention remote sensing in surveillance operations [1], collaborative search and rescue [2,3], building aerial sensor networks that aid disaster management [4], or supporting backbone communications to mobile ground stations [5].
Instead of using UAVS, author in [6] propose the deployment of vehicle-mounted mobile base station to provide services like file distribution among group communications over heterogeneous architecture with the aid of group application server and Proximity Service links as illustrated in Figure 1. In this solution, a vehicle-mounted mobile base station is placed close to the disaster area and works in a cell breathing manner to expand or shrink the cell coverage periodically to support group communications. In [7], author use the multi-hop function where a device can play the role of a relay to connect out-of-range devices using D2D connection. Thanks to the Third Generation Partnership Project (3GPP) that proposed this D2D technology coupled with the Proximity Service (ProSe) 8. Thus, ProSe technology allows UEs in proximity to discover themselves and even to have direct communication as soon as telecom operators enable the public safety mode. Direct links are then created between UEs rather than having their radio data (user plane) travel through the base station (BS) or over the core network. D2D communications can effectively improve overall throughput, minimize packets latency/jitter as well as optimize radio spectrum utilization and even energy consumption. The next section explores how to use D2D and ProSe technology to build underlay networks.
2. Underlay D2D network based on ProSe service
2.1. Introduction
During the first generations of cellular networks, only one air interface is defined and used to connect UE to the network infrastructure by supporting uplink and downlink operations. With the 3GPP release 12[8], a sidelink has been introduced allowing UE to connect directly with other UEs. This sidelink defines a set of physical, transport and logical channels that can be deployed for synchronization, discovery, and direct communication operations within a D2D communication underlaying cellular system. Newly defined physical layer channels are as follows:
- PSBCH: Physical SL broadcast channel, which carries system information and synchronization signals.
- PSCCH: Physical SL control channel, which carries UE-to-UE control plane data.
- PSDCH: Physical SL discovery channel, which supports UE direct discovery transmissions.
- PSSCH: Physical SL shared channel, which is used for user plane data transmission.3.
2.2. Reference ProSe architecture
3GPP has also defined a Proximity Service (ProSe) in both 4G[9] and 5G[10]. From Figure 2, some main components can be identified:
- ProSe App server which can serve as public safety answering point and can directly communicate with an application defined in UE.
- ProSe UE App which is an application installed on the UE side that uses ProSe capabilities.
- ProSe Function/DDNFM that acts as the reference point for ProSe App Server and UEs. This function is responsible for verification, authorization, and configuration of UEs. It also allows network core level discovery for direct communication scenarios between devices.
In addition to the PC5, several other interfaces have been defined by 3GPP to allow interaction between the various ProSe components and network core functions. We can mention the PC1 interface that enable applications installed on the UE to exchange data with the ProSe Server while the PC2 is used by ProSe functions to get updates from the server and to support all functionalities used for direct D2D communication. On the other side, the UE can use the PC3 interface for D2D discovery and communication.
The architecture presented in Figure 2 shows a basic case of two UEs belonging to the same public land mobile networks (PLMN) supporting 4G and 5G networks. However, it is possible that UEs register to different PLMNs or even belong to different radio access networks (RANs) such as LTE-A and WiFi. Some other interfaces not mentioned in this paper can be used for roaming scenarios to keep home ProSe function/DDNFM reachable for both the roaming UE as well as the visiting ProSe function.
2.3. ProSe functions and communication scenarios in public safety networks
In public safety context and following any eventual damage caused by the disaster, three situations can be resulted: (1) cellular antenna continue to operate normally, (2) a part of them are available while other are paralyzed, and (3) all the access network is paralyzed. To support these cases, D2D communication can be divided according to the following three scenarios, as shown in Figure 3:
- In-coverage: when all UEs are within coverage of the eNB(s)
- Partial-coverage: when at least one in-coverage participant acts as UE-to-Network relay while other UE-to-UE relays can provide network access to distant users.
- Out-of-coverage: when all participants are out of the eNB’s
Figure 4 illustrates all supported ProSe functions and scenarios for both commercial and public safety use cases. While only ProSe discovery operations are supported in commercial context, the Public Safety can benefit from all available ProSe functions including direct and relay-based communication throw PC5 interface. We note that WLAN integration is defined only in ProSe based on LTE, while the UE-to-UE Relay function is defined only in ProSe based on 5G network.
2.4. D2D synchronization procedure
Synchronization procedure is a precondition for direct communication and direct proximity discovery services. This procedure defines physical resources in time and frequency that carries D2D control and traffic data. The Primary Sidelink Synchronization Signal (PSSS) is deployed in synchronization of the initial timing and frame boundary estimation. PSSS signals are designed to simplify the detection of the synchronization sources. It can be broadcasted by cellular antenna for in-coverage UEs or even by an independent UE for partial and out of coverage scenarios. The synchronization procedure happens naturally as long as UEs are in coverage of the same eNB or scattered over synchronized neighboring eNBs. For UE located in coverage of an eNB that supports sidelink operation, Resource Pool with preconfigured list of Transmission and Reception parameters will be provided to configure the D2D direct communication.
2.5. Infrastructure vs. D2D based communication
Despite all efforts to execute load balancing between cells, the fully centralized approach based on eNBs is not usually suited for public safety situations where large number of subscribers are grouped on the same area and sharing large amount of data. To avoid eNBs overload situation, D2D direct communication can be considered as an alternative solution that create an underlay network supported and maintained by participant UEs as illustrated in Figure 5. All the traffic should then be spread among the involved devices throw direct communication links. Moreover, partial-coverage D2D communications can be deployed to overcome lack of coverage issue.
2.6. Underlay D2D topologies Models
ProSe Direct D2D communication can be established through one-to-one or one-to-many methods [8]. Users in coverage receive authorization and radio parameters from the PLMN while out-of-coverage users should use their pre-configured data. The one-to-many communication is based on multicast method to enable subscribed users having the same Group-ID to receive a copy of the message. In D2D communications, links quality is evaluated according to the channel Quality Indicator (CQI) by attributing a value between 1 and 15 [11]. These values indicate the level of modulation and coding the UE could operate. The value 15 is assigned to the channel having the best quality. In this work, we define some D2D models according to the following topologies illustrated in Figure 6:
- Loosely coupled: In this model, illustrated in Figure 6(a), a minimum number of links should be created and maintained within D2D group using one-to-one communication method.
- Fully Coupled: In this model illustrated in Figure 6(b), each UE should connect with all neighbors in its range. This approach can be achieved using multicast one-to-many communication method.
- Tightly coupled: In this approach illustrated in Figure 6(c), starting from the loosely coupled model, new additional selected links can be added between UEs according to one of these strategies: (1) based on CQI by maintaining only links that hold certain CQI threshold, (2) based on a maximum number of links per user in manner to connect with neighbor having less number of connections instead of neighbor with highest CQI, and (3) based on a combination of the two previously mentioned strategies while the additional links are both limited by their number but also by the minimum level of CQI.
3. The D2D Loosely Coupled Model
This paper will focus on the loosely coupled that keep a minimum number of direct connections between UEs while guaranteeing an interconnection path between the maximum number of participants.
3.1. Neighbor’s classification
To facilitate the management of the network, each Selected User (SU) will detect neighbors in his coverage and classify them according to two possible group types: The first single group, named Gnc (Group of not connected), which includes all the neighbors who have no path connecting them. The second group type is named Gc (Group of connected). Depending on the topology, some Gc groups can be created to include all the SU neighbors who have an already path that connects them. If many groups are created, they will be named Gc1, Gc2, Gc3, etc. We mention that the path which connects two neighbors can allow either a direct link or indirect link between them by crossing other UEs who are not necessarily neighbors of the SU. Based on the example illustrated in Figure 7, the SU should create the following groups: Gnc = {3,6}; Gc1 = {1,2}; Gc2 = {5,7,8}.
3.2. Adding user to the network
To join a D2D network, the new user (NU) starts by sending a PSCCH message to discover his neighborhood. Based on PC1 interface, ProSe Application Server should provide to the NU a global description about the participating UE including an identification of interconnection links. Based on this information, NU should be able to create Gnc and Gc groups to classify discovered users on the neighboring. As a next step, as illustrated in Figure 8 and Figure 9, NU should create a direct communication using PSSCH with all neighbors on the Gnc group. Afterwards, direct communication should be established by NU with the user having the best CQI on each Gc group.
3.3. Network Update Management
The geographic mobility of UEs, combined with different obstacles and external sources, can significantly affect the power and quality of the signal. In this context of permanent change of CQI, it is important to conduct periodic updates to ensure the connectivity of the group. Two strategies are proposed: (1) “Less cost” approach that tends to retain the links between UEs as long as they exist. However, as soon as a link from a member of the Gc group is lost, a new link with a UE from the same Gc group will be created, (2) “Optimized tree” approach that is a little more expensive, but it has the advantage of guaranteeing a network with optimal links. As soon as a variation in the link with a member of one of the Gc groups is detected, the procedure is triggered to check if a better link is possible within the same group. The two approaches are illustrated on the flowchart of Figure 10.
3.4. UE departure or disconnection
UE disconnection from the D2D network can be done according to three different scenarios:
- Alert before leaving: Alert can be generated by the UE before leaving the D2D network. This can happen when the battery reaches a critical level, or as soon as the CQI level drops continuously and tends towards zero, or if the user sends a disconnection request before closing the application.
- Suddenly without alerting: This situation should not be very frequent, and it is due to the voluntary closure of the terminal connection or due to signal interference. Otherwise, it could be caused by an obstacle which suddenly blocks the radio transmission.
- General disconnection from the network: When the rescue mission ends, the PLMN terminates the public safety network mode. In this case, the UE is no longer authorized to use direct D2D communication function.
Depending on the position on the topology, if the UE was a "Leaf node" (holding only one connection), in this case, no damage to the network tree can be caused by this departure. For other cases, D2D network using the loosely coupled approach will be affected and recovery procedure should then be launched in proactive or reactive mode to find alternatives. Fixing CQI threshold close to value 1 or 2 can, in many cases, resolve the departure problem by proactively changing the network topology in manner to place the leaving UE as leaf node.
4. Material and Methods
4.1. Simulation environment and parameters
We have developed our own Java based simulator [12] with graphic interface using MG2D API [13]. The loosely coupled model has been implemented to support both ‘Less cost” and “optimized tree” algorithms as illustrated in Figure 11.
Figure 11.
Overview of D2D direct communication in loosely coupled topology implementing: (a) “less cost” and (b) “optimized tree”.
Figure 11.
Overview of D2D direct communication in loosely coupled topology implementing: (a) “less cost” and (b) “optimized tree”.
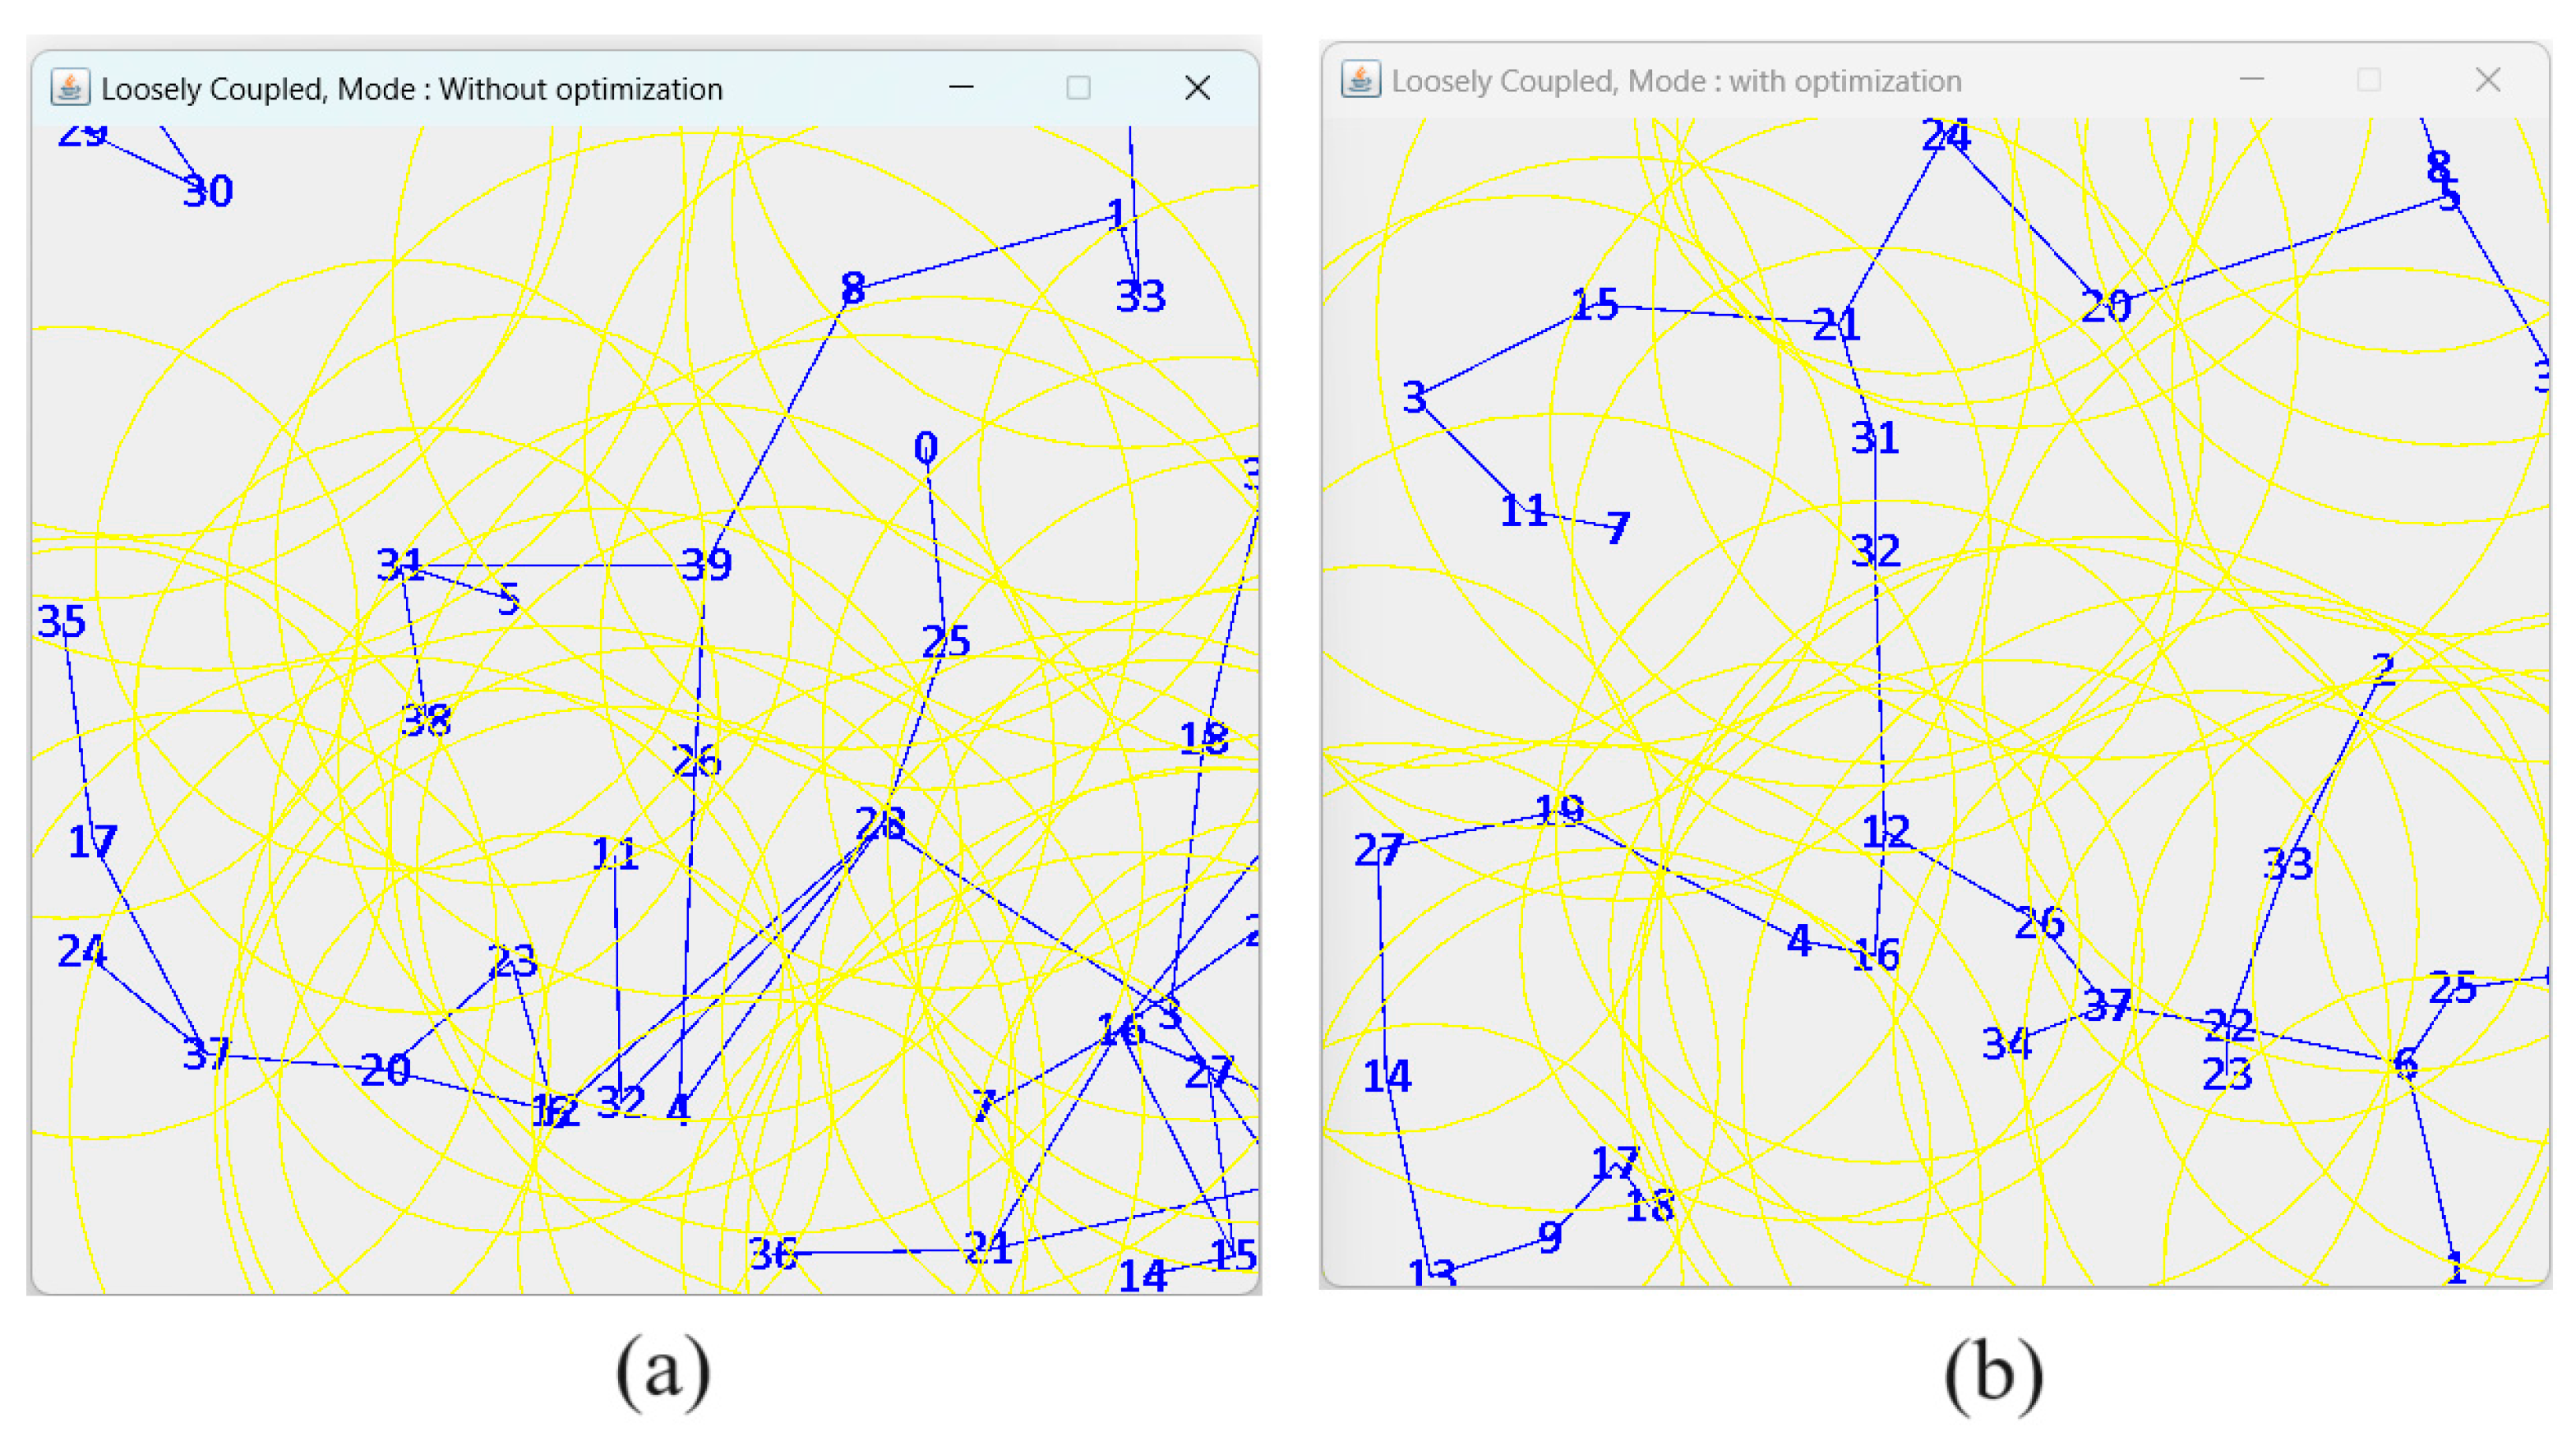

Table 1.
Summary of the Parameters used in the simulation experiments.
| Simulation Parameters | Value |
|---|---|
| Transmitter range | Randomly from 100 to 200 m |
| CQI | 1 to15 (0 for unreachable UE) |
| Simulation Time | 7200 seconds (2 hours) |
| Node Pause Time when boundary is | Randomly 0 to 60 seconds |
| Topology Size | 500m x 500m |
| Number of Nodes | from 2 to 70 (new added node every 100 |
| Node Speed (Vmax) | 1 to15 (0 for unreachable UE) |
4.2. Adding users to the simulation area
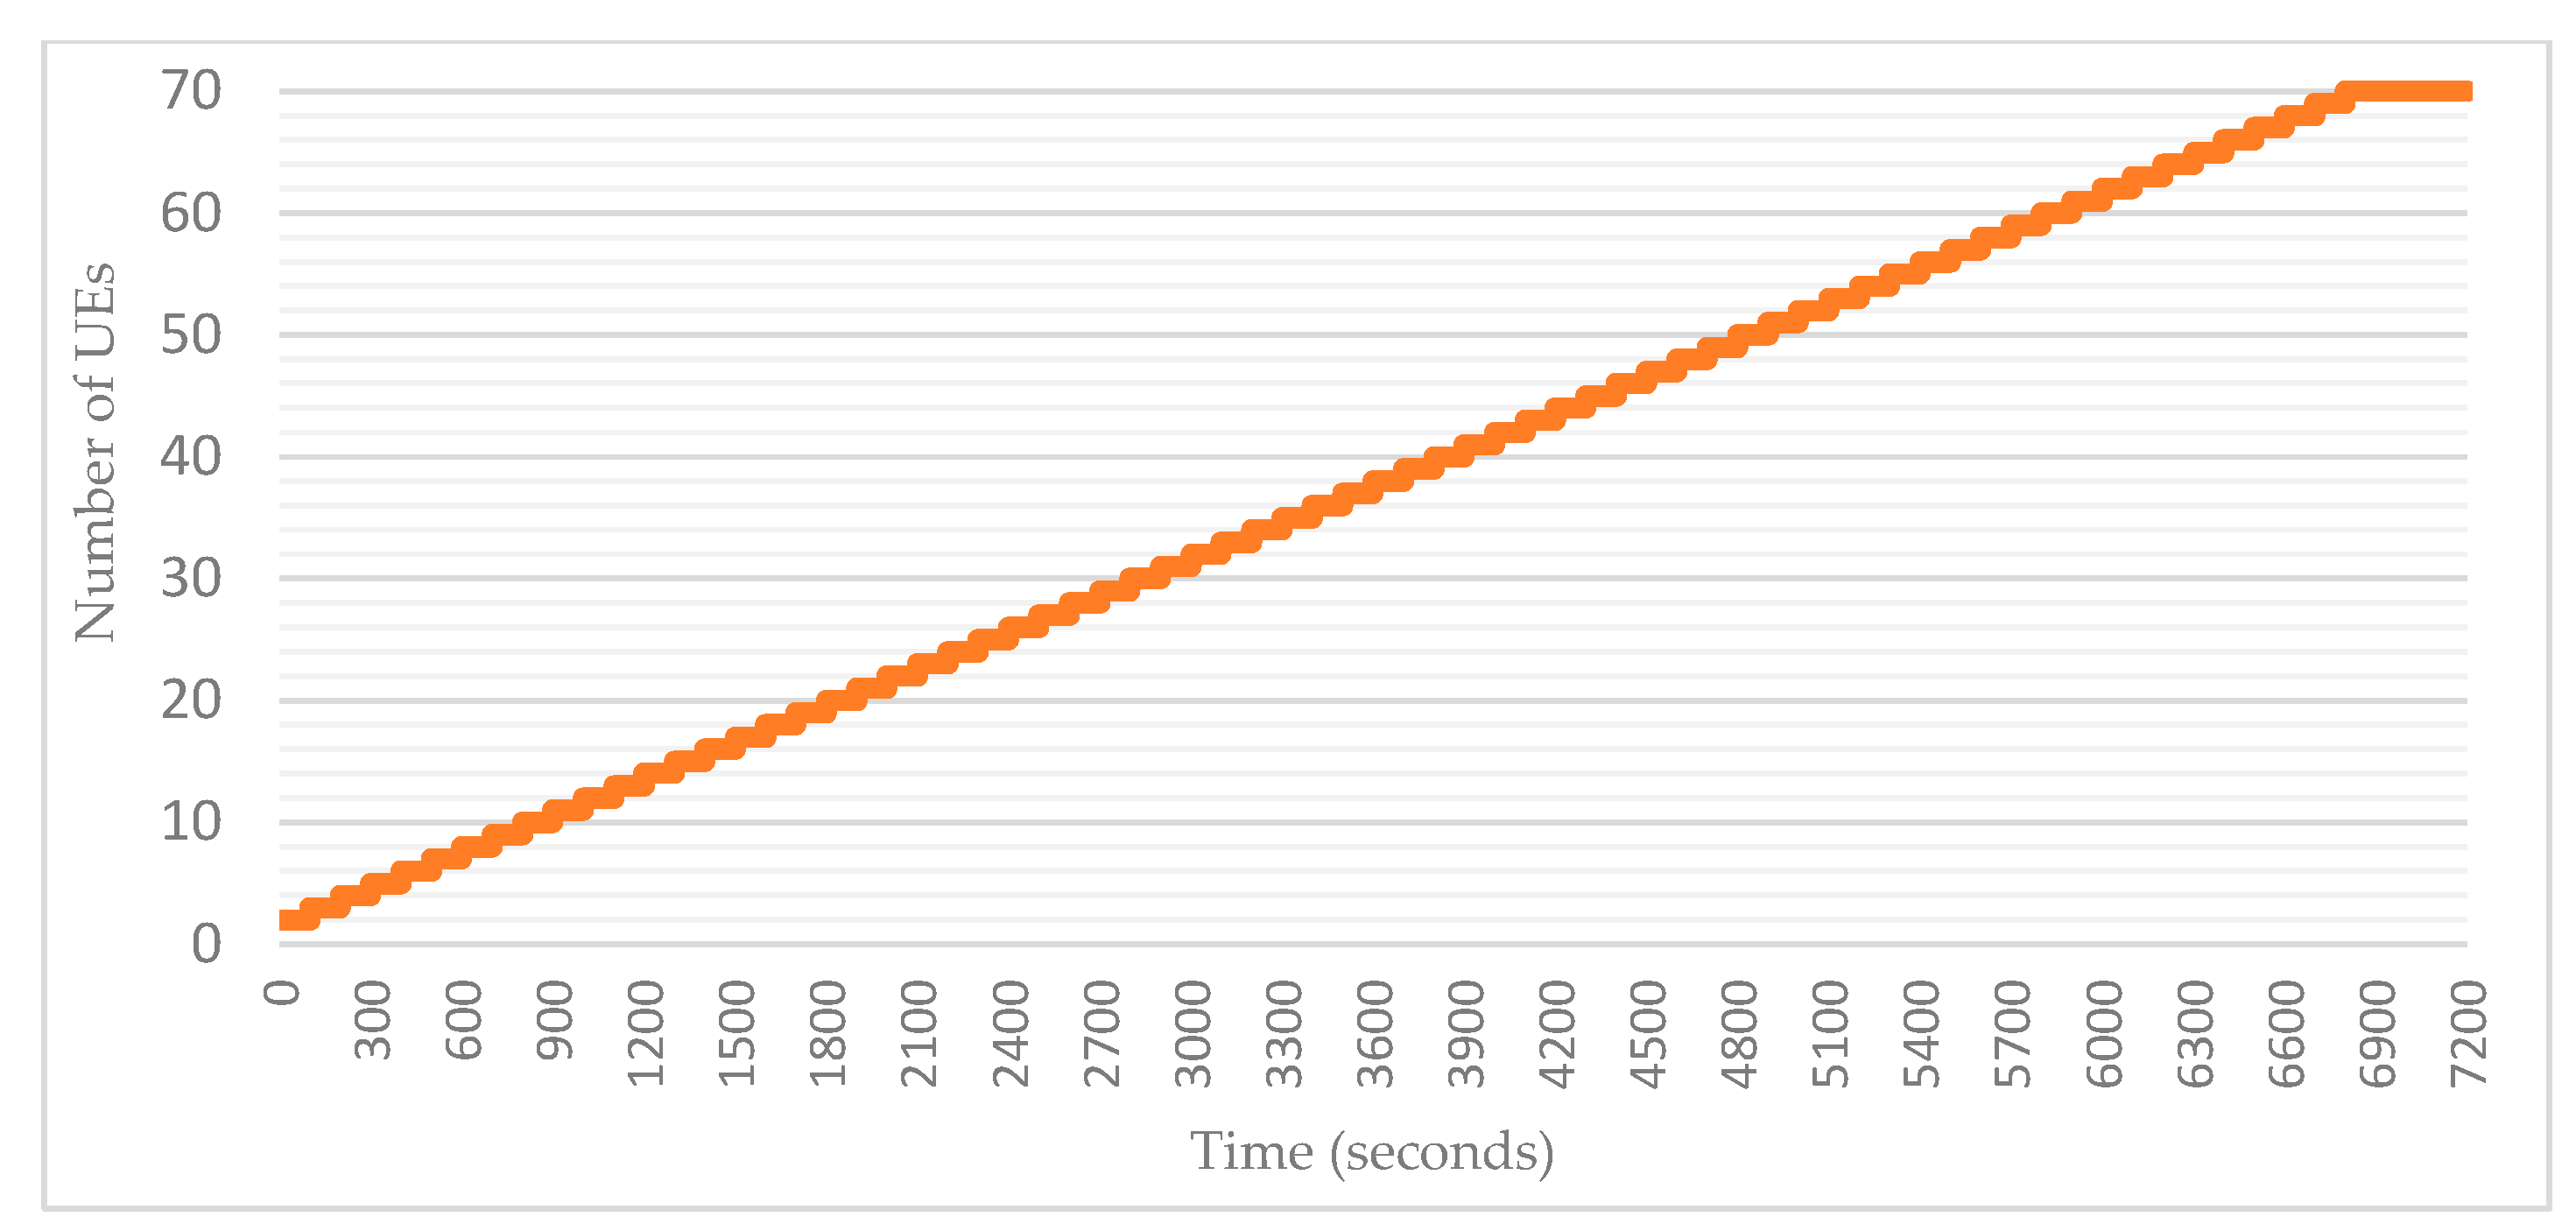
Number of nodes representing UEs can then be placed randomly on preconfigured square/rectangle area. Once the total number of nodes in the simulation is defined, it is possible to add all the nodes either during simulation launch, or gradually according to pre-configured time intervals. In our simulations, we opted for the second method by adding a new UE every 100 seconds. This allows us to better observe the evolution of the group as well as many parameters related to the connectivity levels, the average CQI and the number of topology updates.
Figure 12.
Adding UEs to the simulation area over time.
4.3. UE movement model
RDM (Random Direction Mobility) model [14]is used to simulate rescue team movements during the disaster situation as illustrated in Figure 13. Compared to other models, RDM avoids a high probability of any node to select a new destination located around the center of the simulation area, or a destination that requires path of the node through the center area. In our simulation, a node starts its motion by selecting a direction 0, 2*π with speed 0, Vmax. As soon as the node reaches the limit of the simulation zone, it waits for a random pause time of 0,60s. Subsequently, the node chooses a new direction among 0, π while keeping its initial speed. This process continues until the simulation ends.
4.4. UE Transmission/reception range and CQI calculation
Even if the direct LTE max transmission range can reach 500 meters [15], the realistic values are generally located between 100 and 200 meters [16]depending on the area topology and by taking into consideration all sources that can affect signal strength/noise. CQI values are determined by Table 2 that show corresponding modulation/coding scheme with the minimum transmission rate expressed in kbps.
Table 2.
CQI-MCS mapping for D2D direct communication.
| CQI | Modulation and Coding Scheme | Min. Rate D2D (kbps) |
|---|---|---|
| 1 | QPSK | 28.00 |
| 2 | QPSK | 37.33 |
| 3 | QPSK | 56.00 |
| 4 | QPSK | 112.00 |
| 5 | QPSK | 168.00 |
| 6 | QPSK | 201.60 |
| 7 | 16-QAM | 224.00 |
| 8 | 16-QAM | 336.00 |
| 9 | 16-QAM | 403.20 |
| 10 | 64-QAM | 504.00 |
| 11 | 64-QAM | 504.00 |
| 12 | 64-QAM | 604.80 |
| 13 | 64-QAM | 756.00 |
| 14 | 64-QAM | 840.00 |
| 15 | 64-QAM | 924.00 |
The uplink CQI is determined proportionally to the distance d between the two UEs by considering the maximum transmission range R of each user as illustrated in Algorithm 1.
| Algorithm 1. CQI calculation |
|
if d > R CQI ← 0 else if d = = 0 CQI ←15 else CQI ← 16 – d / (R / 15) // CQI is defined as an Integer |
4.5. Network update based on CQI threshold
While the "optimized tree" approach that substitutes links as soon as others with a better CQI are found, the "less cost" approach, on the other side, keeps links as long as CQI value is positive. New approach based on a CQI threshold can be used to minimize the number of network update as described in Algorithm 2. If a neighbor on the same Gc group offers better CQI, we should check if this CQI is at least higher than a certain CQI threshold before executing the handover and generating a new network topology update. The CQI threshold-based approach could certainly reduce the number of substitution operations and therefore network updates. However, simulations must be carried out to assess the impact of such an approach on the average CQI.
| Algorithm 2. Nework update according to CQI threshold. |
| For each Gc group of UEi do if CQI_Value(New_neighbor) - CQI_Value(Old_neighbor) <= CQI_threshold then keep Connection with Old_neighbor else Connect with New_neighbor Disconnect from Old_neighbor Report the modification to the ProSe Application Server number_of_updates ++ end end |
5. Simulation results
5.1. Effects of Density and Group connectivity
In public safety situations, the aim is to guarantee reachability between participating users during the rescue mission. Group connectivity is defined as the capacity of all group users to continue to be inter-connected and reachable by other members of the same group. Otherwise, the consistency of group connectivity is not usually guaranteed, especially when a limited number of users are dispersed in large areas having different rescue missions and should move in opposite directions. We define three levels of group connectivity: level_1 when all users participating in the mission are reachable by forming a single group, level_2 when 2 groups of users are formed, and level_3 when 3 groups or more are formed. Figure 14 depicts the progression of the three levels of connectivity according to number of UEs using simulation parameters presented in Table 1. For each selected value of UEs from 5 to 70 placed on a square area of 500 m² with a random speed that varies from 1 to 4m/s, we calculate the average value of 10 simulations of 7200 seconds (2 hours).
During these simulations, a verification is processed every second to count the time duration corresponding to every formed group's connectivity type. For better presentation, we express the resulted time as a percentage of the total simulation time duration. From Figure 14, it is possible to conclude that with less than 20 UEs (80 UEs/km²), the probability of having a single group (or even two) is very low. From 50 UEs (200 UEs/km²), the probability of having level_3 become very minimal. As soon as 70 users (280 users/km²) are reached, the uniqueness (level_1) of the group is confirmed and the decomposition of this group occurs for less than 2% of the total time, i.e., up to 2 to 3 minutes every 2 hours.
5.2. “Less cost” vs. “optimized tree” approaches
Using the simulation values presented in Table 1, the two approaches “Less cost” and “optimized tree” are implemented as explained in section 0. While the “less cost” approach focuses on keeping minimum change on the network structure, the “optimized tree” approach allows each node to check in its neighbors for better CQI. Simulations are conducted to estimate how costly keeping an optimized topology could be in terms of links substitutions. Figure 15 illustrates the gap between the two approaches that become more considerable once the number of users reach 20. From 30 users, the gap begins to stabilize around 2 to 3 points on the CQI scale. The CQI value represent to average value of all established direct communication links of the network. On the same graph, a total incremental number of updates (divided by 2000 for better visibility) as well as periodic number of updates per second have been added. We notice that their value increases exponentially while the number of added users is in linear progression. With 70 UEs, it takes up to 25 operations per second to keep the network optimized. During 2 hours of simulation, more than 32,000 substitution operations were performed.
5.3. Effect of CQI threshold based approaches on network updates and average CQI of the groupe
To reduce the number of network updates generated by the “optimized tree” approach, we introduce a CQI threshold that should be verified before performing the update. Figure 16 show the progression of the generated updates using different CQI threshold values. Compared to the “Optimized tree” Approach (CQI = 0). We can notice a gain of almost 30% of network updates when the CQI threshold is egal to 1. This gain continues to progress less significantly with increasing CQI threshold values.
A set of simulations are carried out to verify the effect that the variation of the CQI threshold can have on the average CQI of the network. Several CQI thresholds were used during the simulations ranging from 0 (for the optimized approach) up to 10. For a better visual comparison, Figure 17 include the CQI average chart for each CQI threshold value while lines chart of the two reference approaches i.e., “optimized tree” and “less cost” are kept for better comparison.
We notice that the resulted average CQI, while CQI threshold vary from 1 to 10, represents a loss compared to the "optimized tree" approach but also a gain compared to the "less cost" approach. For each number of users grouped into a set of 10, we calculate the gain generated by the average CQI according to simulated CQI threshold values. As a reference, the gain of 100% is obtained with the "optimized tree" method. Figure 18 shows excellent results when the CQI threshold is equal to 1 with 95% of gain. When the CQI is equal to 2, the gain becomes slightly less stable depending on the number of users and varies from 88% for 60/69 UEs and up to 82% for 10/19 UEs. In these simulations, results when number of users is less than 10 are not represented since the resulted average CQI is extremely unstable.
5.4. Effect of increasing optimization intervals on network updates and average CQI of the groupe
With the aim of reducing the number of network updates, a set of simulations is achieved by increasing the optimizations interval while CQI-threshold is fixed to 0. Instead of performing the optimization every second, different values of the optimization interval (2, 4, 6, 8, 10 and 20 seconds) were simulated. Compared to the “optimized tree” where optimization is carried out every second, we note that using an interval of 2 seconds can reduce the number of network updates by almost 10% when the number of UEs is equal to 70. We also note that, with the variation of the optimization interval, the gap between network updates becomes significant from 40 UEs. Moreover, as the number of UEs increases, the reduction in network updates becomes more important.
By using the same values of the optimization interval, a set of simulations was carried out to verify the effect on the average CQI of the network. From Figure 20, different graphs corresponding to each selected optimization interval value are represented. We notice that the shape of the graphs lines in the upper part are almost close to those of the "optimized network" approach. However, the difference widens in the lower values of the graphs, and we notice that the values of the average CQI drop once optimization interval increases.
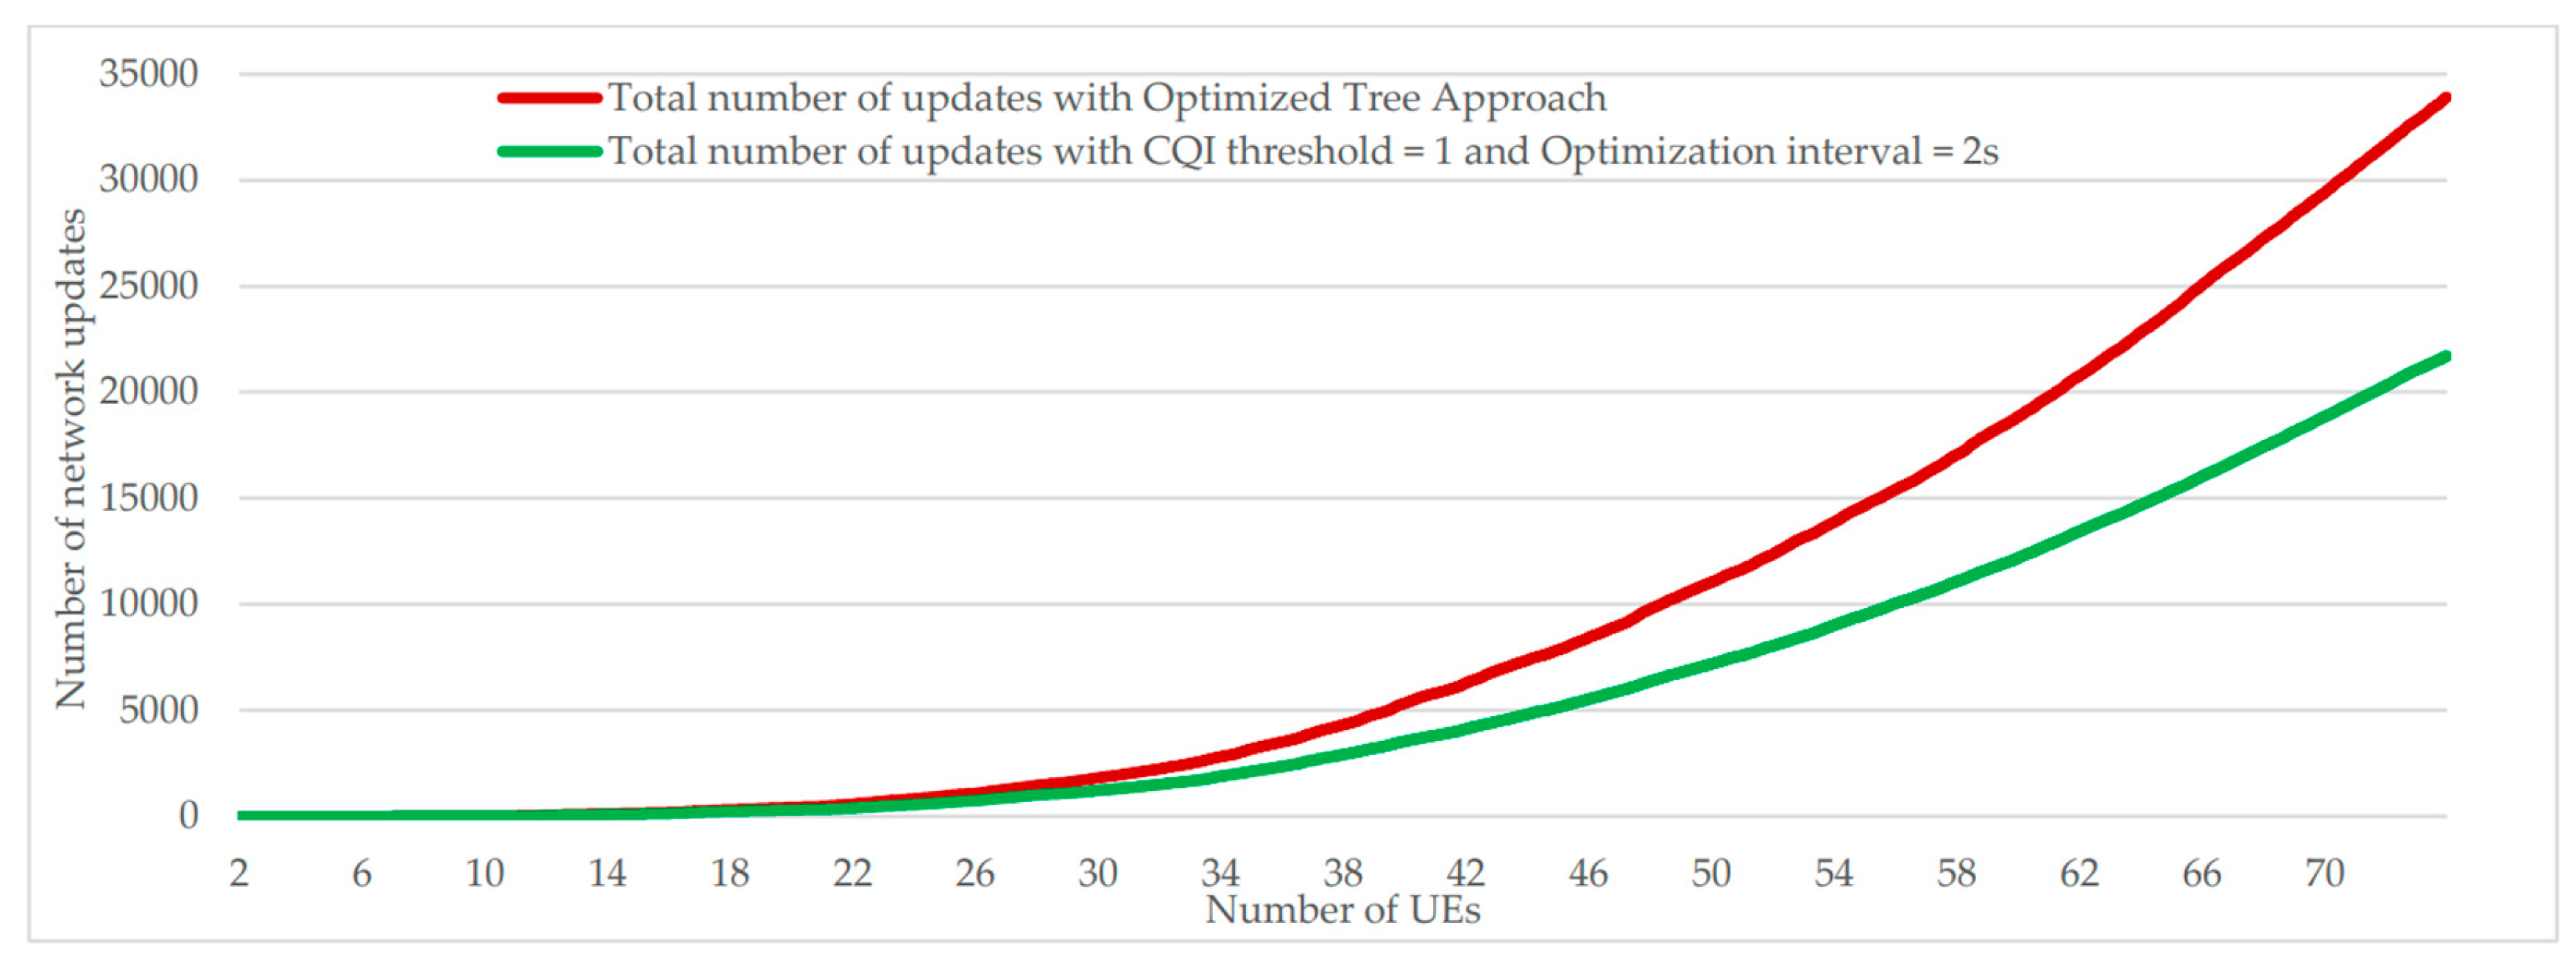
5.6. Effect of the combination of the CQI threshold and the optimization interval compared to the "optimized tree" approach
During the series of simulations previously presented, it was possible to note that the use of a threshold of CQI egal to 1 or an optimization interval of 2 seconds made it possible to reduce the number of network updates without significantly affect the CQI average. New simulations were therefore carried out by a new approach that combines the two following parameters: CQI threshold = 1 and optimization interval = 2 seconds. From results presented in Figure 21 and Figure 22, we can notice a considerable drop in the number of updates while the average CQI has been slightly degraded.
6. Conclusion
D2D is a promising technology that opens the doors for different use cases mainly during emergency situations where direct communication is enabled by telecom operators. Through the simulations, it was possible to define the required UE density level that guarantees global connectivity for all participating users. Both of “optimized tree” and “less cost” approaches were evaluated in terms of the number of network updates and the level of the average CQI. It was concluded that the use of a CQI threshold equal to 1 combined with an optimization interval equal to 2 seconds can considerably reduce the number of optimizations updates while average CQI is kept close to the maximum values.
References
- R. Zahínos, H. Abaunza, J. I. Murillo, M. A. Trujillo, and A. Viguria, ‘Cooperative Multi-UAV System for Surveillance and Search&Rescue Operations Over a Mobile 5G Node’, in 2022 International Conference on Unmanned Aircraft Systems (ICUAS), 2022, pp. 1016–1024. [CrossRef]
- Z. Liu, H. Chen, Y. Wen, C. Xiao, Y. Chen, and Z. Sui, ‘Mode Design and Experiment of Unmanned Aerial Vehicle Search and Rescue in Inland Waters’, in 2021 6th International Conference on Transportation Information and Safety (ICTIS), 2021, pp. 917–922. [CrossRef]
- Y. Naidoo, R. Stopforth, and G. Bright, ‘Development of an UAV for search & rescue applications’, in IEEE Africon ’11, 2011, pp. 1–6. [CrossRef]
- P. P. Ray, M. Mukherjee, and L. Shu, ‘Internet of Things for Disaster Management: State-of-the-Art and Prospects’, IEEE Access, vol. 5, pp. 18818–18835, Sep. 2017. [CrossRef]
- A. Alnoman and A. Anpalagan, ‘On D2D communications for public safety applications’, in 2017 IEEE Canada International Humanitarian Technology Conference (IHTC), 2017, pp. 124–127. [CrossRef]
- S. I. Sou, M. R. Li, S. H. Wang, and M. H. Tsai, ‘File distribution via proximity group communications in LTE-advanced public safety networks’, Computer Networks, vol. 149, pp. 93–101, Feb. 2019. [CrossRef]
- L. Babun, A. İ. Yürekli, and İ. Güvenç, ‘Multi-hop and D2D communications for extending coverage in public safety scenarios’, in 2015 IEEE 40th Local Computer Networks Conference Workshops (LCN Workshops), 2015, pp. 912–919. [CrossRef]
- 3GPP Technical Specification Group Radio Access Network, ‘Evolved Universal Terrestrial Radio Access (E-UTRA), Radio Resource Control (RRC), Protocol specification , TS 36.331 (Release 17)’. 2023.
- 3GPP Technical specification group services and system aspects, ‘Proximity-based services (prose); stage 2, TS 23.303 (release 17)’, 2023.
- 3GPP Technical Specification Group Core Network and Terminals, ‘Proximity-services (ProSe) in 5G System (5GS) protocol aspects, TS 24.554 (Release 18)’. 2023.
- L. Lai, D. Feng, F.-C. Zheng, X. Wang, H. H. Yang, and T. Q. S. Quek, ‘CQI-Based Interference Detection and Resource Allocation With QoS Provision in LTE-U Systems’, IEEE Trans Veh Technol, vol. 70, no. 2, pp. 1421–1433, 2021. [CrossRef]
- W. Elleuch, ‘D2D Simulator for loosely coupled network)’. ULCO, Nov. 2023. Accessed: Nov. 16, 2023. [Online]. Available: https://github.com/wajdielleuch/D2D_SIM.
- R. Synave, A. Desitter, N. Dubrunfaut, M. Langa, and G. Langa, ‘MG2D (2D graphics engine)’. ULCO, Calais, Jan. 13, 2020.
- C. Kumar, ‘Evaluation of MANET Performance in Presence of Obstacles’, International Journal of Ad hoc, Sensor & Ubiquitous Computing, vol. 3, no. 3, pp. 37–46, Jun. 2012. [CrossRef]
- X. Lin, J. G. Andrews, A. Ghosh, and R. Ratasuk, ‘An overview of 3GPP device-to-device proximity services’, IEEE Communications Magazine, vol. 52, no. 4, pp. 40–48, 2014. [CrossRef]
- D.-W. Lim, C.-J. Chun, and J.-M. Kang, ‘Transmit Power Adaptation for D2D Communications Underlaying SWIPT-Based IoT Cellular Networks’, IEEE Internet Things J, vol. 10, no. 2, pp. 987–1000, 2023. [CrossRef]
Figure 1.
Overview of some solutions for extending cellular coverage.
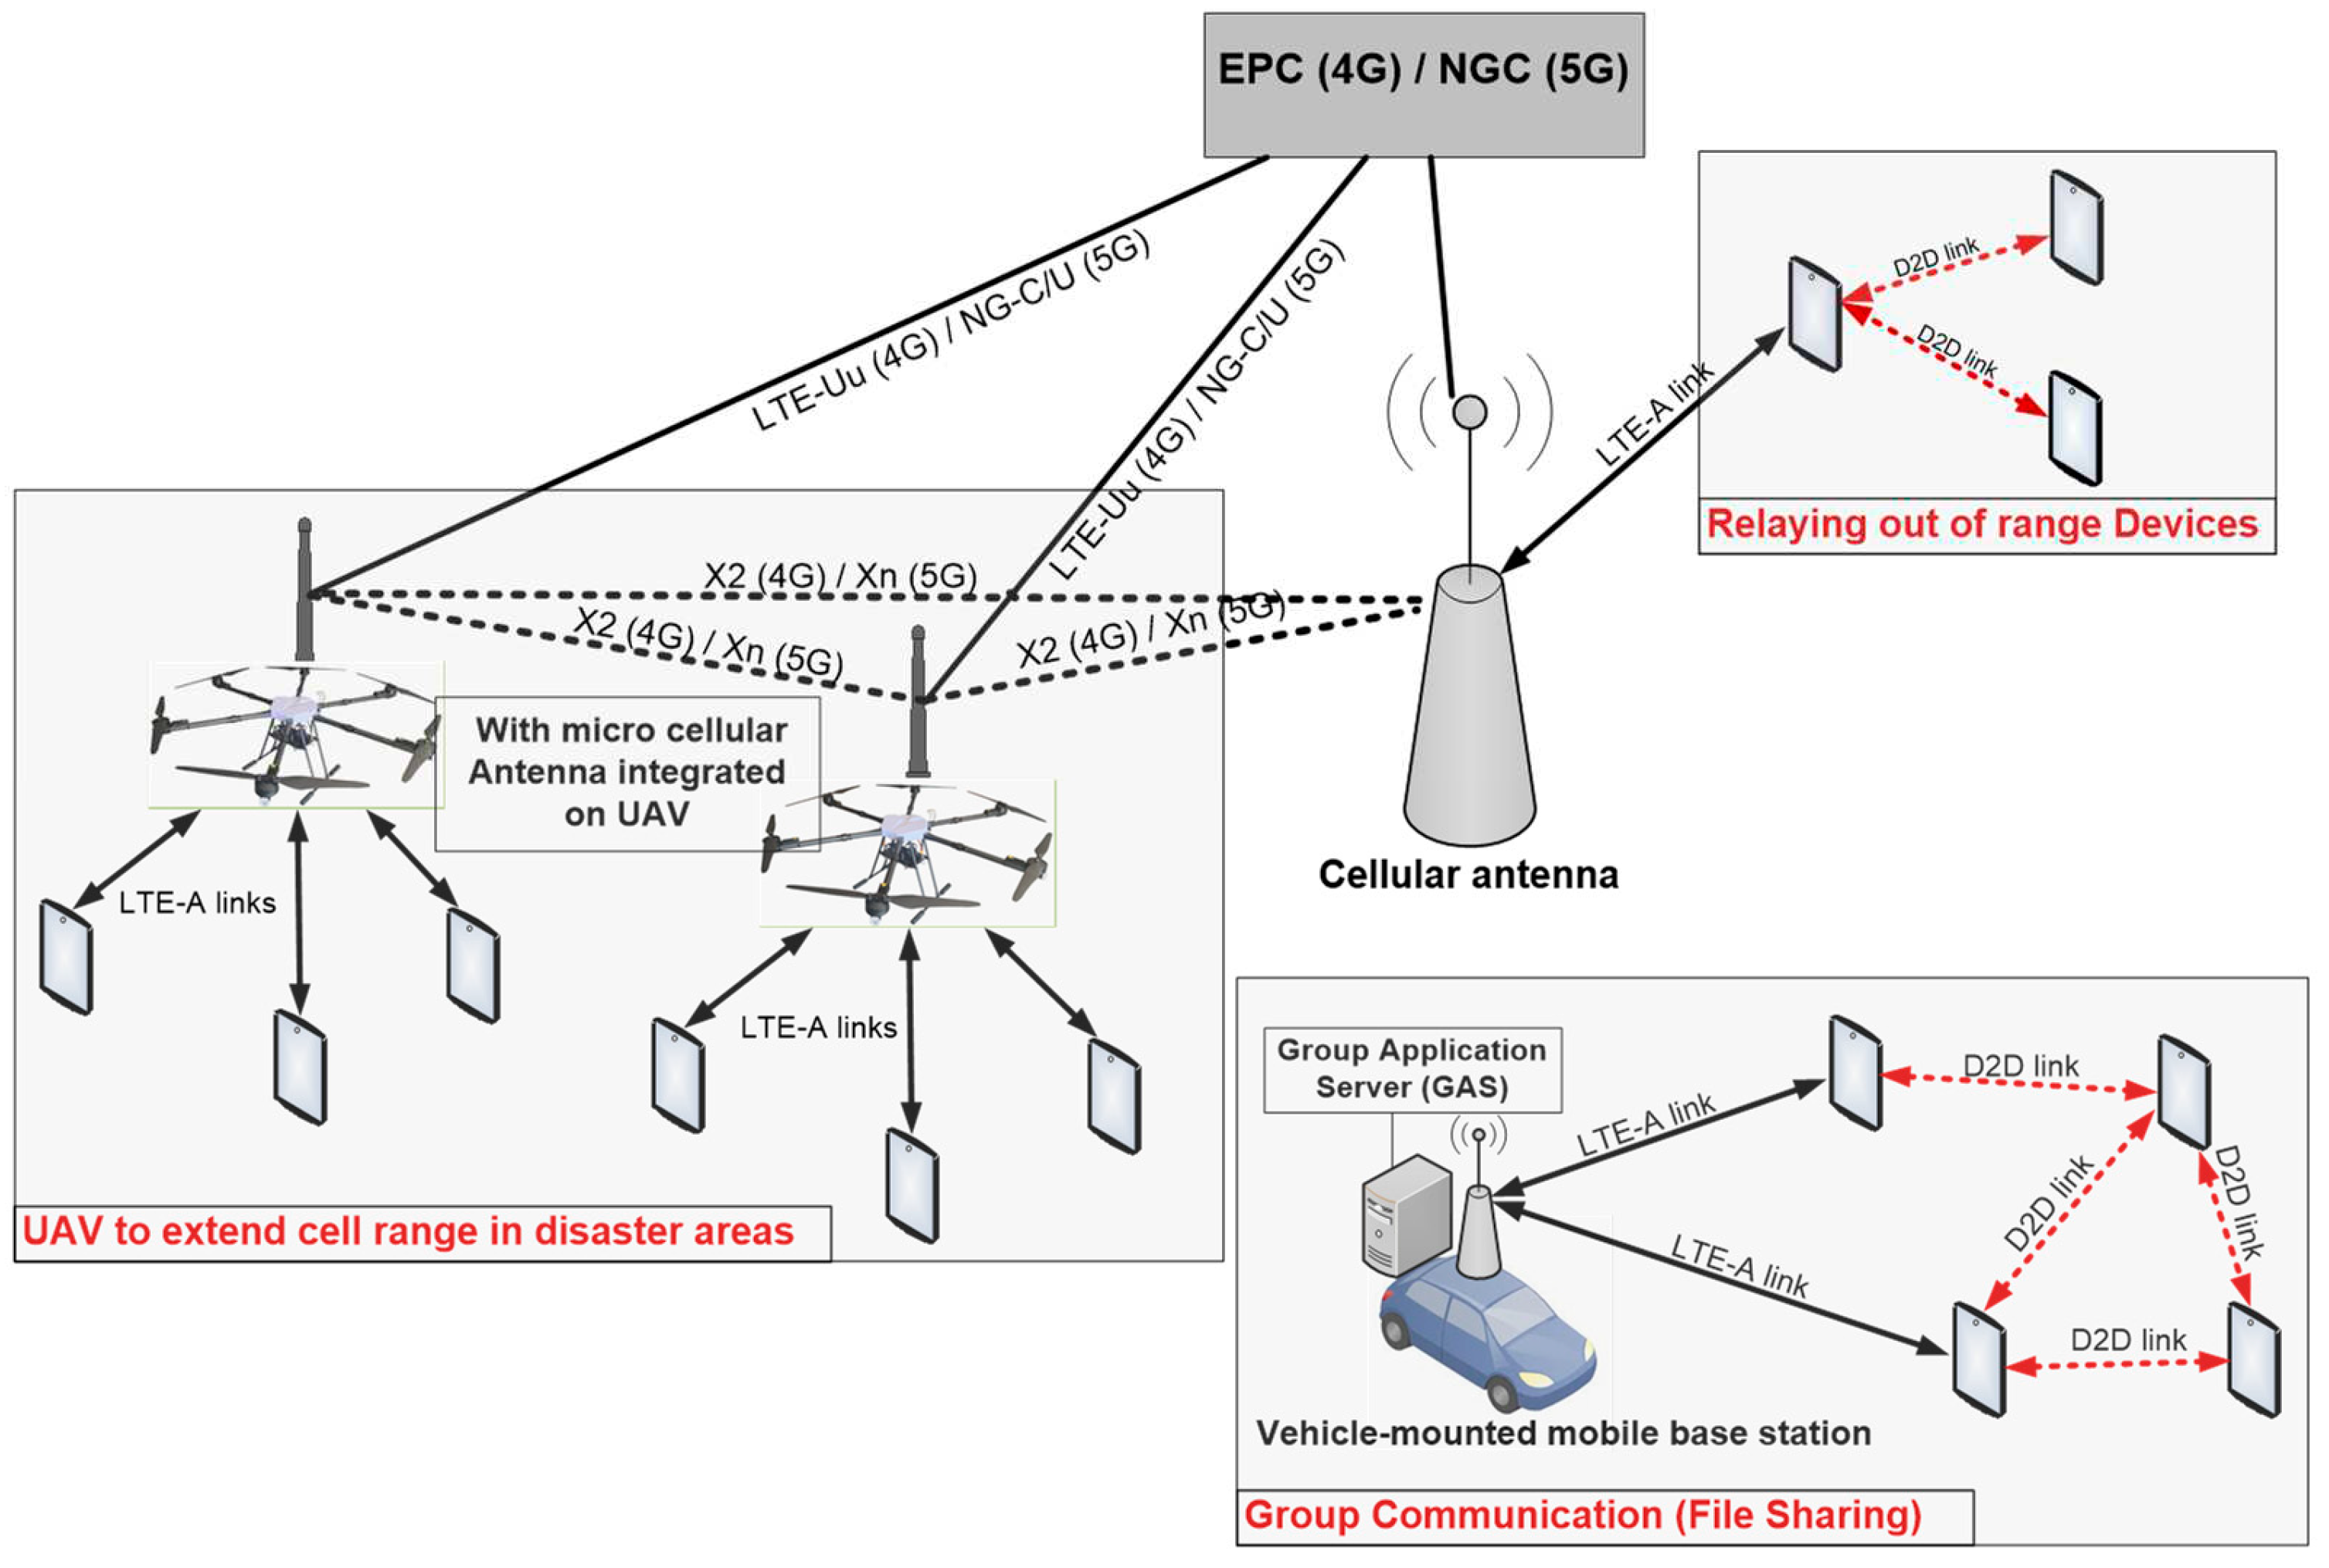
Figure 2.
Non-Roaming reference ProSe architecture for 4G/5G networks.
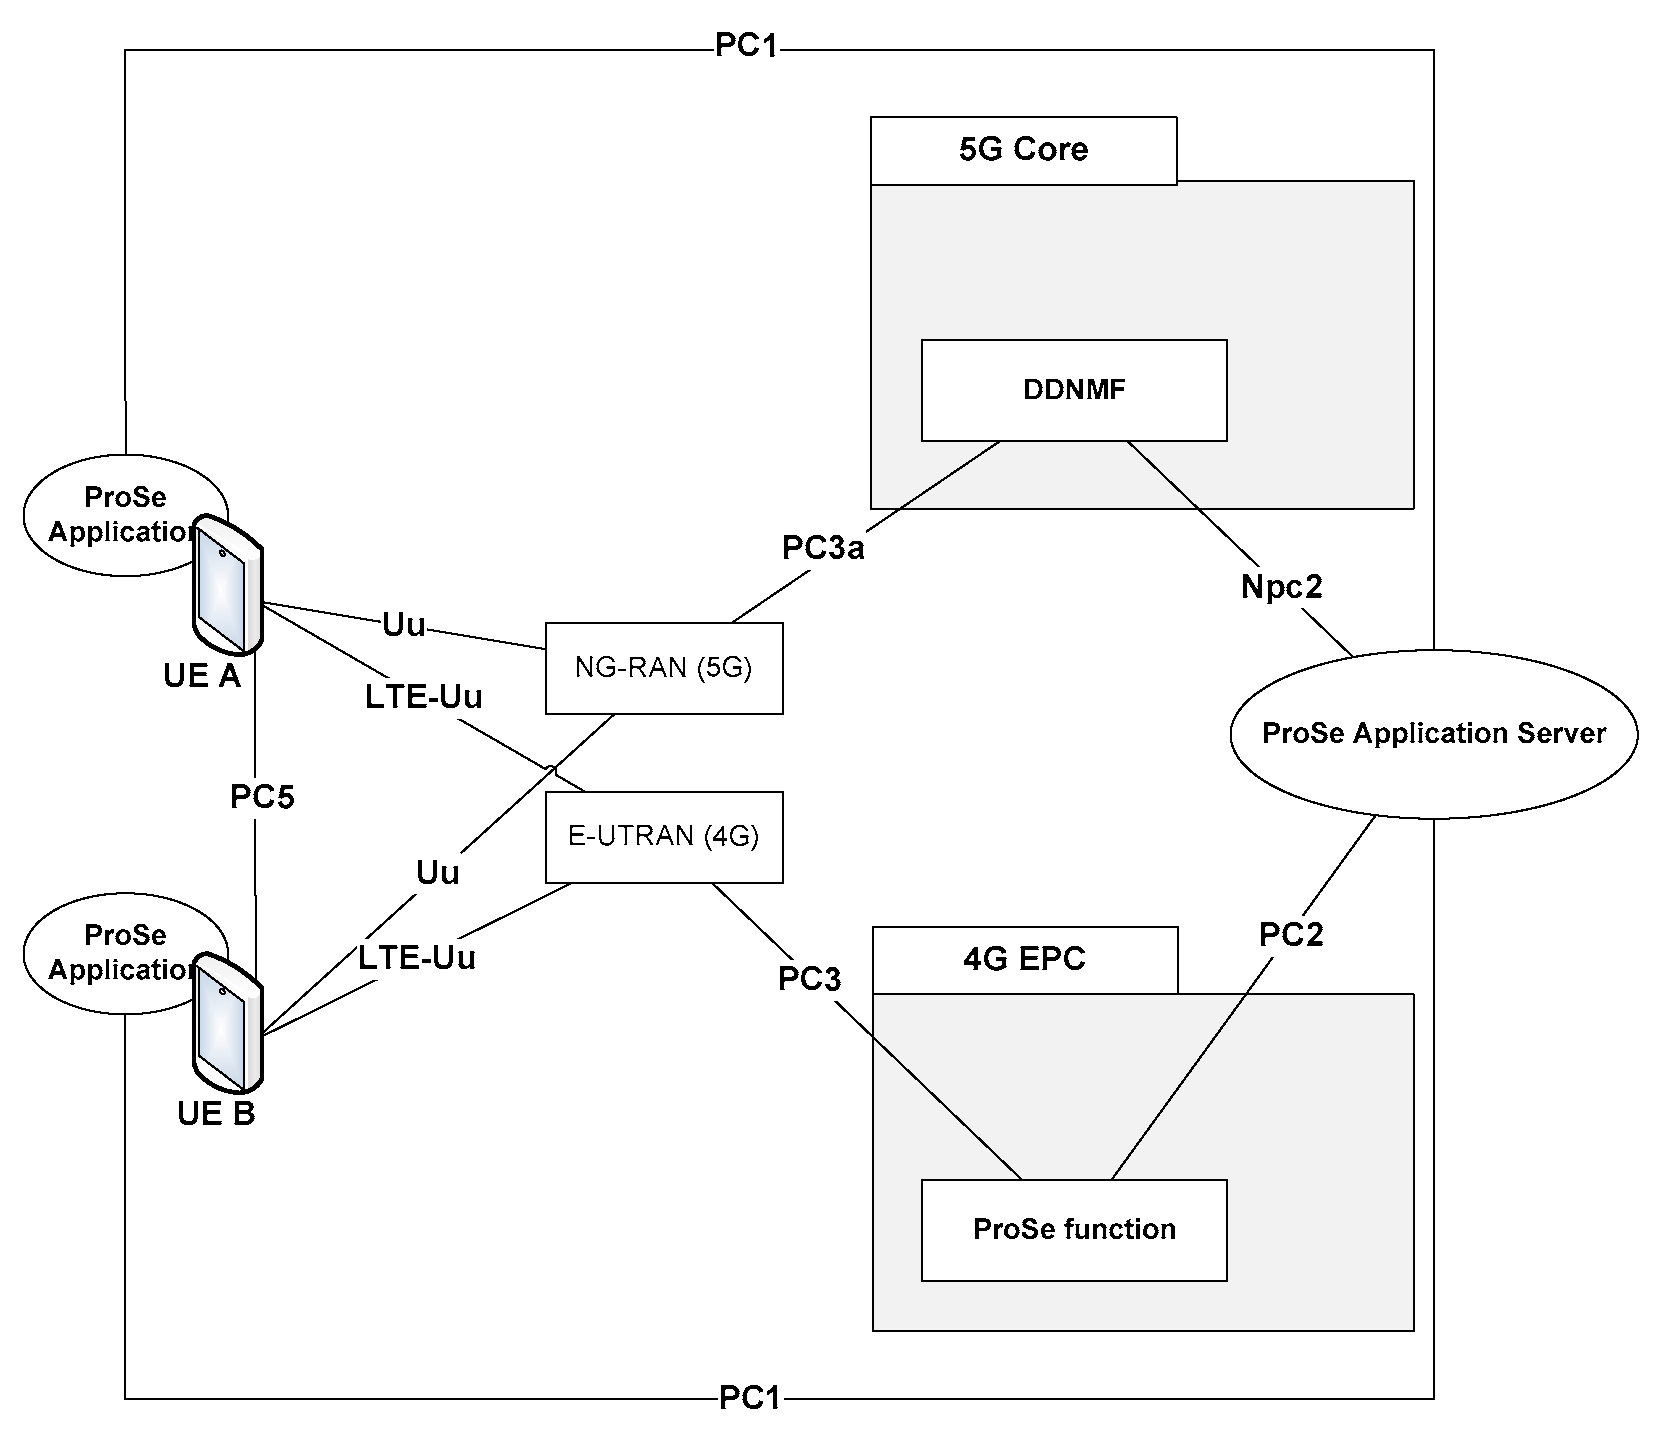
Figure 3.
D2D communication scenarios.
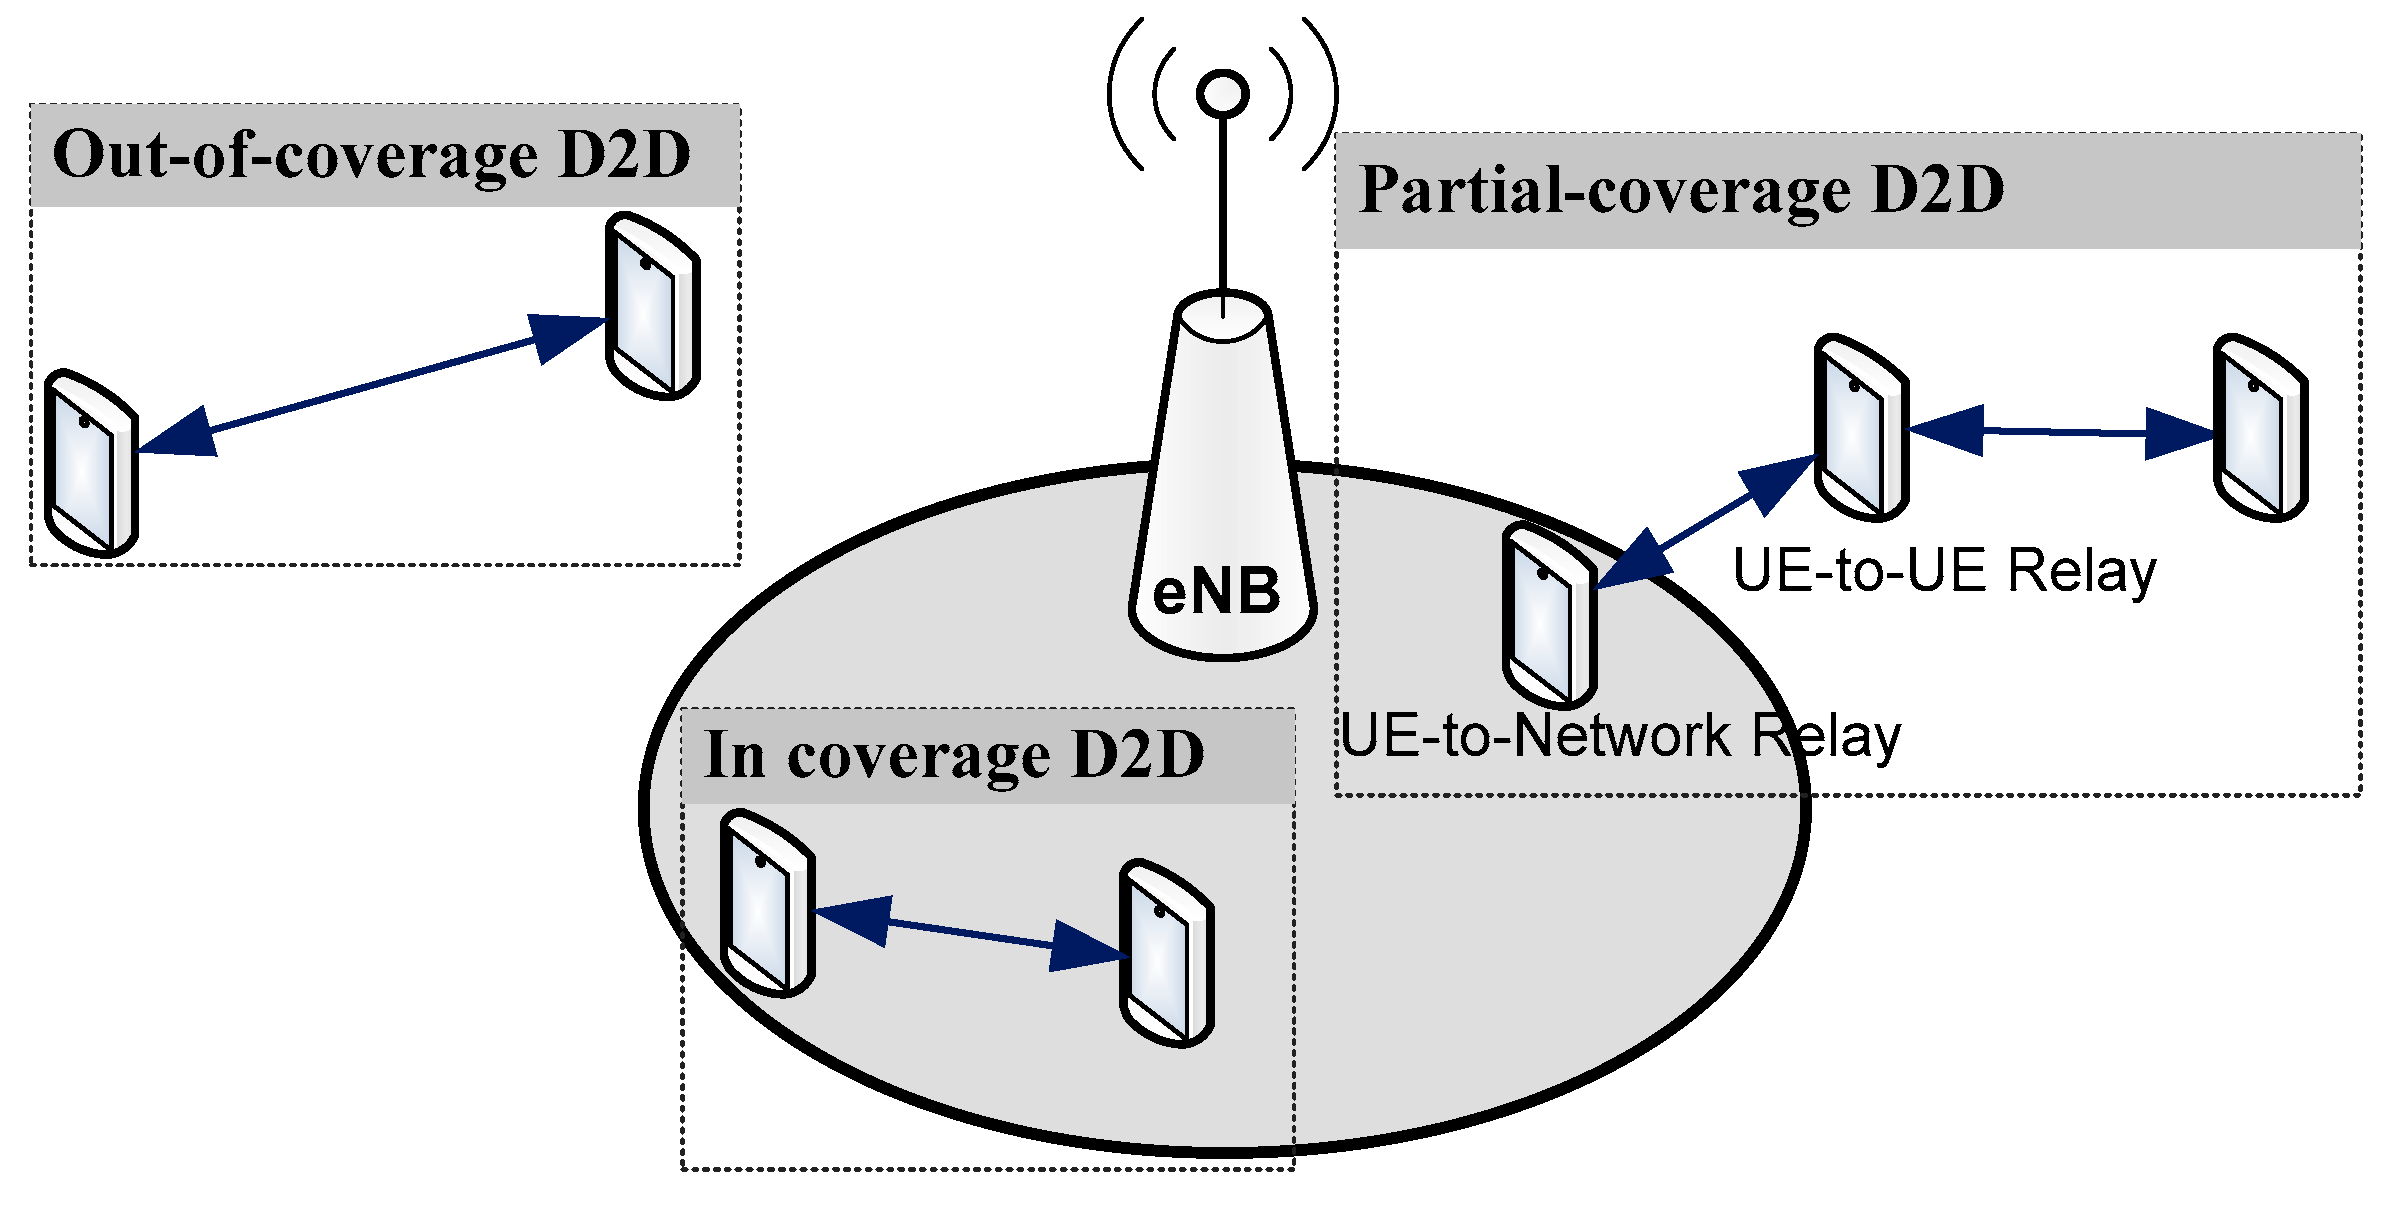
Figure 4.
ProSe functions overview.
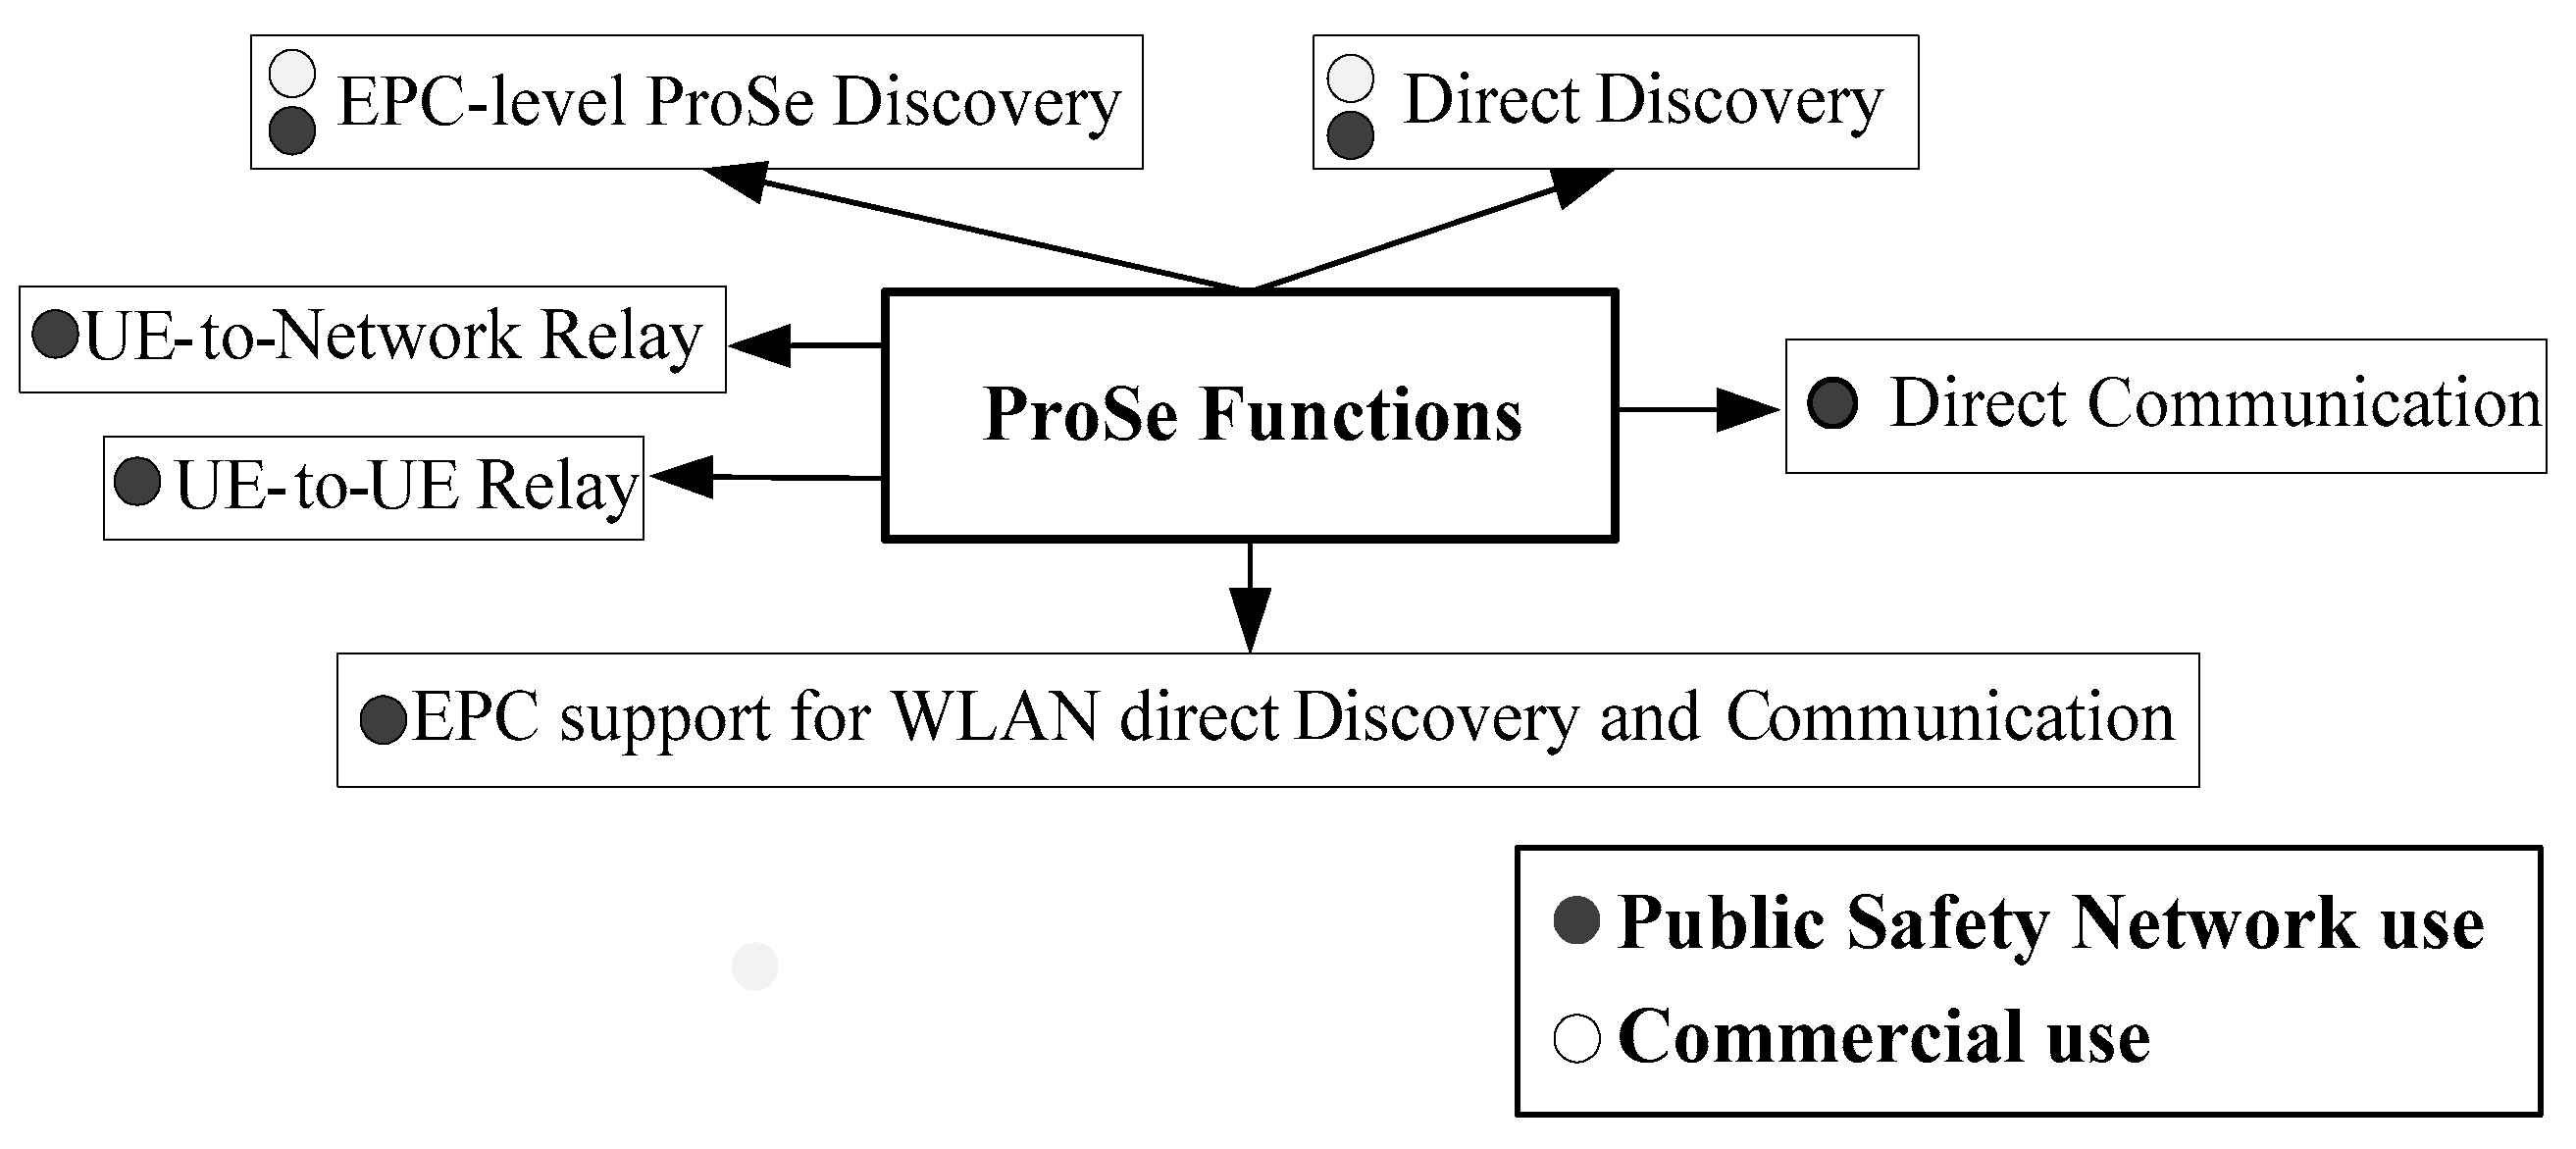
Figure 5.
Infrastructure vs. D2D based communication in cellular networks. (a) Underlay network in cellular network. (b) Underlay network in D2D.
Figure 5.
Infrastructure vs. D2D based communication in cellular networks. (a) Underlay network in cellular network. (b) Underlay network in D2D.

Figure 6.
Overview of some D2D underlay network topologies Models: (a) Loosely Coupled, (b) Fully Coupled, and (c) Tightly Coupled.
Figure 6.
Overview of some D2D underlay network topologies Models: (a) Loosely Coupled, (b) Fully Coupled, and (c) Tightly Coupled.
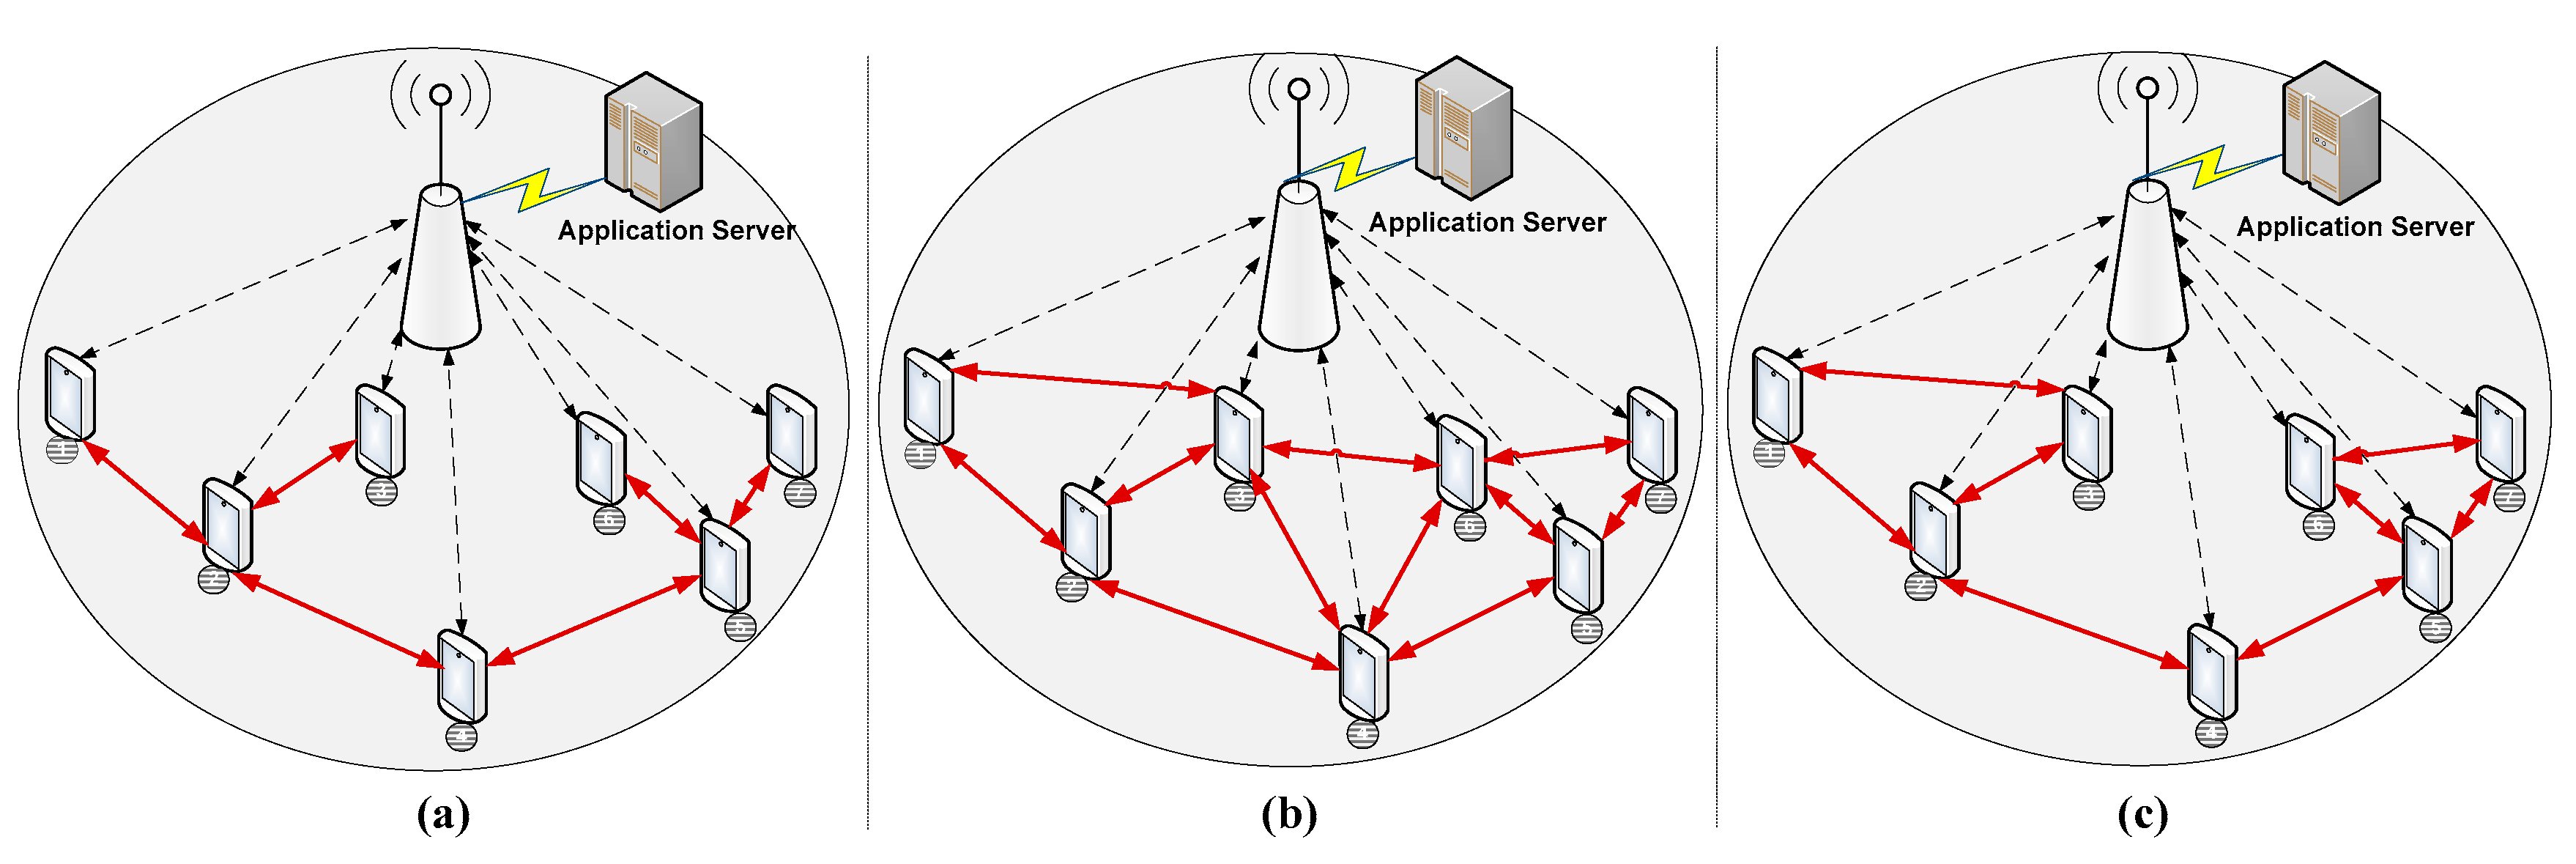
Figure 7.
Create Gnc and Gc groups for users in-coverage of Selected User.

Figure 8.
Creating link with Gnc and Gc groups members.
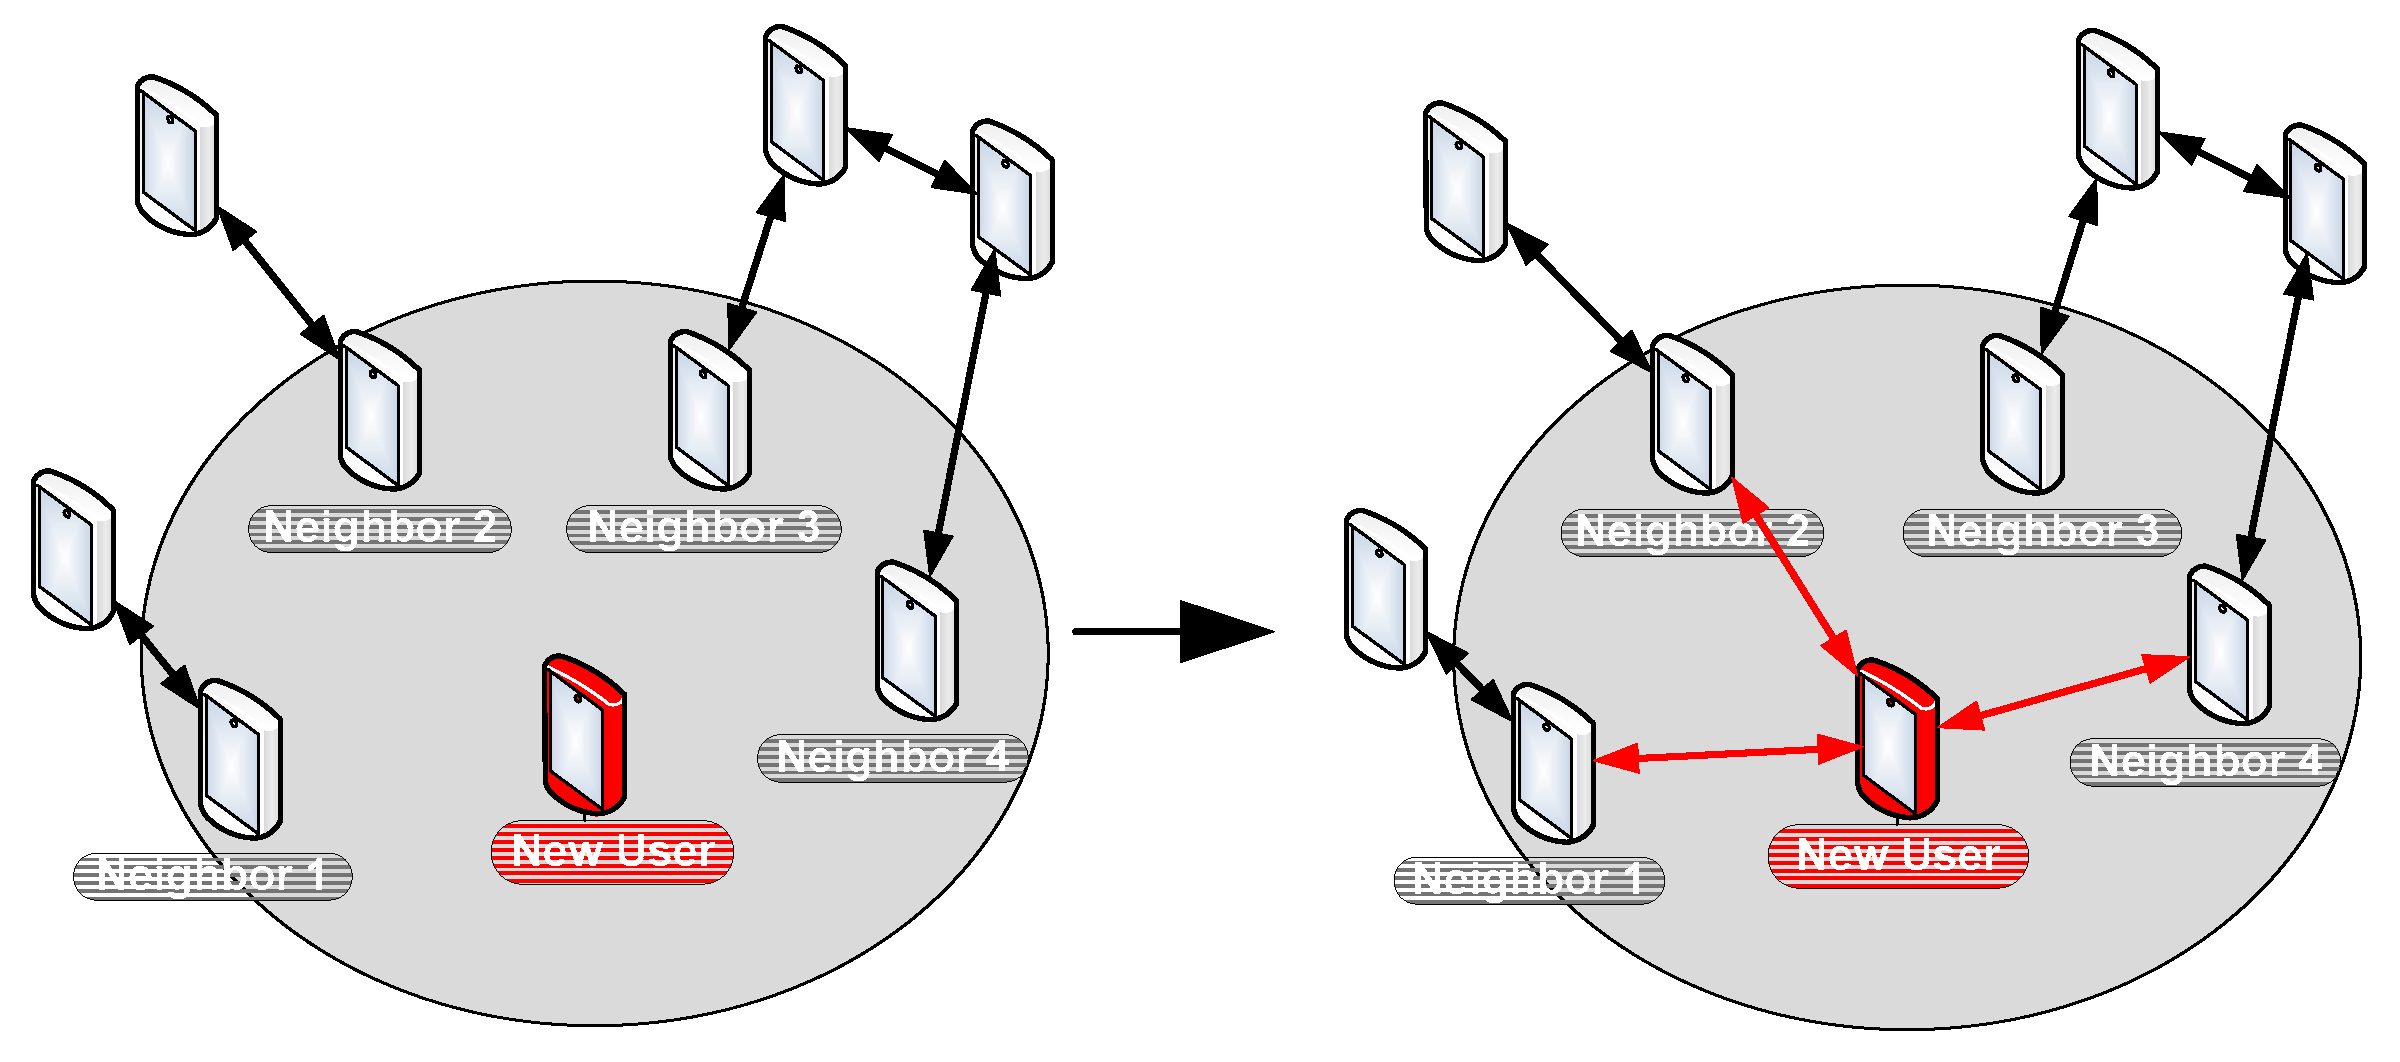
Figure 9.
Flowchart of adding new user in loosely coupled approach.#
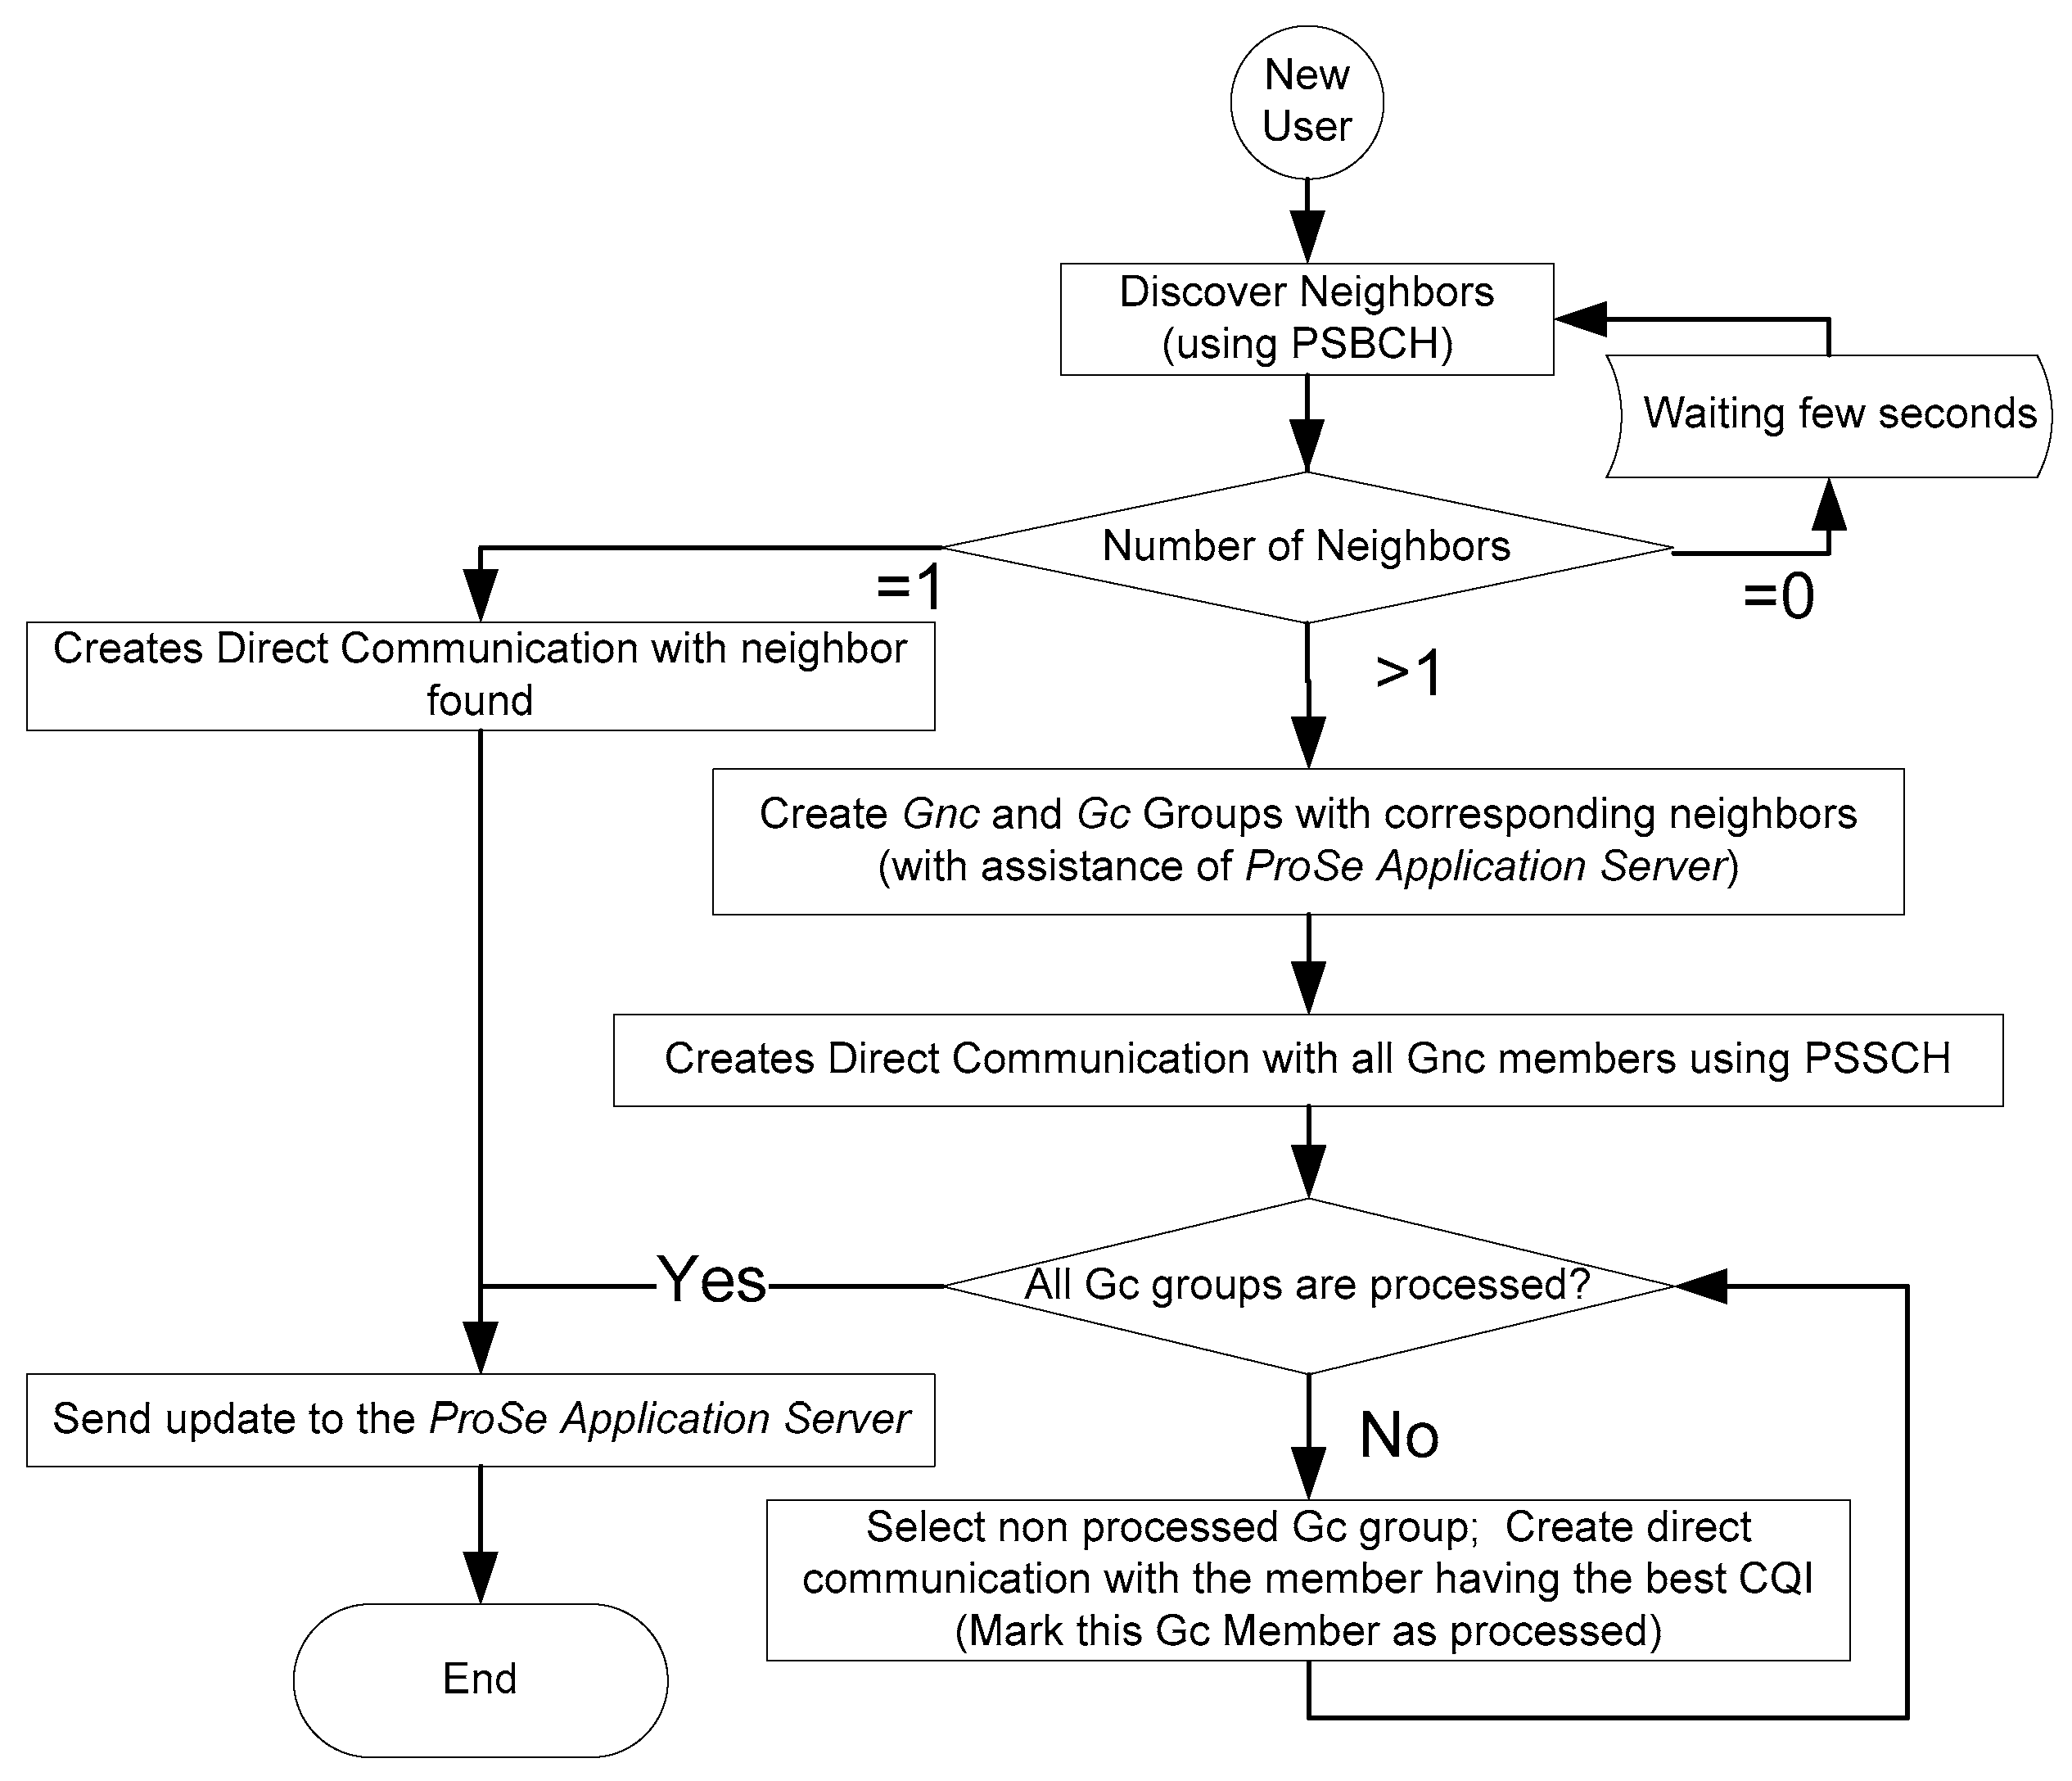
Figure 10.
Flowchart of network update procedure.
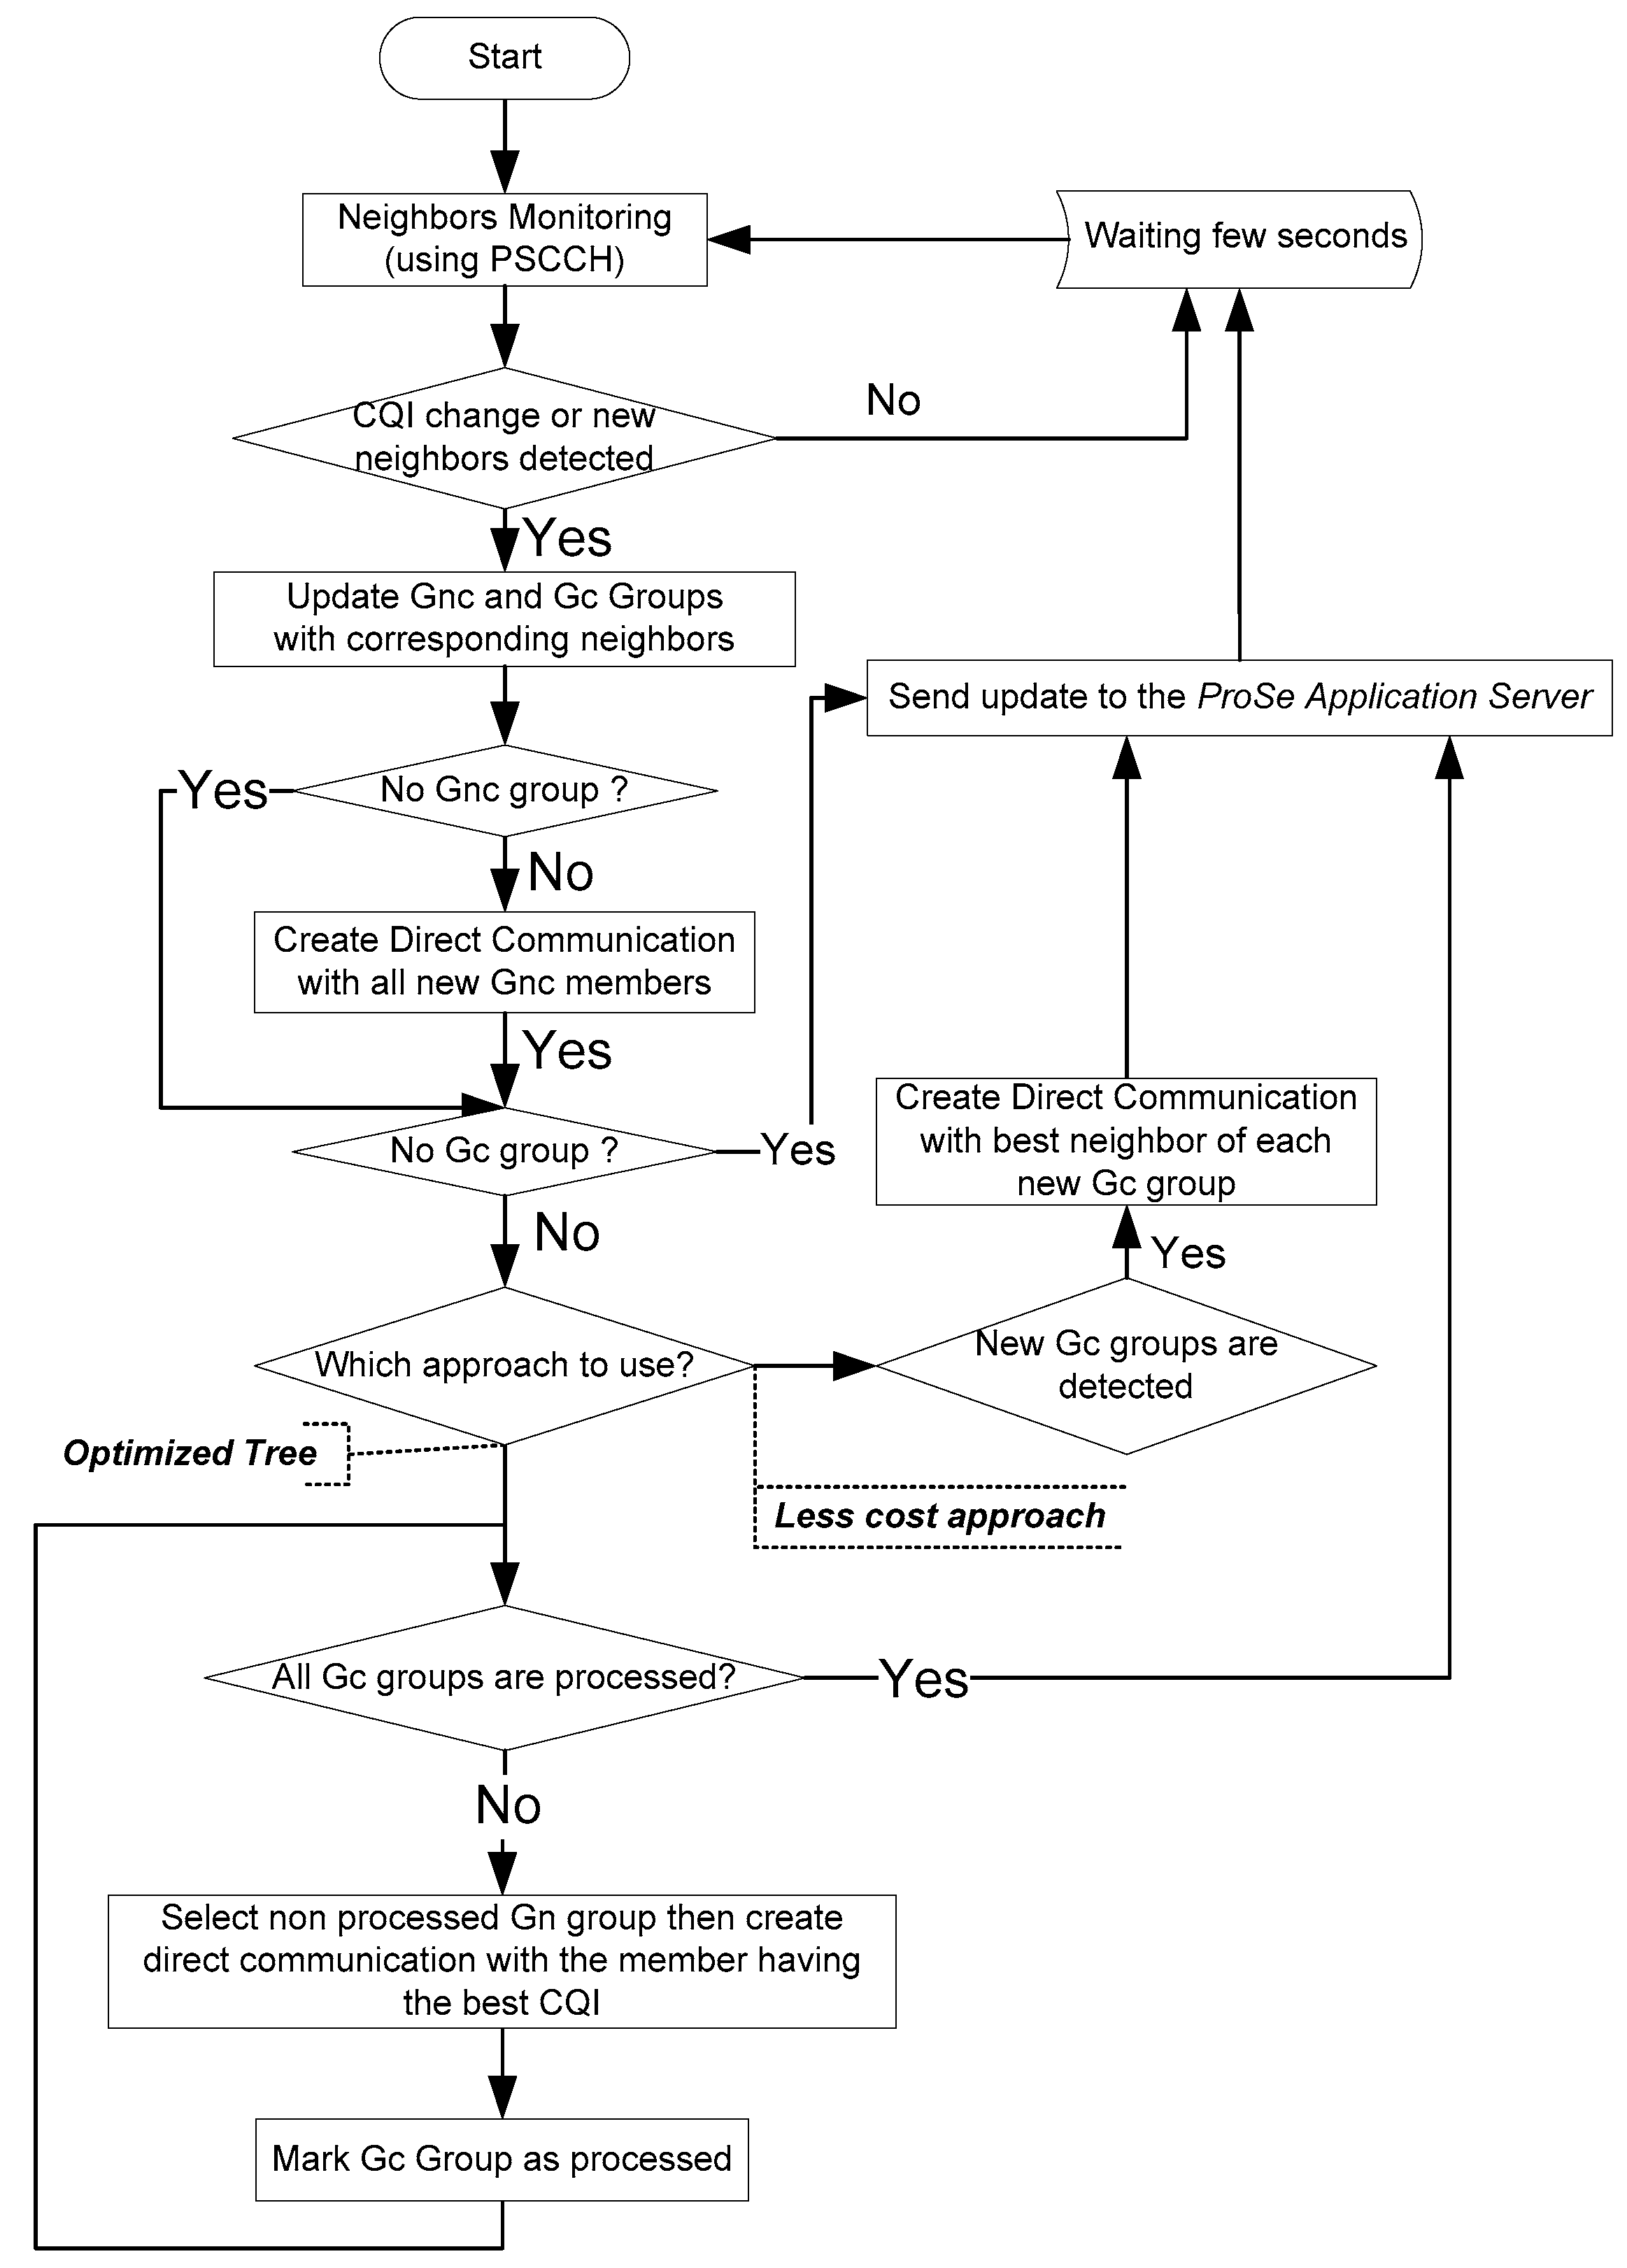
Figure 13.
UE movement in Random Direction Mobility Model.
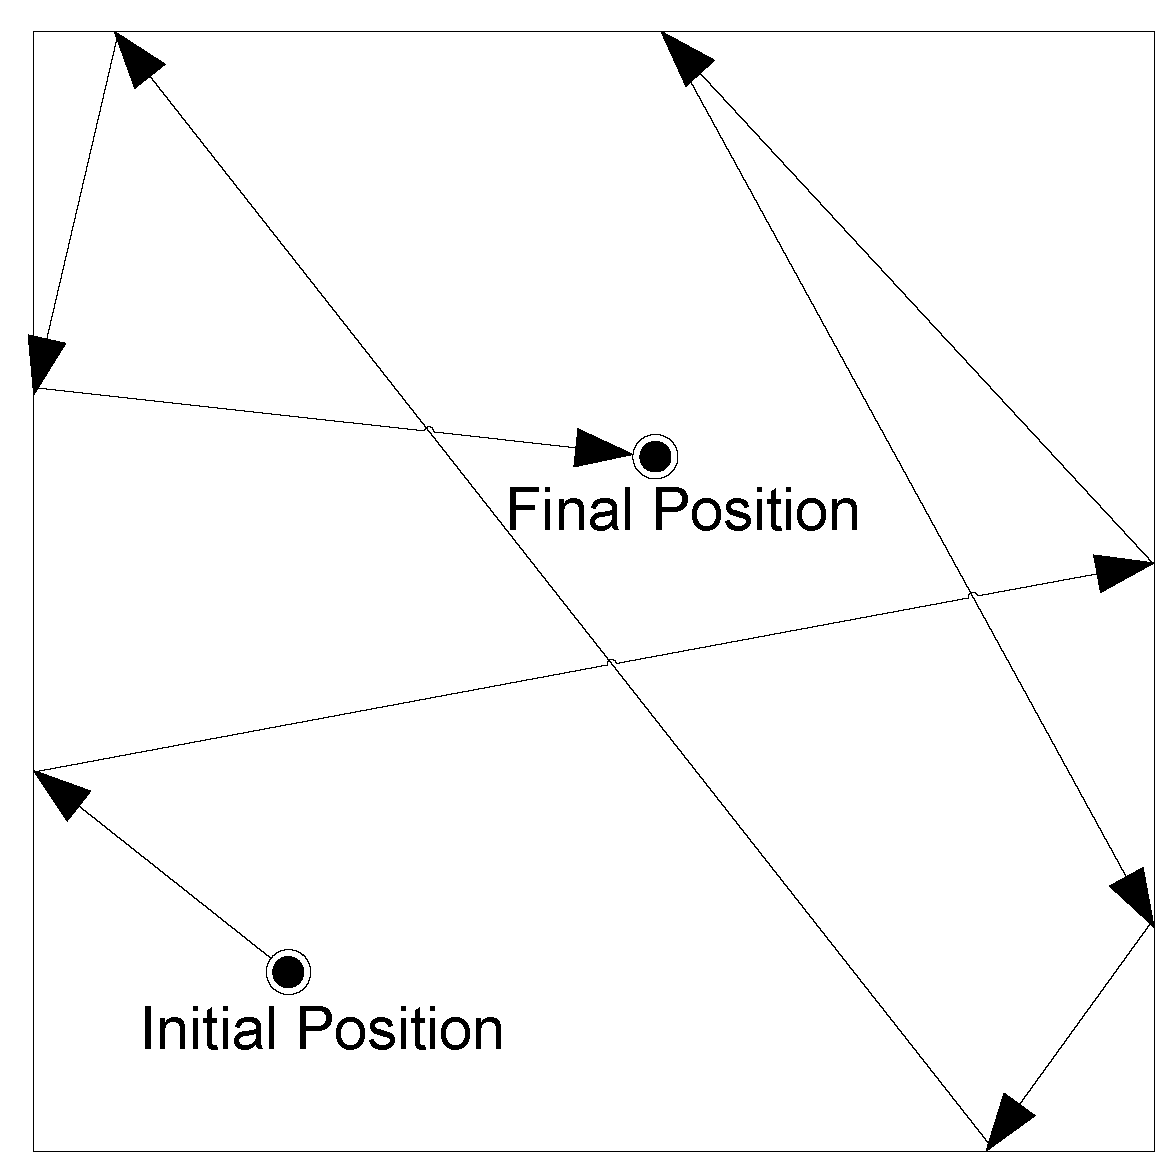
Figure 14.
Progression of the three Group connectivity levels according to the number of UEs and the corresponding time duration in percentage.
Figure 14.
Progression of the three Group connectivity levels according to the number of UEs and the corresponding time duration in percentage.
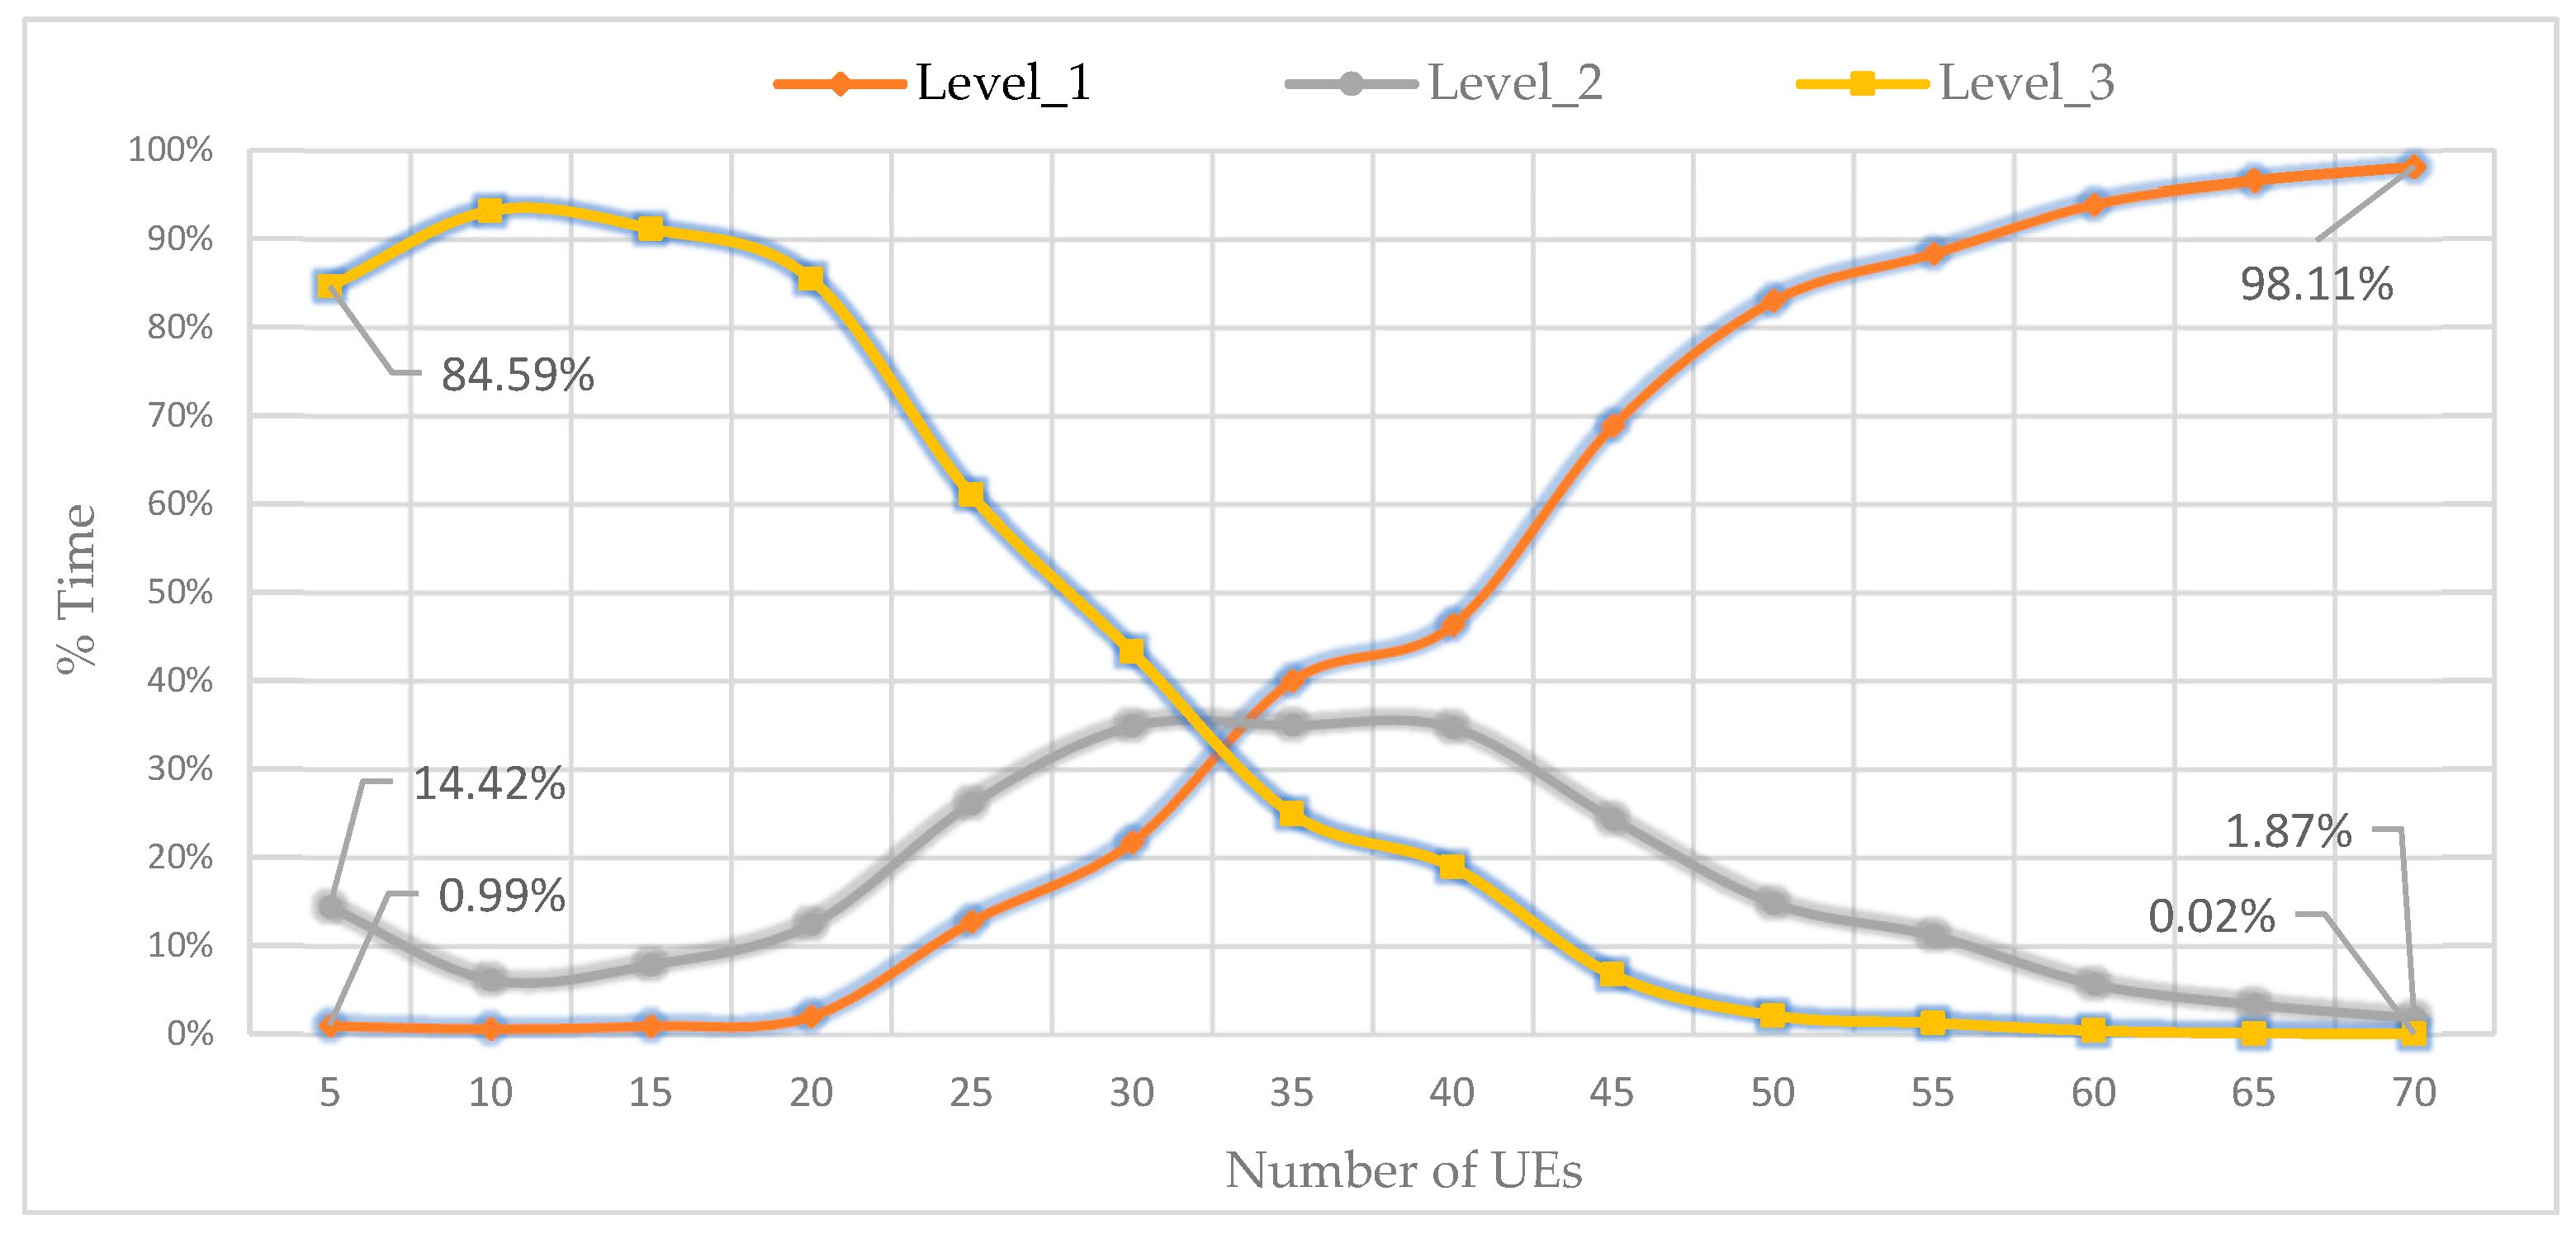
Figure 15.
Comparison of “less cost” vs. “optimized tree” approaches in terms of average CQI with the progression of both number of updates per second and total number of updates while number of user increase.
Figure 15.
Comparison of “less cost” vs. “optimized tree” approaches in terms of average CQI with the progression of both number of updates per second and total number of updates while number of user increase.
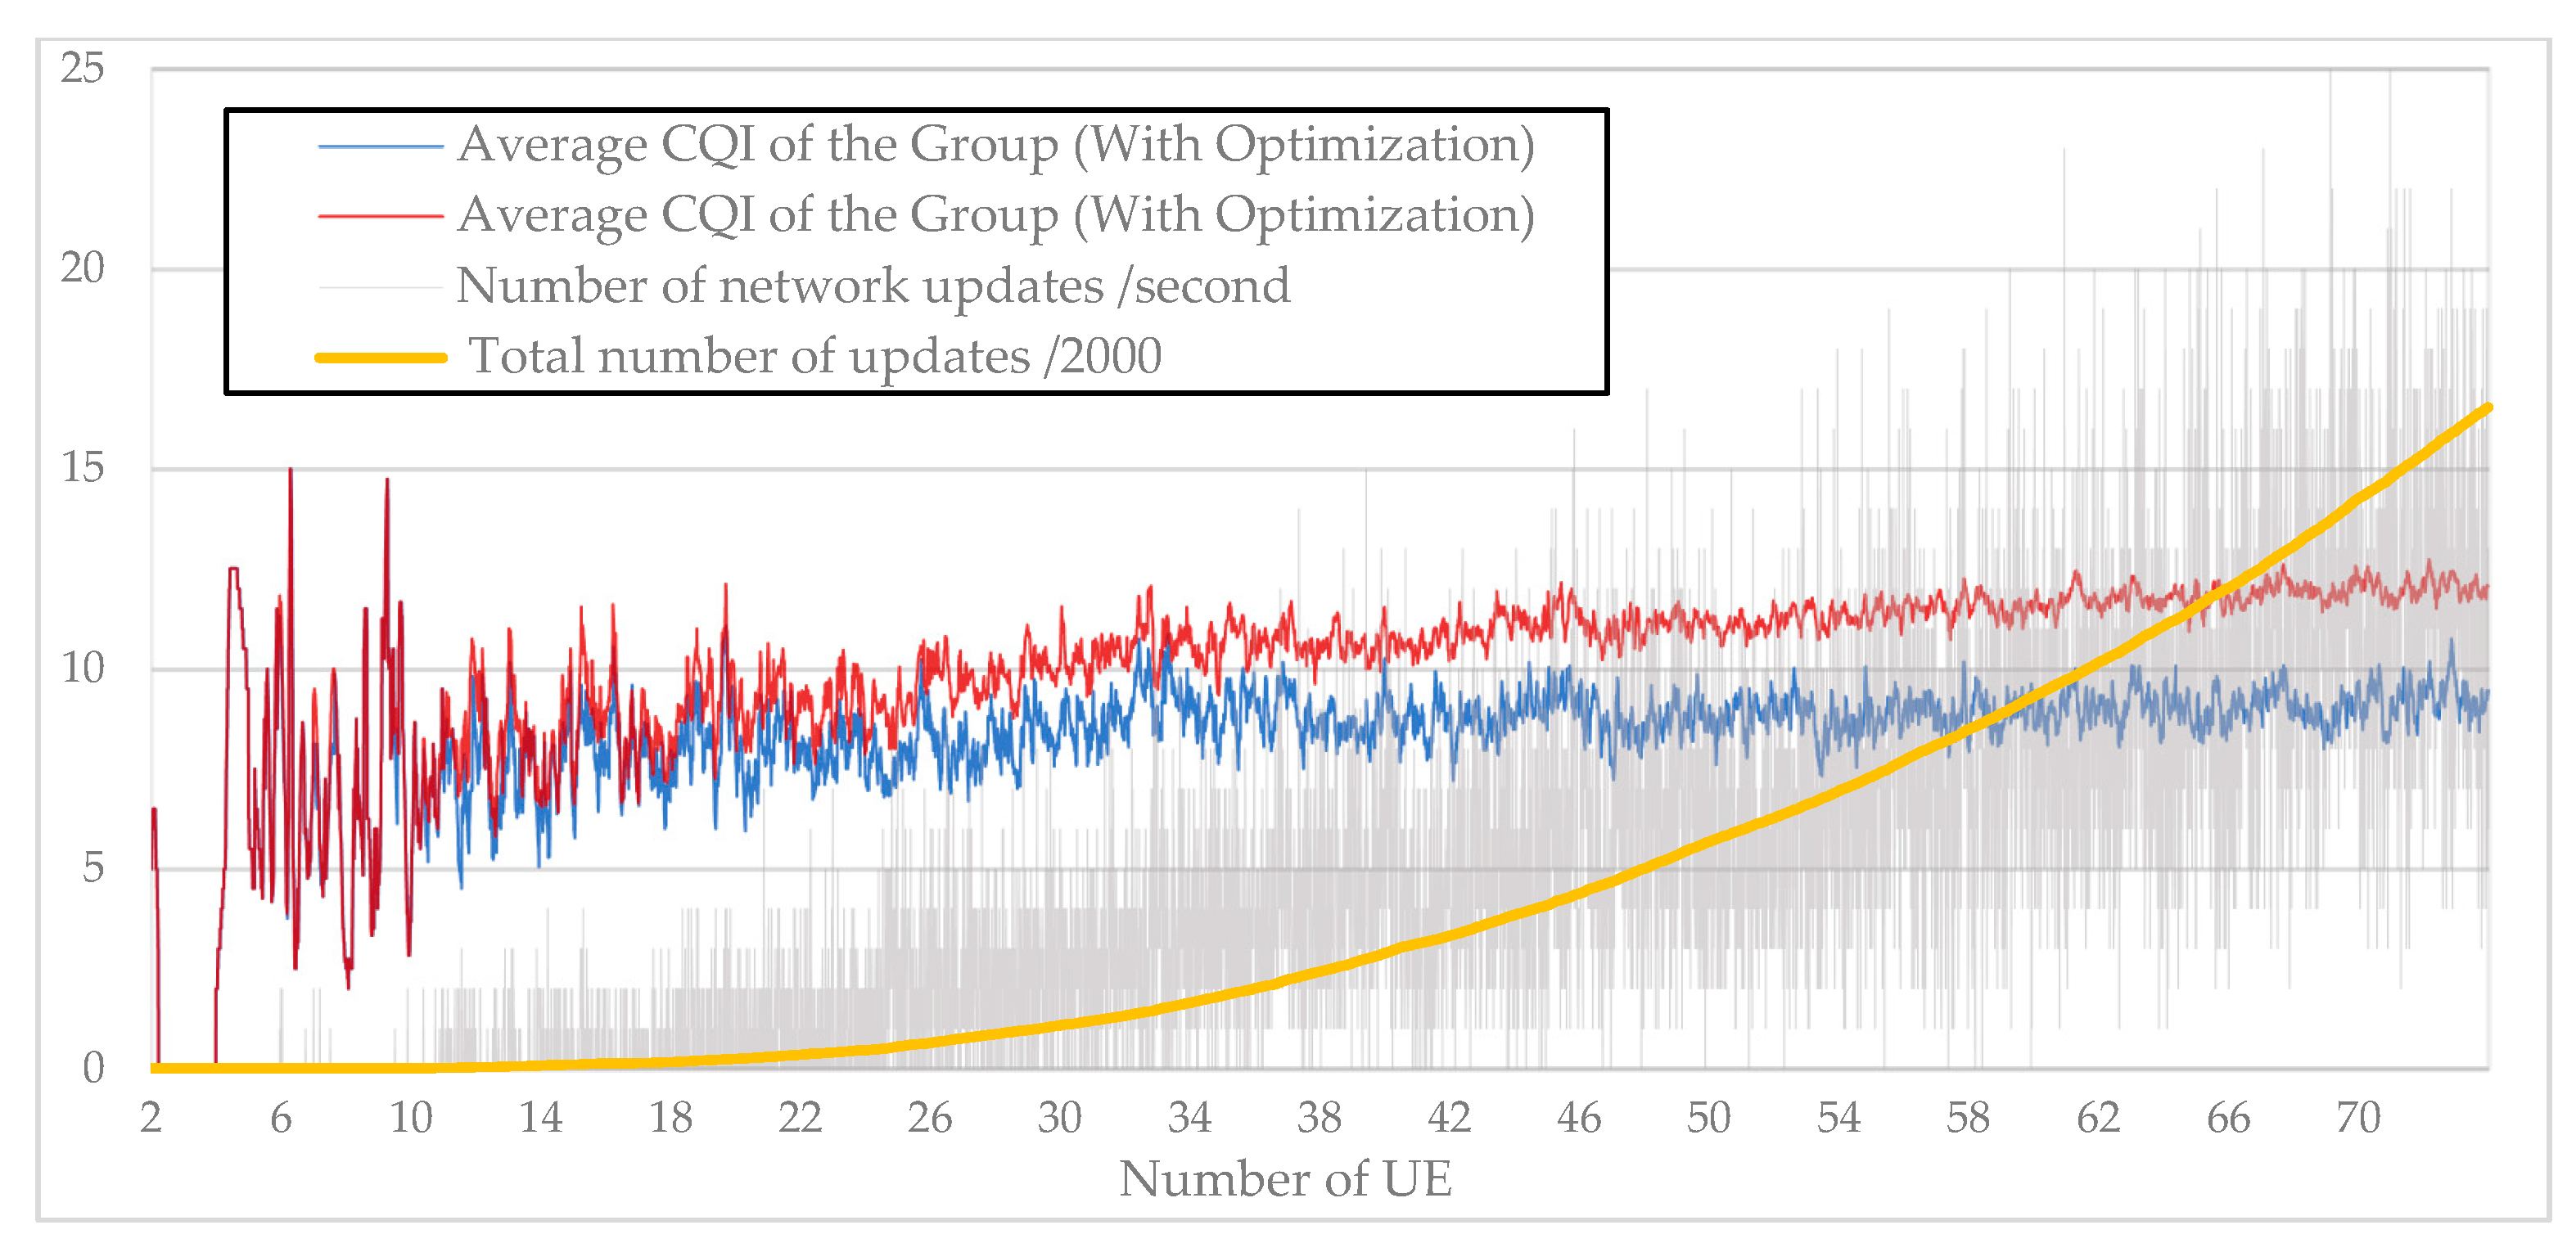
Figure 16.
Number of network updates genereted according to different CQI thresholds.
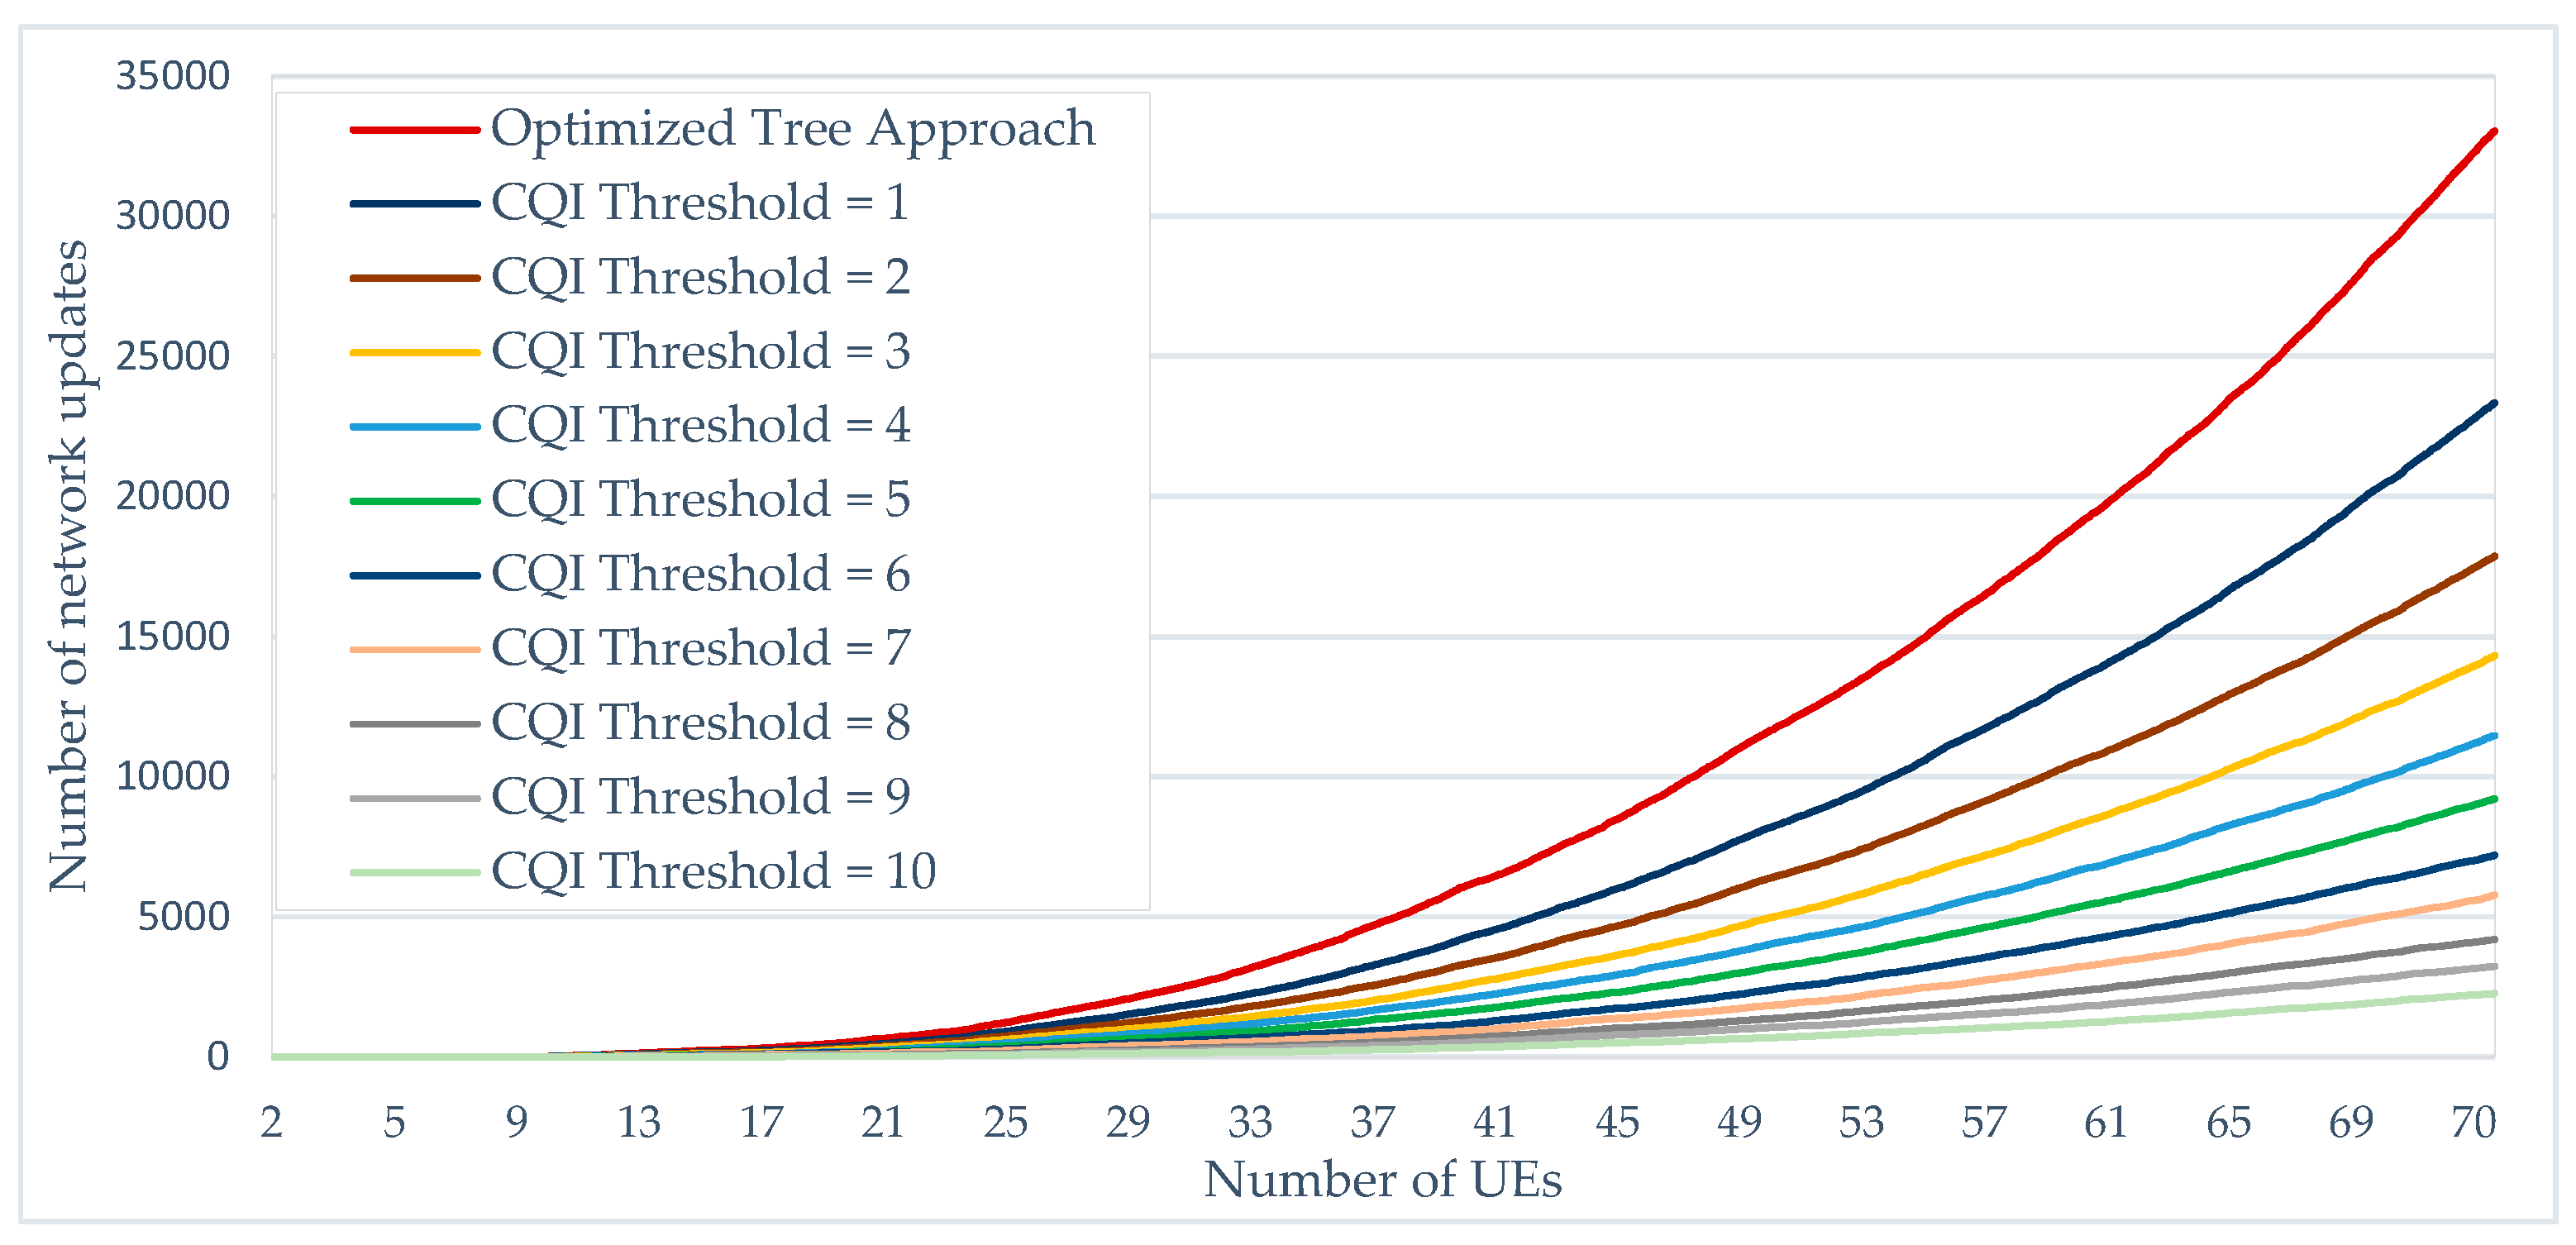
Figure 17.
Resulted average CQI for each CQI threshold value from 1 to 10.

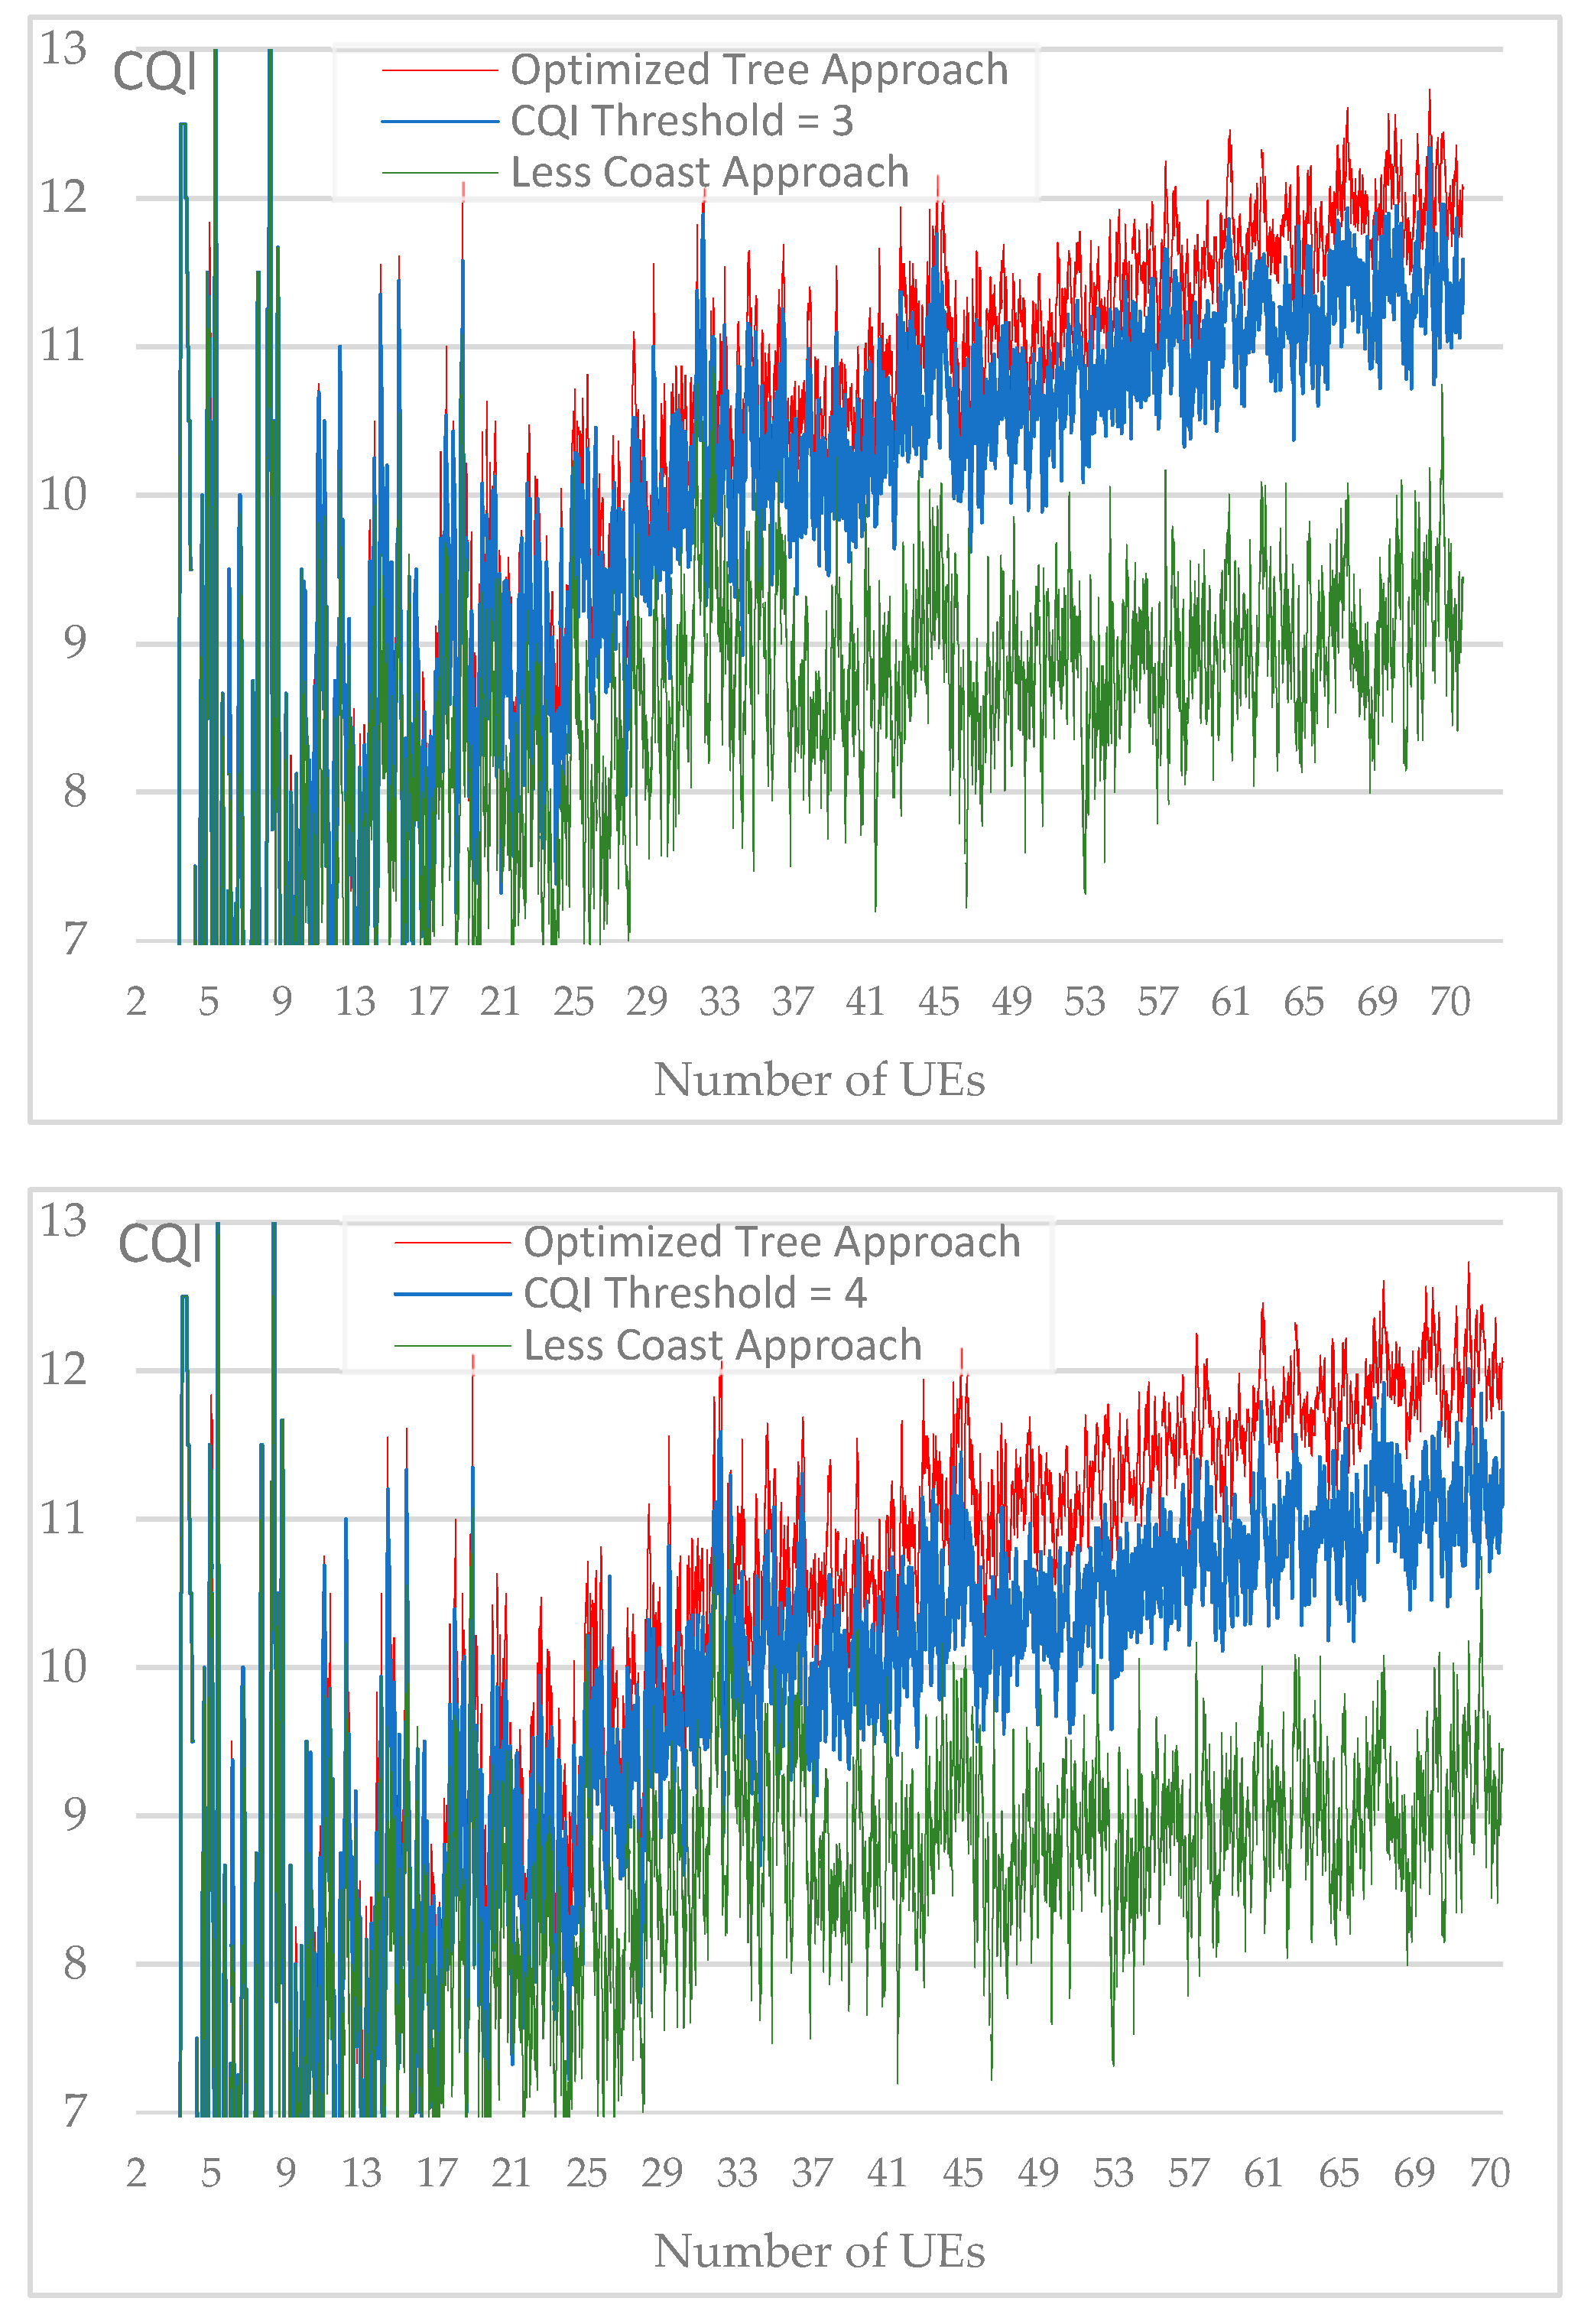
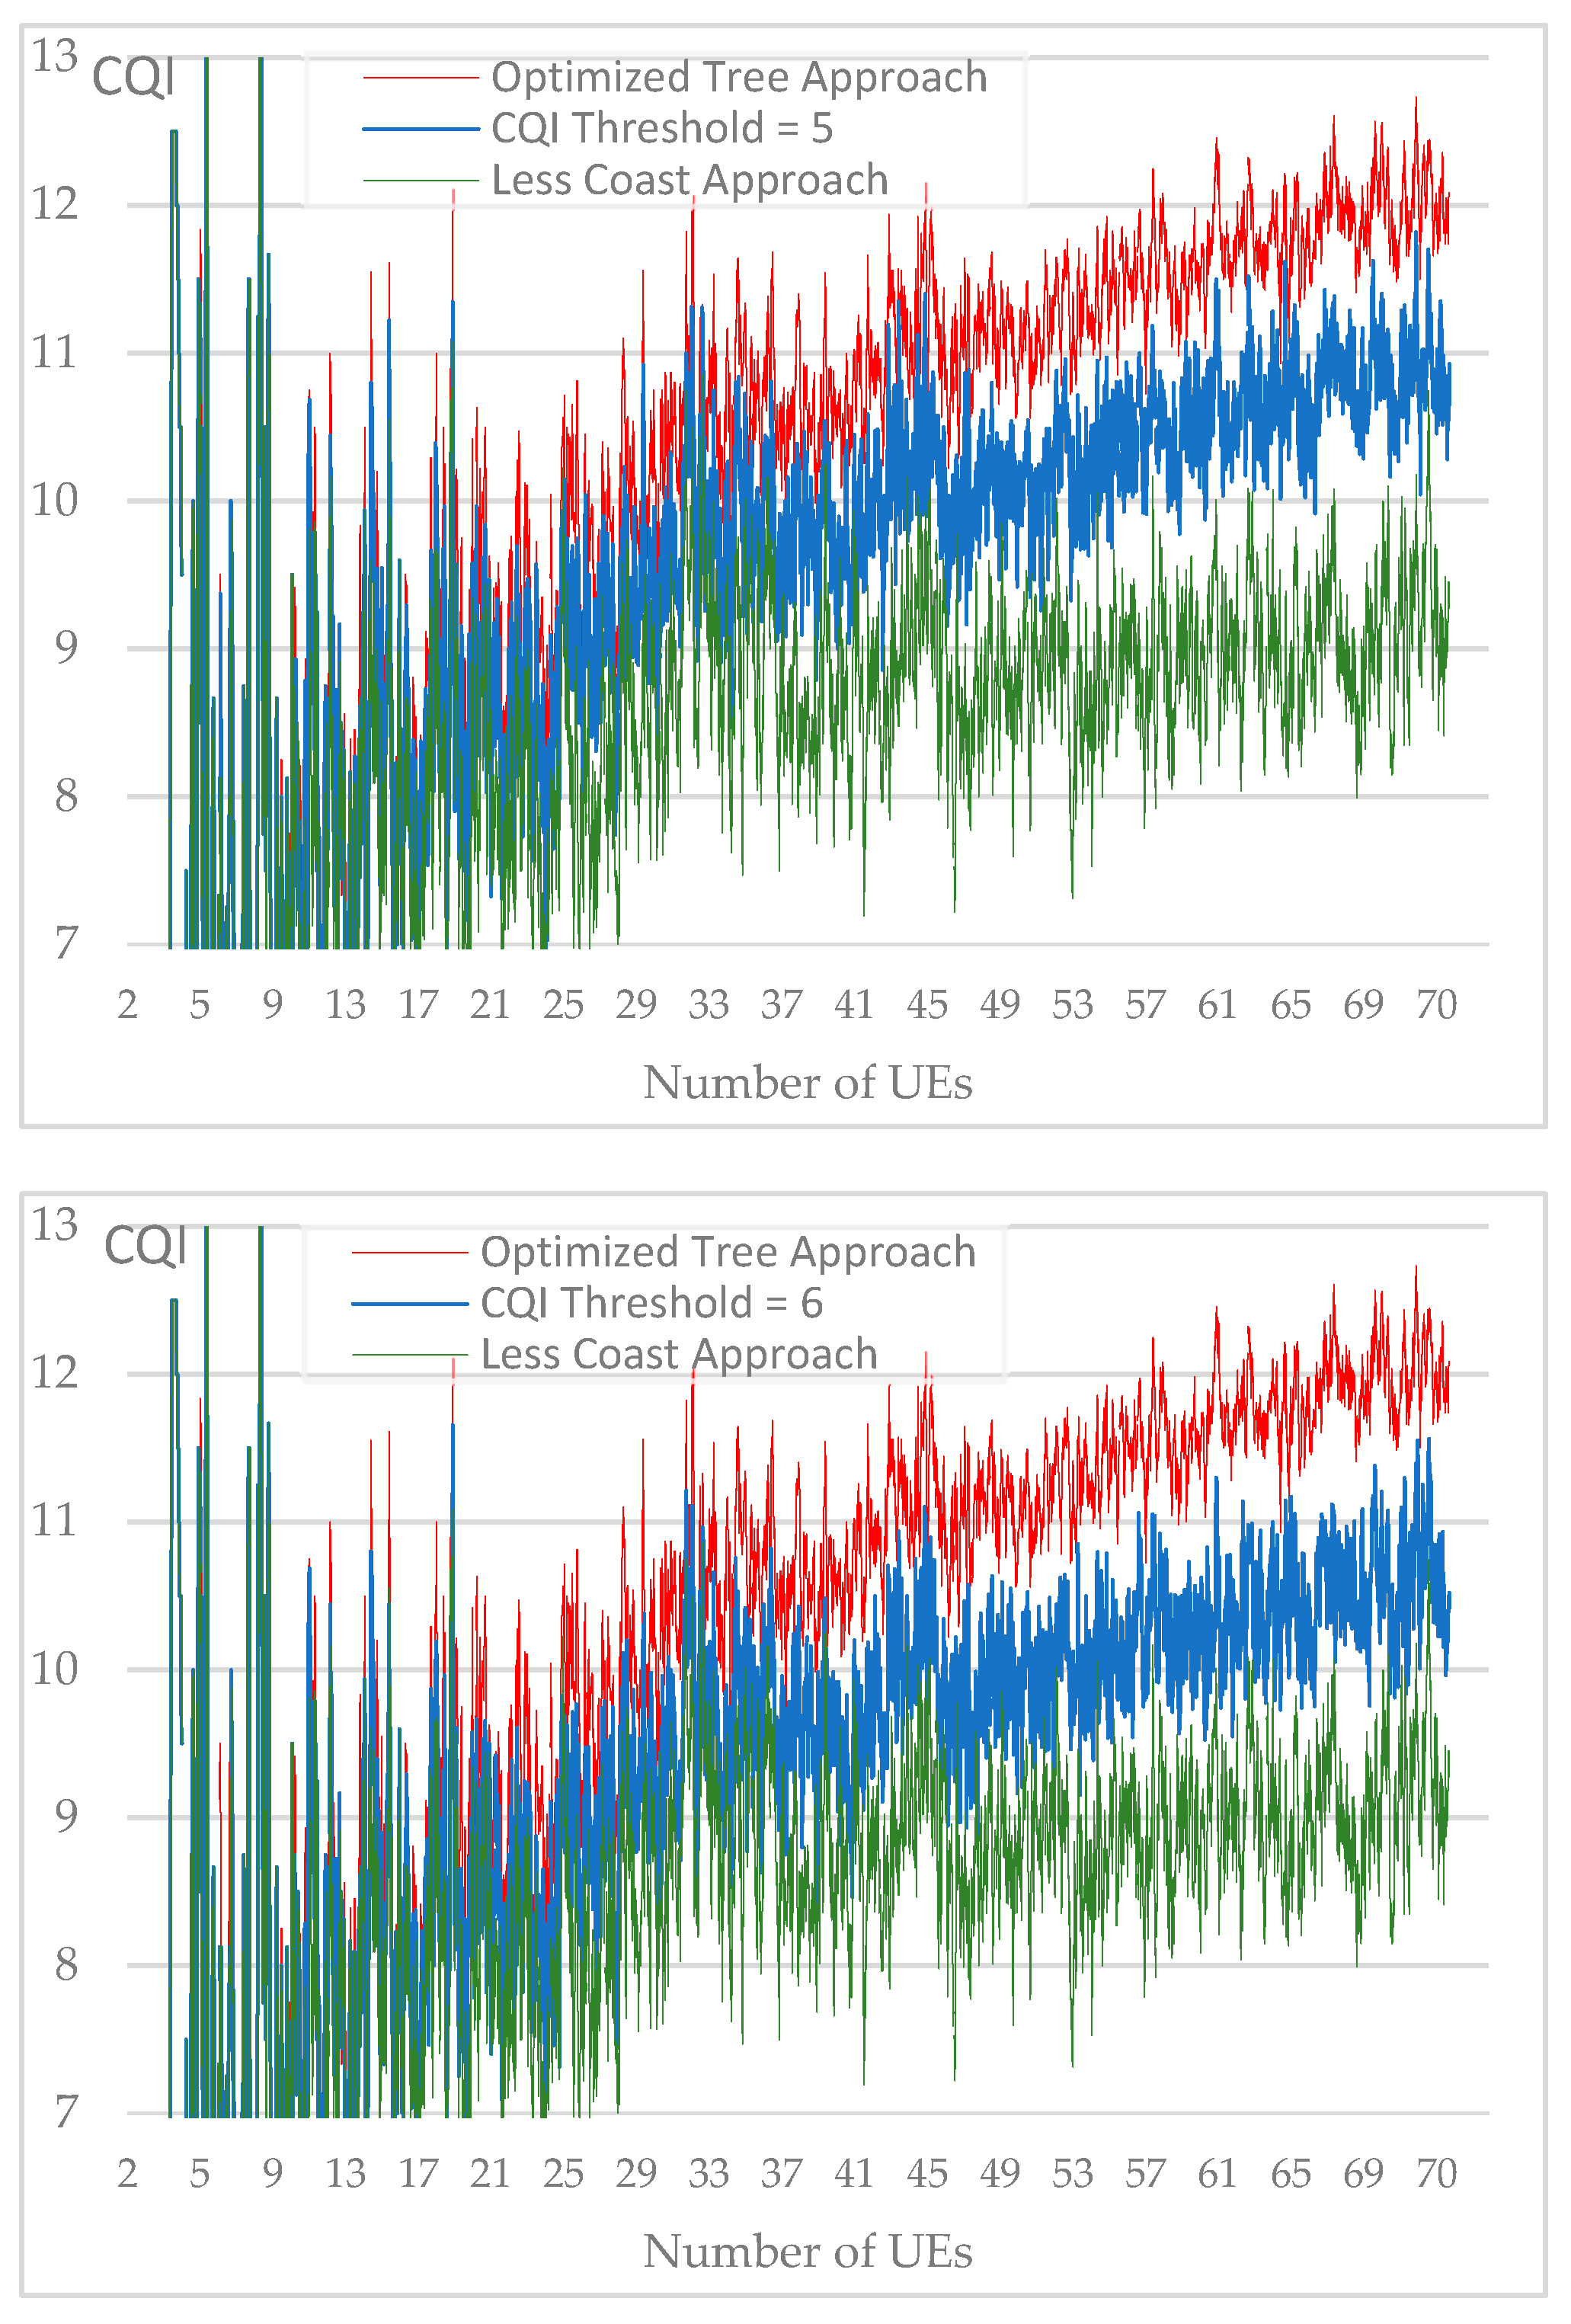
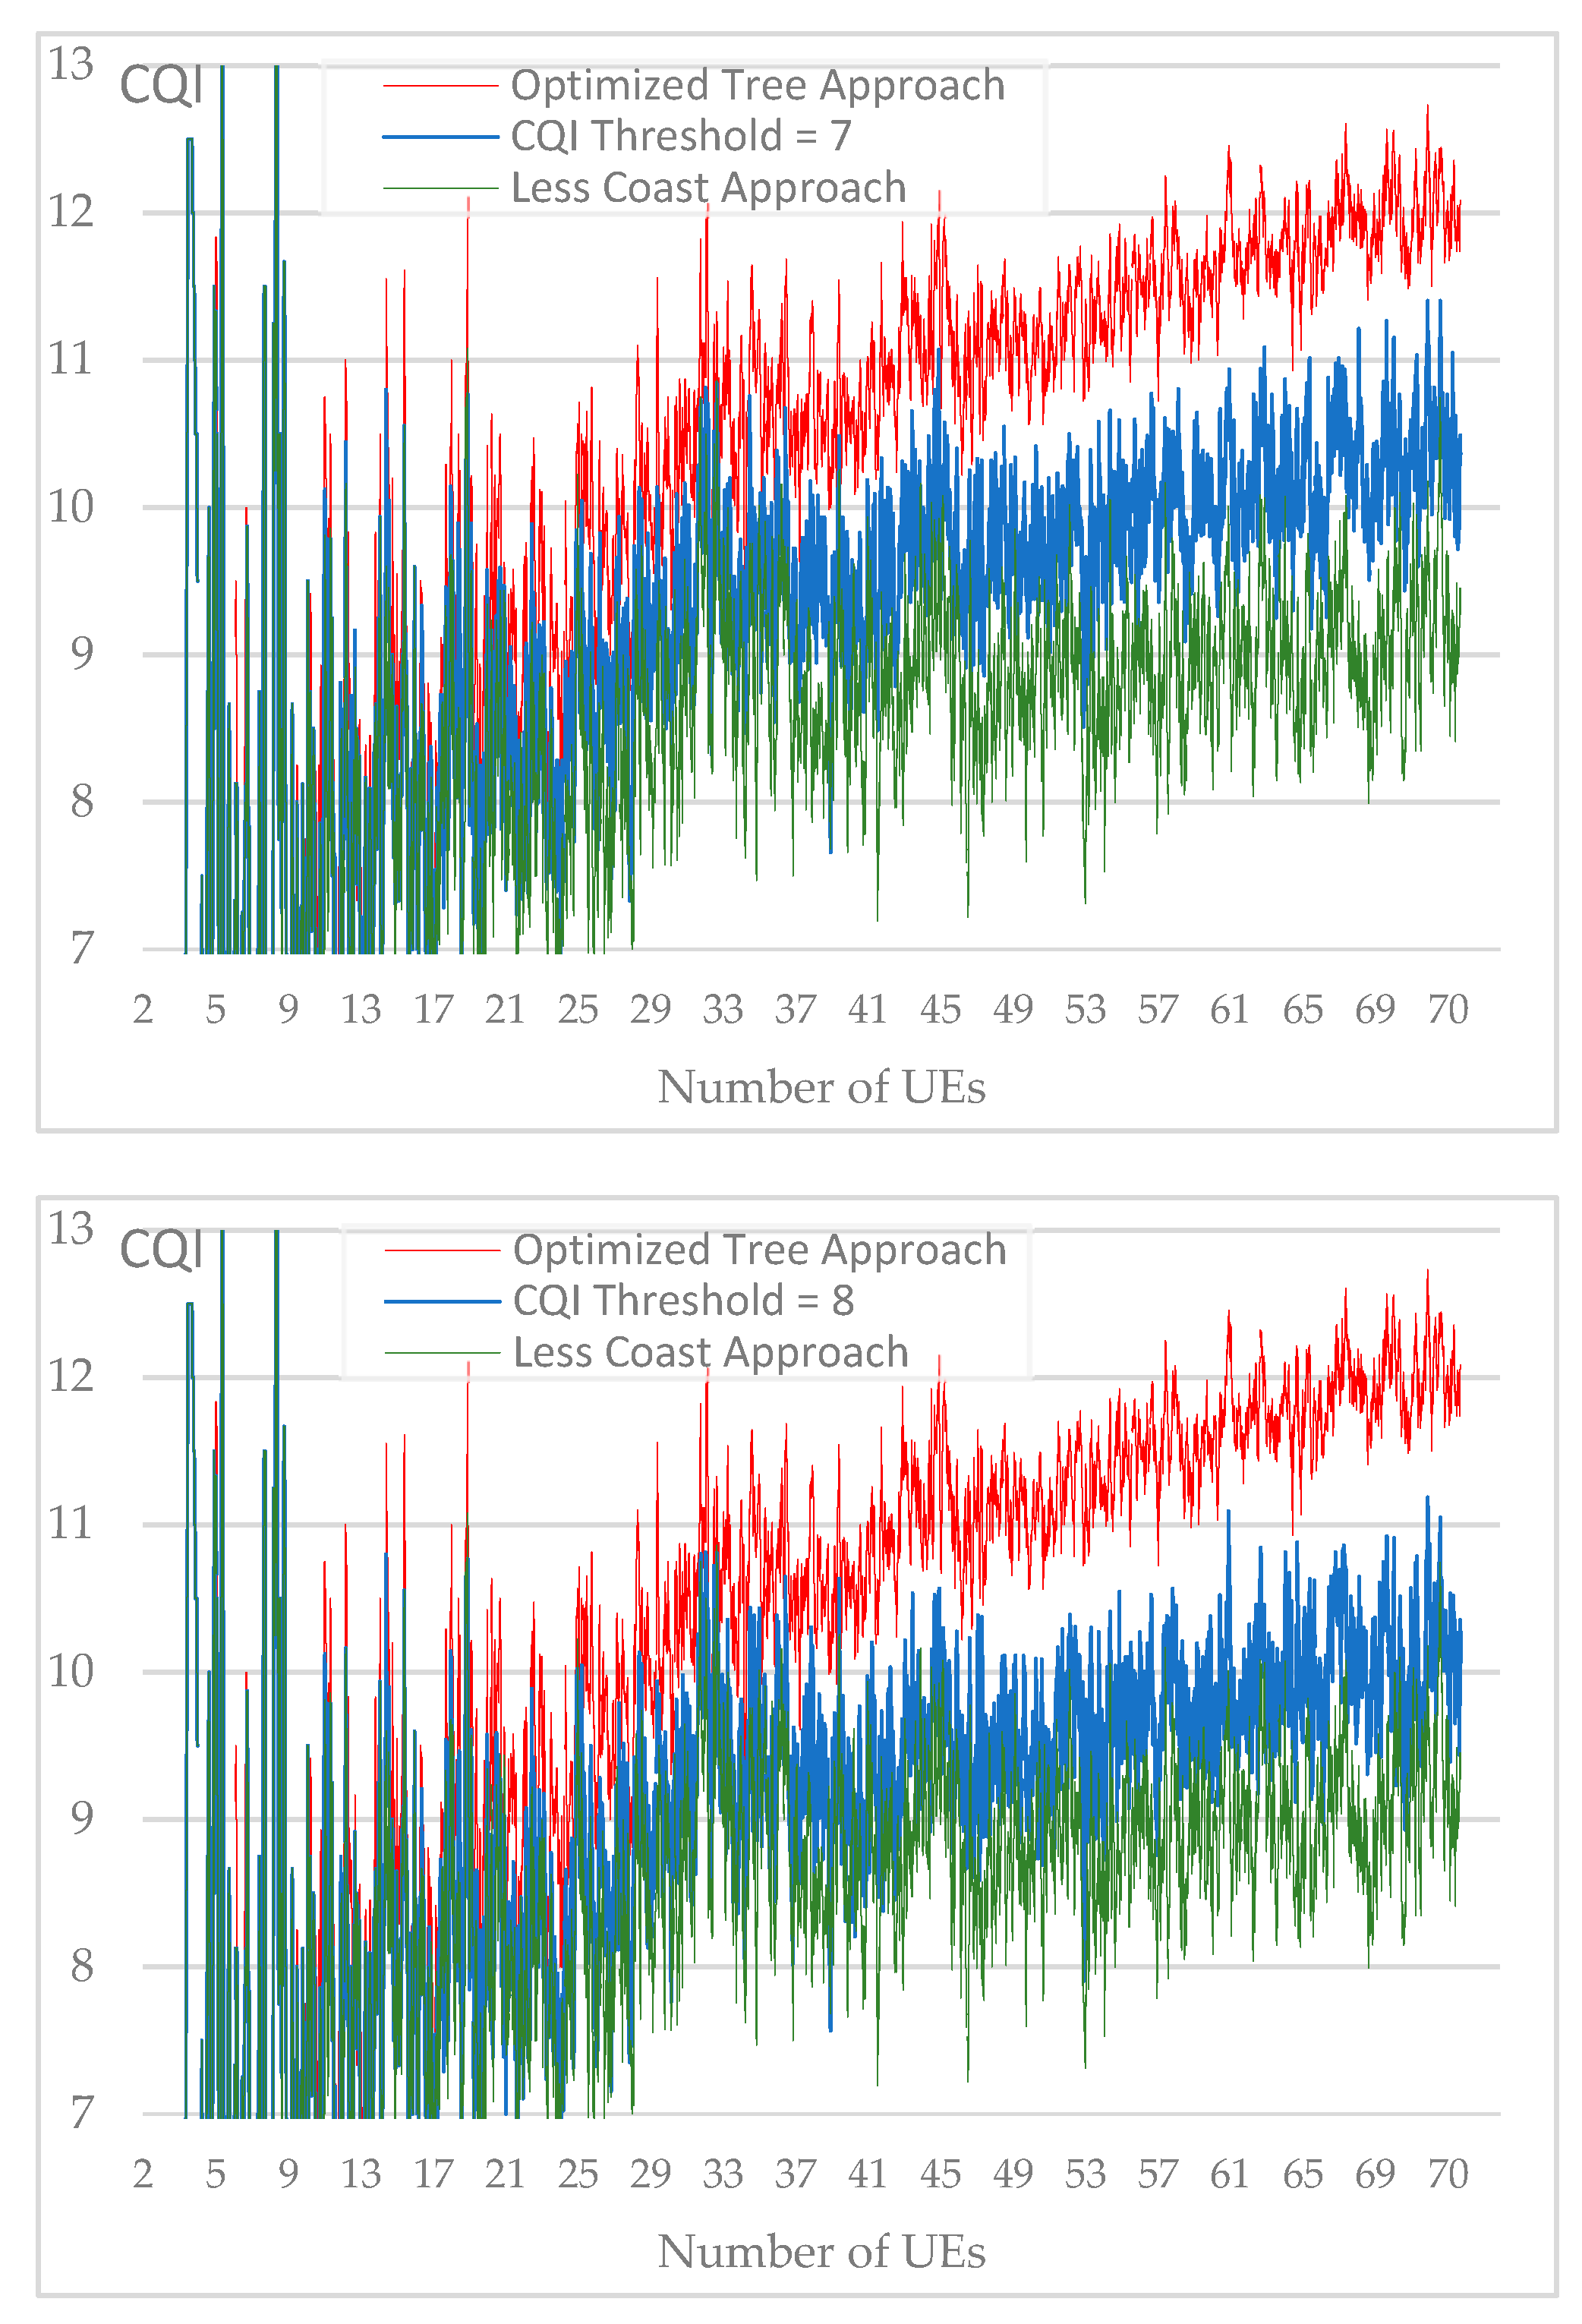
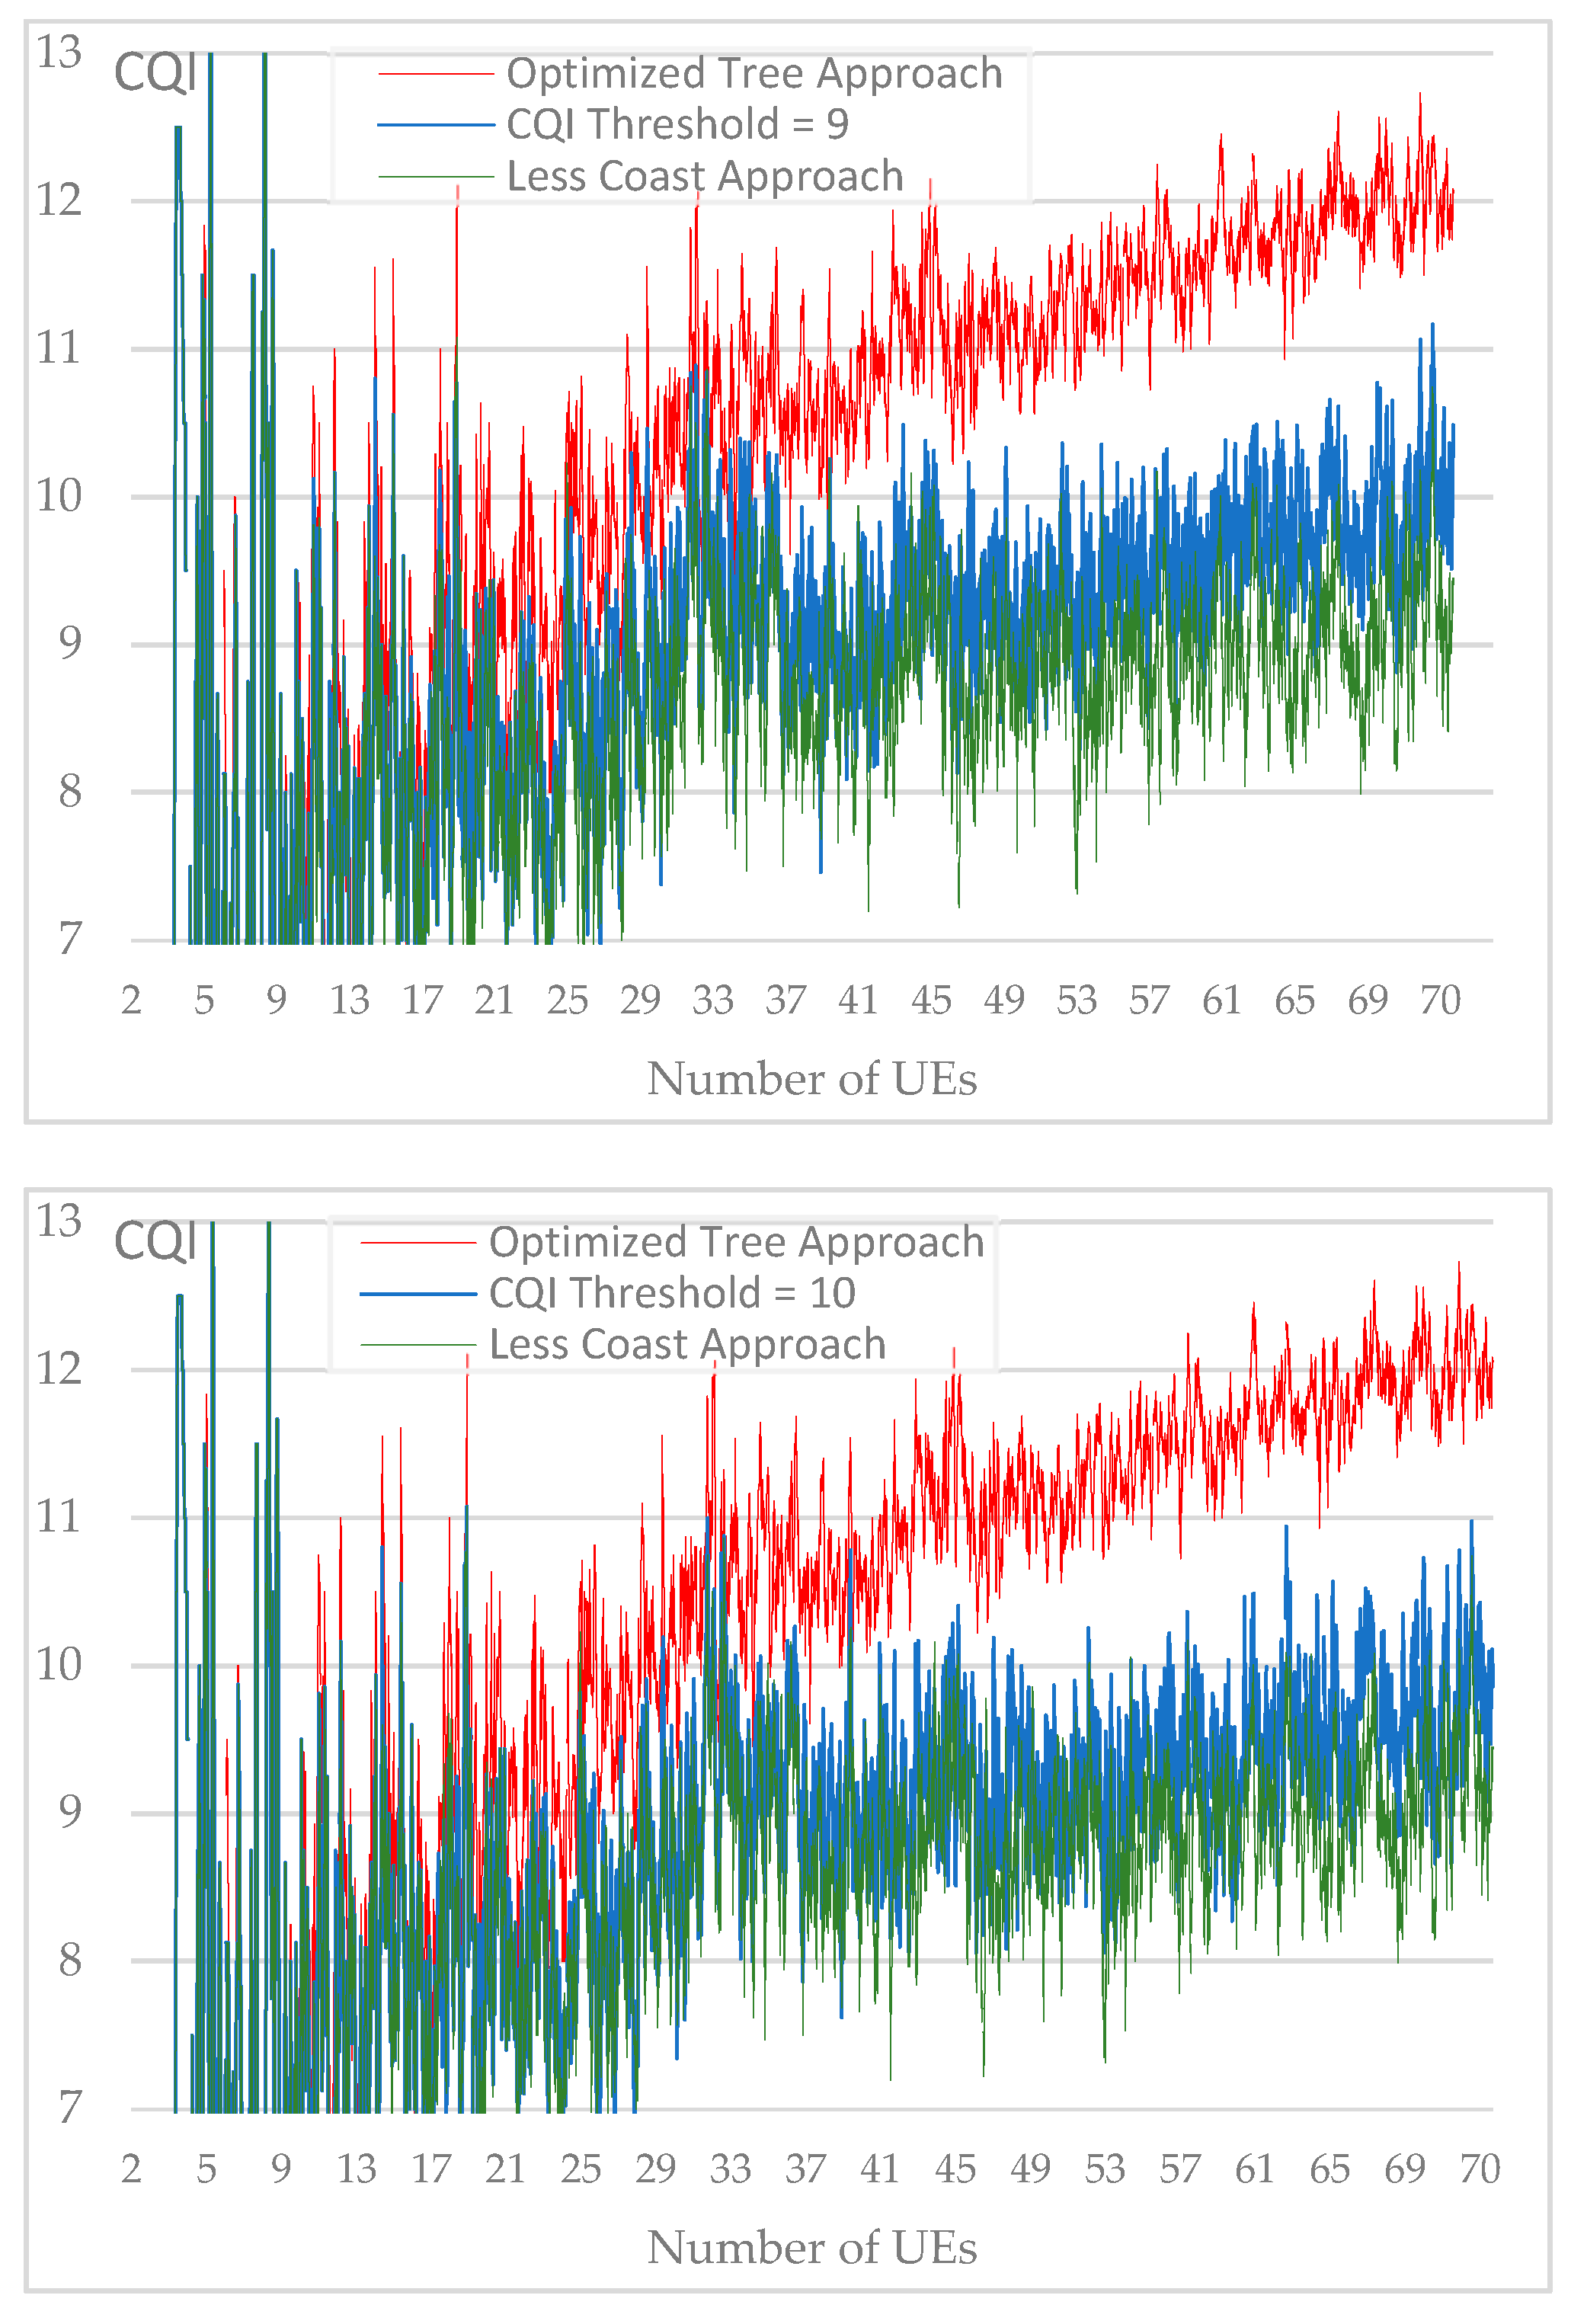
Figure 18.
Average CQI gains according to the number of UEs and CQI threshold values.
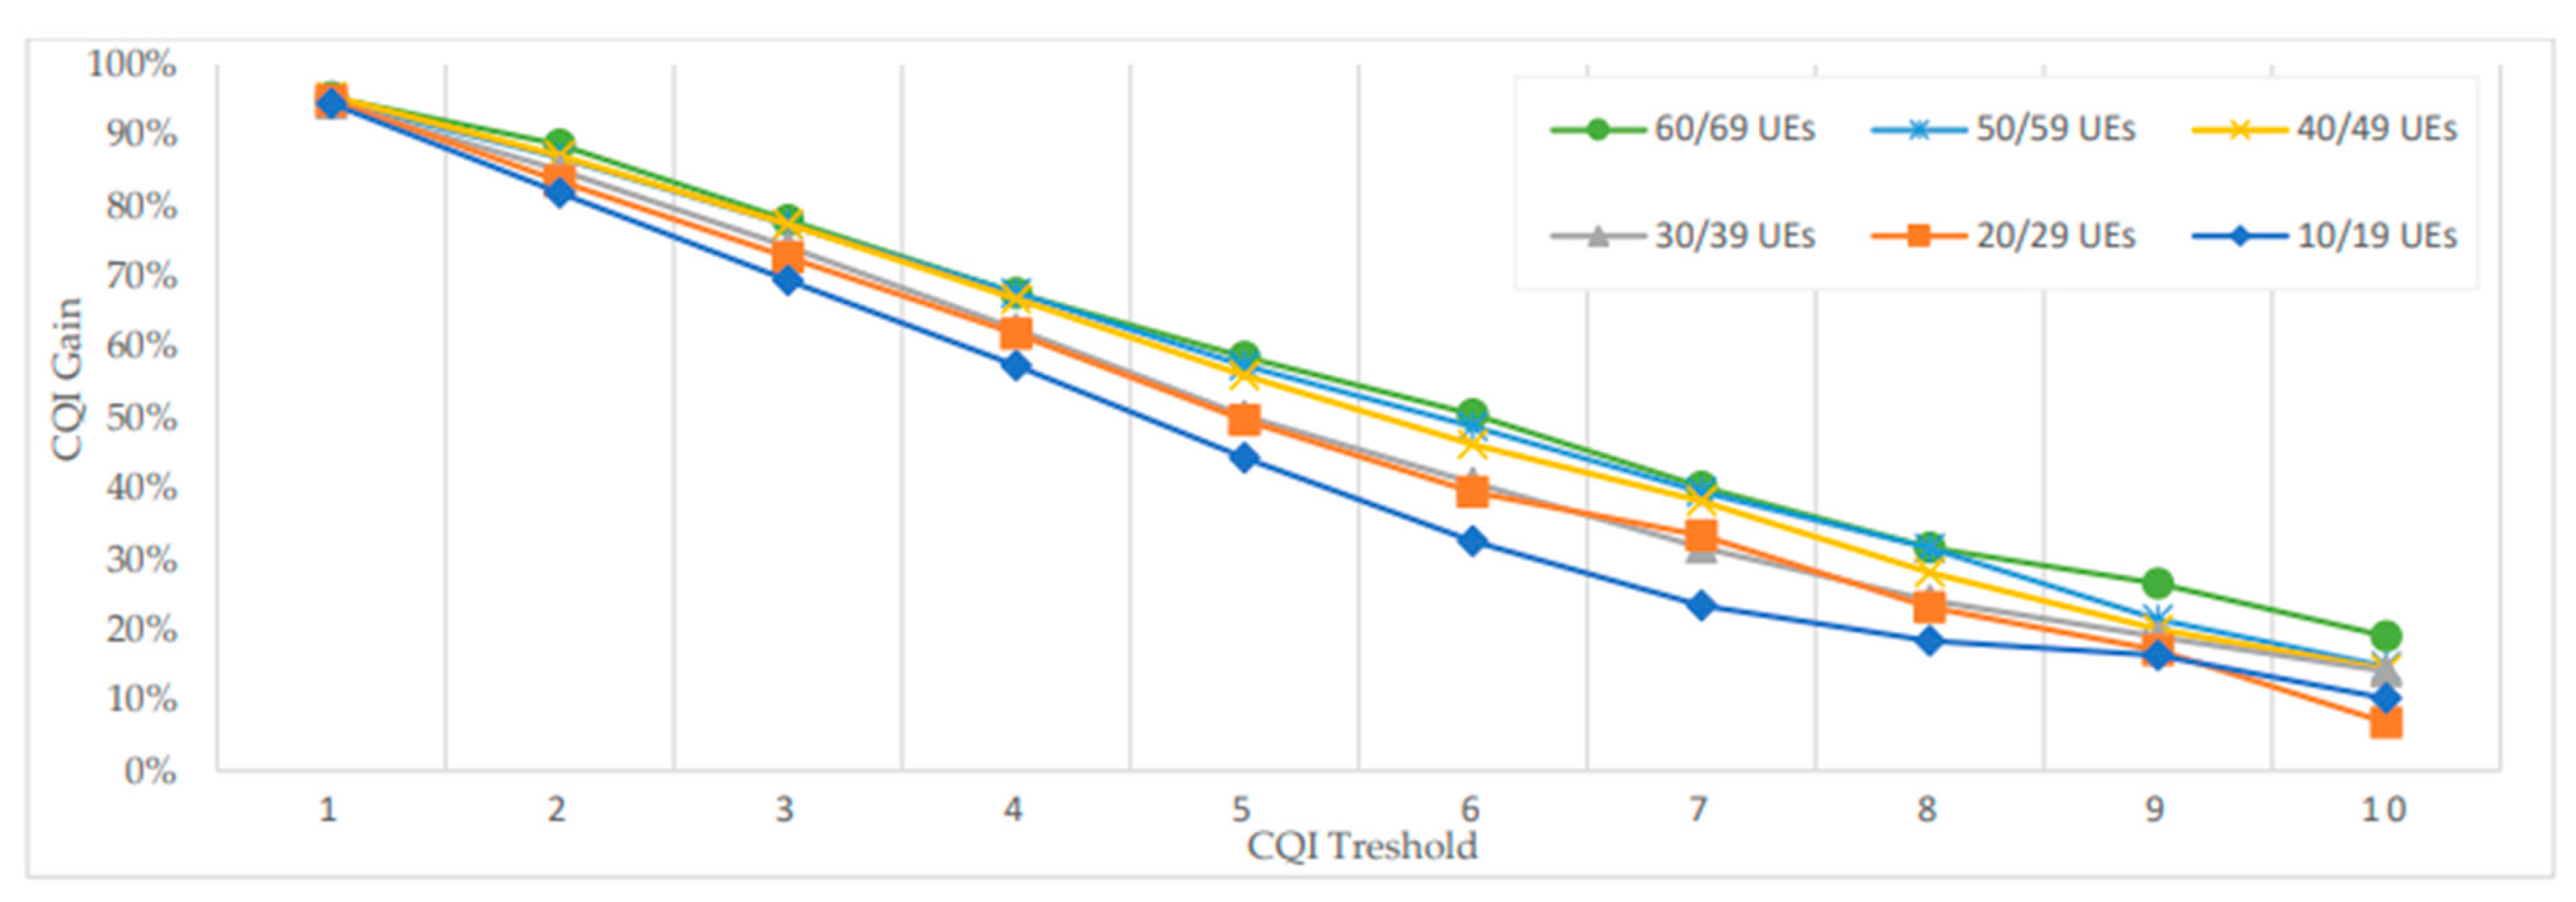
Figure 19.
Number of network updates generated according to different optimization intervals.
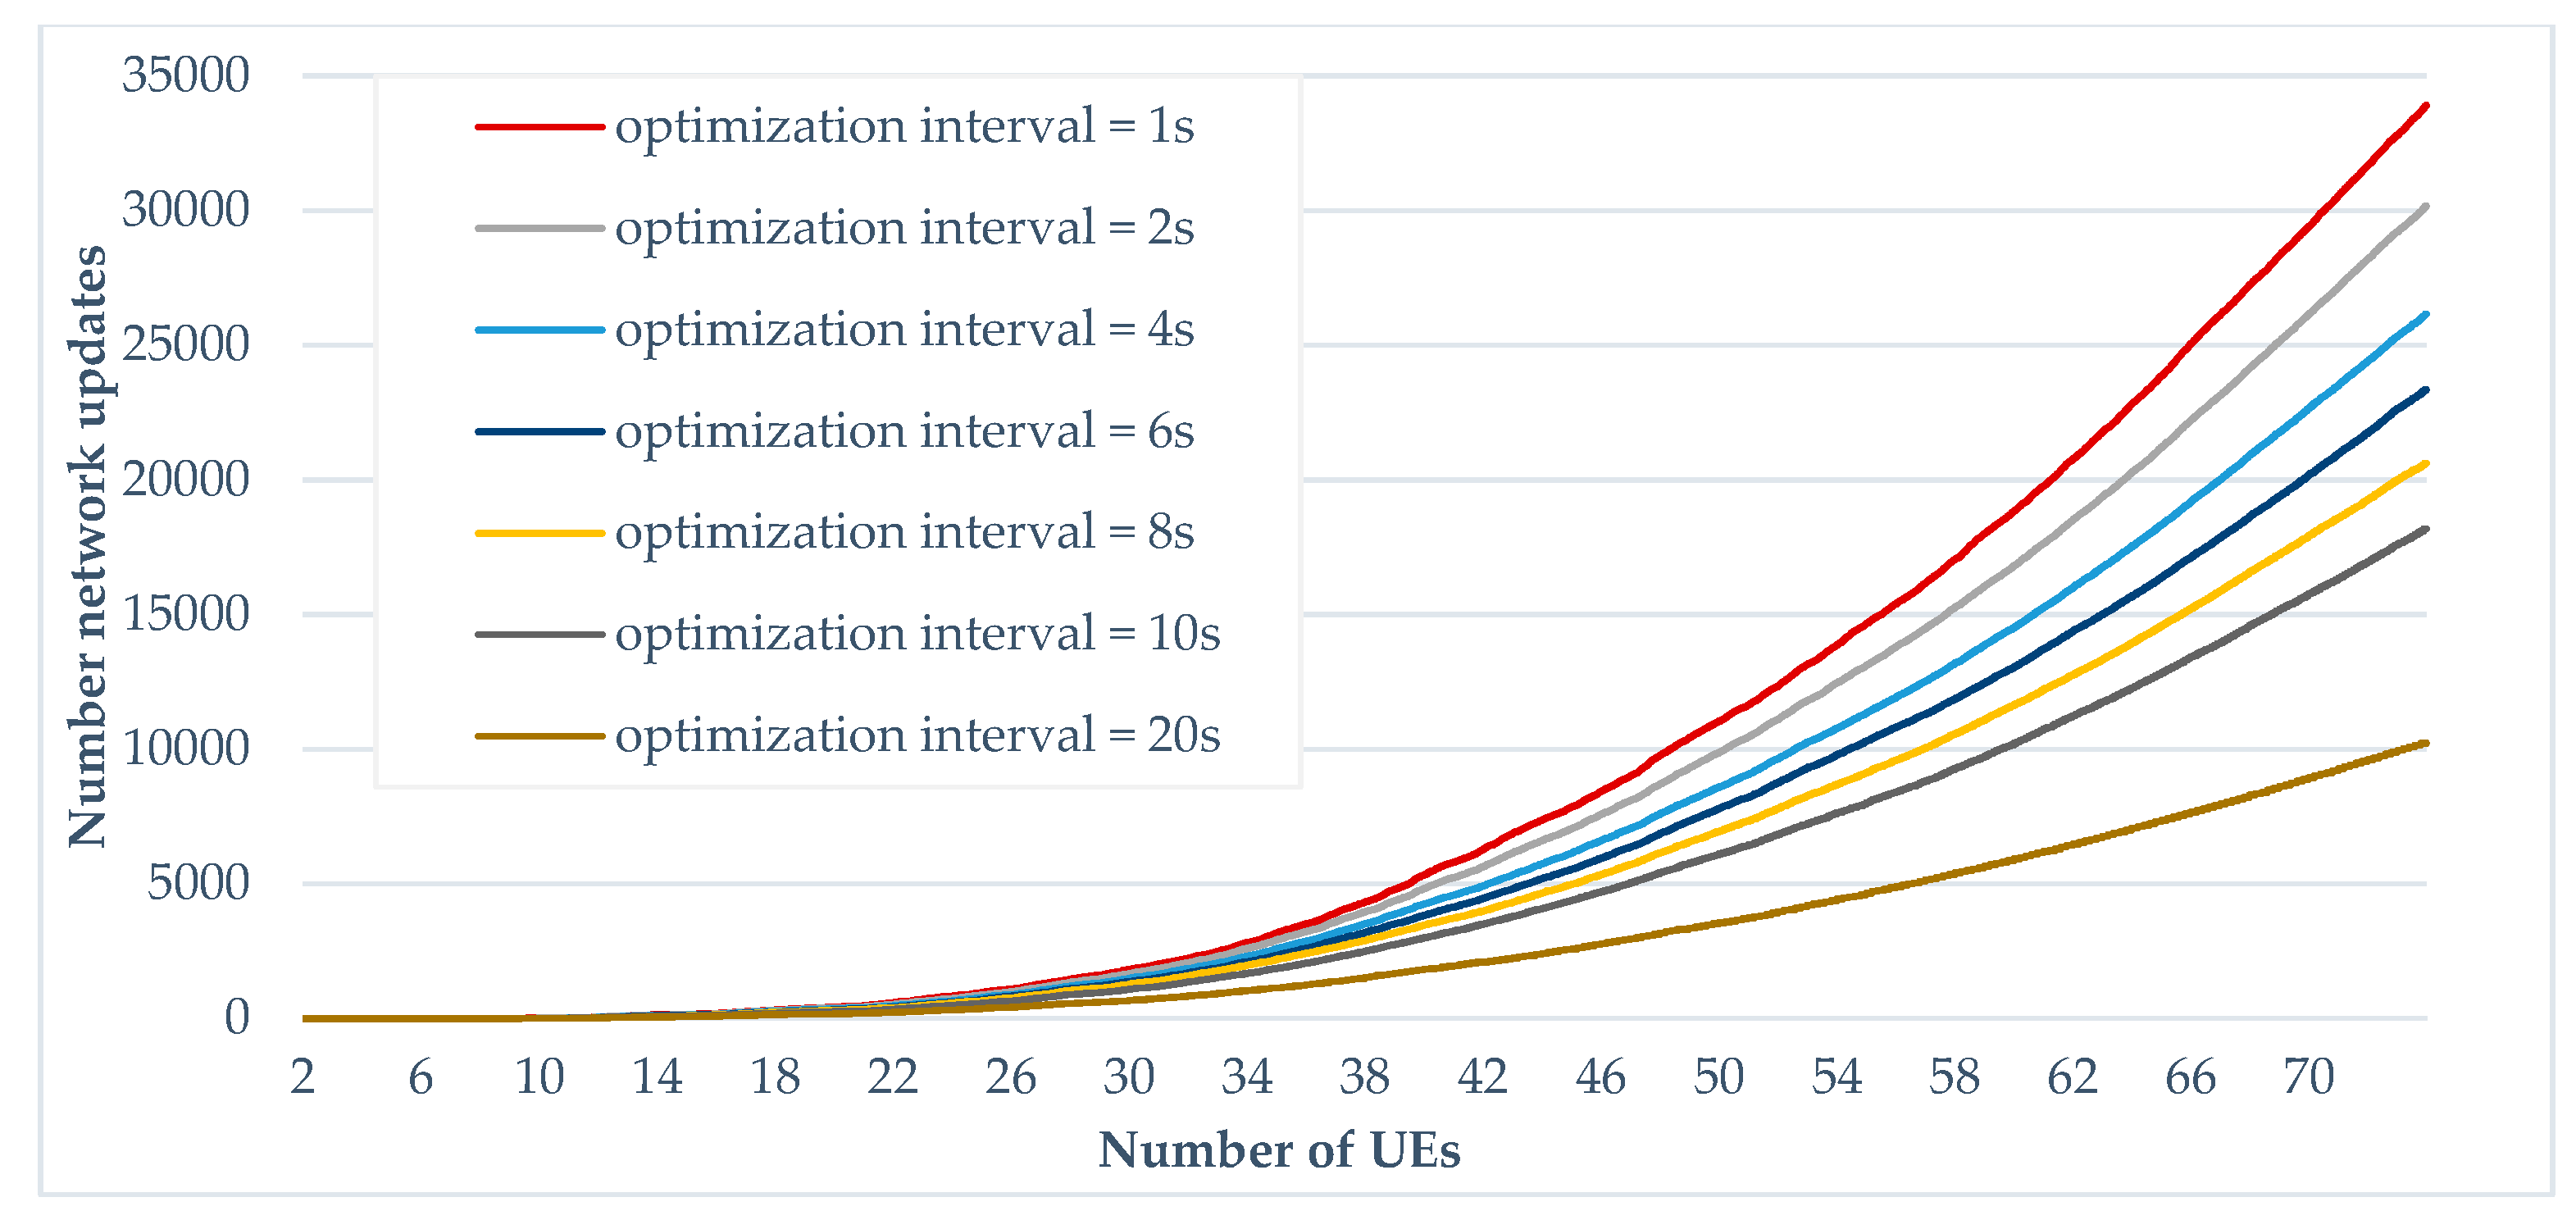
Figure 20.
Resulted average CQI for each optimization frequency.
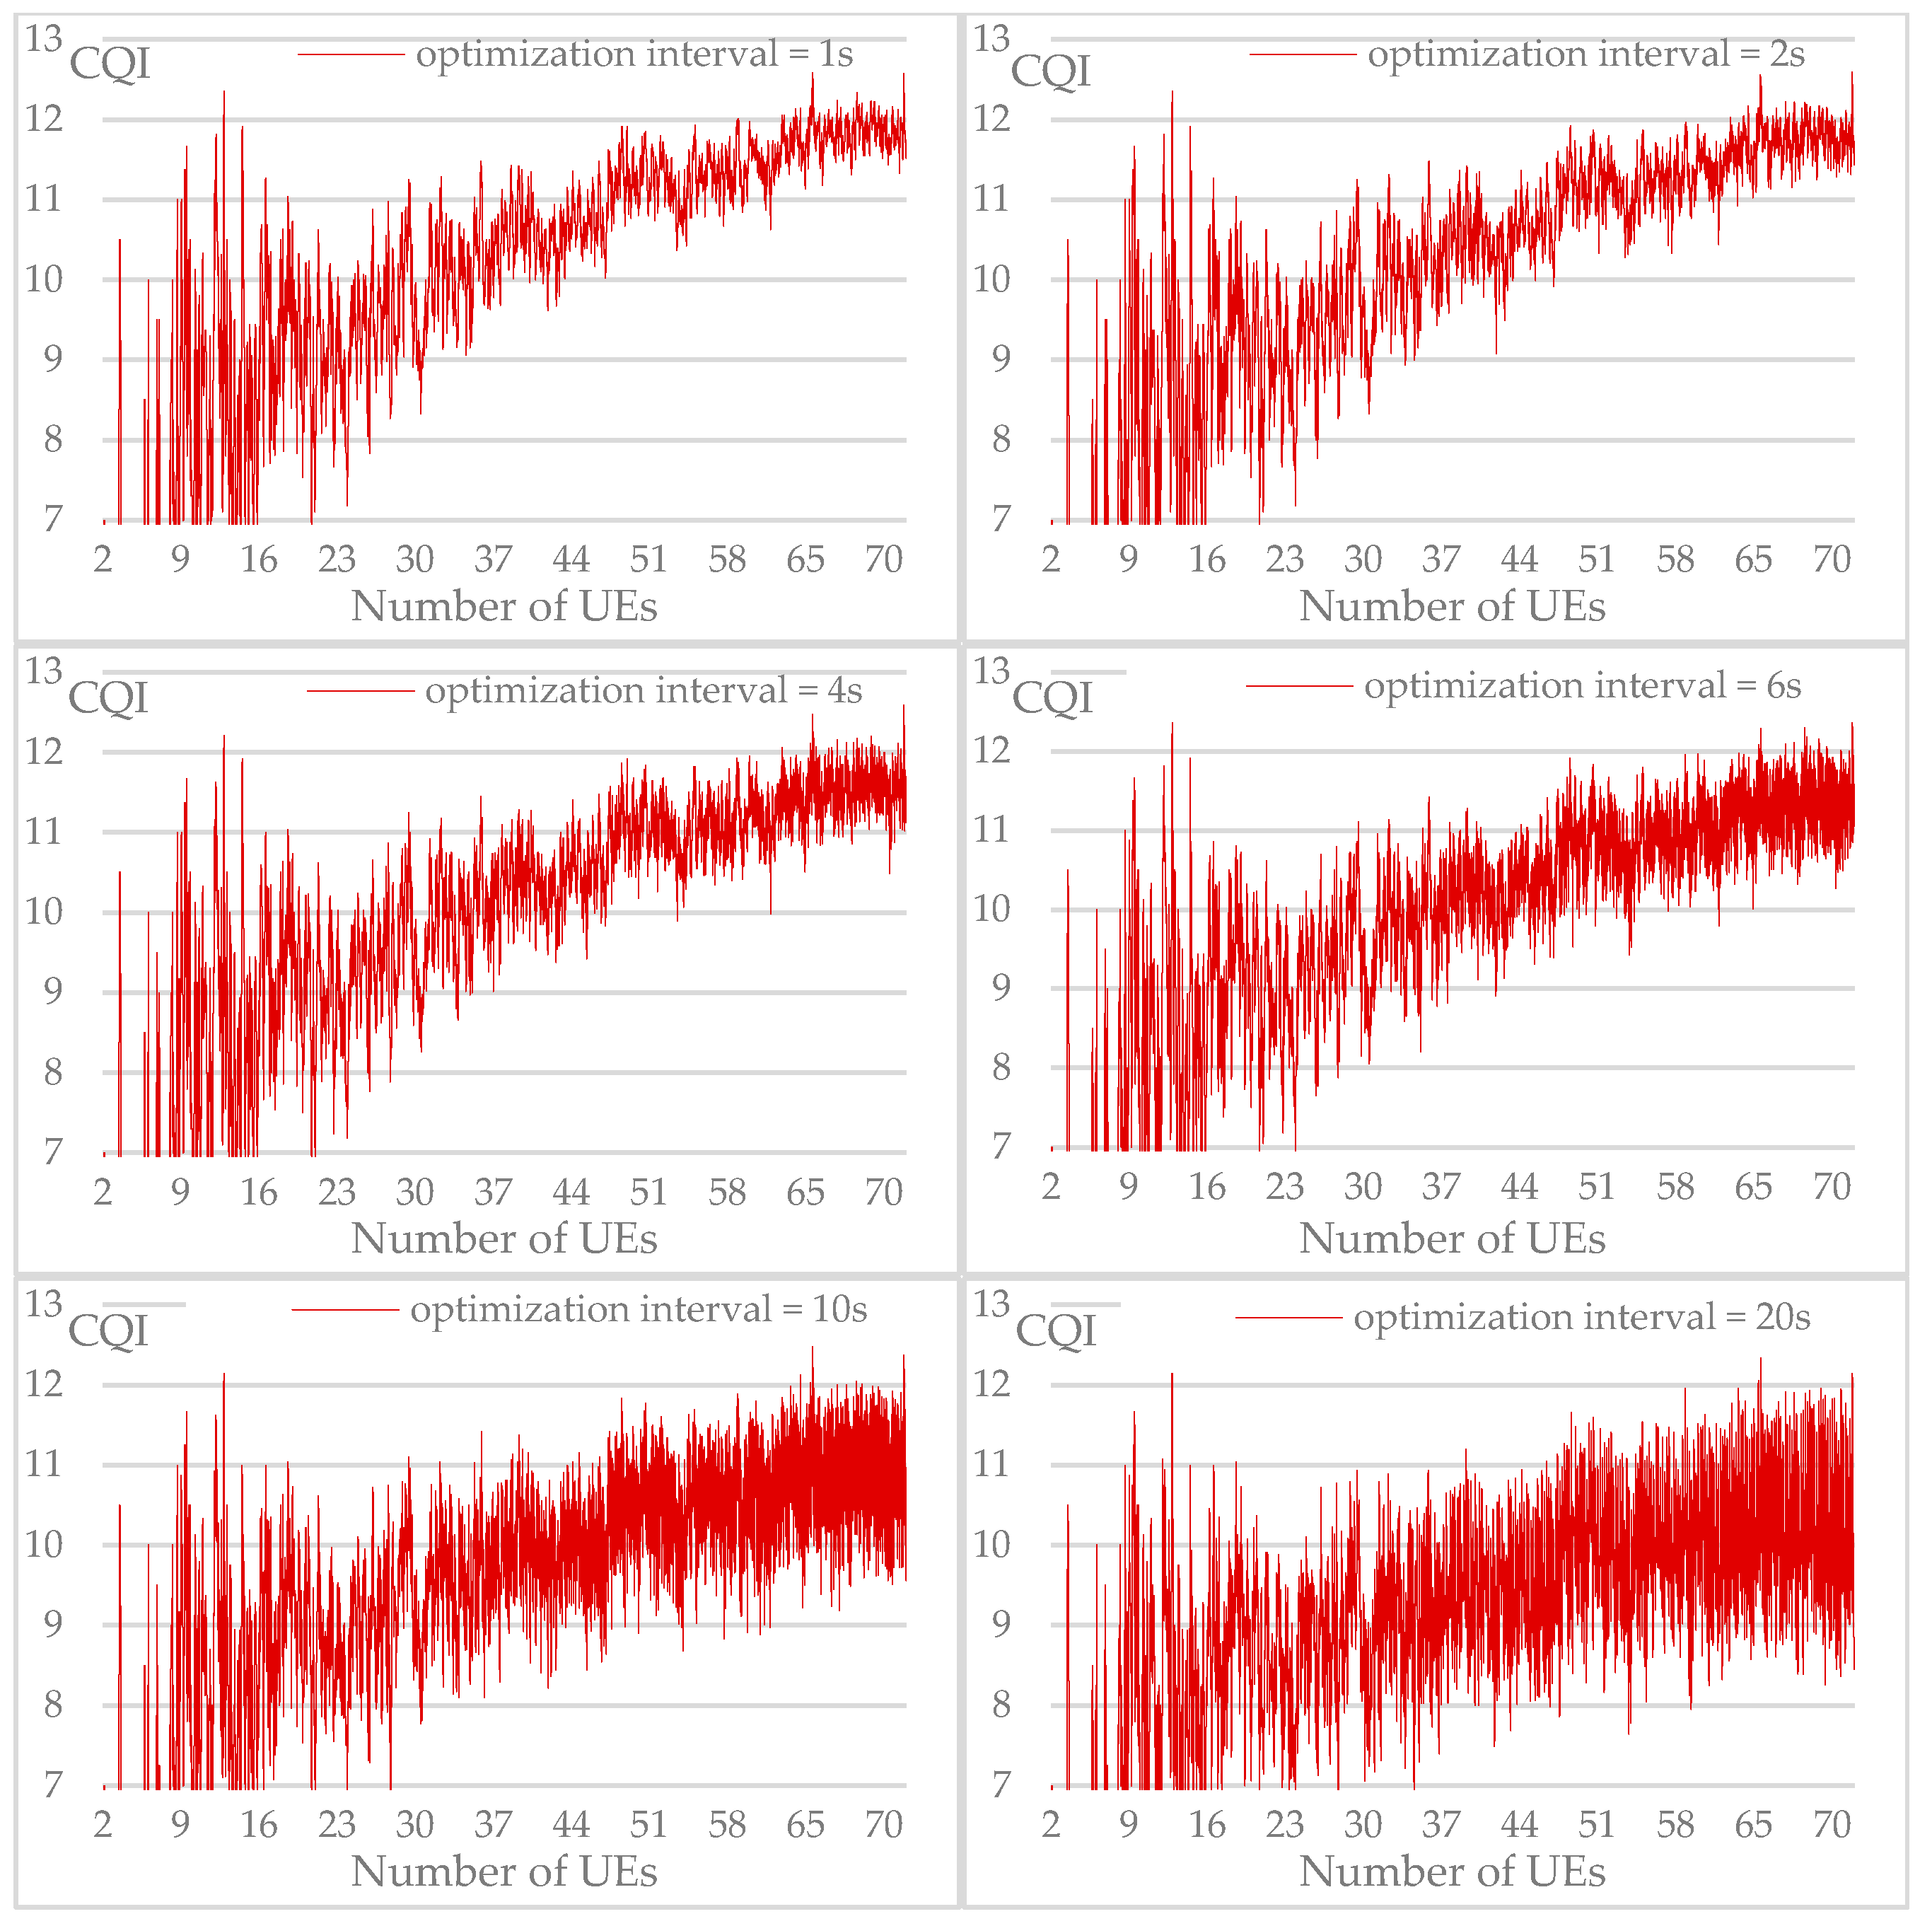
Figure 21.
Average CQI comparison between optimized tree approach and customized approach (CQI threshold = 1 and optimized interval = 2s).
Figure 21.
Average CQI comparison between optimized tree approach and customized approach (CQI threshold = 1 and optimized interval = 2s).
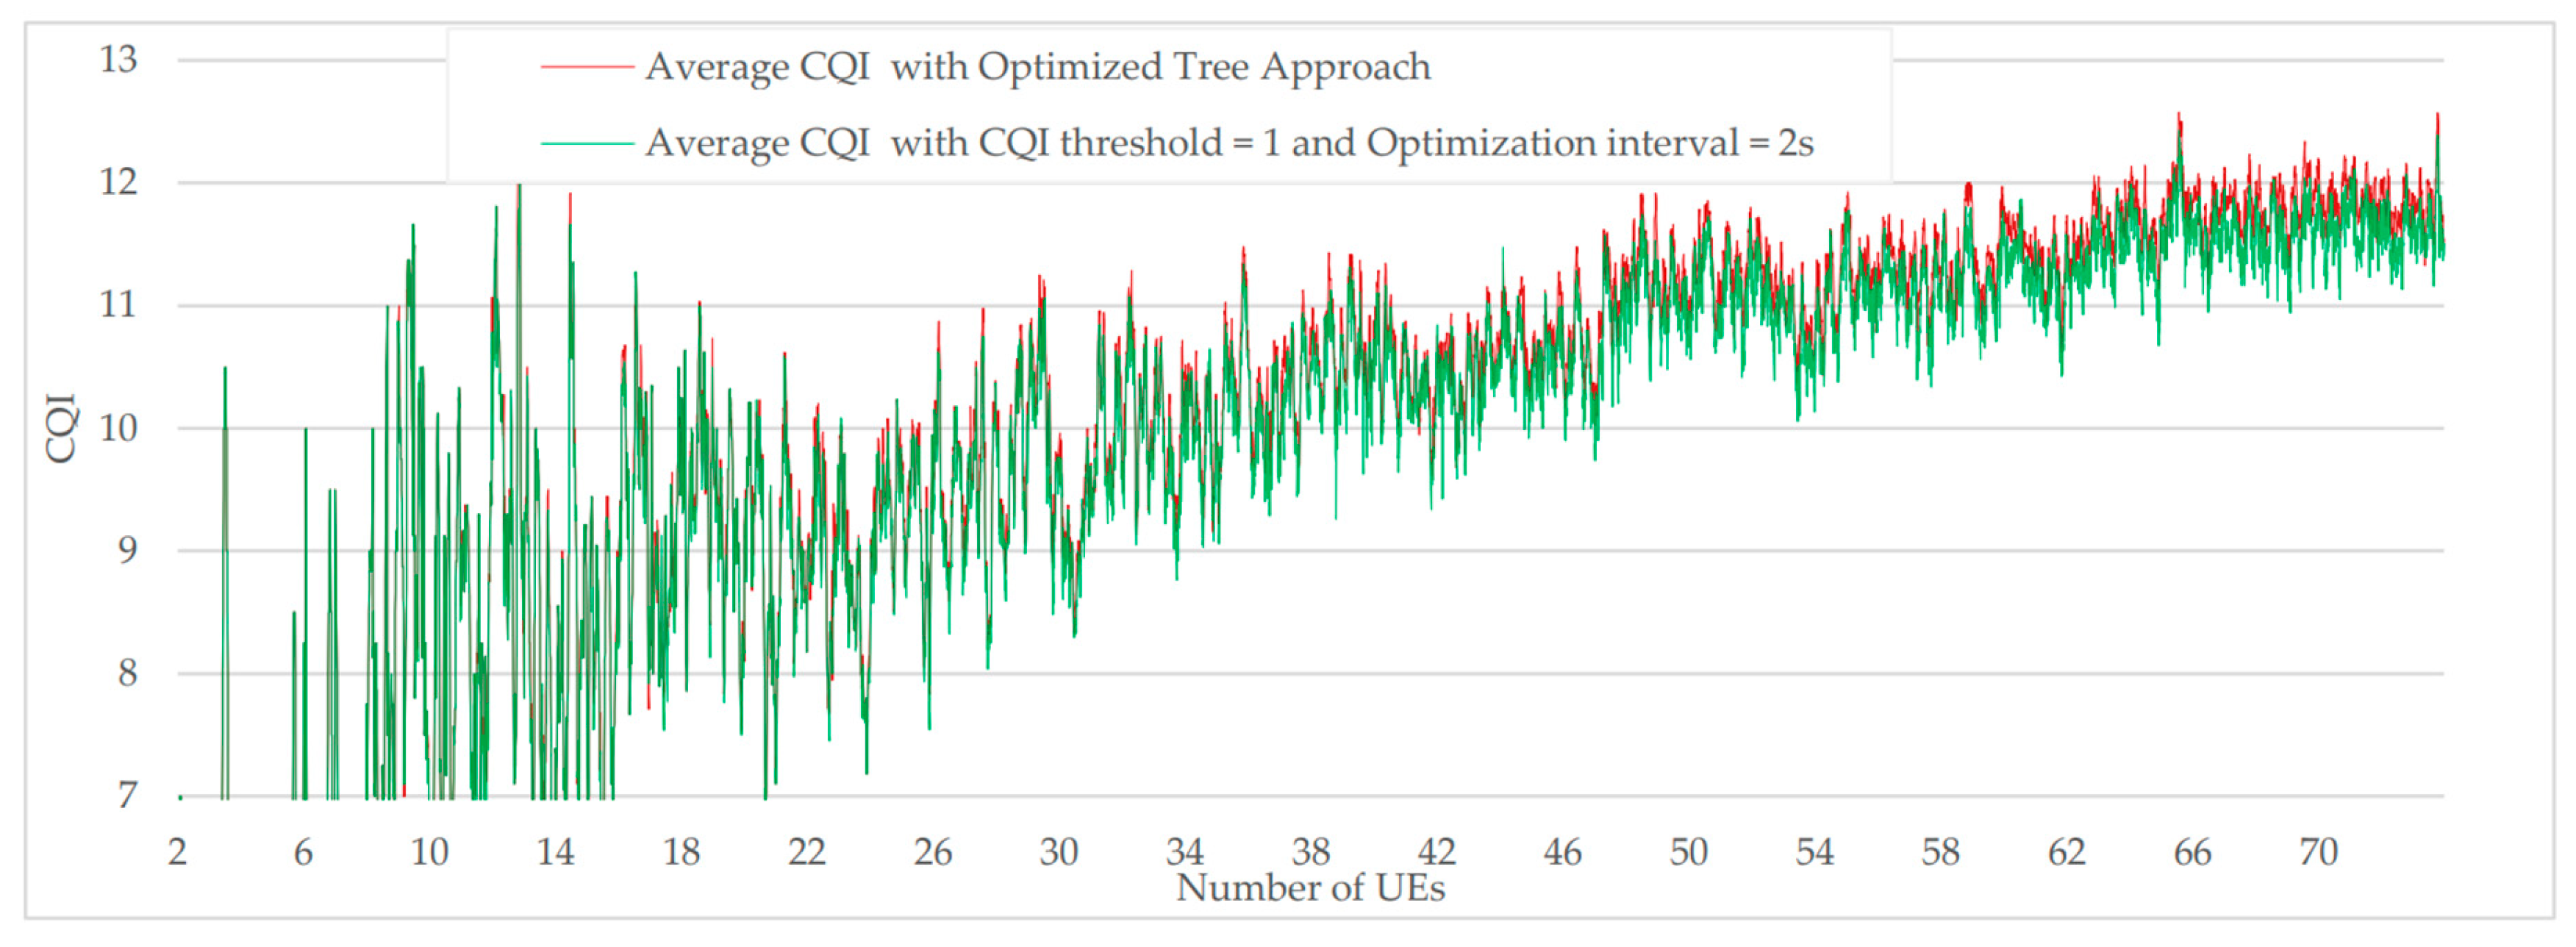
Figure 22.
Number of network updates comparison between “optimized tree” approach and customized approach (CQI threshold = 1 and optimized interval = 2s).
Figure 22.
Number of network updates comparison between “optimized tree” approach and customized approach (CQI threshold = 1 and optimized interval = 2s).
Disclaimer/Publisher’s Note: The statements, opinions and data contained in all publications are solely those of the individual author(s) and contributor(s) and not of MDPI and/or the editor(s). MDPI and/or the editor(s) disclaim responsibility for any injury to people or property resulting from any ideas, methods, instructions or products referred to in the content. |
© 2023 by the authors. Licensee MDPI, Basel, Switzerland. This article is an open access article distributed under the terms and conditions of the Creative Commons Attribution (CC BY) license (http://creativecommons.org/licenses/by/4.0/).
Copyright: This open access article is published under a Creative Commons CC BY 4.0 license, which permit the free download, distribution, and reuse, provided that the author and preprint are cited in any reuse.


