Submitted:
27 November 2023
Posted:
28 November 2023
You are already at the latest version
Abstract
The biological conservation measures factor (B) in the Chinese Soil loss Equation (CSLE) model is one of the main components in evaluating soil erosion, and the accurate calculation of B factor at the regional scale is fundamental in predicting regional soil erosion and the dynamic changes. In this study, we developed an optimal computational procedure for estimating and mapping the B factor in the Google Earth Engine (GEE) cloud computing environment using multiple data sources through data suitability assessment and image fusion. Taking the Yanhe River Basin in the Loess Plateau of China as an example, we evaluated the availability of daily precipitation data (CHIRPS, ERA5, and PERSIANN-CDR data) against the data at national meteorological stations. We estimated the B factor from Sentinel-2 data and proposed a new method, namely trend migration method, to patch the missing values in Sentinel-2 data using three other remote sensing data (MOD09GA, Landsat-7, Landsat-8). We then calculated and mapped the B-factor in Yanhe River Basin based on rainfall erosivity, vegetation coverage, and land use types. The results show that the ERA5 precipitation dataset outperforms the CHIRPS and PERSIANN-CDR data in estimating rainfall erosivity and rainfall, and it can be utilized as an alternative data source for meteorological stations in soil erosion modeling. Compared to the harmonic analysis of time series (HANTS), the trend migration method proposed in this study is more suitable for patching the missing parts of Sentinel-2 data. The restored high-resolution Sentinel-2 data fit nicely with the 10-m resolution land use data, enhancing the B factor calculation accuracy from the region to the spot level. The B factor computation procedure developed in this study is applicable to various river basin and regional scales for regional soil erosion monitoring.
Keywords:
B-factor
; CSLE
; google earth engine
; soil erosion
; data patching
1. Introduction
Soil erosion is one of the most serious environmental issues in the world, it not only causes soil degradation but also poses threats to agricultural production and food security [1,2,3]. Dynamic monitoring of soil erosion based on remote sensing data and GIS technology can provide important data support for assessing soil erosion conditions and developing soil and water conservation measures [4]. So far the most widely applied and accepted empirical models are Universal Soil Loss Equation (USLE) and its revised version (RUSLE), which are used to predict soil erosion rates at regional and global scales [5,6]. Based on USLE, the Chinese Soil Loss Equation (CSLE) was developed with the consideration of soil and water conservation measures, which is simple in structure and has stronger applicability in China [7,8]. The CSLE model describes the main features of the erosion process based on natural and anthropogenic environmental components, and one of the key components is the vegetation cover and biological conservation measures factor (or the B factor).
The B factor refers to the ratio of the amount of soil loss on slopes covered with vegetation to that on fallow land under the same conditions (including rainfall, soil, slope, slope length, engineering measures and tillage measures) [7,9]. The B factor is influenced by erosive rainfall during the growing season and the vegetation cover. Seasonal changes in vegetation, vertical vegetation structure, and land cover all influence on the value of the B factor to varying degrees, and obtaining the structured and time-series vegetation data is difficult, making the accurate estimation of the B factor a challenging task.
Same as the cover and management factor (C) in RUSLE, rainfall erosivity is used a weighting factor to subdivide the B factor to a certain period (normally half-monthly). Rainfall data is fundamental for the B factor computing as rainfall significantly affects the dynamic of the B factor as rainfall varies in time and space, causing temporal instability and uneven spatial distribution [10,11]. Rainfall data is obtainable from ground meteorological observation stations, but the spatial distribution of meteorological stations is often uneven and sparse in remote areas, resulting in a substantial number of missing values [12,13]. Grid-based high temporal and spatial resolution large-scale rainfall products have been developed and employed for soil erosion model computation in recent years. However, the usefulness of multiple grid rainfall products in soil erosion modelling remains unknown, consequently, determining the quality and application of different rainfall datasets in soil erosion modelling is crucial.
As an important indicator of surface vegetation condition and regional ecosystems, fractional vegetation cover (FVC) is important in estimating the B factor [14]. Many studies have been undertaken over the last few decades on the monitoring and assessment of FVC using remote sensing satellites and low-altitude unmanned aerial vehicle (UAV) technologies [15,16]. The majority of remote sensing satellite data are derived from low-resolution satellite sensors such as MODIS, which are typically used for large-scale vegetation cover estimation and have poor accuracy. Although low-altitude UAVs have improved data accuracy to some extent, their coverage is limited and cannot meet the requirements for large-scale vegetation cover estimation. As a result, integrating remote sensing imaging at various scales, improving data resolution, and applying it to the B factor monitoring remains a research challenge.
Google Earth Engine (GEE) is a big data platform that aggregates nearly 40 years of huge global remote sensing imagery data, and it has received significant attention from academics recently [17]. The fundamental advantage of GEE is its remarkable computational power, which enables it to process and analyze data without downloading it, considerably enhancing the efficiency of data processing and analysis. It offers a practical method for conducting extensive regional research, therefore provides a reliable way for the dynamic monitoring of regional B factor [18].
In this study, the Yanhe River Basin is chosen as the study area. We assessed the availability and suitability of three daily rainfall datasets in estimating rainfall erosivity in the GEE cloud platform. We estimated NDVI and FVC from Sentinel-2 and the missing values were filled using other remote sensing data. With these high-precision estimation of regional rainfall and vegetation cover, we proposed and implemented a method for evaluating and mapping the B factor in the GEE cloud computing environment, in conjunction with land use types.
2. Study area
The study area is located in the Yanhe River Basin, in the northern part of Shaanxi Province, with geographical coordinates ranging from 36°23' to 37°17' N and 108°45' to 110°28' E. This basin is a primary tributary of the middle reaches of the Yellow River, spanning from Huokou Town to Longmen District (Figure 1). The Yanhe River has a total length of 286.9 km, covering a watershed area of 7,687 km2. This basin is within the continental semi-arid monsoon climate zone and influenced by seasonal monsoons throughout the year. The annual average temperature is 8.8°C, with an average annual rainfall of 520 mm, primarily concentrated from June to September, accounting for over 70% of the total annual amount. The climate and temperature in the basin vary dramatically from southeast to northwest. The topography is complex, characterized by numerous gullies and ravines, represents a typical loess hilly and gully region on the Loess Plateau. Vegetation distribution in the area exhibits distinct zonality [19]. The vegetation types change from forested areas to forest-grassland areas and then to typical grassland areas from the southeast to the northwest.
3. Materials and methods
3.1. Data sources
The rainfall remote sensing datasets (CHIRPS, ERA5, PERSIANN-CDR), land use data (WorldCover 10m, 2020), and surface reflectance remote sensing data (MOD09GA, Landsat 7, Landsat 8, Sentinel-2) were sourced from the GEE cloud platform. The ground station data was obtained from China's national-level ground meteorological station basic meteorological element daily value dataset (V3.0). The vector boundary data for the Yanhe River Basin was acquired from the Earth System Science Data Center of the Loess Plateau Division (https://www.loess.geodata.cn).
3.1.1. Rainfall data
The rainfall datasets used in this study include CHIRPS, ERA5 and PERSIANN-CDR, all of which are available on the GEE platform. CHIRPS is a global grid rainfall dataset with a high resolution that combines 0.05° resolution satellite imagery with in-situ site data to create a gridded rainfall time series that records daily rainfall data from 1981 to the present. PERSIANN-CDR is the precipitation estimation from remotely sensed information using artificial neural networks, which is developed using the PERSIANN algorithm on GridSat-B1 infrared satellite data, and provides daily rainfall estimates at a spatial resolution of 0.25° from 1983 to the near-present (Ashouri et al., 2015). The ERA5 data is the fifth generation of climate reanalysis datasets produced by the European Centre for Medium-Range Weather Forecasts (ECMWF), and it provides multi-parameter hourly data on the status of the atmosphere, land surface and oceans. The data accessibility of the three rainfall datasets listed above was evaluated using daily values of basic meteorological elements (V3.0) from national surface weather stations of China.
3.1.2. Land use data
The land use data utilized in this study is the ESA WorldCover v100, a product of the European Space Agency (ESA) based on Sentinel-1 and Sentinel-2 imaging data. This global land use cover product is part of ESA's Fifth Earth Observation Envelope Programme (EOEP-5), with a resolution of 10 m. WorldCover products provide 11 land cover categories, and the data has been independently validated to obtain an overall accuracy of 75% worldwide. The land use types in Yanhe River Basin include forest land, shrub land, grassland, cultivated land, building land, water body, wetland and unused land (Figure 2), and the proportion of each land use type is shown in Table 1.
3.1.3. Remote sensing data
The surface reflectance remote sensing data products used in this study include MOD09GA, LandSat7, LandSat8, Sentinel-2 (Table 2). MOD09GA is a surface spectral reflectance product obtained by the Terra Moderate Resolution Imaging Spectroradiometer (MODIS), which provides Bands 1-7, including 500-meter surface reflectance values, and including 500-meter reflectance values and 1-kilometer observation and geolocation statistics. Landsat 7 ETM+ (the enhanced thematic Mapper) data consists of eight bands, bands 1–5 and 7 have a spatial resolution of 30 m, band 6 has a spatial resolution of 60 m, and band 8 has a spatial resolution of 15 m. Landsat 8 Operational Land Imager (OLI) data product consists of 9 bands with a spatial resolution of 30 m, including a panchromatic band of 15 m. Sentinel-2 was launched on March 7, 2017 by the European Space Agency and it provides 13 operating bands ranging from visible to short-wave infrared wavelengths.
3.2. Technological procedure
The B factor of the Yan River Basin was calculated in the GEE cloud computing environment using Python coding. The specific processing steps were as follows:
(1) The applicability of three gridded daily precipitation datasets CHIRPS, ERA5 and PERSIANN-CDR in GEE for the Yan River Basin was assessed against the data from national meteorological stations. The dataset that demonstrated the highest suitability was chosen to calculate rainfall erosivity and its proportion.
(2) MOD09GA, Sentinel-2, Landsat 8, and Landsat imagery data were obtained and preprocessed, and the missing areas in the Sentinel-2 data were then identified.
(3) The normalized difference vegetation index (NDVI) was computed separately for each of these four datasets. The missing NDVI data in Sentinel-2 were patched using NDVI calculated from MOD09GA, Landsat 8, and Landsat 7.
(4) The patched NDVI data were analyzed using the pixel binary method to determine the average vegetation coverage (FVC) for 24 half-months over three years.
(5) Based on the average FVC of the 24 half-months, the B factor was assessed by considering land use types and the proportion of rainfall erosivity factors during this period (Figure 3).
3.3. Image processing
MOD09GA, Sentinel-2, Landsat 8, and Landsat 7 data from 2019-2021 were used to calculate NDVI in this study. The total number of effective images for the four products in the Yanhe River Basin was 1096, 749, 133, and 155, respectively, and the data missing rates were 0%, 5%, 20%, and 27%, with a screening condition of less than 20% cloud cover (Table 3). Since Sentinel-2 have the highest coverage and resolution in the entire research region, it was chosen to compute the B factor in the Yanhe River basin. Due to the data missing in the 7th and 19th half- months, Sentinel-2 images were patched before the NDVI computing. The NDVI was calculated as follows:
where NIR represents the near-infrared band and RED represents the red band of the respective remote sensing images.
In terms of spatial distribution and time series, Sentinel-2 data is highly consistent with MOD09GA, Landsat8, and Landsat7 data. Therefore, MOD09GA, Landsat8, and Landsat7 remote sensing images were used to patch the missing data in the Sentinel-2 imagery. Figure 4 demonstrates that the average NDVI variance among the four groups of images have a highly consistent trend throughout the 24 half-monthly time series. By analyzing the correlation of each two groups of data in the time series, it is found that the correlation of each two groups of data in the time series is above 0.96. Furthermore, the NDVI values for the four datasets from 2019 to 2021 were synthesized by the maximum synthesis method, and the correlation of the four datasets was obtained by using the Pearsons Correlation function. The heatmap of Pearson correlation coefficient matrix shows that the spatial relationships between Sentinel-2 imagery and Landsat 7 and 8, and MOD09GA data were fitted, with all correlation coefficients exceeded 0.5 (Figure 5).
There are several methods available for data patching, which can be broadly categorized into two types. The first type is spatial interpolation, which is useful for filling small-scale missing data but has ineffective for large-scale data gaps. The second type is linear/non-linear interpolation in the time series. Linear interpolation methods, such as the best index slope extraction (BISE) method [19], using a sliding window approach to identify and replace missing values in a series. However, determining the optimal window size is challenging, and it has limited applicability to capture the non-linear patterns of real-world imagery. Non-linear interpolation methods, such as the Savitzky-Golay (S-G) filtering method, asymmetric Gaussian (AG) model filtering method [20], and harmonic analysis of time series (HANTS) method [21], have more complex calculations and often suffer from overfitting, resulting in data value distortion. Based on these concerns, this study proposed a trend migration method, a new approach for repairing missing data based on the rate of change in remote sensing imagery over a time and the surrounding raster values in the time series of the missing values. The HANTS approach, which is commonly used for time series analysis, is also utilized for comparative analysis. The formula of the trend migration is as follows:
Where, Si-1 is the value of the Sentinel-2 data in the ith half-month, Di represents the corresponding values of an alternative dataset (i.e., MOD09GA, Landsat8 or Landsat7) that is in high temporal consistency with Sentinel-2 data on the time series for the same half-month.
The Sentinel-2 images after data patching, were used to calculate the NDVI for each half-month period from 2019 to 2021, resulting in a total of 24 half-month per year. Based on NDVI data, the pixel-based binary model was applied to compute the vegetation cover, and the average vegetation cover for the 24 half-months period over a period of three years was then derived. The formula for calculating FVC is as follows:
where FVC is vegetation coverage (for grassland, shrub land and forest land). NDVI is the pixel value of the normalized difference vegetation index, NDVImin and NDVImax are NDVI values of the pure vegetation cover pixel and the bare soil cover pixel, respectively.
3.4. Calculation of the B factor
The B factor was calculated by combining vegetation cover (FVC) data with the 10-m resolution land use types and the rainfall erosion factor proportions over one year in 24 half-monthly intervals. Specific formulas were used to calculate the B factor values for shrublands, forest land, and grasslands, while the remaining land use classifications were allocated B factor values directly based on land use types. (Table 4). The annual average value of the B factor was estimated based on the sum of soil loss ratio (SLRi) for each half month (1-24) in a year and multiple it by the rainfall erosivity ratio of the same half month as a weighting factor [22]. The formula is as follows:
where, WRi is the ration of rainfall erosivity in the ith half month to annual erosivity, with a value range of 0-1; SLRi is the soil loss ratio of forestland, shrubland and grassland in the ith half month, dimensionless, with a value range of 0-1.
For forestland, the SLRi is calculated as:
For shrubland, the SLRi is calculated as::
For grassland, the SLRi is calculated as:
where, GD is the understory coverage of the tree forest, with a value range of 0-1, including the understory coverage of all vegetation (shrubs, herbs, and litter) except for the tree canopy layer, based on field investigation or expert experience. FVC is vegetation coverage calculated as formula 3.
4. Result and discussion
4.1. Applicability of different rainfall datasets in the Yanhe River Basin
Multiple rainfall indices for the Yanhe River Basin from 1986 to 2015 were generated using three different daily rainfall datasets in the GEE platform (Table 3). The average annual erosive rainfall measured by meteorological stations was 283 mm, while the ERA5, GHIRPS, and PERSIANN-CDR datasets measured 288 mm, 332 mm, and 128 mm, respectively. The absolute errors between the three datasets and the meteorological stations were 5.17 mm, 49.24 mm, and -154.82 mm, respectively. The average annual rainfall erosivity calculated by meteorological station data was 1327 MJ····mm hm-2 h-1 a-1, whereas the mean annual rainfall erosivity values of the ERA5, GHIRPS and PERSIANN-CDR datasets were 1327, 1876, and 502 MJ····mm hm-2 h-1 a-1, respectively. The differences between them and meteorological stations were -105.23, 549.1, and -825.18 MJ····mm hm-2 h-1 a-1, respectively. The results reveal that the multi-year mean erosive rainfall, daily erosive rainfall and rainfall erosivity estimated from ERA5 dataset are the closest to those from the meteorological stations.

Table 5.
Comparisons of rainfall parameters from the national meteorological stations and the three daily rainfall datasets.
Table 5.
Comparisons of rainfall parameters from the national meteorological stations and the three daily rainfall datasets.
| Rainfall parameters | Meteorological station | ERA5 | CHIRPS | PERSIANN-CDR |
|---|---|---|---|---|
| Annual average rainfall (mm) | 467.01 | 569.89 | 480.94 | 455.08 |
| Average annual erosive rainfall (mm) | 282.54 | 287.71 | 331.78 | 127.72 |
| Multi-year average erosive rainfall days (mm / day) | 22.20 | 22.01 | 28.39 | 20.27 |
| Multi-year average number of days of erosive rainfall (day) | 11.67 | 13.07 | 11.69 | 6.30 |
| Multi-year average rainfall erosivity (MJ····mm hm-2 h-1 a-1) | 1327.15 | 1221.92 | 1876.25 | 501.97 |
Figure 6 depicts the fluctuation trend of annual average rainfall erosivity estimated from four independent rainfall datasets. The annual average rainfall erosivity of all four datasets peaked in 2013, with the ERA5 dataset having the closest peak value and variation trend to the meteorological station. The WR change trend of the three datasets and the meteorological station data is substantially the same, as shown in Figure 7. The variation curves of WR by meteorological station data and the ERA5 dataset created a bimodal distribution, with WR reaching peaks of 16.2% and 16.0%, respectively, in the 13th and 16th half months. The WR curves from the CHIRPS and PERSIANN-CDR datasets had a unipeak distribution and peaked at 18.9% and 18.1% both in the 15th half months. The WR trend in the ERA5 dataset is the most similar to meteorological station data.
When comparing the performance of the three datasets, PERSIANN-CDR exceeded the other two in average annual rainfall, but fell shorts in terms of the other parameters. The CHIRPS dataset overestimated values for average annual erosive rainfall, average erosive rainfall days, and average rainfall erosion force calculation, and had poor consistency with data from meteorological station in terms of WR. Although the resolution of ERA5 dataset was not the highest, it demonstrated extremely high consistency with the meteorological station data in terms of average erosive rainfall, average erosive rainfall days, average erosive rainfall duration, average rainfall erosion force, and WR trend. Therefore, the ERA5 dataset was chosen and utilized as the alternatives of meteorological station data to calculate and map the B-factor in the CSLE model.
4.2. The NDVI calculated by patched Sentinel-2 images
The NDVI of the Yanhe River Basin was calculated for 24 half-months using the raw Sentinel-2 images, the Sentinel-2 images with 20% filtered cloud cover, the Sentinel-2 images patched by the HANTS method, and the Sentinel-2 images patched by the trend migration method (Figure 8). Except for the missing data in the 7th and 19th half-month periods, the NDVI variation curves generated from the patched images essentially coincides with the variation curves of the raw images and the images with 20% filtered cloud cover, maximizing the retention of the original data. The NDVI values calculated from the Sentinel-2 images patched by the HANTS method and raw images might overfit and distort images, particularly in the 4th to 8th half-month periods, resulting in errors in time-series-based remote sensing studies, such as vegetation phenology research. Compared to the HANTS method, the trend migration method proposed in this study was more consistent with the original data, and more reliable in patching the missing data in the Sentinel-2 images.
The trend migration method was employed to patch the missing NDVI data from Sentinel-2 images in the Yanhe River Basin in the 7th and 19th half-months. Taking the 7th half-month as an example, when using raw Sentinel-2 images, there were visible cloud cover and localized anomalies in the NDVI images (Figure 9a). When using the Sentinel-2 images with 20% filtered cloud cover, the missing rate of NDVI images reached 56% (Figure 9b). By trend migration method, the missing parts were patched by MOD09GA, Landsat-7, and Landsat-8 images in the 7th half-month, the calculated NDVI image was more coordinated overall, and the average NDVI values in Yanhe River Basin changed from 0.22 before image patching to 0.23 after image patching (Figure 9c,d). Similarly, the average NDVI values changed from 0.51 to 0.53 in the 19th half-month after image patching (Figure 9e,f).
Figure 10 displays the results of NDVI calculated using Sentinel-2 images, MOD09GA images, Landsat-7 images, and Landsat-8 images. It revealed that the NDVI calculated from the patched Sentinel-2 data not only exhibited higher data integrity but also possessed the finest resolution of 10 m. The results imply that the method proposed in this study for patching Sentinel-2 images was simple, reliable, and high useful. The patched Sentinel-2 were compatible with the 10-m resolution land use data, which improved the accuracy of B-factor calculation from the region to the spot level.
4.3. Assessment of vegetation cover and biological measures B factor
The patched Sentinel-2 image were used to produce FVC at a spatial resolution of 10 m for all 24 half-monthly periods of a year (Figure 11). The average value of FVC increases first and then declines with time, according to the shifting trend. The average FVC was less than 0.1 before the 7th half-month (early Spring), while it increased dramatically after the 8th half-month (Spring), and peaking at 0.8 in the 16th half-month (early August). Following that, the mean value of FVC progressively decreased, eventually going below 0.1 at the 24th half-month (December).
The SLR was calculated based on FVC, and WR was calculated based on ERA5 data over a 24 half-monthly periods on GEE platform. We then calculated the B-factor of the Yanhe River Basin based on Equation (4), combined with land use types. Figure 12 depicts the spatial distribution of the B-factor in the Yanhe River Basin in 2020. Except for the agricultural land with a value of 1, high-value areas of the B-factor in the basin were concentrated along the river system due to human activities and the proximity of urban centers to water bodies, resulting in relatively low vegetation covering. Furthermore, in addition to places near water bodies, some high-value B-factor areas could be found in the northwest of the Yanhe River Basin, which was characterized by low-coverage grassland with weak development and sparse vegetation coverage, resulting in relatively high B-factor values. Low-value B-factor habitats, on the other hand, were mostly found in the forests and grasslands with high vegetation cover.
The average B-factor value in the entire Yanhe River Basin in 2020 was 0.19, which was slightly lower than the 0.22 average in the loess hilly-gully region in 2017 and 0.38 in 2010 calculated by Huang [23]. The Yanhe River Basin had relatively high overall vegetation coverage, with increasing trends in woods and grasslands and a continuous decrease in the cultivated land area, which had decreased by about 25% between 2010 and 2020 [24]. The improvement of vegetation structure and changes in land use types have both contributed to the overall declining trend of the B-factor. Compared to previous studies, our projected average B-factor value in this study appears more consistent and appropriate.
5. Conclusions
The applicability of ERA5, CHIRPS, and PERSIANN-CDR daily rainfall data in the Yanhe River Basin was evaluated using the precipitation data from national meteorological stations for the period 1985 to 2015 in GEE. The missing NDVI data in Sentinel-2 was patched by incorporating MOD09GA, Landsat-7, and Landsat-8 images. Automated process has been developed using Python codes for rainfall data assessment, image patching and processing, as well as FVC, WR, and SLR calculation, thereby enabling the assessment and mapping of the B-factor in the GEE cloud computing environment. We can draw these conclusions from this study:
(1) The ERA5 precipitation dataset exhibited strong agreement with meteorological station data across various metrics including average erosive rainfall, average erosive rainfall intensity, average rainfall erosivity, and WR over multiple years. It demonstrated better suitability for the Yanhe River Basin compared to the CHIRPS and PERSIANN-CDR datasets, making it a viable alternative for calculating rainfall erosivity in the absence of meteorological station data.
(2) This study proposed a new and simple method, the trend migration method, for patching Sentinel-2 data missing based on the rate of change of the image in time. Sentinel-2 modified by trend migration approach outperformed HANTS method in terms of data authenticity. The restored high-resolution Sentinel-2 data fit nicely with the 10-m resolution land use data, enhancing the B factor calculation accuracy from the region to the spot level.
(3) In the GEE environment, we developed a fully automated B-factor calculation procedure, and B-factor was assessed and mapped efficiently based on rainfall erosivity, soil loss rate, vegetation covering, and land use types in the Yanhe River Basin. The computation procedure is broadly applicable and can be extended to various river basins as well as wider regional scales, which provides data and technical supports for regional soil erosion monitoring.
Author Contributions
Conceptualization, H.S.; formal analysis, Y.W., H.S. and J.S.; funding acquisition, H.S. and X.Y.; methodology, X.Y., Y.W. and H.S.; data curation, Y.W., J.S. and L.L.; writing— original draft preparation, Y.W. and H.S.; writing—review and editing, X.Y., H.S., Y.W. and M.G. All authors have read and agreed to the published version of the manuscript.
Funding
This research was funded by the CAS “light of West China” program (XAB2020YN04), the National Natural Science Foundation of China (41501055), and the High-end Foreign Experts Recruitment Plan of China (G2022172016L).
Data Availability Statement
Not applicable.
Acknowledgments
We appreciate the assistance of the Google Earth Engine platform and its creators. We acknowledge the journal editor and the anonymous reviewers for their insightful criticisms and outstanding work on this research. We also acknowledge data support from “Loess plateau science data center, National Earth System Science Data Sharing Infrastructure, National Science & Technology Infrastructure of China (http://loess.geodata.cn)”.
Conflicts of Interest
The authors declare no conflict of interest.
References
- Leng, S.Y.; Feng, R.G.; Li, R. Key Research Issues of Soil Erosion and Conservation in China. Journal of Soil and Water Conservation 2004, 18, 1–6. [Google Scholar]
- Shi, P.J.; Liu, B.Y.; Zhang, K.L.; Jin, Z. Soil Erosion Process and Model Studies. Resources Science 1999, 21, 9–18. [Google Scholar]
- Li, Z.; Zhu, B.; Li, P. Advancement in Study on Soil Erosion and Soil and Water Conservation. Acta Pedologica Sinica 2008, 45, 802–809. [Google Scholar]
- Cai, Q.; Liu, J. Evolution of Soil Erosion Models in China. PROGRESS IN GEOGRAPHY 2003, 22, 242–250. [Google Scholar]
- Fu, B.; Liu, Y.; Lü, Y.; He, C.; Zeng, Y.; Wu, B. Assessing the Soil Erosion Control Service of Ecosystems Change in the Loess Plateau of China. Ecological Complexity 2011, 8, 284–293. [Google Scholar] [CrossRef]
- Lin, J.; Guan, Q.; Tian, J.; Wang, Q.; Tan, Z.; Li, Z.; Wang, N. Assessing Temporal Trends of Soil Erosion and Sediment Redistribution in the Hexi Corridor Region Using the Integrated RUSLE-TLSD Model. CATENA 2020, 195, 104756. [Google Scholar] [CrossRef]
- Liu, B.; Zhang, K.; Xie, Y. An Empirical Soil Loss Equation. In Proceedings of the Proceedings of the 12th International Soil Conservation Organization Conference, Beijing, China; 2002; pp. 26–31. [Google Scholar]
- Shi, W.; Huang, M.; Barbour, S.L. Storm-Based CSLE That Incorporates the Estimated Runoff for Soil Loss Prediction on the Chinese Loess Plateau. Soil and Tillage Research 2018, 180, 137–147. [Google Scholar]
- Yin, S.; Zhu, Z.; Wang, L.; Liu, B.; Xie, Y.; Wang, G.; Li, Y. Regional Soil Erosion Assessment Based on a Sample Survey and Geostatistics. Hydrol. Earth Syst. Sci. 2018, 22, 1695–1712. [Google Scholar] [CrossRef]
- Xu, Y.; Ding, Y.; Zhao, Z. Confidence Analysis of NCEP/NCAR 50-Year Global Reanalyzed Data in Climate Change Research in China. yyqxxb 2001, 12, 337–347. [Google Scholar]
- Zhao, T.; Ai, L.; Feng, J.M. An Intercomparison between NCEP Reanalysis and Observed Data over China. Climatic and Environmental Research 2004, 9, 278–294. [Google Scholar]
- Wang, Z.; Zhong, R.; Chen, J.; Huang, W. Evaluation of Drought Utility Assessment of TMPA Satellite-Remote-Sensing-Based Precipitation Product in Mainland China. Transactions of the Chinese Society of Agricultural Engineering 2017, 33, 163–170. [Google Scholar]
- Cai, Y.; Jin, C.; Wang, A.; Guan, D.; Wu, J.; Yuan, F.; Xu, L. Comprehensive Precipitation Evaluation of TRMM 3B42 with Dense Rain Gauge Networks in a Mid-Latitude Basin, Northeast, China. Theor Appl Climatol 2016, 126, 659–671. [Google Scholar] [CrossRef]
- Liu, H.; Zhang, M.; Lin, Z.; Xu, X. Spatial Heterogeneity of the Relationship between Vegetation Dynamics and Climate Change and Their Driving Forces at Multiple Time Scales in Southwest China. Agricultural and Forest Meteorology 2018, 256–257, 10–21. [Google Scholar] [CrossRef]
- Li, M.; Zhang, Y. Temporal and spatial variation characteristics and influencing factors of vegetation cover in the middle Yellow River Basin. Journal of Guizhou Normal University(Natural Sciences) 2023, 41, 10–20+40. [Google Scholar]
- Jiang, W.; Yuan, L.; Wang, W.; Cao, R.; Zhang, Y.; Shen, W. Spatio-Temporal Analysis of Vegetation Variation in the Yellow River Basin. Ecological Indicators 2015, 51, 117–126. [Google Scholar] [CrossRef]
- Gorelick, N.; Hancher, M.; Dixon, M.; Ilyushchenko, S.; Thau, D.; Moore, R. Google Earth Engine: Planetary-Scale Geospatial Analysis for Everyone. Remote Sensing of Environment 2017, 202, 18–27. [Google Scholar] [CrossRef]
- Zhang, B. Remotely Sensed Big Data Era and Intelligent Information Extraction. Geomatics and Information Science of Wuhan University 2018, 43, 1861–1871. [Google Scholar] [CrossRef]
- Wen, Z.; Jiao, F.; Jiao, J. Prediction and mapping of potential vegetation distribution in Yanhe River catchment in hilly area of Loess Plateau. Chinese Journal of Applied Ecology 2008, 1897–1904. [Google Scholar]
- Roerink, G.J.; Menenti, M.; Verhoef, W. Reconstructing Cloudfree NDVI Composites Using Fourier Analysis of Time Series. International Journal of Remote Sensing 2000, 21, 1911–1917. [Google Scholar] [CrossRef]
- Zhou, J.; Jia, L.; Menenti, M. Reconstruction of Global MODIS NDVI Time Series: Performance of Harmonic ANalysis of Time Series (HANTS). Remote Sensing of Environment 2015, 163, 217–228. [Google Scholar] [CrossRef]
- Liu, B.; Guo, S.; Li, Z.; Xie, Y.; Zhang, K.; Liu, X. Chinese Hydraulic Erosion Sampling Survey. Soil and Water Conservation in China 2013, 26–34. [Google Scholar] [CrossRef]
- Huang, C. Study on the Spatiotemporal Variation of Soil Erosion in the Loess Plateau over the Past 40 Years and Its Controlling Factors. Doctor, Northwest University, 2021.
- Yang, S.; Quan, Q.; Xu, J.; Zhang, F.; Liu, T. Water Conservation Function in the Process of Land Use Change in Yanhe River Basin. Soil and Water Conservation in China 2022, 33–36. [Google Scholar]
Figure 1.
Geographical location of the Yanhe River Basin.
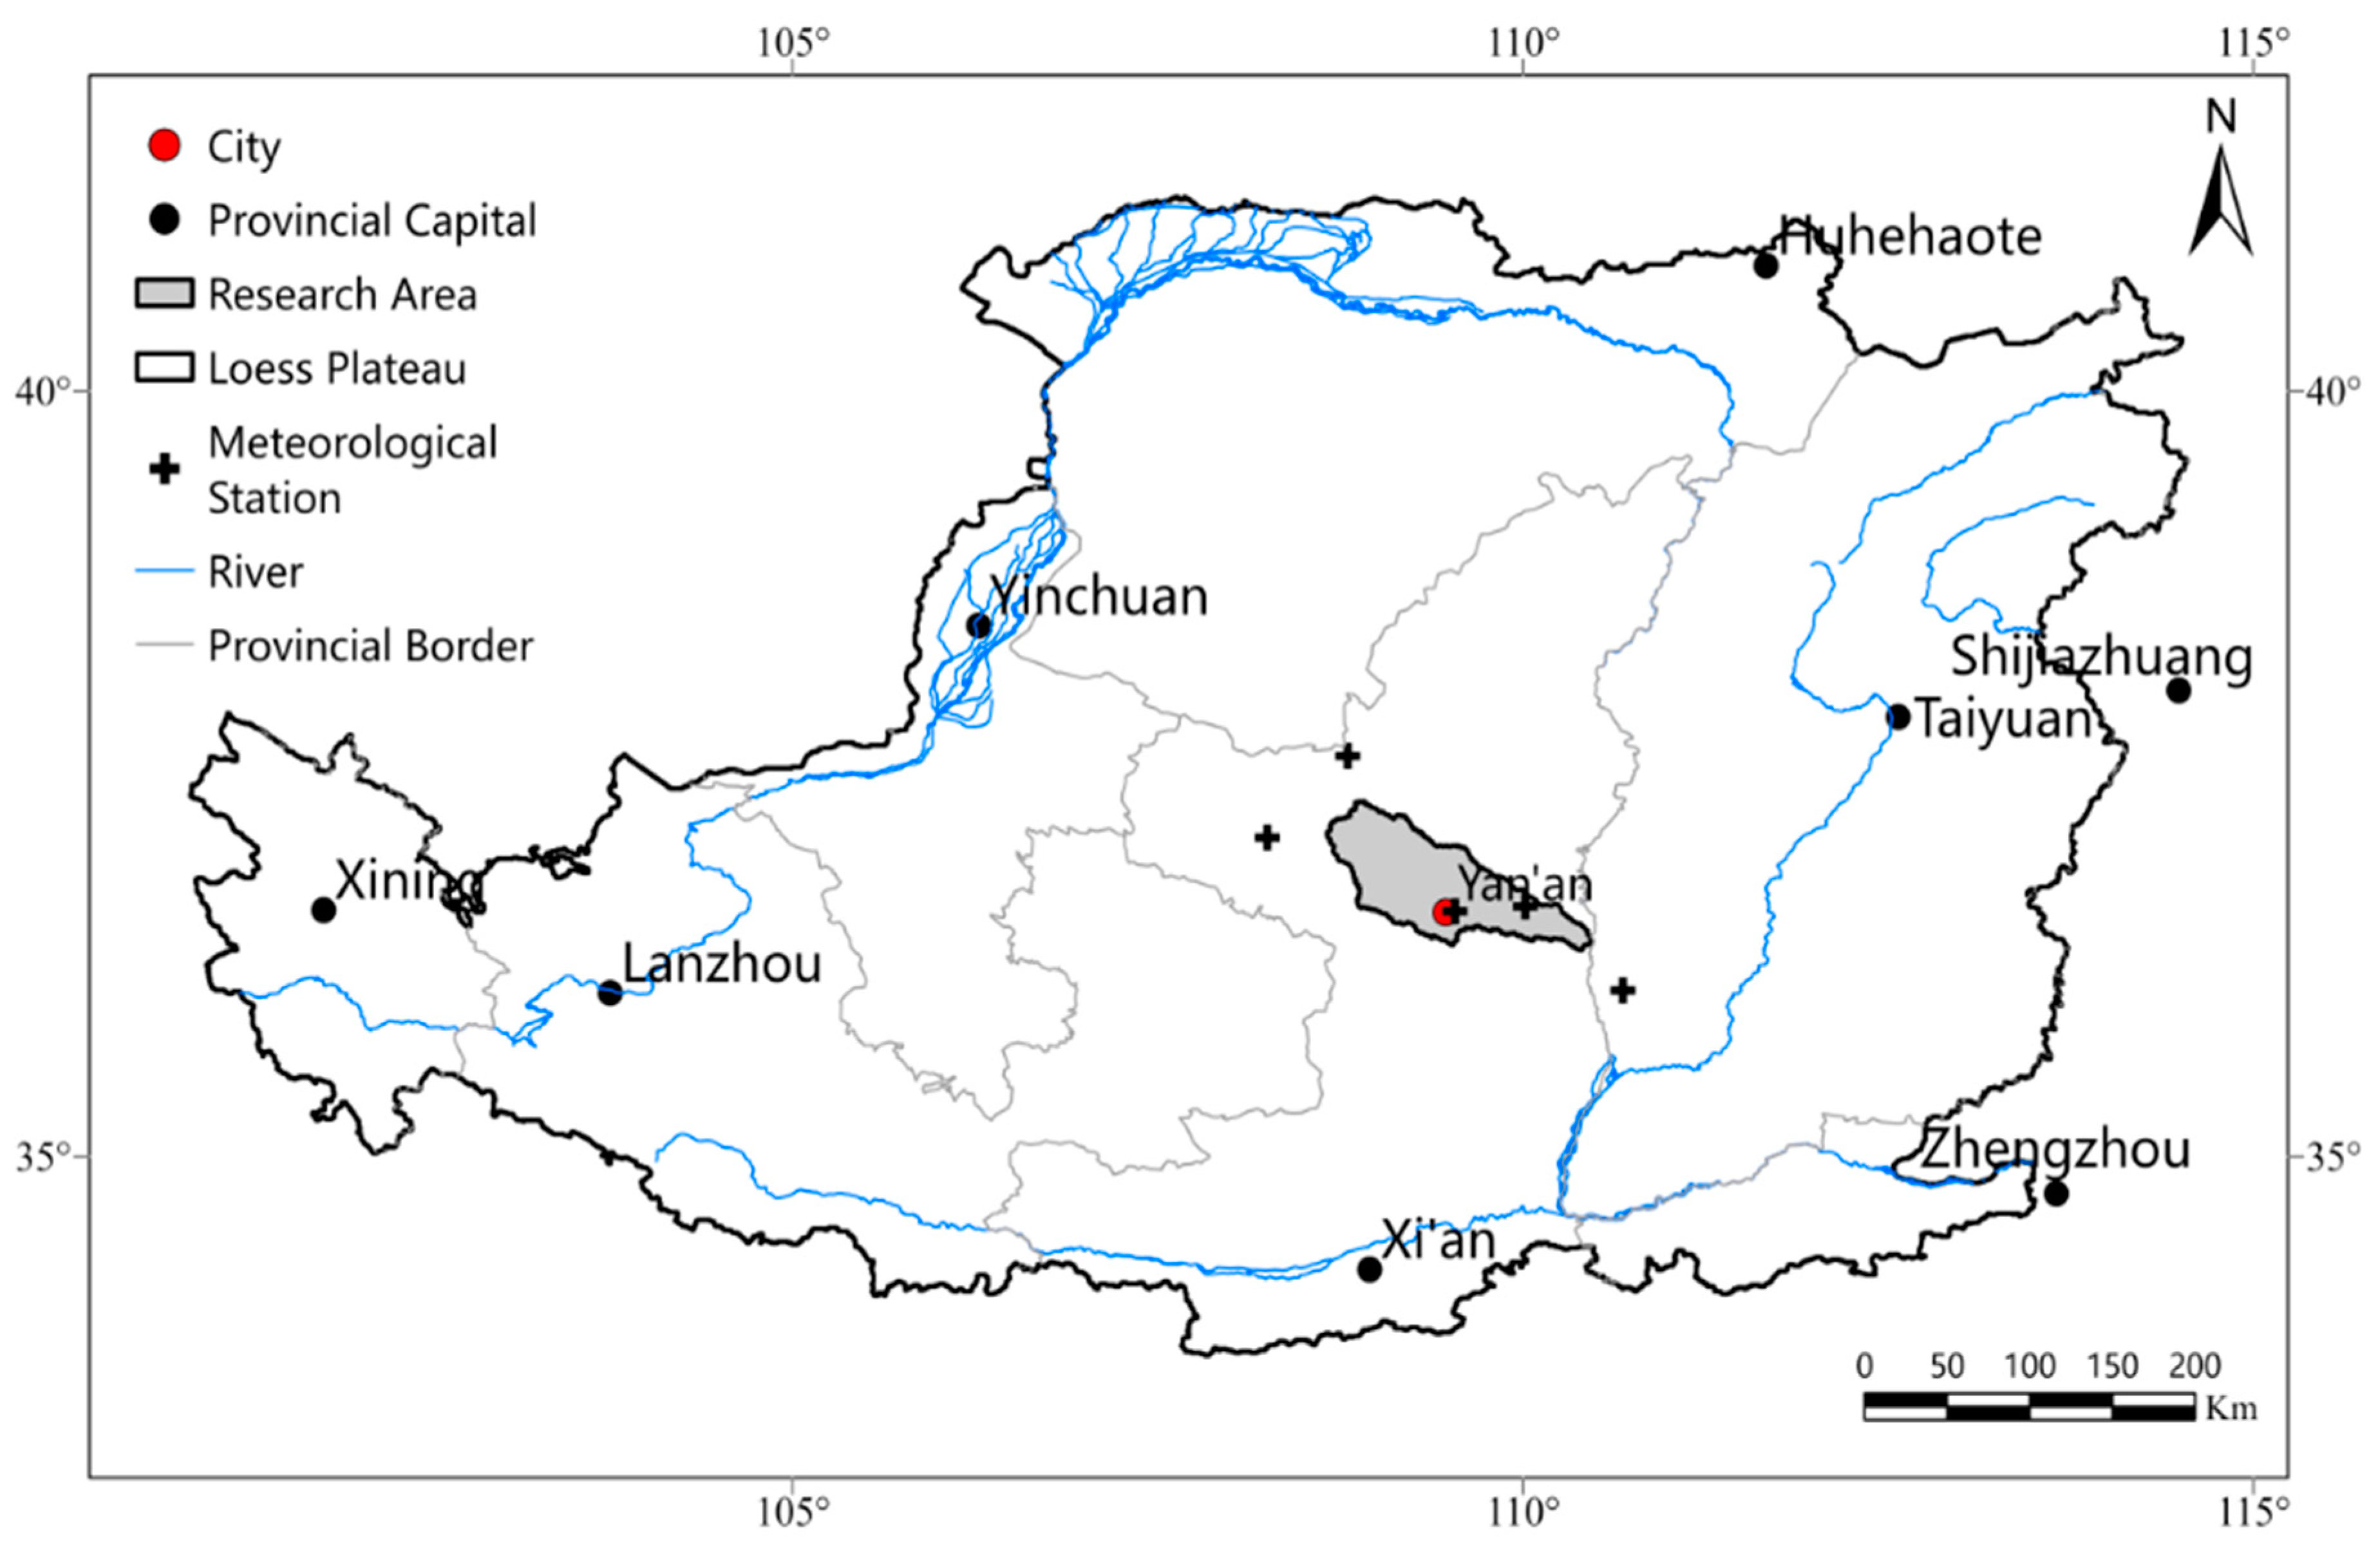
Figure 2.
Land use types in Yanhe River Basin.
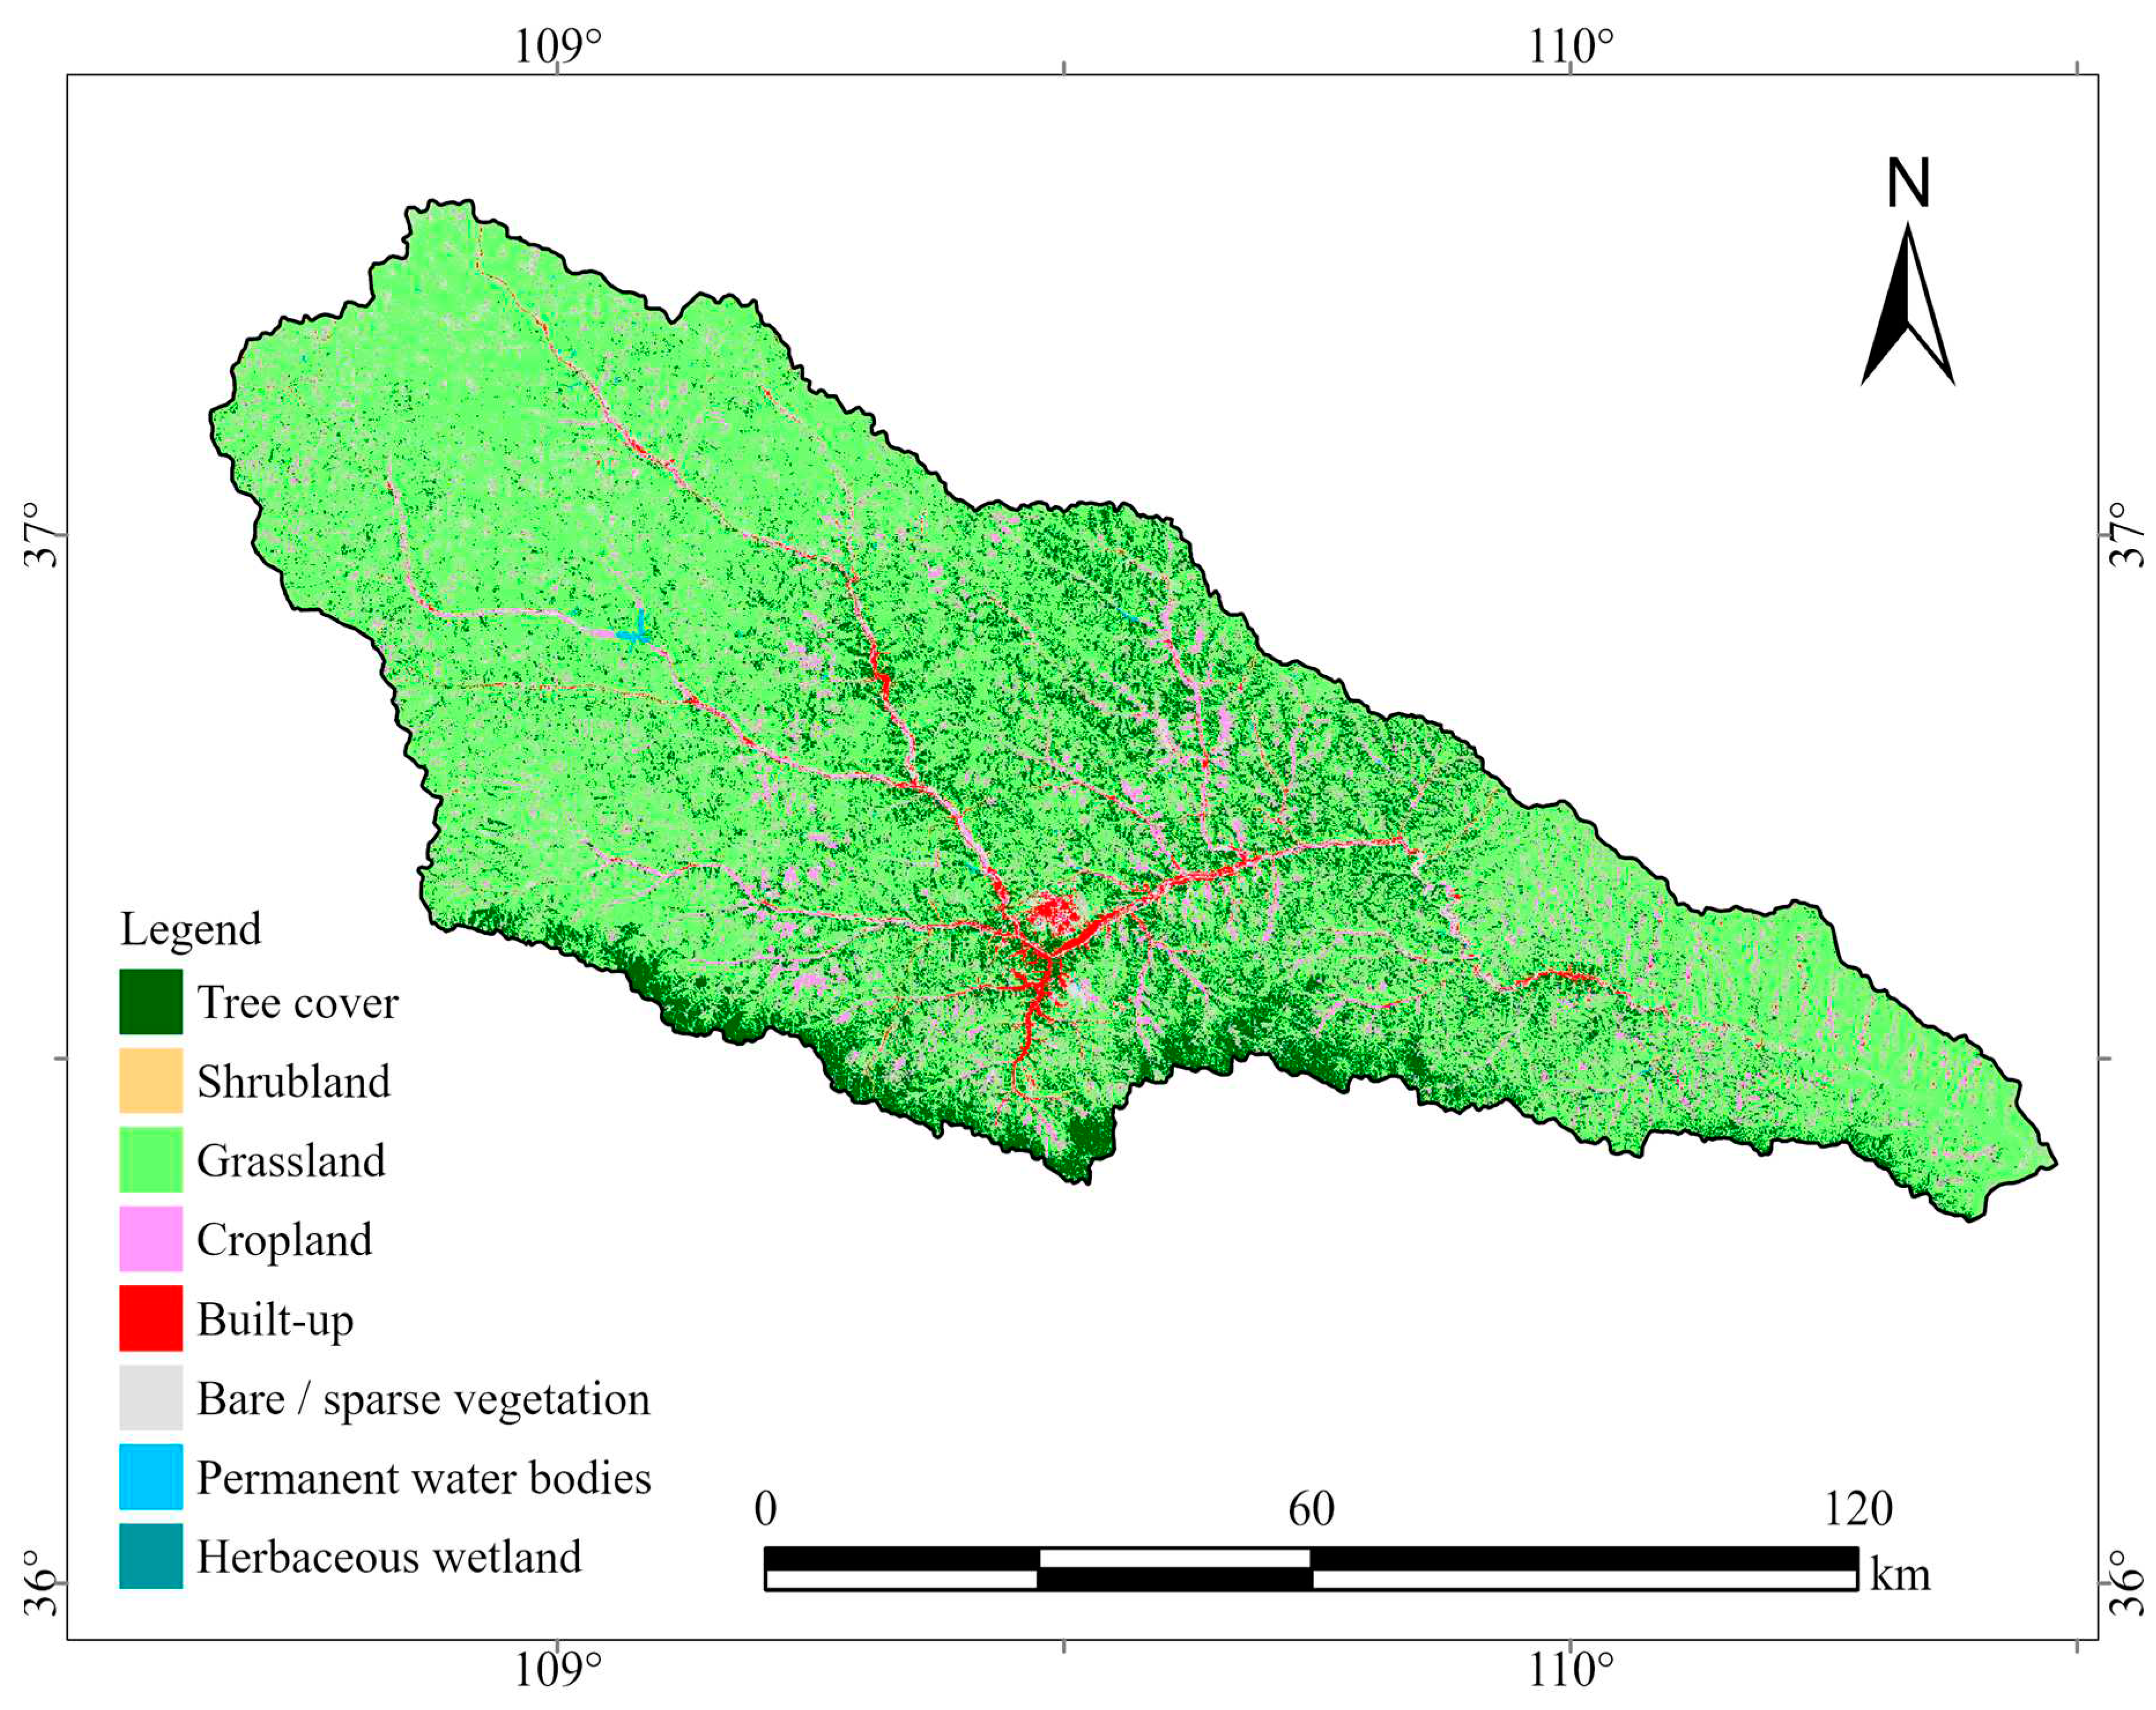
Figure 3.
Flowchart of the data processing in GEE environment.
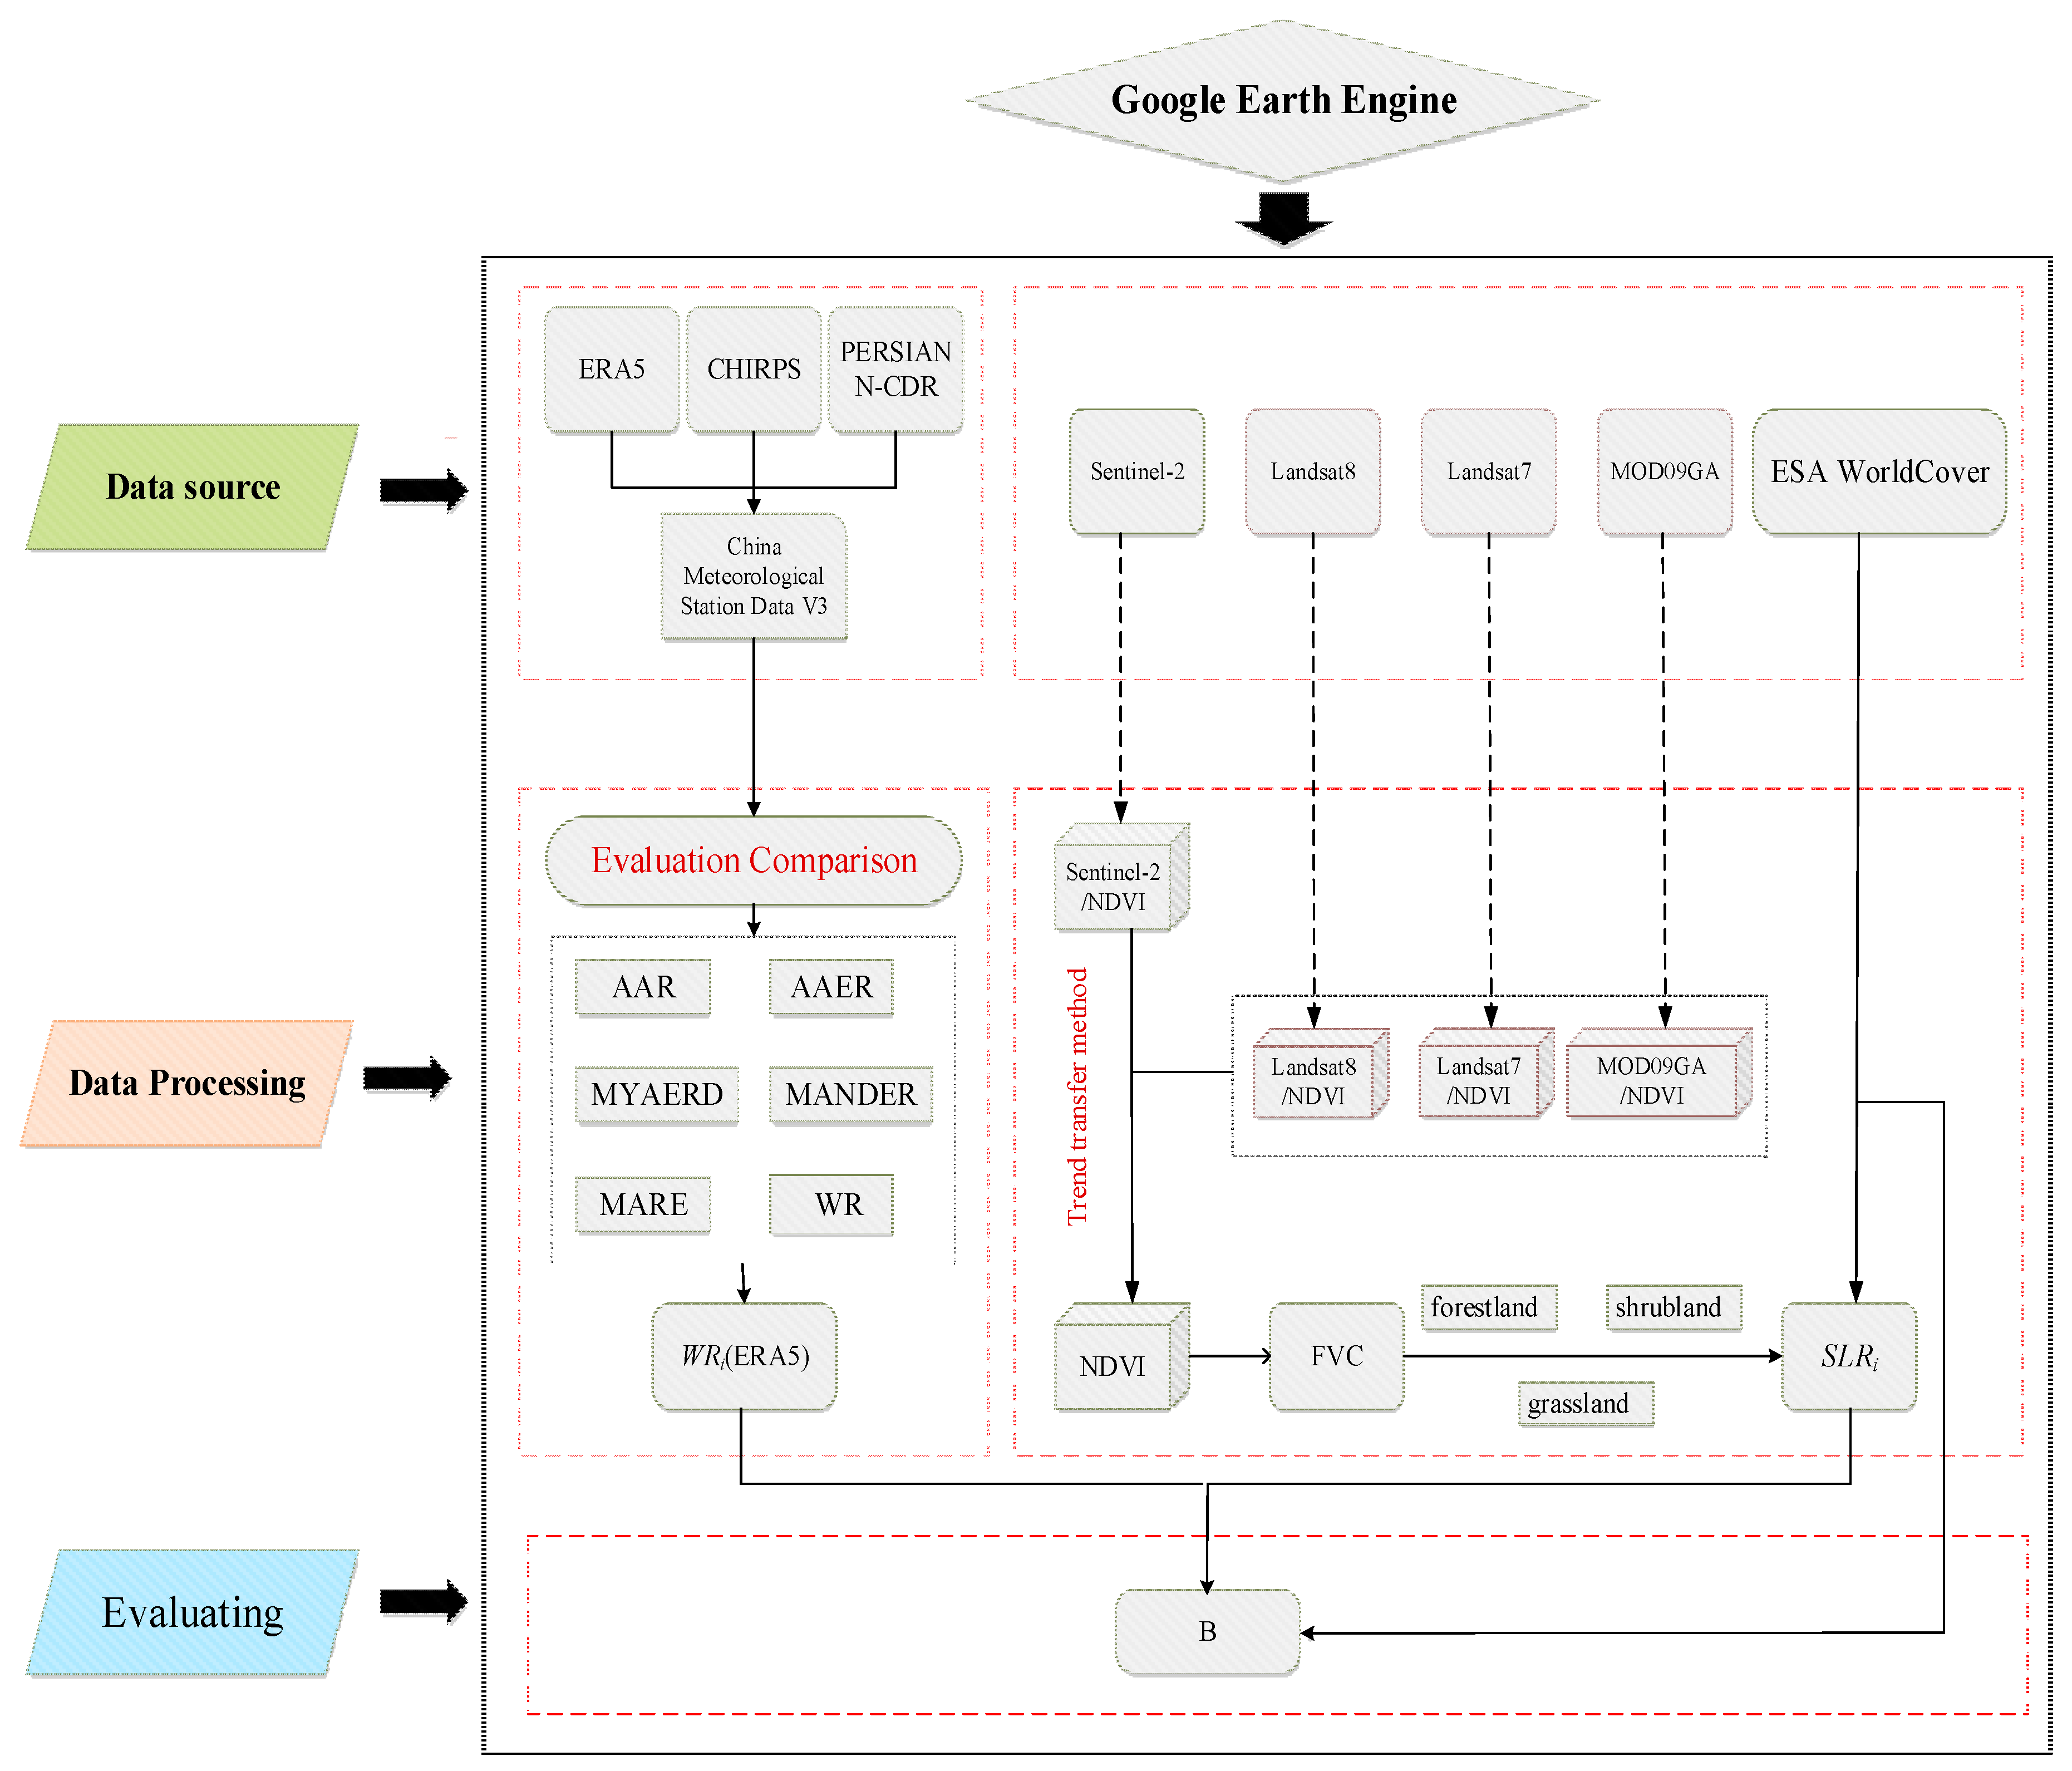
Figure 4.
The seasonal changes of NDVI values derived from MOD09GA, Sentinel-2, Landsat 8, and Landsat 7 image data.
Figure 4.
The seasonal changes of NDVI values derived from MOD09GA, Sentinel-2, Landsat 8, and Landsat 7 image data.
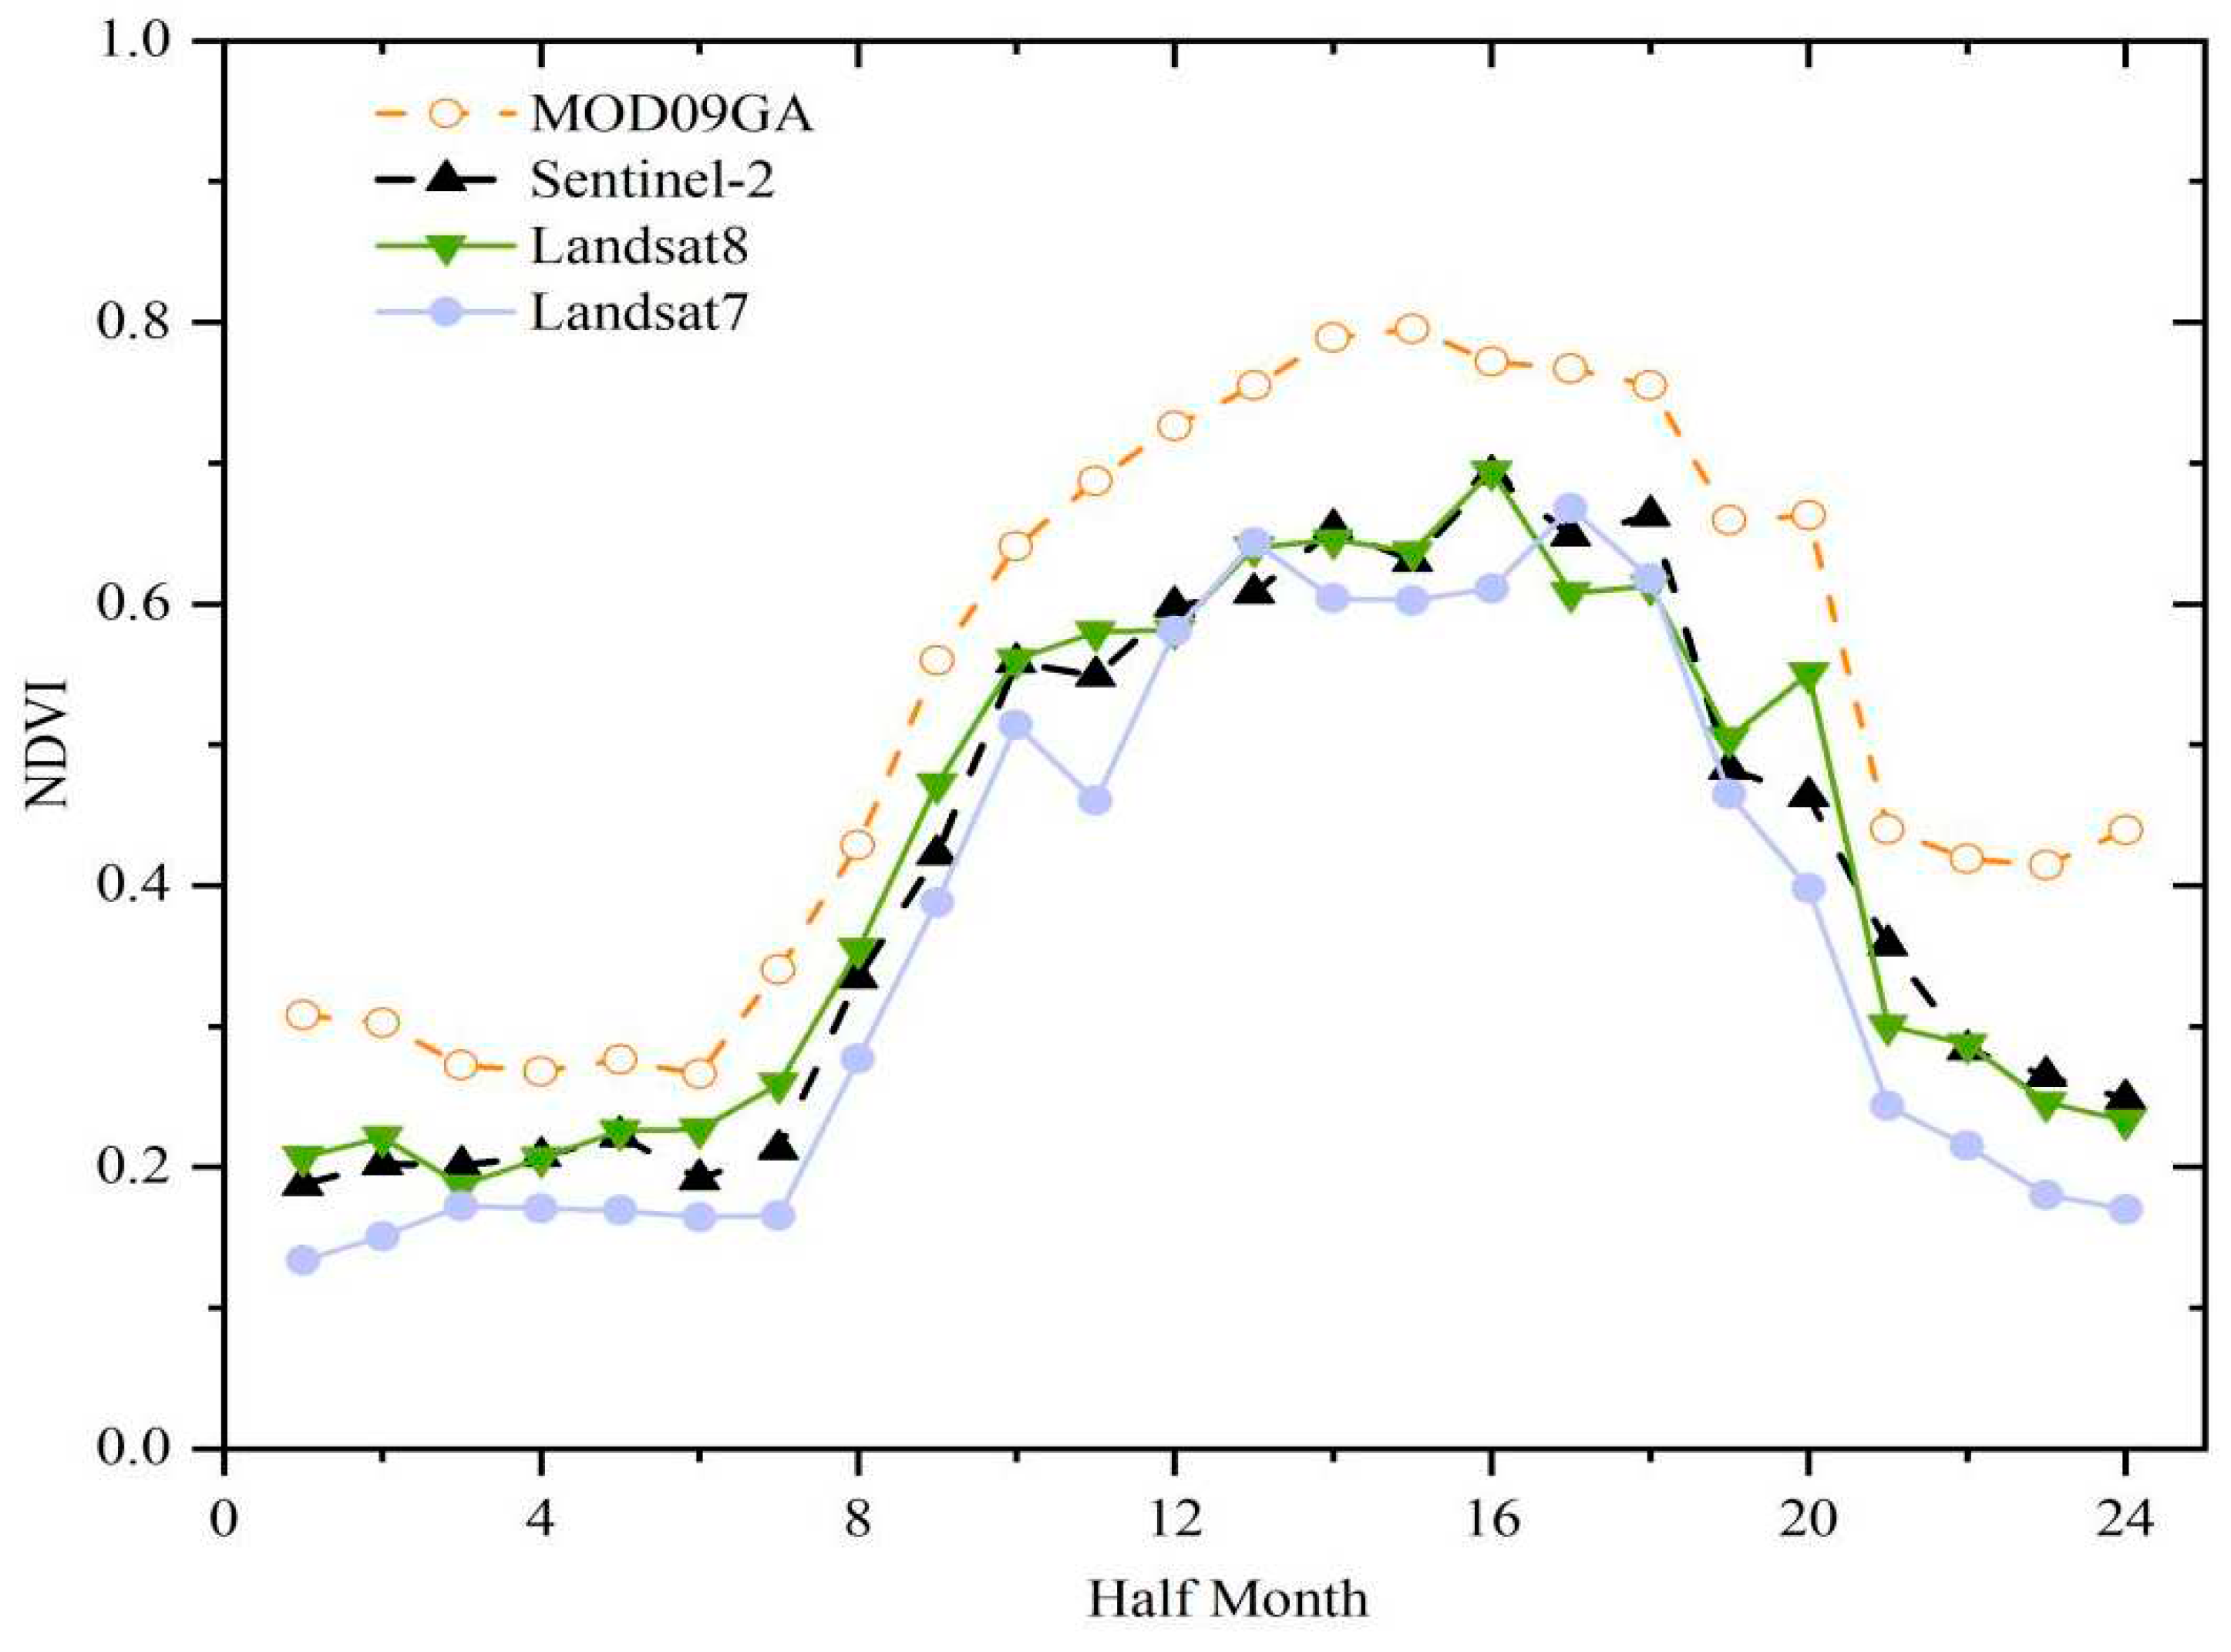
Figure 5.
Heatmap of Pearson correlation coefficient matrix.
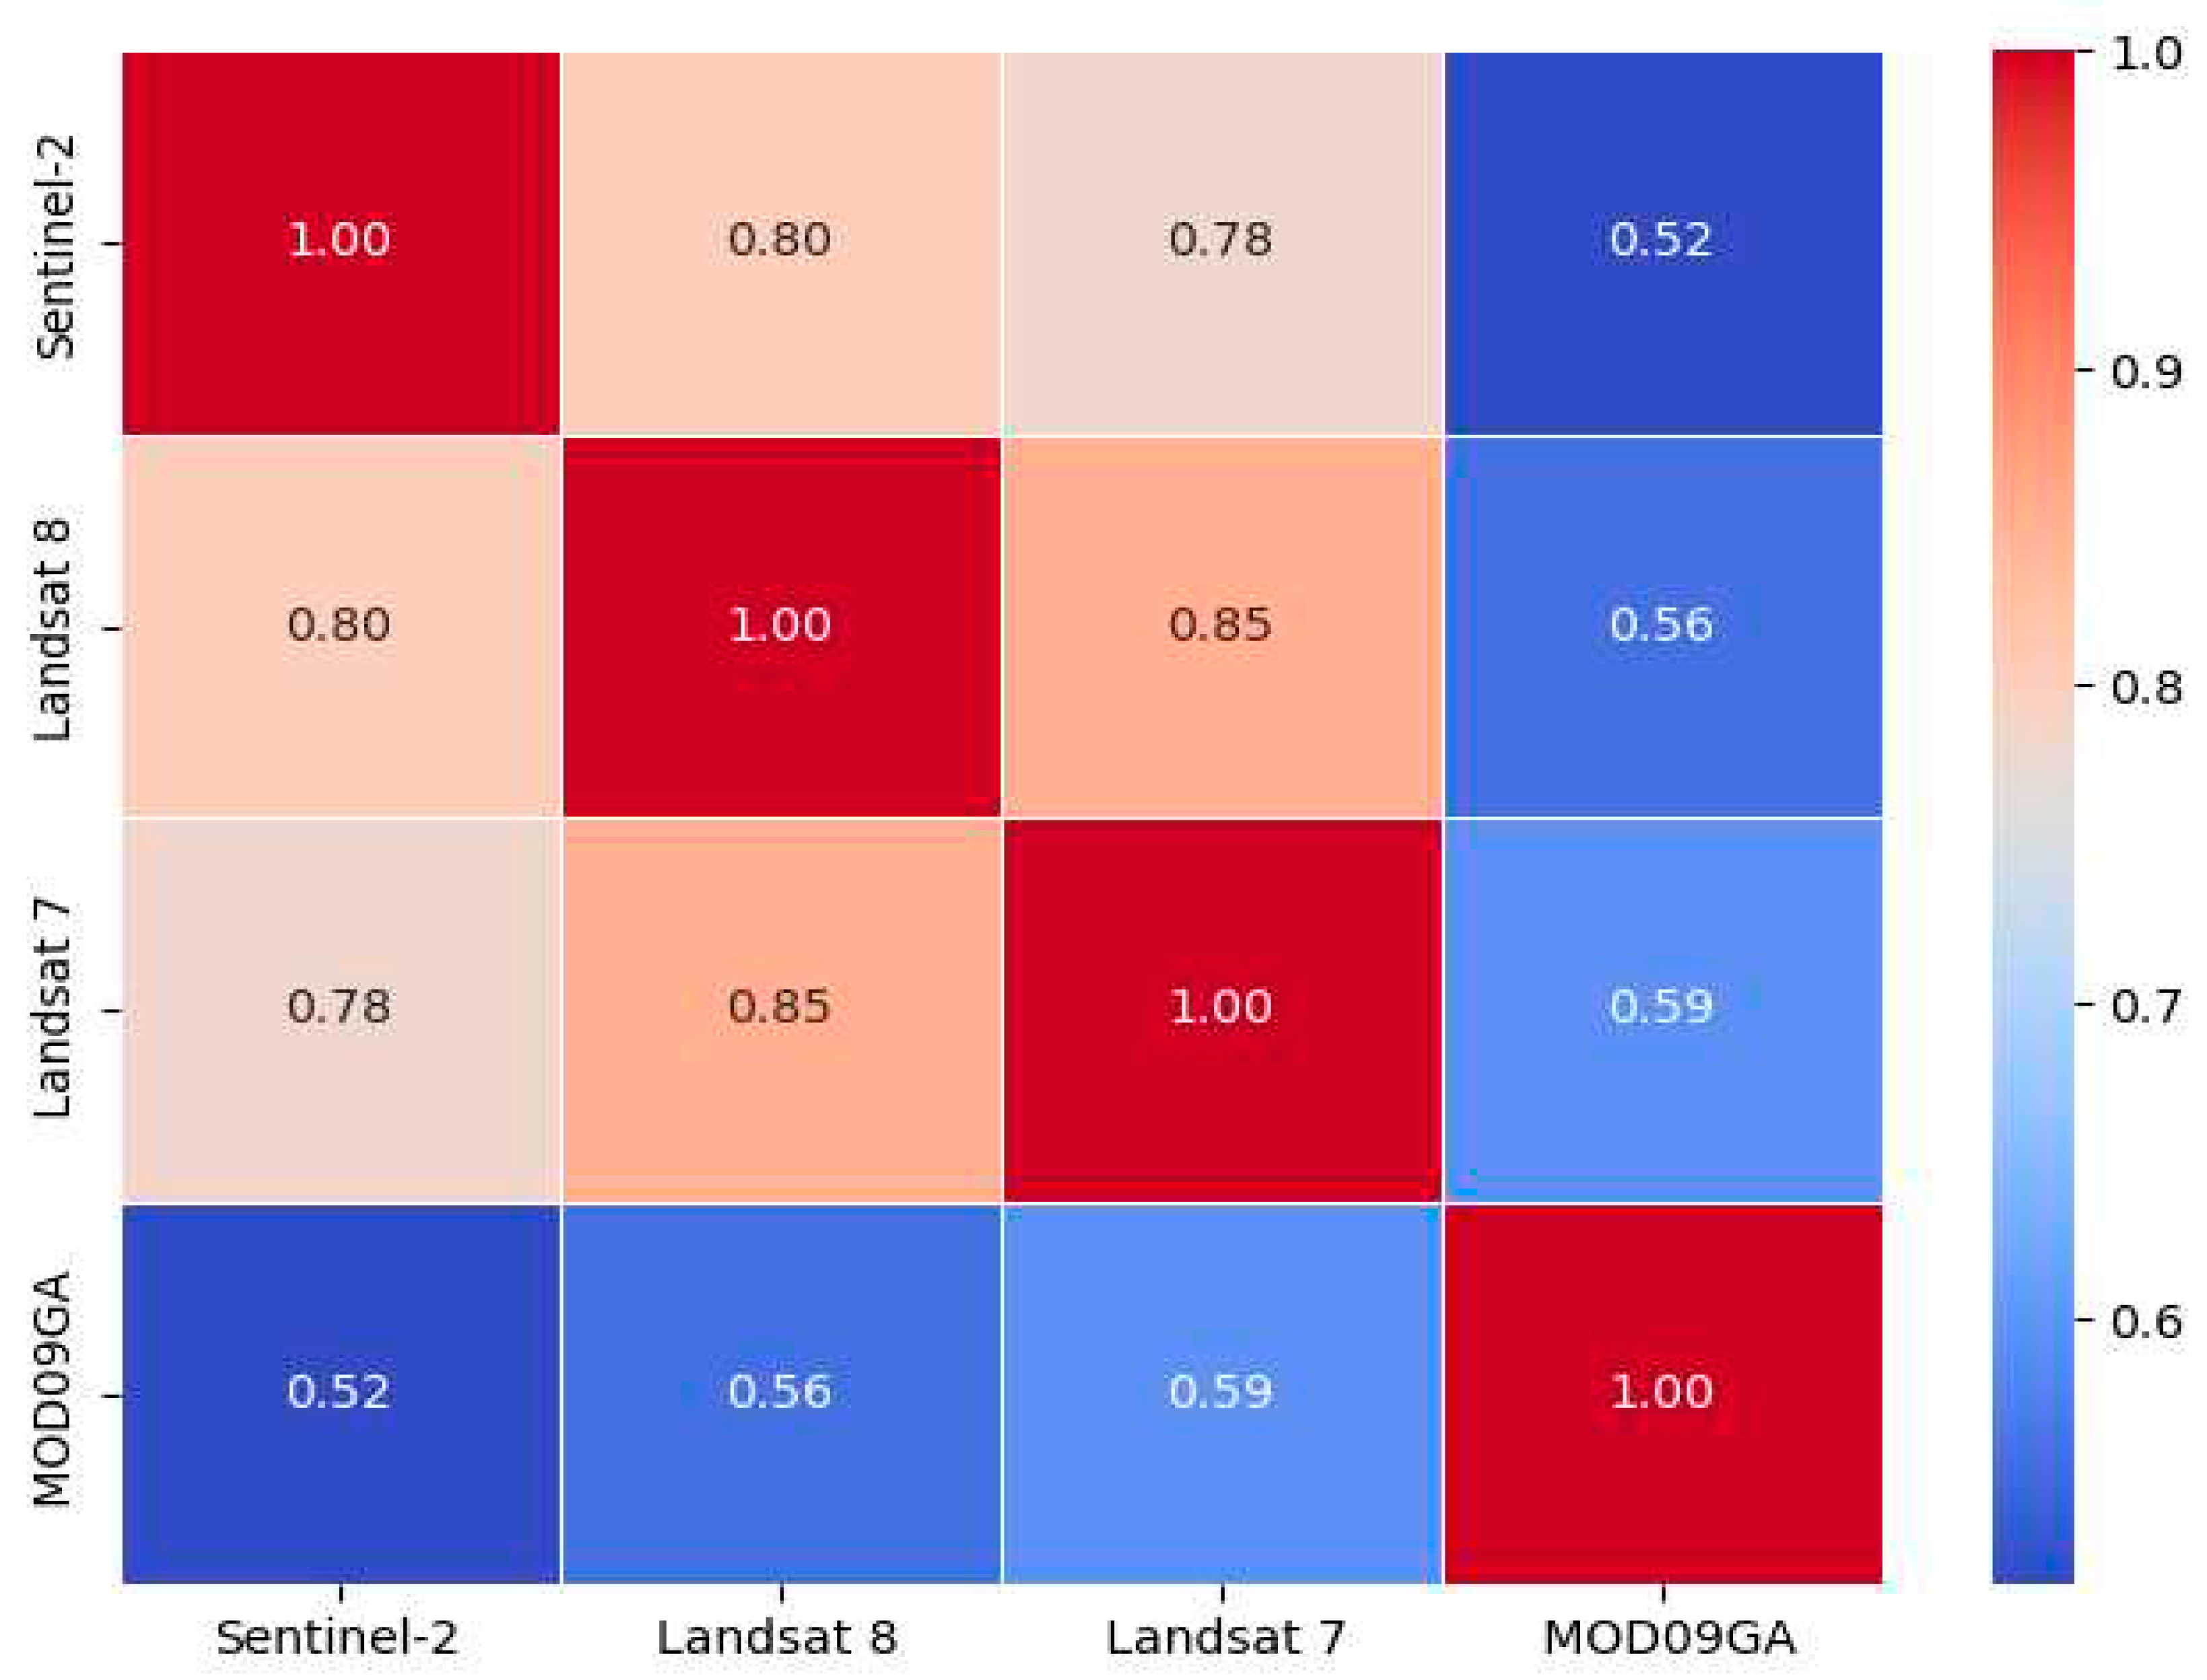
Figure 6.
Annual average rainfall erosivity calculated by different datasets from 1986 to 2015.
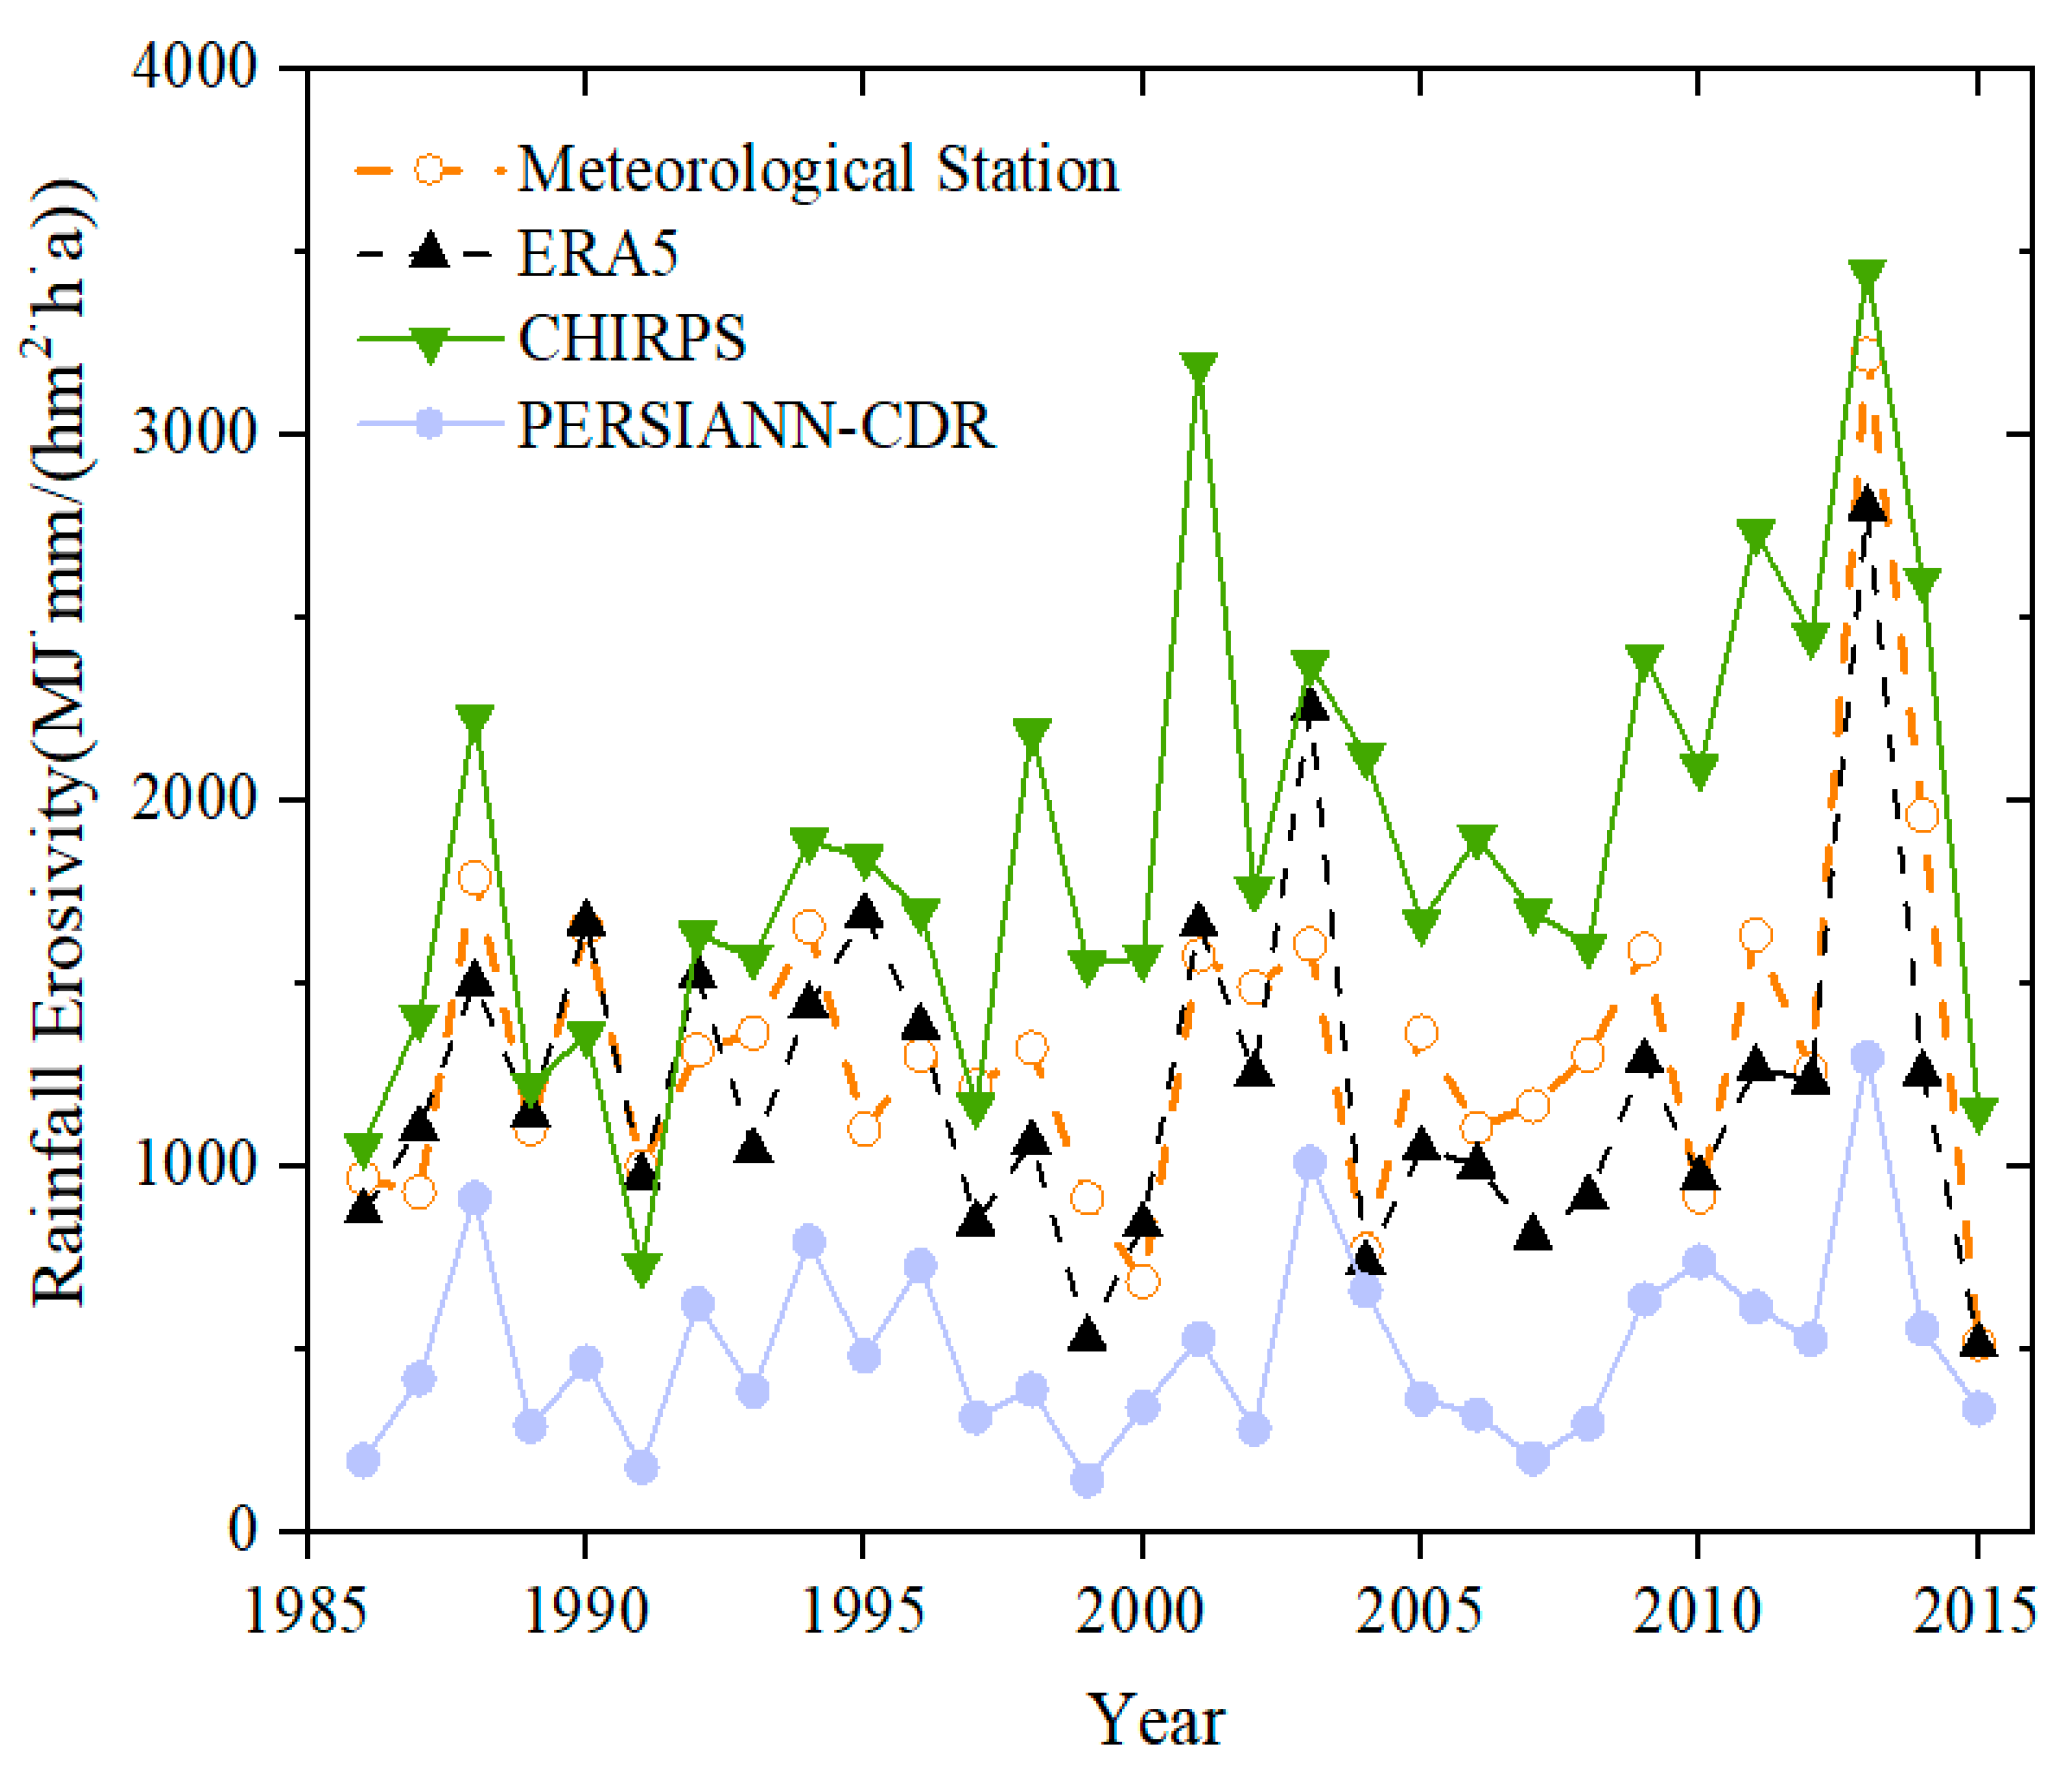
Figure 7.
WR (the ratio of half-month rainfall erosivity to average annual rainfall erosivity) calculated by different datasets from 1986 to 2015.
Figure 7.
WR (the ratio of half-month rainfall erosivity to average annual rainfall erosivity) calculated by different datasets from 1986 to 2015.
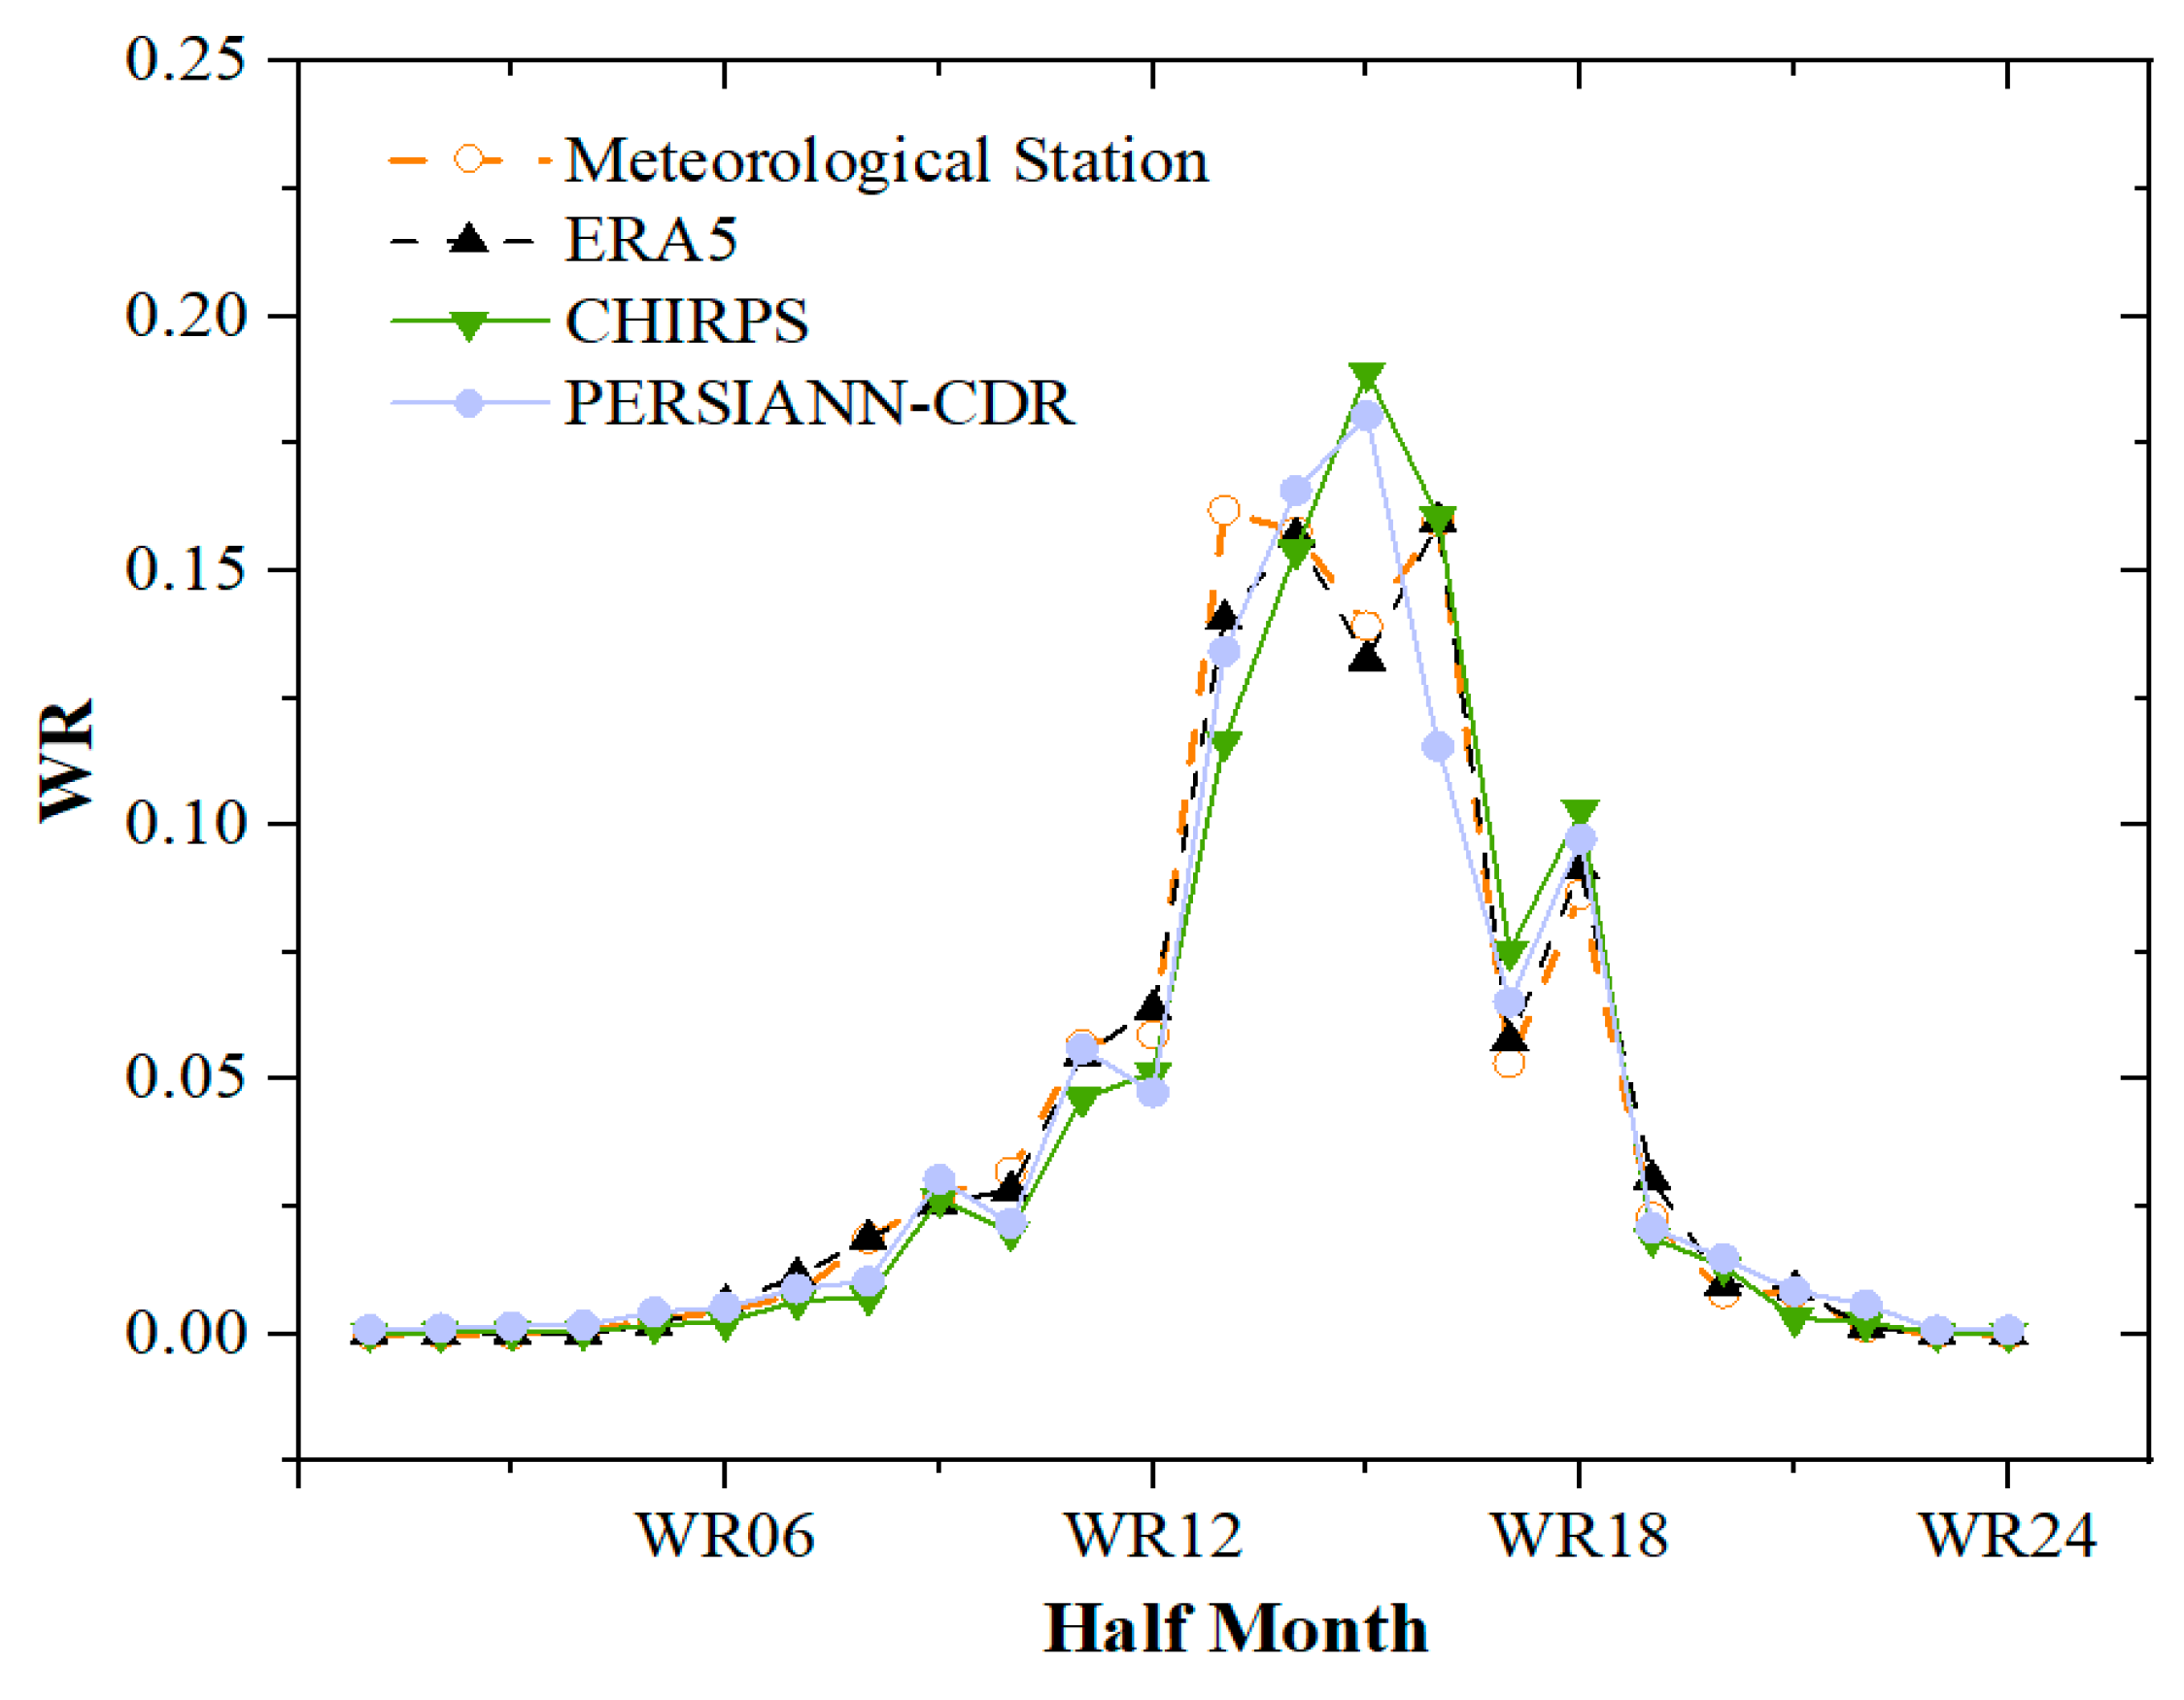
Figure 8.
NDVI calculated for 24 half-months using the raw Sentinel-2 images, the Sentinel-2 images with 20% filtered cloud cover, the Sentinel-2 images patched by the HANTS method, and the Sentinel-2 images patched by the trend migration method.
Figure 8.
NDVI calculated for 24 half-months using the raw Sentinel-2 images, the Sentinel-2 images with 20% filtered cloud cover, the Sentinel-2 images patched by the HANTS method, and the Sentinel-2 images patched by the trend migration method.
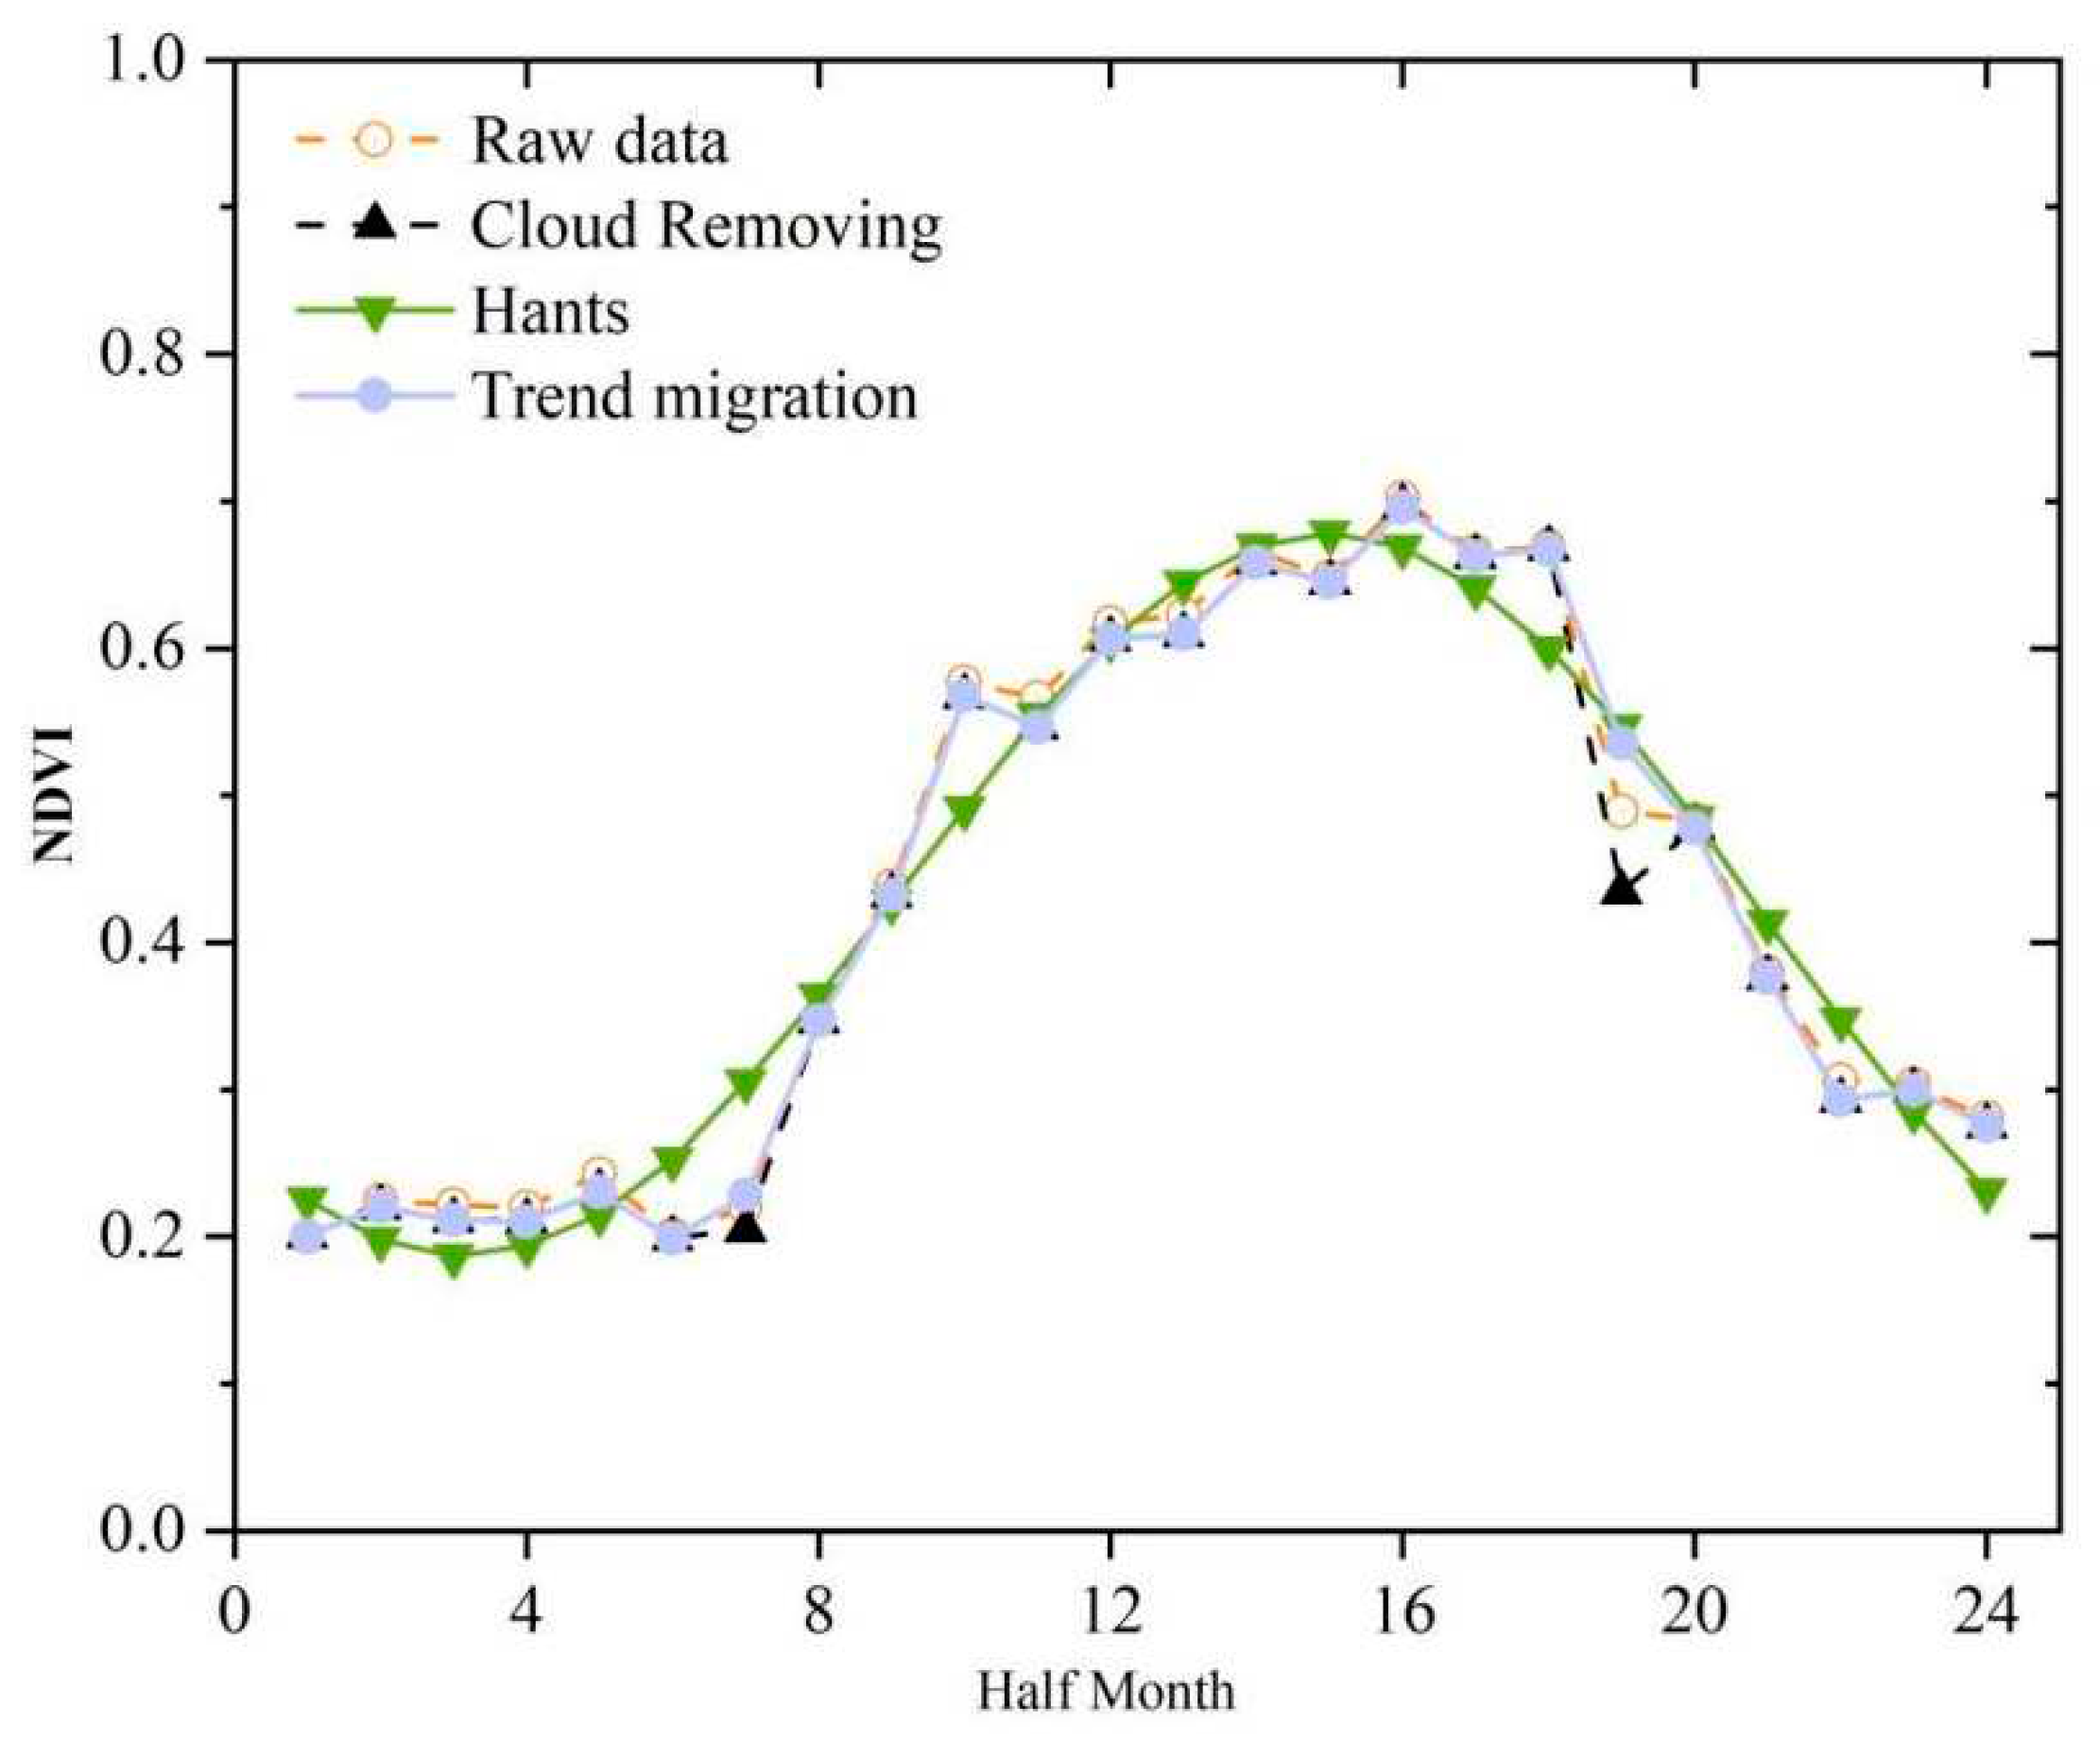
Figure 9.
NDVI generated using (a) the raw Sentinel-2 images in the 7th half-month, (b) the Sentinel-2 images with clouds filtered in the 7th half-month, (c) the missing parts patched by MOD09GA, Landsat-7, and Landsat-8 images in the 7th half-month, (d) the Sentinel-2 images after patched in the 7th half-month, (e) the raw Sentinel-2 images in the 19th half-month, and (f) the Sentinel-2 images after patched in the 19th half-month.
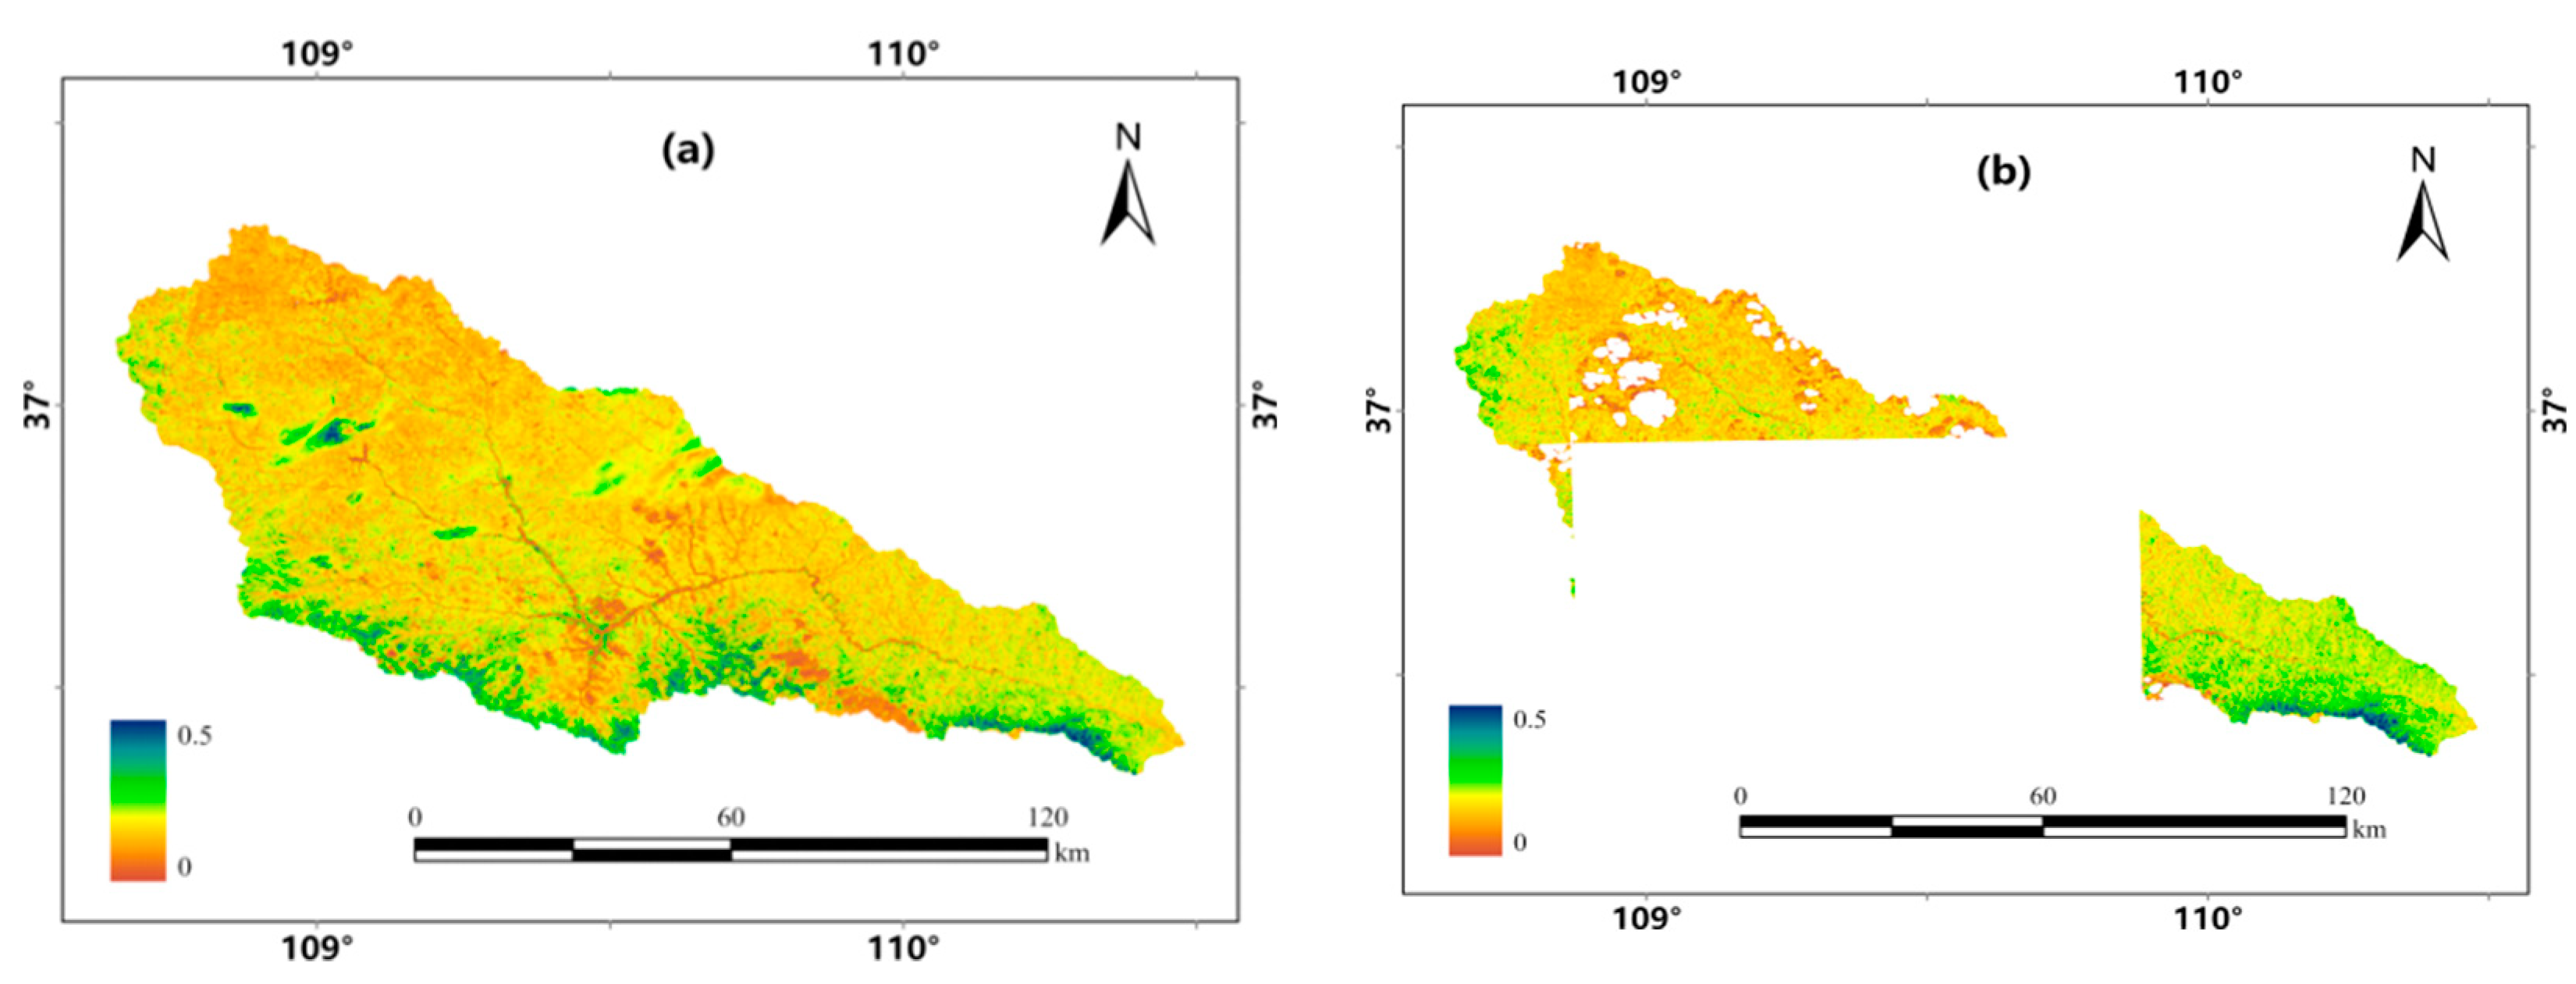
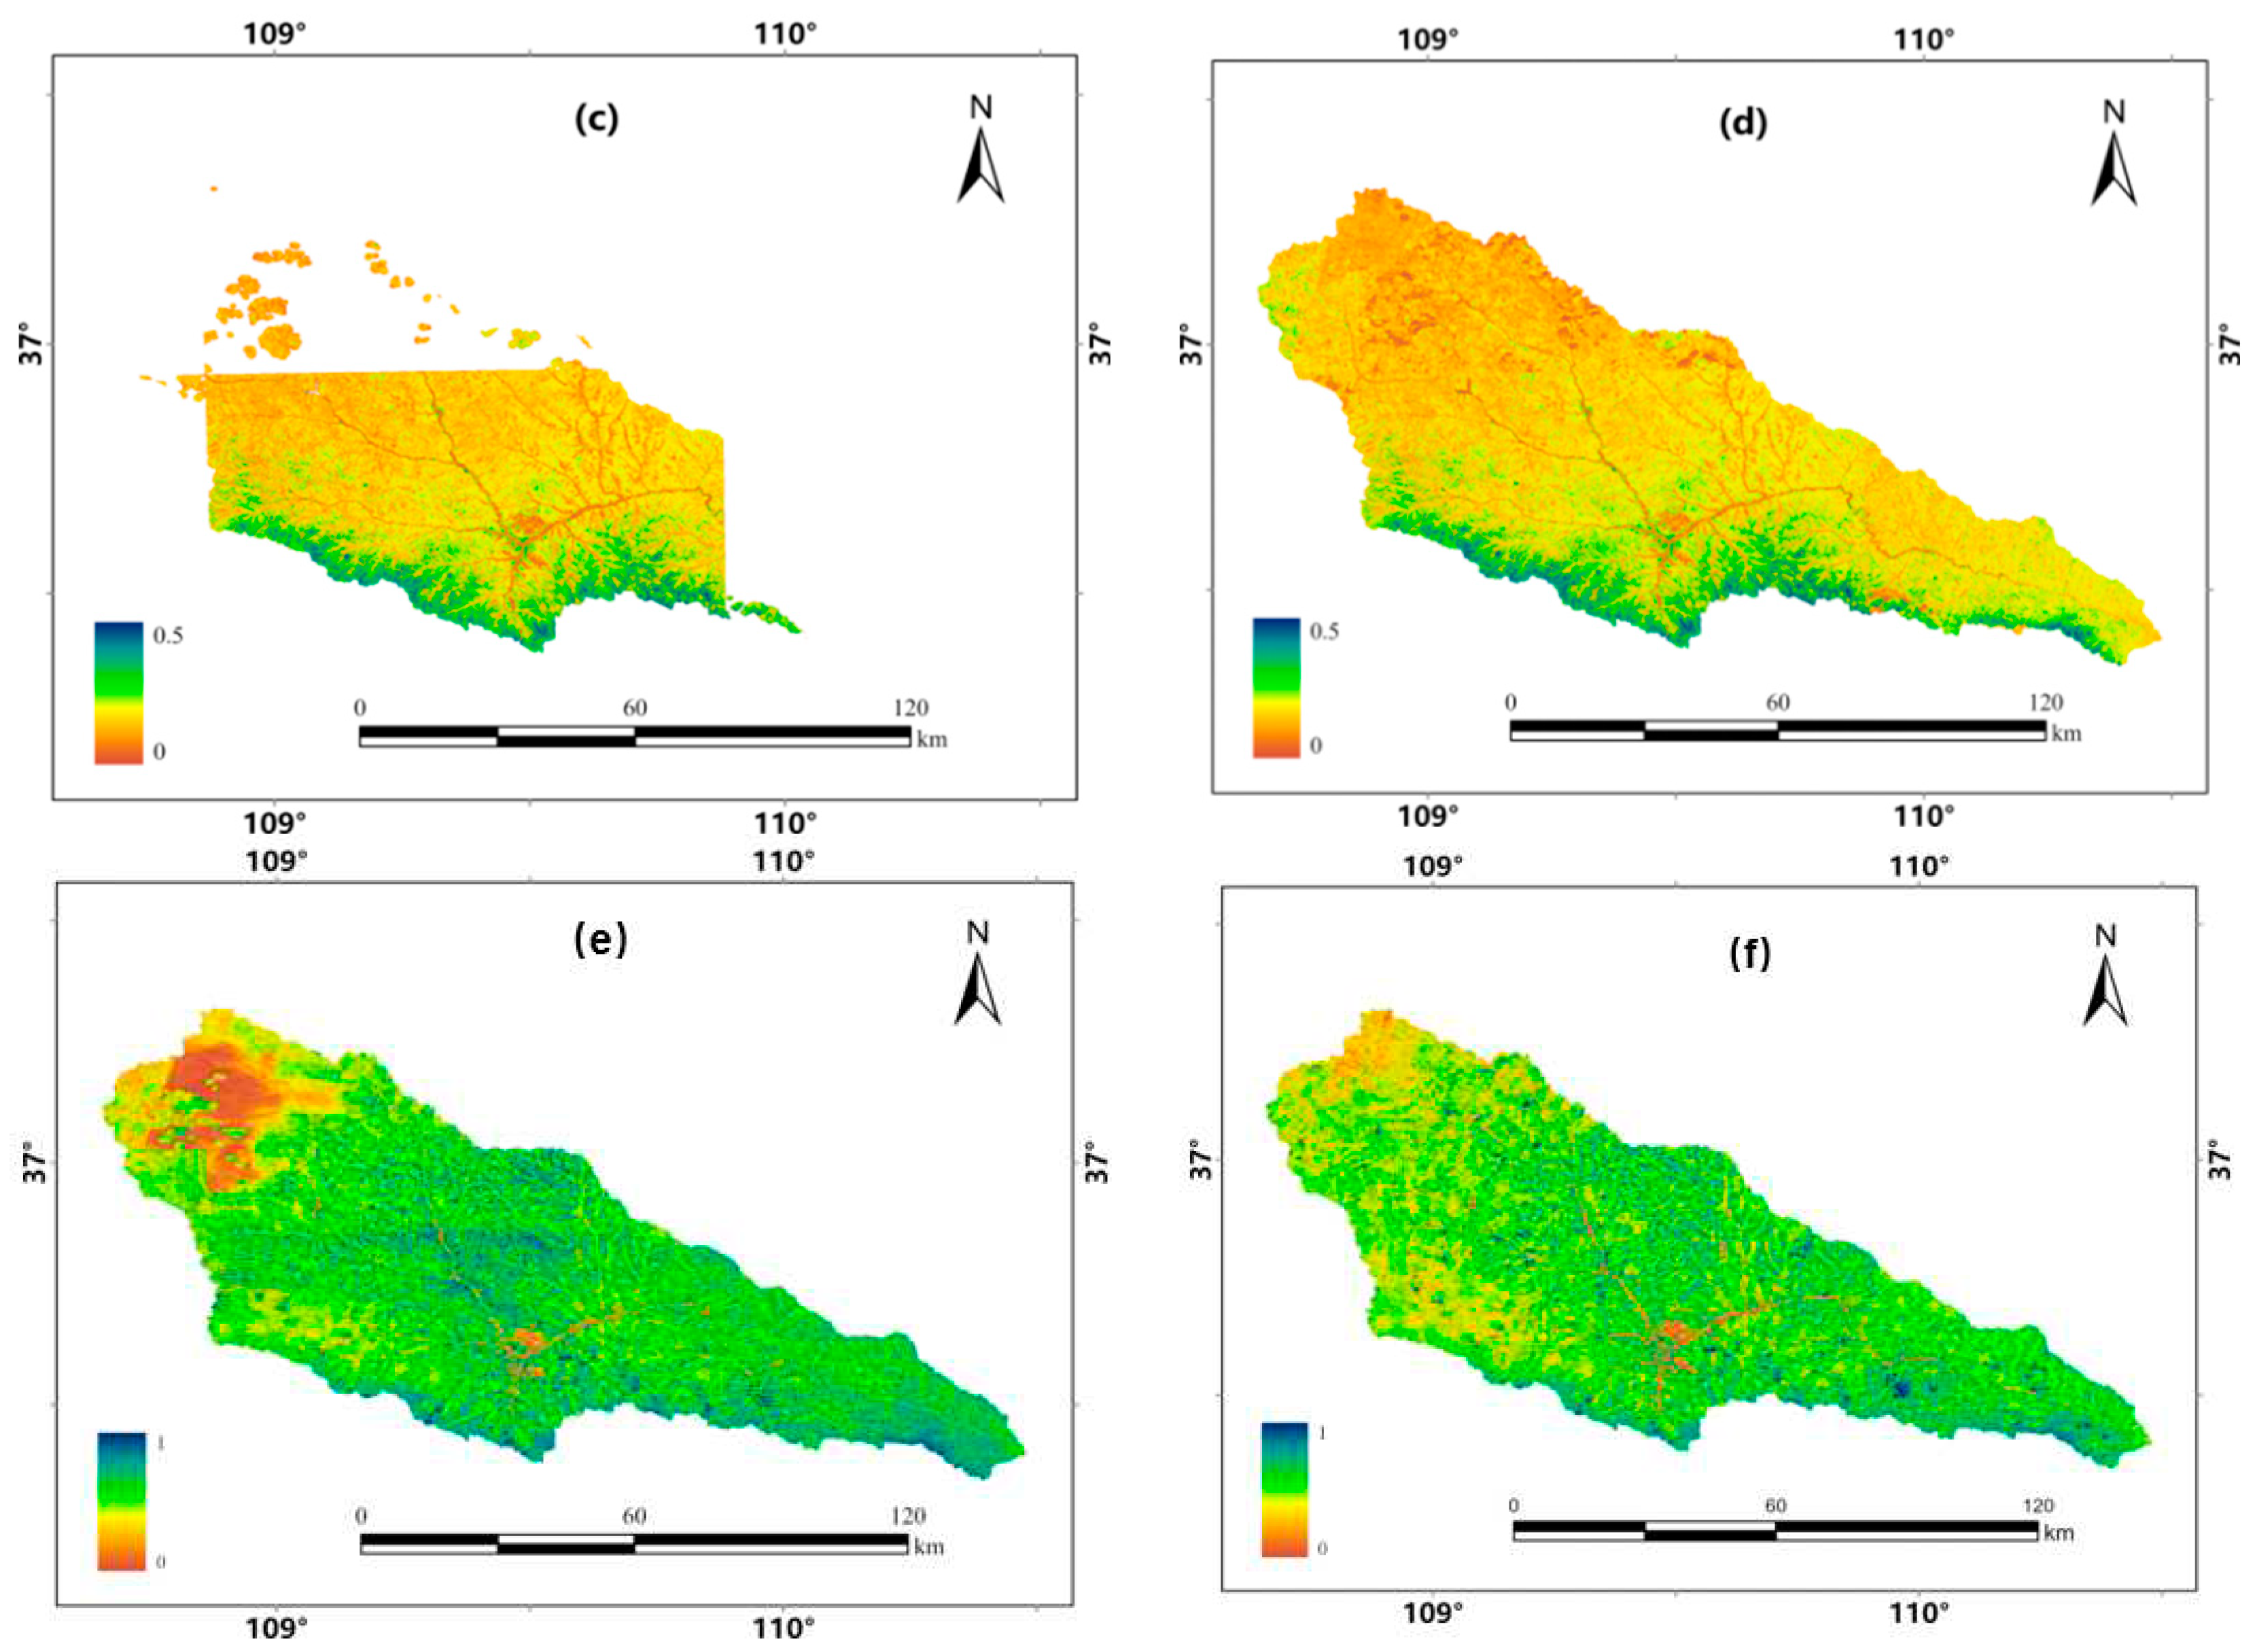
Figure 10.
Details of NDVI calculated in the Yanhe River Basin. (a) The selected rectangular region, (b) The google map of the selected region, (c) NDVI calculated from Sentinel-2, (d) NDVI calculated from MOD09GA, (e) NDVI calculated from Landsat-7s and (f) NDVI calculated from MODIS.
Figure 10.
Details of NDVI calculated in the Yanhe River Basin. (a) The selected rectangular region, (b) The google map of the selected region, (c) NDVI calculated from Sentinel-2, (d) NDVI calculated from MOD09GA, (e) NDVI calculated from Landsat-7s and (f) NDVI calculated from MODIS.
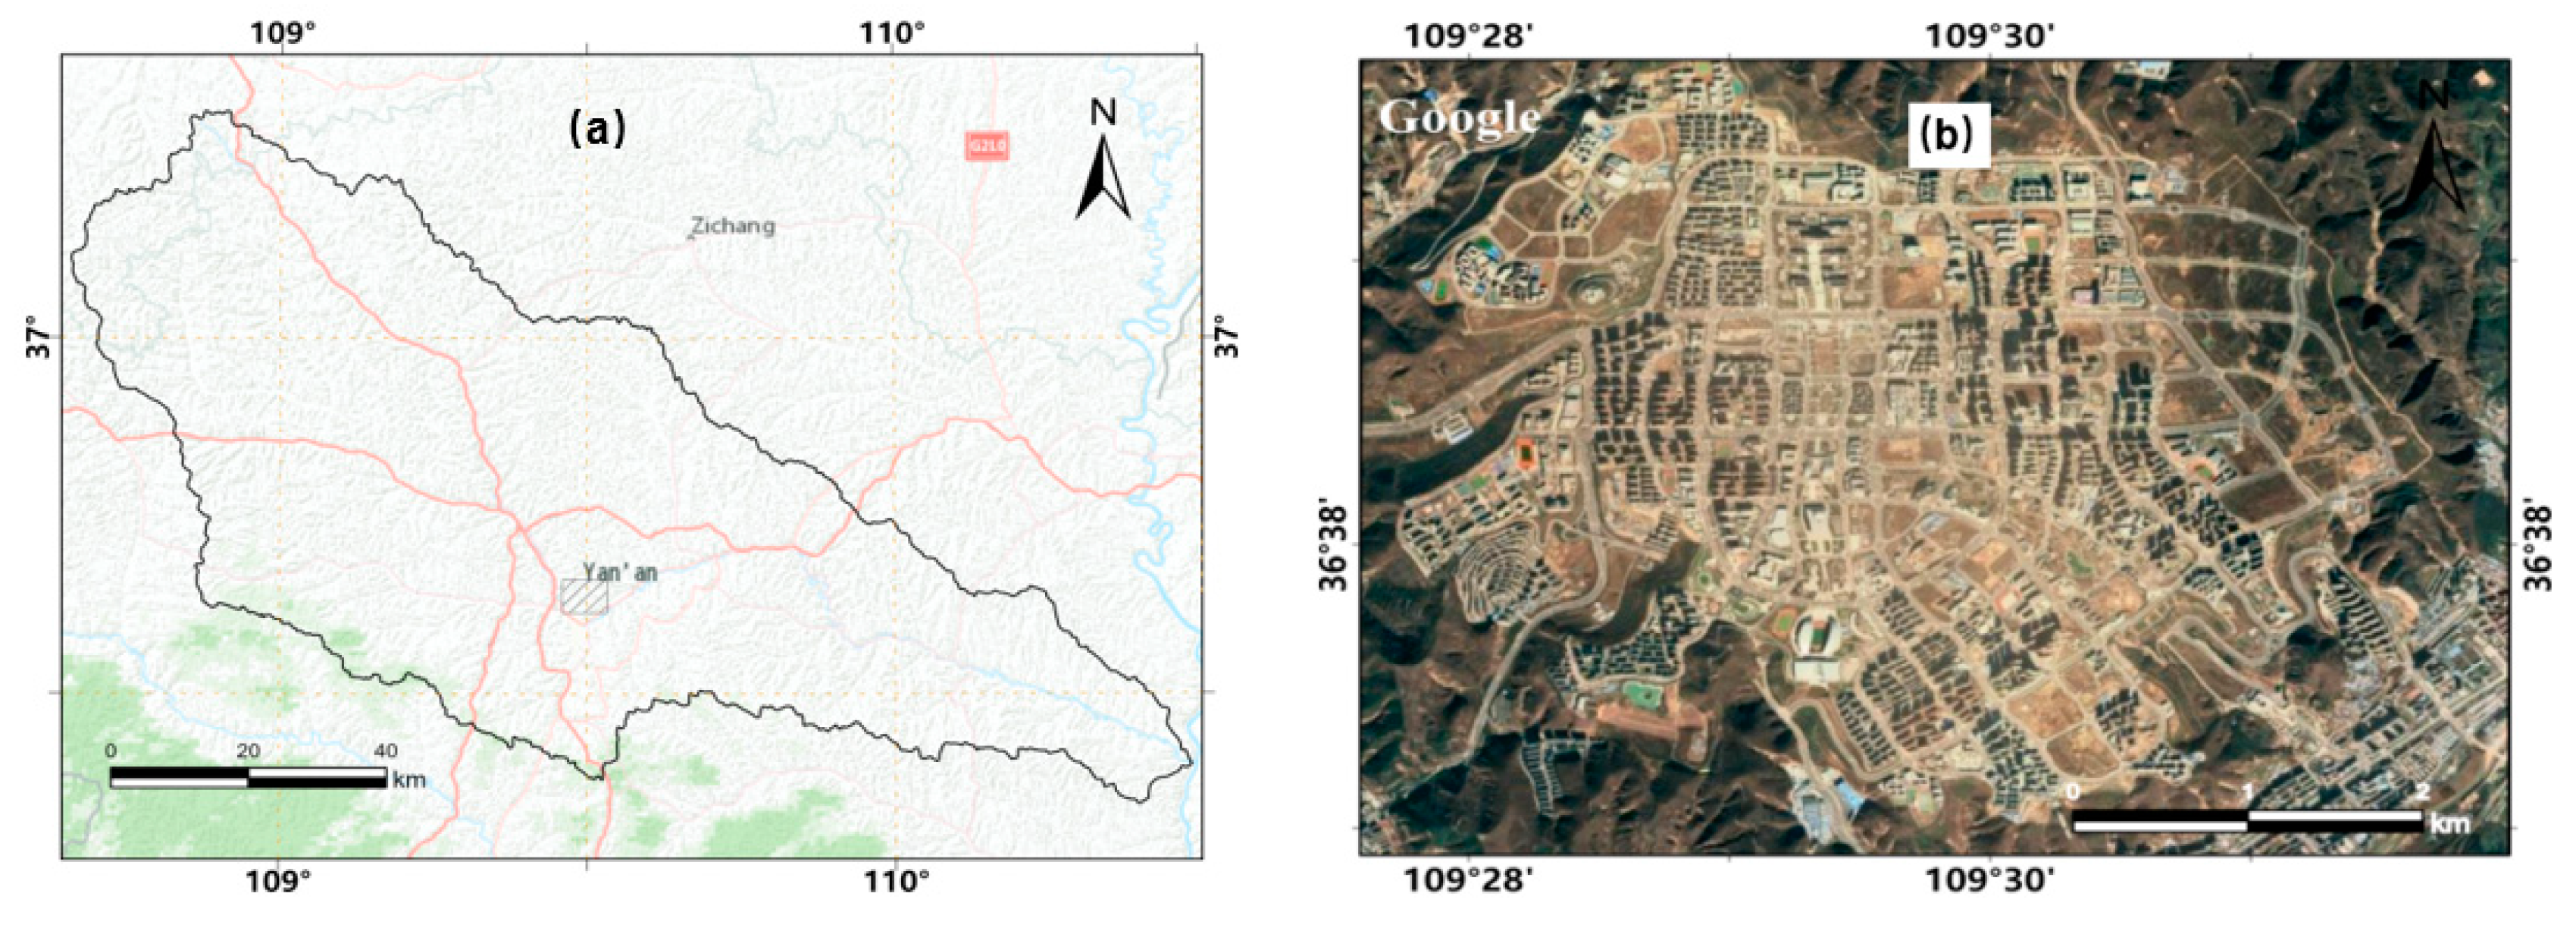
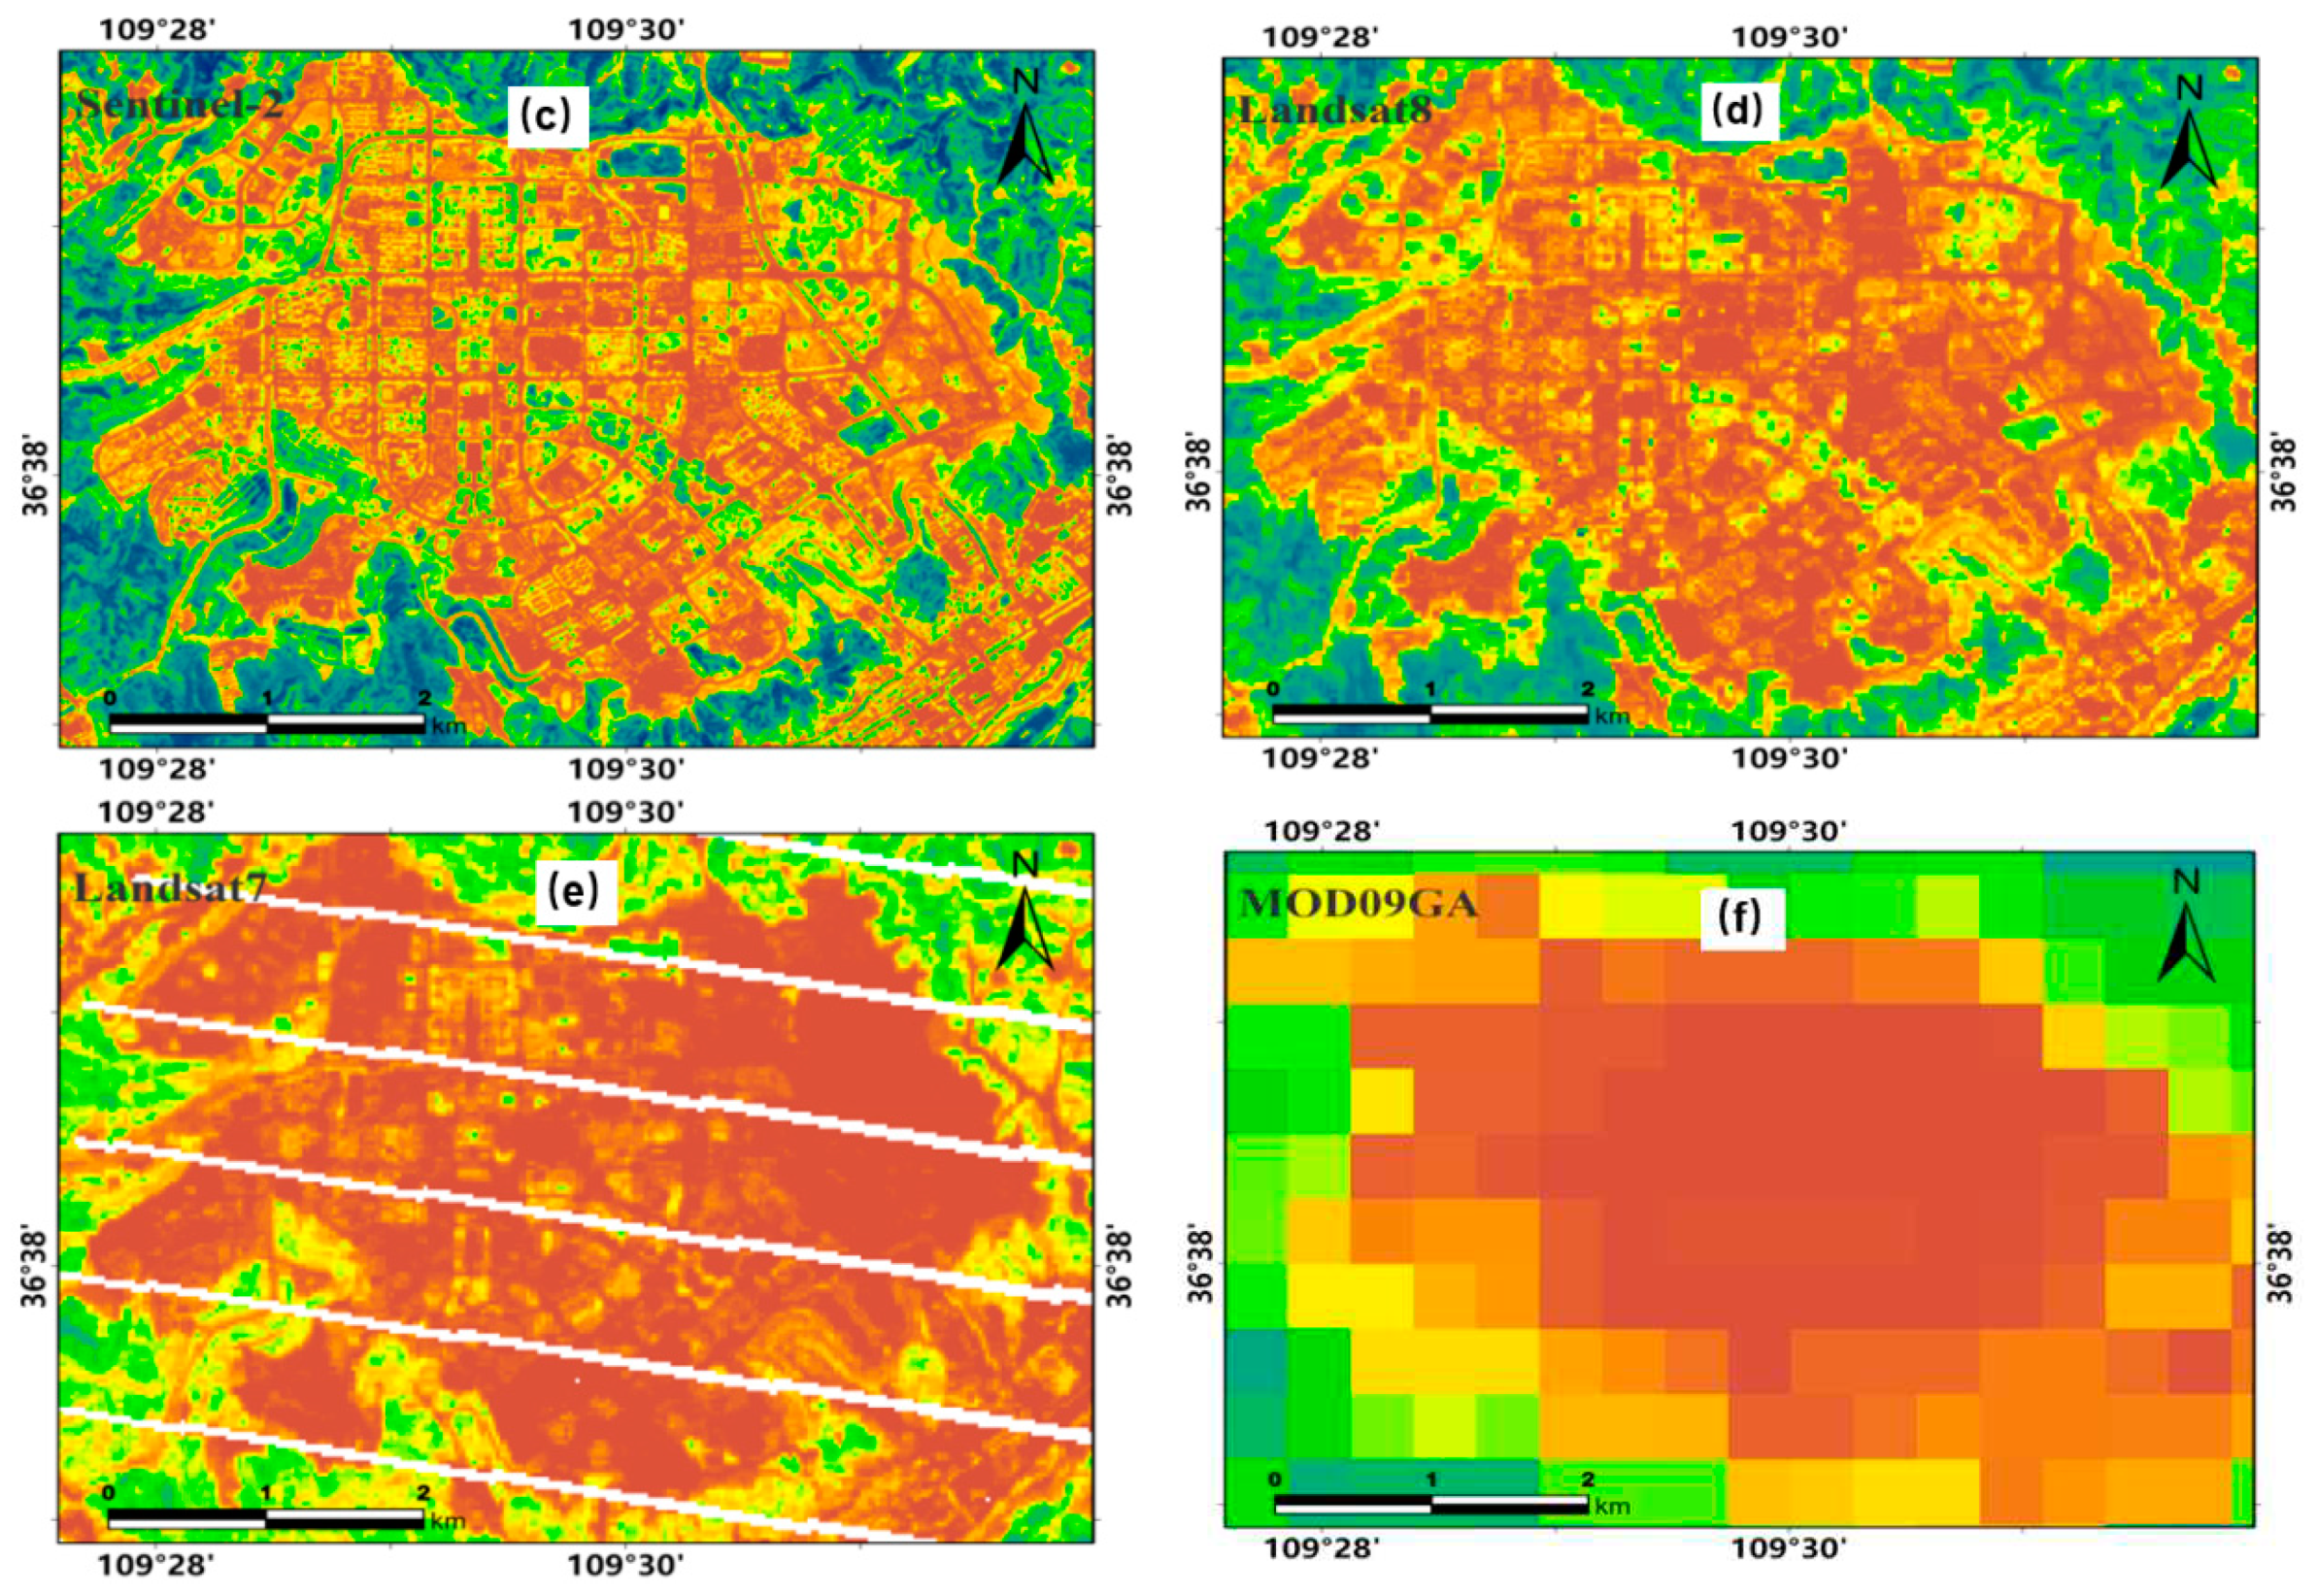
Figure 11.
Mean 24 half-monthly FVC values from 2019 to 2021 in the Yanhe River Basin from January to December.
Figure 11.
Mean 24 half-monthly FVC values from 2019 to 2021 in the Yanhe River Basin from January to December.
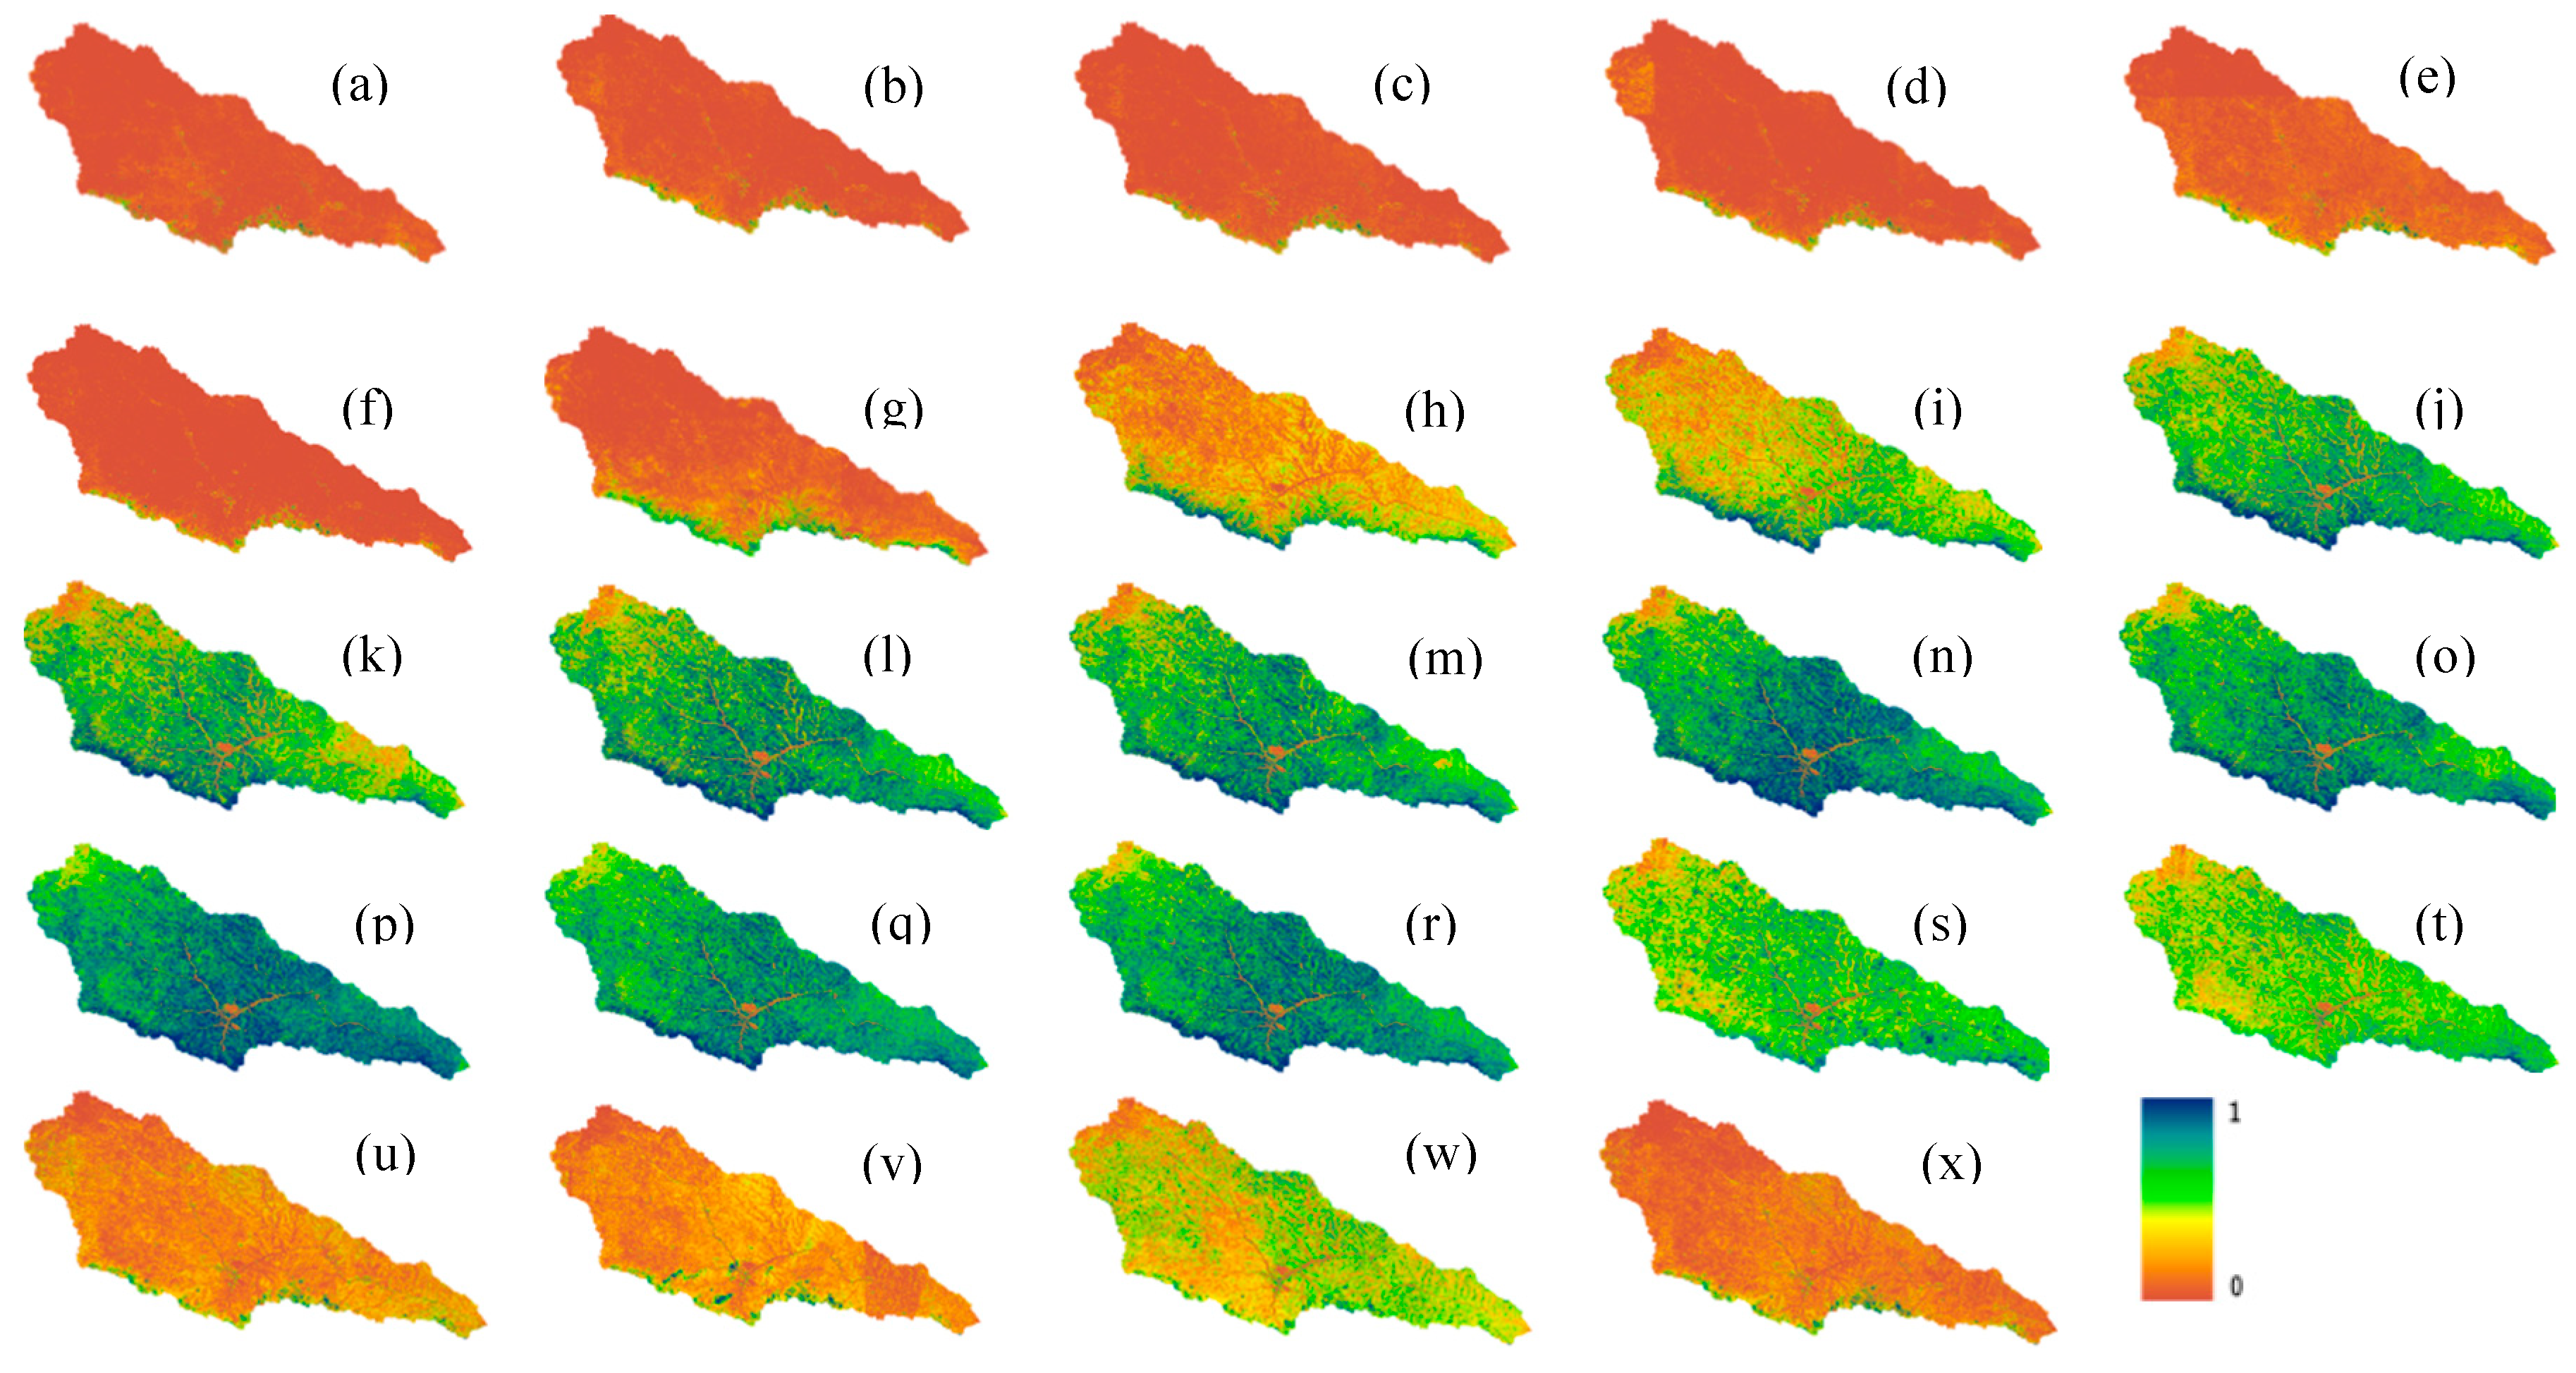
Figure 12.
Spatial distribution of B factor in the Yanhe River Basin.
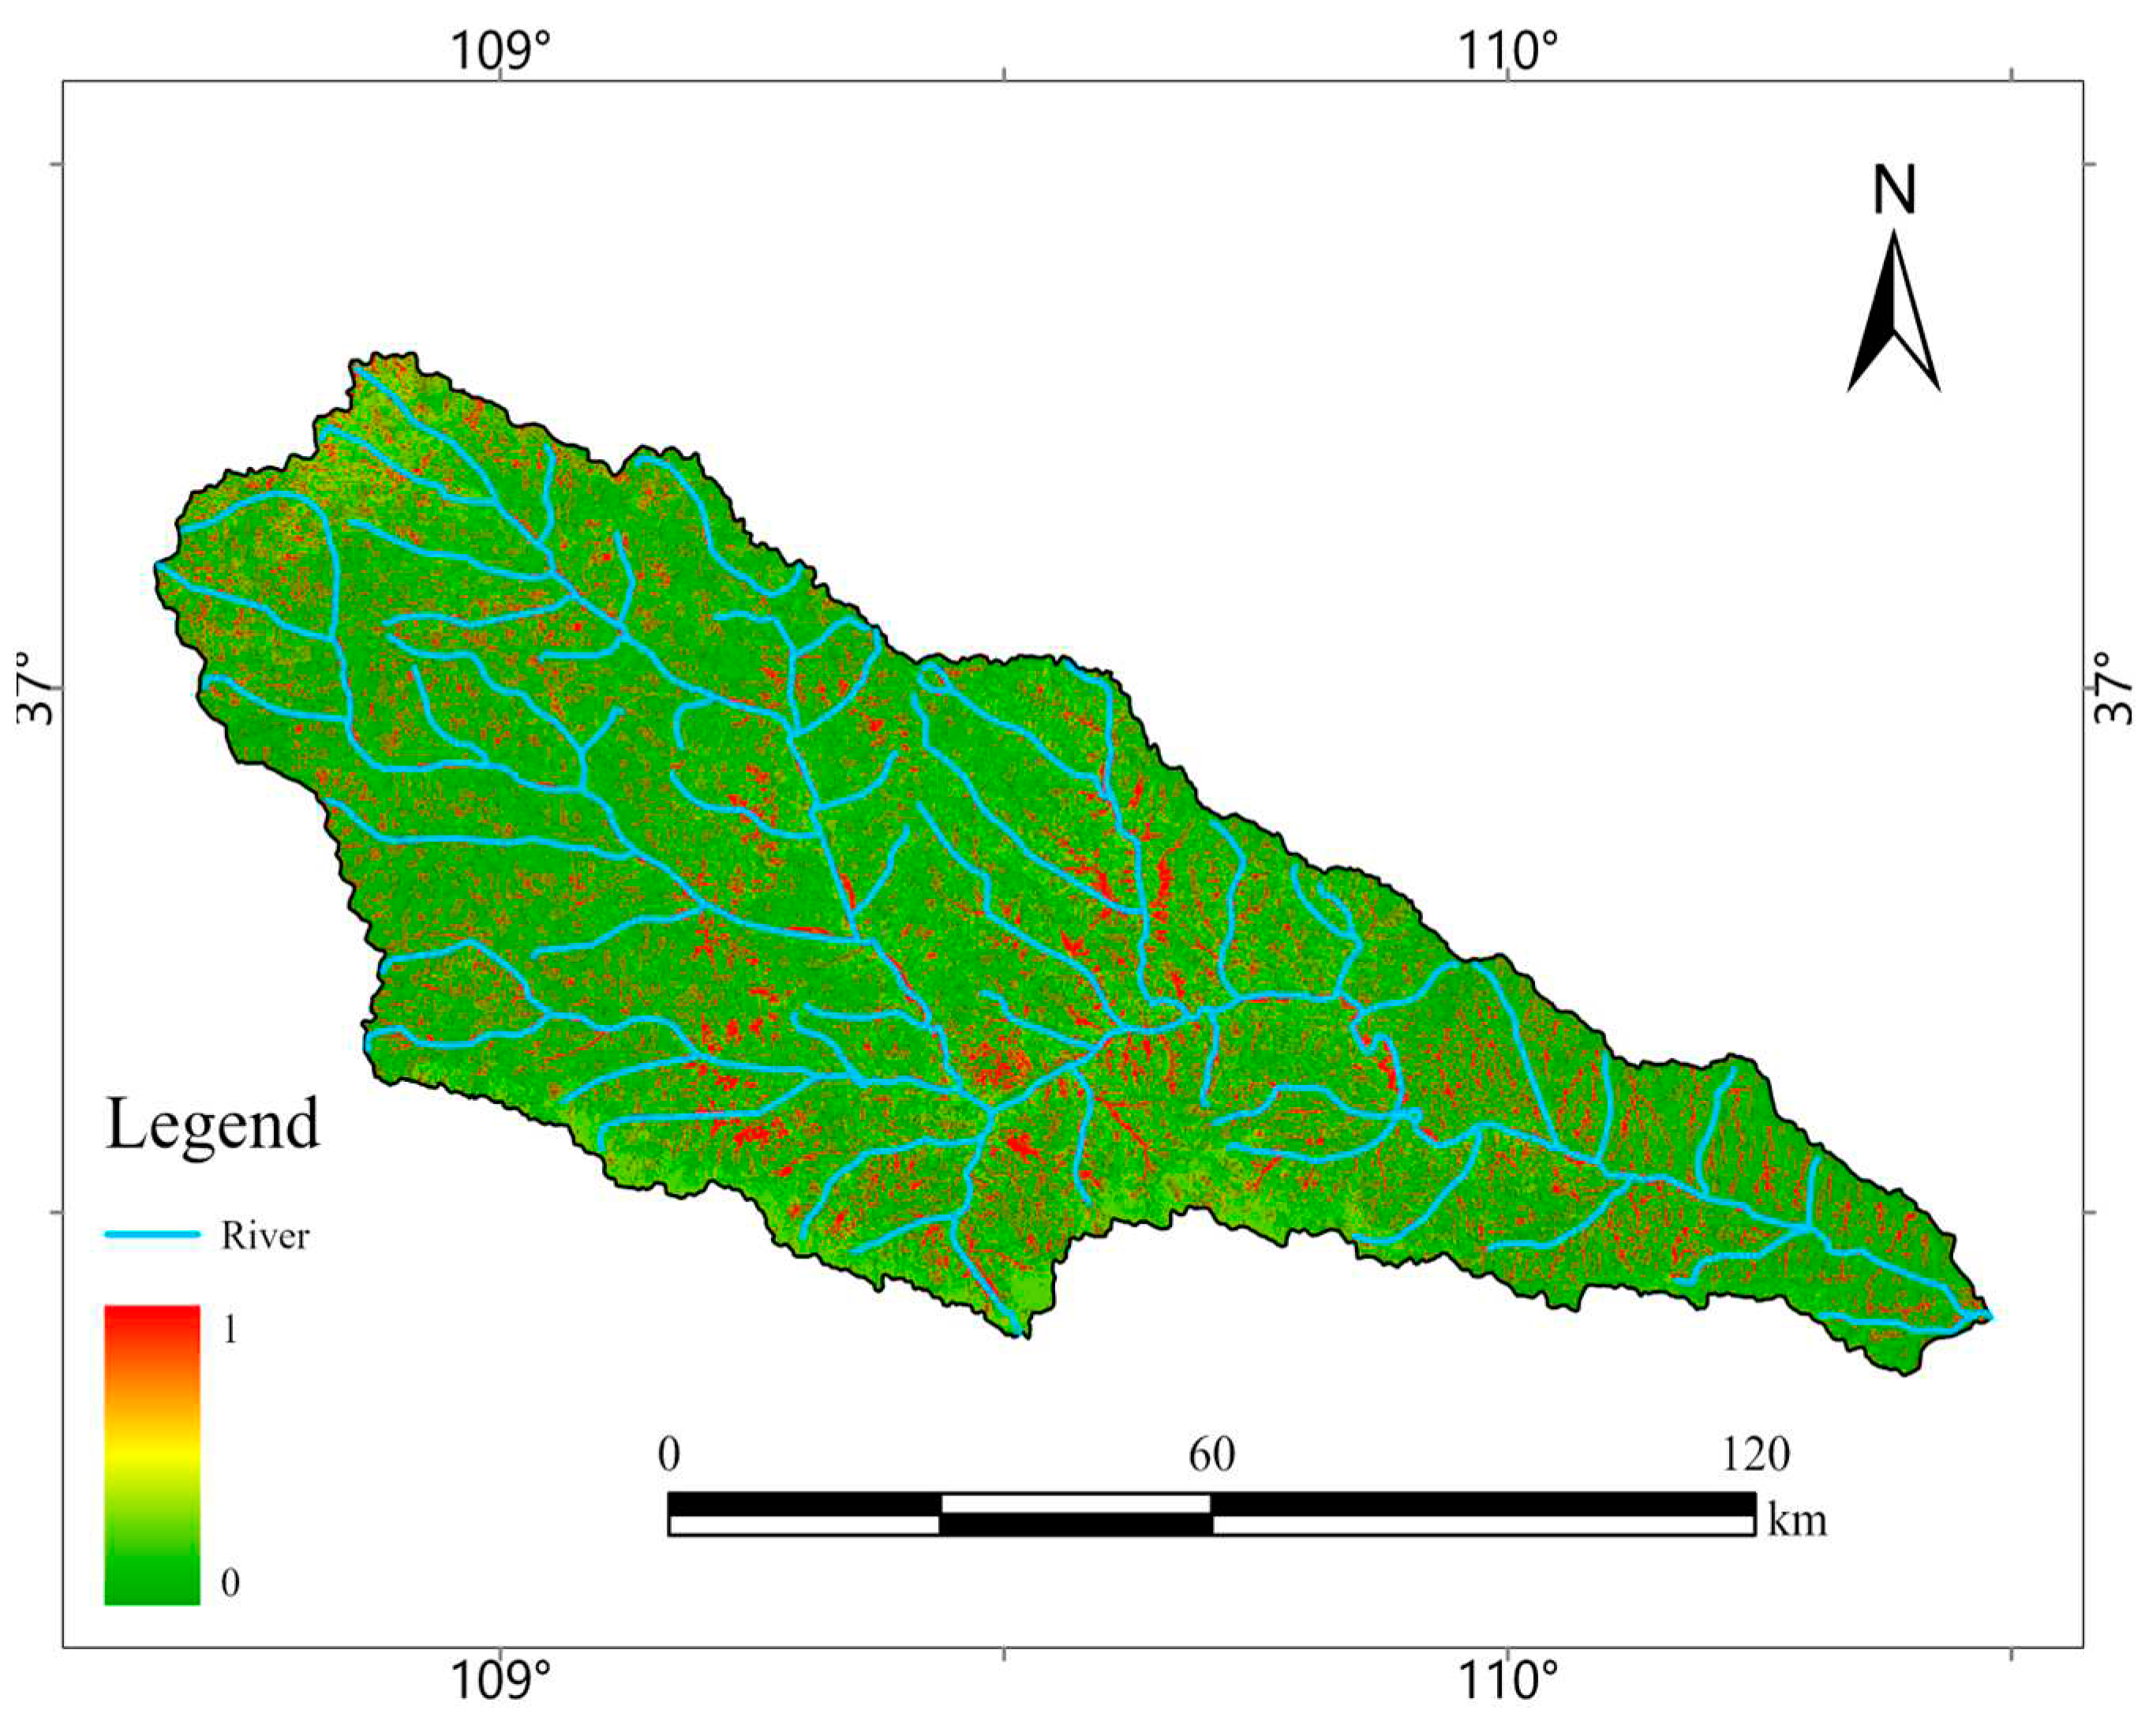
Table 1.
The area and proportions of different land use types in Yanhe River Basin.
| Land use types | Area (km2) | Proportions |
|---|---|---|
| Forest land | 1151.02 | 14.98% |
| Shrub land | 0.0166 | 0.00% |
| Grass land | 5358.8 | 69.76% |
| Cultivated land | 528.086 | 6.87% |
| Building land | 101.481 | 1.32% |
| Unused land | 535.108 | 6.97% |
| Water body | 6.9805 | 0.09% |
| Wetland | 0.0569 | 0.00% |
Table 2.
Summary of the remote sensing products used in this study.
| Datasets | Name | Period (day) | Resolution (m) | Period |
|---|---|---|---|---|
| MODIS | MOD09GA | 1 | 463.313 | 2000-2023 |
| Landsat 7 | LE07/C02/T1_L2 | 8 | 30 | 1999-2023 |
| Landsat 8 | LC08/C02/T1_L2 | 8 | 30 | 2013-2023 |
| Sentinel 2 | S2_SR HARMONIZED | 5 | 10 | 2017-2023 |
Table 3.
The missing rate of the four remote sensing datasets in 24 half-months.
| Half- month | MOD09GA | Sentinel-2 | Landsat8 | Landsat7 | ||||
|---|---|---|---|---|---|---|---|---|
| Number of available images | Missing rate | Number of available images | Missing rate | Number of available images | Missing rate | Number of available images | Missing rate | |
| 1 | 45 | 0% | 27 | 0% | 6 | 10% | 6 | 55% |
| 2 | 48 | 0% | 35 | 0% | 5 | 0% | 8 | 6% |
| 3 | 45 | 0% | 31 | 0% | 5 | 41% | 9 | 3% |
| 4 | 40 | 0% | 18 | 0% | 6 | 0% | 3 | 46% |
| 5 | 45 | 0% | 21 | 0% | 7 | 9% | 9 | 6% |
| 6 | 48 | 0% | 32 | 0% | 8 | 0% | 10 | 17% |
| 7 | 45 | 0% | 14 | 56% | 3 | 1% | 2 | 92% |
| 8 | 45 | 0% | 33 | 0% | 8 | 0% | 9 | 11% |
| 9 | 45 | 0% | 35 | 0% | 8 | 0% | 9 | 10% |
| 10 | 48 | 0% | 43 | 0% | 6 | 0% | 8 | 2% |
| 11 | 45 | 0% | 34 | 0% | 8 | 45% | 3 | 40% |
| 12 | 45 | 0% | 21 | 0% | 2 | 81% | 1 | 55% |
| 13 | 45 | 0% | 33 | 0% | 6 | 16% | 9 | 0% |
| 14 | 48 | 0% | 30 | 0% | 2 | 30% | 2 | 91% |
| 15 | 45 | 0% | 35 | 0% | 5 | 6% | 5 | 35% |
| 16 | 48 | 0% | 33 | 0% | 6 | 0% | 1 | 90% |
| 17 | 45 | 0% | 38 | 0% | 6 | 63% | 9 | 2% |
| 18 | 45 | 0% | 31 | 0% | 6 | 3% | 7 | 9% |
| 19 | 45 | 0% | 9 | 56% | 0 | 100% | 2 | 48% |
| 20 | 48 | 0% | 35 | 0% | 2 | 1% | 8 | 25% |
| 21 | 45 | 0% | 51 | 0% | 7 | 62% | 9 | 2% |
| 22 | 45 | 0% | 27 | 0% | 5 | 1% | 9 | 1% |
| 23 | 45 | 0% | 45 | 0% | 6 | 0% | 9 | 8% |
| 24 | 48 | 0% | 38 | 0% | 10 | 0% | 8 | 7% |
| Total | 1096 | 0% | 749 | 5% | 133 | 20% | 155 | 27% |
Table 4.
The B-factor value based on land use classes.
| Land use (Class I) | Land use (Class II) | B factor value | Description |
|---|---|---|---|
| Cultivated land | Paddy field | 1 | Soil and water conservation benefits reflected by tillage measure factor |
| Irrigated land | 1 | Soil and water conservation benefits reflected by tillage measure factor | |
| Dry land | 1 | Soil and water conservation benefits reflected by tillage measure factor | |
| Residential, industrial and mining lands | Urban residential lands | 0.01 | Equivalent to 80% of vegetation cover |
| Rural residential lands | 0.025 | Equivalent to 60% of vegetation cover | |
| Independent industrial and mining lands | 1 | Equivalent to no vegetation cover | |
| Commercial service and public lands | 0.01 | Equivalent to 80% of vegetation cover | |
| Special land use | 0.1 | ||
| Land for transportation | 0.01 | Equivalent to 80% of vegetation cover | |
| Land for water area and water conservancy facilities | 0 | Forced to 0, so that the amount of erosion is equal to 0 | |
| Other land | Saline alkali soil | 0 | - |
| Sandy land | 0 | - | |
| Swamp land | 0 | - | |
| Bare rock | 0 | - | |
| Bare soil | 1 | - | |
| Glaciers and permanent snow cover | 0 | - |
Disclaimer/Publisher’s Note: The statements, opinions and data contained in all publications are solely those of the individual author(s) and contributor(s) and not of MDPI and/or the editor(s). MDPI and/or the editor(s) disclaim responsibility for any injury to people or property resulting from any ideas, methods, instructions or products referred to in the content. |
© 2023 by the authors. Licensee MDPI, Basel, Switzerland. This article is an open access article distributed under the terms and conditions of the Creative Commons Attribution (CC BY) license (http://creativecommons.org/licenses/by/4.0/).
Copyright: This open access article is published under a Creative Commons CC BY 4.0 license, which permit the free download, distribution, and reuse, provided that the author and preprint are cited in any reuse.


