Submitted:
27 November 2023
Posted:
28 November 2023
You are already at the latest version
Abstract
This research deals with risk assessment for human life, man-made infrastructure, and agriculture in a landslide-prone area using GIS-based spatial methods. The study area landslide inventory map was prepared based on previous landslide information, aerial photograph analysis, and several field observations. A total of 550 landslides have been included with 182 debris flow and 368 soil slides. All included landslides were classified into two groups by random selection; half were used for model calibration and the rest were used for cross-validation. In the analysis, fourteen causative factors were vastly used, such as aspect, slope, curvature, elevation, topographic wetness index, forest timber diameter, forest type, forest crown density, forest age, land-use, geology, soil drainage, soil depth, and soil texture. Moreover, to identify the interaction between occurred landslides and causative factors, the affected pixels were divided into different sub-classes using a frequency ratio method. Based on the total dataset, three landslide susceptibility maps were constructed using Bayesian prediction, likelihood ratio, and fuzzy set method. By evaluating cross-validation and success rate curve, model susceptibility results were plotted with a receiver operating characteristic (ROC) curve and the area under the curve (AUC) was estimated. In addition, for risk assessment, each social data layer such as agriculture, house, industry, business, road, river, population intensity, monetary value, and vulnerability level was added based on the local standard and incident time and was converted into US dollars. During the analysis, each method hazard map was used with a specific group of thematic data layers. Subsequently, for preparing the probability table, study area total pixels and predictive landslide affected pixels were considered. Matching with the affected pixels, a standard of 5000 pixels was selected to run the final evaluation. Based on the results, the agricultural field showed the highest vulnerability and estimated risk of US $ 16.3 million. Further, the man-made infrastructure map showed a risk of US $ 31.3 million. The total estimated population casualties were 6.77, which was relatively similar to the published data.
Keywords:
Landslide
; Spatial prediction
; Vulnerability
; Cross-validation
; Prediction table
; Landslide risk
1. Introduction
A landslide is defined as the propensity of a terrain to produce slope instability [1]. Worldwide, landslides are recognized as very dangerous and widespread natural disasters with negative consequences such as property damage, human casualties, and economic losses, and require excessive maintenance costs. Landslides are most often detected and mapped by combining an interpretation of air photos or multispectral digital imagery and selected ground verification information [2], and are often based on “professional judgment” [3]. Based on location, various types of landslides are known. There are nine different magnitude levels of landslides, and each can cross a few square meters to hundreds or thousands of square kilometers across the land from the starting point. In mountainous landscapes, landslides are more frequently triggered by heavy rainfall [4,5]. Some damaging landslides occur because of human disturbance such as land-use changes, deforestation, excavation, changes in the slope profile, and irrigation; overall, human activities are increasingly involved in causing this hazard [6].
In landslide analysis, susceptibility mapping is a vital tool for disaster management and development activities planning in mountainous terrains of tropical and subtropical environments [7]. Investigation of mass movements could be conducted based on site-specific (individual slope) or regional-scale evaluation [8]. After the development of remote sensing and GIS technology, hazard type studies have been changed from local studies of single events to those at a regional level with assessment of susceptibility or risk [8]. In recent years, landslide susceptible area assessment has played an important role in the developing land utilization regulations aiming to minimize the loss of lives and damage to property [9]. Further, considering the increasing awareness of socio-economic impacts and pressure of urbanization on the environment, systematic research on landslide has been undertaken globally, including inventory mapping, susceptibility mapping, hazard mapping, and risk assessment [10]. Landslide susceptibility maps can be prepared in many ways such as by using the probabilistic method [11,12,13], and statistical models [14,15,16,17,18,19,20,21].
Studies on natural hazards including landslide susceptibility and landslide risk, usually literature dealing with the general principles, theory, economy, and management of risk [8]. Risk assessment is very common during landslide susceptibility analysis and can show the probability (susceptibility) and impact range or potential damage that is even could generate (vulnerability), as well as population number with the related risk. Hills and mountains are the dominating landform in Korea and cover almost 70% of the total area. Globally, Korea is recognized as one of the most landslide vulnerable countries because of its unique topography and climate. This study has been done to protect lives and property in the selected area for effective land-use management. Particularly, mapping the areas that are susceptible to occur landslides and landslide related risk. Numerous studies have done on different purpose in the same study area but they are not identified landslide risk [22,23,24]. Usually the social and economic impacts of landslides are both significant and complex [25]. Considerate with loss of life and injuries, the real impacts are economic and social in the affected area. In our study, we tried to find out landslide related risk based on some high resolution socio-economic data. There are various relevant studies have been done basis on concept, principles, definition, theory, methods, management, case studies, vulnerability and consequences [26,27,28,29,30,31,32,33,34,35,36,37,38,39,40,41]. Slow-moving landslide-induced damage affected areas were also analyzed for the calculation of infrastructural health monitoring [42,43,44,45]. All the related studies help to analyze the study area properly.
The social and economic losses caused by landslides can be reduced or mitigated by effective planning and management of land use [8]. Overall, based on the global impact of property damage and causalities caused by landslides, it is essential to identify future probable landslide hazard areas to avoid or reduce potential damage. Therefore, the present study aimed to create an appropriate landslide susceptibility map by applying various statistical models. Firstly, based on the total historical landslides, the development and distribution characteristics of each landslide was analyzed considering factors condition and identified frequency ratio. Then, the landslide susceptibility map generating spatial models were vastly applied and compared the success rate for an individual model. To obtain cross-validation results, occurrence data were divided into two groups. Moreover, to determine a reliable and acceptable model for susceptibility mapping, three different modeling methods were applied and verified. Finally, based on the socio-economic data, this was used to determine the landslide risk in the study area for supporting policy makers, public authorities and quick responders in identifying hotspots.
2. Materials and Methods
2.1. Study Area
The study area is located at Jinbu district (Pyeongchang County) in Gangwon province and covers almost 146.76 km2 area. Its geographical location lies between 37°34´30˝ to 37°40´00˝ north and 128°29´45˝ to 128°39´30˝ east in the north-eastern site of Korea (Figure 1). This region is mainly mountainous with the highest elevation at 1,390 meters. Its topographic characteristics are low in the north, center as well as west region (490–750 m) and high in the east and south region (750–1,390 m). Korea has a subtropical monsoon climate, with frequent rainfall and annual average precipitation of 1288.7 mm, mostly occurring from July to September, with an average annual temperature of 6.5°C [46]. Regarding drainage area, there are many lakes, canals, and rivers across the country and the land cover mostly at deciduous and coniferous forests.
The geological and morphological formation of land shows a higher probability of landslide occurrence during the heavy rainfall period and on slope step angles. In Gangwon Province, cumulative high rainfall that occurred the day before and during the day of the landslide was the main cause of the landslide, which had a huge debris flow [47]. The geological formation dominated by granite and it was formed during the Jurassic period in the Mesozoic era [8]. These granite batholiths are diagonally aligned in the southwest to northeast direction and the Sambangsan Formations in the southwest region show purple to greenish gray fine sandstone and siltstone across the study area [48]. July 2006, this region was vastly affected by landslides after the typhoons Ewiniar, Balis and Kaemi, accompanied with heavy rainfall, and resulted in large social and economic losses [49,50]. In this country, the summer season (June, July and August) rainfall and typhoons, which are created in the Pacific Ocean every year, are considered the main triggers for landslide. Usually, most of the typhoon moves northward along the Yellow Sea, then across the vicinity of Baeknyeongdo Island and sometimes little bent to east, and finally reaches the land area of the Korean Peninsula. At the time of the landslide, the influence of western wind blowing from China and the North Pacific high pressure resulted in its slight deviation to the east. Therefore, the typhoon reached the area faster than expected; similar events occurred in the Pyeongchang County.
2.2. Methodology
This research project have done considerate the following Figure 2. First, based on landslide history and aerial photographic analysis, many landslide locations were tested to determine and construct a vector type spatial database using GIS software for the selected area. For all continuous maps the scale was used of 1:5000 and for geology, soil, forest and land-use maps the scale was of 1:25000. In the analytical procedure, elevation, slopes, curvature, topographic wetness index, and aspect were extracted from a digital elevation model. Eventually, forest type, crown density, and timber diameter were extracted from the forest maps whereas soil drainage, depth, and texture were extracted from the soil maps. Moreover, geology and land-use maps were extracted from Korea Institute of Geosciences and Mineral Resources (IGMR) and Ministry of Environment respectively. Second, all data layers such as continuous, thematic, and occurrence were converted into pix to raw image files and then used in method analysis as the causative factor. Third, fuzzy set, Bayesian, and likelihood ratio models were used for obtaining landslide susceptibility maps. By random selection using Excel, all landslide occurrences were divided into two different groups and used in the validation analyzing module to evaluate success ratios. Raster formatted and unique classified socio-economic data were vastly used for study area risk assessment. Based on the incident time, the vulnerability scale and monetary value (Korean national) were chosen for each classified data layer and then converted into US dollars. Finally, any social map was plotted over a specific method landslide hazard map using risk assessment software to identify actual risk. Basically, scientific research goes through collecting, analyzing, and reporting data. In each of these aspects, errors can and do occur. In this work, we gave importance to statistical and data errors.
2.2.1. Fuzzy Set
Zadeh [51] and approximately 300 researchers have developed the fuzzy set theory, which has now begun to be applied in a wide range of scientific research. Based on the relation with a given degree, the fuzzy set theory indicates that objects belong to a set or couples of objects. The idea of the fuzzy theory considered as a spatial object and set member on a map. It also allows partial membership of an object to different classes and considerably calculates the basis of the relative importance of each neighbor with respect to the test instances [52]. In classical theory, an object is considered as a set member depending on its membership value. If the membership value is 1, it counts as a member otherwise, it may not be applicable for calculation. In the fuzzy set theory, certainty level is introduced, and the membership value varies between 0 and 1. Depending on the problem, membership functions or possibility distributions are used to formulate fuzzy numbers. During the analysis of two or more maps with the membership value for the same set, the result can differ with a variety of operators based on their membership values.
A fuzzy set is a pair where AND of fuzzy is alternative to a Boolean AND operation in the classical set values of equation (1). It is defined as:
where represents the fuzzy membership function, at a particular location, μA represents the membership value for map A, and μB is the membership value for map B. When any input map carries the maximum value and use in analysis, the fuzzy OR acts like the Boolean OR, with the following formula. The fuzzy OR is defined as:
The fuzzy algebraic product is defined as:
where, i represents the fuzzy membership value for the i-th map, as well as i = 1, 2, …, n maps to be combined [53]. Each element of a relation, i, results from a pairwise comparison of a thematic layer category. The fuzzy algebraic sum is always complementary and equal to the fuzzy algebraic product, being defined by the following equation:
Gamma operations have various influences on fuzzy set theory. This is defined in terms of the fuzzy algebraic product and the fuzzy algebraic sum [54], is defined as:
where, λ is a value chosen in the range 0,1; using equations (3) and (4), the fuzzy algebraic sum as well as fuzzy algebraic product are calculated. There are many options in the fuzzy model for the gamma operation. In this study, gamma operation (0.5) was used for the fuzzy set model analysis. To determine events and factors, the frequency ratio and membership function were calculated. By using the probability frequency ratio model, the spatial relationship between landslide occurrences and each landslide-related factor was analyzed. The result of the frequency ratio was then normalized between 0.00 and 1.00 to determine the fuzzy membership value [54]. Finally, using fuzzy operators, a landslide susceptibility map was produced.
βcombination = (Fuzzy algebraic sum)λ ∗ ((Fuzzy algebraic product)1−λ
2.2.2. Bayesian
Bayesian probability is one of the major theoretical and practical frameworks for reasoning and decision making under uncertainty [55,56]. In landslide analysis, all pixels are calculated as probable factors and are influenced by future landslide prone areas through the input spatial dataset [57]. Bayesian theory was proposed in the late eighteenth to early nineteenth century by Thomas Bayes and Pierre-Simon de Laplace. For a long time, it was forgotten, but began to be recognized in different application domains in different periods during the twentieth century. In scientific activity, Bayesian probability was never developed as a single and homogeneous theory. Therefore, it was applied under various names.
Bayes’ rule involves the manipulation of conditional probabilities. This theory fundamentally verifies and handles conditional probabilities. It can also be used as a combined probability of two events, M&N, which are expressed as:
In Bayesian probability, all single events is indicated by the hypothesis, H, and the other factor is data, D; it is then possible to judge the relative truth of the hypothesis using Bayes’ rule:
The term P(H|D) is called likelihood function and identifies the probability of observed data based on the hypothesis. Usually, this value depends on the expression of known information regarding the input data for verifying the hypothesis. The term P(H) is called prior, as it reflects prior knowledge before the data are considered. Specification of the prior is often the most subjective aspect of Bayesian probability theory. Moreover, one of the advantages of this theory is that experimenter assumptions are made up front, and the reasoning process is directly revealed. The term P(D) is obtained by summing P(H|D) P(H) over all H, and usually acts as an ignorable normalizing constant. The term P(H|D) is also known as posterior; it is obtained after considering the data as its name suggests, and reflects the hypothesis probability. In case of the n set of hypothesis H1,…,Hn, where H is represented by the following equation:
2.2.3. Likelihood Ratio
The likelihood ratio model provides the user with fewer decisions based on application compared to the fuzzy set model. Based on the theory, it models the conditional probability of occurrences for future landslides in a study area characterized by spatial data [58]. Likelihood ratios are used to assess two things: 1) the potential utility of a particular hazard test, and 2) the likelihood of an incident condition. The likelihood ratio is mainly a probability ratio that a test result is correct, compared with the probability of incorrect test results. The sensitivity and specificity of the test are determined based on the numbers used to generate a ratio, which is calculated by positive and negative test results (value more/less than 1). The equation as:
2.3. Data Source and Analysis
2.3.1. Causative Factors
Initially existing spatial distribution landslide data for this study area were collected in two different ways and used to predict potential future landslides. Using an inventory map, basic information about landslide hazards or risks at a regional level can be obtained [11]. Satellite images spanning all of Korea are provided by the Daum website [59] with a spatial resolution of 0.5 m. During the year 2008, Daum corporation’s digital aerial photographs have been analyzed and verified. First, study area existing landslide locations were identified by aerial photography interpretation [59]. Therefore, the total extracted landsides together with classification were verified by Varnes classification and updated using a handheld GPS [1]. For authentic and reliable outputs, several field visits were performed. In order to accomplish all steps, total 550 polygons, or events, of landslides were included of which 368 were soil slides and the remaining 182 were debris flow by following a scale of 1: 5000. For our inventory, the rainfall caused by typhoons is the main trigger of the landslides. The obtained total landslide data was constructed vector map then converted into a raster called inventory map through ArcGIS software (Figure 3). During the field survey, each landslide coordination are recorded, as a point to use as input data in the susceptibility model. Therefore, we selected two typical landslides in the study area, to show the location and variation of appearance (Figure 4a, b). Most landslides were developed on the steep–moderate mountain slopes of watersheds with relatively high weathered materials or granite jointed areas [8]. Every landslide was counted and displayed an individual location on the map.
The occurrences of landslide is normally influenced by hydrological, topographic, and geological factors. Environmental factors are a collection of data layers that are expected to effect on the occurrence of landslides, and can be utilized as causal factors in the prediction of future landslides [60]. During data collection and susceptibility analysis, most researchers preferred points or polygons as symbols to identify landslides. However, to verify landslide occurrences topographical, geological, and hydrological factors, nine causative factors have been selected in the study area. All selected causative factors were determined based on their scale, availability, and relevance. The final factor selection was based on aerial photography interpretation, historical landslides, field visits, land-use variation, and land forming characteristics in the Korean peninsula. The continuous data for the study area were collected from the National Geographic Information Institute using a digital elevation model with 5 m ˟ 5 m cell size. The other related continuous layers were extracted from the digital elevation model (DEM). The attribute table contains information for all categorical data such as land-use, geology, forest, and soil which were collected from different sources and different scales (Table 1).
2.3.2. Analysis
A frequency ratio is the proportion of national tariff lines which affected by a particular non-tariff barrier or by a specified group of non-tariff barriers regardless of whether the products are affected [61]. The number of occurrences per unit of time are described the frequency of the objects. According to the result of total slides frequency ratio calculation, the maximum number of landslides have occurred on the 20–40 degree slope angle and mostly in the 30°–35° (1.64%) class interval (Figure 5). In the aspect map, landslides frequently occurred on the south, southwest, and southeast facing slopes and showed higher vulnerability (). Landslides occurred very less in the eastern and southern sites because of their high topographic range. Moreover, the highest landslide frequency ratios were calculated between the 600–700 m to 700–800 m class interval in the elevation map. The frequency ratio generally decreased with the increase in altitude and landslides were rarely identified at elevations higher than 1000 m, as there is a very thin cover of soil and rocky materials at this range [8]. In the study, both concave and convex slopes were active, but landslide mostly occurred in concave slope areas. For landslide-related susceptibility analysis, the TWI map is also counted as a very important factor. In the frequency ratio, the topographic wetness index map carried the highest landslide percentage at the first sub-class.
Geology is also considered another most important predisposing factors for landslide occurrence. The following figure represents the landslide ratio, which is divided into six sub classes depending on the formatting parameters of geology. The representing sub-class “granite” showed a significant level of slope instability with a frequency ratio of 1.42% and covered an area of almost 82.25%. The other sub-classes such as the Pleistocene and Choseon were also active but did not carry the maximum frequency ratio. Moreover, in the land-use map, the highest number of landslides occurred in the sub-class of deciduous and coniferous forests that covered almost 49.2% and 32.5% of the area, respectively. The Pine tree forest area had undergone 2,249 landslides and covered 43.78% of the study area; in the crown density map, the loose forest had a frequency ratio of 3.44%. Further, the soil map, sub-class 20–50 m depth, coarse texture, and drainage showed the most vulnerable area with frequency ratios of 1.83%, 1.24%, and 1.41%, respectively compared with the other classes. Based on the following figure, the overall frequency ratio results showed an unsettled relationship between the study area causative factors and landslide occurrences.
3. Results
3.1. Method Application
In any scientific research, the results section normally represents the core findings based on the information gathered using methodology and analysis [8,61]. The result must be described with a very simple explanation, avoiding any bias or false impressions, and should be organized in a logical progression. In this study, there were three modeling methods such as fuzzy set, Bayesian, and likelihood ratio have been vastly used to obtain authentic and reliable landslide susceptibility images by applying different causative factor datasets. During susceptibility analysis, the software data preparation module was used to obtain the .spg image file for each thematic, continuous, and occurrence dataset.
The spatial prediction module was extracted using 8-bit and 32-bit .spg images as result maps; using PCI Geomatics, the 8-bit image was transformed into a TIFF file to obtain the susceptibility level classified map. The ArcGIS 10.1 software was used to classify the result map. Each map carried 200 equal interval classes were reclassified again into thirteen classes comprising 10%, 5%, and 1% intervals; the study area total of 100% and a most hazardous area of 1% was identified. Each resultant map of the study area, with an approximate surface area of 5% was assigned as the most susceptible for future landslides, and was represented by magenta and purple color. Half of the study area was denoted as a safe zone for landslide occurrence, and was marked in dark blue to light blue. Figure 6 (a, b, and c) shows the classified landslide susceptibility maps produced using the fuzzy set, likelihood ratio, and Bayesian predictive models.
3.2. Cross Validation
In landslide susceptibility mapping, most of the result map showed that landslides are strongly connected with relative causative factors such as climate, geology, soil, forest, morphology, and land-use, which are mostly influenced by heavy rainfall [8]. The Korean Peninsula receives heavy rainfall because of its climatic condition and geographical location. Every year, several typhoons affect this country and influence landslide occurrences in different areas. Jinbu is one of the rainfall prone areas where landslides show a significant relation with the relative causative factors. Each model accuracy was identified using a modeling software cross-validation module. Using the total data (debris flow and soil slides), three landslide susceptibility maps were extracted from the spatial modeling method. The landslide susceptibility map was plotted with a receiver operating characteristic (ROC) curve; the area under the curve (AUC) was calculated, and the most hazardous area was extracted [8]. Based on occurrence data, all ratios were calculated using Microsoft Excel for each model.
In the total landslide susceptibility map, the area under curve (AUC) and the most hazardous area success rate (SR20%) was extracted and plotted using Microsoft Excel and subsequently subjected to modeling using the fuzzy set, Bayesian, and likelihood ratio methods (Figure 7). The likelihood ratio and fuzzy set model contained nearly similar results and showed an accuracy level of 0.862614 and 0.864796. The Bayesian model with an AUC of 0.858132 also showed high accuracy. According to the result and comparison of each model, the likelihood ratio method showed the highest accuracy of 86.48% and was assigned as the best and most reliable model for total landslide susceptibility analysis in the study area. Further, the fuzzy set, Bayesian and likelihood ratio models indicated 75.9%, 76.7%, and 77.0% as the most hazardous 20% area, respectively. Compared with the validation result, the Bayesian predictive model is less accurate than the likelihood ratio and fuzzy set models.
3.3. Risk Assessment
Risk assessment indicates the overall potential harm to describe hazards and risk factors in a specific area. Landslide risk assessment provides guidelines to practitioners for establishing the likelihood and extent to which future slope failures could adversely impact society and affect people and society [62]. Risk identification is the main target for any landslide susceptibility analysis. During analysis, the actual risk elements for different types of landslides are determined. Many factors influence the risk, crossing the academic boundaries between science, technology, economy, location, planning, and policy [8]. Risk assessment is not easy, and is always uncertain and complex, therefore it needs the combination of various methods, techniques, and tools during analysis. Expertise in various field including geomorphology, engineering, climatology, metrology, hydrology, statistics, mathematics, social sciences, environmental sciences, and history is also needed. This study used some structural testing procedures to identify the hazardous areas and to evaluate their advantages and disadvantages. Globally, very few researchers are working on landslide risk assessment compared to susceptibility mapping and hazard analysis. The basic terms of “susceptibility” and “vulnerability” are often used in landslide analysis, where “susceptibility” refers to the factors inherent to physical predisposition whereas “vulnerability” often refers to external factors such as occupation or casualties [8]. Moreover, highly mountainous and seasonal heavy rainfall-prone areas in Korea have undergone very little work on risk assessment.
In literature review, various definitions of risk have been recognized, including partial risk, specific risk, value risk, total risk, and multiple risk [63]. The definition and classification of risk have proposed by Varnes and approved by the Office of the United Nations Disaster Relief Co-operation (UNDRO) for all categories of natural hazards, which are applied to the risk and posted by mass movement, according to the equation:
Usually, a landslide risk is defined using equation 10 where, exposure the period and is also commonly used in landslide hazard assessment as well, , and to determine the vulnerability of landslide, , or
The probabilities for landslide hazard and vulnerability is expressed by equation 11 where, individual landslide risk is assigned as . This also provides the combined probability of landslide hazard and vulnerability, during the occurrence of a specific landslide. When vulnerability depends on the hazard, landslide risk is determined by the following equation:
where, specific landslide risk is indicated by the probability of the hazard multiplied by the probability of future damage. Equation 12 is applicable in the identification of specific element-related risk magnitudes in a harmful landslide. Specific value risk is the loss or damage to an individual element, excluding human life, resulting from a specific affected hazardous area [8]. Using utilitarian, monetary, and intrinsic value evaluation, risk can be analyzed and expressed for a significant value. Multiple risk seams to result from multiple specific elements extracted from specific hazard-affecting landslides. Finally, total landslide risk, can be calculated by counting the expected number of lives lost, injured persons, and property damage or economic losses caused by landslides through the total risk of specific elements determined from all hazard-affecting landslides [8]. Using standard probability concepts and methods, total landslide risk can be evaluated when it is counted as a probability.
3.3.1. Social Data Analysis
Globally, all types of natural hazards including landslides have been responsible for a high percentage of casualties and economic losses in the relevant areas. Every year, a significant number of people suffer from this problem in South Korea. Landslide-related social and economic losses can be reduced by applying effective initiatives and proper management. Risk assessment for any natural hazard is linked with several socioeconomic elements, such as the distribution of economic activities, infrastructures, human lives, and valuable assets [25,64]. Risk assessment in the study area, various social data including household, population, agriculture, industry, business, others, rivers and roads have been considered (Table 2). Landslide risks evaluating all thematic data layers were extracted from the Korean National Geographic Information Institute with a scale of 1:5000. Comparing the others in the contest of causality analysis, this study was unique because of the population map which was prepared based on GRID data. The process of clarifying hazardous areas, vulnerability, and risk must target the prevention of natural disasters. However, cross-validation techniques have been briefly used to evaluate the probability of hazardous events occurrences along with possible scenarios to produce risk prediction maps [64]. This analysis will help to evaluate the application and requirement of such maps for any disaster reduction and mitigation plan.
Using a risk assessment software, socio-economic data were input into thematic data layers and a table (TL) was generated. A probability table was computed for each pixel by transferring the prediction rate table [8]. The expected future damage pixels (PrTa) were extracted based on the average number and size of hazardous events. When the probability table could not carry good monotonic and non-decreasing slope properties, another transformation was extracted (M–Ta). However, if the newly transformed table shows much irregularity or fluctuation, a more advanced smooth curve (F–Ta) adjustment procedure can be applied. Finally, a risk map can be generated using any one of the probability tables as input data, any specific socio-economic thematic data layer or all thematic data layers with their monetary value, as well as the vulnerability table and susceptibility, to analyze the hazard prediction image.
4. Discussion
For analyzing risk through a risk assessment software, the basic requirement is considered as monetary value and vulnerability level for each individual class of thematic data. In this study, monetary value was selected for individual class thematic data based on local currency at the incident time and was converted into US dollars. In 2006, 1 US dollar was equal to 960 Korean won. The thematic data agriculture map showed 1 m2 and monetary value was evaluated for two classes as US $ 37 and US $ 2, respectively. The river map was also prepared similar to the agriculture land and monetary value was respectively estimated as US $ 41 and US $ 21 for two classes. Moreover, the thematic data of road and household were counted as 1m unit maps and classified into three sub-classes with respective monetary values of US $ 1234, US $ 617, and US $ 6 for road and US $ 676, US $ 1100, and US $ 1477 for house. The remaining thematic data for industry, others, and business were counted as single class maps with a unit of 1m2 and the same procedure monetary values of US $ 2351, US $ 783 and US $ 17466. Before the final analytical procedure, the text tables PrTa and M-Ta were prepared and future landslide affected pixels were counted as 5,000. The total pixels of the study area (5,870,281) and the assumed pixels were used with the prediction-rate table from CV module to generate the probability table, PrTa and the monotone table M-Ta [8].
Finally in landslide risk assessment, individual thematic data layers with the probability table were used with an 8-bit hazard map of the spatial prediction module. The total population number (10,147) was identified by counting the household number. Results showed the risk to agriculture as US $ 35.4 million, that to man-made infrastructures as US $ 39.3 million, and number of casualties as 15.31 with the Bayesian model; with the fuzzy set model, the risk to agriculture was US $ 16.3 million, that to man-made infrastructures was US $ 31.3 million, and number of casualties was 6.77; and with the likelihood ratio model, the risk to agriculture was US $ 37.2 million, that to man-made infrastructures was US $ 40.8 million, and the number of casualties was 10.50 (Table 3).
During the incident time, the total number of casualties were counted as 11 persons, where 7 persons were accounted by the specific natural disaster landslide, as published on a government site [49]. For each type of disaster, man-made infrastructural and agricultural losses were also counted separately. This authentic information mostly matched that of the Fuzzy set model results with 5,000 pixels assumed to be affected; the others parameter results also showed satisfactory standards [8]. In this study area, the total pixels were counted as 5,870,281, where the landslide-affected pixels were 5,137, which is very close to the assumed pixel value of 5,000. Therefore, the fuzzy set model was determined as the best and reliable method for risk assessment in this area (Figure 8, Figure 9 and Figure 10). In each category, landslide high risk areas are found where the susceptibility and vulnerability values were high and represented by purple color. On the other hand, our study’s low landslide risk areas are found where susceptibility and vulnerability value gradually decreased and shown by different color with ratio.
5. Conclusions
As the social and economic losses caused by landslides can be reduced or mitigated by effective planning and management of land use, it is essential to identify future probable landslide hazard areas to avoid or reduce potential damage. In this study, various factors and statistical methods were applied and regulated over a specific area. Using a spatial prediction model and aerial photography images, a thematic database needed for future analysis and mapping of this area was prepared. The basic interaction between previous landslides and related causative factors were investigated depending on selective factors. Moreover, this study also calculated the frequency ratio to identify the number of landslide occurrences in each thematic and continuous map and individual sub-lasses. The attained all the objectives fixed at the beginning of the analysis. Based on these results, during susceptibility analysis, the likelihood ratio model showed 86.48% accuracy, and seems to be a reliable and applicable model. For model verification and accuracy compression, each landslide susceptibility map was plotted together with a receiver operating characteristic (ROC) curve and the area under the curve (AUC) was evaluated to determine the success ratio curve through a cross-validation module. Finally, in risk assessment, it is difficult to select a monetary value and parameter for each thematic social data layer. However, in this study, eight different socio-economic thematic data layers were selected along with their vulnerability standards and monetary values using a specific hazard map and probability table.
Risk assessment is the ultimate target for any landslide hazard analysis through combined calculation of the risk of individual slope failures or multiple landslides to different assets, and mitigating the effects of slope failures on humans and their surroundings. In this study, we shortly discussed the theory and methods along with the differences in different methods and data layers that are useful for identifying landslide risk. Moreover, for each thematic socio-economic data, monetary value was added based on the local currency standard at the time. The result showed that the agricultural field 190 number class in the fuzzy set model extracted the maximum risk cost and that the evaluated total risk was estimated of US $ 16.3 million. Among man-made infrastructures, roads were considered at the highest risk area with a total estimated risk of US $ 31.3 million and total population casualties were calculated as 7, which was very close to the number published by the Korean government. The risk assessment result for landslides depends on reliable information on the occurrence frequency, types, and damage level caused by the expected number of pixels to be afflicted by future landslides. Landslide risk assessment is usually used to fulfill the political, social, and technical perspectives. For the most acceptable and reliable landslide risk results, researchers or experts need to collaborate with planers, economists, builders, civil defense managers, decision makers, and concerned citizens regarding the affected field. According to the result of this study, risk map can be used to take proper disaster management planning such as priority based valuable elements, public service centers, crop volts and human shelters. The methodologies and process applied in this study, can be used to study the similar field or different hazard field such as flood or mountain fire areas, to make more significant and reliable risk map that can protect also human lives.
Author Contributions
Al-Mamun conceived and designed the research idea, analyzed the data, and wrote the manuscript; Dong-Ho Jang revised the manuscript critically and improving the quality of the research.
Funding
This work was supported by the research grant of the Kongju National University in 2021.
Data Availability Statement
The data used to support the findings of this study are available from the corresponding author upon request.
Acknowledgments
The authors would like to thank Seong-Ho Lee, Ye-Seul Lee, and Hye-Yeon Yoon for providing the datasets and also grateful to the editors and anonymous reviewers whose comments have significant influence to improve this paper.
Conflicts of Interest
The authors declare that there are no conflicts of interest to publish this paper.
References
- Varnes, D.J. Slope movement types and processes. Landslides: Analysis and Control, edited by Schuster, R.L. and Krizek, R. J. 1978, 176, 11–33.
- McKean, J.; Roering, J. Objective landslide detection and surface morphology mapping using high-resolution airborne laser altimetry. Geomorphology 2004, 57(3-4), 331–351. [CrossRef]
- Wieczorek, G.F. Preparing a detailed landslide-inventory map for hazard evaluation and reduction, Bull. Int. Asso. Eng. Geologists 1984, 21, 337–342. [CrossRef]
- Dikau, R.; Brunsden, D.; Schrott, L.; Ibsen, M. Landslide recognition: Identification, movements and causes. Wiley, Chichester, England, 1996, 251.
- Smith, K. Mass movement hazards, in environmental hazards-assessing risk and reducing disaster. 6th edition, 2009, 205–226.
- Guzzetti, F.; Paola, R.; Mauro, C.; Mirco, G.; Francesca, A. Probabilistic landslide hazard assessment at the basin scale. Geomorphology 2005, 72(1-4), 272–299. [CrossRef]
- Dahal, R.K.; Hasegawa, S.; Nonomura, S.; Yamanaka, M.; Masuda, T.; Nishino, K. GIS-based weights-of-evidence modelling of rainfall-induced landslides in small catchments for LSM. Env. Geol. 2008, 54(2), 314–324.
- Mamun, A. Application of the spatial prediction modeling approach for landslide susceptibility mapping and risk evaluation. Ph.D. thesis, Kongju National University, Republic of Korea, 2020.
- Wang, H.; Gangjun, L.; Weiya, X.; Gonghui, W. GIS-based landslide hazard assessment: an overview. Progress in Physical Geography 2005, 29(4), 548–567. [CrossRef]
- Aleotti, P.; Chowdhury, R. Landslide hazard assessment: summary review and new perspectives. Bull. Eng. Geol. Environ. 1999, 58, 21–44. [CrossRef]
- Sujatha, E.R.; Kumaravel, P.; Rajamanickam, G.V. Assessing landslide susceptibility using Bayesian probability based weight of evidence model. Bull. Eng. Geolo. Environ. 2014, 73, 147–161. [CrossRef]
- Saponaro, A.; Pilz, M.; Wieland, M.; Bindi, D. Landslide susceptibility analysis in data-scarce regions: the case of Kyrgyzstan. Bull. Eng. Geolo. Environ. 2015, 74(4), 1117–1136. [CrossRef]
- Strauch, R.; Istanbulluoglu, E.; Riedel, J. A new approach to mapping landslide hazards: a probabilistic integration of empirical and physical based models in the North Cascades of Washington, USA. Nat. Hazards Earth Syst. Sci. 2019, 19, 2477–2495. [CrossRef]
- Yilmaz, I. Landslide susceptibility mapping using frequency ratio, logistic regression, artificial neural networks and their comparison: a case study from Kat landslides, Turkey. Computer and Geoscience 2009, 35(6), 1125–1138. [CrossRef]
- Bednarik, M.; Magulova, B.; Matys, M.; Marschalko, M. Landslide susceptibility assessment of the Kralovany Liptovsky Mikulas railway case study. Physics and Chemistry of the Earth Parts A/B/C 2010, 35(3-5), 162–171. [CrossRef]
- Ozdemir, A.; Altural, T. A comparative study of frequency ratio, weights of evidence and logistic regression methods for landslide susceptibility mapping: Sultan Mountains, SW Turkey. J. Asian Earth Sci. 2013, 64, 180–197. [CrossRef]
- Khodadad, S.; Cho, S.H.; Jand, D.H. Assessment of landslide susceptibility using GIS-based models in Jinbu area. J. Korean Geomo. Asso. 2016, 23(4), 153–167. [CrossRef]
- Chen, W.; Panahi, M.; Tsangaratos, P.; Shahabi, H.; Ilia, I.; Panahi, S.; Li, S.; Jaafari, A.; Ahmed, B.B. Applying population based evolutionary algorithms and a neuro-fuzzy system for modeling landslide susceptibility. Catena 2019, 172, 212–231. [CrossRef]
- Hu, M.; Liu, Q.; Pengyu, L. Susceptibility assessment of landslides in Alpine Canyon region using GIS-based models. Wuhan Univ. J. Nat. Sci. 2019, 24, 257–270. [CrossRef]
- Klai, A.; Haddad, R.; Bouzid, M.K.; Rabia, M.C. Landslide susceptibility mapping by fuzzy gamma operator and GIS, a section of the national road nº11 linking Matur to Beja, Nortshem Tumisia. Arab. J. Geosci. 2020, 13, 58. [CrossRef]
- Segoni, S.; Pappafico, G.; Luti, T.; Catani, F. Landslide susceptibility assessment in complex geological settings: sensitivity to geological information and insight its parameterization. Landslides 2020, 17(10), 2443–2453. [CrossRef]
- Lee, S.; Oh, H.J. Ensemble-based landslide susceptibility maps in Jinbu area, Korea. Terri. Mass Mobe. 2012, 193–220. [CrossRef]
- Cha, D.; Hwang, J.; Choi, B. Landslide detection and volume estimation in Jinbu area of Korea. Forest Sci. Tech. 2018, 14(2), 61–65. [CrossRef]
- Lee, M.J.; Choi, J.W.; Oh, H.J.; Won, J.S.; Park, I.; Lee, S. Ensemble-based landslide susceptibility maps in Jinbu area, Korea. Env. Earth Sci. 2012, 67, 23–37. [CrossRef]
- Winter, M.G. Landslide hazards and risks to road users, road infrastructure and socio-economic activity. Proceedings of the 17th ECSMGE, 2019, 1118. [CrossRef]
- Jang, D.H. Risk analysis for man-made infrastructures in the Beoun area for landslide disaster. J. Korean Geomo. Asso. 2006, 13(3), 1–15.
- Dimri, S.; Champatiray, P.K.; Lakhera, R.C.; Santosh, S.; Fuzzy set based method for landslide hazard assessment in active seismic zone of Himalaya. Landslides 2007, 4, 101–111. [CrossRef]
- Wood, N.J.; Burton, C.G.; Cutter, S.L. Community variations in social vulnerability to Cascadia related tsunamis in the U.S Pacific Northwest. Nat. Hazards 2010, 52, 369-389. [CrossRef]
- Kappes, M.S.; Papathoma-Kohle, M.; Keiler, M. Assessing physical vulnerability for multi type hazards using an indicator-based methodology. Appl. Geography 2012, 32, 577–590. [CrossRef]
- Fuchs, S.; Keiler, M.; Sokratov, S.; Shnyparkov, A.Q. Spatiotemporal dynamics: the need for an innovative approach in mountain hazards risk management. Nat. Hazards 2013, 68, 1217–1241. [CrossRef]
- Uzielli, M.; Catani, F.; Tofani, V.; Casagli, N. Risk analysis for the Ancora landslide–1: characterization of landslide kinematics. Landslides 2014, 12, 69–82. [CrossRef]
- Bai, S.; Lu, P.; Wang, J.J. Landslide susceptibility assessment of the Youfang catchment using logistic regression. J. Mount. Sci. 2015, 12(4), 816–827. [CrossRef]
- Karagiorgos, K.; Thaler, T.; Huble, J.; Maris, F.; Fuchs, S. Multi-vulnerability analysis for flash flood risk management. Nat. Hazards 2016, 82, 63–87. [CrossRef]
- Promper, C.; Glade, T. Multilayer exposure maps as a basis for a regional vulnerability assessment for landslides: applied in Waidhofen/Ybbs, Austria. N. Hazards 2016, 82, 111–127. [CrossRef]
- Vu-Bac, N.; Lahmer, T.; Zhuang, X.; Rabczuk, T. A software framework for probabilistic sensitivity analysis for computationally excessive models. Adv. Eng. Software 2016, 100, 19–31. [CrossRef]
- Pradhan, B.; Abdulwahid, W.M. Landslide risk assessment using multi-hazard scenario produced by logistic regression and LiDAR based DEM. L. Scam Appl. Landslide Asse. 2017, 253–275. [CrossRef]
- Althuwaynee, O.F.; Pradhan, B. Semi-quantitative landslide risk assessment using GIS-based exposure analysis in Kuala Lumpur City. Geomat. Nat. Hazards Risk 2017, 8(2), 706–732. [CrossRef]
- Liu, X.; Miao, C. Large-scale assessment of landslide hazard, vulnerability and risk in China. Geomat., Nat. Hazards Risk 2018, 9(1), 1037–1052. [CrossRef]
- Azimi, S.R.; Nikraz, H.; Yazdani-Chamzini, A. Landslide risk assessment by using a new combination model based on a fuzzy inference system model. KSCE J. Civil Eng. 2018, 22(11), 4263–4271. [CrossRef]
- Pollock, W.; Grant, A.; Wartman, J.; Grace, A.J. Multimodel method for landslide risk analysis. MethodsX 2019, 6, 827–836. [CrossRef]
- Amashi, A.R.; Hulagabali, A.M.; Solanki, C.H.; Dodagoudar, G.R. Landslide risk assessment and mitigation: a case study. Soil Dynam. Earthquake Geot. Eng. 2019, Springer, Singapore, 249–258.
- Infante, D.; Martine, D.D; Confuorto, P.; Tessitore, S.; Tomas, R.; Calcaterra, D.; Ramondini, M. Assessment of building behavior in slow-moving landslide-affected areas through DInSAR data and structural analysis. Engin. Struct. 2019, 199. 109638. [CrossRef]
- Del Soldato, M.; Solari, L.; Poggi, F.; Raspini, F.; Tomas, R.; Fanti, R.; Casagli, N. Landslide-Induced damage probability estimation couping InSAR and field survey data by fragility curves. Remote Sens. 2019, 11(12), 1486. [CrossRef]
- Miano, A.; Mele, A.; Calcaterra, D.; Di Martire, D.; Infante, D.; Prota, A.; Ramondini, M. The use of satellite data to support the structural health monitoring in areas affected by slow-moving landslides: a potential application to reinforced concrete buildings. Struct. Health Monit. 2021, 20(6), 3265-3287. [CrossRef]
- Li, F.; Torgoev, I.; Zaredinov, D.; Li, M.; Talipov, B.; Belousova, A.; Kunze, C.; Schneider, P. Landslide-induced mass transport of radionuclides along transboundary Mailuu-Suu river networks in Central Asia. Remote Sens. 2021, 13(4), 698. [CrossRef]
- http://www.kma.go.kr/.
- Park, W.; Han, Y.; Jeon, S.; Roh, B. Characteristics of rock failure in metamorphic rock areas, Korea. Landslides and Engineered Slopes, from the past to the future 2008, CRC press, 485–490.
- Geological Society of Korea, Changdong-Hajinburi geological map sheet 1962.
- http://www.korea.kr/.
- Lee, S.; Oh, H.J. Ensemble-based landslide susceptibility maps in Jinbu area, Korea. In Terrigenous mass movements, Springer: Heidelberg, Berlin, 2012, 193–220. [CrossRef]
- Zadeh, L.A. Fuzzy sets, Information and Control. 1965, 8, 338-353.
- Panigrahi, A.; Patra, M.R. Network intrusion detection model based on fuzzy-rough classifiers. Handbook of Neural Computation, Academic Press, 2017, 109–125. [CrossRef]
- Thiery, Y.; Malet, J.P.; Maquaire, O. Test of fuzzy logic rules for landslide susceptibility assessment. In SAGEO: Information Geographique, observation et localization structuration et analyses representation 2006, 16.
- Lee, S. GIS-based spatial analysis for geosciences: geospatial correlative investigation. Korean Inst. Geosci. & Mineral Res. 2012, 188.
- Omar, K.; Nordin, M.J.; Vadakkepat, P.; Prabuwono, A.S.; Abdullah, S.N.; Baltes, J.; Amin, S.M.; Hassan, W.Z.; Nasrudin, M.F. Intelligent robotics systems: inspiring the NEXT. 16th FIRA Roboworld Congress, proceeding Springer, Kuala Lumpur, Malaysia, 16 August 2013.
- Abebe, T. Bayesian spam filter for Wolaytta. Int. J. Adv. Eng. Res. Sci. 2019, 6 (12), 540–544. [CrossRef]
- Chung, C.F.; Fabbri, A.G. Probabilistic prediction models for landslide hazard mapping. Photo Eng. Remote Sens. 1999, 65(12), 1389–1399.
- Chung, C.F.; Fabbri, A.G. Validation of spatial prediction models for landslide hazard mapping, Nat. Hazards 2003, 30(3), 451–472. [CrossRef]
- http://www.daum.net/.
- Westen, C.J.V.; Alkema, D.; Damen, M.C.J.; Kerle, N.; Kingma, N.C. Multi-hazard risk assessment: Distance education course guide book. Enscheda, The Netherlands: United Nations University, 2011.
- Urmi, R.B.R.; Mamun, A.; Jang, D.H. Life risk assessment of landslide disaster in Jinbu area using logistic regression model. J. Korean Geomo. Asso. 2020, 27(2), 65–85.
- Lee, E.M.; Jones, D.K. Landslide risk assessment, London: Thomas Telford. 2014, 1–20.
- Vandine, D.F.; Moore, G.; Wise, M.; Vanbuskirk, C.; Gerath, R. Technical terms and methods: Landslide risk case studies in forest development planning and operations, BC Ministry of Forest, Forest Science program. Abst. Land Manage. Handbook 2005, 56, 13–26.
- Chung, C.F.; Fabbri, A.G.; Jang, D.H.; Scholten, H.J. Risk assessment using spatial prediction modeling for natural disaster preparedness. Geo-inf. Disaster Manag. 2005, 619–640. [CrossRef]
Figure 1.
Study area.
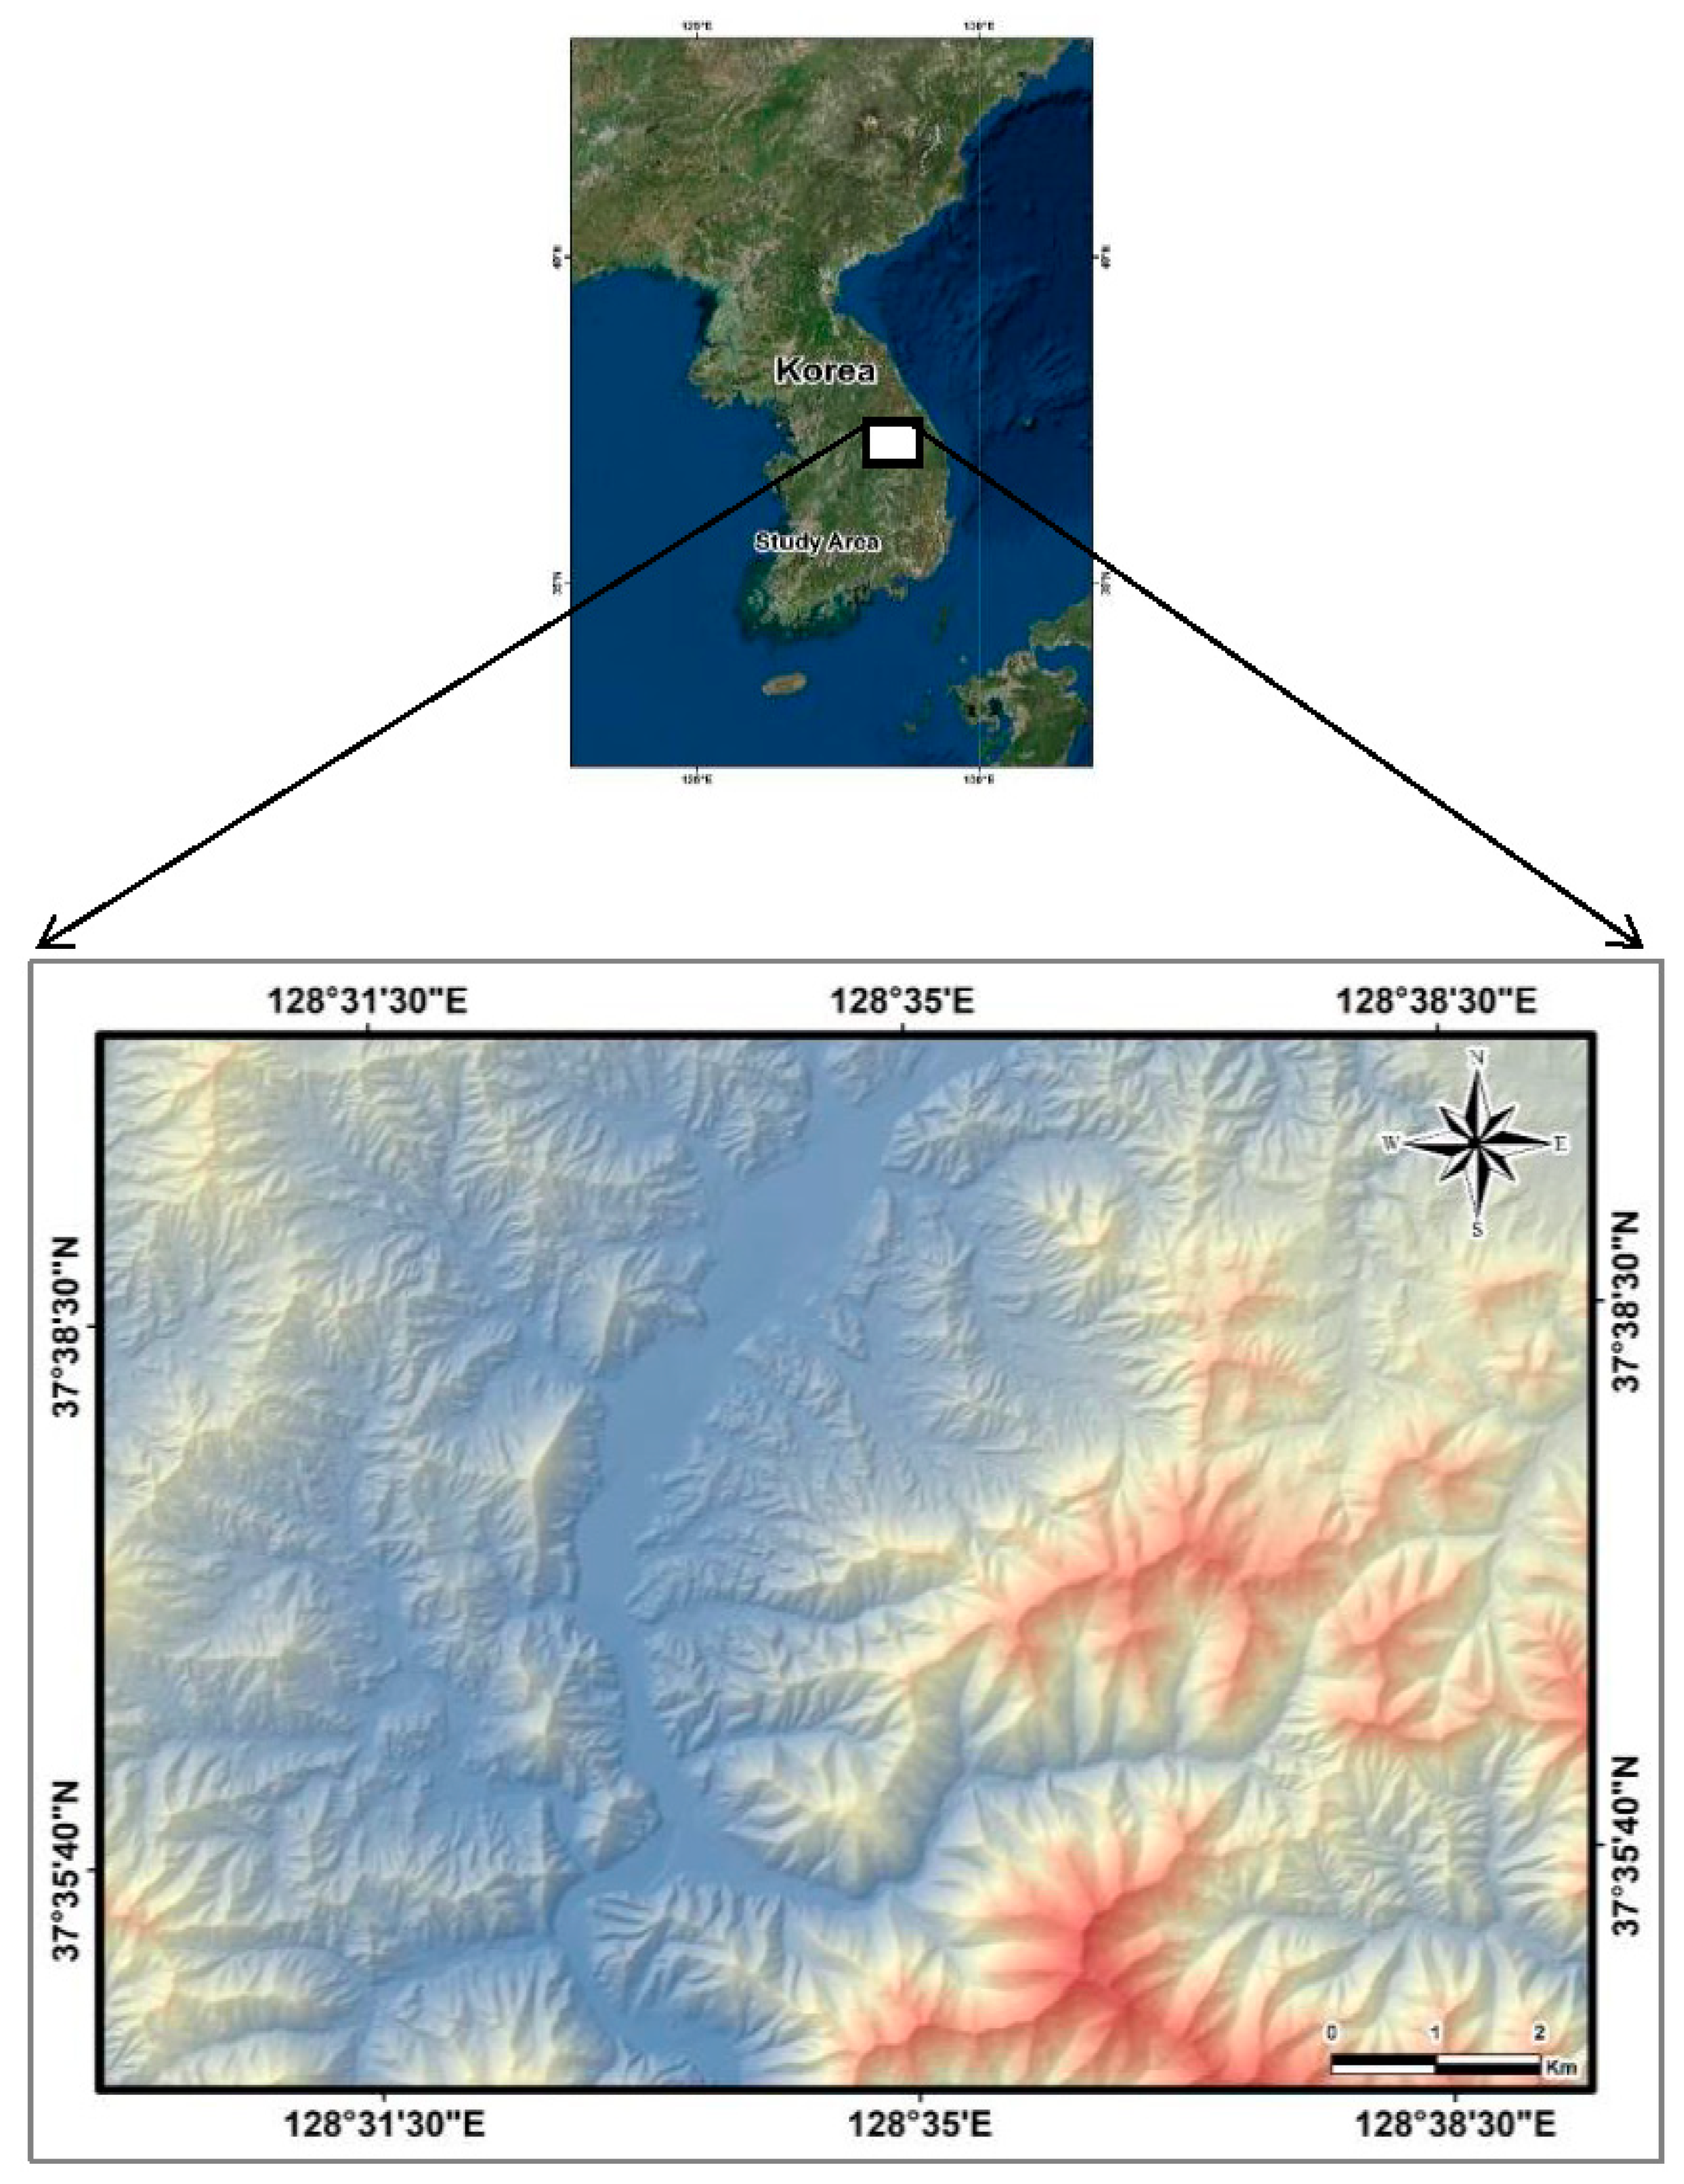
Figure 2.
Methodology flowchart for the research.
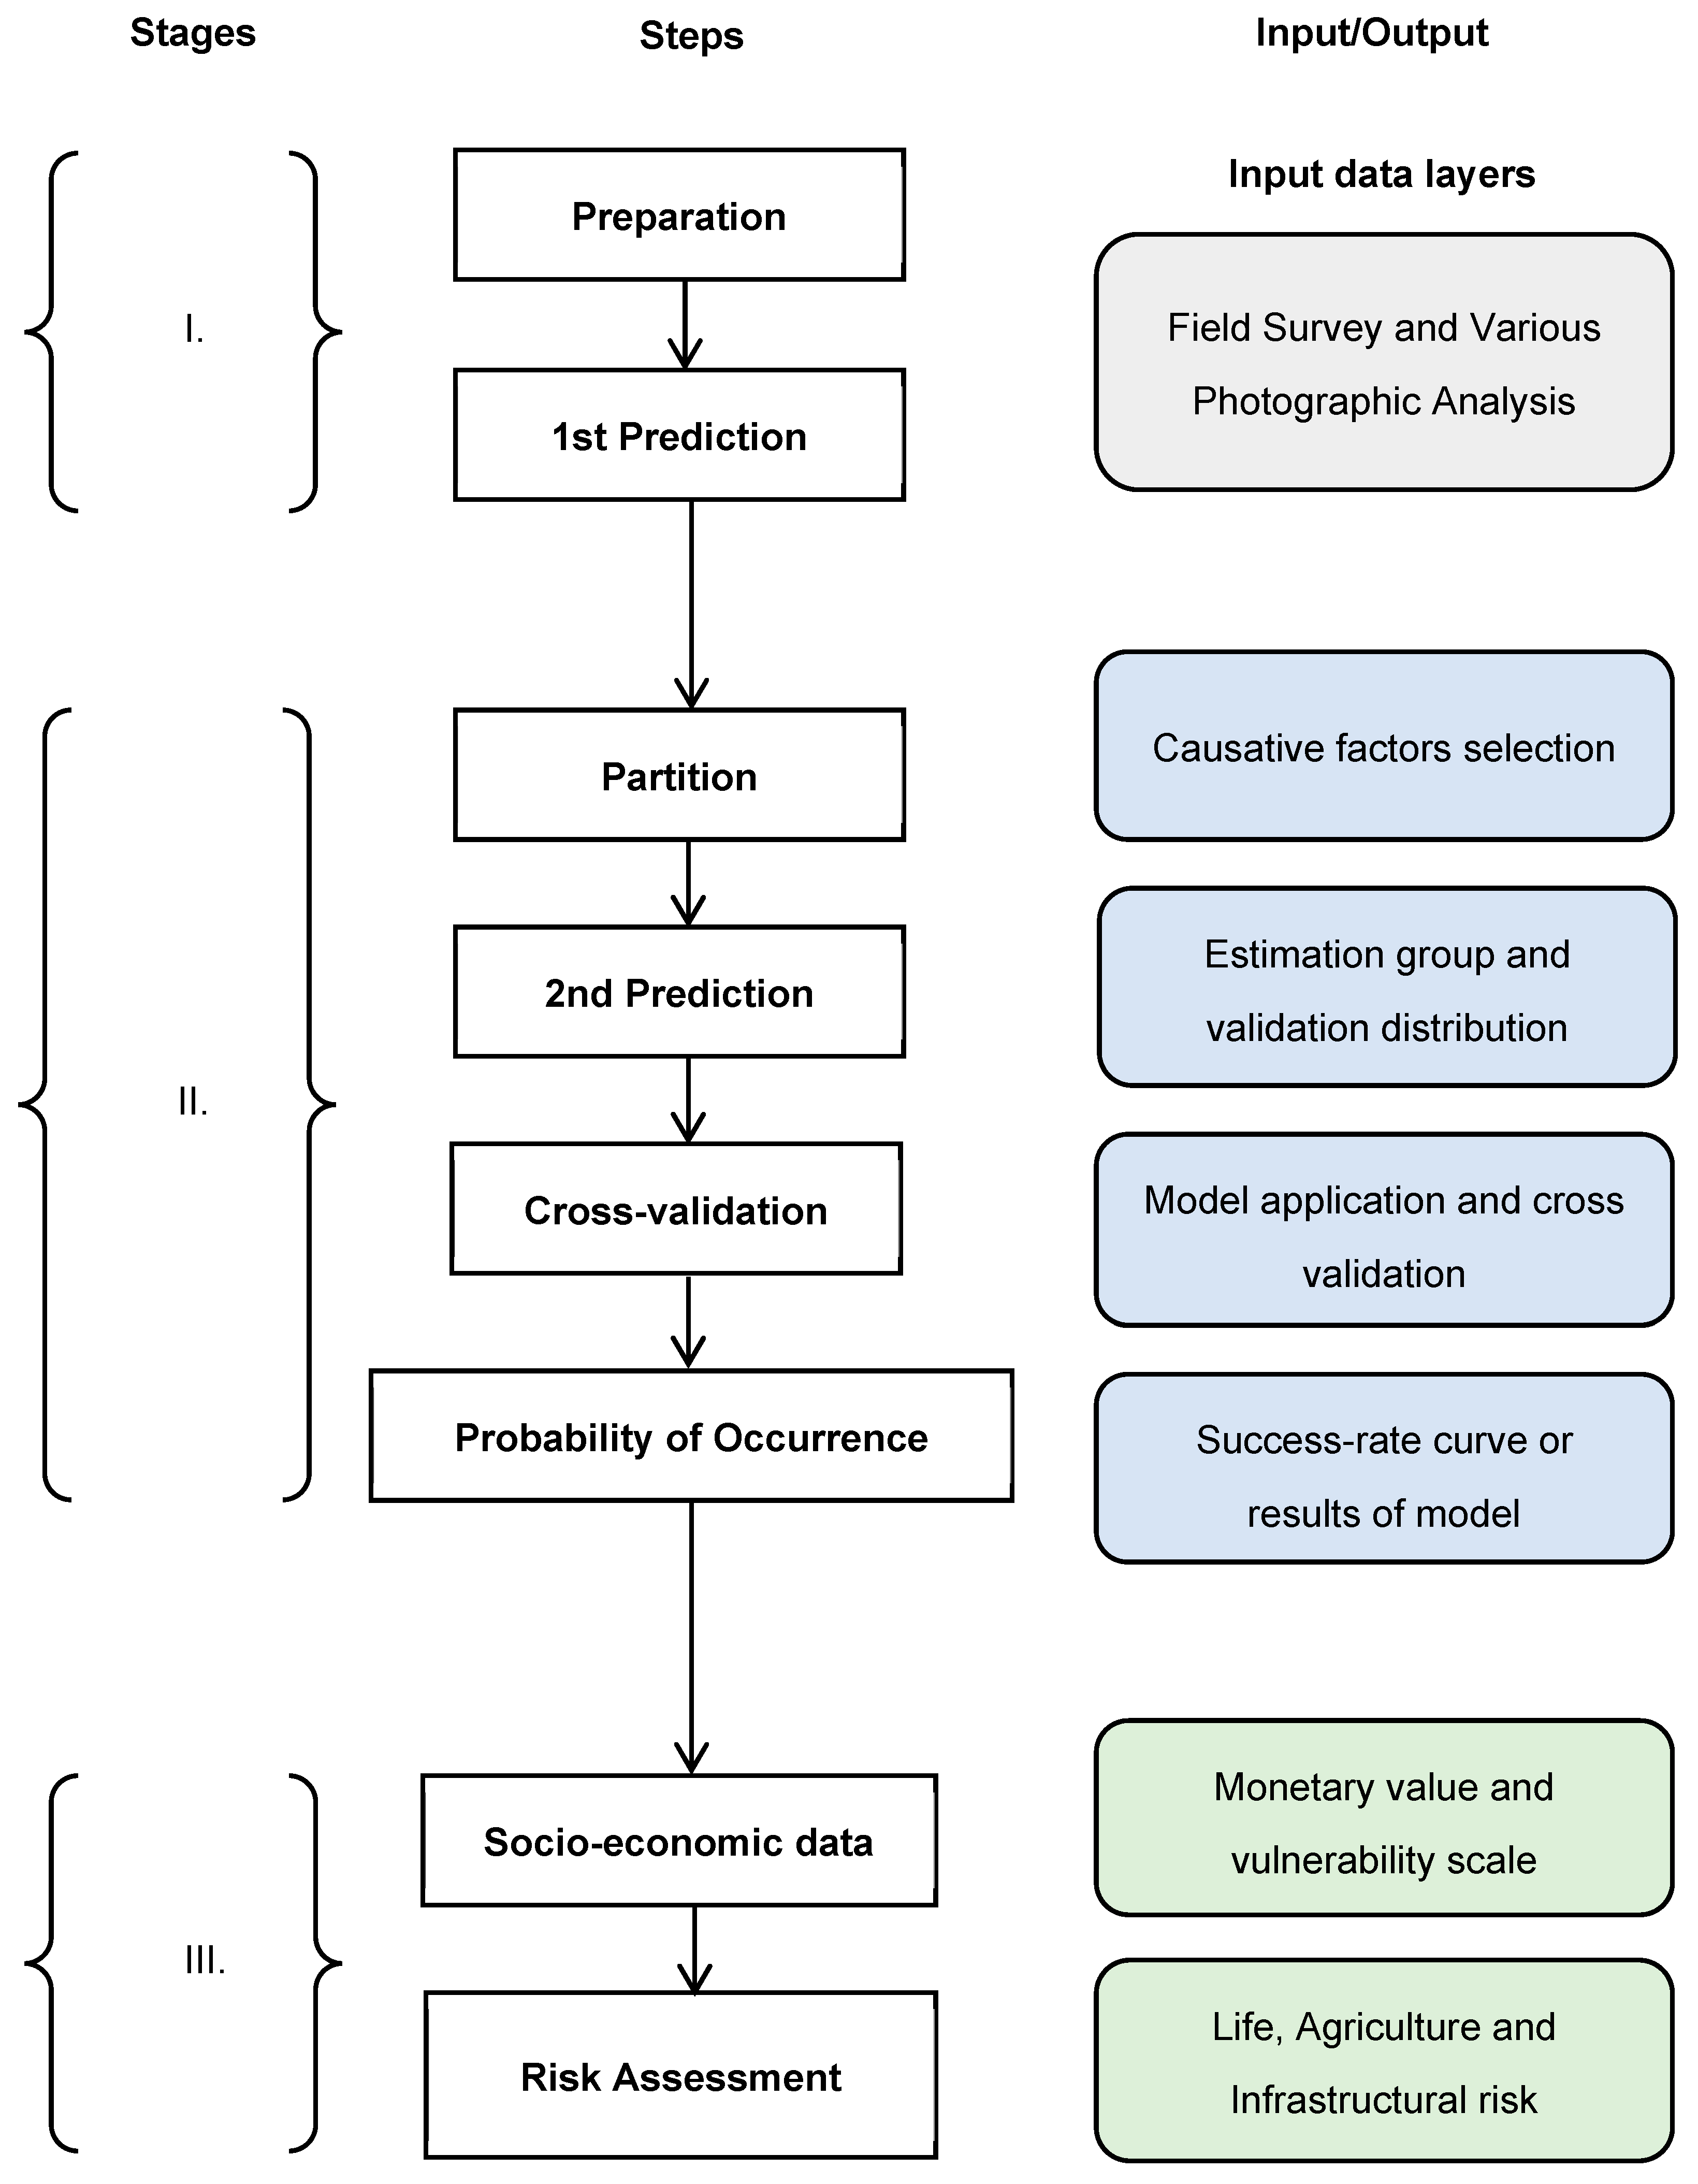
Figure 3.
Landslide inventory map.
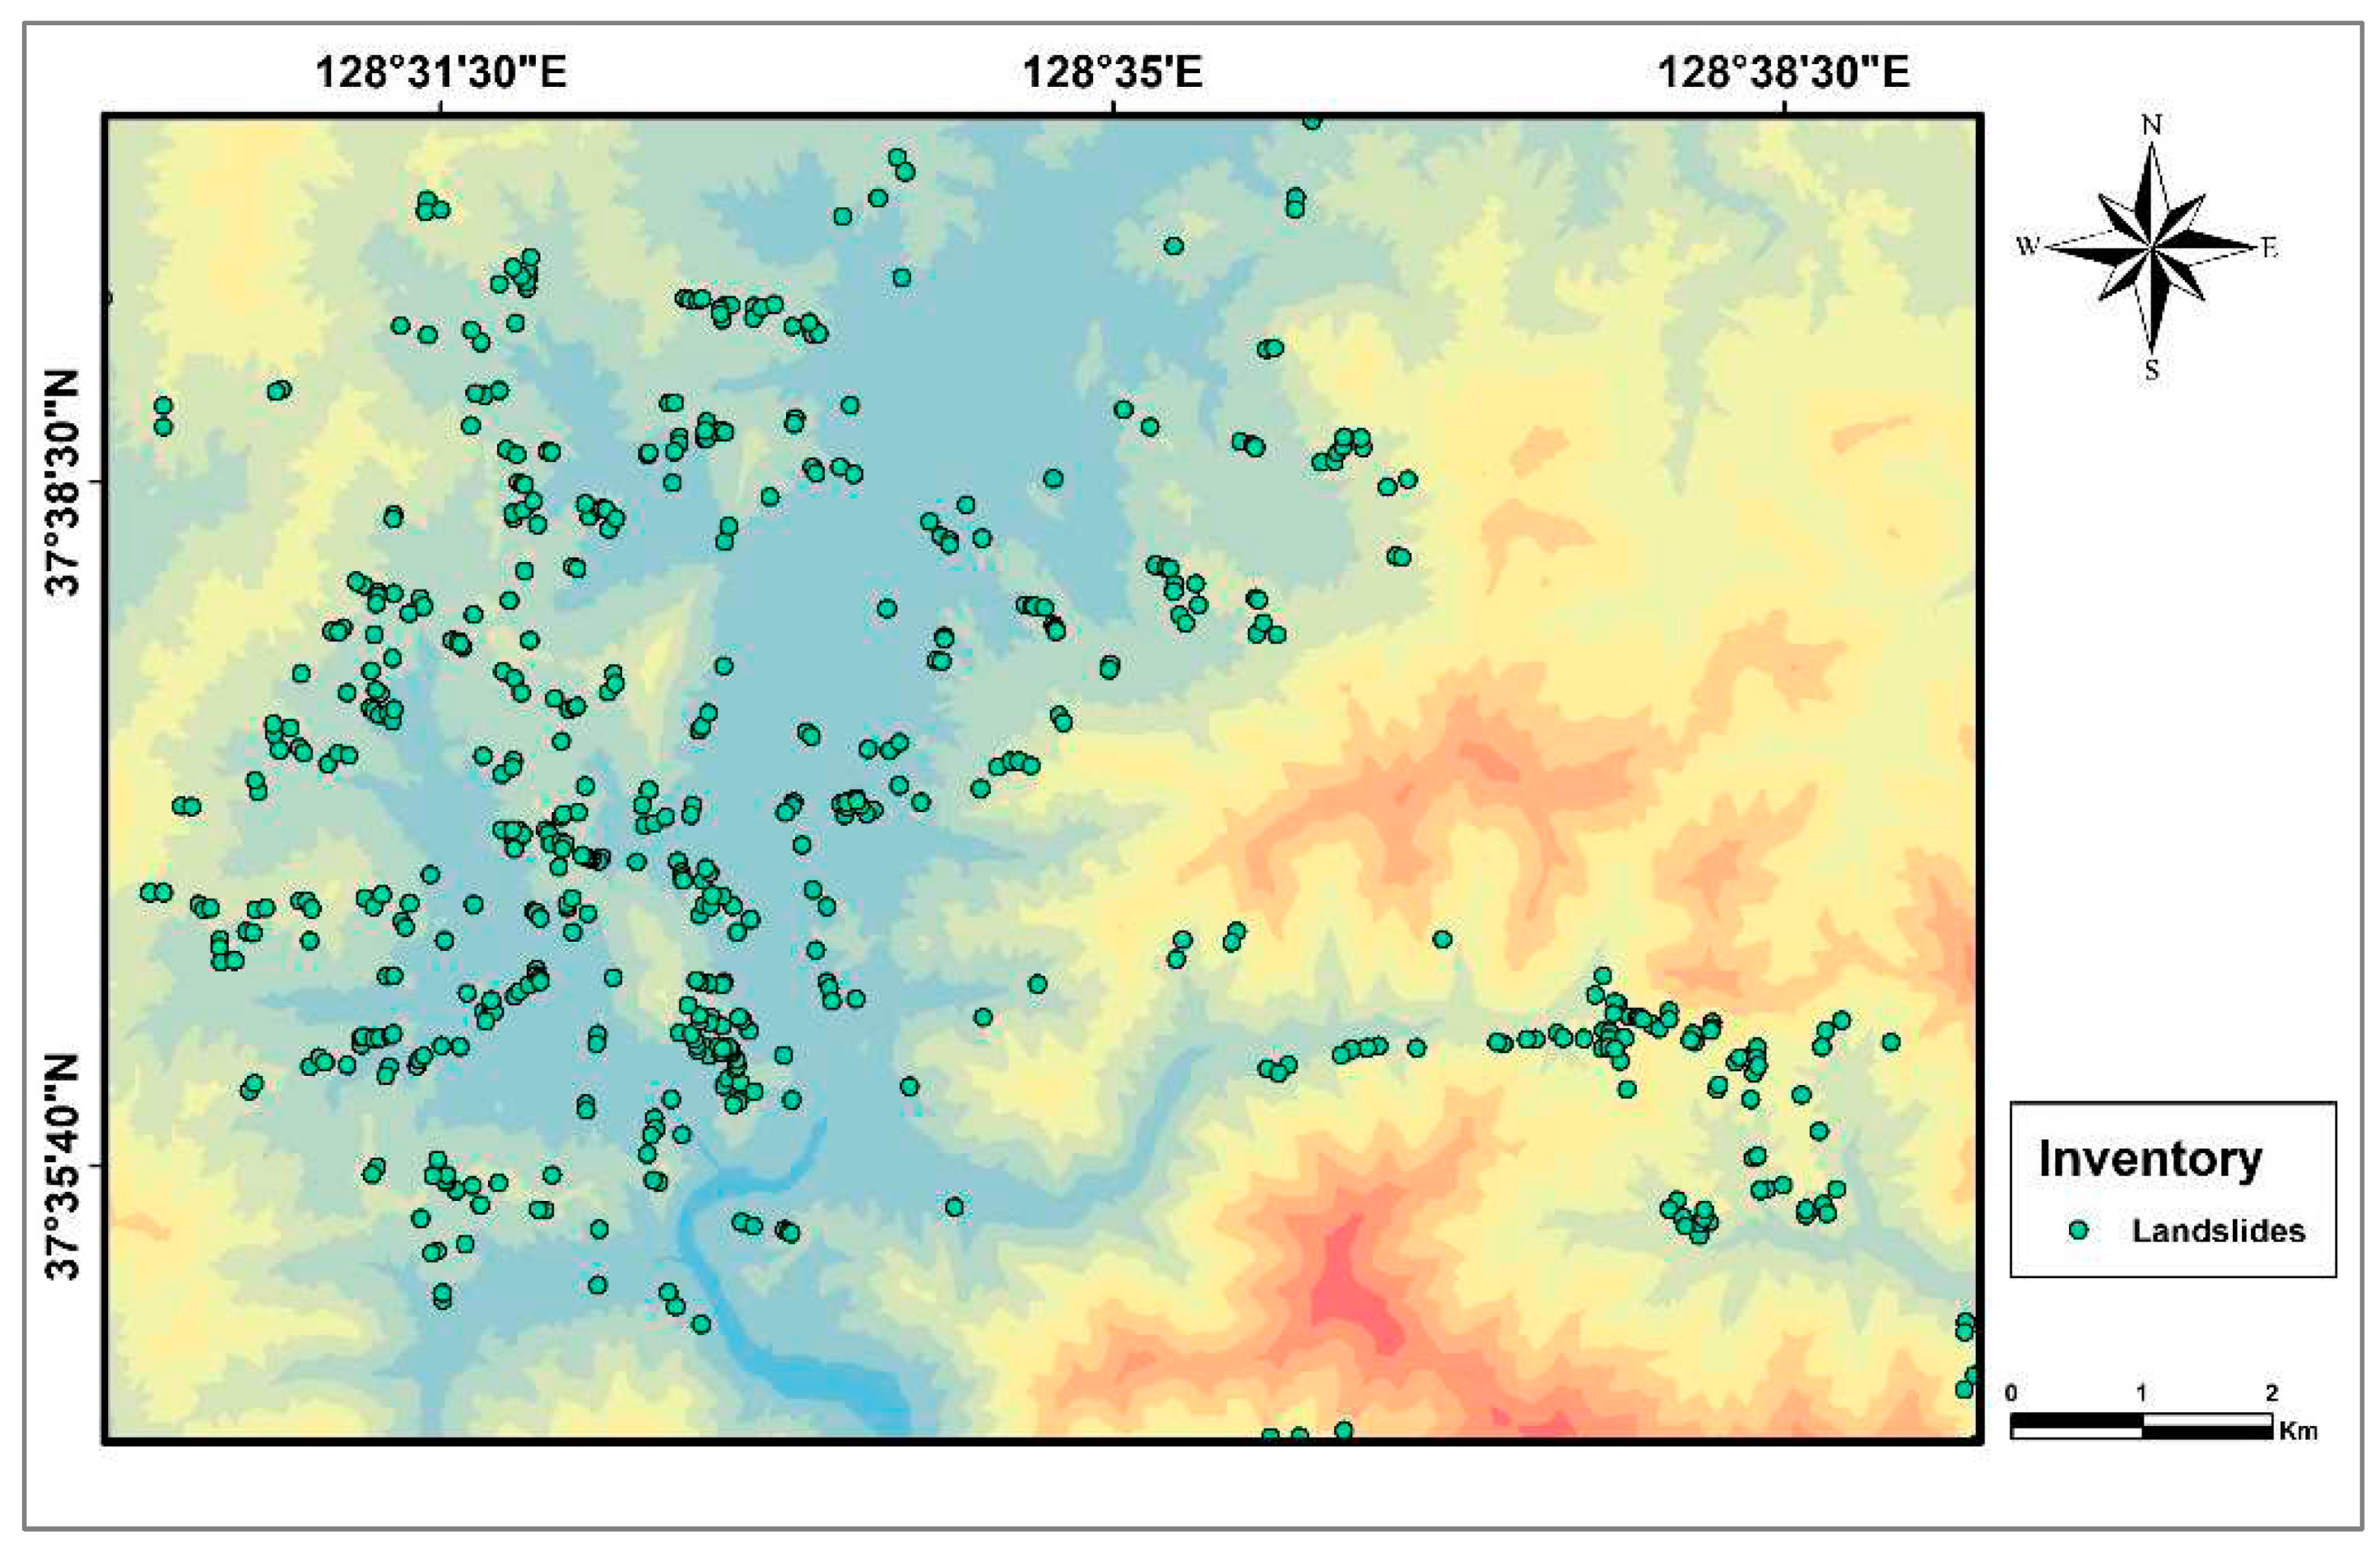
Figure 4.
Field survey landslide images of soil slide (a) and debris flow (b).
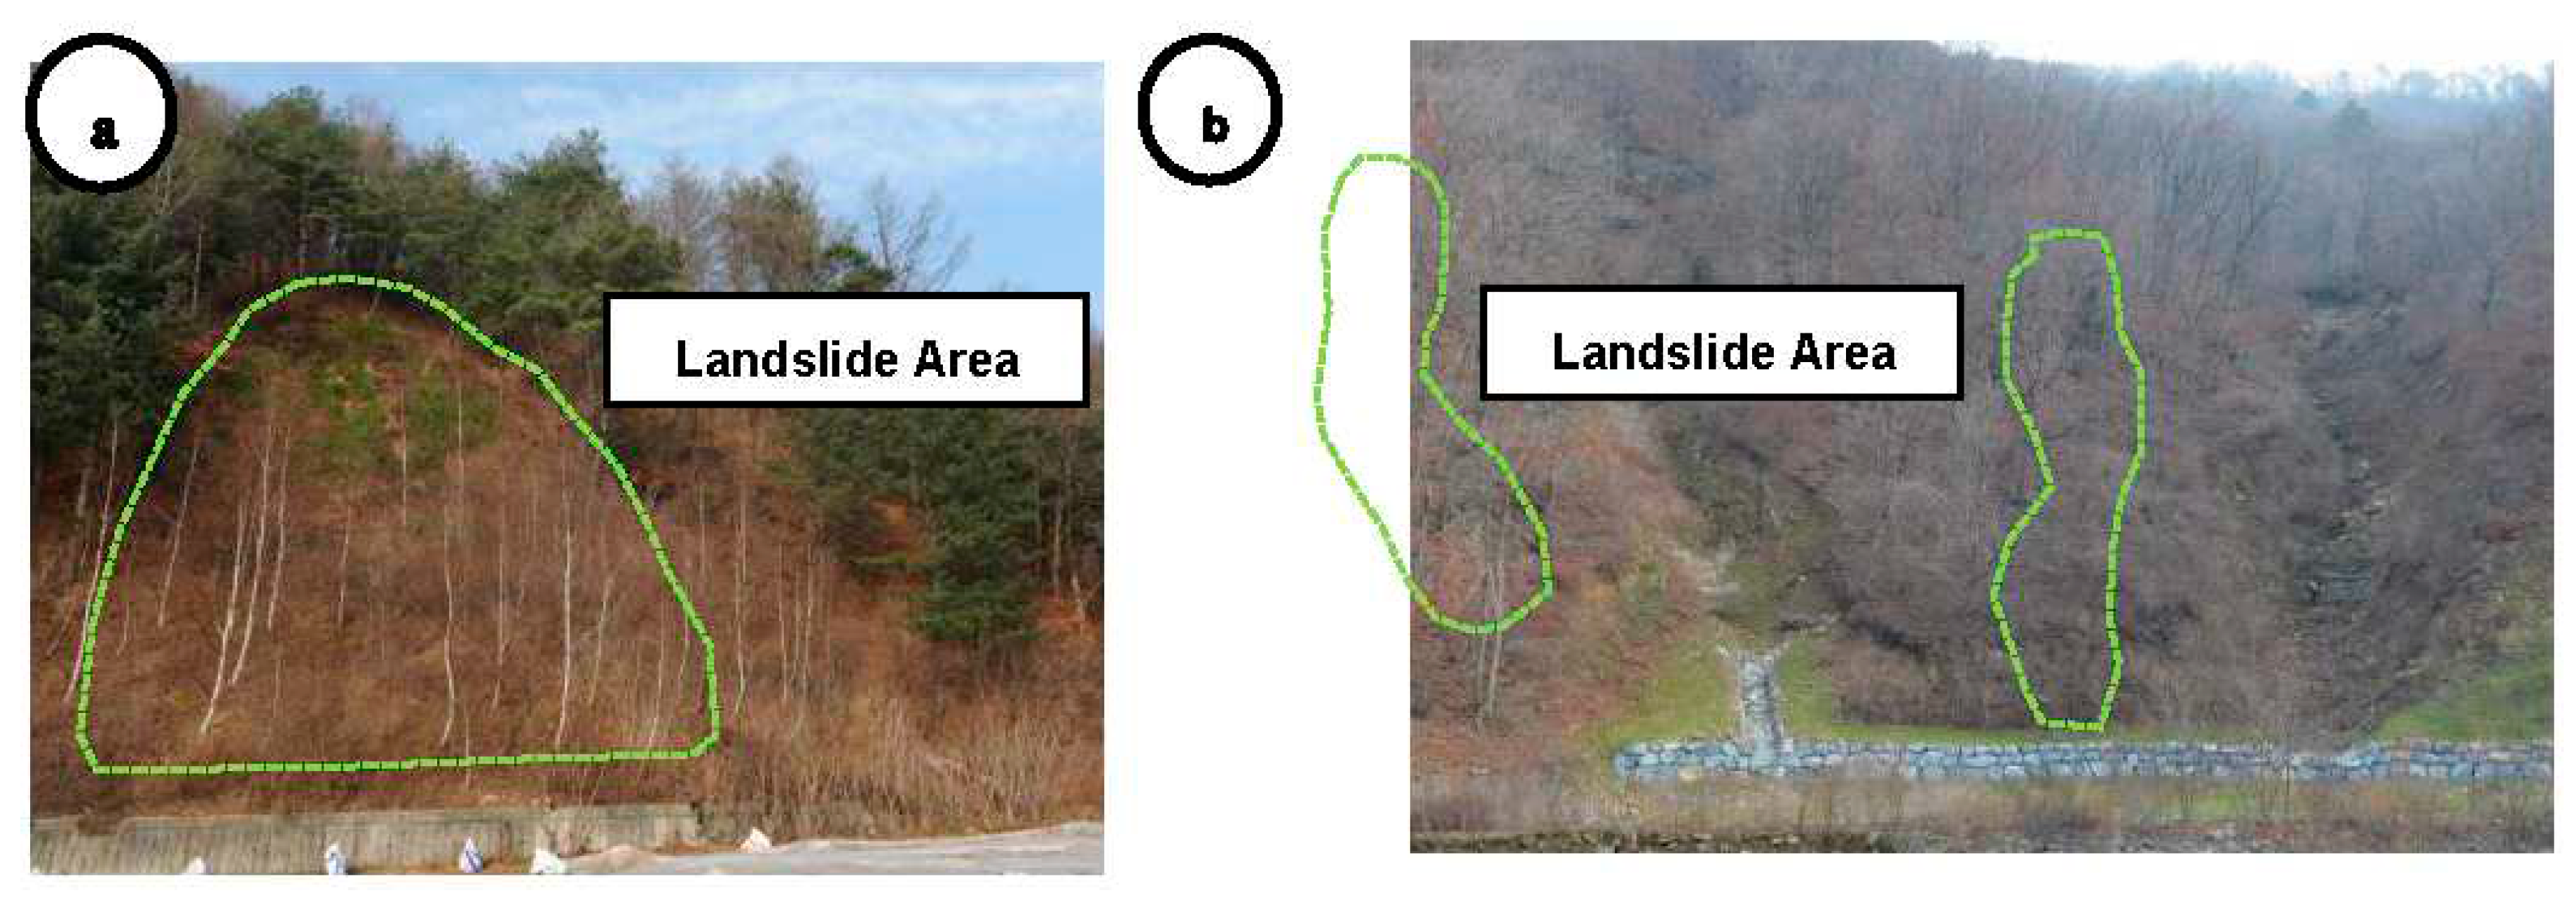
Figure 5.
Relationship between the frequency ratio and landslide percentages for slope (a), aspect (b), elevation, (c), TWI (d), geology (e), land-use (f), forest type (g), crown density (h), soil depth (i), and soil texture (j).
Figure 5.
Relationship between the frequency ratio and landslide percentages for slope (a), aspect (b), elevation, (c), TWI (d), geology (e), land-use (f), forest type (g), crown density (h), soil depth (i), and soil texture (j).
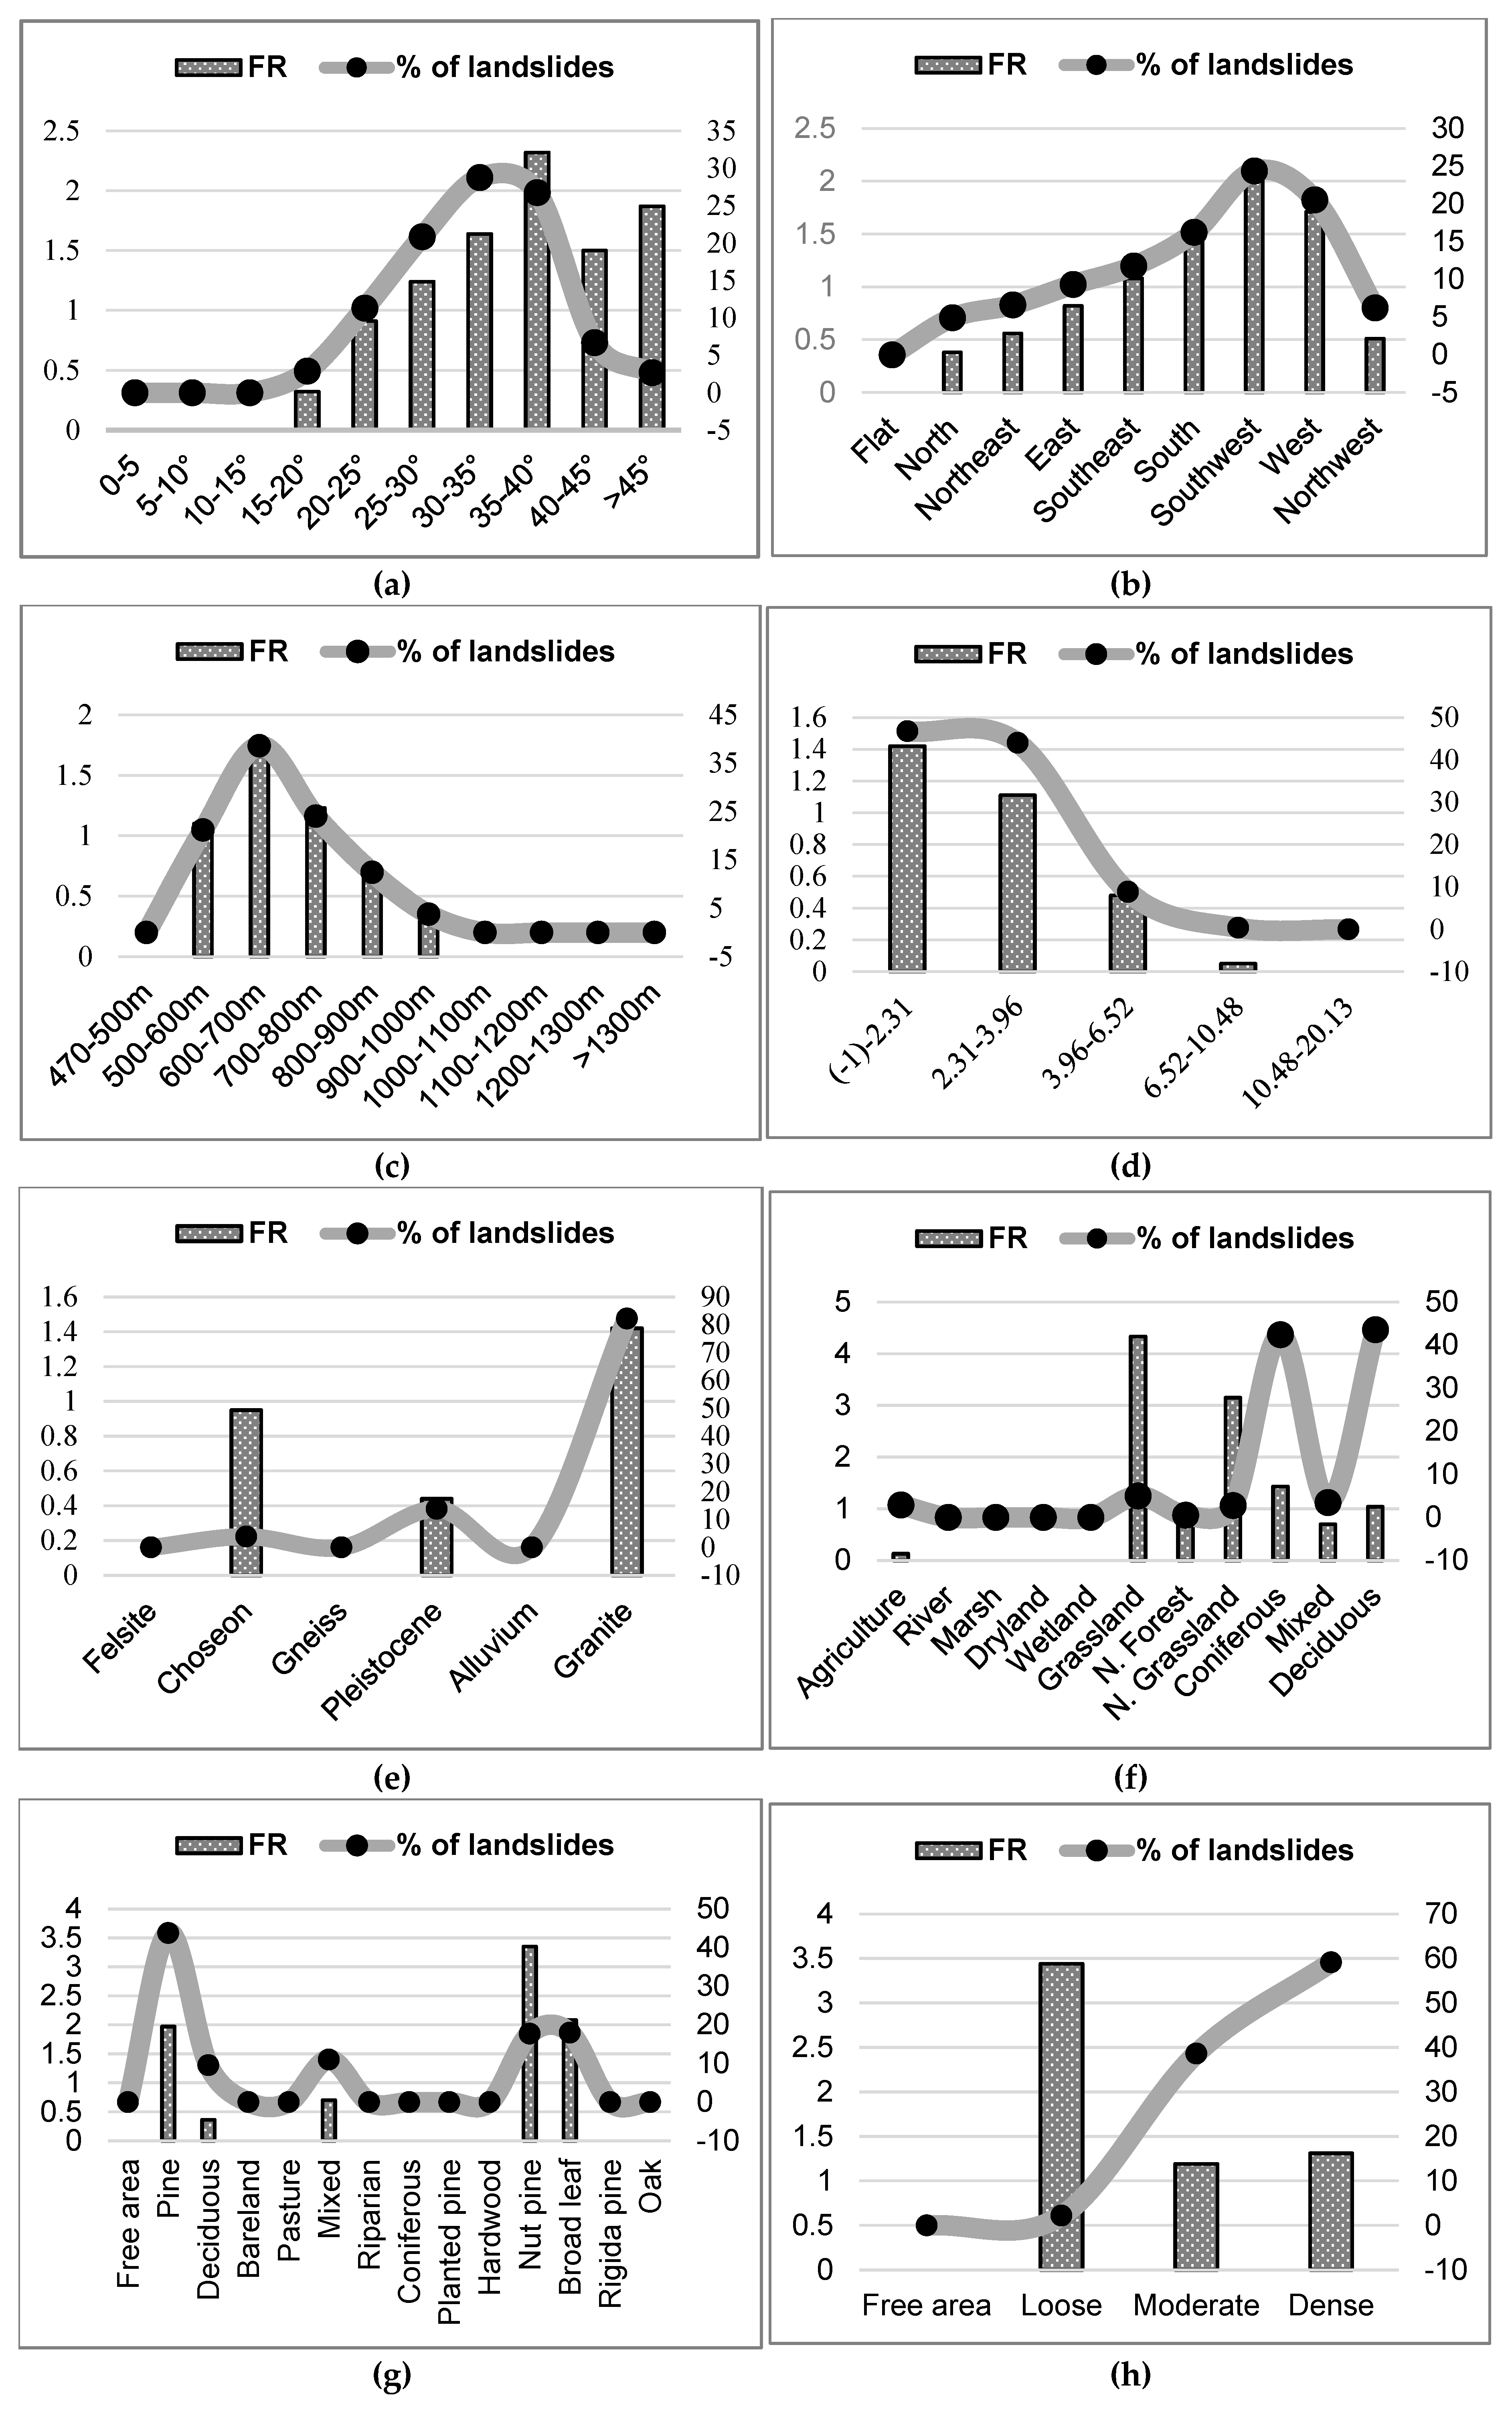
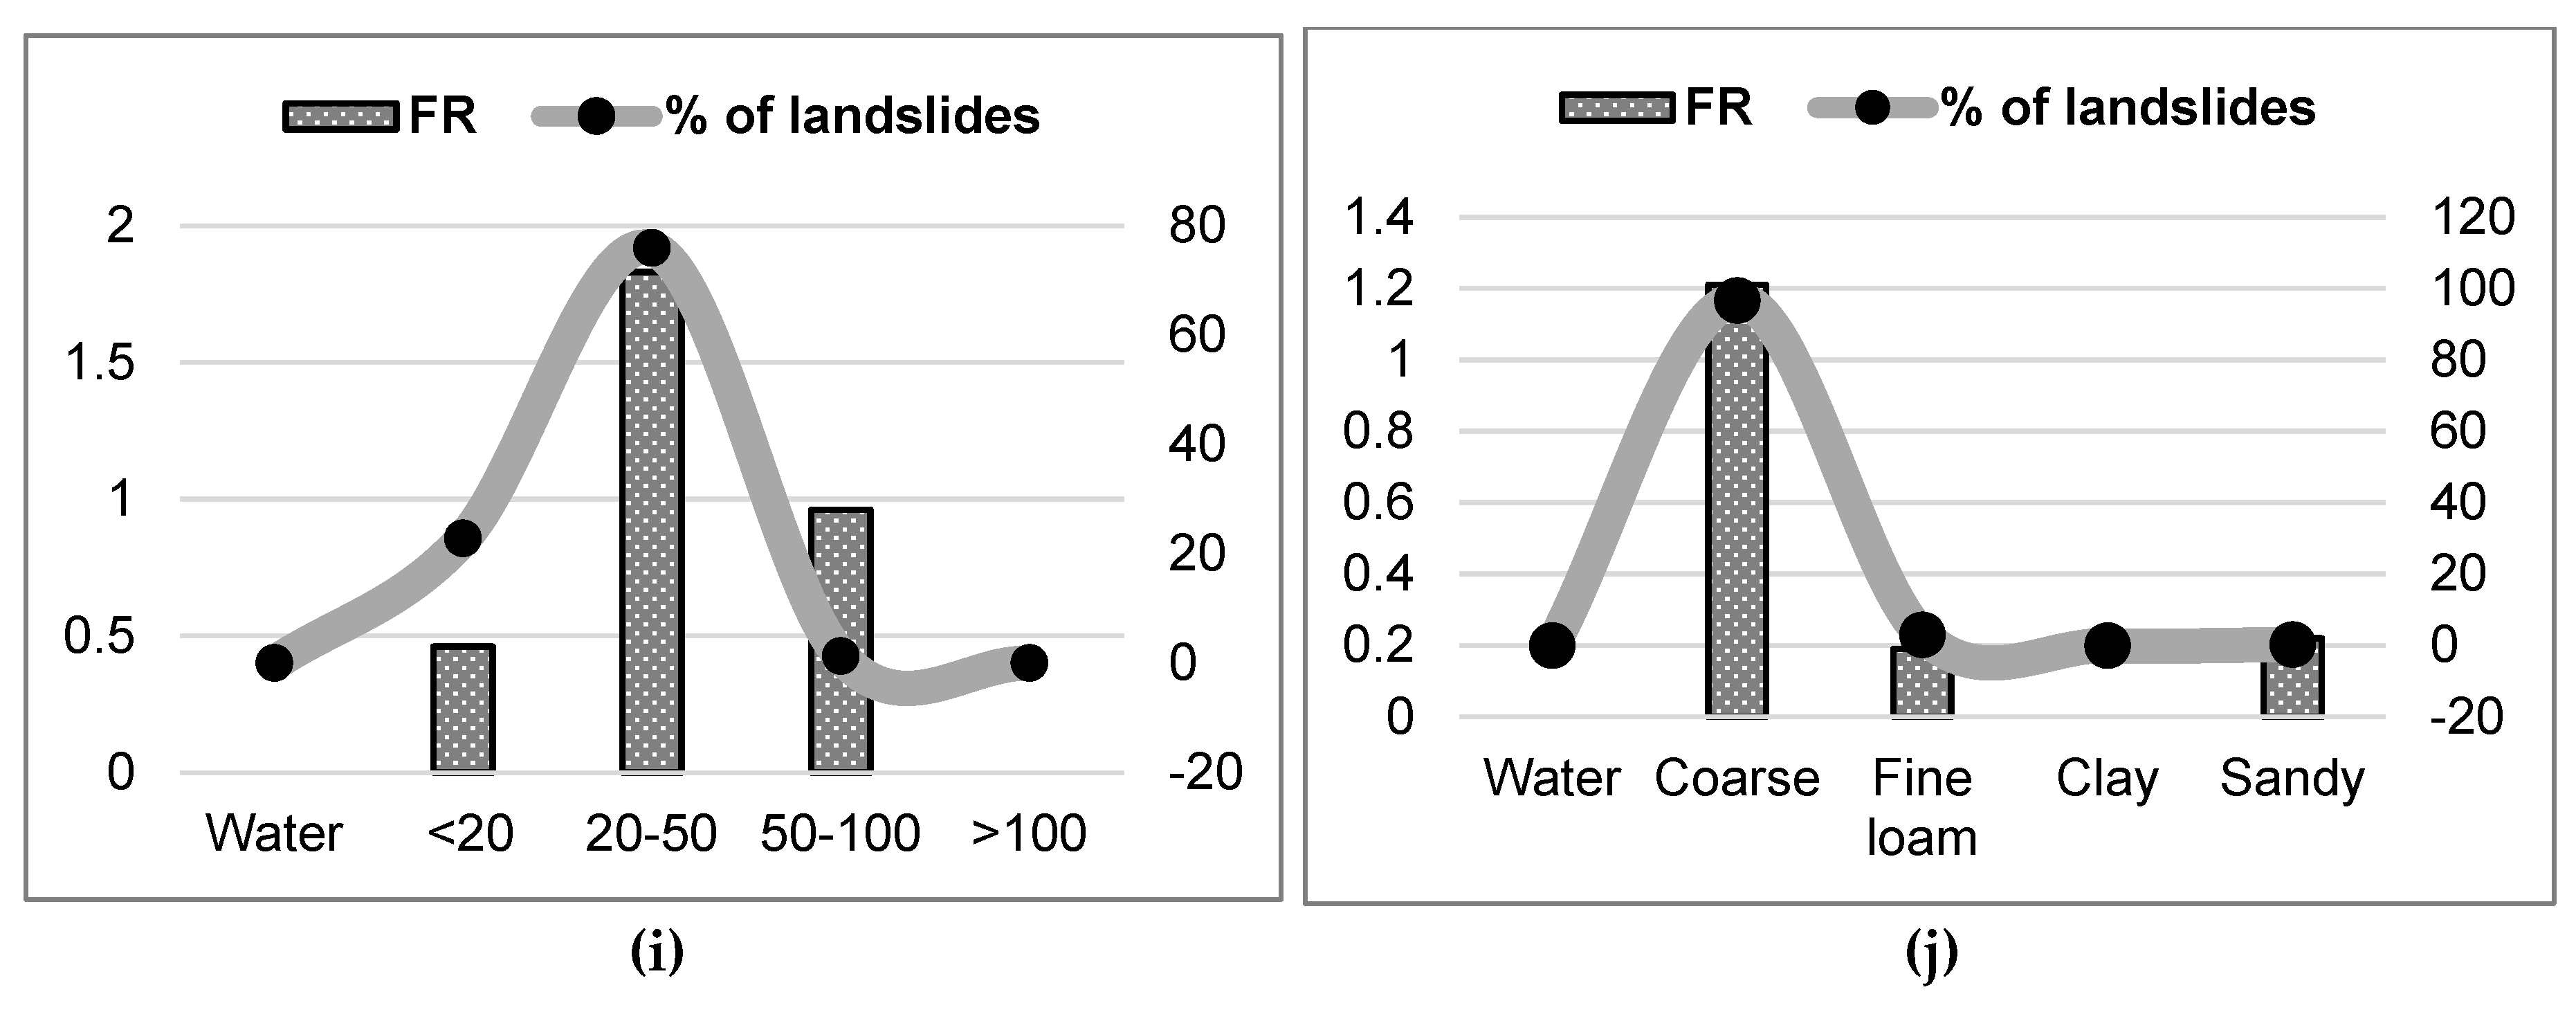
Figure 6.
Landslide susceptibility maps by the fuzzy set (a), Bayesian (b), and likelihood ratio(c) models.
Figure 6.
Landslide susceptibility maps by the fuzzy set (a), Bayesian (b), and likelihood ratio(c) models.
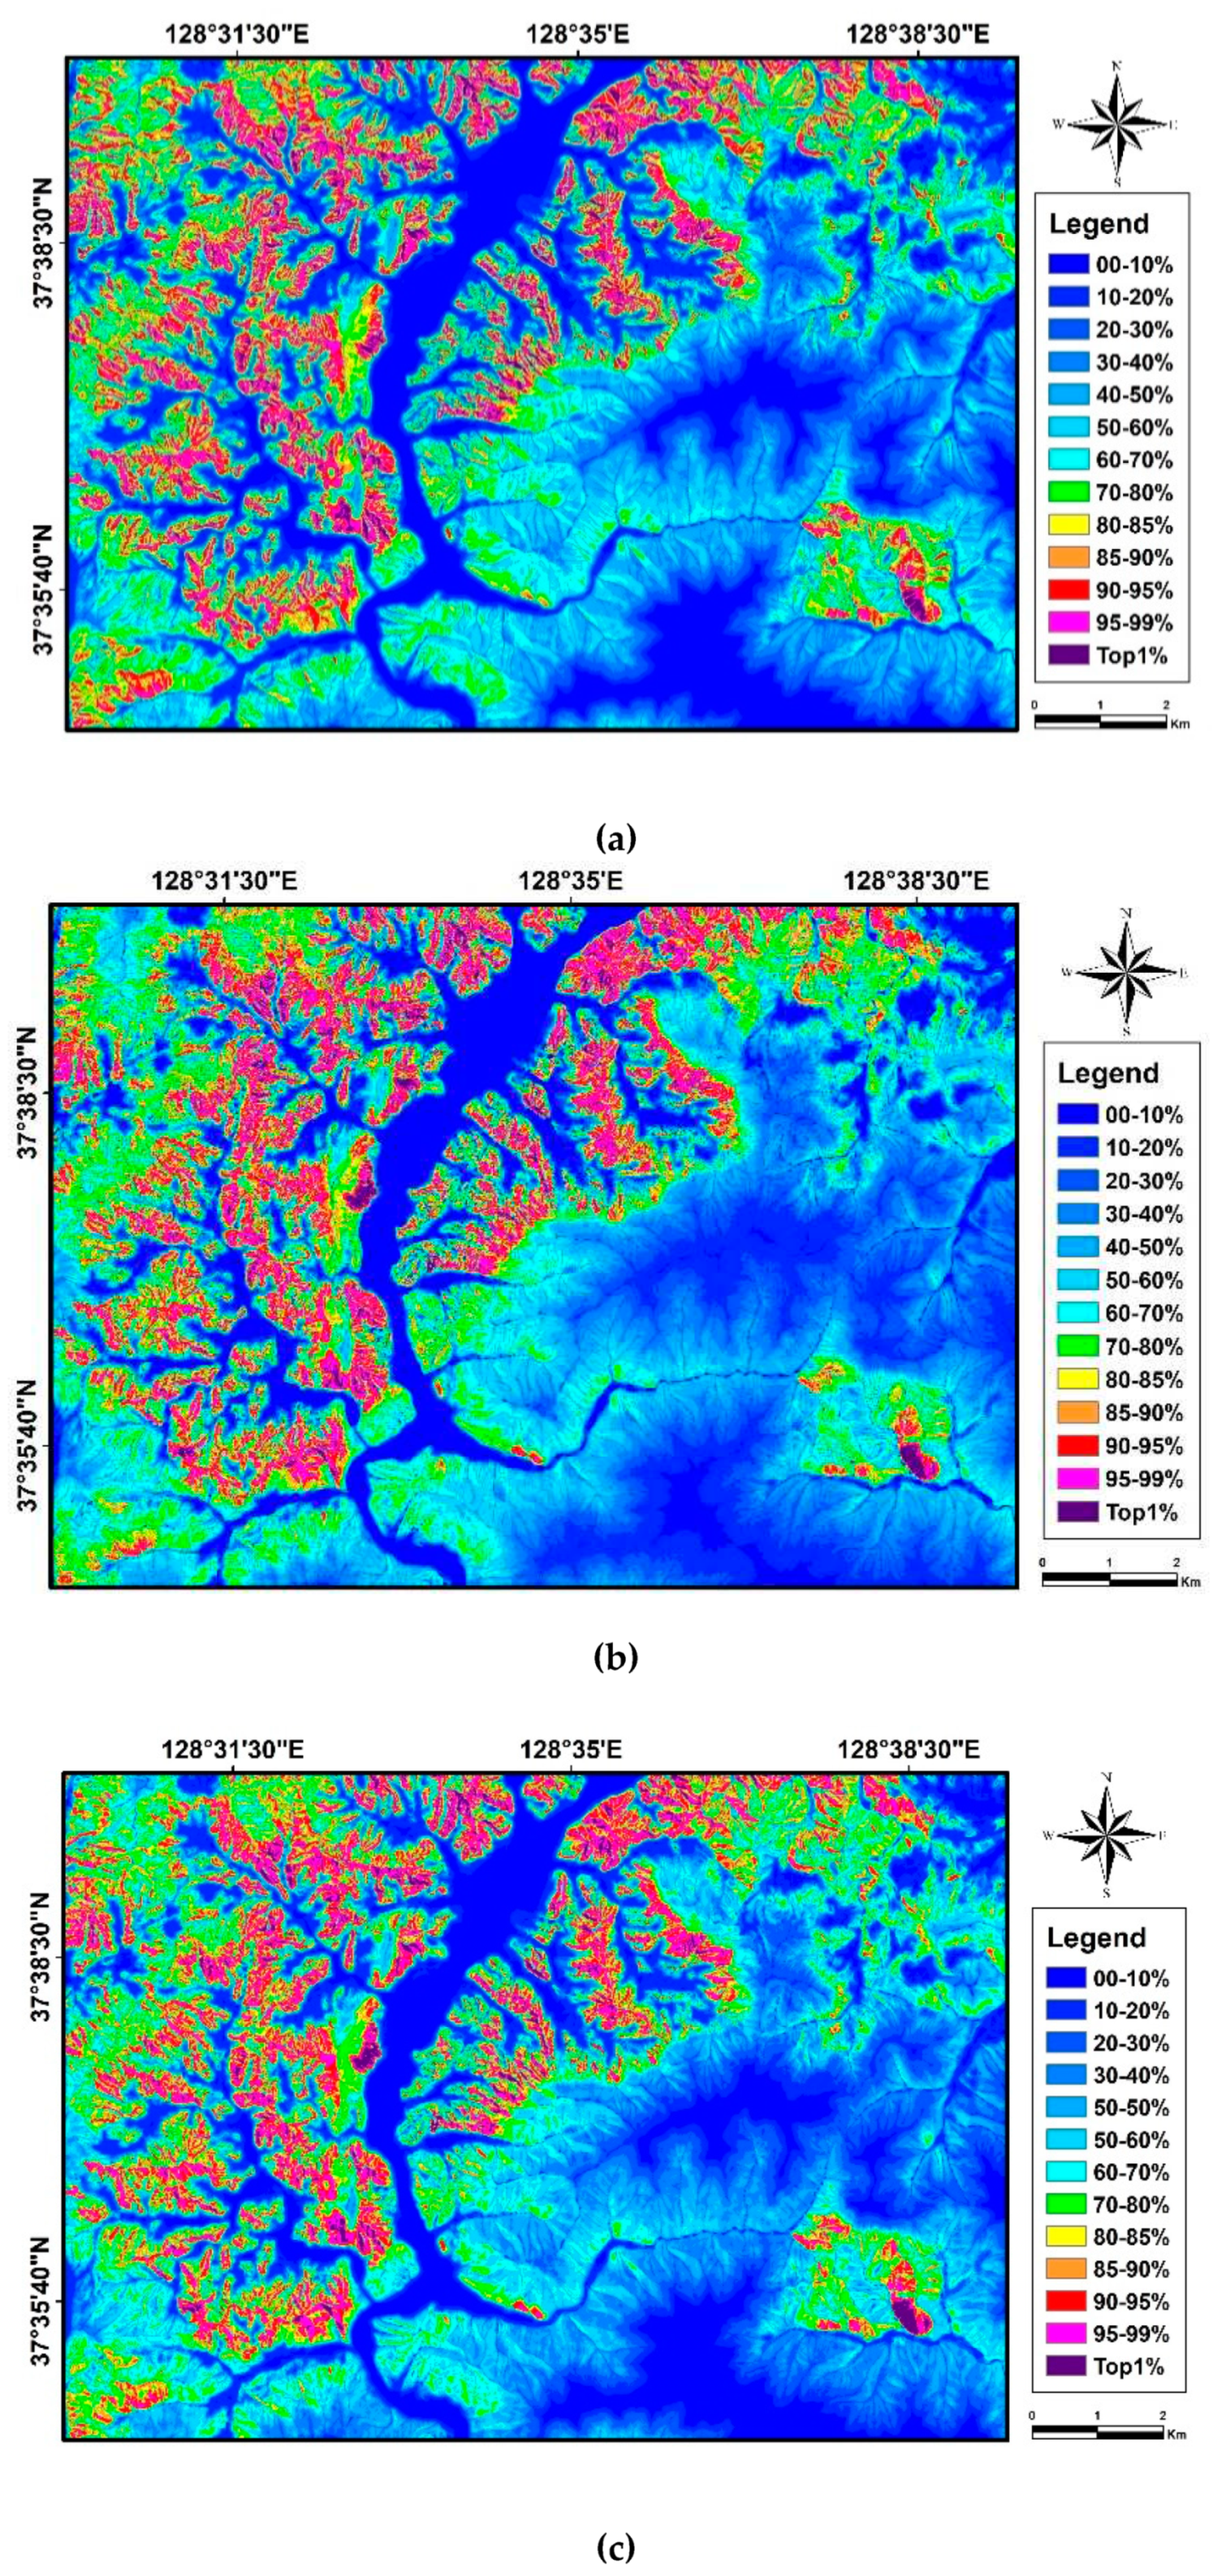
Figure 7.
Landslide susceptibility map success rate curve.
Figure 8.
Population risk map.
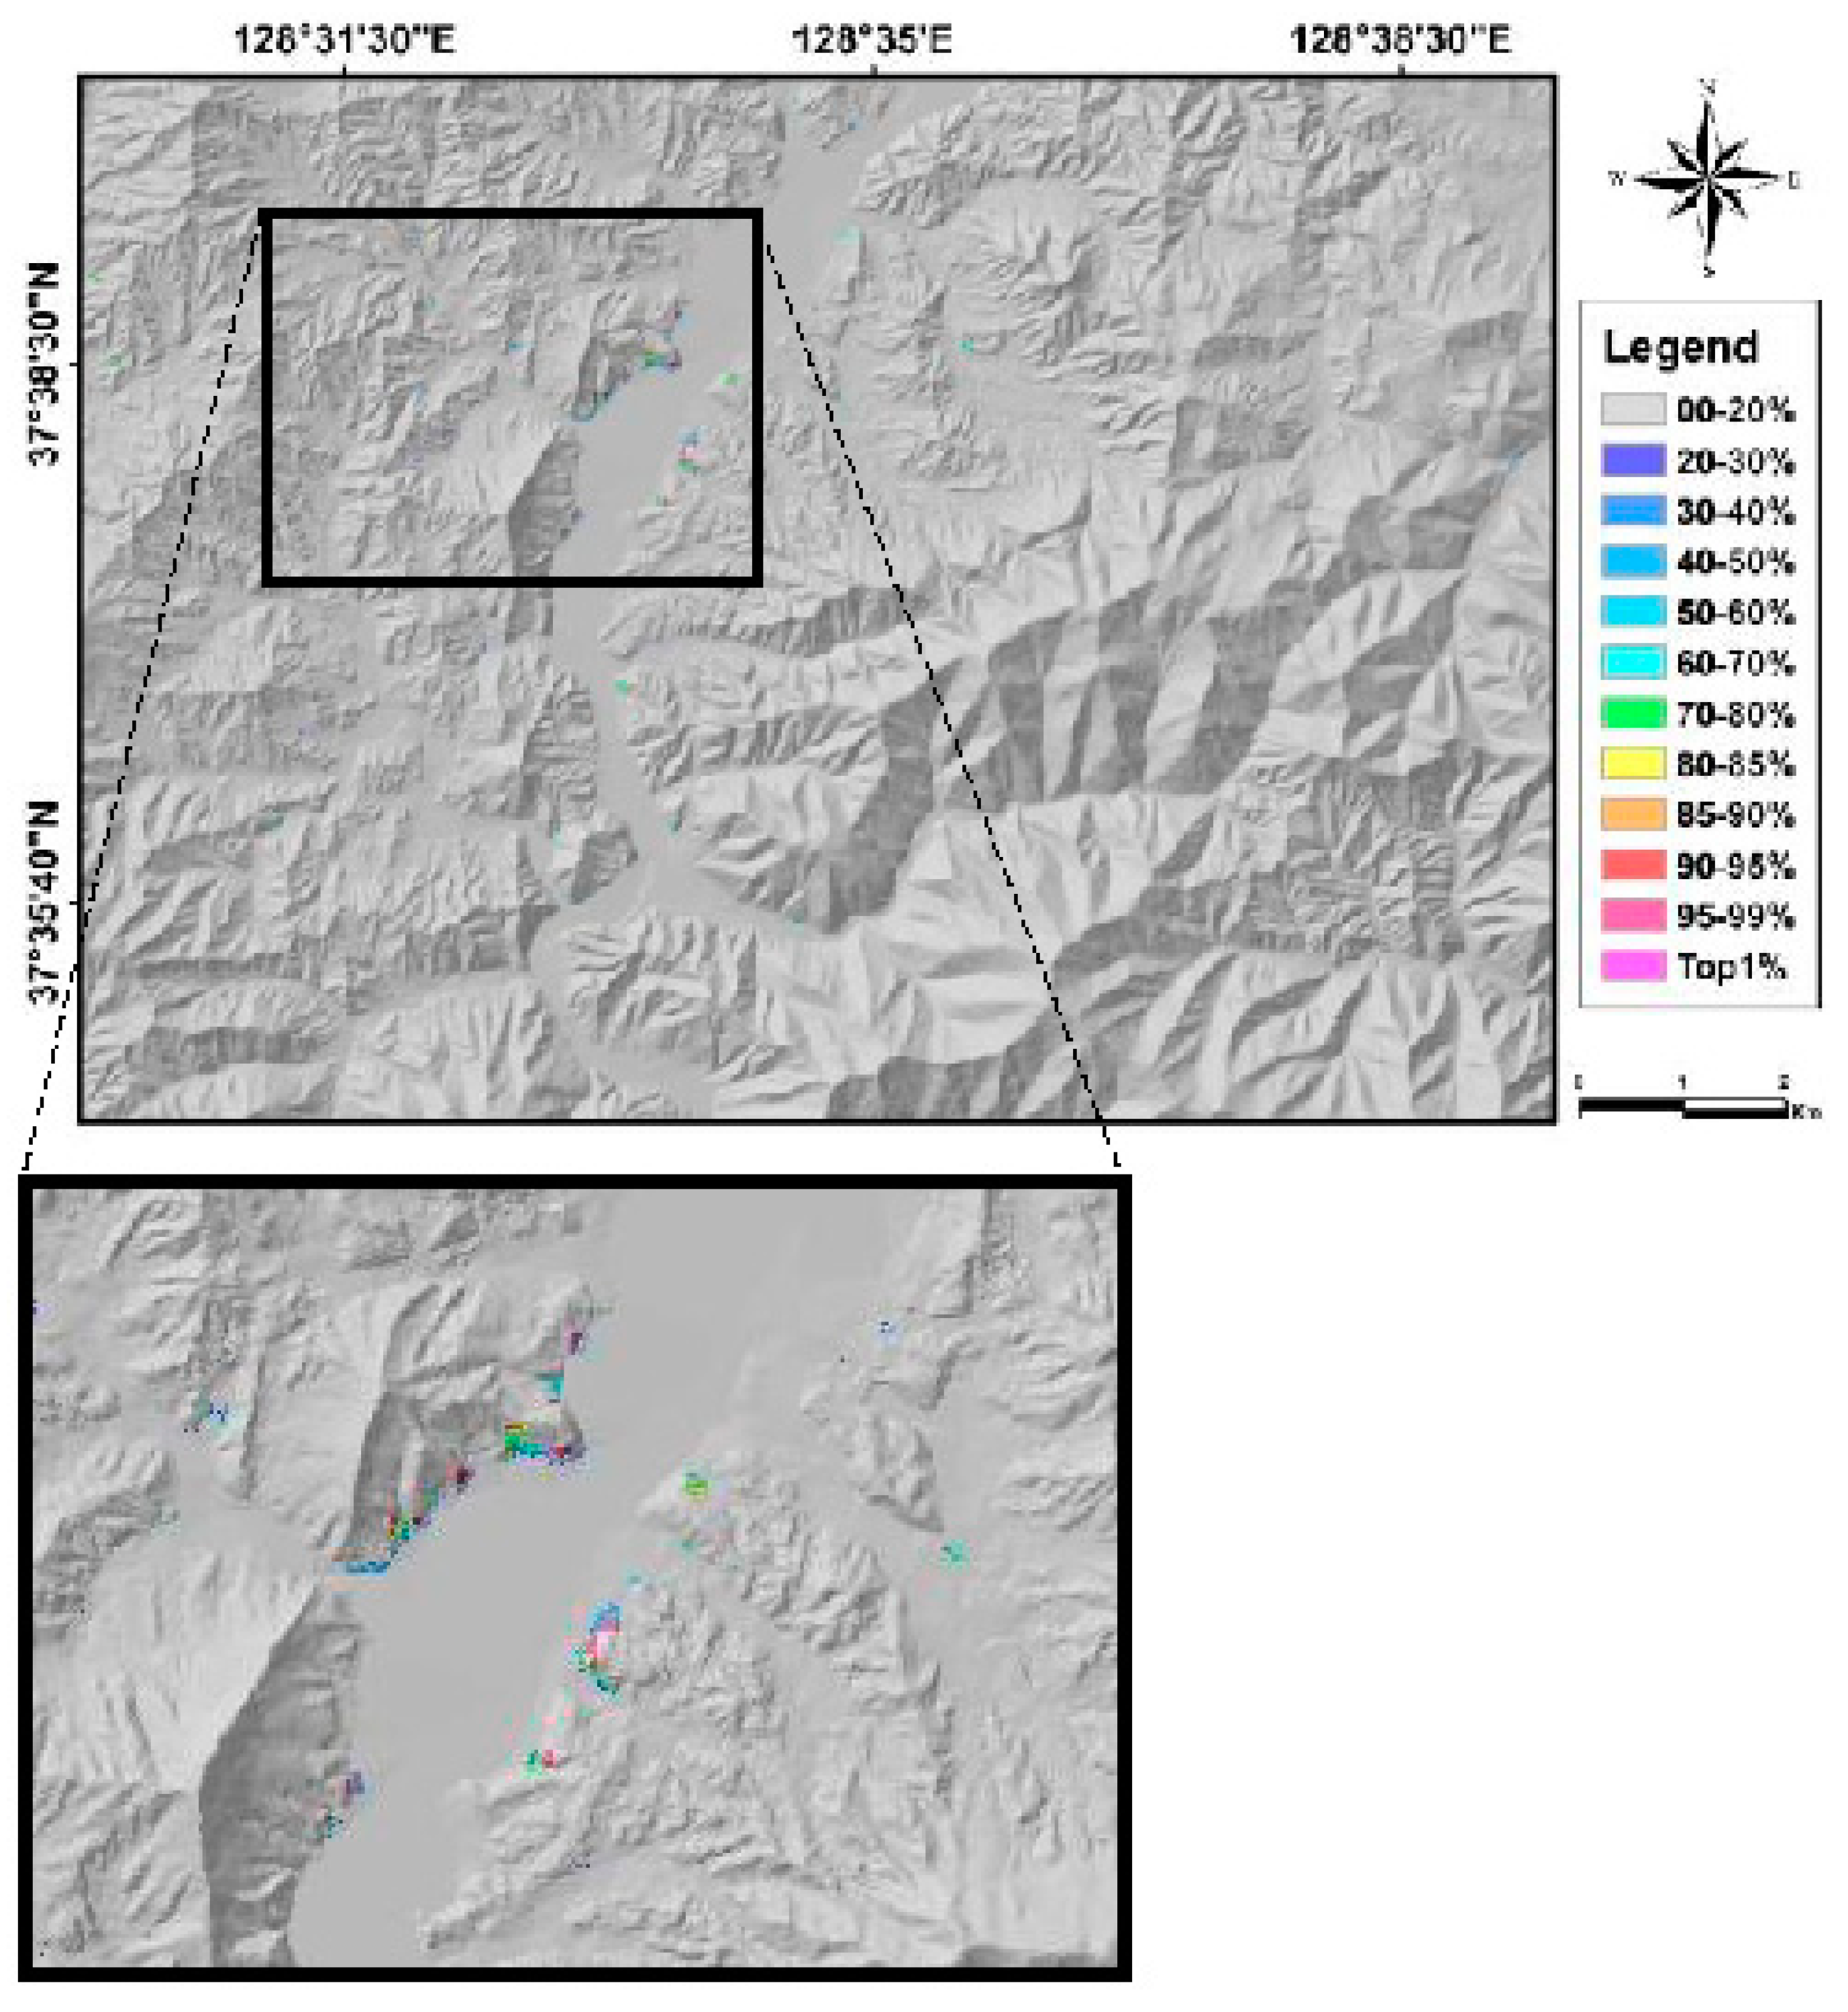
Figure 9.
Risk map for man-made infrastructures.
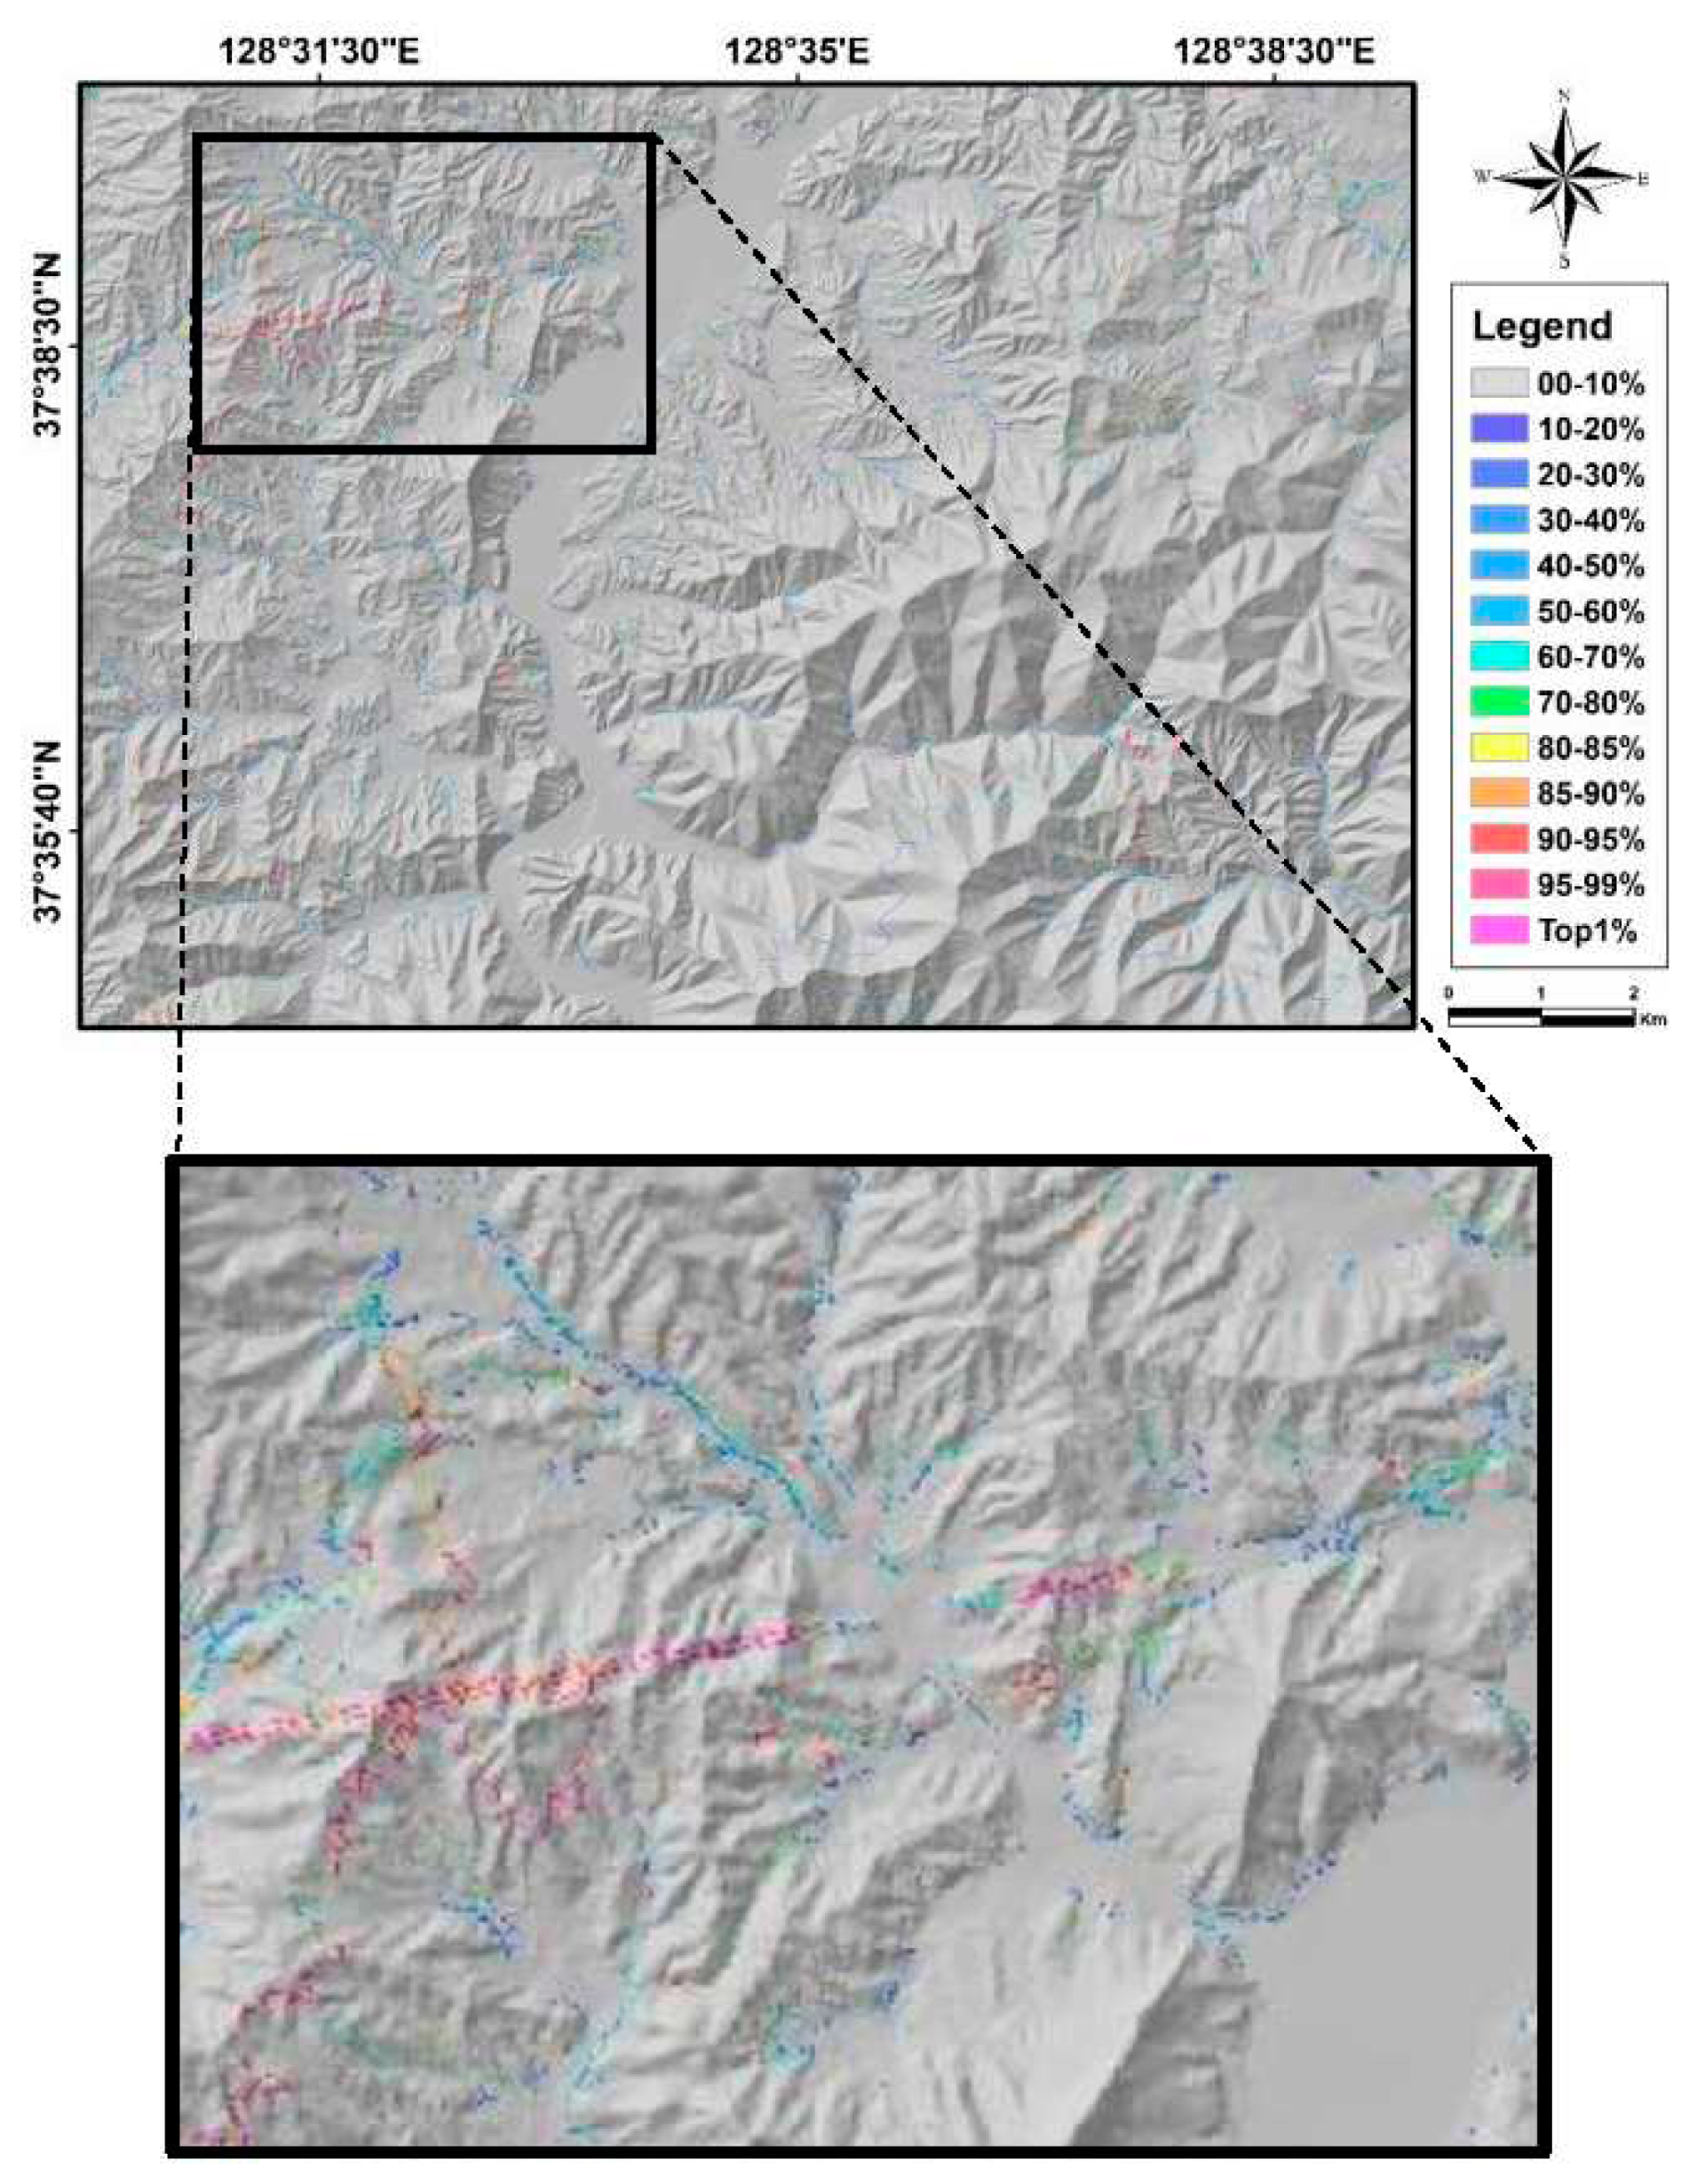
Figure 10.
Risk map for agriculture.
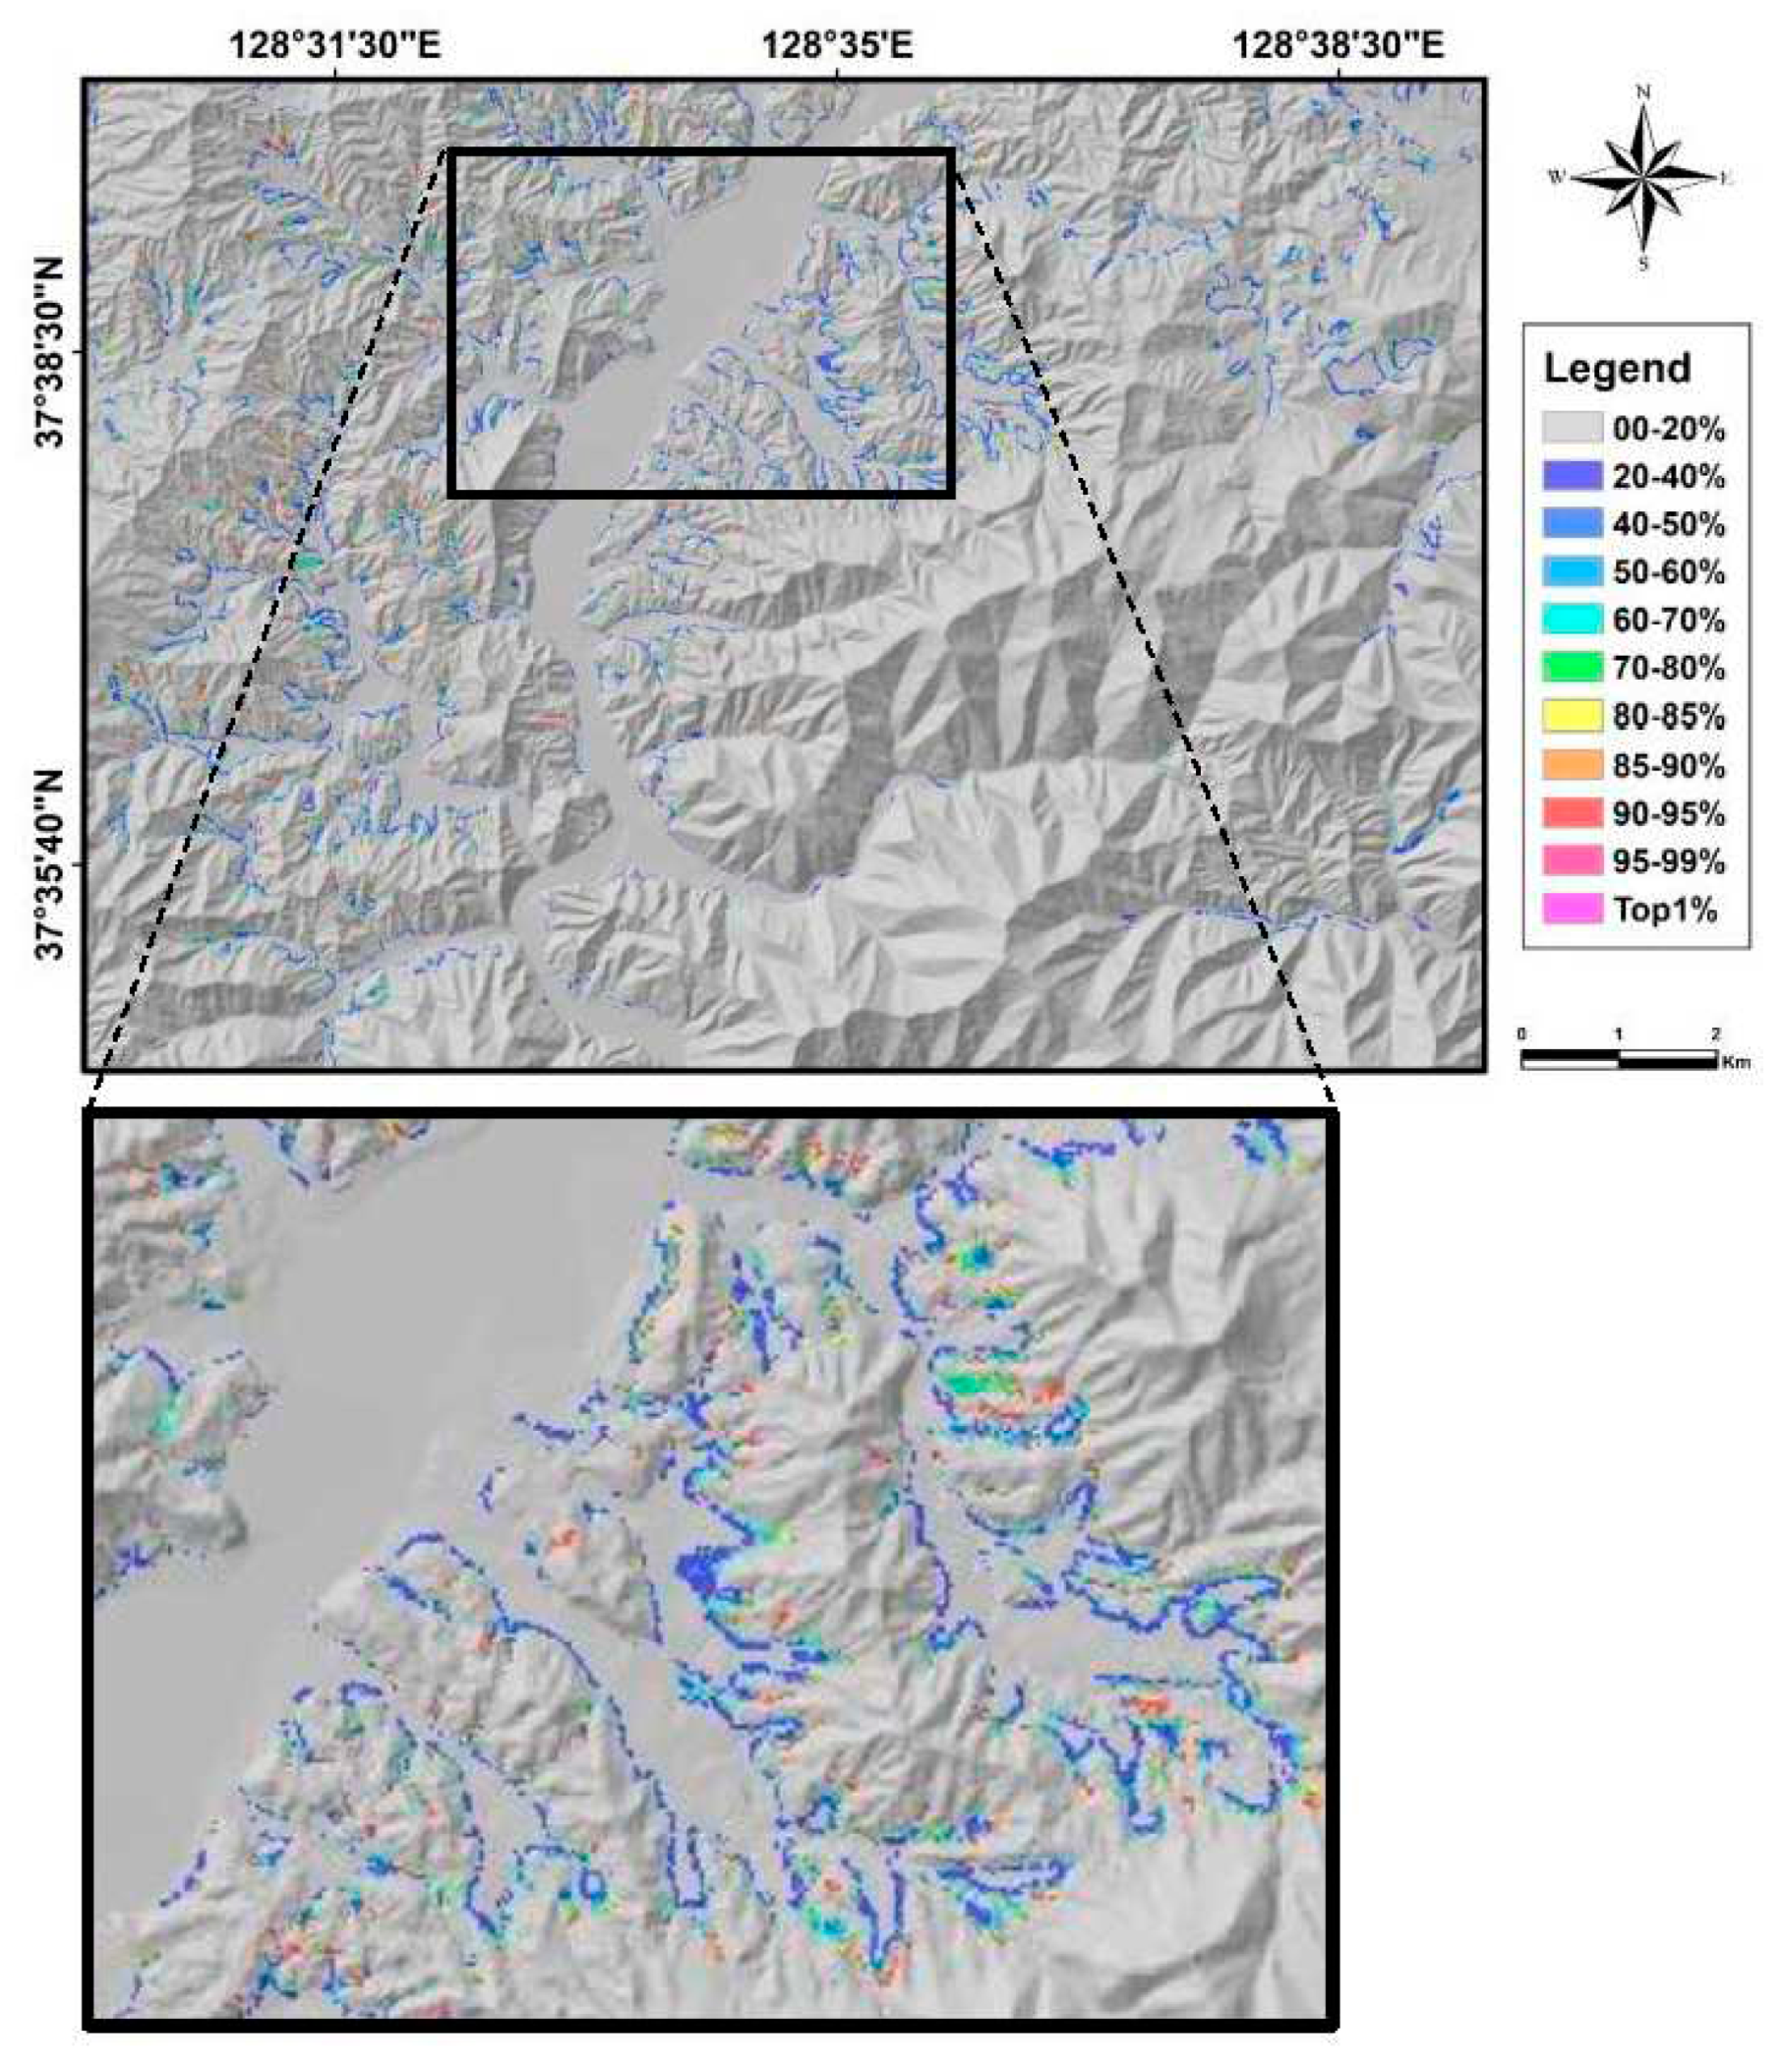

Table 1.
Study area causative factors and sources.
| Causative factors | Scale | Data type | Data sources | |
|---|---|---|---|---|
| Topography | Elevation | 30 meter digital elevation model (DEM) | Continuous(grid) | Elevation point data from the National Geographic Information Institute. |
| Slope | ||||
| Aspect | ||||
| Curvature | ||||
| TWI | ||||
| Land-use | 1:25,000 | Thematic | Ministry of Environment | |
| Geology | 1:50,000 | Thematic | Korean Institute of Geosciences and Mineral Resources | |
| Forest | 1:25,000 | Thematic | National Institute of Forest Science | |
| Soil | 1:25,000 | Thematic | Rural Development Administration | |
Table 2.
Classification of social economic data for landslide risk assessment.
| Factor | Classification |
|---|---|
| Agriculture | 1. Paddy; 2. Fruit tree |
| Business | 1. All kind of business |
| House | 1. General; 2. Row; 3. Apartment |
| Industry | 1. All categories of industry |
| River | 1. Main; 2. Narrow (Tributary) |
| Population | 1. Volume of population (1,2,3……11 person) |
| Others | 1. Related other features |
| Road | 1. Main (Highway); 2. Medium (National roads); 3. Narrow (Province roads and others) |
Table 3.
Risk result for 5000 assumed pixels using different models.
| Models | Agriculture (US $) | Man-made infrastructures (US $) | No. of Casualties |
|---|---|---|---|
| Bayesian | 35,367,068 | 39,335,032 | 15.31 |
| Fuzzy set | 16,260,712 | 31,277,960 | 6.77 |
| Likelihood ratio | 37,157,612 | 40,795,284 | 10.50 |
Disclaimer/Publisher’s Note: The statements, opinions and data contained in all publications are solely those of the individual author(s) and contributor(s) and not of MDPI and/or the editor(s). MDPI and/or the editor(s) disclaim responsibility for any injury to people or property resulting from any ideas, methods, instructions or products referred to in the content. |
© 2023 by the authors. Licensee MDPI, Basel, Switzerland. This article is an open access article distributed under the terms and conditions of the Creative Commons Attribution (CC BY) license (http://creativecommons.org/licenses/by/4.0/).
Copyright: This open access article is published under a Creative Commons CC BY 4.0 license, which permit the free download, distribution, and reuse, provided that the author and preprint are cited in any reuse.


