Preprint
Article

Effect of Rare Earth Y Content on Microstructure and High Temperature Oxidation Properties of Fe-Ni Based Alloys

Altmetrics

Downloads

91

Views

49

Comments

0

Submitted:

24 November 2023

Posted:

27 November 2023

You are already at the latest version

Alerts
Abstract
The effects of rare earth Y content on the microstructure and high-temperature oxidation properties of 47Fe-36Ni-15Cr-1.5Mn alloy at 1000°C were investigated. The results show that 47Fe-36Ni-15Cr-1.5Mn alloy oxidizes at 1000°C under laboratory atmospheric pressure to form an oxide film layer dominated by Cr2O3 and (Fe, Ni, Mn) Cr2O4 spinel, and the oxidation curve of the alloy follows the parabolic law. After the addition of rare earth Y, rare earth phases precipitated along the grain boundaries in the alloy, and the more Y content, the more precipitated phases in the grain boundaries. The alloy with added rare earths was oxidized at a high temperature of 1000 °C for 2160 min, the oxidation law still followed the parabolic law, while the rare earth phase at the grain boundary reacted with the oxygen atoms infiltrated from the outside to generate a rare earth Y-rich oxide residing at the boundary between the grain boundary and the precipitated phase of the alloy. Add 0.5 wt.% rare earth Y 47Fe-36Ni-15Cr-1.5Mn-0.5Y alloy 1000 ° C high temperature oxidation of the formation of spinel oxide crystalline particles, dense and complete oxide film layer, the surface of the addition of a small amount of (0.5 wt.%) rare earth Y after the refinement of the oxide particles, and in the alloy grain boundaries in the form of oxides reside in the alloy to inhibit the cations in the matrix and the oxygen negative ions. and oxygen-negative ions in the alloy matrix, improving the antioxidant performance of the alloy. With the further increase of rare earth Y, during the oxidation of the alloy at high temperature, the precipitation phase at the grain boundary promotes the inward diffusion of oxygen, resulting in the deterioration of the antioxidant property of the alloy.
Keywords: 
Subject: Chemistry and Materials Science  -   Metals, Alloys and Metallurgy

1. Introduction

As one of the clean energy sources in today's world, nuclear energy has the advantages of green economy, safety and reliability, high energy density, and does not emit carbon dioxide greenhouse gases in the process of power generation, which can reduce the consumption of fossil fuels and the greenhouse effect problems brought about. According to the data of international energy structure, nuclear power has occupied one-third of the global electricity [1,2], which accounts for 31.5% of the low-carbon energy generation, according to the latest data of the Global Nuclear Power Association (GNPA), the installed capacity of nuclear power plants is on an upward trend every year, and all the countries around the globe are in the process of large-scale development of nuclear power plants, and the share of nuclear energy in the energy structure continues to increase, which means that in the future, nuclear energy will replace fossil fuels, and will be the main energy method in the energy structure, and will be a major energy method in the future. This means that nuclear energy will replace fossil fuels in the future, and will be used in human life as the main energy source in the energy structure [3,4]. However, the materials of Generation IV nuclear energy pose a great challenge to the performance of structural materials due to the extremely harsh and severe service environment [5].
Fe-Ni based alloys have many excellent properties, corrosion resistance, resistance to high temperature oxidation and excellent high temperature mechanical properties, etc. They are one of the key candidate materials for the sodium-cooled fast reactor dynamic conduits in the fourth generation of nuclear reactors, and the higher the temperature and the harsher the service environment, the higher the antioxidant properties of the alloys are required [6,7]. The high-temperature oxidation behavior of the alloy is very complex, which is typically characterized by changes in oxidation kinetics and oxide film composition. In the constant temperature high temperature oxidation process, there are three oxidation stages: rapid oxidation stage, over-oxidation stage and diffusion-controlled oxidation stage. The oxidation rate of the alloy increases with increasing temperature. During the oxidation process of Fe-Ni alloys, FeO oxides are preferentially generated, which further promotes the internal oxidation of the alloy. FeO oxides are typically porous and easy to detach, which significantly reduces the high-temperature antioxidant properties of the alloys [8,9]. On the contrary, the formation of a continuous and dense oxide layer on the surface of the alloy can prevent the diffusion of oxygen atoms into the alloy and the diffusion of metal elements outward along the oxide layer, thus improving the high-temperature oxidation resistance of the alloy and prolonging the service life of the alloy. Therefore, the formation of a continuous and dense oxide film on the surface of the alloy is a key factor in determining the antioxidant performance of the alloy [10,11]. Studies have shown that the addition of rare-earth active elements to alloys produces the rare-earth effect, which can enhance the adhesion of the oxide layer of alloys to reduce the flaking of the oxide layer on the surface and lower the oxidation rate of alloys, thus enhancing the high-temperature antioxidant performance of alloys. Although there have been many reports on the enhancement of high temperature oxidation behavior of alloys by rare earth elements, the effect of rare earth element oxides on the surface formation of alloys and the oxidation mechanism have not been clarified [12,13].
As the high-temperature application environment of Fe-Ni-Cr-based alloys becomes more extensive, the requirements for their high-temperature oxidation resistance also become more demanding. During the oxidation process of the alloy, the alloying elements react with oxygen in the air to produce oxides, resulting in the loss of the original mechanical properties of the alloy, and with the growth of service time the alloy undergoes fatigue and other mechanical failures. The addition of reactive elements such as rare earth elements (Y, Ce or La) can be a solution to enhance the oxidation resistance of alloys at high temperatures. Reactive element effect (REE) plays an important role in the oxidation process of alloys by promoting the preferential oxidation of Cr and Al, enhancing the bonding of the oxide layer to the substrate, and reducing the oxidation kinetics of the alloy during the oxidation process. Essentially, these beneficial effects are thought to be related to the polarization of rare earth elements towards the grain boundaries of the oxide layer, altering the cation migration mechanism. Many studies have been conducted on the corrosion behavior of alloys with added rare earth elements in oxidizing gases or water vapor containing conditions [14,15]. Recently, based on the oxidation behavior of Y-doped Ni-30Fe-20Cr alloys [16], they found that the addition of 0.05-0.10 wt.% Y was able to reduce the oxidation rate of the alloys and improve the oxide adhesion with the inhibition of oxidation within the alloys due to the reduction of diffusion of chromium outward along the grain boundaries by alloying Y. The results of this study are summarized as follows. However, whether alloy Y will play a similar role in Fe-Ni-Cr based alloys needs to be addressed by experimental studies.
Therefore, the aim of this work is to investigate the effect of element Y on the physical phase structure and properties of Fe-Ni-Cr based alloys. The aim is to investigate the oxidation behavior of the newly developed alloy at 1000 °C and to elucidate the effect of element Y on the physical phase structure and properties of Fe-Ni-Cr based alloys.

2. Materials and Methods

2.1. Preparation of Alloy Specimens

The alloys were made of high purity Fe (99.99%), Ni (99.99%), Cr (99.99%), Mn (99.99%) and Y (99.99%) produced by Zhong Nuo New Material Technology Co. Three kinds of 47Fe-36Ni-15Cr-1.5Mn-xY high-temperature alloys with different Y contents were prepared by vacuum arc melting method, and x represents the content of Y element (0 wt%, 0.5 wt% and 1 wt%). The designed alloy element contents and compositions are shown in Table 1. The prepared alloys were named as 0Y, 0.5Y and 1Y alloys according to the difference of the Y contents, respectively. The specific preparation steps are as follows: first, the designed metal powders are fully mixed and homogenized, and then placed in the copper crucible of the melting furnace for high-temperature arc melting, and after arc melting, the alloy is cast into ingots under argon atmosphere. In order to eliminate the residual stresses of the alloy, the alloy ingots were annealed in a vacuum tube furnace at a temperature of 700°C for 72 h. After annealing, the alloy ingots were cut into (Φ15mm*1mm) round specimens using wire-cutting equipment. Finally, all the alloy specimens were polished with SiC sandpaper and their surfaces were polished with a polishing cloth with diamond polishing solution, followed by ultrasonication in acetone and ethanol and then blow-dried and set aside. The surface of the alloy specimens was metallurgically corroded with chemical reagents (10 ml of hydrogen fluoride + 10 ml of nitric acid solution + 70 ml of distilled water) at room temperature for 50 s-60 s to observe the metallographic microstructure.

2.2. Oxidation tests

The oxidation test of the alloy is carried out in a tube furnace under atmospheric atmosphere at a set temperature of 1000°C with a heating rate of 10°C/min. When the temperature reaches 1000°C, the alloy specimens are put into a crucible and then into the tube furnace for a certain period of time, and the alloy specimens are taken out of the tube furnace at certain intervals (10 min, 30 min, 60 min, 360 min, 720 min, 1440 min and 2160 min) and then cooled down to room temperature in air. The alloy samples were removed from the tube furnace at certain time intervals (10 min, 30 min, 60 min, 360 min, 720 min, 1440 min and 2160 min) and then cooled to room temperature in air. Before and after the oxidation tests, the samples were weighed using an electronic balance with an accuracy of 10-5 g. To ensure the accuracy of the data, each sample was weighed three times and the average value was taken.

2.3. Material Characterization

Optical microscopy was used to observe the metallographic microstructure of the specimens and to calculate the grain size of the alloys. A field emission scanning electron microscope (SEM, FEI QUANTAFEG250, USA) equipped with an energy spectrometer (EDS) was used to observe the surface morphology and cross-section microstructure of the alloy specimens and oxide films. The phase compositions of the alloy and oxide film were examined by X-ray diffractometer (XRD, Burker D8 Advance, Germany) using Cu Kα radiation (λ=0.154 nm).

3. Results

3.1. Phase structure and microstructure of alloy specimens

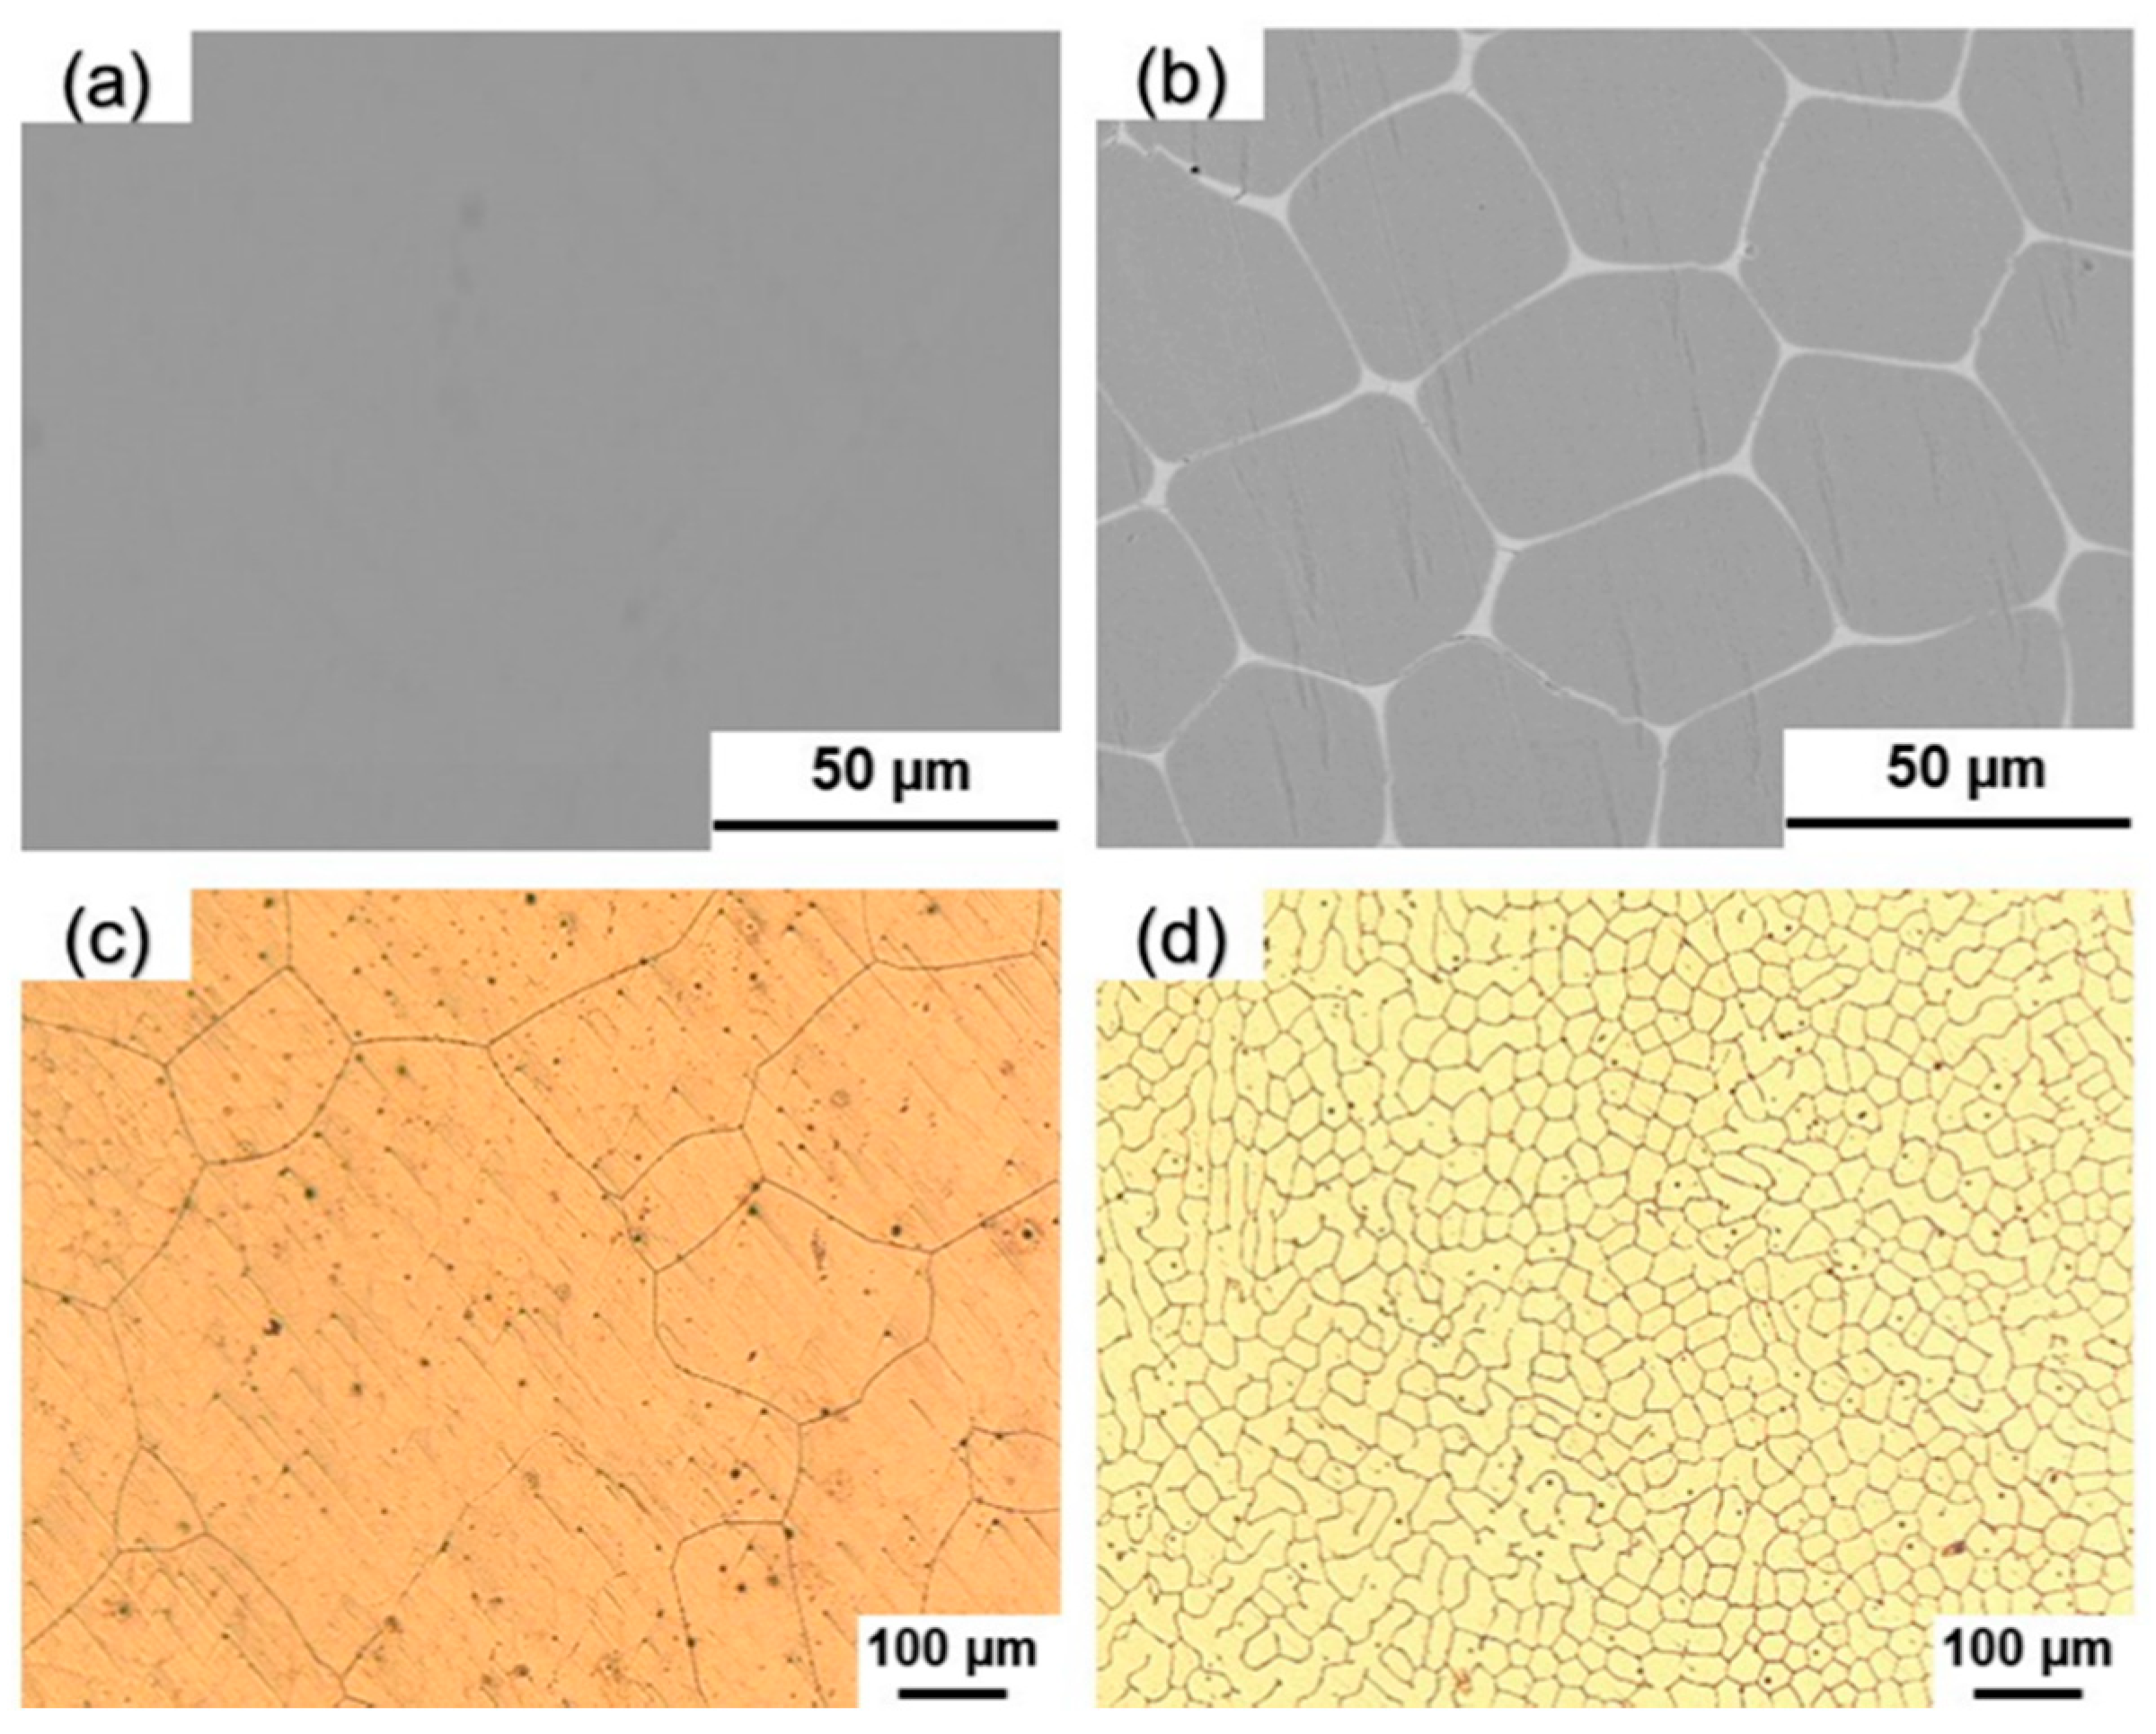
Figure 1 shows the SEM map and optical microscope (OM) metallographic microstructure of the alloy specimens. From Figure 1a, it can be seen that the surface of the 0Y alloy is smooth and there is no intermetallic phase generation; from Figure 1b, it can be seen that the 1Y alloy grain size is uniform, and the difference between grey and bright white color is presented within the grains and at the grain boundaries, respectively, and the polarization of bright white intermetallic phase can be observed at the grain boundaries; from Figure 1c, it can be seen that the morphology of the 0Y alloy specimen is similar to a cellular structure, with obvious grain boundaries, large grain size, between 100 μm -200 μm, and uneven distribution; from Figure 1d, it can be seen that, compared with the 0Y alloy, the grain size of 1Y alloy has been significantly refined, with fine and uniformly distributed grains, the grain size is 40 μm -50 μm, and the polarization of the intermetallic phase can be clearly observed at the grain boundaries.
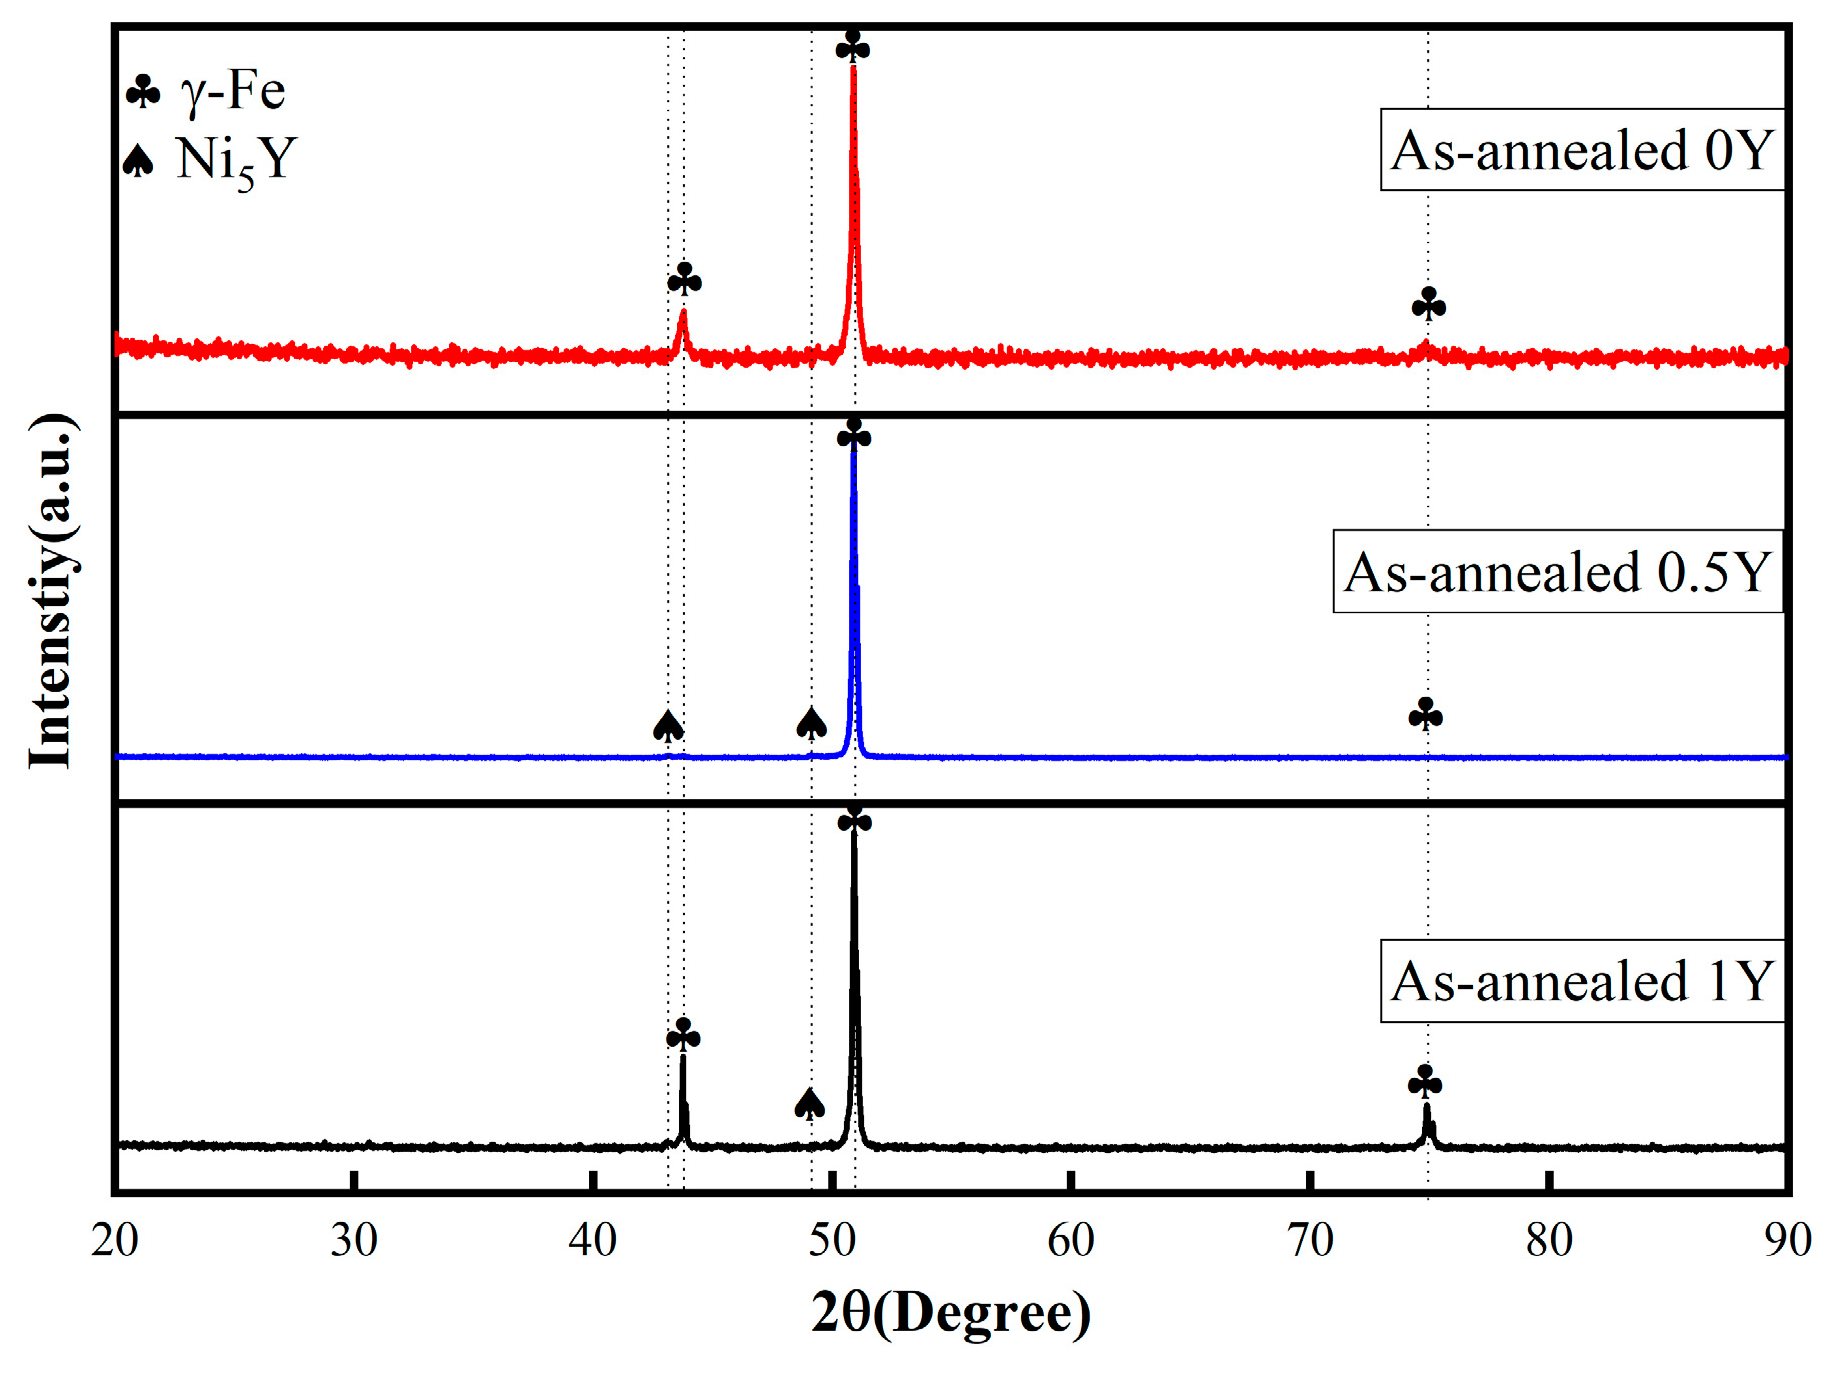
Figure 2 shows the XRD patterns of the alloy specimens, from which it can be seen that the 0Y alloy is a stable austenitic structure of γ-Fe phase, in addition to the characteristic peaks of the γ-Fe phase in both the 0.5 Y alloy and the 1 Y alloy, the characteristic peaks of Ni5Y intermetallic compounds have appeared, and due to the intermetallic phase precipitation at grain boundaries, and the content of small, the characteristic peaks of the intensity of the lower, combined with the results of Figure 1, it can be concluded that the Y element is easy to precipitate Ni5Y phase when added to the alloy due to its high activity and small solid solubility in austenite.
With the increase of Y content, the Ni5Y phase precipitated in the alloy also increases, and the addition of Y element makes the grain size of the alloy undergo the phenomenon of refinement, which is attributed to the effect of the addition of rare earth elements on the thermodynamic and kinetic processes of alloy solidification. Rare earths, as a kind of surface-active elements, can reduce the interfacial tension during grain nucleation, thus reducing the critical size nucleation work and increasing the nucleation rate. And the formation of a large number of Ni5Y phase polarization in the alloy at the alloy grain boundaries hindered the growth of the alloy, thus playing the role of grain refinement [17].

3.2. Oxidation kinetics

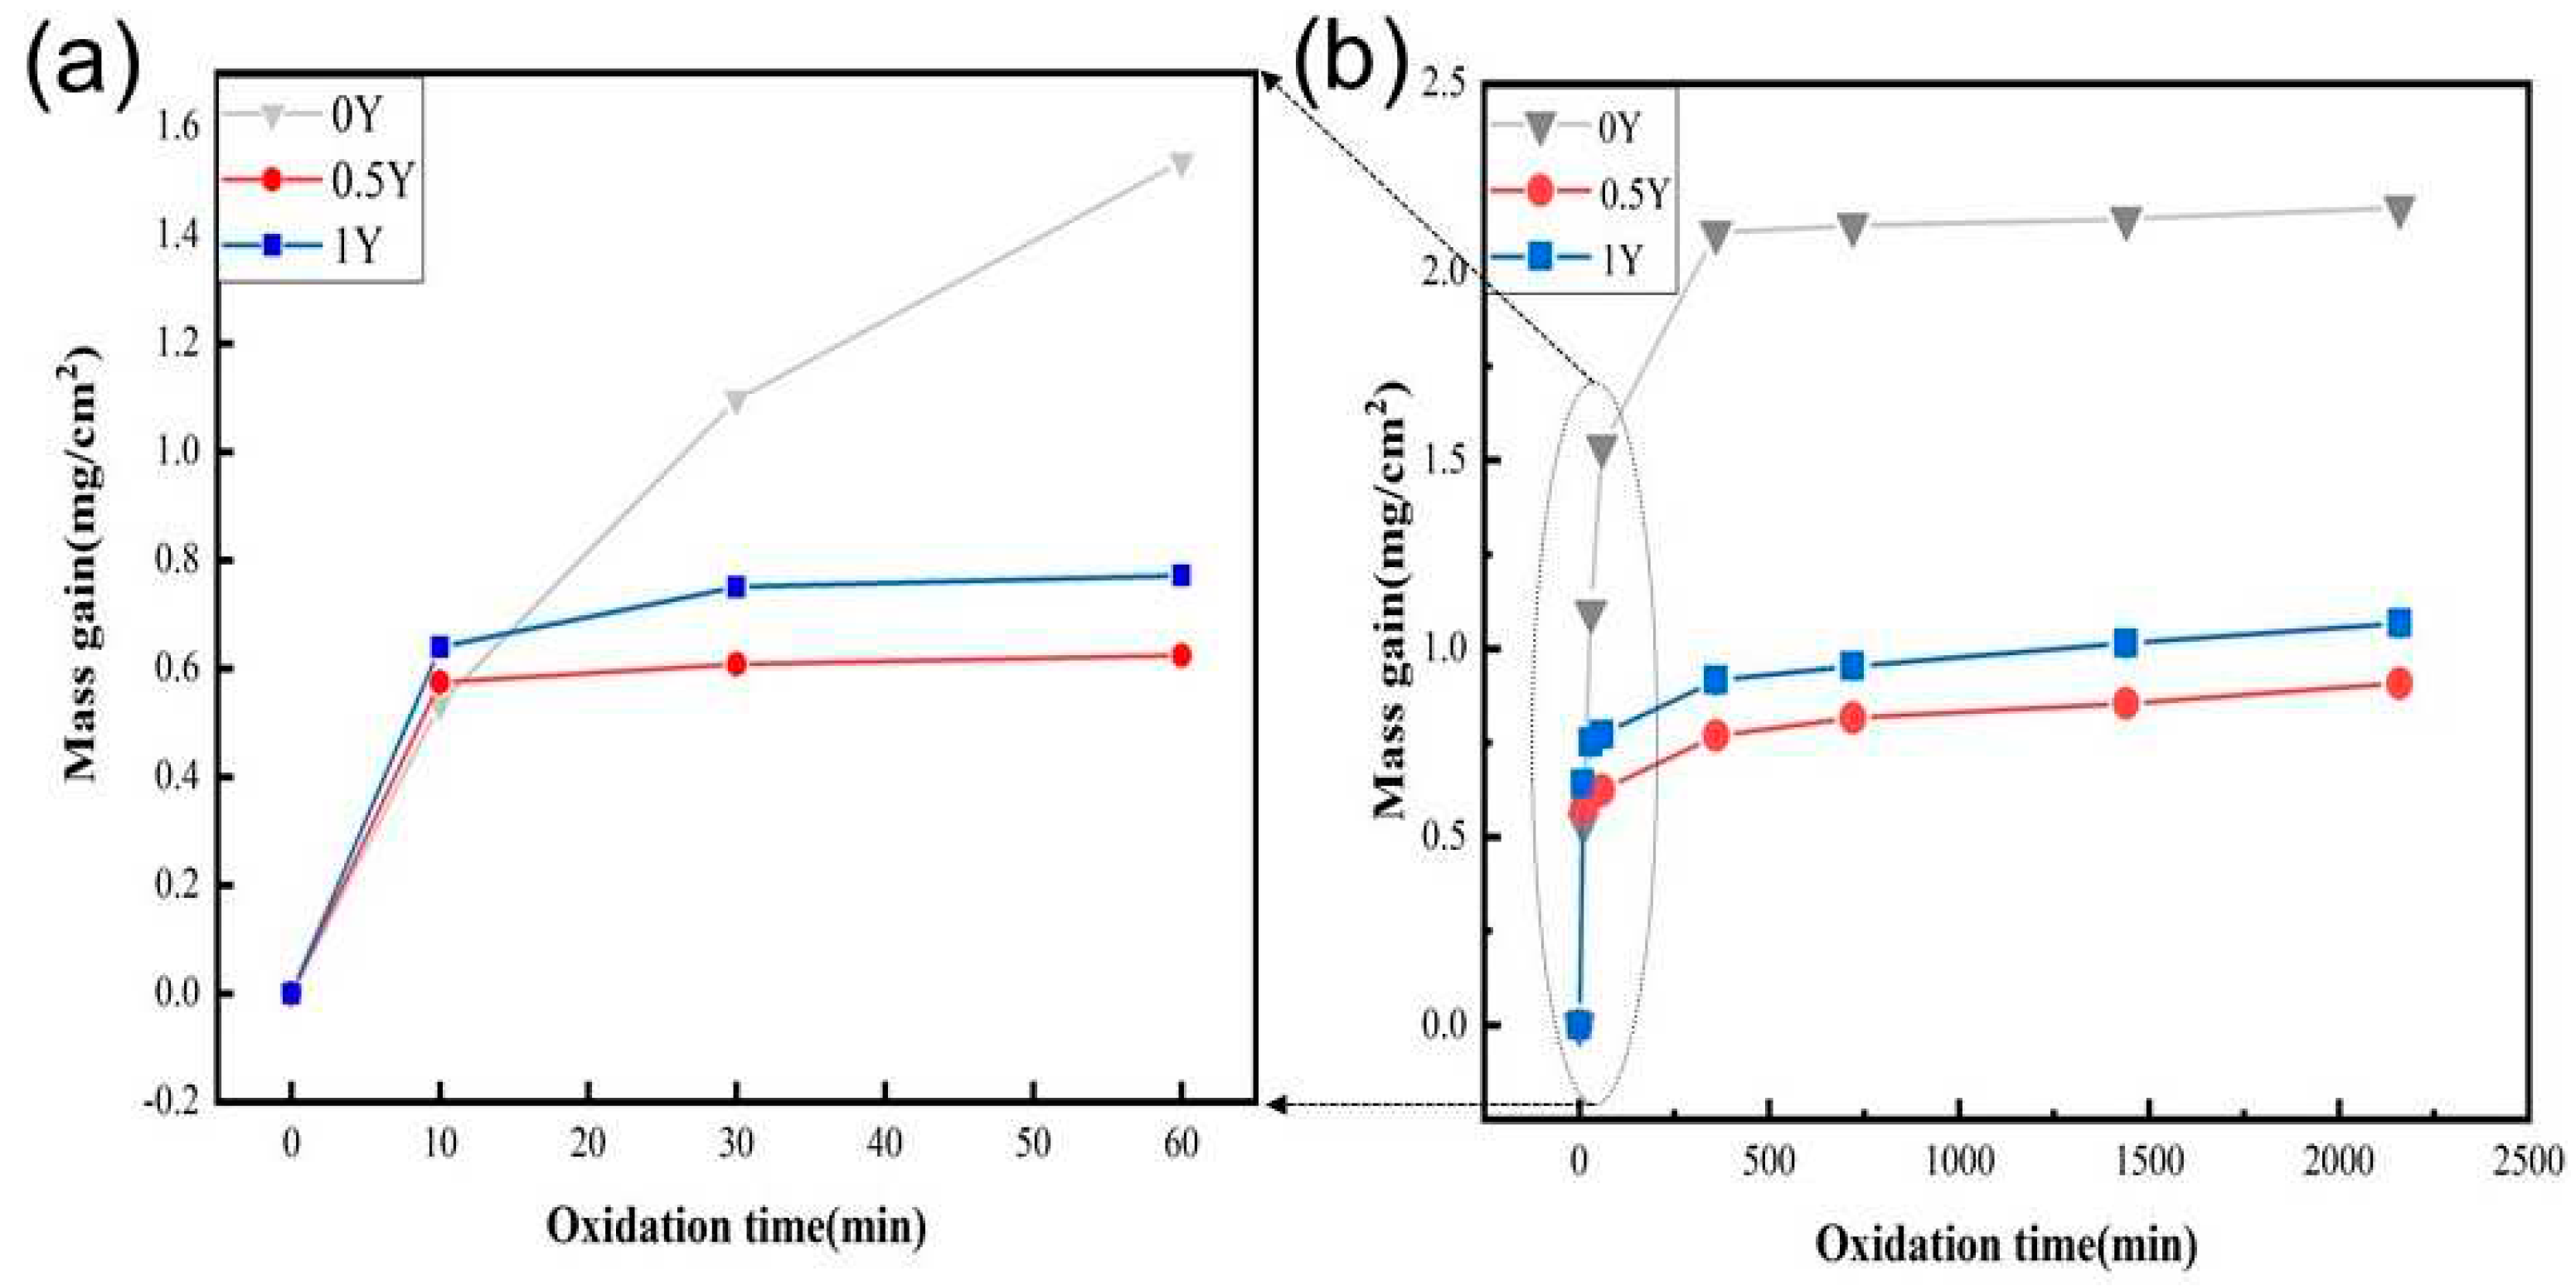
Figure 3 shows the high-temperature oxidation kinetic curves of alloy specimens oxidized in air at 1000°C for 2160 min, from which it can be seen that the mass of three alloys, 0Y, 0.5Y, and 1Y, which have different Y contents, all increase with oxidation time during high-temperature oxidation, and compared with the 0Y alloys, the 0.5Y and 1Y alloys have smaller mass increases, while the 0Y alloys have the largest mass increases. The above results show that the three alloys have the largest mass increase. The above results show that the three alloys have the same oxidation behavior, the initial oxidation stage for 0Y alloy is 0-60 min, the second stage of oxidation is 10-360 min, and the third stage of oxidation is after 360 min, while for 0.5Y and 1Y alloys, the initial stage of oxidation is 0-10 min, the second stage of oxidation is 10-360 min, and the third stage of oxidation is after 360 min. 360 min later. In the initial stage of oxidation, the mass increase are linear growth with the extension of oxidation time, this stage is mainly the formation of oxide film, the oxidation rate is faster, the oxidation is mainly controlled by the chemical reaction; in the second stage of oxidation, the mass increase is slow, mainly the formation of the oxide film is transformed into the growth of the oxide film, the alloy surface forms a layer of thinner Cr2O3 oxide film, the oxygen is diffused to the interface through the oxide layer, while the element in the alloy matrix diffusion, at the same time the elements within the alloy matrix to the reaction interface diffusion, the material oxidation rate by the chemical reaction and diffusion rate jointly controlled by the oxidation of the third stage, mainly by the matrix elements outward diffusion and oxygen atoms to the inward diffusion of the control. When the oxidation time reaches 2160 min, the best high-temperature oxidation resistance is 0.5Y alloy, whose oxidized weight gain is about 0.91 (mg/cm2), the worst high-temperature oxidation resistance is 0Y alloy, whose oxidized weight gain is about 2.17 (mg/cm2), and 1Y alloy's high-temperature oxidation resistance is a little bit poorer than 0.5Y alloy, but they are all better than that of 0Y alloy.
In other words, all the Y-added alloys have better high temperature oxidation resistance than the non-Y-added alloys. In addition, the reaction time of the initial oxidation stage of the Y-added alloys is greatly reduced compared with that of the Y-free alloys, which suggests that the addition of trace amounts of rare earth Y to the alloys can promote the rapid formation of dense oxide film on the surface of the alloys and improve the high-temperature oxidation resistance of the alloys. According to the reports in the literature [18,19], it is speculated that there are several reasons, (1) rare earth Y elements doped into the alloy in the form of precipitation phase in the alloy, due to the presence of Ni5Y phase, so that the alloy grain in the process of growing up to inhibit the growth of the alloy, the alloy grain size refinement, the alloy grain boundaries increased, and in the process of oxidation diffusion in alloys is generally dominant is the grain boundaries of the diffusion. Alloy grain boundaries increase, Cr element diffusion channels increase, making the alloy to form a dense protective oxide film Cr2O3 film time is greatly reduced, so the alloy in the oxidation of the early stage of rapid oxidation, and in the oxidation of the late oxidation rate tends to flatten. (2) Rare earth Y element in the high temperature oxidation process with the oxidation process, rare earth Y element activity is high, easy to oxidize. According to the dynamic polarization theory, Y ions from the matrix polarization in the oxide grain boundaries, due to the atomic radius of the rare earth ions is larger, polarization in the oxide grain boundaries can prevent the other cations in the alloy to the outside of the spread and the oxygen negative ions of the diffusion of the inward, so that the alloy of the oxidation layer thickness is reduced, reduce the oxidation rate of the alloy.

3.3. Surface morphology and tissue composition analysis of oxidation products

Figure 4 shows the XRD spectra of the surface oxide film of 47Fe-36Ni-15Cr-1.5Mn-xY alloy specimens after high-temperature oxidation, and it can be seen that, after oxidizing the 47Fe-36Ni-15Cr-1.5Mn-xY (0, 0.5 wt.%, and 1 wt.%) alloys at 1000 ℃ for 30 min and 2160 min, the three alloys after oxidation showed similar XRD data spectra, and compared with the specimens before oxidation, the characteristic peaks of γ-Fe were enhanced after 30 min of oxidation, while the characteristic peaks of γ-Fe were weakened or even disappeared after 2160 min of oxidation. Compared with the samples before oxidation, the characteristic peak of γ-Fe is enhanced after 30 min of oxidation, and the characteristic peak of γ-Fe is weakened or even disappeared after 2160 min of oxidation, which indicates that in the initial stage of high-temperature oxidation, the oxide film has not yet been completely formed, and the high temperature is conducive to the birth of γ-Fe austenite phase grains, making the increase in the degree of crystallinity, and thus the characteristic peak of the γ-Fe austenite phase becomes stronger, and the thicker and more stabilized grains are grown on the surface of the alloys with the prolongation of oxidation time. With the extension of oxidation time, a thick and stable oxide film grows on the surface of the alloy, which makes the γ-Fe characteristic peak weaker. From Figure 4a, it can be seen that the oxidation products of 0Y alloy are mainly composed of Cr2O3 and Mn1.5Cr1.5O4 after 30 min of oxidation. With the increase of oxidation time, the alloy oxides are mainly composed of Fe3O4 and Fe2O3 type oxides. In Figure 4b,c, it can be seen that in 0.5Y and 1Y alloys after 30 min of oxidation, the oxidation products are mainly Cr2O3 and Mn1.5Cr1.5O4, while after 2160 min of oxidation, the oxidation products are mainly composed of M (Fe, Ni, Cr, Mn)3O4, which the addition of the surface Y does not have much effect on the type of oxides generated.
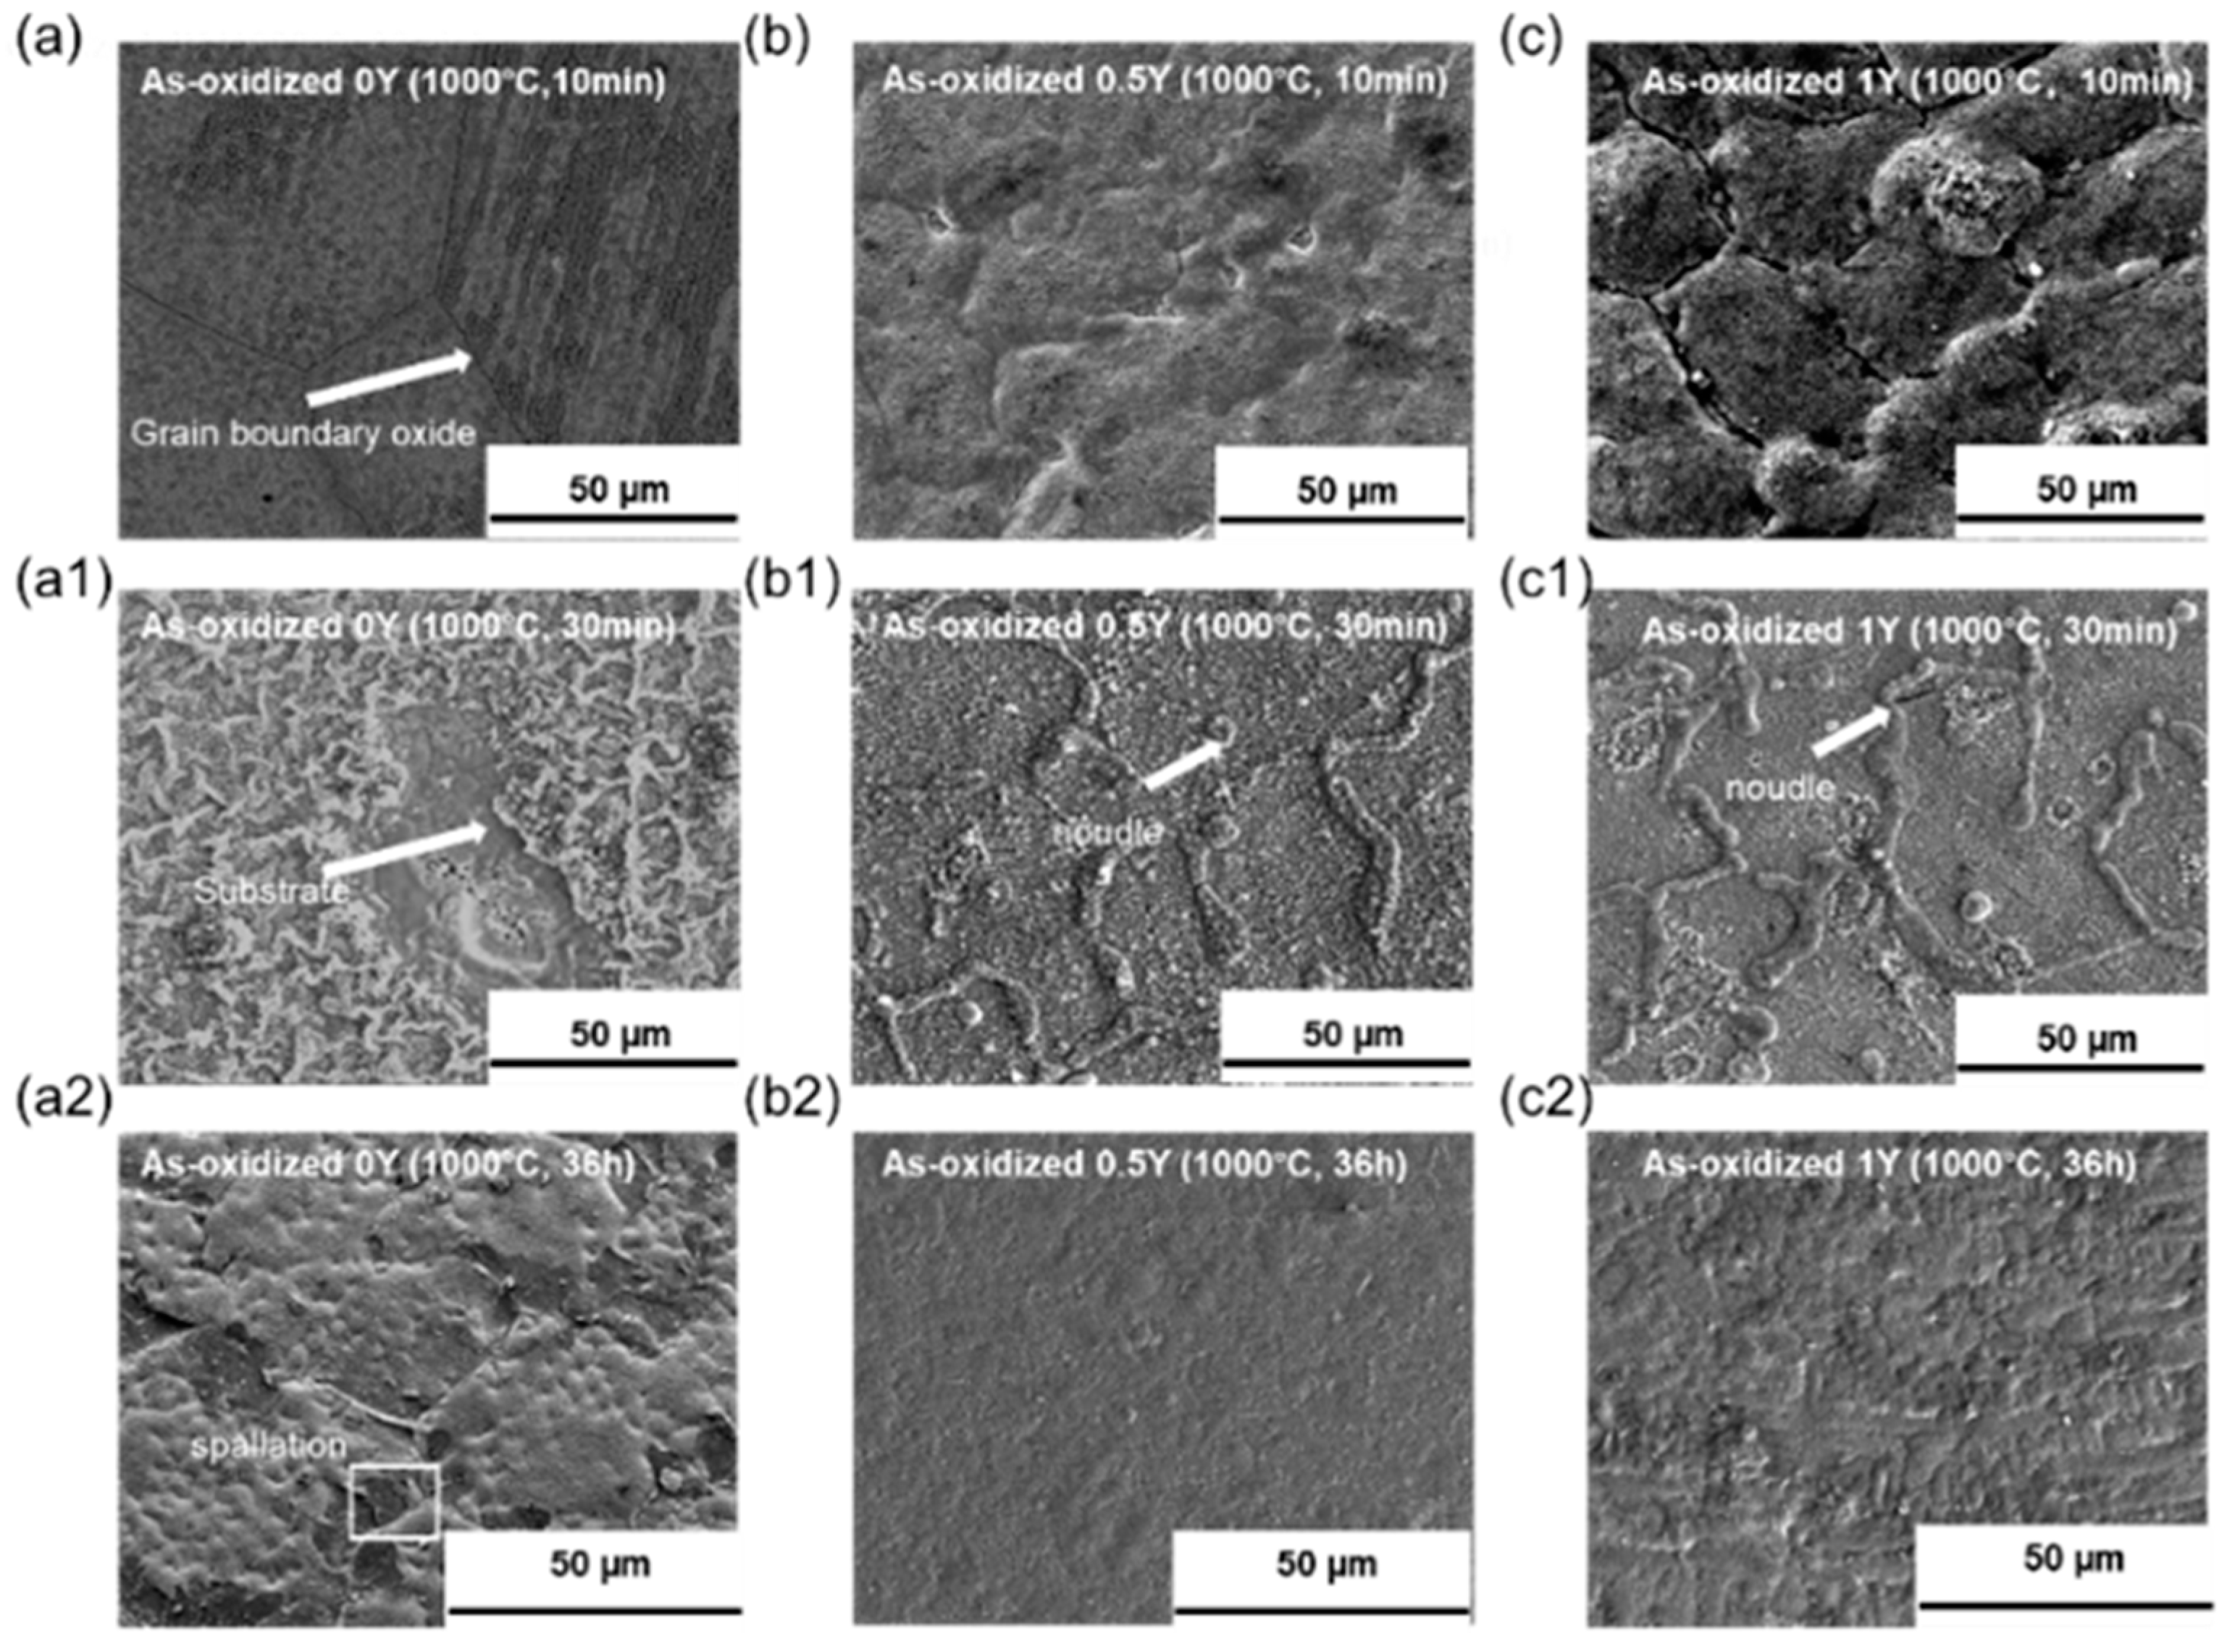
Figure 5 shows the electron microscope scans of the surface morphology of the oxide films of Fe-Ni-Cr-xY alloys after oxidation in air at 1000 °C for 10 min, 30 min and 2160 min. From Figure 5a–c, it can be seen that grain boundary oxides and spherical oxides were formed in all three alloy samples. The grain boundary oxides are formed rapidly in the grain boundary region, and the grain boundary becomes a diffusion channel for metal cations to combine with oxygen negative ions in the environment. The formation of grain boundary oxides is caused by the rapid diffusion of metal ions through the grain boundary region. The generation of the oxide layer begins when the alloy is exposed to high temperature air, and at the initial stage of oxidation, the oxides begin to nucleate, and the oxygen negative ions react with the alloy metal cations at the interface between the metal and the air. As the exposure time grows, the oxide nucleation ends and begins to grow outward. As the oxide grows, the oxide size gradually increases and the reaction rate increases. Successive lateral growth of the oxide will result in the formation of a continuous oxide layer by collision of the oxide particles with each other. When the surface of the alloy is completely covered by the oxide, the growth rate of the oxide begins to decrease, and the oxide layer changes to grow upward, and this change in growth direction will further thicken the oxide film of the alloy. The diffusion mechanism of metal ions in the alloy is mainly metal ions along the short-circuit diffusion and lattice diffusion. While in the short-circuit diffusion process, the ion diffusion rate is faster and the oxide growth rate is higher. Compared with the 0Y alloy, from the surface of the oxide film after 10 min of oxidation, it can be seen that the surface of the Y-containing alloy generates fluffy bulging oxides and cracking occurs at the grain boundaries, and the amount of oxide generated is more than that of the Y-free alloy, and with the increase of Y content, the amount of oxide generated is more. From Figure 5a1–c1, it can be seen that the oxide film on the surface of the 0Y alloy gradually becomes thicker at 30 min of oxidation, and local flaking occurs, whereas the oxide film on the surface of the 0.5Y and 1Y alloys becomes denser, and the surface of the oxide film begins to form a tumulus-like oxide and the continuous oxide co-exists with the grain-boundary oxides on the surface of the samples, and the cracks at the grain-boundaries are closed by the subsequently generated oxide film; From Figure 5a2–c2, it can be seen that after oxidizing for 2160 min, the surface of 0Y alloy formed a thick and uneven oxide layer, and the local spalling phenomenon occurred, in 0.5Y alloy, the surface oxide film was dense and the surface was smooth and flat, and the surface oxide film of 1Y alloy was rough and showed an uneven morphology.
From the metallographic diagram of Figure 1d, it is concluded that with the addition of Y the grain size of the alloy decreases and the grain boundary coefficient of the alloy increases, which results in an increase in the number of channels for the outward diffusion of metal cations in the alloy, and due to the large number of outward diffusion of the metal cations an oxide film is formed on the surface of the alloy. It has been reported in the literature [20] that at the early stage of oxidation, due to the high activity of rare-earth elements, rare-earth oxides are preferentially generated on the surface of the alloys to provide nucleation sites for the nucleation and growth of other metal oxides, which is consistent with the conclusion that the weight gain of Y-containing alloys at the early stage of oxidation is higher than that of Y-free alloys in the oxidation kinetic curves of Figure 3.
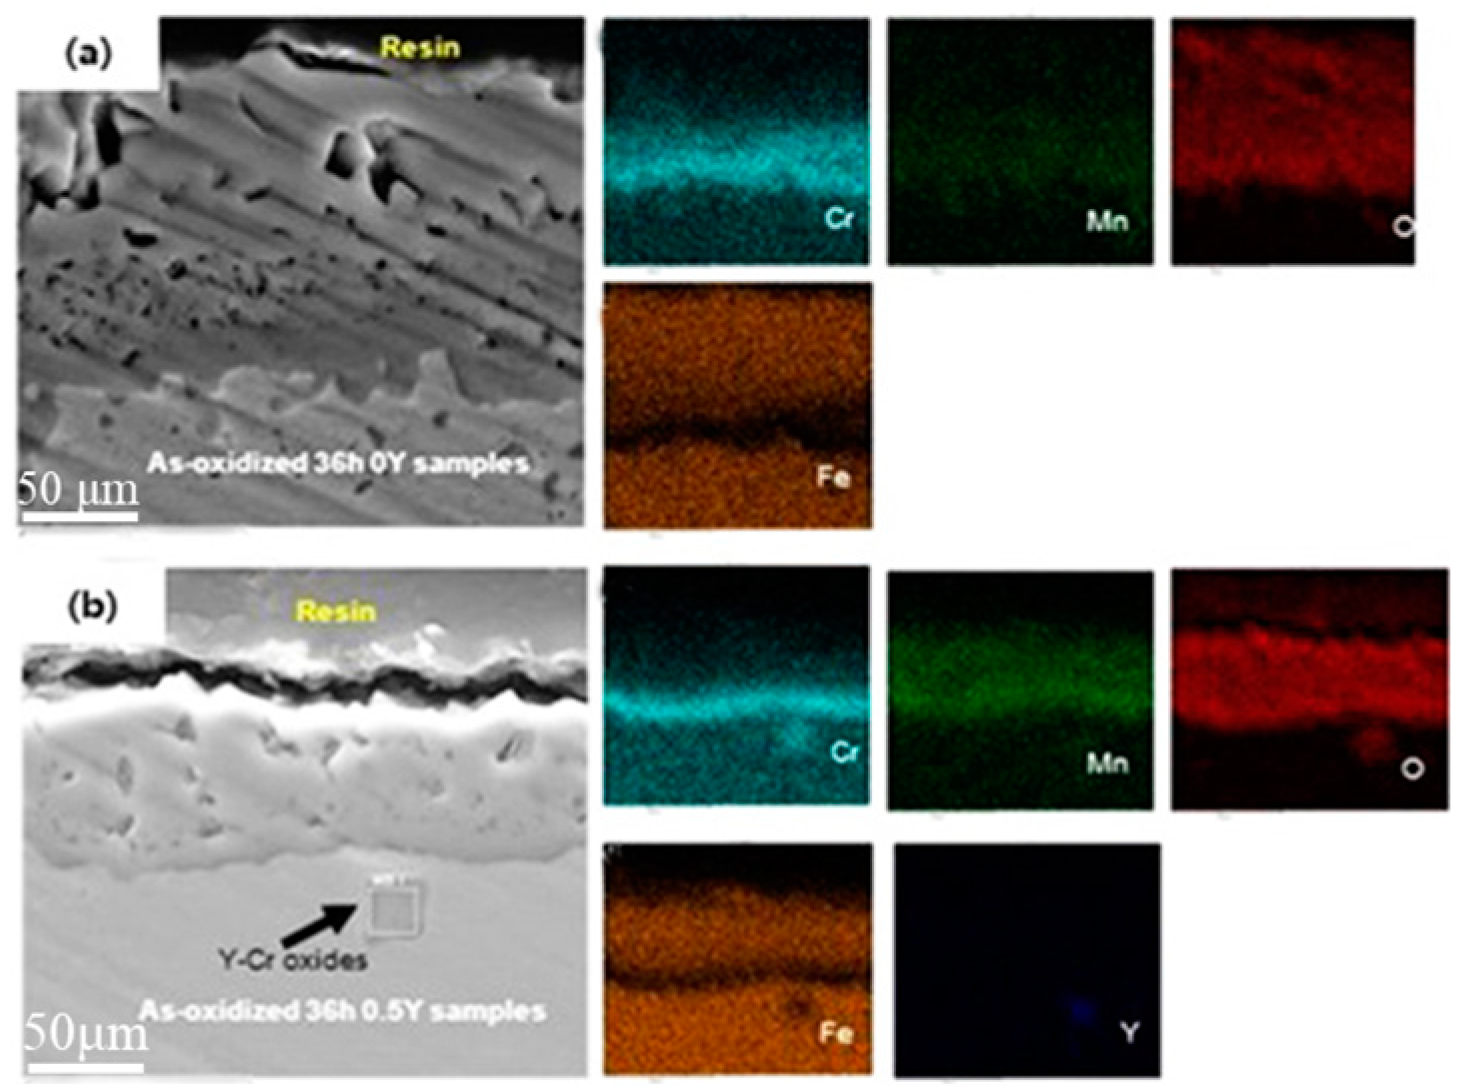
Figure 6 shows the cross-sectional SEM images and corresponding EDS patterns of the 47Fe-36Ni-15Cr-1.5Mn-xY alloy after oxidation at 1000 ℃ for 2160 min. As can be seen in Figure 6a, the surface of the 0Y alloy formed a continuous coverage of oxide film, which mainly consisted of Fe-rich oxides in the outer layer (with thickness of about 12 μm), and Mn1.5Cr1.5O4 oxides and protective Cr2O3 oxides in the inner layer (with thickness of about 5.2 μm). (thickness of about 5.2 μm) of protective Cr2O3 oxide. From Figure 6b, it can be observed that the outer layer of 0.5 Y alloy is mainly Fe-rich oxide layer (thickness of about 7.4 μm), and the inner layer is mainly protective Cr2O3 layer (thickness of about 2.1 μm). 0Y alloy has the thickest thickness of the oxide layer, and the thickness of Cr-rich layer and Fe-rich oxide layer is thicker than that of the 0.5 Y alloy, and the large number of pores in the cross-sectional morphology suggests that the oxide layer is relatively loose and cannot be efficiently removed from the surface of the alloy. This shows that the oxide layer is relatively loose and cannot effectively prevent the diffusion of metal cations or oxygen negative ions during the high-temperature oxidation process, and cannot play a good anti-temperature oxidation effect. On the contrary, the cross-section morphology of 0.5 Y alloy has fewer holes, good densification, the appearance of Y, Cr mixed oxides, and the cross-section of the oxide film composition has not changed much, but the overall thickness is reduced by about 50% compared to 0 Y alloy, this is due to the rare earth Y elements added into the alloy, its solubility is low, in the alloy melting process is easy to be in the alloy at the alloy grain boundaries in the form of precipitation phase exists in the alloy. During high-temperature oxidation, these precipitated phases are present inside the grains and at the grain boundaries, leading to the formation of coarser inclusions. Rare earth-rich Y precipitates are preferentially oxidized over Cr. The occurrence of internal oxidation in Y-containing alloys is unavoidable due to the high oxygen diffusivity of rare earth-containing oxides, which can provide a large number of short-circuit diffusion pathways for oxygen inward [21]. The internally oxidized oxides mainly consist of oxides of Fe, Ni and Cr encapsulated with trace amounts of Y-containing oxides, and the appearance of rare earth precipitation phases leads to severe internal oxidation of the alloys.
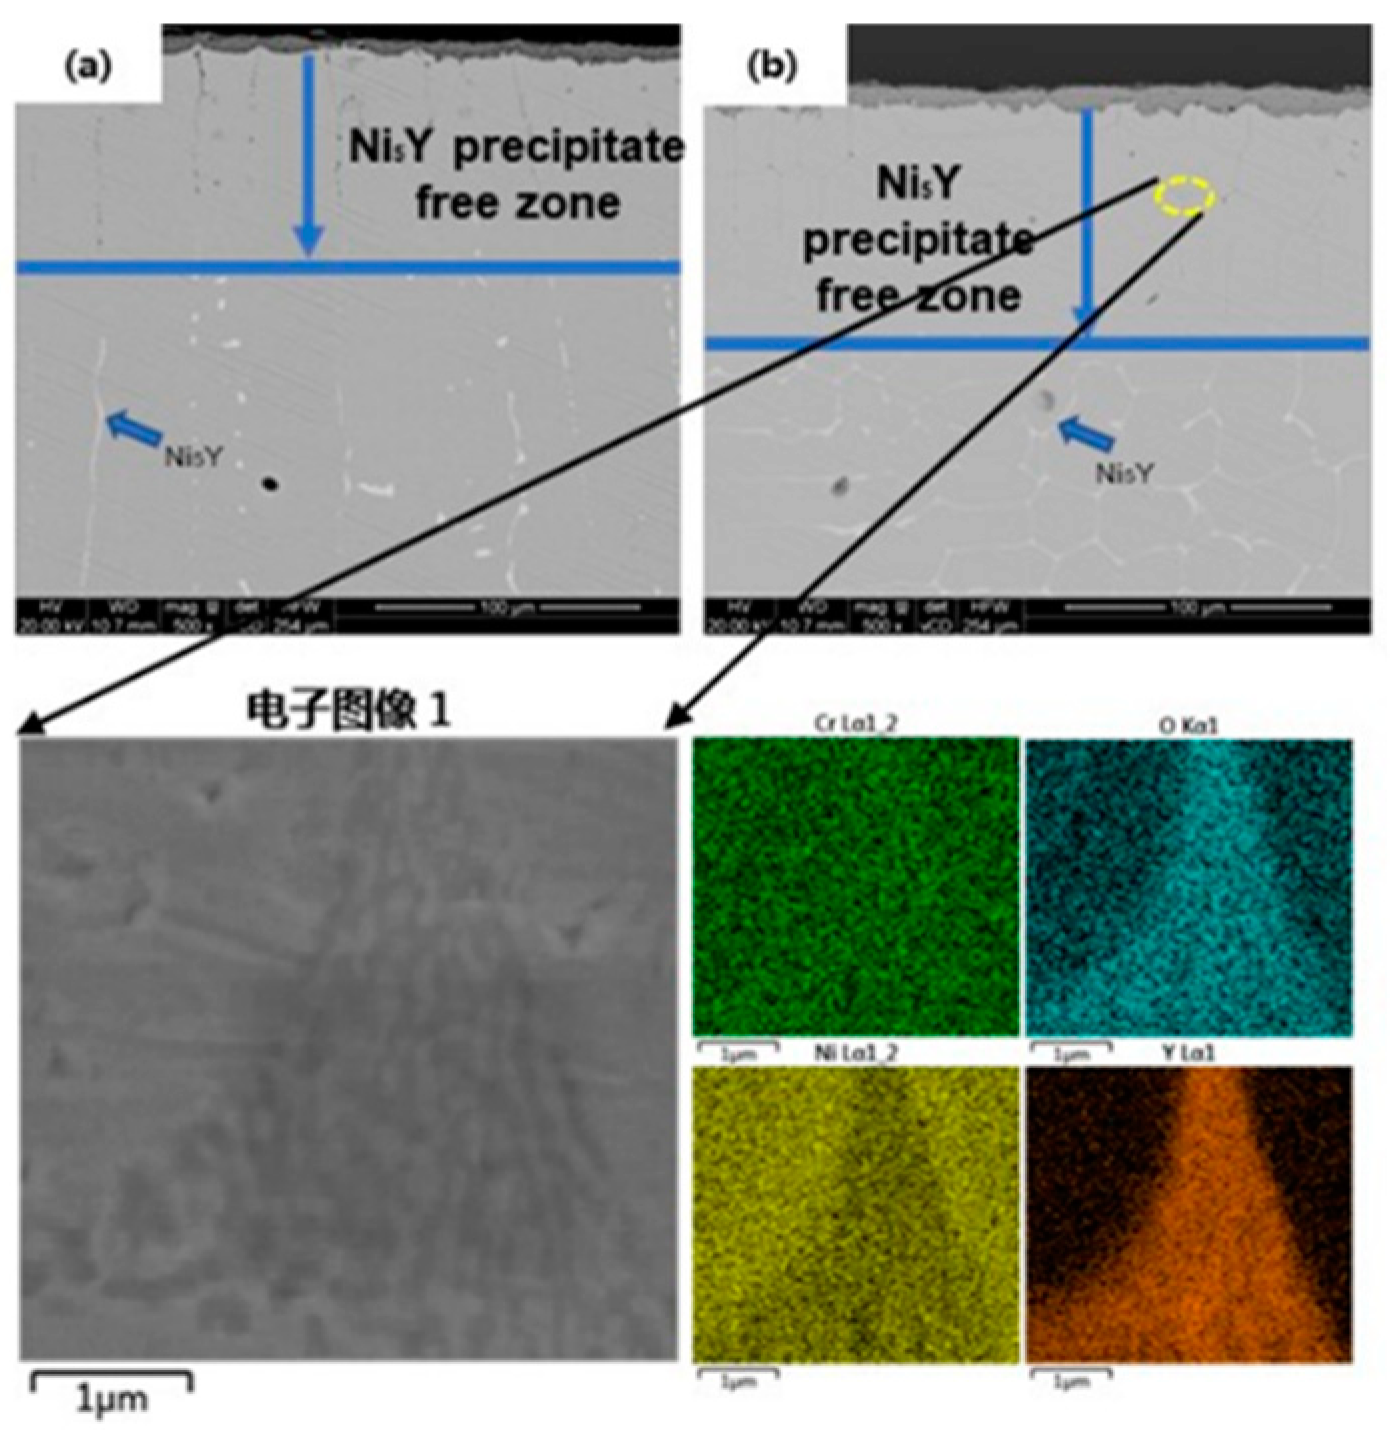
Figure 7 shows the cross-sectional high magnification SEM images and corresponding EDS patterns of 0.5 Y and 1 Y alloys after oxidation at 1000°C for 2160 min. From Figure 7a, it can be found that three kinds of regions appear in the Y-containing alloys after oxidation, the oxidized layer region, the region of Ni5Y-phase-free region, and the region of Ni5Y-phase-enriched region. Comparing the two Y-containing alloys, the degree of internal oxidation of the 0.5 Y alloy is slightly shallower than that of the 1Y alloy, which is due to the fact that the thickness of the surface oxide layer of the alloy decreases as a whole when the rare earth elements are added, which reduces the stress of the growth of the surface oxide film at the late stage of oxidation of the alloy and avoids the phenomenon of flaking off of the oxide film layer. And in the Y-containing alloys without Ni5Y phase grain boundaries in the region of the rare earth Y-rich wedge-shaped oxides. These oxides can play a "pinning effect" on the outer oxide layer, and the wedge-shaped oxides can significantly improve the bonding force between the alloy oxide film and the substrate, and enhance the spalling resistance between the oxide film layer and the substrate [22].

4. Conclusions

(1) Different Y contents have significant effects on the microstructural aspects of Fe-Ni-Cr alloys. The moderate amount of Y can refine the alloy grain. With the increase of Y content, the Ni5Y phase precipitated in the alloy changes from discrete distribution at the alloy grain boundaries to uniform distribution at the alloy grain boundaries. Corresponding to the changes in microstructure is the effect of different Y content Fe-Ni-Cr alloy hardness. The hardness of the alloy increased with the increase of Y content after the alloy was held at 700 ℃ for 4320 min.
(2) The addition of Y element can obviously change the anti-temperature oxidation performance of Fe-Ni-Cr alloy, the addition of appropriate amount of Y can make the matrix to obtain a higher Y solid solubility, which is conducive to the formation of Cr2O3 protective oxide layer, hindering the diffusion of the alloy matrix elements to the outside, and enhance the resistance to spalling between the surface oxide film and the matrix, which significantly improves the anti-temperature oxidation performance of the alloy. While 1Y alloy due to the generation of excessive oxide pinning makes the alloy occur serious internal oxidation, oxidation rate accelerated, and is not conducive to the anti-temperature oxidation performance of the alloy.

Author Contributions

Conceptualization, W.X.; methodology, X.C.; software, S.F. and J.Y.; validation, H.W. and W.S.; formal analysis, X.C.; investigation, J.Y.; resources, X.C.; data curation, S.F.; writing—original draft preparation, S.F.; writing—review and editing, S.F. and X.C.; supervision, W.X.; funding acquisition, W.X. All authors have read and agreed to the published version of the manuscript.

Funding

This research was funded by the National Natural Science Foundation of China (No.51405385), the Natural Science Foundation of Shaanxi Province (2017JM5095), the Key Project of Provincial Government Linkage in Shaanxi Province (2022GD-TSRD-22), the Graduate Innovation and Practical Ability Training Program of Xi’an Shiyou University (YC22121022).

References

  1. Wang, Q., Guo, J., Li, R, R., et al. Exploring the role of nuclear energy in the energy transition: A comparative perspective of the effects of coal, oil, natural gas, renewable energy, and nuclear power on economic growth and carbon emissions. Environmental Research, 2023 (211): 115290. [CrossRef]
  2. Mathew, M. D., Nuclear energy: A pathway towards mitigation of global warming. Progress in Nuclear Energy 2022 (143): 104080. [CrossRef]
  3. Jurakulov, S. Z., Nuclear energy. Educational Research in Universal Sciences, 2023 (10): 514-518.
  4. Was, G. S., et al. Materials for future nuclear energy systems. Journal of Nuclear Materials, 2019 (527): 151837. [CrossRef]
  5. Schulenberg, T., and Laurence K.H.L., Super Critical Water-cooled Reactors (SCWRs). Handbook of Generation IV Nuclear Reactors. Woodhead Publishing, 2023. 259-284.
  6. Ganji, D. K., and Rajyalakshmi, G. Influence of alloying compositions on the properties of nickel-based superalloys: a review. Recent Advances in Mechanical Engineering: Select Proceedings of Ncame, 2020 (2019): 537-555.
  7. Chen, S. H., et al. Tailoring Microstructure of Austenitic Stainless Steel with Improved Performance for Generation-IV Fast Reactor Application: A Review. Crystals, 2023(13): 268.
  8. Zhang, H. W., Yang, Z., Wu, Z.Y., et al. Oxide-Scale Evolution on a New Ni–Fe-Based Superalloy at High Temperature. Oxidation of Metals, 2019 (92): 49-65. [CrossRef]
  9. Veselkov, S., et al. High-temperature oxidation of high-entropic alloys: A review. Materials, 2021 (14): 2595. [CrossRef]
  10. Yiliti, Y., Dong, G.Y., Liu, X.Y., et al. The high temperature oxidation behavior of a superalloy prepared by vacuum induction melting and electron beam smelting: A comparative study. Journal of Materials Research and Technology, 2023 (25): 6977-6991. [CrossRef]
  11. Young, J., The nature of high temperature oxidation. Corrosion Series, 2008: 11-27.
  12. 12. Zheng, Z, B., Wang, S., Long, J., et al. Effect of rare earth elements on high temperature oxidation behaviour of austenitic steel. Corrosion Science, 2020 (164): 108359.
  13. Li, X. L., He, S.M., Zhou, X. t., et al. Effects of rare earth yttrium on microstructure and properties of Ni–16Mo–7Cr–4Fe nickel-based superalloy. Materials characterization, 2014 (95): 171-179.
  14. Khokhlov, V. V., et al. Theoretical analysis of anomalies in high-temperature oxidation of Fe–Cr, Fe–Ni, and Fe–Ni–Cr alloys. Protection of metals, 2004 (40): 62-66.
  15. Saito, Yasutoshi. The role of rare earth elements on the high-temperature oxidation of heat-resisting alloys. Tetsu-to-Hagane, 1979, (25): 747-771. [CrossRef]
  16. Yang Z, Lu J.T., Yang. Z., et al. Oxidation behavior of a new wrought Ni-30Fe-20Cr based alloy at 750°C in pure steam and the effects of alloyed yttrium. Corrosion Science, 2017, (125): 106-113.
  17. Rare Earth Research Group. Rare Earth [M]. Vol.2, Beijing: Metallurgical Industry Press, 1978: 25.
  18. Parimin, N., Hamzah, E., Amrin, A., et al. Effect of grain size on the isothermal oxidation of Fe-33Ni-19Cr alloys at 700 ℃. Advanced Materials Research, 2014, (845): 56-60. [CrossRef]
  19. Wu. Y, Li. Y., Xu. Y., et al. Unveiling the precipitation-induced high-temperature oxidation behavior in a Ni-Al-Y alloy. Materials Letters, 2021, (297): 129977.
  20. Hou. P. Y., Stringer J. The effect of reactive element additions on the selective oxidation, growth and adhesion of chromia scales. Materials Science & Engineering A, 1994, 202(1-2): 1-10.
  21. Cheng, X., Fan, L., Liu, L., et al. Effect of doping aluminum and yttrium on high-temperature oxidation behavior of Ni-11Fe-10Cu alloy. Journal of Rare Earths, 2016, 34(11): 1139-1147. [CrossRef]
  22. Lustman B. The intermittent oxidation of some nickel-chromium base alloys. JOM, 1950, 2(8): 995-996. [CrossRef]
Figure 1. SEM images of alloy specimens: (a) 0Y alloy, (b) 1Y alloy; OM metallographs after corrosion: (c) 0Y alloy, (d) 1Y alloy.
Preprints 91370 g001
Figure 2. XRD spectra of 0Y, 0.5Y and 1Y alloys after annealing.
Preprints 91370 g002
Figure 3. Weight gain curve of alloy specimen oxidized at 1000°C for 36 h. (a) partial plot, (b) complete plot.
Preprints 91370 g003
Figure 4. XRD spectra of annealed state alloys Fe-36Ni-15Cr-1.5Mn-xY after isothermal oxidation at 1000 °C for 10 min, 30 min and 2160 min: (a) 0 Y alloy; (b) 0.5 Y alloy; (c) 1 Y alloy.
Preprints 91370 g004
Figure 5. Surface images of alloys after isothermal oxidation at 1000°C for 10 min, 30 min and 2160 min: (a) 0Y alloy; (b) 0.5Y alloy; (c) 1Y alloy.
Preprints 91370 g005
Figure 6. Cross-sectional SEM images and corresponding EDS patterns of Fe-36Ni-15Cr-1.5Mn-xY (0, 0.5 wt%) alloys after oxidation at 1000 °C for 2160 min: (a) 0Y alloys; (b) 0.5Y alloys.
Preprints 91370 g006
Figure 7. Cross-sectional high magnification SEM images and corresponding EDS patterns of Fe-36Ni-15Cr-1.5Mn-xY alloy after oxidation at 1000 °C for 2160 min: (a) 0.5 Y, (b) 1 Y.
Preprints 91370 g007
Table 1. Design composition of annealed alloys.
Samples Amounts(wt.%) of the elements
Fe Ni Cr Mn Y
0Y 47.5 36 15 1.5 0
0.5Y 47 36 15 1.5 0.5
1Y 46.5 36 15 1.5 1
Disclaimer/Publisher’s Note: The statements, opinions and data contained in all publications are solely those of the individual author(s) and contributor(s) and not of MDPI and/or the editor(s). MDPI and/or the editor(s) disclaim responsibility for any injury to people or property resulting from any ideas, methods, instructions or products referred to in the content.
Copyright: This open access article is published under a Creative Commons CC BY 4.0 license, which permit the free download, distribution, and reuse, provided that the author and preprint are cited in any reuse.
Prerpints.org logo

Preprints.org is a free preprint server supported by MDPI in Basel, Switzerland.

Subscribe

© 2024 MDPI (Basel, Switzerland) unless otherwise stated