
Submitted:
24 November 2023
Posted:
28 November 2023
You are already at the latest version
Abstract
Background: We screened key genes involved in the dedifferentiation process of thyroid cancer by analyzing differentially expressed genes in anaplastic thyroid carcinoma (ATC) using Gene Expression Omnibus (GEO) database.
Methods: We analyzed differentially expressed genes in ATC from GEO database and constructed a co-expression network using Weighted Gene Co-expression Network Analysis (WGCNA) . Cytoscape was used to calculate top ten key genes based on their gene scores. DEPDC1 was selected as interest gene for further validation, including examination of its prognostic relationship with thyroid cancer, correlation analysis with thyroid differentiation markers, immune cell infiltration, and tumor microenvironment. The impact of DEPDC1 on cancer cell migration, invasion, and proliferation was validated through downregulation and overexpression of DEPDC1 gene in thyroid cancer cell lines c643 and BCPAP.
Results: We identified top 10 key genes in ATC: AURKA, TPX2, RACGAP1, MELK, DLGAP5, DEPDC1, KIF2C, NCAPG, CCNB1, and PBK. DEPDC1 showed a strong correlation with the prognosis of thyroid cancer. The odds ratio (OR) for overall survival was 3.5 (P=0.016) in individuals with high DEPDC1 expression, and the OR for disease-free survival was 2.6 (P=0.003). Additionally, the analysis revealed a significant negative correlation between the expression of DEPDC1 and thyroid differentiation markers. Gene Ontology enrichment analysis demonstrated that DEPDC1 co-expressed genes were enriched in cellular processes, cell cycle pathways, and dynamic protein groups. Matrix and immune scoring indicated tumor microenvironment and immune scores were associated with DEPDC1 expression. TIMER2.0 online analysis revealed a strong correlation between DEPDC1 expression and immune cell infiltration in papillary thyroid carcinoma. After downregulation of DEPDC1 expression, the invasion, migration, and proliferation abilities of tumor cells were significantly reduced. Conversely, overexpression of DEPDC1 exhibited the opposite effect.
Conclusion: DEPDC1, a newly identified dedifferentiation gene in thyroid cancer, inversely correlated with the degree of differentiation. High expression of DEPDC1 promotes cancer progression and leads to poor prognosis in thyroid cancer.
Keywords:
DEPDC1
; Dedifferentiation
; Expression correlation
; Cancer progression
; Prognosis
1. Introduction
Thyroid cancer (TC) is the most common endocrine malignancy and has shown a significant increase in incidence worldwide in recent years, leading to increased mortality rates[1,2]. TC includes various histological types, including papillary thyroid carcinoma (PTC) and anaplastic thyroid carcinoma (ATC). PTC accounts for over 80% of all TC and is a well-differentiated type with a good clinical prognosis and a 10-year specific survival rate exceeding 90%[3]. On the other hand, ATC exhibits high malignancy and poor prognosis and is considered one of the most undifferentiated types of cancer, with a median survival of only 6-8 months and contributing to nearly half of TC-related deaths[4,5]. This type of cancer is considered to exhibit the lowest degree of cancer cell differentiation.
Dedifferentiation refers to the transformation of initially well-differentiated thyroid cells, resulting in the loss of normal characteristics and function, leading to a decrease in cell differentiation. This dedifferentiation process is often directly associated with tumor invasiveness and poor prognosis. Histologically, PTC can progress to ATC through dedifferentiation, a common biological process in cancer, causing tumors to transition from a highly differentiated state to a poorly differentiated state[6]. Luo et al. showed that ATC cells originate from a small fraction of PTC cells[7]. Lina Lu et al. utilized single-cell transcriptomic and genetic alteration data from different subtypes of cancer patients to study the dedifferentiation process from PTC to ATC, including stress response DTC cells, inflammatory ATC cells (iATCs), papillary defect ATC cells, and extending all the way to mesenchymal ATC cells (mATCs)[8]. Therefore, key differentially expressed genes identified in ATC may be crucial genes involved not only in TC but also in the dedifferentiation process of other types of cancer. Thus, screening and studying key genes closely related to dedifferentiation in ATC are of significant importance for further understanding the invasion, migration, and proliferation mechanisms of TC, as well as for improving poor prognosis.
In our study, we employed weighted gene co-expression network analysis (WGCNA) to identify key genes in ATC. This method allows for weighted analysis of gene expression relationships, enabling the identification of highly correlated genes. It is commonly believed that key genes are more likely to be found among the highly correlated genes. Subsequently, we validated the screened key gene through database verification and in vitro experiments using cancer cell lines to further explore the following aspects of their relevance. First, we conducted correlation analysis of the expression of key gene to understand the expression patterns in TC and the association with the degree of dedifferentiation. Second, we studied the relationship between immune cell infiltration and key gene to determine its role in regulating the tumor microenvironment. We also investigated the relationship between key gene and the prognosis of patients with TC to assess its value as potential prognostic markers. Finally, we performed RNA interference and plasmid overexpression experiments in TC cell line to further validate its effects on the invasion, migration, and proliferation of TC by detecting the changes in the in vitro migratory, invasive, and proliferative abilities of these cancer cells. Through the aforementioned research, we hope to explore how new dedifferentiation key gene promote the invasion, migration, and proliferation of TC, and investigate their correlation with poor prognosis. This will contribute to a deeper understanding of the occurrence and developmental mechanisms of TC and provide strong evidence for clinical treatment and precision medicine.
2. Results
2.1. Screening of ATC-related Key Genes
2.1.1. Integration of gene expression omnibus (GEO) data: By integrating the GEO datasets, we obtained 134 samples with 22,880 gene expressions. These samples consisted of 55 normal, 59 PTC, and 20 ATC samples.
2.1.2. Screening of differentially expressed genes (DEGs): We identified a total of 2195 DEGs (Supplementary Material 1).
2.1.3. Preliminary Screening of Candidate Key Genes using WGCNA:
Soft thresholding calculations were performed for 2195 genes.
Verification of the optimal soft thresholding value: Through comparative analysis, a soft thresholding value of 8 yielded the most favorable results.
Construction of gene expression networks: We identified 280 genes, resulting in 590 gene expression links.
2.1.4. Cytoscape gene selection: Through screening, we selected ten genes for further analysis. These genes were AURKA, TPX2, RACGAP1, MELK, DLGAP5, DEPDC1, KIF2C, NCAPG, CCNB1, and PBK (Figure 1). DEPDC1 was selected for further research and validation.
2.2. Expression of DEPDC1 in TC
2.2.1. Protein translation levels of DEPDC1 in PTC and follicular thyroid carcinoma (FTC)
DEPDC1, known as DEP domain containing 1, is located within the cell nucleus and is a part of the transcriptional repression complex. Gene information from the NCBI website (https://www.ncbi.nlm.nih.gov/gene/) indicates that DEPDC1 may have enzymatic activation activity and participate in the negative regulation of transcription and DNA templating. The expression of DEPDC1 in TC tissue was observed in the cytoplasm, as shown in Figure 2, according to The Human Protein Expression Atlas (THPA, https://www.proteinatlas.org/). Studies have shown that DEPDC1 is involved in the occurrence and development of various cancers, but there is currently a lack of in-depth research specifically on TC[9,10,11,12].
2.2.2. Transcriptional expression levels of DEPDC1 and thyroid differentiation markers in different grades of thyroid cancer and their correlation
The analysis results demonstrated that as the degree of differentiation decreased gradually from normal tissue to PTC and ATC, the expression of DEPDC1 showed a gradual increase (Figure 3A, all P < 0.01), whereas the expression of thyroid differentiation markers, such as thyroglobulin (TG), thyroid peroxidase (TPO), and thyroid stimulating hormone receptor (TSHR), showed a gradual decrease (Figures 3B,D, all P < 0.001). In thyroid tissues, including normal tissue, PTC, and ATC, there was a significant negative correlation between the expression of DEPDC1 and thyroid differentiation markers, with correlation coefficients ranging from -0.72 to -0.8 (Figure 4A–C, all P-values less than 0.001).
2.3. The Influence of DEPDC1 Expression Levels on Thyroid Cancer Prognosis
We analyzed the influence of DEPDC1 expression on PTC prognosis through GEPIA 2 network. The odds ratio (OR) for DEPDC1 overexpression compared to low expression was 3.5 (P=0.016, Figure 5A) as revealed by the analysis of overall survival (OS). High expression of DEPDC1 was associated with significantly worse OS prognosis (P=0.01, Figure 5A). Similarly, the analysis of disease-free survival (DFS) revealed that the OR for DEPDC1 overexpression compared to low expression was 2.6 (P=0.003, Figure 5B). High expression of DEPDC1 was associated with significantly worse DFS prognosis (P=0.0021, Figure 5B).
2.4. Analysis of co-expressed genes of DEPDC1 in ATC.
We screened 622 genes that were co-expressed with DEPDC1 in ATC, with correlation coefficients ranging from 0.68 to 0.96 (Supplementary Material 2). The co-expression gene network is shown in Figure 6, indicating a strong correlation among genes co-expressed with DEPDC1.
Database for Annotation, Visualization, and Integrated Discovery (DAVID) Gene Ontology (GO) Biological Process enrichment analysis revealed that the genes co-expressed with DEPDC1 were primarily involved in cell division, followed by the cell cycle (Figure 7A). Analysis of cellular components showed that the majority of DEPDC1 co-expressed genes were localized in the nucleus, particularly in the nucleoplasm (Figure 7B). Molecular Function analysis indicated that genes co-expressed with DEPDC1 were primarily involved in protein binding (Figure 7C). Based on these findings, it can be inferred that DEPDC1 is likely located in the cell nucleus and participates in cell division and cell cycle processes through protein binding.
2.5. Relationship between DEPDC1 expression and tumor microenvironment
2.5.1. The tumor microenvironment analysis showed that individuals with high DEPDC1 expression had significantly higher stromal, immune, and overall scores than those with low expression (Figure 8. All P-values <0.001). Immune cell infiltration analysis revealed a significant positive correlation between DEPDC1 expression and infiltration of neutrophils, T cells CD4 memory activated T cells, gamma delta T cells, and dendritic cells resting in TC, while it showed a significant negative correlation with T cell regulatory (Tregs), B cell memory, and NK cell activation (Figure 9).
2.5.2. TIMER2.0 online analysis revealed that the expression of DEPDC1 showed a significant positive correlation with the infiltration of B cells, CD4+ T cells, CD8+ T cells, macrophages, neutrophils, and dendritic cells (Figure 10, P<0.01).
2.6. Involvement of DEPDC1 in migration, invasion, and proliferation of thyroid cancer cell lines
2.6.1. Changes in the transcription level of DEPDC1 after transfection. Compared to the negative control group, the DEPDC1 mRNA expression decreased by 84.7% in the c643 siRNA interference group, while the mRNA expression was 158 times higher in the overexpression group compared to the negative control group (Figure 11A). In BCPAP, the siRNA interference group showed a 89.3% decrease in expression, while the overexpression group showed a 236-fold increase in expression (Figure 11B).
2.6.2. The impact of siRNA interference and plasmid transfection overexpression of DEPDC1 on the migration ability of cancer cells. After siRNA interference of DEPDC1, the migration rate of c643 and BCPAP cells decreased compared to the negative control group (Figure 12A,B). On the other hand, plasmid transfection overexpression of DEPDC1 increased the migration rate of c643 and BCPAP cells compared to the negative control group (Figure 12C,D). These findings suggest that DEPDC1 is involved in enhancing the migration ability of cancer cells.
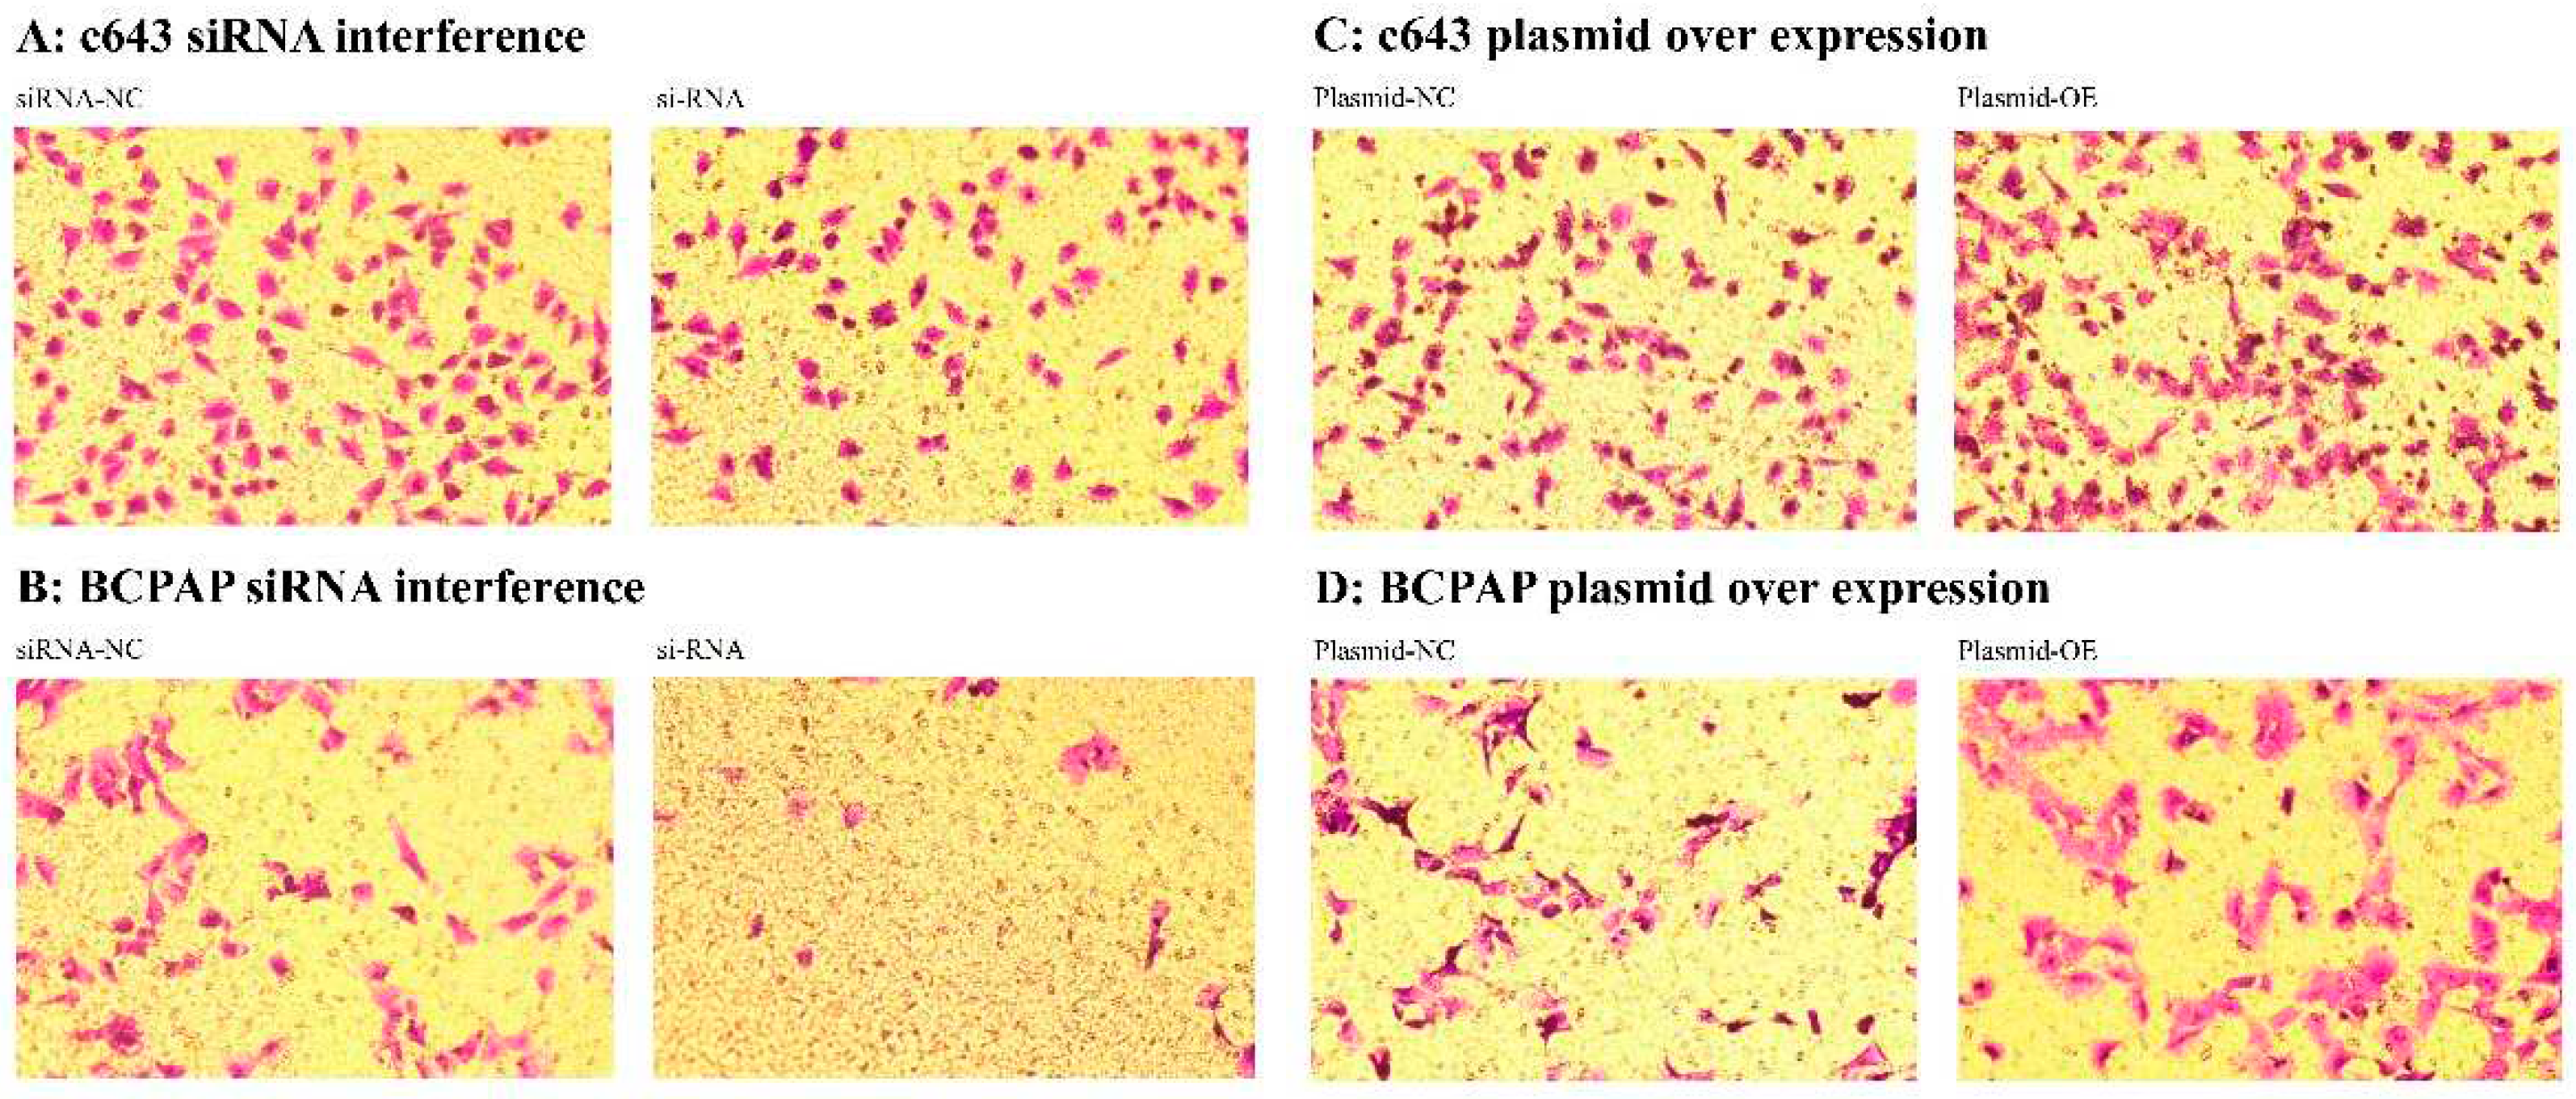
2.6.3. The impact of siRNA interference and plasmid transfection overexpression of DEPDC1 on the invasive ability of cancer cells after transcription. After siRNA interference of DEPDC1, the invasive ability of c643 and BCPAP cells decreased compared to the negative control group (Figure 13A,B). Conversely, plasmid transfection overexpression of DEPDC1 increased the invasive ability of c643 and BCPAP cells compared to the negative control group (Figure 13C,D). These findings suggest that DEPDC1 is involved in enhancing the invasive ability of cancer cells.
2.6.4. The influence of siRNA interference and plasmid transfection overexpression of DEPDC1 transcription on cancer cell proliferation. After siRNA interference of DEPDC1, the proliferation rate of c643 and BCPAP cells decreased compared to the negative control group (Table 2). Conversely, plasmid transfection overexpression of DEPDC1 resulted in an increased proliferation rate of c643 and BCPAP cells compared to the negative control group (Table 2). These findings suggest the involvement of DEPDC1 in promoting the proliferation of cancer cells.

Table 1.
Proliferation rates of c643 and BCPAP cells after siRNA interference and plasmid overexpression of DEPDC1 compared to the negative control group.
Table 1.
Proliferation rates of c643 and BCPAP cells after siRNA interference and plasmid overexpression of DEPDC1 compared to the negative control group.
| siRNA interference of DEPDC1 | Plasmid over expression of DEPDC1 | |||
| c643 | BCPAP | c643 | BCPAP | |
| 0h | 100.5% | 98.3% | 101.2% | 102.8% |
| 4h | 69.4% | 74.1% | 111.2% | 108.7% |
| 24h | 12.8% | 23.5% | 125.1% | 115.3% |
| 48h | 23.7% | 30.4% | 152.6% | 138.9% |
| 72h | 30.5% | 41.6% | 137.5% | 125.8% |
3. Discussion
Our study aimed to identify the key genes involved in the dedifferentiation process of thyroid cancer by analyzing differentially expressed genes in the GEO database. DEPDC1 was selected for validation using public database and experimental analysis. Through differential, WGCNA, and Cytoscape analyses, we identified 10 top-scoring key genes in ATC, with DEPDC1 showing a high prognostic value in thyroid cancer. Subsequent analysis and research revealed that DEPDC1 is highly expressed in thyroid cancer, and its expression increases with a lower degree of differentiation, such as in ATC. Furthermore, DEPDC1 expression was significantly negatively correlated with thyroid differentiation marker expression. Further cell experiments demonstrated that DEPDC1 promoted tumor cell migration, invasion, and proliferation.
ATC is the most aggressive form of thyroid cancer, and its origin has yet to be clearly determined. Previous studies have suggested that dedifferentiation of PTC is an important factor in ATC development [7,8]. Our study revealed that as one of the 10 key genes extracted from ATC differential genes, DEPDC1 showed a negative correlation with the degree of thyroid differentiation (Figure 3A) and thyroid markers (Figure 3B,D), providing additional evidence for the hypothesis that ATC originates from PTC. In addition, the expression of DEPDC1 in TC was significantly negatively correlated with the thyroid differentiation markers (TG, TPO, and TSHR) (Figure 4), suggesting its potential involvement in the dedifferentiation process of thyroid cancer. Meanwhile, it was discovered that DEPDC1 was also associated with the prognosis of PTC, indicating significant clinical relevance (Figure 5).
Although the exact origin of ATC remains unclear, its treatment remains a challenge. Traditional surgery, radiotherapy, and chemotherapy have limited efficacy, and radioactive iodine therapy is ineffective, leading to low rates of curative surgery and high mortality rates, with a 1-year survival rate of only approximately 10%, accounting for approximately 40-50% of thyroid cancer-related deaths[13,14]. New adjuvant radiotherapy/chemotherapy has resulted in R0/R1 surgery in only 13.2% of patients[15]. Therefore, the search for new drug targets has become urgent. Our study found that DEPDC1 was closely related to the immune microenvironment (Figure 8 and Figure 9), providing a theoretical basis for immunotherapy in patients with high DEPDC1 expression. Additionally, silencing DEPDC1 significantly reduced the migration, invasion, and proliferation of cancer cells (Figure 12 and Figure 13, Table 1). Thus, the development of new drugs targeting DEPDC1 holds promise in providing new treatment options for patients with ATC or other refractory thyroid cancers. In their study, Chuan Tian et al. revealed that the functional involvement of Linc-ROR-mediated DEPDC1 may contribute to progression and angiogenesis in hepatocellular carcinoma patients, suggesting a potential target for anticancer therapies[9].
However, our study has limitations and shortcomings. For example, although we identified DEPDC1 as a key gene by screening the GEO database and conducting related validation experiments, the detailed mechanisms of DEPDC1 in the occurrence and development of thyroid cancer have not yet been fully clarified. Therefore, future research should further explore the functions and signaling pathways of DEPDC1 to deepen our understanding of its role in thyroid cancer.
Materials and Methods
4.1. ATC-related Key Genes Selection
4.1.1. Integration of GEO data and case selection
The GSE33630 and GSE29265 datasets were merged, excluding cases caused by chernobyl nuclear radiation in GSE29265. To mitigate batch effects, the "sva" package in R was used for batch effect removal.
4.1.2. Preliminary screening of DEGs and pathway enrichment analysis
DEGs analysis was performed on normal and ATC samples using the "limma" package in R. The screening criteria were set as |logFoldChange|>1 and p.adjust<0.01.
4.1.3. Selection of key genes using WGCNA
WGCNA was used to select key genes from the DEGs. Raw gene expression data were preprocessed using the "preprocessCore" package in R, including steps such as standardization, batch effect correction, and gene filtering. This preprocessing step facilitated the construction and analysis of co-expression networks. The "WGCNA" package was used to construct a weighted gene co-expression network based on gene expression data. The network export threshold was set to 0.4. To ensure data integrity and accuracy, the "impute" package was used for imputation of missing values.
4.1.4. Key gene selection using cytoscape
The cytoHubba plugin in Cytoscape software was used to select key genes from the WGCNA results. The EPC calculation method was used to rank the candidate genes based on their correlation with the expression of other genes. The higher the ranking, the stronger the correlation with all other candidate genes. Finally, the top 10 genes were selected as the key genes.
4.2. Expression of DEPDC1 in Thyroid
4.2.1. Protein expression of DEPDC1 in PTC and FTC
Protein expression of DEPDC1 in PTC and FTC tissues was analyzed using THPA, a comprehensive database available at https://www.proteinatlas.org/. This database provides expression maps of over 24,000 human proteins across various normal and pathological tissues.
4.2.2. Expression of DEPDC1 and thyroid differentiation markers in TC of Different Differentiation Levels and Normal Thyroid Tissues, as well as Correlation Analysis
We conducted an analysis using the merged GSE33630 and GSE29265 datasets. The thyroid differentiation markers, TG, TPO, and TSHR, were selected for analysis. We examined the expression of DEPDC1, TG, TPO, and TSHR in normal thyroid tissues and TC at different differentiation levels, including differentiated PTC and undifferentiated ATC.
4.3. The Influence of DEPDC1 Expression Levels on Thyroid Cancer Prognosis
As datasets with ATC prognosis information are unavailable in GEO and TCGA, we performed prognostic assessment of PTC using TCGA database via the GIPEA 2 network (http://gepia2.cancer-pku.cn/#survival). The high and low expression groups were classified based on the optimal cutoff value. The analysis encompassed overall survival and disease-free survival.
4.4. Co-expression Analysis of DEPDC1 in ATC
We merged the datasets GSE33630 and GSE29265. The "limma" package was used for co-expression gene analysis of DEPDC1 in ATC with a screening criterion of P<0.001. The top six genes were positively correlated with DEPDC1 and the top five negatively correlated genes were selected. The "circlize" and "corrplot" packages in R were used to generate a co-expression circle plot. The selected co-expressed genes were further subjected to GO analysis using the DAVID website at https://david.ncifcrf.gov/tools.jsp, which includes the analysis of biological processes, cellular components, and molecular functions. The results were visualized using the ggplot2 package in R, with a screening criterion of FDR<0.001 for the top 10 pathways.
4.5. The Relationship Between DEPDC1 Expression and TC Immune Infiltration
4.5.1. Combined the GSE33630 and GSE29265 datasets, we extracted gene expression data in TC, including PTC, and ATC. The TME score (TMEscore) was generated using the "estimate" package in R language, differential analysis was performed using the "limma" package, and visualization was done using the "reshape2" and "ggpubr" packages. The "CIBERSORT" package in R language was used to generate immune infiltration scores for the merged GEO dataset, and functions from the "imma" package were utilized for sample grouping, data transformation, and differential analysis. Data visualization was carried out using the "reshape2," "ggpubr," "vioplot," and "ggExtra" packages.
4.5.2. The relationship between DEPDC1 expression and immune cell infiltration in TC was analyzed using TIMER2.0 online tool at https://cistrome.shinyapps.io/timer/.
4.6. Effects of DEPDC1 expression reduction and overexpression on migration, invasion, and proliferation of thyroid cancer cells
4.6.1. Cell culture and reagents. Human anaplastic thyroid cancer cell line c643 and poorly differentiated papillary thyroid cancer cell line BCPAP were commercially obtained from Procell Life Science&Technology Co.,Ltd. The identity of these cell lines was authenticated by short tandem repeat (STR) DNA analysis by the supplier prior to shipment. Cells were cultured in RPMI 1640 medium supplemented with 10% fetal bovine serum, streptomycin (100 mg/mL), and penicillin (100 U/mL), and maintained at 37°C in a humidified incubator with 5% CO2 atmosphere.
4.6.2. DEPDC1 knockdown and overexpression. siRNA interference was employed for DEPDC1 knockdown, and plasmid overexpression system was used for DEPDC1 overexpression. Lipocat2000C (cat.no.AQ11669) was purchased from Beijing Aoqing Biotechnology Co. Ltd. One Step Competent Cell Preparation Kit (cat.no.D0301) and Plasmid Midi Preparation Kit for All Purpose (cat.no.D0020) were purchased from Beyotime Biotechnology. The siRNA used in this study was chemically synthesized and provided by Shanghai GenePharma. The sequence of negative control siRNA (si-NC) was 5'-UUCUCCGAACGUGUCACGUTT-3' (sense strand) and 5'-ACGUGACACGUUCGGAGAATT-3' (antisense strand), and the sequence of DEPDC1 siRNA (si-DEPDC1) was 5'-GGAAGAUGUUGAAGAAGUUTT-3' (sense strand) and 5'-AACUUCUUCAACAUCUUCCTT-3' (antisense strand). Plasmid-OE for DEPDC1 overexpression and Plasmid-NC as negative control were constructed by Miaoling Biological Company (see Supplementary Material 1, 2) and transformed and replicated in DH5α competent cells using the One Step Competent Cell Preparation Kit and Plasmid Midi Preparation Kit for All Purpose, respectively. siRNA and plasmid transfection were performed following the manufacturer's instructions using Lipocat2000C transfection reagent for transient transfection. Total RNA was collected and q-PCR was performed 48 hours after transfection. Each experiment was repeated three times for result validation.
4.6.3. RNA Isolation and Quantitative Real-time PCR Analysis. Total RNA was prepared using the RNAeasy™ Animal RNA Isolation Kit with Spin Column (Beyotime Biotechnology) according to the manufacturer's instructions. The reverse transcription of 500ng total RNA was performed using random primers and the One Step TB Green® PrimeScript™ RT-PCR Kit (cat.no.RR066A, Takara) as specified by the manufacturer. The resulting cDNA was subjected to reverse transcription and q-PCR amplification using the StepOnePlus system (Applied Biosystems) and BeyoFast™ SYBR Green qPCR Mix (2X) (cat.no.D7260-5ml, Beyotime Biotechnology) according to the manufacturer's instructions. The relative expression levels of the target gene compared to the reference gene (GAPDH) were calculated using the 2−ΔΔCt method. Each experiment was performed in triplicate to validate the results. Statistical analysis was conducted using Student's t-test. The primer sequences used in this study were as follows: DEPDC1 Forward 5'- CTCGTAGAACTCCTAAAAGGCA-3', Reverse 5'-TCAACATCTTCCTGGCTTAGTT-3'; GAPDH Forward, 5'-GCACCGTCAAGGCTGAGAAC-3'; Reverse, 5'-TGGTGAAGACGCCAGTGGA-3'. All primers were synthesized by Sangon Biotech.
4.6.4. Wound healing assay. 2×10⁵ cells in logarithmic growth phase were individually seeded into each well of a six-well plate. When the cell density reached approximately 80%, transfections for siRNA knockdown and plasmid overexpression were conducted using Lipocat2000C as directed by the manufacturer's instructions. After allowing the cells to fully cover the well and incubating for at least 6 hours, a straight line was made at the center of each well using the tip of a 200 μl pipette, followed by a change of serum-free culture medium. The cells were then further cultured for 24 hours. Images were captured at 0 hours (0h) and 24 hours (24h) after creating the scratch. Each experiment was repeated three times to validate the results.
4.6.5. Transwell cell invasion assay. The invasion activity of the cells was assessed using 24-well Transwell chambers (cat.no.3422; Corning Costar Corp.) and Matrix-Gel™ Basement Membrane Matrix (cat.no.C0372-1ml; Beyotime Biotechnology). According to the manufacturer's instructions, a layer of Matrix was coated on the upper chamber of the Transwell. After 48 hours of siRNA knockdown and plasmid overexpression, 2×10⁴ treated cells were resuspended in 200 μl serum-free culture medium and then seeded into the upper chamber of the Transwell. In the lower chamber of the Transwell, 500 μl of complete culture medium containing 10% fetal bovine serum was added. After incubating for 24 hours, the remaining cells in the inner surface of upper chamber of the Transwell were removed. The cells on the bottom surface of the upper chamber were fixed with 4% paraformaldehyde at room temperature for 30 minutes and then stained with 0.1% crystal violet for 15 minutes. Images of the samples were captured and recorded. Each experiment was repeated three times to validate the results.
4.6.6. Cell proliferation experiment. The Enhanced Cell Counting Kit-8 (CCK-8) (cat.no.C0041, Beyotime Biotechnology) was utilized to experimentally assess cell proliferation. After a 6-hour treatment with DEPDC1 siRNA, overexpression plasmid, and their corresponding negative controls, cells were harvested and re-digested. Subsequently, 1×10⁴ cells per well were seeded in a 96-well plate. At 0, 4, 24, 48, and 72 hours post-seeding, each well was supplemented with 10μL of CCK8 solution, followed by further incubation at 37°C for 2 hours. Absorbance at 450nm was then measured using an enzyme-linked immunosorbent assay (ELISA) reader. Each experiment was conducted three times to validate the results.
5. Conclusions
In summary, our study identified DEPDC1 as a novel biomarker for the dedifferentiation of thyroid cancer through analysis of public databases and experimental validation. It was found that DEPDC1 promotes the migration, invasion, and proliferation of tumor cells. Additionally, high expression of DEPDC1 is associated with the prognosis and immune infiltration of patients with thyroid cancer. However, further research is needed to investigate the detailed mechanisms of DEPDC1 in the occurrence and development of thyroid cancer, as well as the development and validation of potential therapeutic strategies.
Supplementary Materials
The following supporting information can be downloaded at the website of this paper posted on Preprints.org, Supplementary Material 1; Supplementary Material 2; Supplementary Material 3; Supplementary Material 4.
Author Contributions
Conceptualization, W.L.; methodology, H.T.; software, H.T; validation, H.H.; formal analysis, H.H.; investigation, W.L.; resources, W.L.; data curation, H.H.; writing—review and editing, W.L.; writing—original draft, H.T.; visualization, L.W.; supervision, H.Y.; project administration, J.Q.; funding acquisition, W.L.. All authors have read and agreed to the published version of the manuscript.
Funding
This research was funded by National Cancer Center/National Clinical Research Center for Cancer/Cancer Hospital, Chinese Academy of Medical Sciences and Peking Union Medical College, Beijing, 100021, China, grant number no. 2020-I2M-C&T-B-070.
Institutional Review Board Statement
Not applicable.
Informed Consent Statement
Not applicable.
Data Availability Statement
Publicly available datasets were analyzed in this study. This data can be found here: https://www.ncbi.nlm.nih.gov/gene/; https://www.proteinatlas.org/; http://gepia2.cancer-pku.cn/#survival; https://david.ncifcrf.gov/tools.jsp; https://cistrome.shinyapps.io/timer/.
Conflicts of Interest
The authors declare no conflict of interest.
References
- Siegel, R.L.; Miller, K.D.; Jemal, A. Cancer statistics, 2020. CA Cancer J Clin 2020, 70, 7–30. [Google Scholar] [CrossRef] [PubMed]
- Sung, H.; Ferlay, J.; Siegel, R.L.; et al. Global Cancer Statistics 2020: GLOBOCAN Estimates of Incidence and Mortality Worldwide for 36 Cancers in 185 Countries. CA Cancer J Clin 2021, 71, 209–249. [Google Scholar] [CrossRef] [PubMed]
- Fagin, J.A.; Wells, S.J. Biologic and Clinical Perspectives on Thyroid Cancer. N Engl J Med 2016, 375, 1054–1067. [Google Scholar] [CrossRef] [PubMed]
- Molinaro, E.; Romei, C.; Biagini, A.; et al. Anaplastic thyroid carcinoma: from clinicopathology to genetics and advanced therapies. Nat Rev Endocrinol 2017, 13, 644–660. [Google Scholar] [CrossRef] [PubMed]
- Fallahi, P.; Ferrari, S.M.; Galdiero, M.R.; et al. Molecular targets of tyrosine kinase inhibitors in thyroid cancer. Semin Cancer Biol 2022, 79, 180–196. [Google Scholar] [CrossRef] [PubMed]
- Boumahdi, S.; de Sauvage, F.J. The great escape: tumour cell plasticity in resistance to targeted therapy. Nat Rev Drug Discov 2020, 19, 39–56. [Google Scholar] [CrossRef] [PubMed]
- Luo, H.; Xia, X.; Kim, G.D.; et al. Characterizing dedifferentiation of thyroid cancer by integrated analysis. Sci Adv 2021, 7. [Google Scholar] [CrossRef] [PubMed]
- Lu, L.; Wang, J.R.; Henderson, Y.C.; et al. Anaplastic transformation in thyroid cancer revealed by single-cell transcriptomics. J Clin Invest 2023, 133. [Google Scholar] [CrossRef] [PubMed]
- Tian, C.; Abudoureyimu, M.; Lin, X.; et al. Linc-ROR facilitates progression and angiogenesis of hepatocellular carcinoma by modulating DEPDC1 expression. Cell Death Dis 2021, 12, 1047. [Google Scholar] [CrossRef]
- Sharen, G.; Li, X.; Sun, J.; et al. Silencing eL31 suppresses the progression of colorectal cancer via targeting DEPDC1. J Transl Med 2022, 20, 493. [Google Scholar] [CrossRef] [PubMed]
- Huang, G.; Chen, S.; Washio, J.; et al. Glycolysis-Related Gene Analyses Indicate That DEPDC1 Promotes the Malignant Progression of Oral Squamous Cell Carcinoma via the WNT/beta-Catenin Signaling Pathway. Int J Mol Sci 2023, 24. [Google Scholar]
- Qiu, J.; Tang, Y.; Liu, L.; et al. FOXM1 is regulated by DEPDC1 to facilitate development and metastasis of oral squamous cell carcinoma. Front Oncol 2022, 12, 815998. [Google Scholar] [CrossRef] [PubMed]
- Saini, S.; Tulla, K.; Maker, A.V.; et al. Therapeutic advances in anaplastic thyroid cancer: a current perspective. Mol Cancer 2018, 17, 154. [Google Scholar] [CrossRef] [PubMed]
- Glaser, S.M.; Mandish, S.F.; Gill, B.S.; et al. Anaplastic thyroid cancer: Prognostic factors, patterns of care, and overall survival. Head Neck 2016, 38 (Suppl. S1), E2083–E2090. [Google Scholar] [CrossRef] [PubMed]
- Besic, N.; Auersperg, M.; Us-Krasovec, M.; et al. Effect of primary treatment on survival in anaplastic thyroid carcinoma. Eur J Surg Oncol 2001, 27, 260–264. [Google Scholar] [CrossRef] [PubMed]
Figure 1.
Co-expression network of key ATC genes, with higher co-expression scores indicated by a darker shade of red.
Figure 1.
Co-expression network of key ATC genes, with higher co-expression scores indicated by a darker shade of red.
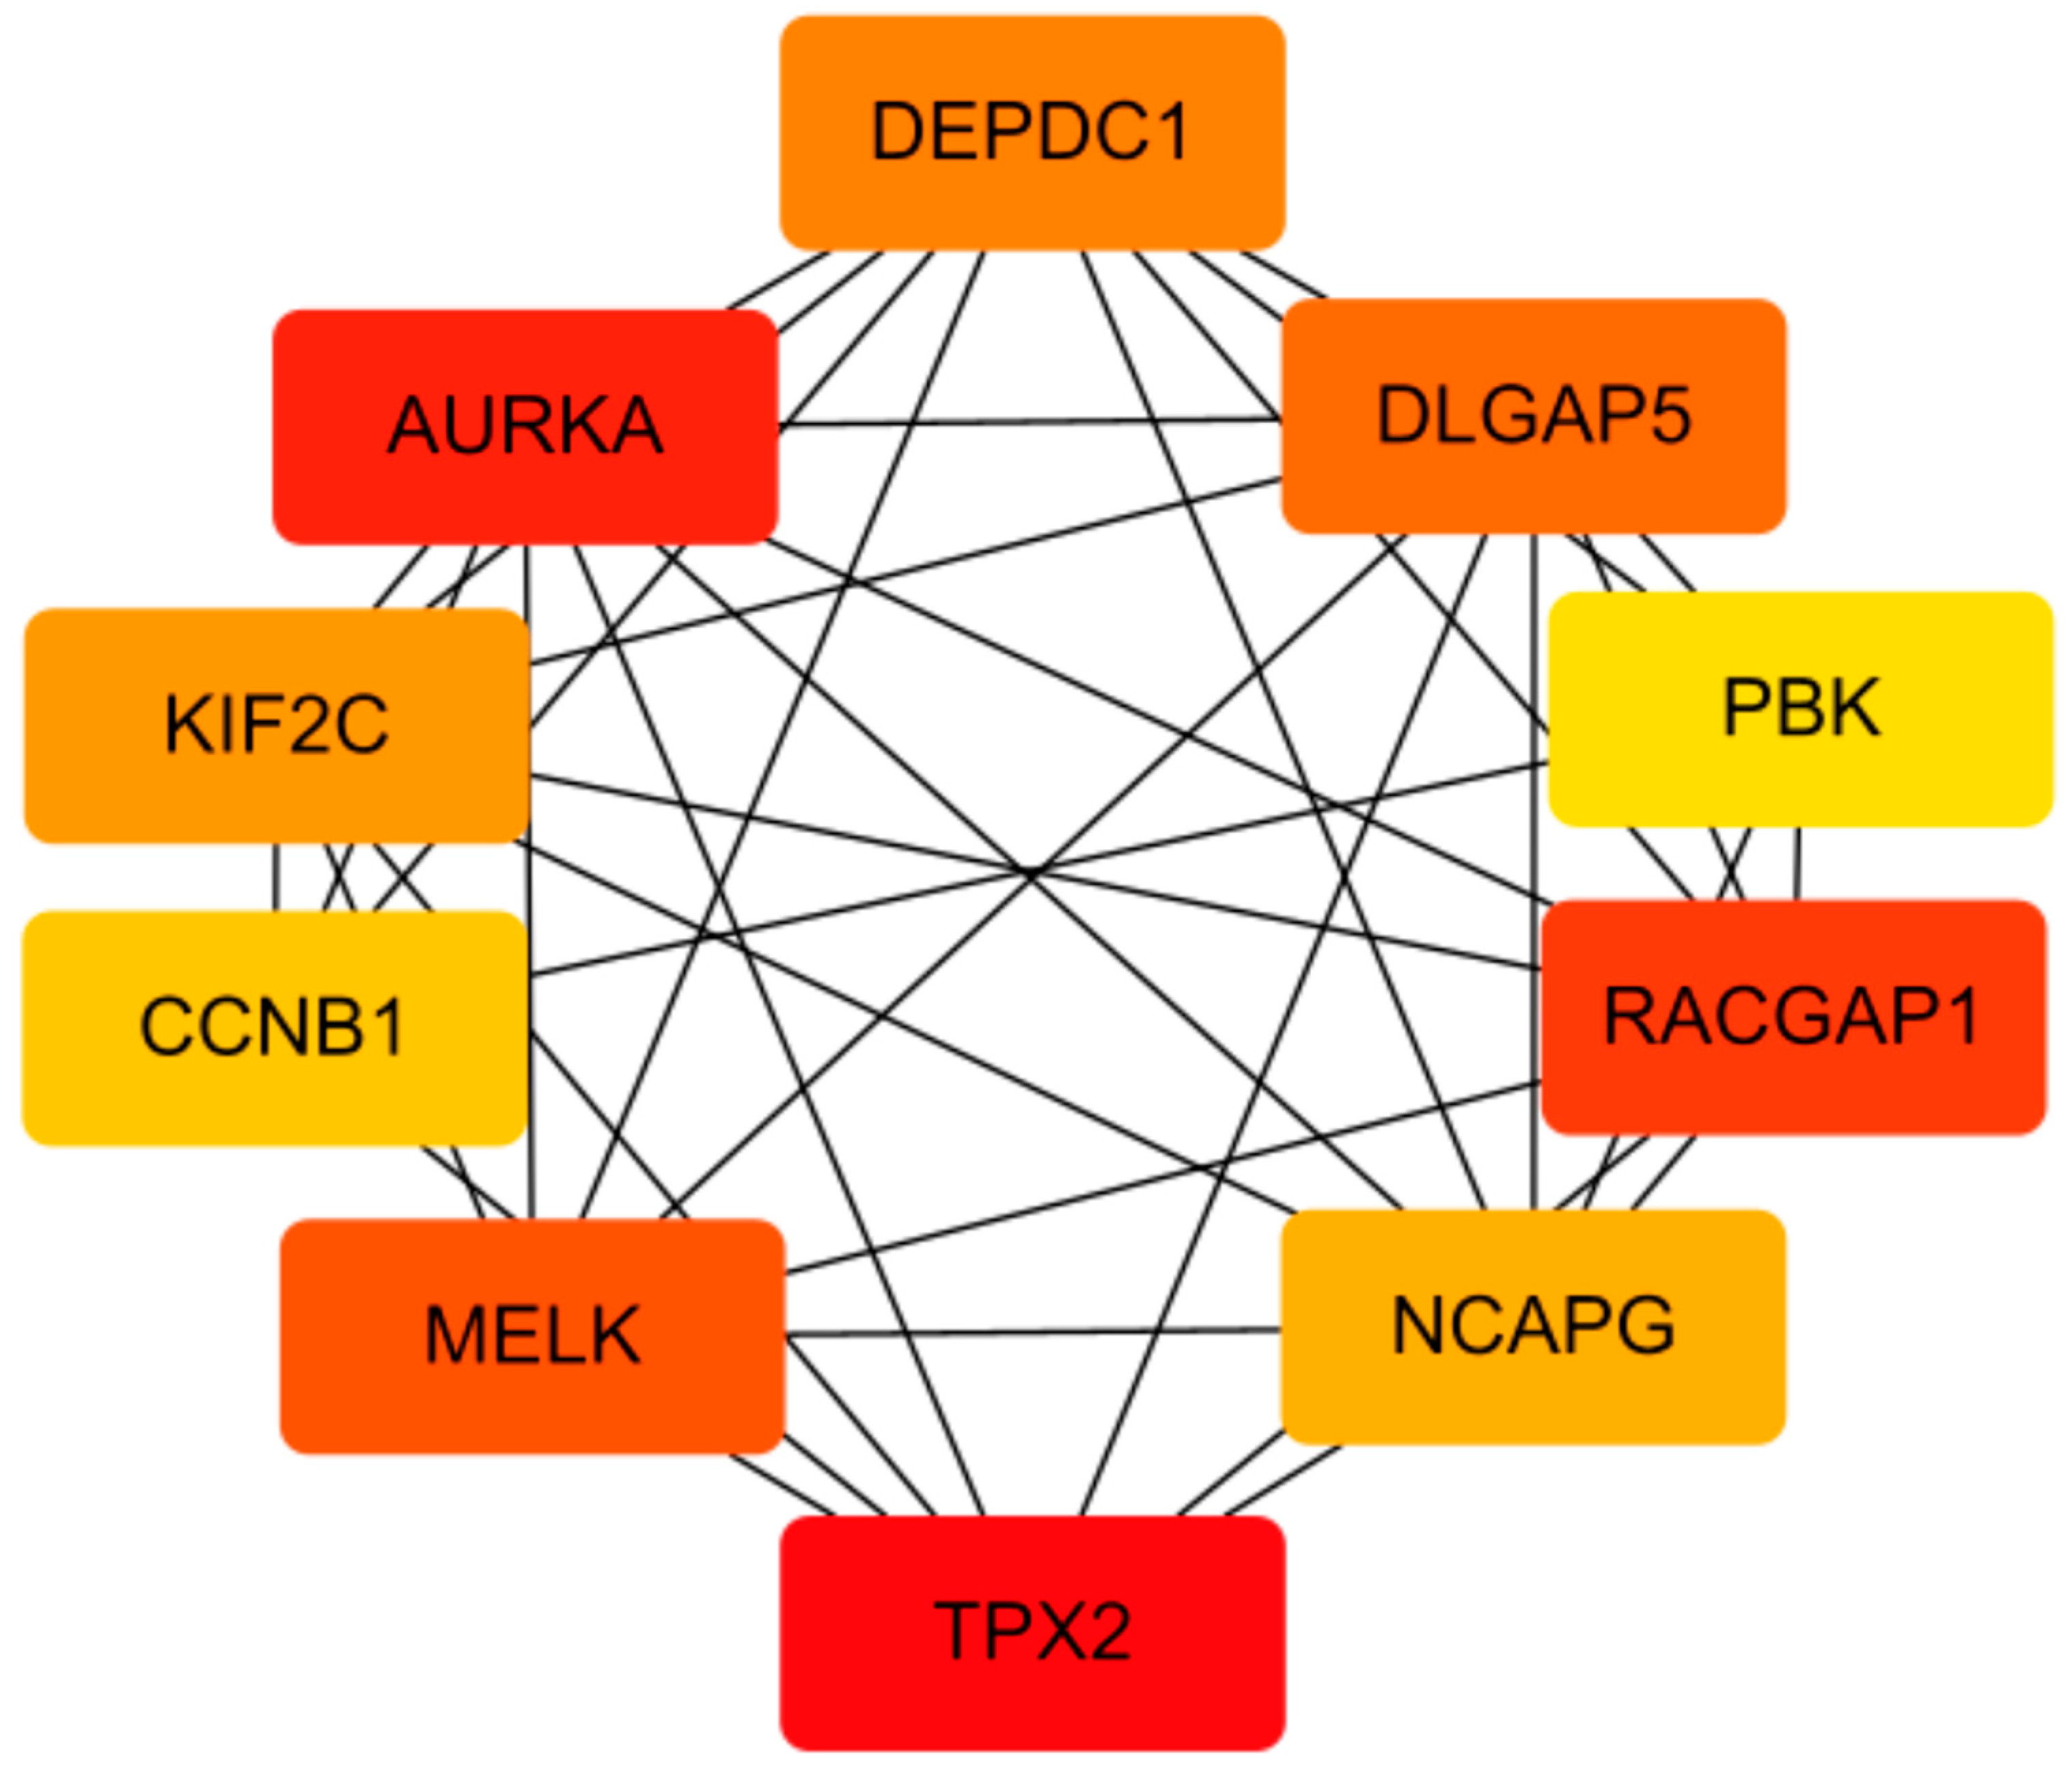
Figure 2.
Expression of DEPDC1 in TC tissues in THPA database. A: PTC. B: follicular thyroid carcinoma (FTC).
Figure 2.
Expression of DEPDC1 in TC tissues in THPA database. A: PTC. B: follicular thyroid carcinoma (FTC).
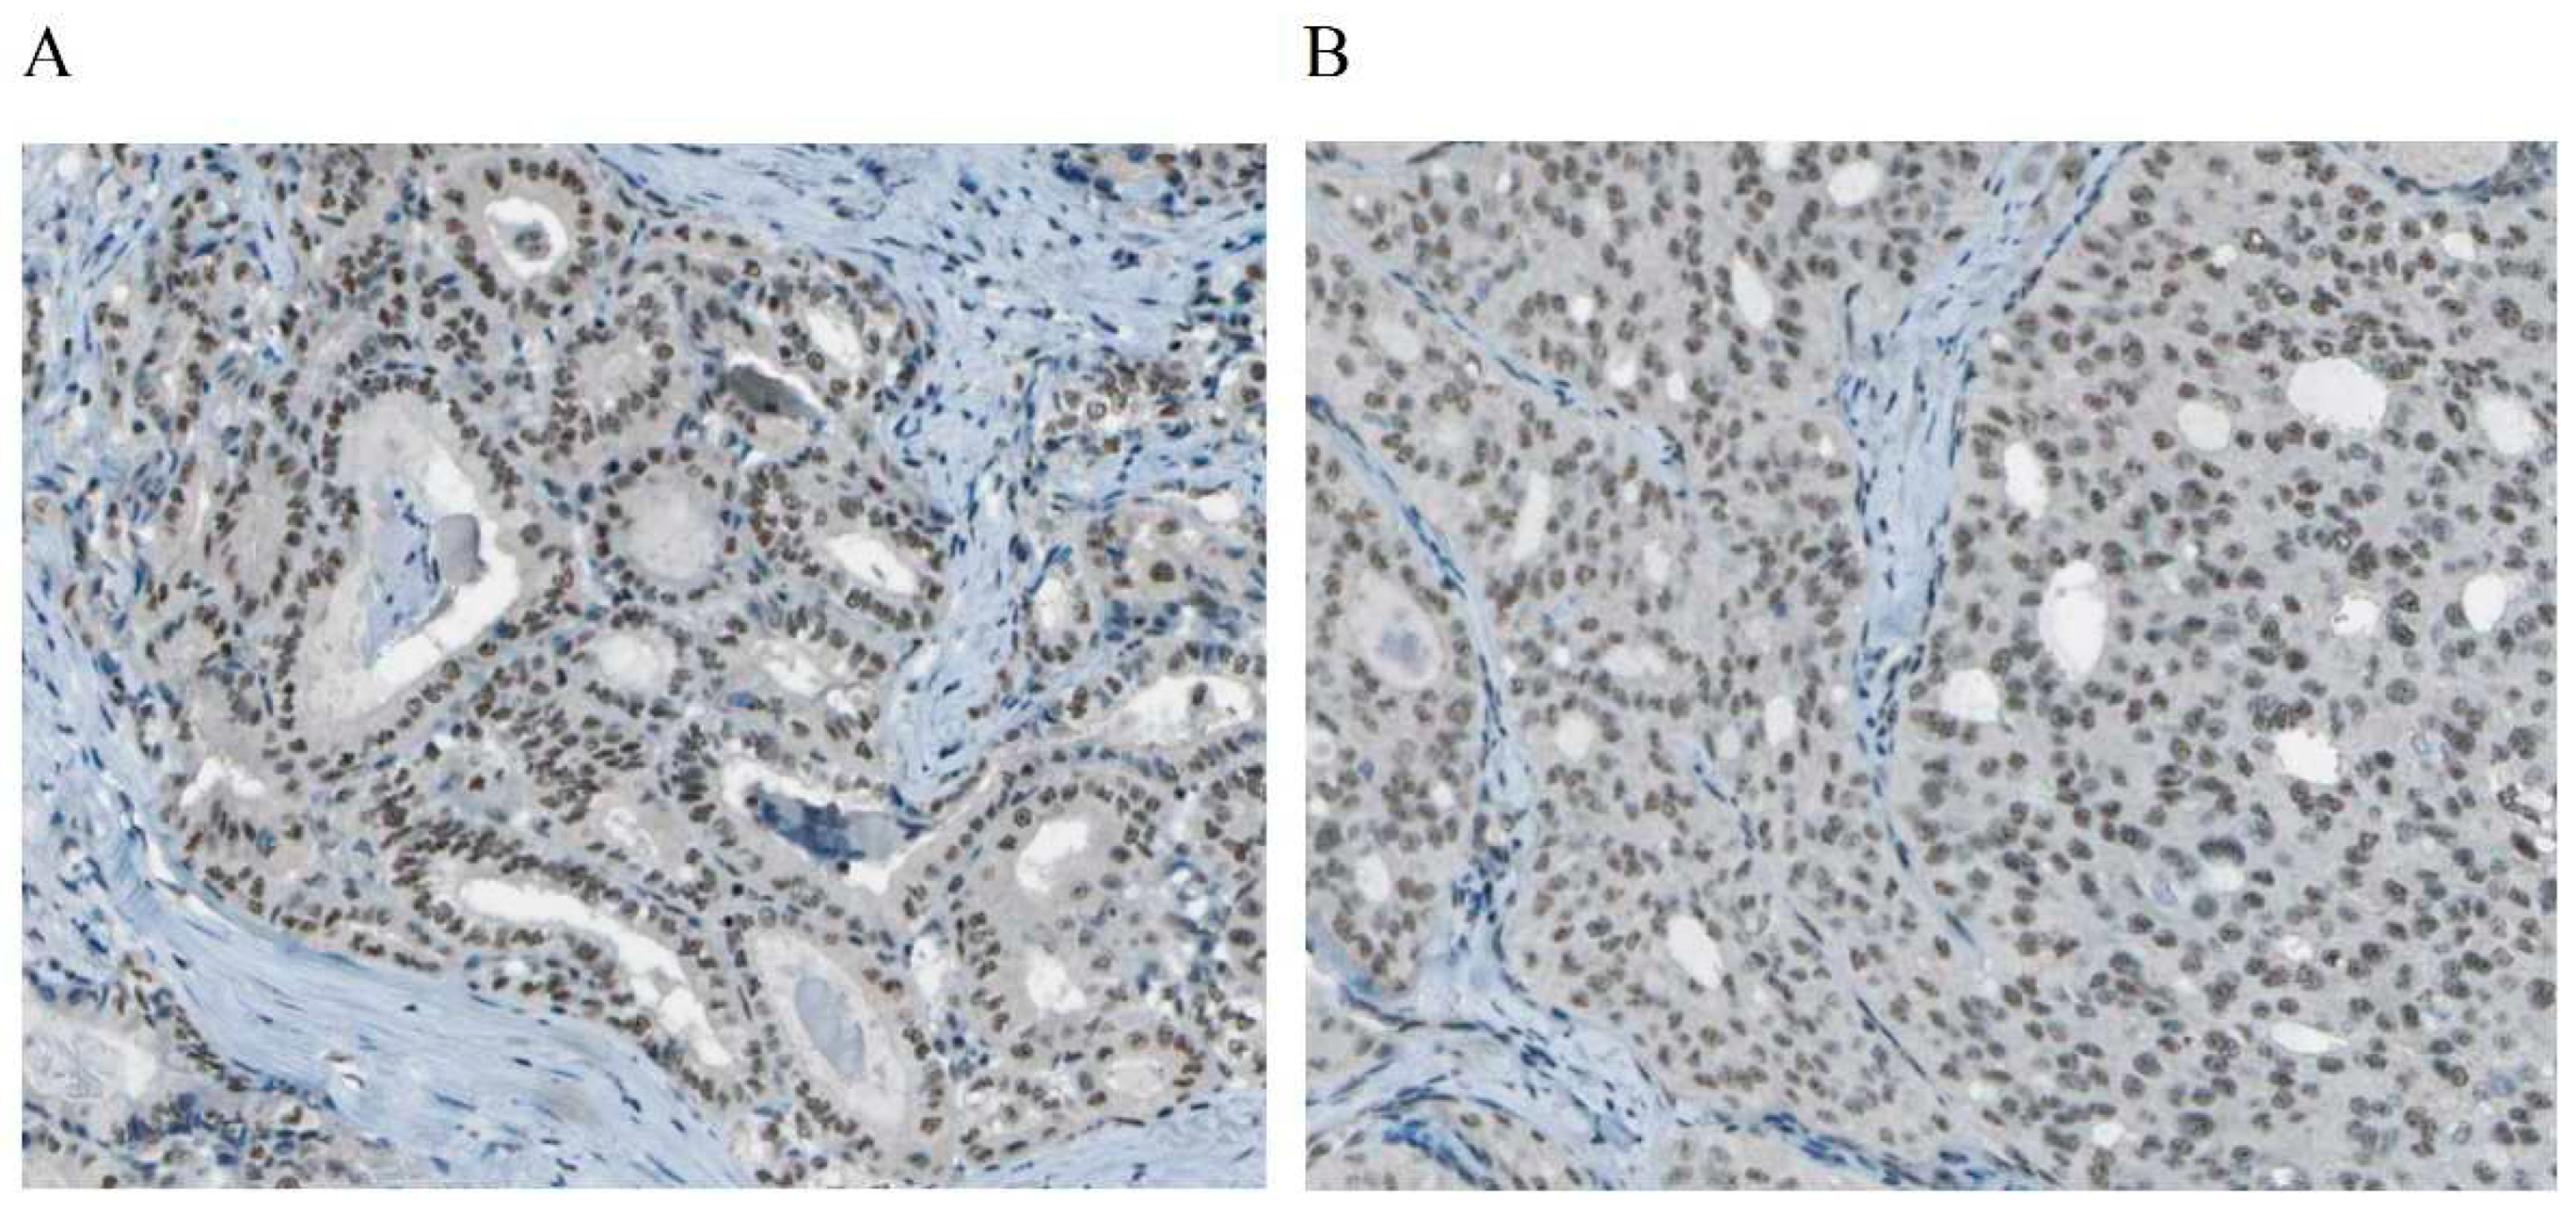
Figure 3.
Expression of DEPDC1 and thyroid differentiation markers in normal and TC tissues. A: DEPDC1. B: TSHR. C: TG. D: TPO.
Figure 3.
Expression of DEPDC1 and thyroid differentiation markers in normal and TC tissues. A: DEPDC1. B: TSHR. C: TG. D: TPO.
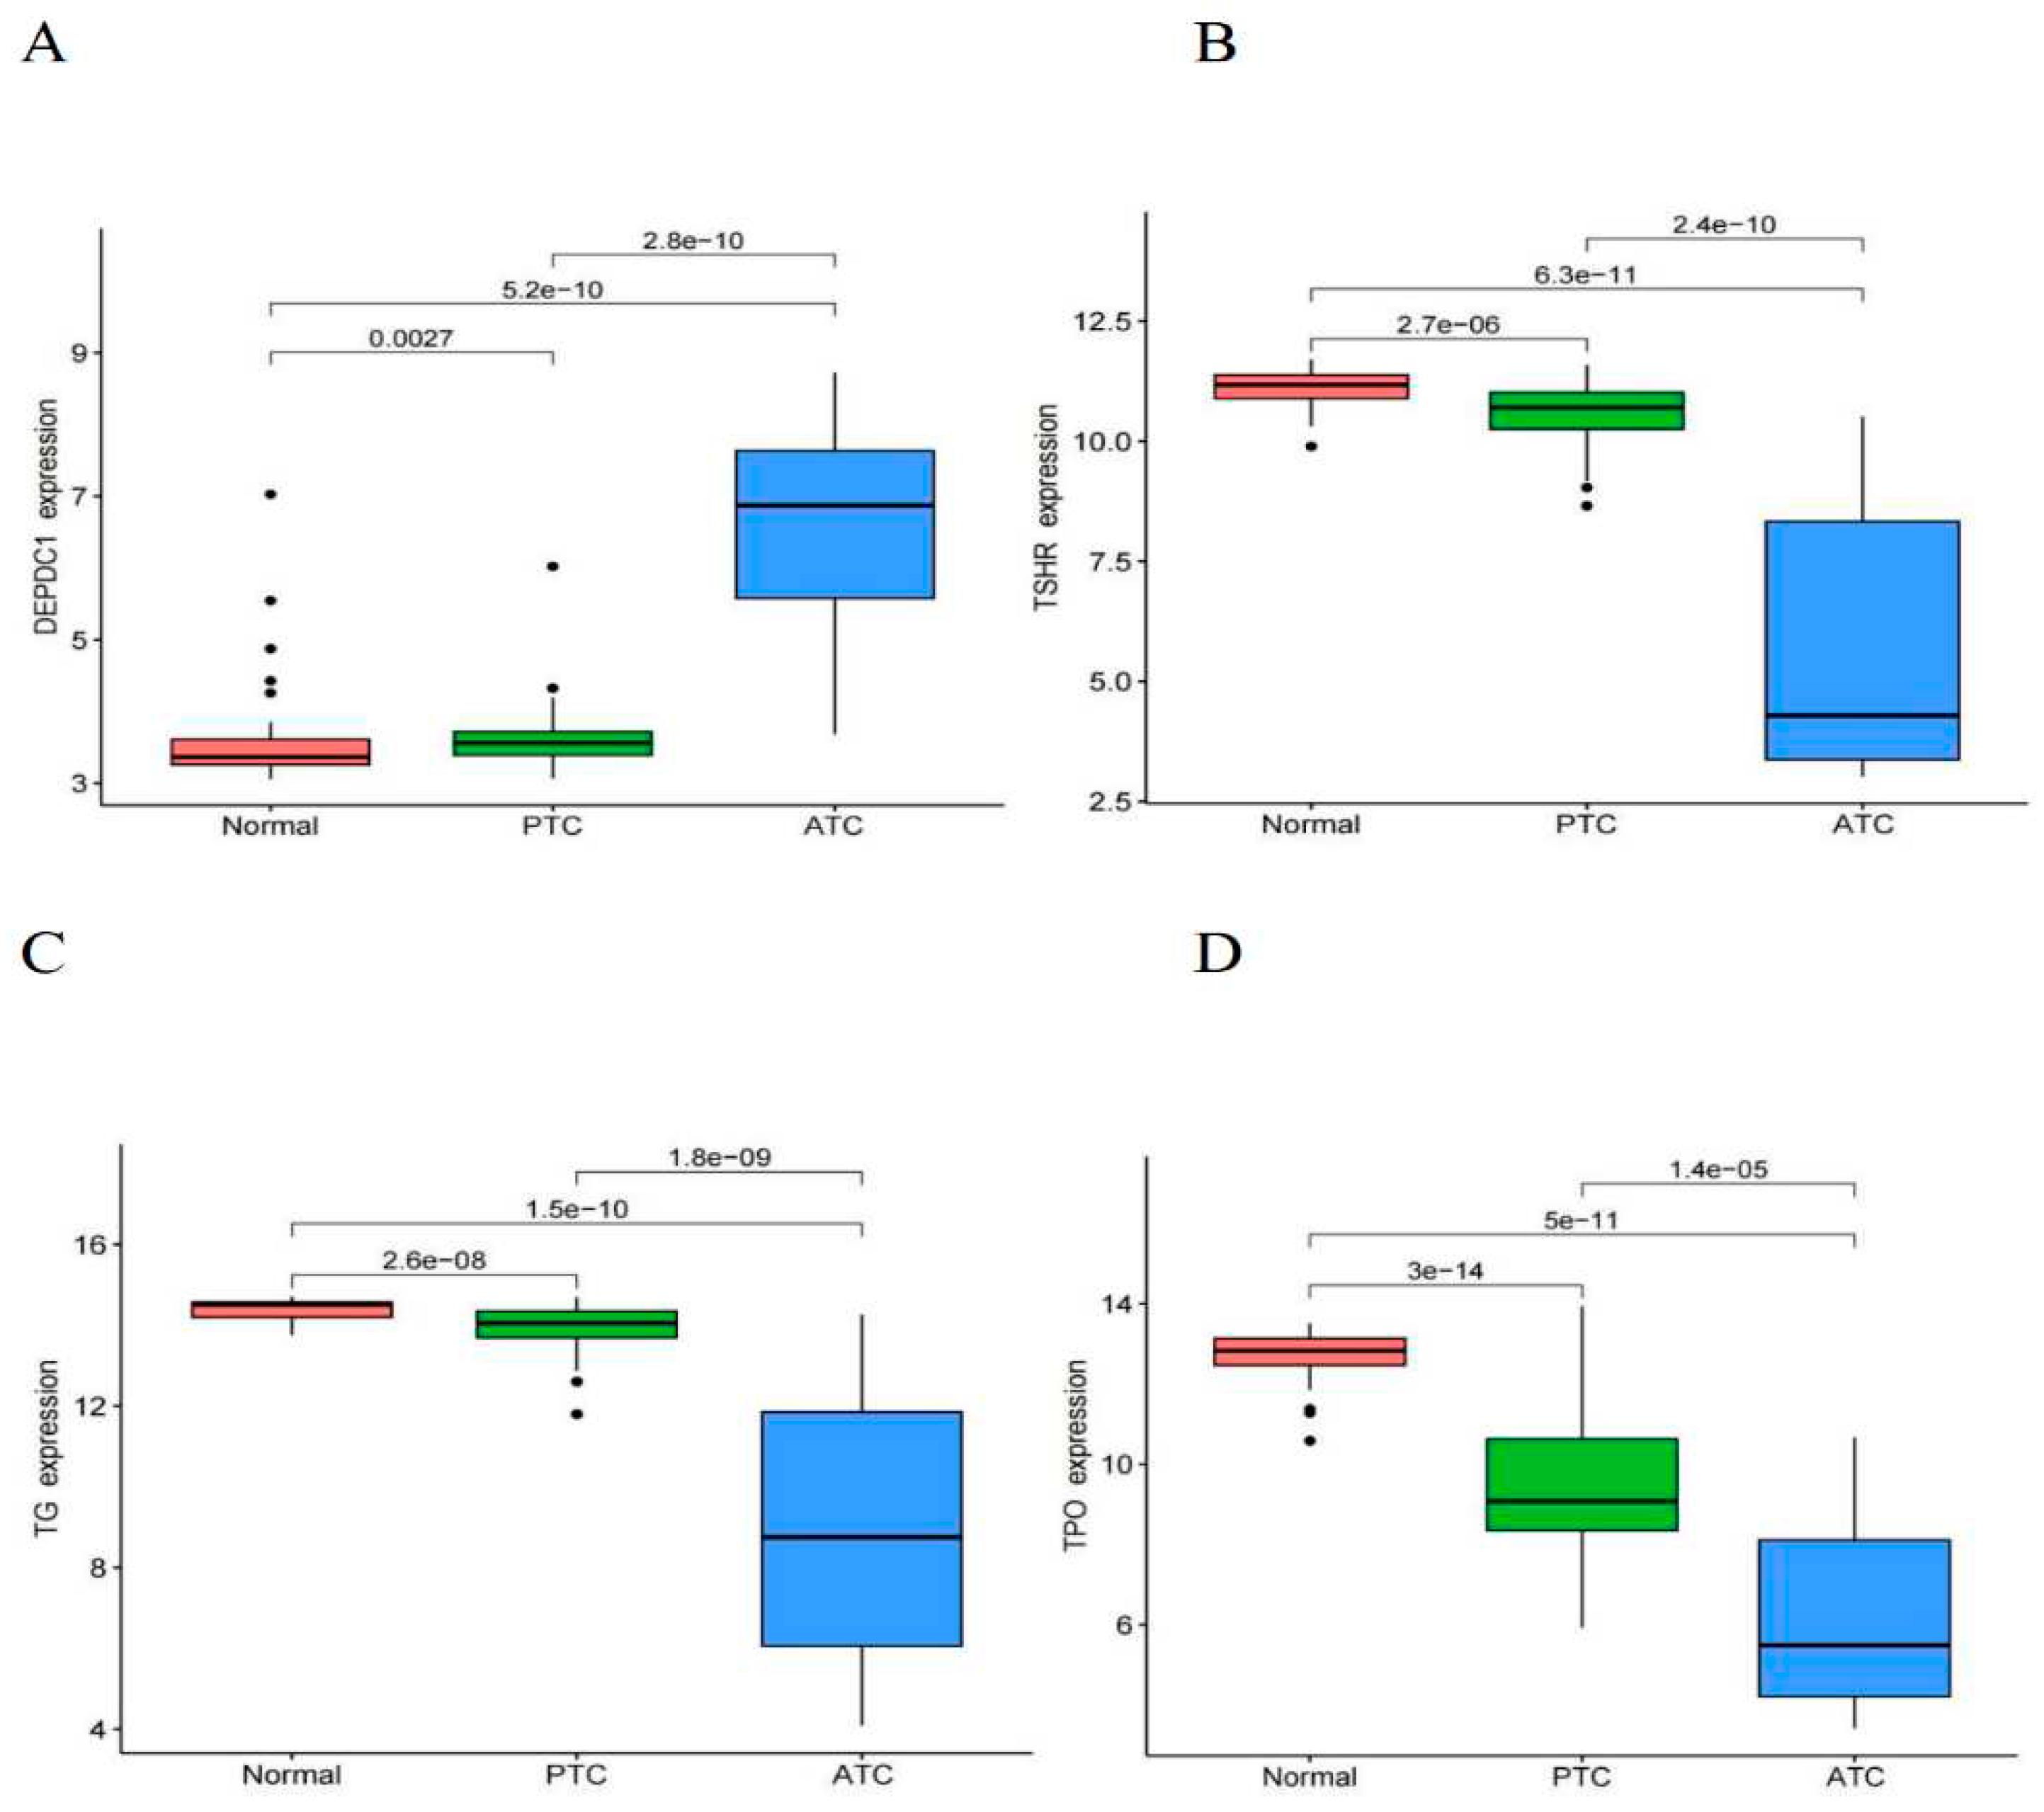
Figure 4.
Correlations of DEPDC1 gene expression with TG, TSHR, and TPO in thyroid tissues (including normal thyroid tissue, PTC and ATC). A: The correlation coefficient between DEPDC1 and TSHR expression was -0.8. B: The correlation coefficient between DEPDC1 and TG expression was -0.78. C: The correlation coefficient between DEPDC1 and TPO expression was -0.72. All correlations demonstrated statistical significance (P<0.001).
Figure 4.
Correlations of DEPDC1 gene expression with TG, TSHR, and TPO in thyroid tissues (including normal thyroid tissue, PTC and ATC). A: The correlation coefficient between DEPDC1 and TSHR expression was -0.8. B: The correlation coefficient between DEPDC1 and TG expression was -0.78. C: The correlation coefficient between DEPDC1 and TPO expression was -0.72. All correlations demonstrated statistical significance (P<0.001).
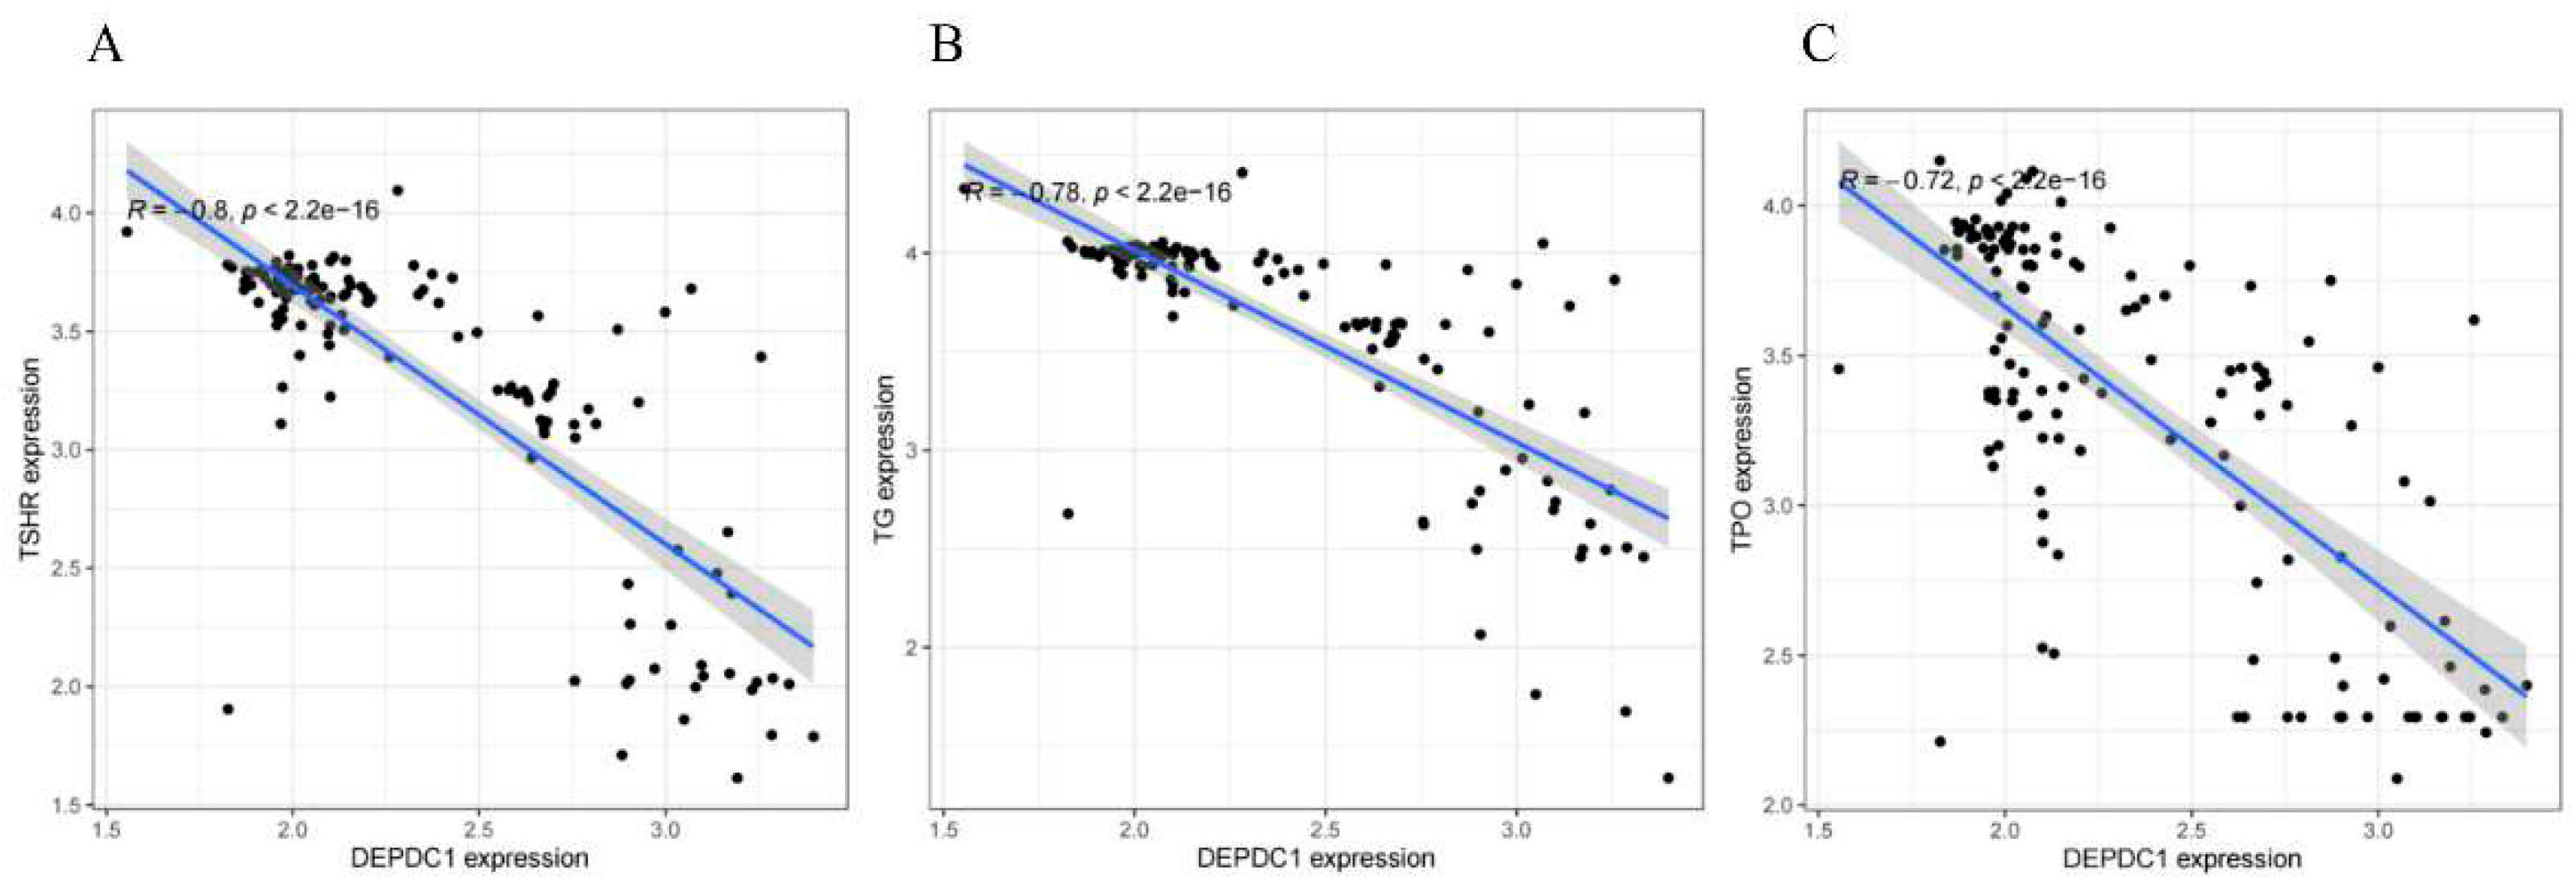
Figure 5.
The Influence of DEPDC1 Expression Levels on Thyroid Cancer Prognosis. A: OS. B: DFS.
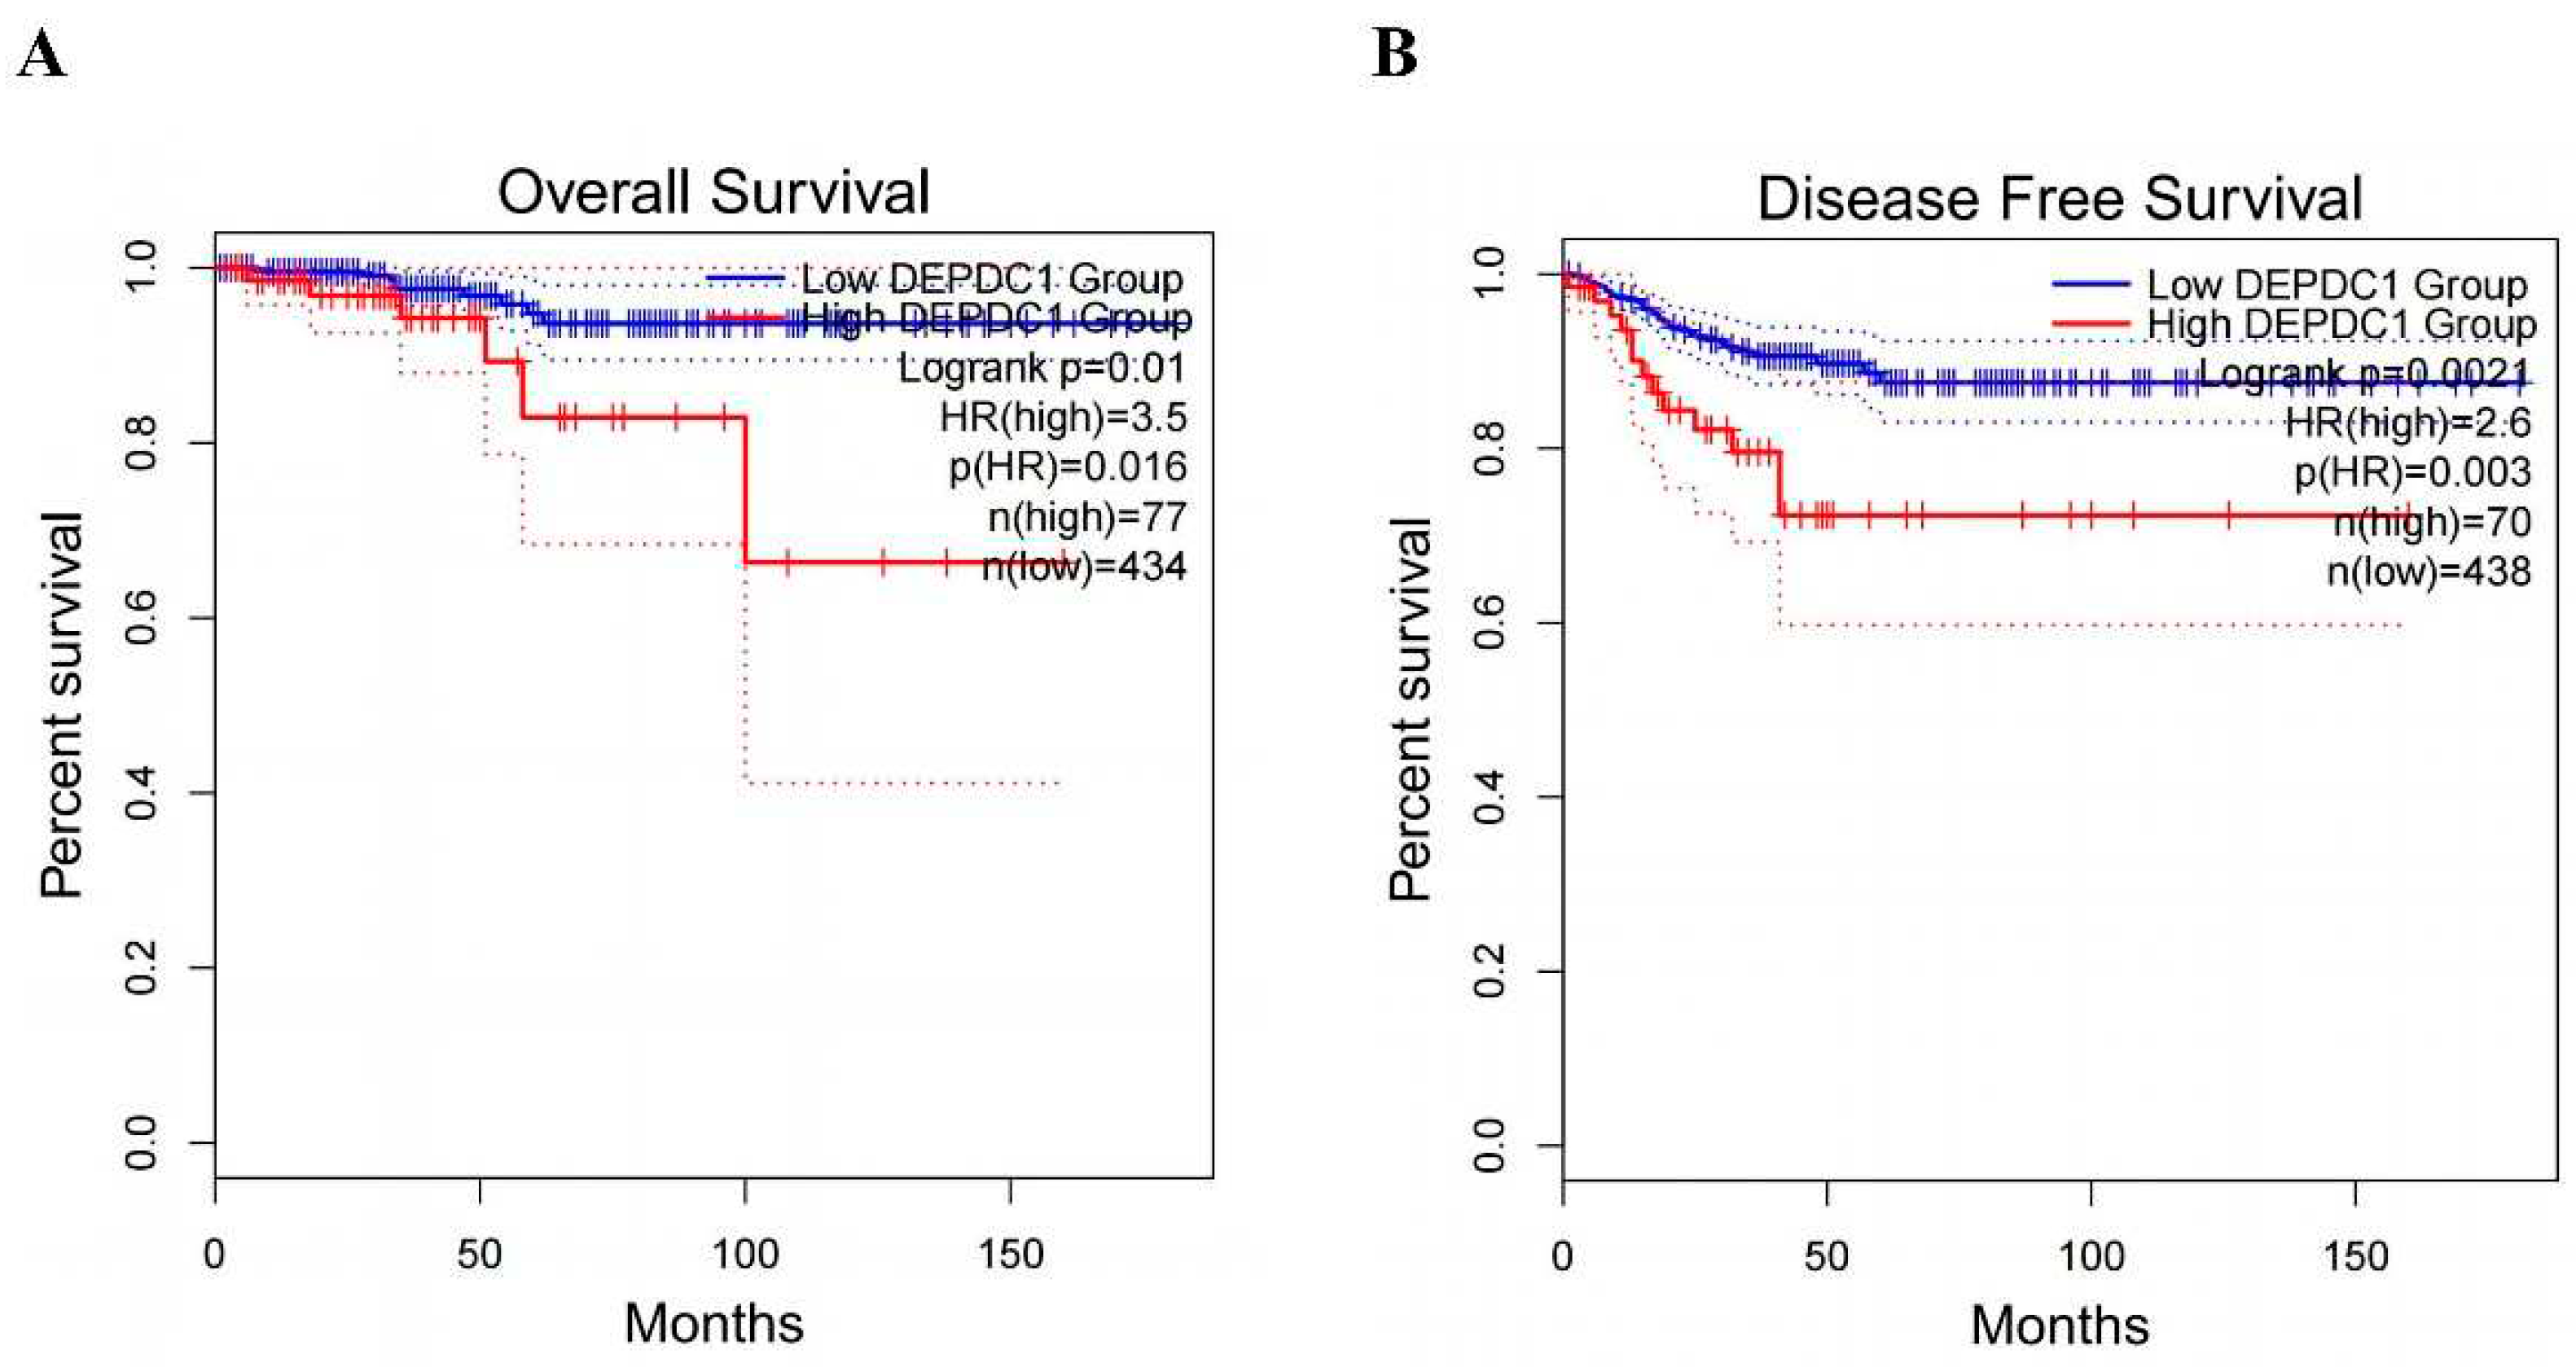
Figure 6.
Co-expression gene network of DEPDC1 in ATC. Data source: GEO database. The rectangular plot on the right represents the correlation with DEPDC1 expression, with red indicating positive correlation and green indicating negative correlation.
Figure 6.
Co-expression gene network of DEPDC1 in ATC. Data source: GEO database. The rectangular plot on the right represents the correlation with DEPDC1 expression, with red indicating positive correlation and green indicating negative correlation.
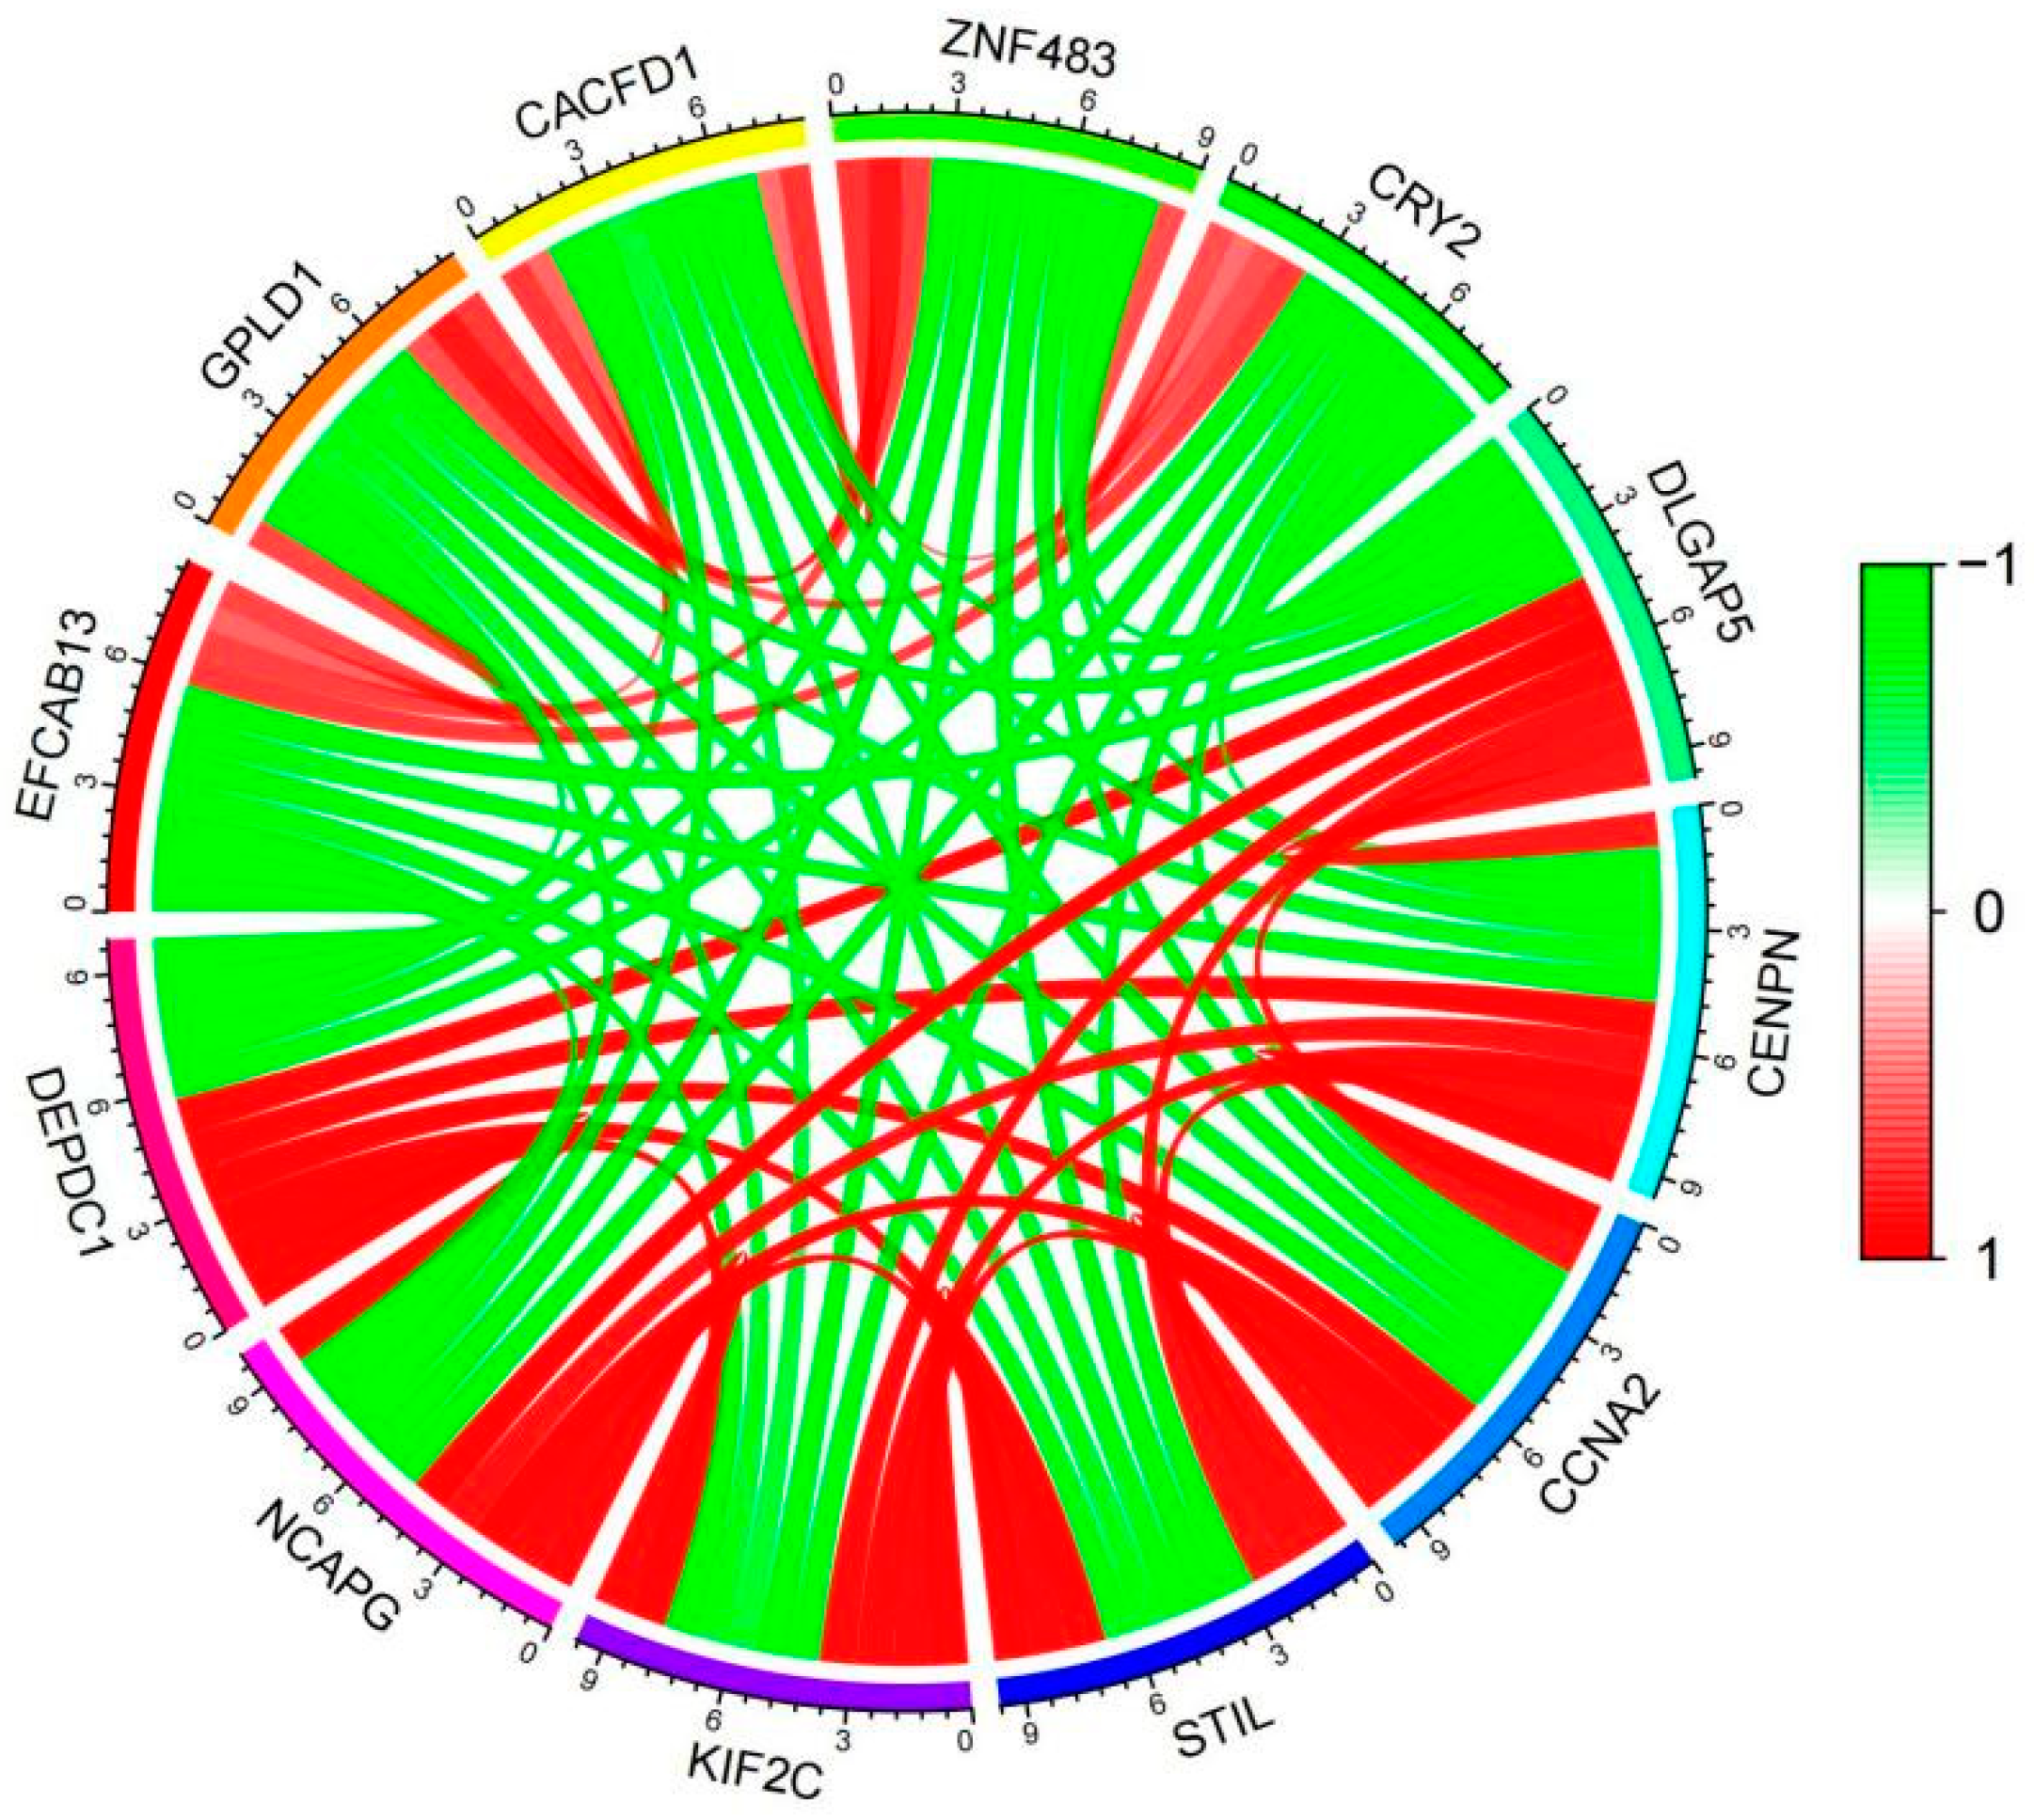
Figure 7.
Enrichment pathway analysis by DAVID GO. A: Analysis of Biological Processes. B: Analysis of Cellular Components. C: Analysis of Molecular Functions. The rectangular plots on the right represent the correlation between DEPDC1 expression and these pathways, with red indicating positive correlation and blue indicating negative correlation.
Figure 7.
Enrichment pathway analysis by DAVID GO. A: Analysis of Biological Processes. B: Analysis of Cellular Components. C: Analysis of Molecular Functions. The rectangular plots on the right represent the correlation between DEPDC1 expression and these pathways, with red indicating positive correlation and blue indicating negative correlation.
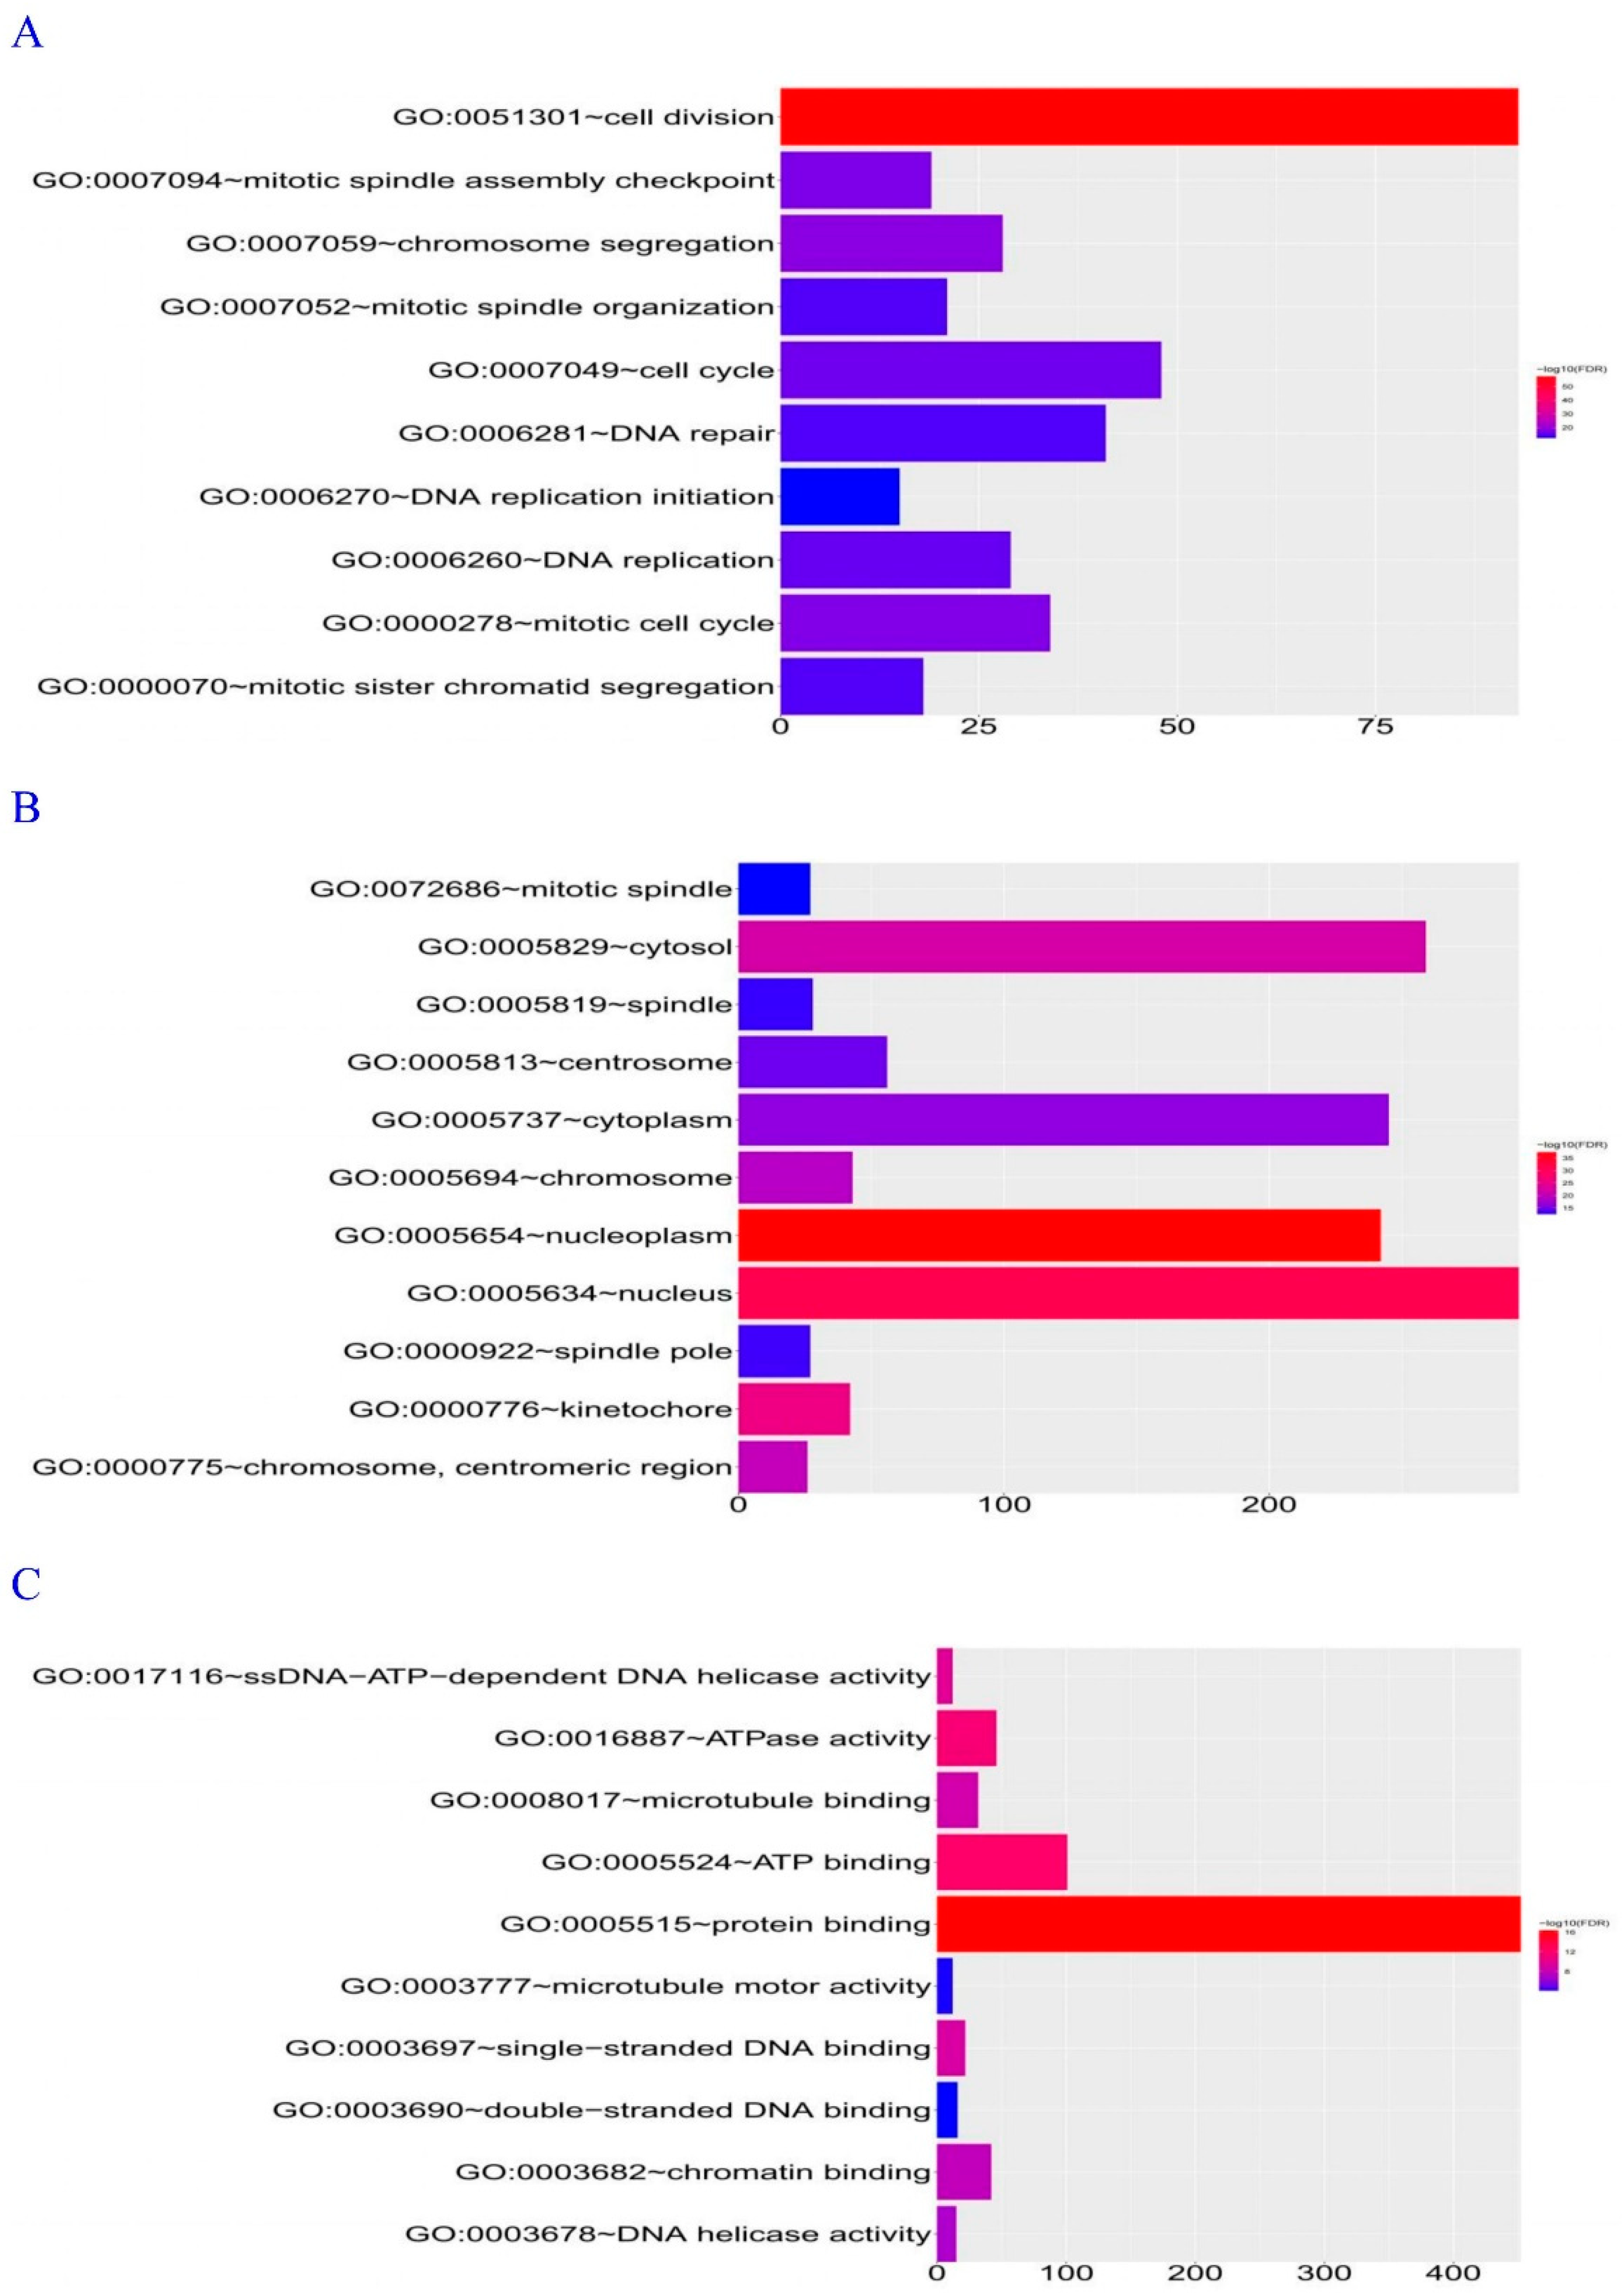
Figure 8.
The relationship between the expression of DEPDC1 and the tumor microenvironment score. ***: P<0.001.
Figure 8.
The relationship between the expression of DEPDC1 and the tumor microenvironment score. ***: P<0.001.
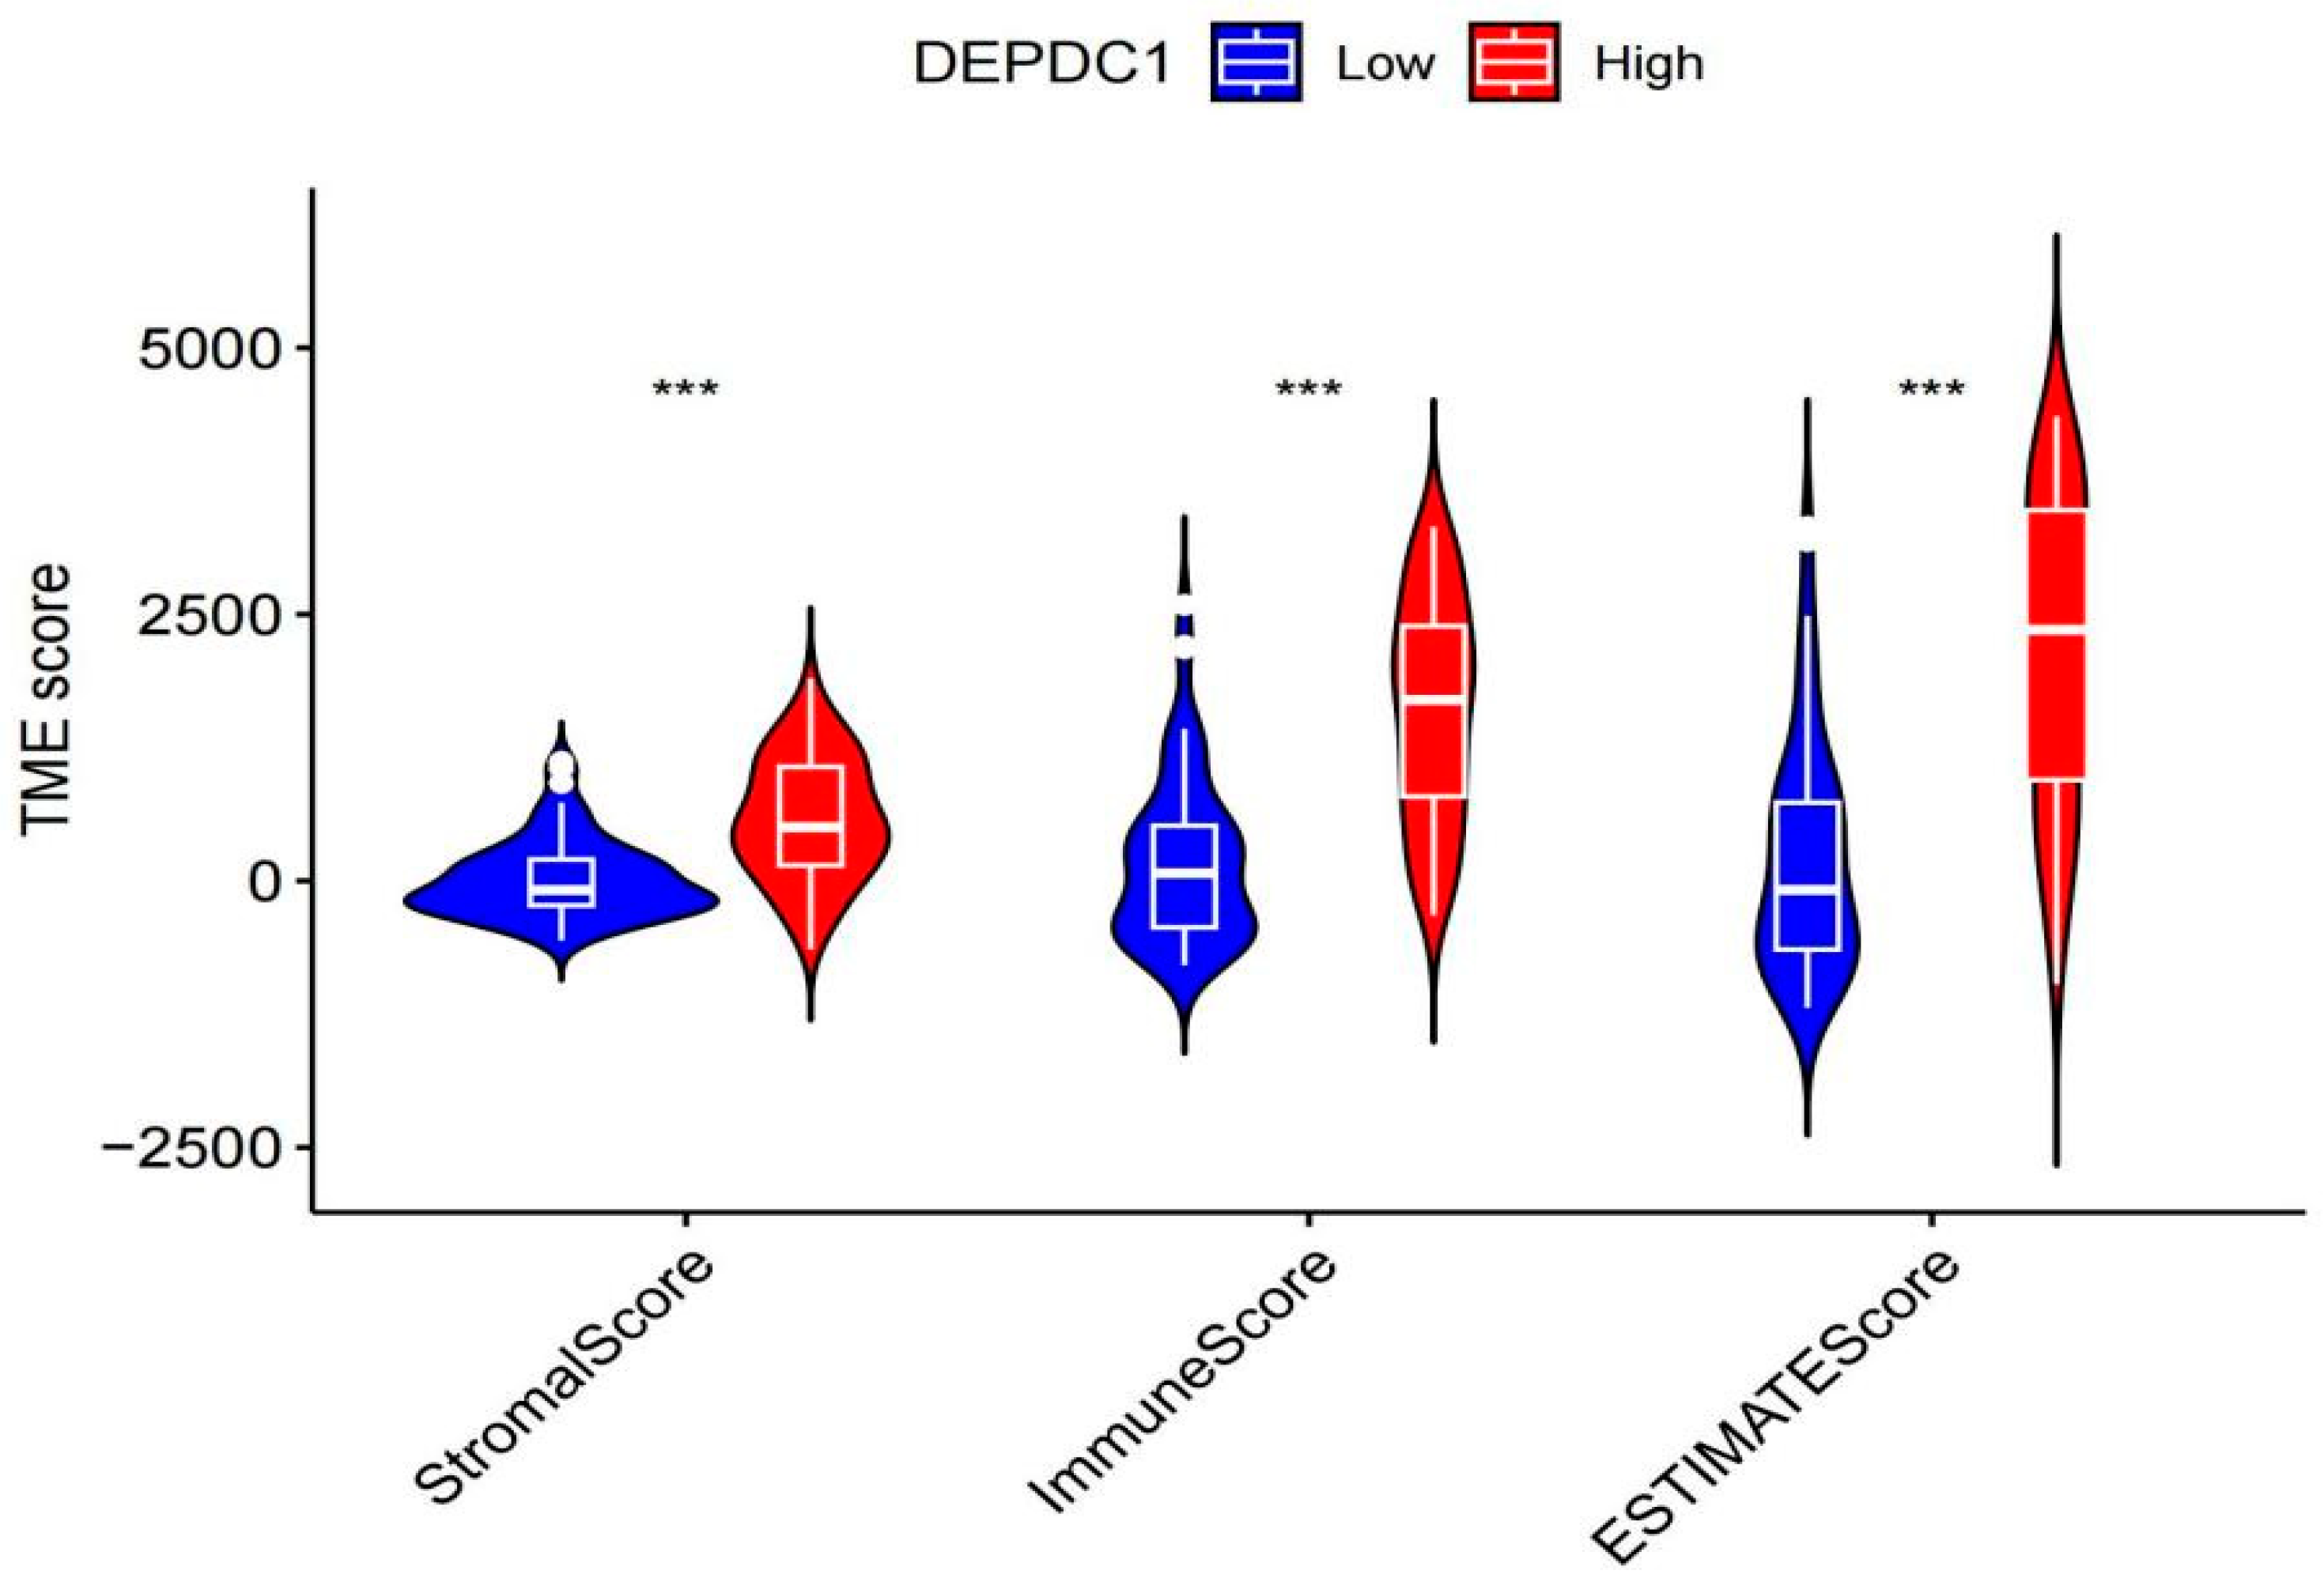
Figure 9.
The relationship between the expression of DEPDC1 and the immune cells infiltration. The size of the circle represents the absolute value of the correlation coefficient, and the color represents the magnitude of the P-value. The X-axis represents the correlation coefficient, and the Y-axis represents the P-value corresponding to each immune cell.
Figure 9.
The relationship between the expression of DEPDC1 and the immune cells infiltration. The size of the circle represents the absolute value of the correlation coefficient, and the color represents the magnitude of the P-value. The X-axis represents the correlation coefficient, and the Y-axis represents the P-value corresponding to each immune cell.
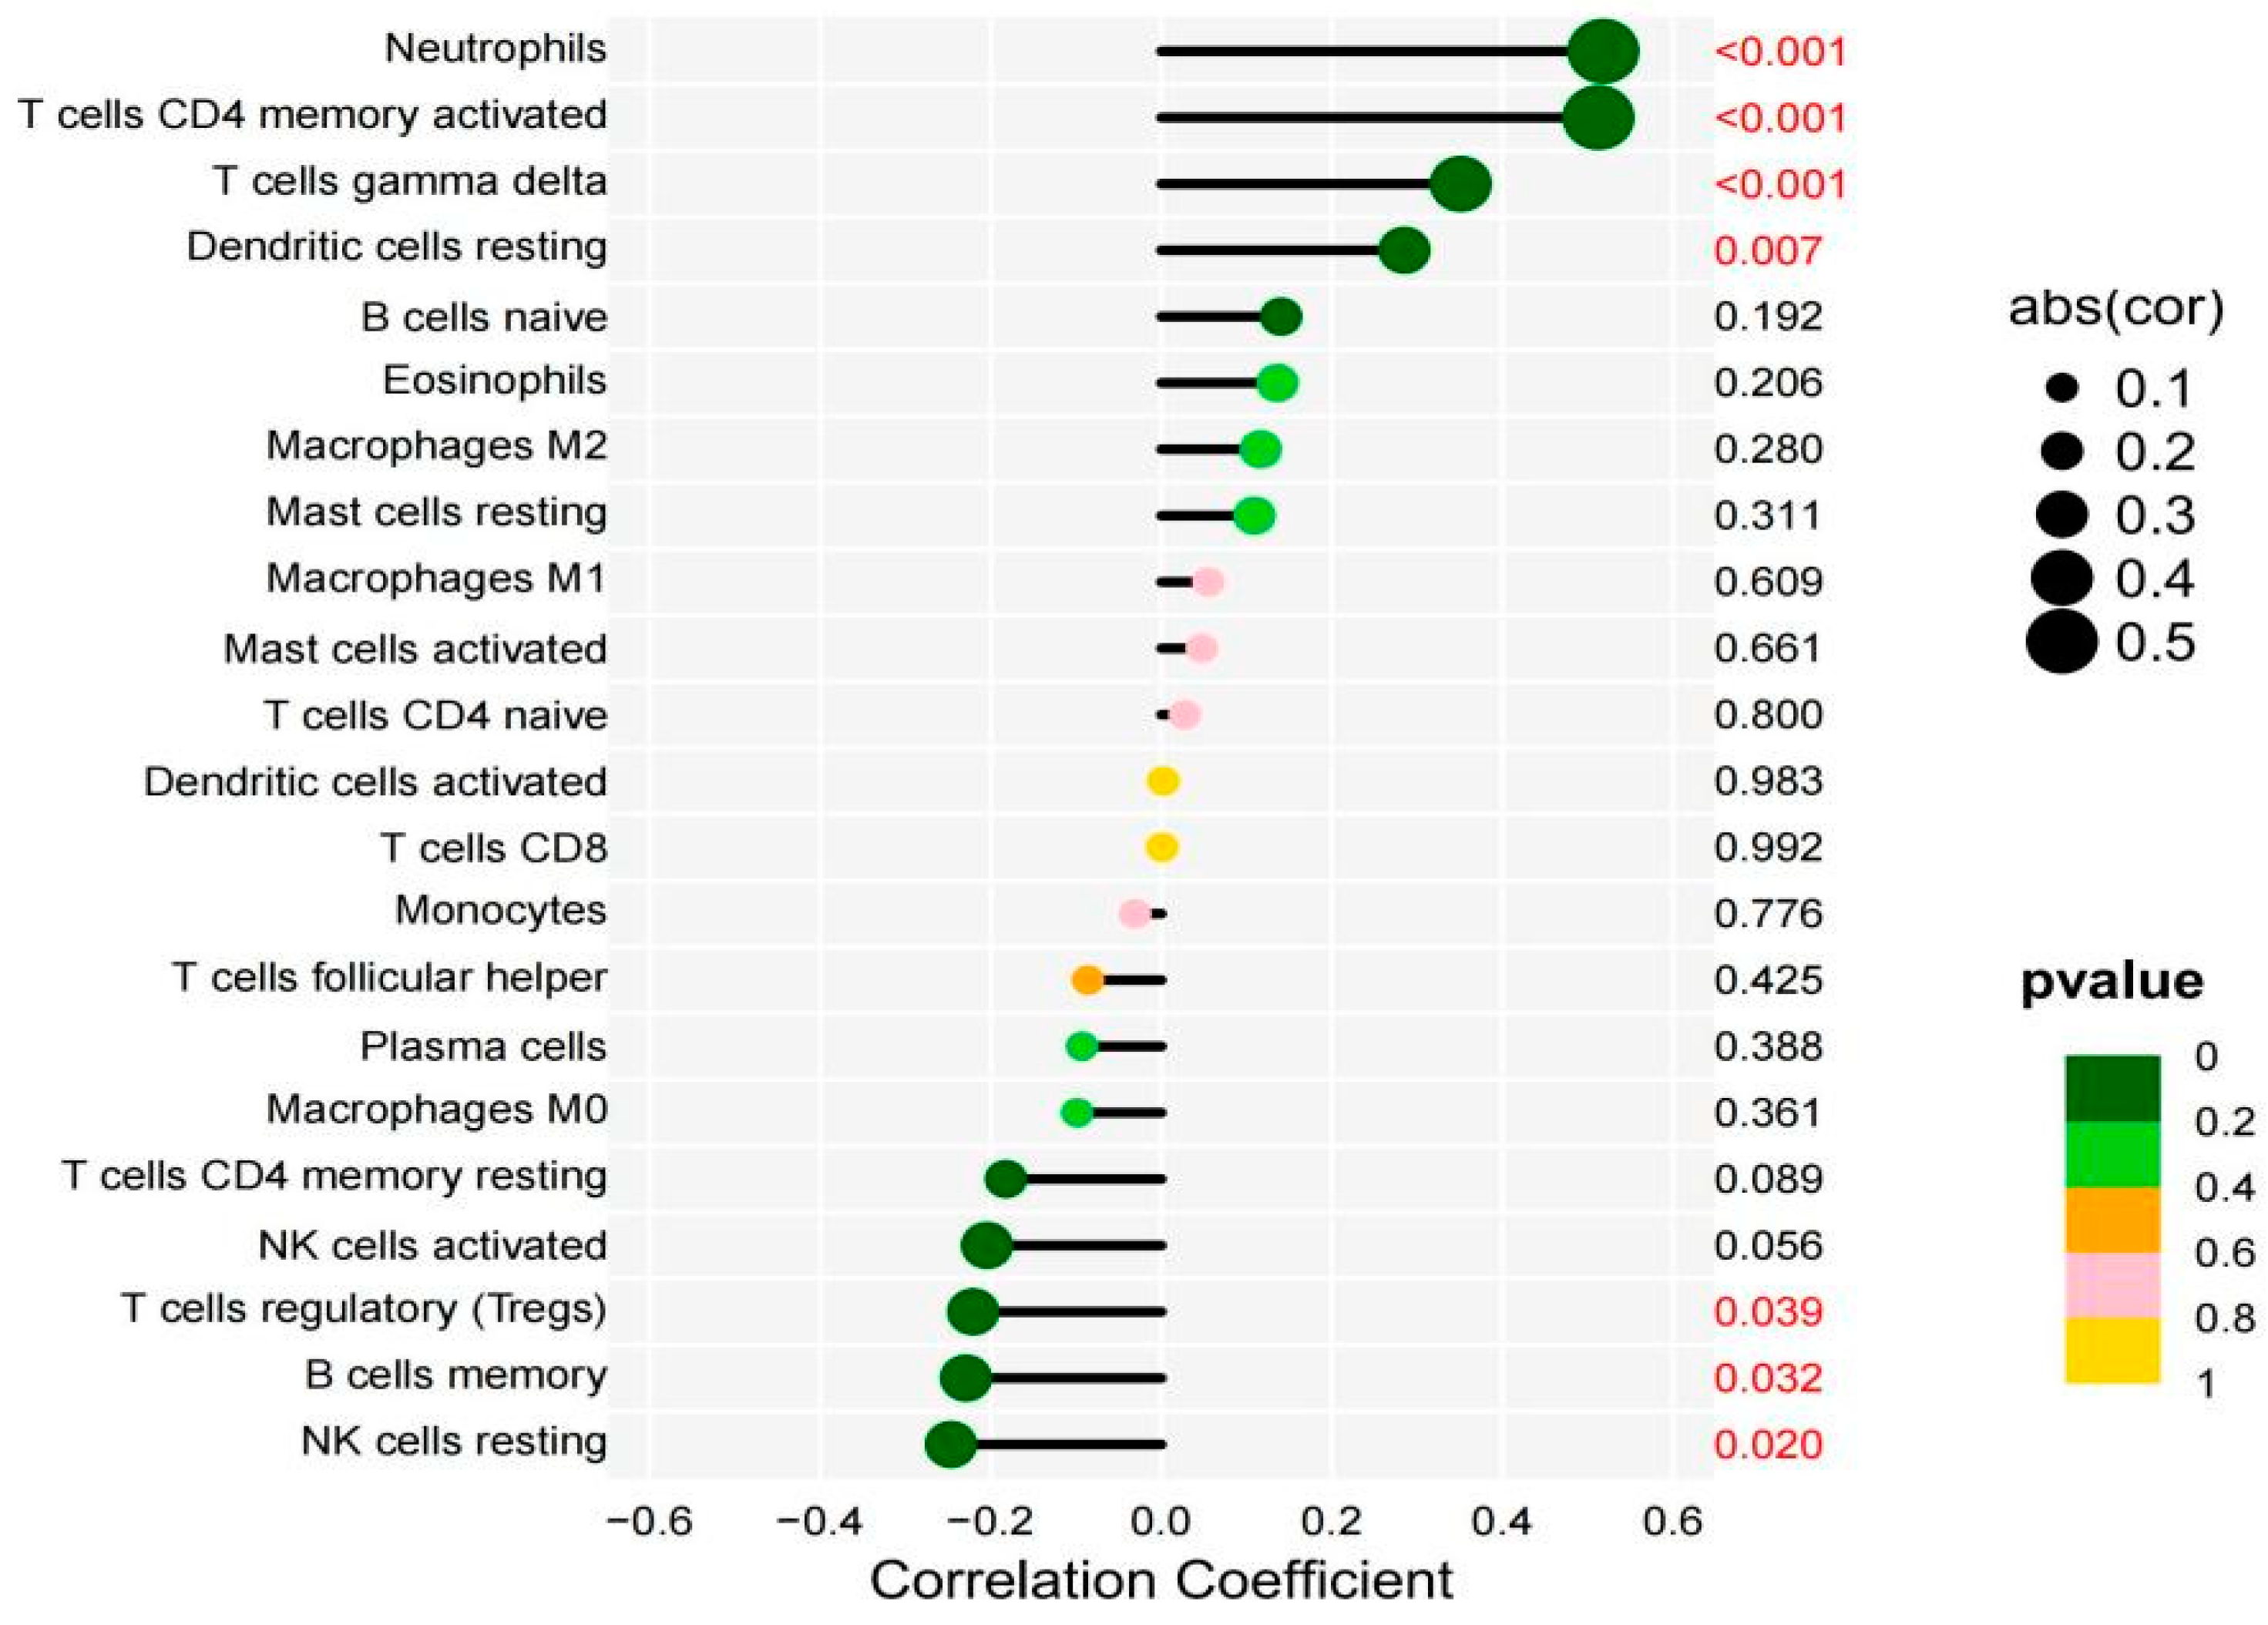
Figure 10.
The relationship between DEPDC1 expression in TC and immune cell infiltration was analyzed using TIMER2.0. It was observed that DEPDC1 expression was significantly positively correlated with the infiltration of B cells, CD4+ T cells, CD8+ T cells, macrophages, neutrophils, and dendritic cells. Except for the CD8+ T cells with P-value less than 0.01, all other P-values were significantly less than 0.001.
Figure 10.
The relationship between DEPDC1 expression in TC and immune cell infiltration was analyzed using TIMER2.0. It was observed that DEPDC1 expression was significantly positively correlated with the infiltration of B cells, CD4+ T cells, CD8+ T cells, macrophages, neutrophils, and dendritic cells. Except for the CD8+ T cells with P-value less than 0.01, all other P-values were significantly less than 0.001.

Figure 11.
The transcription level change was confirmed by qPCR after si-RNA interference and plasmid over expression in c643 and BCPAP cells. A: c643 cell line. B: BCPAP cell line. *** : P < 0.001 versus negative control group.
Figure 11.
The transcription level change was confirmed by qPCR after si-RNA interference and plasmid over expression in c643 and BCPAP cells. A: c643 cell line. B: BCPAP cell line. *** : P < 0.001 versus negative control group.
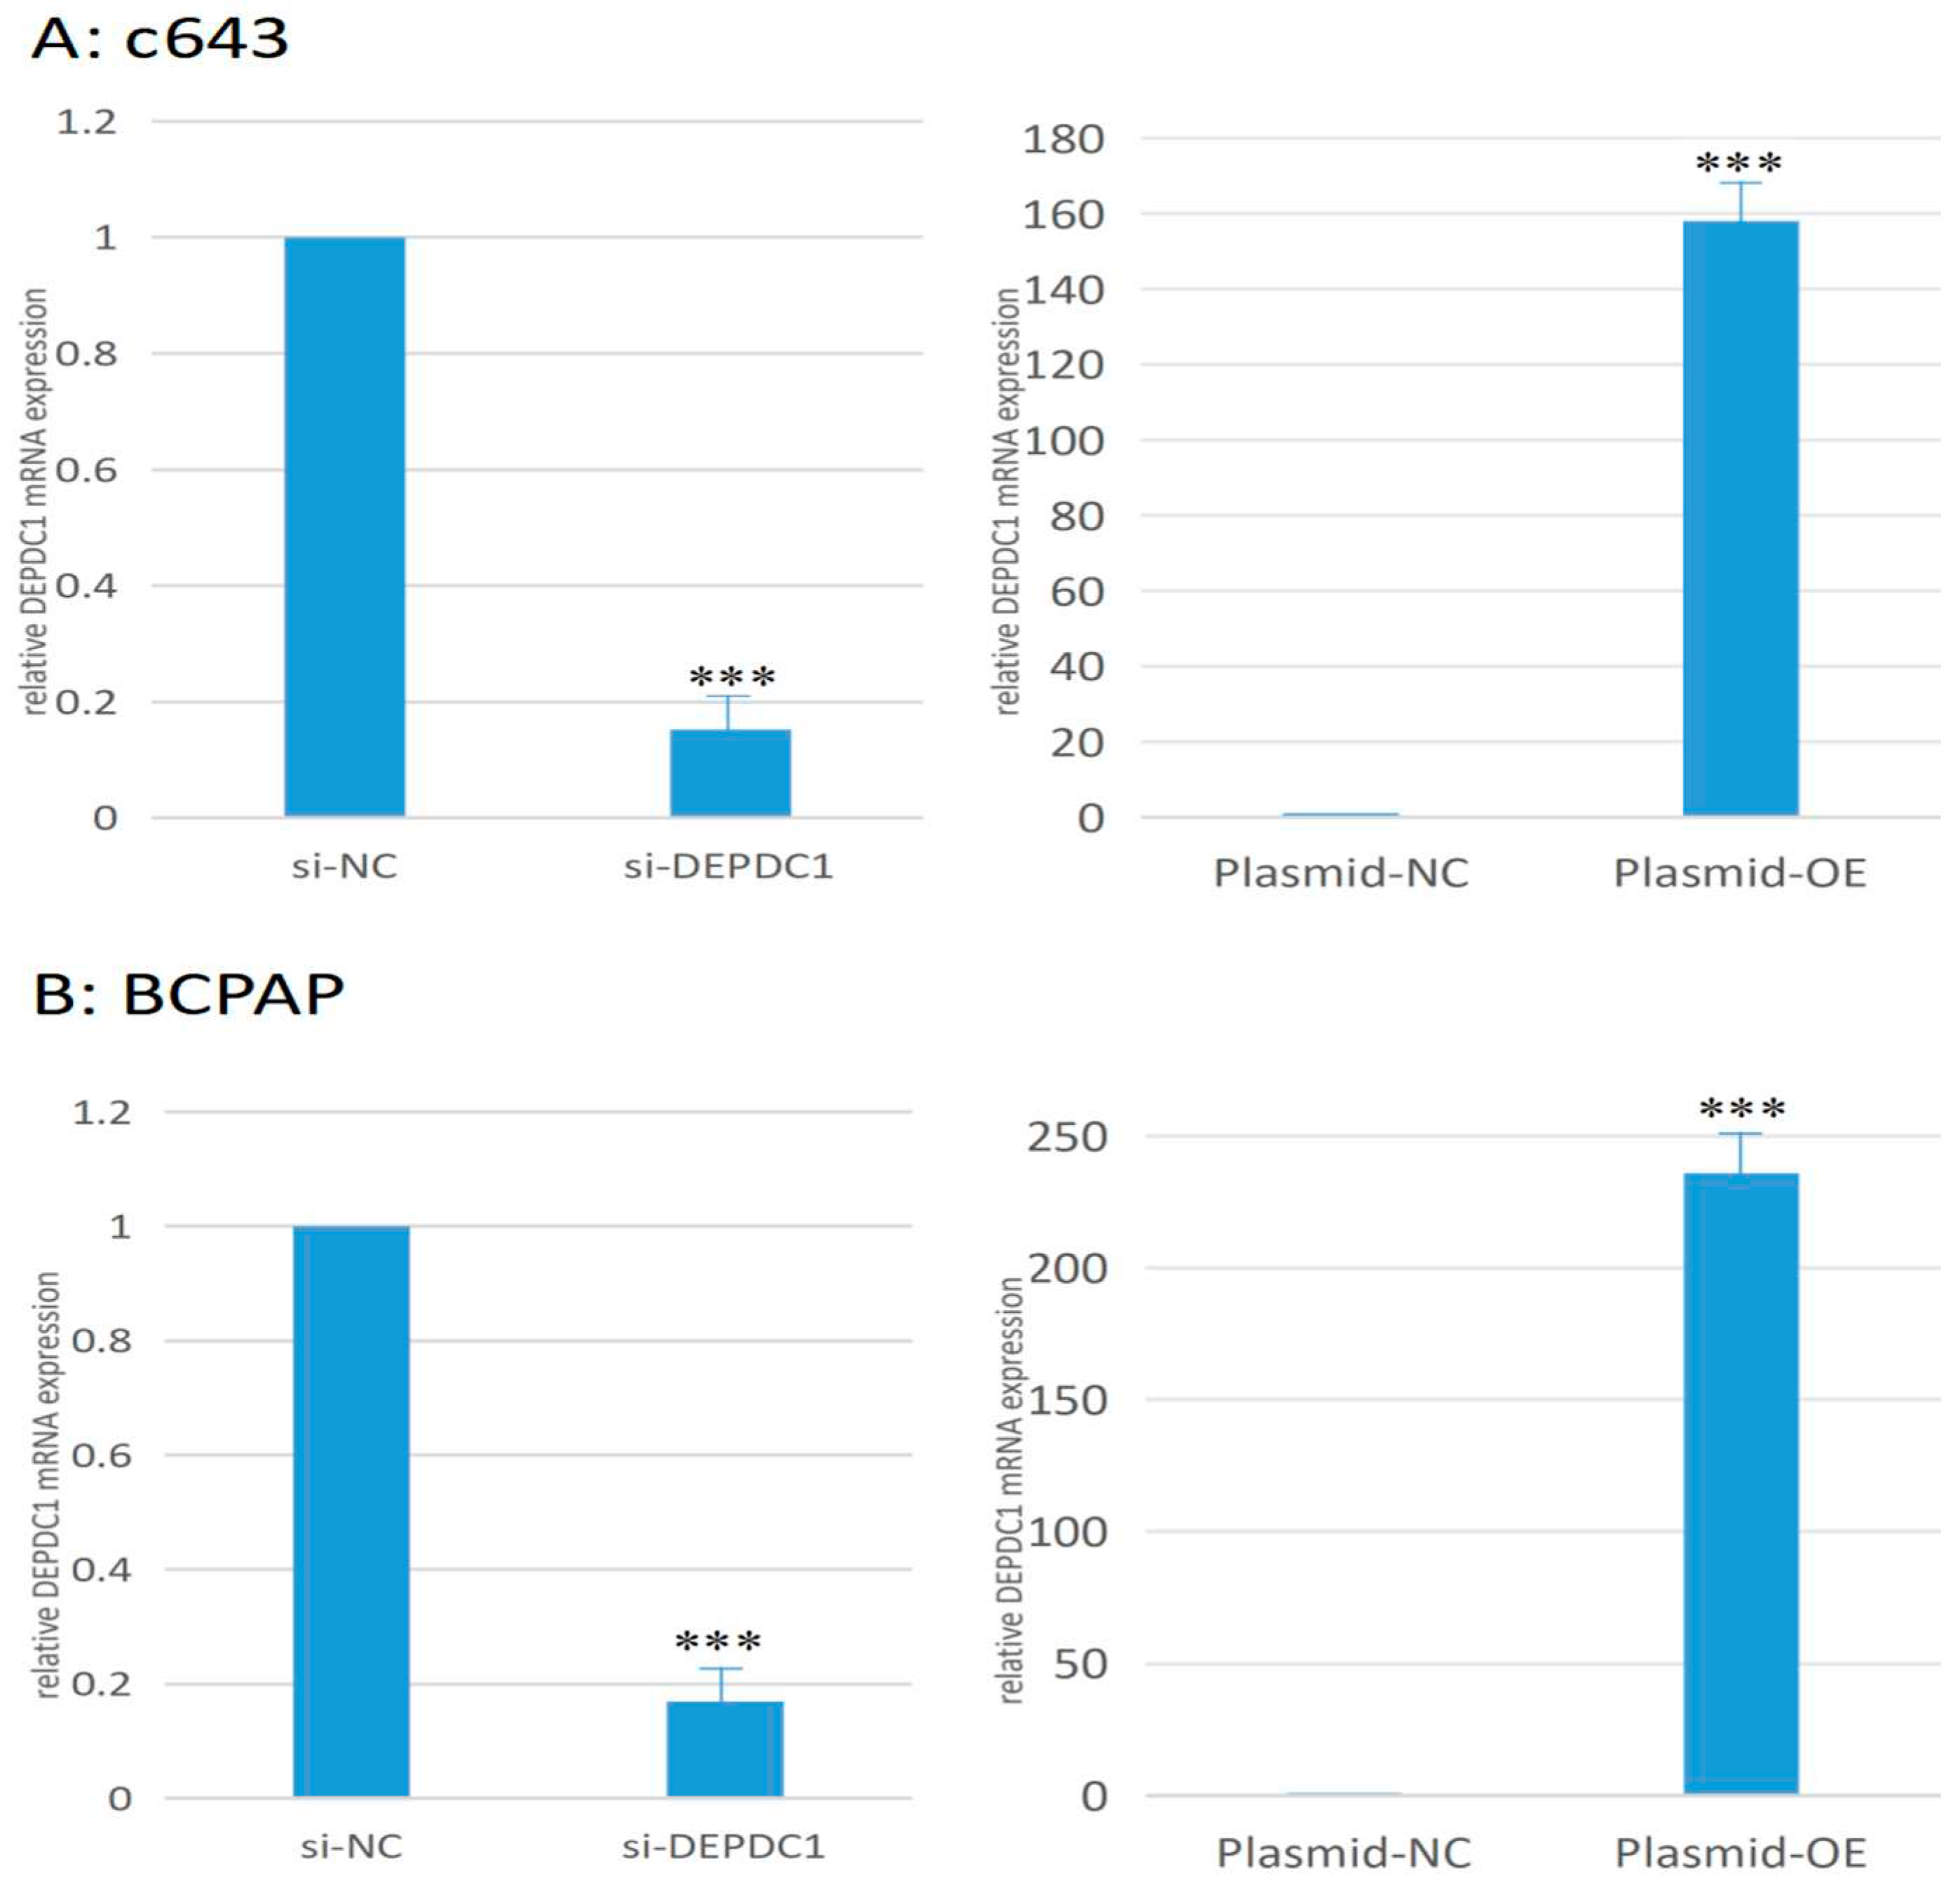
Figure 12.
After si-RNA interference and plasmid over expression of DEPDC1 for c643 and BCPAP cells, the migration ability was assessed using the wound healing assay. A: si-RNA interference for c643 cell line. B: si-RNA interference for BCPAP cell line. C: plasmid over expression for c643 cell line. D: plasmid over expression for BCPAP cell line. NC: negative control; OE: over-expression
Figure 12.
After si-RNA interference and plasmid over expression of DEPDC1 for c643 and BCPAP cells, the migration ability was assessed using the wound healing assay. A: si-RNA interference for c643 cell line. B: si-RNA interference for BCPAP cell line. C: plasmid over expression for c643 cell line. D: plasmid over expression for BCPAP cell line. NC: negative control; OE: over-expression
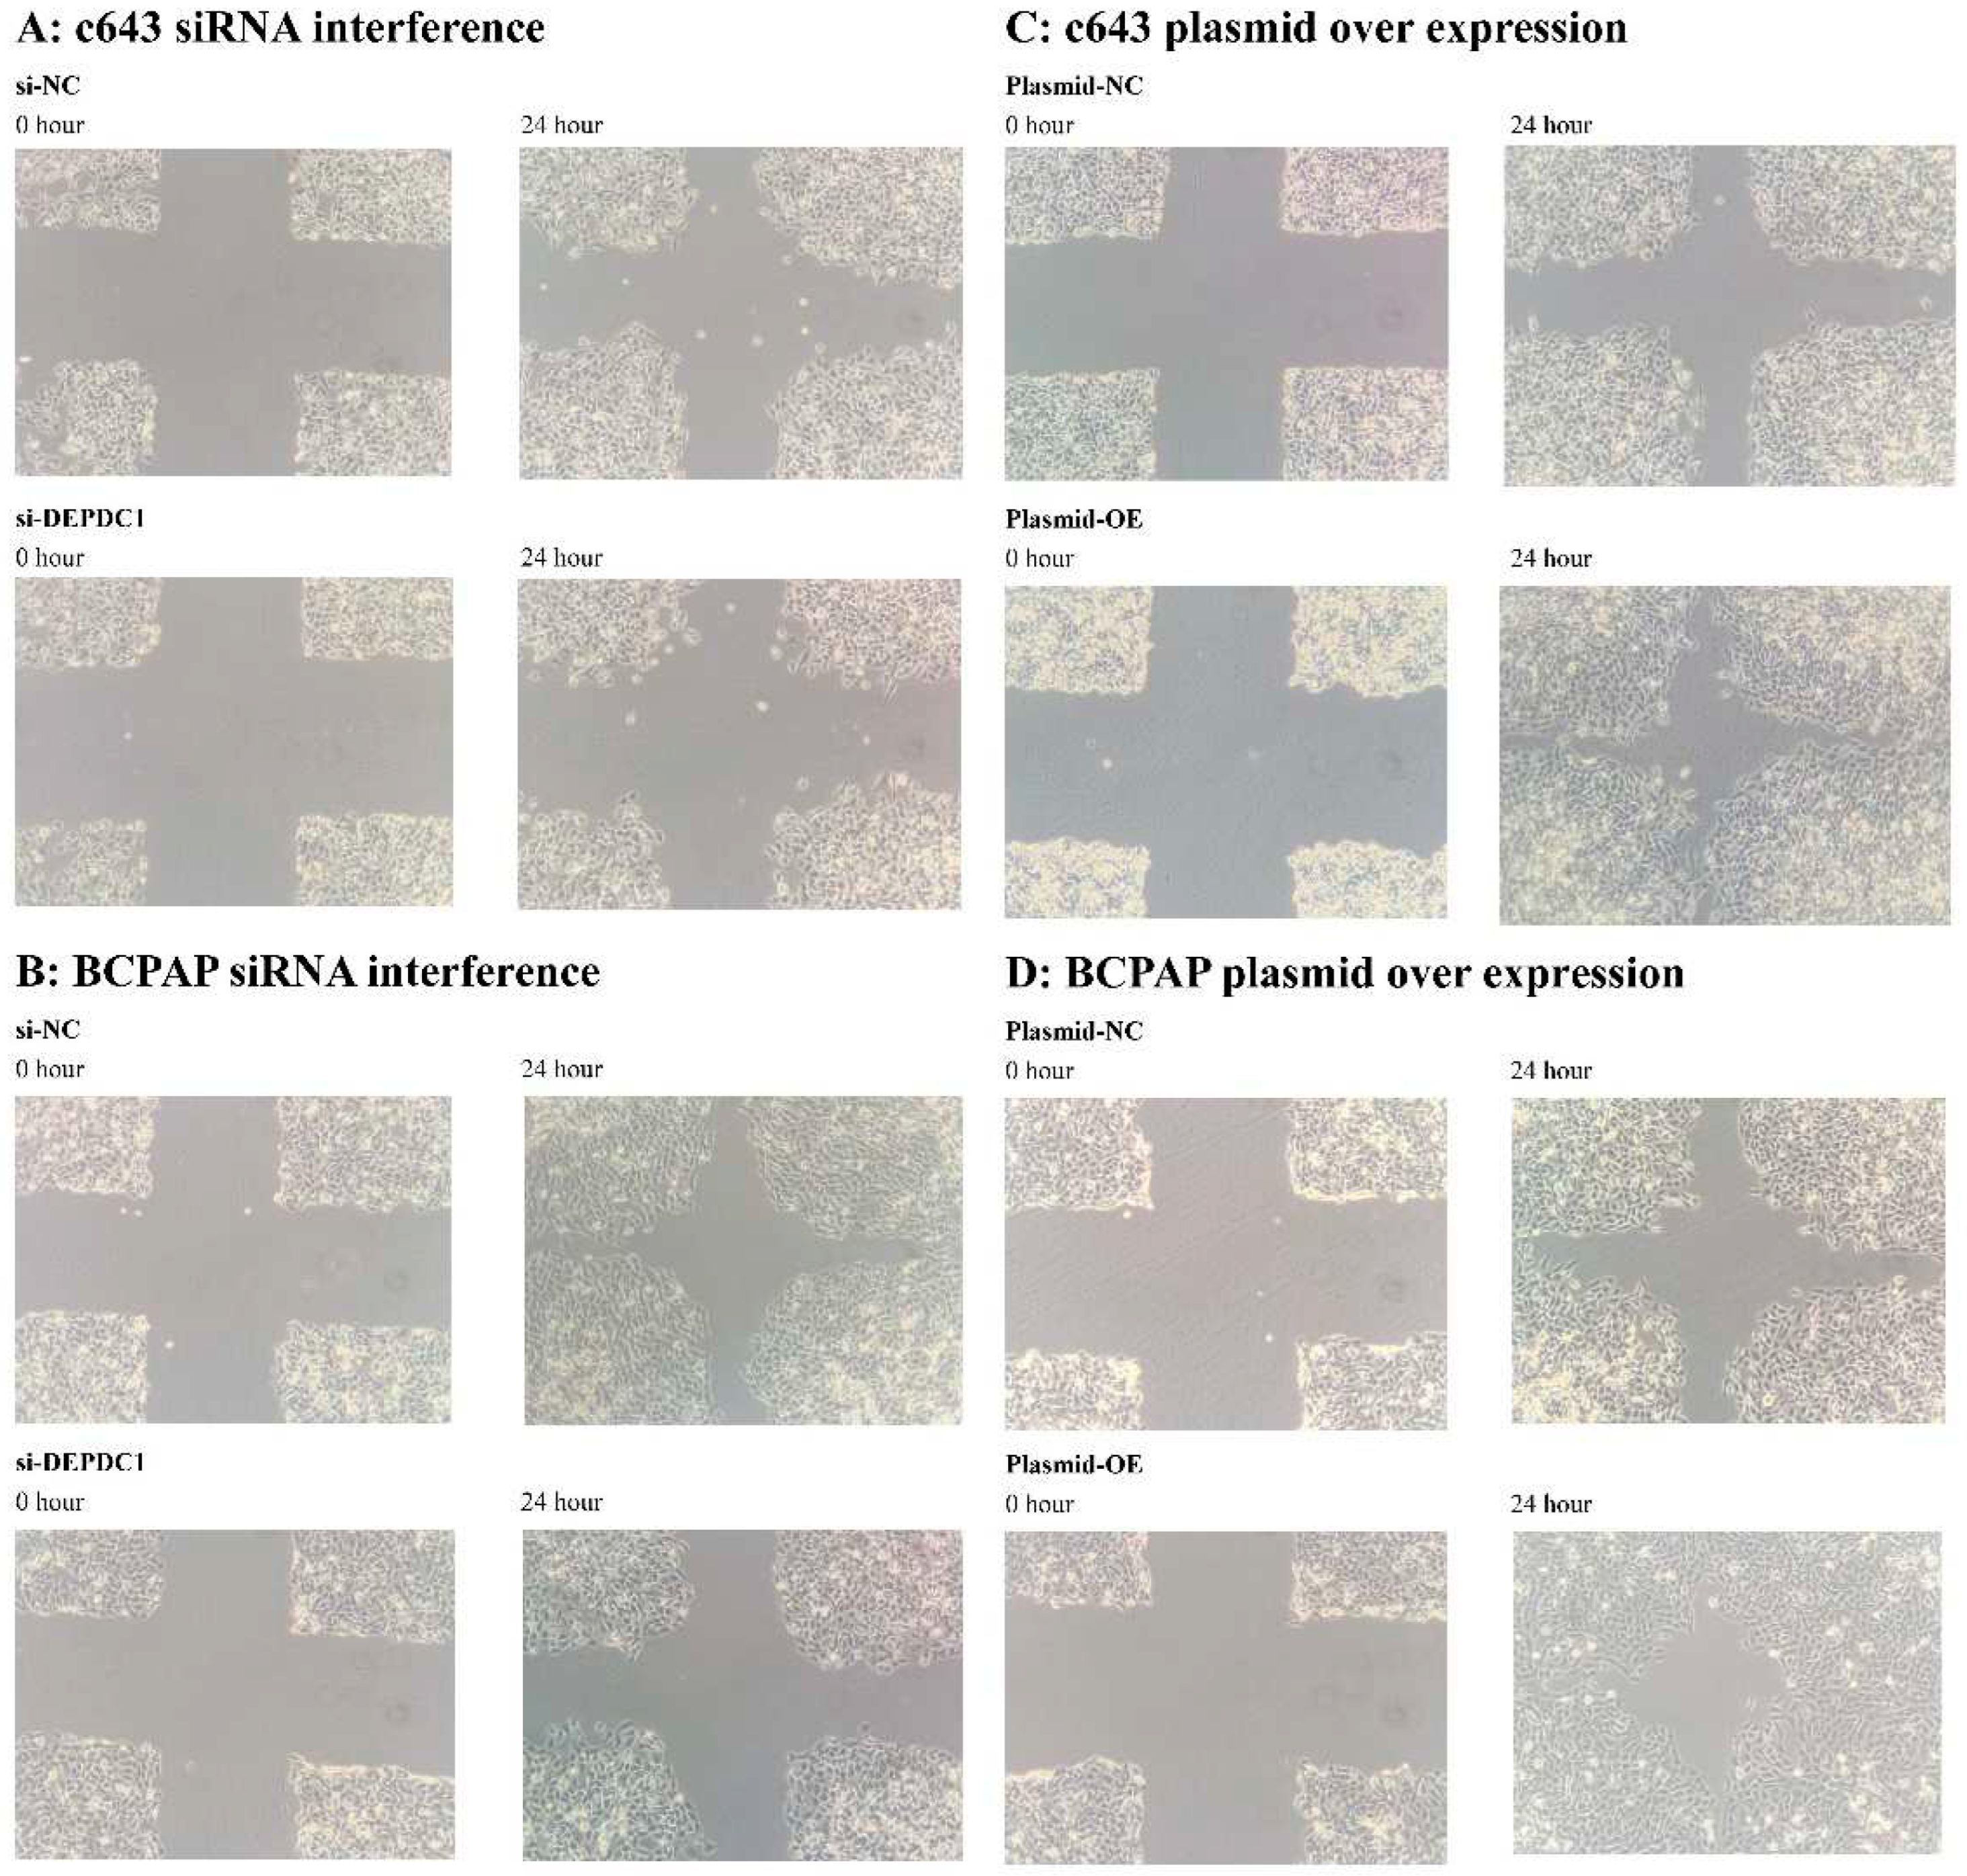
Figure 13.
After si-RNA interference and plasmid over expression of DEPDC1 for c643 and BCPAP cells, the invasion ability was assessed using the transwell assay. A: si-RNA interference for c643 cell line. B: si-RNA interference for BCPAP cell line. C: plasmid over expression for c643 cell line. D: plasmid over expression for BCPAP cell line.
Figure 13.
After si-RNA interference and plasmid over expression of DEPDC1 for c643 and BCPAP cells, the invasion ability was assessed using the transwell assay. A: si-RNA interference for c643 cell line. B: si-RNA interference for BCPAP cell line. C: plasmid over expression for c643 cell line. D: plasmid over expression for BCPAP cell line.
Disclaimer/Publisher’s Note: The statements, opinions and data contained in all publications are solely those of the individual author(s) and contributor(s) and not of MDPI and/or the editor(s). MDPI and/or the editor(s) disclaim responsibility for any injury to people or property resulting from any ideas, methods, instructions or products referred to in the content. |
© 2023 by the authors. Licensee MDPI, Basel, Switzerland. This article is an open access article distributed under the terms and conditions of the Creative Commons Attribution (CC BY) license (http://creativecommons.org/licenses/by/4.0/).
Copyright: This open access article is published under a Creative Commons CC BY 4.0 license, which permit the free download, distribution, and reuse, provided that the author and preprint are cited in any reuse.