
Submitted:
20 November 2023
Posted:
22 November 2023
You are already at the latest version
Abstract
Background and Objectives: Since the protective role of ghrelin against high glucose-induced retinal damage was not yet explored, we aimed to investigate the serum levels of total ghrelin (TG), its acylated (AG) and des-acylated (DAG) forms in diabetic retinopathy (DR) patients. Moreover, the correlation between serum ghrelin and neutrophil elastase (NE) levels, enhancing the risk of microhemorrhages, was investigated; Materials and Methods: Serum markers were determined by Enzyme-Linked Immunosorbent Assays in 12 non-diabetic subjects (CTRL), 15 diabetic patients without DR (Diabetic), 15 patients with non-proliferative (NPDR) and 15 patients with proliferative DR (PDR); Results: TG and AG serum levels were significantly decreased in NPDR (P < 0.01 vs Diabetic) and in PDR patients (P < 0.01 vs NPDR). AG serum levels were inversely associated with DR progression (r = -0.83,P < 0.01), serum neutrophils percentage (r = -0.74, P < 0.01) and serum NE levels (r = -0.73, P < 0.01). These were significantly increased in NPDR (P < 0.01 vs Diabetic) and PDR (P < 0.01 vs PDR) groups, positively correlating with DR progression (r = 0.86, P < 0.01). Conclusions: The reduction of circulating AG and its association with the increased risk of microhemorrhages could be considered a novel marker for DR progression.
Keywords:
diabetic retinopathy
; ghrelin
; neutrophils
; neutrophil extracellular traps
1. Introduction
Diabetic retinopathy (DR) represents the main cause of blindness, especially in industrialized countries, with a significant impact on health care costs [1]. Although intravitreal injections of anti-VEGF drugs and steroids seem to be effective for the management of both Non-Proliferative (NPDR) and Proliferative (PDR) DR forms [2,3], DR detection is still a challenge since it requires complex and expensive equipment, along with well trained technicians [4]. Therefore, the identification of new systemic biomarkers correlated to the stage of the disease, and involved in its evolution, could be a useful novel tool to predict or early identify NPDR and to slow its progression to PDR [5].
To this regard, ghrelin is a peptide hormone produced by gut that beyond its role as an orexigenic signal [6], mediates anti-apoptotic, autophagic and anti-inflammatory effects at the level of the eye structures, as for example in the epithelial cells of the lens membrane [7], and in the retina [8]. Interestingly, previous preclinical studies reproducing DR in vitro and in vivo have shown that ghrelin reduces retinal angiogenesis, apoptosis and inflammation induced by high glucose through the activation of the ghrelin receptor [9,10]. A receptor known as growth hormone secretin receptor 1a (GHSR-1a) and characterized by its higher affinity to acylated form of ghrelin compared to the des-acylated one [11]. Through this receptor, ghrelin is able to promote the apoptosis of neutrophils [12,13], leukocytes highly involved in inflammation and endothelial damage during DR evolution, contributing to DR complications with the extrusion of neutrophil extracellular traps (NETs) [14]. A process called NETosis, worsened by hyperglycemia [15,16] and exacerbated in DR patients [17,18]. Thus, ghrelin could impact the progression of DR through a cross-talk with neutrophils and the related risk of NETosis process in diabetic patients.
Therefore, the present study aimed to evaluate in humans whether there are putative changes in total levels of serum ghrelin and/or its acylated/des-acylated forms during different phases of DR, and whether they correlate with clinical signs and serum elastase levels, indicative of NET formation [19] and vascular damage [15,19,20].
2. Results
2.1. Characteristics of DR Patients
57 patients (31 males and 26 females) were enrolled in this study and divided in the following four groups, based on ocular evaluations and DR clinical diagnosis:
- Non-diabetic subjects with absence of ocular pathologies (N = 12) - CTRL group;
- Diabetic patients without DR signs (N = 15 ) - Diabetic group;
- Diabetic patients with diagnosis of non-proliferative DR (N = 15) - NPDR group;
- Diabetic patients with diagnosis of proliferative DR (N = 15) - PDR group;
Differences in age or diabetes duration were not observed in diabetic groups. Conversely, PDR patients exhibited significantly higher glycaemic levels compared to Diabetic and NPDR groups (both P < 0.05) (Table 1).
Moreover, neutrophils percentage significantly increased in NPDR patients compared to Diabetic group (P < 0.01). This was even more elevated in PDR patients (P < 0.01 vs NPDR) (Table 1), although the values for all the 4 clinical groups were in the normal range.
2.2. Serum Ghrelin Levels in DR Patients
Serum total ghrelin (TG) was significantly decreased in Diabetic group compared to CTRL subjects (CTRL: 1056+146 pg/mL; Diabetic: 925+86 pg/mL, P < 0.05 vs CTRL). A reduction in serum TG levels, although not significant in comparison with Diabetic, was detected also in NPDR group (NPDR: 861+126 pg/mL, P > 0.05 vs Diabetic), while it was significant in PDR patients compared to Diabetic group (PDR: 807+127 pg/mL, P < 0.05 vs Diabetic) (Figure 1A).
Similarly, serum acylated ghrelin (AG) was significantly decreased in Diabetic group compared to CTRL subjects (CTRL: 275±93 pg/mL; Diabetic: 171 ±31 pg/mL, P < 0.01 vs CTRL). A further significant reduction was evident in NPDR patients compared to Diabetic group (NPDR: 115 ±24 pg/mL, P < 0.05 vs Diabetic), with the lowest serum AG levels detected in PDR sera (PDR: 63±32 pg/mL, P < 0.01 vs NPDR) (Figure 1B). Conversely, serum des-acylated ghrelin (DAG) was not differentially modulated in our clinical setting (CTRL: 800±182 pg/mL; Diabetic: 926±165 pg/mL; NPDR: 917±248 pg/mL; PDR: 990±193 pg/mL) (Figure 1C).
2.3. Serum AG/DAG Ratio and Its Correlation with Retinal Abnormalities in DR Patients
Consequently, AG/DAG ratio was significantly decreased in Diabetic patients (0.23 ± 0.05, P < 0.01 vs CTRL) compared to CTRL group (0.35 ± 0.1). A progressive significant reduction of AG/DAG ratio was evident also in NPDR (0.16 ± 0.04, P < 0.05 vs Diabetic CTRL) and PDR (0.08 ± 0.04, P < 0.01 vs Diabetic and P < 0.05 vs NPDR) patients (Figure 2A).
The decrease of AG/DAG was paralleled by an increase of microhemorrages, microaneurysms and exudates detected in NPDR and PDR patients respectively by retinography . Indeed, CTRL subjects evidenced a normal retinal vasculature without abnormalities and Diabetic patients showed a slight irregularity of the caliber and vessel course without DR classic signs (Figure 2B). Conversely, NPDR patients evidenced multiple microhemorrhages (1- ≥ 20), microaneurysms and exudates in the four retinal quadrants, while PDR group showed retinal neovascularization, and/or extensive fibrovascular proliferation, or vitreous/preretinal hemorrhages. This increase of retinal abnormalities identifying DR progression was significantly inversed correlated with serum AG/DAG ratio (r = -0.83, P < 0.01) (Figure 2C). Therefore, since the modulation of AG/DAG ratio in DR patients was due to serum AG changes, this was considered for further correlations.
2.4. Serum Neutrophil Elastase (NE) Levels in DR Patients and Its Association with Serum AG
Serum AG were inversely associated in DR patients with serum neutrophils percentage (r = -0.74, P < 0.01) (Figure 3A).
As expected, this positively correlated with serum NE levels (0.80, P < 0.01) (Figure 3B). Indeed, serum NE was significantly increased in Diabetic group compared to CTRL subjects (CTRL: 0.85±0.3 ng/mL; Diabetic: 1.6±0.4 ng/mL, P < 0.05 vs CTRL) (Figure 3C). Moreover, NPDR patients showed serum NE levels significantly elevated compared to Diabetic group (NPDR: 2.2±0.4 ng/mL, P < 0.01 vs Diabetic), with the highest value reached in PDR patients (PDR: 2.9±0.6 ng/mL, P < 0.01 vs NPDR) (Figure 3C). A strong positve correlation was observed between serum NE levels with DR progression (r = 0.86, P < 0.01) (Figure 3D), while a significant inverse association was evident between serum NE and AG (r = -0.73, P < 0.01) (Figure 3E).
3. Discussion
Ghrelin, often referred to as the “hunger hormone”, mediates several functions beyond its effects on appetite, food intake, body weight and adiposity [7]. Indeed, once acylated by the ghrelin-O-acyl transferase (GOAT), the 28-aa Ser3 AG binds with high affinity to the G-protein coupled receptor GHSR1-a on central neurons and peripheral cells [21,22,23]. On these, ghrelin acts by increasing energy intake [24,25], improving cardiac functions [26,27], reducing muscle atrophy [28,29], promoting bone mass or formation [30,31] and through this receptor it promotes the apoptosis of neutrophils [12,13], leukocytes highly involved in inflammation and endothelial damage during DR evolution.
Noteworthy, diabetic retinopathy is a complication of diabetes that damages retinal blood vessels [32]. The typical microvascular alterations that characterize this disease arise with a predictable progression and this allows serious damage to vision to be prevented. Indeed, if neglected, diabetic retinopathy can cause severe vision loss or even blindness [33]. In the NPDR early stage, vascular occlusion and dilation occur; subsequently the condition evolves into PDR, with the growth of new blood vessels on the retinal surface, a process known as neovascularization [33]. At the basis of these changes in the retina there is a wide range of mediators, some pro-proliferative, others anti-proliferative. Among these is ghrelin, a peptide hormone whose endogenous levels can be compromised by pathologies such as diabetes, that seems to have anti-proliferative effects. In fact, previous studies have found a reduced circulating ghrelin concentration in type 2 diabetes [34,35,36], both in the early stages and advanced stages with complications [37,38]. In line with this evidence, here it is indirectly confirmed the protective role of ghrelin in DR since diabetic patients have decreased serum levels of total ghrelin compared to non-diabetic patients, especially those with progression from the NPDR to PDR. However, the novelty of the research with respect to previous one resides in the fact that of the two known isoforms of the total ghrelin, acylated and des-acylated, the acylated form follows the reduction trend shown by the total ghrelin. Conversely, serum des-acylated ghrelin was not differentially modulated in the present clinical context, despite it is the main form secreted in physiological conditions, with an AG/DAG ratio of 1:10 [39,40]. An explanation for this may reside in the fact that diabetes impairs the expression of enzymes that rapidly deacylates AG, such as acyl protein thioesterase 1 which normally deacylates AG [41,42]. This in line with a recent study showing that serum AG seems to be related to elevated blood glucose levels in diabetic obese patients, while DAG seems to be involved in excess body fat mass in the same clinical setting [43]. More specifically, the present study evidenced that changes of serum TG in DR patients are due to AG constant decrement in NPDR and PDR patients. Particularly, serum AG levels decreased significantly in NPDR and PDR patients and showed a strong negative correlation with DR evolution Therefore, in line with the novel clinical applications suggested for AG in Alzheimer’s and Parkinson’s Disease [44], lipodystrophy [45], reproductive toxicity in cancer patients [46] and heart failure [47], serum AG could be considered a sensitive peripheral marker of clinical progression of DR.
From the mechanistic point of view, the changes of AG in DR evolution mirrored the changes and behavior of neutrophils, where ghrelin and its receptor are expressed [48,49]. Indeed, here it is demonstrated an increase of neutrophils percentage in DR stages, which negatively correlates with serum AG levels. During DR, neutrophils play a very important role in microangiopathy occurrence and progression, as well as in the endothelial cell wall inflammatory processes [14,50], since they secrete proteolytic enzymes involved in endothelial damage [14]. This latter leads to chronic inflammation which exacerbates microvascular complications, contributing to DR progression [14,51]. Indeed, DR patients are characterized by high serum neutrophil count [52], with a higher neutrophil-lymphocyte ratio [52,53,54]. This correlating with DR severity in clinical settings [55,56,57]. So, to our knowledge this is the first evidence of a possible endogenous crosstalk between AG and neutrophils for the development and progression of DR. On another note, it is well known that acting on these immune cells, ghrelin exerts anti-inflammatory effects by reducing their migration and infiltration [13,58,59,60,61]. Similarly, ghrelin has been shown to promote neutrophil apoptosis [12,60,61], overall favoring the resolution of inflammation in several diseases, such as arthritis, sepsis and respiratory pathologies [13,58,62,63,64].
The progression of diabetes and diabetic retinopathy (DR) has recently been linked to elevated levels of neutrophil elastase (NE) in circulation, a protein found within the granules of neutrophils. Studies have shown that levels of NE are higher in both type-1 and type-2 diabetic patients when compared to individuals without diabetes [15], along with PDR patients compared to NPDR group [17]. Particularly, NE generally reflects the neutrophil count and contributes to DR pathological vascular permeability [15,19,20]. Moreover, NE is one of the constituents of NETs, along with histones, DNA, fibers and several proteins such as NE, myeloperoxidase (MPO), cathepsin G, cathelicidin and proteinase 3 (PR3) [65]. NETs are a sort of physical barrier against pathogens [66,67] organized by apoptotic netrophils also implicated in the pathology associated with a growing number of immune-mediated conditions [68] and in a process called NETosis. NETosis is induced in an organ in response to endogenous danger signals that must be tightly regulated to prevent excessive tissue damage during acute inflammation or chronic inflammatory and autoimmune disease [68]. Among the other, NETs can occlude the vasculature by promoting thrombosis and obstruct important organ areas. Both diabetes and DR progression seem to be characterized by NETs enhanced formation and release [15,17]. In line with this evidence, it is found here a positive correlation between the increase of neutrophils in the two DR stages analyzed and the serum NE levels. These were increased in both groups with higher levels in PDR patients compared to NPDR patients. Serum NE levels were positively correlated with DR progression, by evidencing a higher risk of NETs formation, which strongly impact the occurrence of thrombosis and hemorrhages [69,70], two of the PDR hallmarks [71]. Furthermore, for the first time it is shown here an inverse correlation between serum NE and AG in DR patients. Therefore, it could be hypothesized that the physiological role of AG in diabetes and uncomplicated retinopathy is to promote neutrophil apoptosis, consequently reducing the risk of NET formation and complications of PDR.
In conclusion, the data presented suggest that circulating ghrelin and its acylated form could be potential markers for the progression of diabetic retinopathy since associates itself to reduced circulating neutrophils activation and reduced NETs formation during the progression of DR from NPDR to PDR. However, it's important to acknowledge the limitations of this study, including the small sample size of patients, the absence of consistent follow-up, and the lack of a direct cause-and-effect study on ghrelin. Bearing these constraints in mind, it's still plausible to consider ghrelin monitoring as a potentially valuable approach in the proactive prevention of DR progression.
4. Materials and Methods
4.1. Clinical Design
This study was performed at the Eye Clinic of the University of Campania “Luigi Vanvitelli” (Naples, Italy), with all its procedures adhering to the Declaration of Helsinki and Good Clinical Practice guidelines. The study was approved by the ethic committee of the University of Campania “Luigi Vanvitelli” (protocol number 42 DEC, 30-1-2019 and protocol number 0003239/i, 01-02-2023). The patients were enrolled after a basal examination, needed to obtain the written informed consent and to evaluate the adherence to the following inclusion criteria: I) Age of at least 46 years; II) Duration of diabetes of at least 4 years; III) Clinical diagnosis of NPDR or PDR by medical history and ocular fundus examination; IV) Hypoglycemic therapy with Sodium-Glucose Cotransporter 2 inhibitors [72]. Patients with body mass index higher than 30 kg/m2 (obese patients), uncontrolled diabetes, other severe diabetic complications (ketoacidosis/nephropathy), recent or systemic infection and recent cardiovascular diseases were excluded. Furthermore, patients using lipid-lowering agents or immunosuppressive, steroidal and non-steroidal anti-inflammatory drugs (NSAIDs) were not enrolled, as well as patients receiving intravitreal steroids/anti-Vascular Endothelial Growth Factors (VEGFs) , and argon laser coagulation or vitrectomy in the last 6 months.
4.2. DR Diagnosis
DR diagnosis was performed by obtaining the patient’s medical history and by performing ocular fundus examination. DR stages were determined by the number of intraretinal microvascular abnormalities, microaneurysms, haemorrhages and retinal neovascularization, according to the American Academy of Ophthalmology Retina-Vitreous Panel [73]. Retinography analysis was performed by using Topcon Engineering.
4.3. Serum Samples Collection and Analysis of Serum Markers
Sterile dry vacutainer tubes were used to obtain fasting venous blood samples from the enrolled patients. Within 2 hours from sampling, blood was incubated at 20°C for 30 minutes before being centrifuged at 4°C for 15 minutes at 3000 rpm, to have serum samples as supernatants. Their aliquots were stored at -80°C for subsequent analysis of serum markers, performed at the Pharmacology Section of University of Campania “Luigi Vanvitelli”) by Enzyme-Linked Immunosorbent Assays (ELISAs). Serum AG, total ghrelin (TG) and NE levels were assessed by using commercial ELISAs according to the manufacturers’ instructions (respectively, EH2601 Human Acylated Ghrelin ELISA Kit, FineTest – Wuhan, China; EH0355 Human Ghrelin ELISAS Kit, FineTest – Wuhan, China; BMS269 Human PMN-Elastase ELISA Kit, Invitrogen – Waltham, MA, USA). Serum DAG levels were calculated by subtracting AG from TG [74].
4.4. Statistical Analysis
Prism 6.0 (GraphPad, San Diego, CA) software was used for both statistical analysis and graph design. One-way analysis of variance (ANOVA), followed by Tukey multiple comparison post hoc test, was used for the determination of differences between groups. The strength of association between 2 quantitative variables was evaluated by Pearson correlation analysis. A P-value < 0.05 was considered significant.
Author Contributions
Conceptualization, M.C.T. and C.G.; methodology, F.P.; software, M.G.V. and M.N.; validation, F.S.; formal analysis, C.G.; investigation, C.C.L. and M.R.; resources, A.H. and S.R.; data curation, M.C.T.; writing—original draft preparation, M.C.T. and C.G.; writing—review and editing, M.D. and S.R.; supervision, F.S. All authors have read and agreed to the published version of the manuscript.
Funding
This research and APC were funded by the Italian Ministry of Education, University and Research, grant number PRIN 2020FR7TCL_002.
Institutional Review Board Statement
The study was conducted in accordance with the Declaration of Helsinki, and approved by the Ethics Committee of University of Campania “Luigi Vanvitelli”, Naples - Italy (protocol number 42 DEC, 30-1-2019 and protocol number 0003239/i, 01-02-2023).
Informed Consent Statement
Informed consent was obtained from all subjects involved in the study.
Data Availability Statement
All the data presented in this study are included within the article.
Conflicts of Interest
The authors declare no conflict of interest.
References
- Teo, Z.L.; Tham, Y.-C.; Yu, M.; Chee, M.L.; Rim, T.H.; Cheung, N.; Bikbov, M.M.; Wang, Y.X.; Tang, Y.; Lu, Y.; et al. Global Prevalence of Diabetic Retinopathy and Projection of Burden through 2045. Ophthalmology 2021, 128, 1580–1591. [Google Scholar] [CrossRef]
- Simó, R.; Hernández, C. New Insights into Treating Early and Advanced Stage Diabetic Retinopathy. Int. J. Mol. Sci. 2022, 23, 8513. [Google Scholar] [CrossRef]
- Bahr, T.A.; Bakri, S.J. Update on the Management of Diabetic Retinopathy: Anti-VEGF Agents for the Prevention of Complications and Progression of Nonproliferative and Proliferative Retinopathy. Life 2023, 13, 1098. [Google Scholar] [CrossRef] [PubMed]
- Jonny, J.; Violetta, L.; Kartasasmita, A.S.; Supriyadi, R.; Rita, C. Circulating Biomarkers to Predict Diabetic Retinopathy in Patients with Diabetic Kidney Disease. Vision 2023, 7, 34. [Google Scholar] [CrossRef] [PubMed]
- Trotta, M.C.; Gesualdo, C.; Petrillo, F.; Cavasso, G.; Corte, A.D.; D’Amico, G.; Hermenean, A.; Simonelli, F.; Rossi, S. Serum Iba-1, GLUT5, and TSPO in Patients with Diabetic Retinopathy: New Biomarkers for Early Retinal Neurovascular Alterations? A Pilot Study. Transl. Vis. Sci. Technol. 2022, 11, 16. [Google Scholar] [CrossRef] [PubMed]
- Pradhan, G.; Samson, S.L.; Sun, Y. Ghrelin: Much More than a Hunger Hormone. Curr. Opin. Clin. Nutr. Metab. Care 2013, 16, 619–624. [Google Scholar] [CrossRef] [PubMed]
- Bai, J.; Yang, F.; Dong, L.; Zheng, Y. Ghrelin Protects Human Lens Epithelial Cells against Oxidative Stress-Induced Damage. Oxid. Med. Cell. Longev. 2017, 2017, 1–8. [Google Scholar] [CrossRef]
- Zhu, K.; Zhang, M.-L.; Liu, S.-T.; Li, X.-Y.; Zhong, S.-M.; Li, F.; Xu, G.-Z.; Wang, Z.; Miao, Y. Ghrelin Attenuates Retinal Neuronal Autophagy and Apoptosis in an Experimental Rat Glaucoma Model. Investig. Opthalmology Vis. Sci. 2017, 58, 6113. [Google Scholar] [CrossRef]
- Bai, J.; Yang, F.; Wang, R.; Yan, Q. Ghrelin Ameliorates Diabetic Retinal Injury: Potential Therapeutic Avenues for Diabetic Retinopathy. Oxid. Med. Cell. Longev. 2021, 2021, 1–9. [Google Scholar] [CrossRef]
- Li, R.; Yao, G.; Zhou, L.; Zhang, M.; Yan, J. The Ghrelin-GHSR-1a Pathway Inhibits High Glucose-Induced Retinal Angiogenesis in Vitro by Alleviating Endoplasmic Reticulum Stress. Eye Vis. 2022, 9, 20. [Google Scholar] [CrossRef]
- Spiridon, I.; Ciobanu, D.; Giușcă, S.; Căruntu, I. Ghrelin and Its Role in Gastrointestinal Tract Tumors (Review). Mol. Med. Rep. 2021, 24, 663. [Google Scholar] [CrossRef]
- Li, B.; Zeng, M.; Zheng, H.; Huang, C.; He, W.; Lu, G.; Li, X.; Chen, Y.; Xie, R. Effects of Ghrelin on the Apoptosis of Human Neutrophils in Vitro. Int. J. Mol. Med. 2016, 38, 794–802. [Google Scholar] [CrossRef]
- Kodama, T.; Ashitani, J.-I.; Matsumoto, N.; Kangawa, K.; Nakazato, M. Ghrelin Treatment Suppresses Neutrophil-Dominant Inflammation in Airways of Patients with Chronic Respiratory Infection. Pulm. Pharmacol. Ther. 2008, 21, 774–779. [Google Scholar] [CrossRef]
- El-Tawab, S.S.; Ibrahim, I.K.; Megallaa, M.H.; Mgeed, R.M.A.; Elemary, W.S. Neutrophil–Lymphocyte Ratio as a Reliable Marker to Predict Pre-Clinical Retinopathy among Type 2 Diabetic Patients. Egypt. Rheumatol. Rehabil. 2023, 50, 11. [Google Scholar] [CrossRef]
- Njeim, R.; Azar, W.S.; Fares, A.H.; Azar, S.T.; Kfoury Kassouf, H.; Eid, A.A. NETosis Contributes to the Pathogenesis of Diabetes and Its Complications. J. Mol. Endocrinol. 2020, 65, R65–R76. [Google Scholar] [CrossRef]
- Zhu, Y.; Xia, X.; He, Q.; Xiao, Q.-A.; Wang, D.; Huang, M.; Zhang, X. Diabetes-Associated Neutrophil NETosis: Pathogenesis and Interventional Target of Diabetic Complications. Front. Endocrinol. 2023, 14, 1202463. [Google Scholar] [CrossRef]
- Wang, L.; Zhou, X.; Yin, Y.; Mai, Y.; Wang, D.; Zhang, X. Hyperglycemia Induces Neutrophil Extracellular Traps Formation Through an NADPH Oxidase-Dependent Pathway in Diabetic Retinopathy. Front. Immunol. 2019, 9, 3076. [Google Scholar] [CrossRef]
- Shafqat, A.; Abdul Rab, S.; Ammar, O.; Al Salameh, S.; Alkhudairi, A.; Kashir, J.; Alkattan, K.; Yaqinuddin, A. Emerging Role of Neutrophil Extracellular Traps in the Complications of Diabetes Mellitus. Front. Med. 2022, 9, 995993. [Google Scholar] [CrossRef] [PubMed]
- Lessieur, E.M.; Liu, H.; Saadane, A.; Du, Y.; Tang, J.; Kiser, J.; Kern, T.S. Neutrophil-Derived Proteases Contribute to the Pathogenesis of Early Diabetic Retinopathy. Investig. Opthalmology Vis. Sci. 2021, 62, 7. [Google Scholar] [CrossRef] [PubMed]
- Liu, H.; Lessieur, E.M.; Saadane, A.; Lindstrom, S.I.; Taylor, P.R.; Kern, T.S. Neutrophil Elastase Contributes to the Pathological Vascular Permeability Characteristic of Diabetic Retinopathy. Diabetologia 2019, 62, 2365–2374. [Google Scholar] [CrossRef]
- Gross, J.D.; Zhou, Y.; Barak, L.S.; Caron, M.G. Ghrelin Receptor Signaling in Health and Disease: A Biased View. Trends Endocrinol. Metab. 2023, 34, 106–118. [Google Scholar] [CrossRef]
- Al Massadi, O.; López, M.; Tschöp, M.; Diéguez, C.; Nogueiras, R. Current Understanding of the Hypothalamic Ghrelin Pathways Inducing Appetite and Adiposity. Trends Neurosci. 2017, 40, 167–180. [Google Scholar] [CrossRef]
- Li, J.; Huang, P.; Xiong, J.; Liang, X.; Li, M.; Ke, H.; Chen, C.; Han, Y.; Huang, Y.; Zhou, Y.; et al. Serum Levels of Ghrelin and LEAP2 in Patients with Type 2 Diabetes Mellitus: Correlation with Circulating Glucose and Lipids. Endocr. Connect. 2022, 11, e220012. [Google Scholar] [CrossRef]
- Sovetkina, A.; Nadir, R.; Fung, J.N.M.; Nadjarpour, A.; Beddoe, B. The Physiological Role of Ghrelin in the Regulation of Energy and Glucose Homeostasis. Cureus 2020. [Google Scholar] [CrossRef] [PubMed]
- Zakhari, J.S.; Zorrilla, E.P.; Zhou, B.; Mayorov, A.V.; Janda, K.D. Oligoclonal Antibody Targeting Ghrelin Increases Energy Expenditure and Reduces Food Intake in Fasted Mice. Mol. Pharm. 2012, 9, 281–289. [Google Scholar] [CrossRef] [PubMed]
- Mao, Y.; Tokudome, T.; Otani, K.; Kishimoto, I.; Nakanishi, M.; Hosoda, H.; Miyazato, M.; Kangawa, K. Ghrelin Prevents Incidence of Malignant Arrhythmia after Acute Myocardial Infarction through Vagal Afferent Nerves. Endocrinology 2012, 153, 3426–3434. [Google Scholar] [CrossRef]
- Cao, S.S.; Kaufman, R.J. Endoplasmic Reticulum Stress and Oxidative Stress in Cell Fate Decision and Human Disease. Antioxid. Redox Signal. 2014, 21, 396–413. [Google Scholar] [CrossRef]
- Sugiyama, M.; Yamaki, A.; Furuya, M.; Inomata, N.; Minamitake, Y.; Ohsuye, K.; Kangawa, K. Ghrelin Improves Body Weight Loss and Skeletal Muscle Catabolism Associated with Angiotensin II-Induced Cachexia in Mice. Regul. Pept. 2012, 178, 21–28. [Google Scholar] [CrossRef] [PubMed]
- Porporato, P.E.; Filigheddu, N.; Reano, S.; Ferrara, M.; Angelino, E.; Gnocchi, V.F.; Prodam, F.; Ronchi, G.; Fagoonee, S.; Fornaro, M.; et al. Acylated and Unacylated Ghrelin Impair Skeletal Muscle Atrophy in Mice. J. Clin. Invest. 2013, JCI39920. [Google Scholar] [CrossRef]
- McLarnon, A. Age-Dependent Balance of Leptin and Ghrelin Regulates Bone Metabolism. Nat. Rev. Endocrinol. 2012, 8, 504–504. [Google Scholar] [CrossRef]
- Napoli, N.; Pedone, C.; Pozzilli, P.; Lauretani, F.; Bandinelli, S.; Ferrucci, L.; Incalzi, R.A. Effect of Ghrelin on Bone Mass Density: The InChianti Study. Bone 2011, 49, 257–263. [Google Scholar] [CrossRef]
- Gesualdo, C.; Balta, C.; Platania, C.B.M.; Trotta, M.C.; Herman, H.; Gharbia, S.; Rosu, M.; Petrillo, F.; Giunta, S.; Della Corte, A.; et al. Fingolimod and Diabetic Retinopathy: A Drug Repurposing Study. Front. Pharmacol. 2021, 12, 718902. [Google Scholar] [CrossRef]
- Perais, J.; Agarwal, R.; Evans, J.R.; Loveman, E.; Colquitt, J.L.; Owens, D.; Hogg, R.E.; Lawrenson, J.G.; Takwoingi, Y.; Lois, N. Prognostic Factors for the Development and Progression of Proliferative Diabetic Retinopathy in People with Diabetic Retinopathy. Cochrane Database Syst. Rev. 2023, 2023. [Google Scholar] [CrossRef]
- Pöykkö, S.M.; Kellokoski, E.; Hörkkö, S.; Kauma, H.; Kesäniemi, Y.A.; Ukkola, O. Low Plasma Ghrelin Is Associated With Insulin Resistance, Hypertension, and the Prevalence of Type 2 Diabetes. Diabetes 2003, 52, 2546–2553. [Google Scholar] [CrossRef]
- Lindqvist, A.; Shcherbina, L.; Prasad, R.B.; Miskelly, M.G.; Abels, M.; Martínez-Lopéz, J.A.; Fred, R.G.; Nergård, B.J.; Hedenbro, J.; Groop, L.; et al. Ghrelin Suppresses Insulin Secretion in Human Islets and Type 2 Diabetes Patients Have Diminished Islet Ghrelin Cell Number and Lower Plasma Ghrelin Levels. Mol. Cell. Endocrinol. 2020, 511, 110835. [Google Scholar] [CrossRef] [PubMed]
- Østergård, T.; Hansen, T.; Nyholm, B.; Gravholt, C.; Djurhuus, C.; Hosoda, H.; Kangawa, K.; Schmitz, O. Circulating Ghrelin Concentrations Are Reduced in Healthy Offspring of Type 2 Diabetic Subjects, and Are Increased in Women Independent of a Family History of Type 2 Diabetes. Diabetologia 2003, 46, 134–136. [Google Scholar] [CrossRef] [PubMed]
- Katsuki, A.; Urakawa, H.; Gabazza, E.; Murashima, S.; Nakatani, K.; Togashi, K.; Yano, Y.; Adachi, Y.; Sumida, Y. Circulating Levels of Active Ghrelin Is Associated with Abdominal Adiposity, Hyperinsulinemia and Insulin Resistance in Patients with Type 2 Diabetes Mellitus. Eur. J. Endocrinol. 2004, 573–577. [Google Scholar] [CrossRef]
- Ueno, H.; Shiiya, T.; Mizuta, M.; Mondal, M.; Nakazato, M. Plasma Ghrelin Concentrations in Different Clinical Stages of Diabetic Complications and Glycemic Control in Japanese Diabetics. Endocr. J. 2007, 54, 895–902. [Google Scholar] [CrossRef] [PubMed]
- Müller, T.D.; Nogueiras, R.; Andermann, M.L.; Andrews, Z.B.; Anker, S.D.; Argente, J.; Batterham, R.L.; Benoit, S.C.; Bowers, C.Y.; Broglio, F.; et al. Ghrelin. Mol. Metab. 2015, 4, 437–460. [Google Scholar] [CrossRef]
- Ariyasu, H.; Takaya, K.; Tagami, T.; Ogawa, Y.; Hosoda, K.; Akamizu, T.; Suda, M.; Koh, T.; Natsui, K.; Toyooka, S.; et al. Stomach Is a Major Source of Circulating Ghrelin, and Feeding State Determines Plasma Ghrelin-Like Immunoreactivity Levels in Humans. J. Clin. Endocrinol. Metab. 2001, 86, 4753–4758. [Google Scholar] [CrossRef]
- Chen, V.P.; Gao, Y.; Geng, L.; Brimijoin, S. Butyrylcholinesterase Regulates Central Ghrelin Signaling and Has an Impact on Food Intake and Glucose Homeostasis. Int. J. Obes. 2017, 41, 1413–1419. [Google Scholar] [CrossRef]
- Satou, M.; Nishi, Y.; Yoh, J.; Hattori, Y.; Sugimoto, H. Identification and Characterization of Acyl-Protein Thioesterase 1/Lysophospholipase I As a Ghrelin Deacylation/Lysophospholipid Hydrolyzing Enzyme in Fetal Bovine Serum and Conditioned Medium. Endocrinology 2010, 151, 4765–4775. [Google Scholar] [CrossRef]
- Zang, P.; Yang, C.-H.; Liu, J.; Lei, H.-Y.; Wang, W.; Guo, Q.-Y.; Lu, B.; Shao, J.-Q. Relationship Between Acyl and Desacyl Ghrelin Levels with Insulin Resistance and Body Fat Mass in Type 2 Diabetes Mellitus. Diabetes Metab. Syndr. Obes. Targets Ther. 2022, 15, 2763–2770. [Google Scholar] [CrossRef]
- Reich, N.; Hölscher, C. Acylated Ghrelin as a Multi-Targeted Therapy for Alzheimer’s and Parkinson’s Disease. Front. Neurosci. 2020, 14, 614828. [Google Scholar] [CrossRef]
- Araújo, C.O.D.; Montenegro, R.M.; Pedroso, A.P.; Fernandes, V.O.; Montenegro, A.P.D.R.; De Carvalho, A.B.; Oyama, L.M.; Maia, C.S.C.; Ribeiro, E.B. Altered Acylated Ghrelin Response to Food Intake in Congenital Generalized Lipodystrophy. PLoS ONE 2021, 16, e0244667. [Google Scholar] [CrossRef]
- Shati, A.A.; Khalil, M.A. Acylated Ghrelin Suppresses Doxorubicin-Induced Testicular Damage and Improves Sperm Parameters in Rats via Activation of Nrf2 and Mammalian Target of Rapamycin. J. Cancer Res. Ther. 2023, 19, 1194–1205. [Google Scholar] [CrossRef]
- Lund, L.H.; Hage, C.; Pironti, G.; Thorvaldsen, T.; Ljung-Faxén, U.; Zabarovskaja, S.; Shahgaldi, K.; Webb, D.-L.; Hellström, P.M.; Andersson, D.C.; et al. Acyl Ghrelin Improves Cardiac Function in Heart Failure and Increases Fractional Shortening in Cardiomyocytes without Calcium Mobilization. Eur. Heart J. 2023, 44, 2009–2025. [Google Scholar] [CrossRef] [PubMed]
- Hattori, N. Expression, Regulation and Biological Actions of Growth Hormone (GH) and Ghrelin in the Immune System. Growth Horm. IGF Res. 2009, 19, 187–197. [Google Scholar] [CrossRef] [PubMed]
- Hattori, N.; Saito, T.; Yagyu, T.; Jiang, B.-H.; Kitagawa, K.; Inagaki, C. GH, GH Receptor, GH Secretagogue Receptor, and Ghrelin Expression in Human T Cells, B Cells, and Neutrophils. J. Clin. Endocrinol. Metab. 2001, 86, 4284–4291. [Google Scholar] [CrossRef]
- Kaštelan, S.; Tomić, M.; Gverović Antunica, A.; Salopek Rabatić, J.; Ljubić, S. Inflammation and Pharmacological Treatment in Diabetic Retinopathy. Mediators Inflamm. 2013, 2013, 1–8. [Google Scholar] [CrossRef] [PubMed]
- Youssef Moursy, E. Relationship Between Neutrophil-Lymphocyte Ratio and Microvascular Complications in Egyptian Patients with Type 2 Diabetes. Am. J. Intern. Med. 2015, 3, 250. [Google Scholar] [CrossRef]
- Woo, S.J.; Ahn, S.J.; Ahn, J.; Park, K.H.; Lee, K. Elevated Systemic Neutrophil Count in Diabetic Retinopathy and Diabetes: A Hospital-Based Cross-Sectional Study of 30,793 Korean Subjects. Investig. Opthalmology Vis. Sci. 2011, 52, 7697. [Google Scholar] [CrossRef] [PubMed]
- Socorro Faria, S.; Fernandes Jr, P.C.; Barbosa Silva, M.J.; Lima, V.C.; Fontes, W.; Freitas-Junior, R.; Eterovic, A.K.; Forget, P. The Neutrophil-to-Lymphocyte Ratio: A Narrative Review. ecancermedicalscience 2016, 10. [Google Scholar] [CrossRef] [PubMed]
- Duman, T.T.; Aktas, G.; Atak, B.M.; Kocak, M.Z.; Erkus, E.; Savli, H. Neutrophil to Lymphocyte Ratio as an Indicative of Diabetic Control Level in Type 2 Diabetes Mellitus. Afr. Health Sci. 2019, 19, 1602. [Google Scholar] [CrossRef]
- Ulu, S.M.; Dogan, M.; Ahsen, A.; Altug, A.; Demir, K.; Acartürk, G.; Inan, S. Neutrophil-to-Lymphocyte Ratio as a Quick and Reliable Predictive Marker to Diagnose the Severity of Diabetic Retinopathy. Diabetes Technol. Ther. 2013, 15, 942–947. [Google Scholar] [CrossRef]
- Wang, R.; Zhang, J.; Li, Y.; Liu, T.; Yu, K. Neutrophil–Lymphocyte Ratio Is Associated with Arterial Stiffness in Diabetic Retinopathy in Type 2 Diabetes. J. Diabetes Complications 2015, 29, 245–249. [Google Scholar] [CrossRef]
- Liu, J.; Liu, X.; Li, Y.; Quan, J.; Wei, S.; An, S.; Yang, R.; Liu, J. The Association of Neutrophil to Lymphocyte Ratio, Mean Platelet Volume, and Platelet Distribution Width with Diabetic Retinopathy and Nephropathy: A Meta-Analysis. Biosci. Rep. 2018, 38, BSR20180172. [Google Scholar] [CrossRef]
- Imazu, Y.; Yanagi, S.; Miyoshi, K.; Tsubouchi, H.; Yamashita, S.; Matsumoto, N.; Ashitani, J.; Kangawa, K.; Nakazato, M. Ghrelin Ameliorates Bleomycin-Induced Acute Lung Injury by Protecting Alveolar Epithelial Cells and Suppressing Lung Inflammation. Eur. J. Pharmacol. 2011, 672, 153–158. [Google Scholar] [CrossRef]
- Jia, S.H.; Parodo, J.; Kapus, A.; Rotstein, O.D.; Marshall, J.C. Dynamic Regulation of Neutrophil Survival through Tyrosine Phosphorylation or Dephosphorylation of Caspase-8. J. Biol. Chem. 2008, 283, 5402–5413. [Google Scholar] [CrossRef]
- Baatar, D.; Patel, K.; Taub, D.D. The Effects of Ghrelin on Inflammation and the Immune System. Mol. Cell. Endocrinol. 2011, 340, 44–58. [Google Scholar] [CrossRef]
- Dixit, V.D.; Taub, D.D. Ghrelin and Immunity: A Young Player in an Old Field. Exp. Gerontol. 2005, 40, 900–910. [Google Scholar] [CrossRef] [PubMed]
- Chang, L.; Zhao, J.; Yang, J.; Zhang, Z.; Du, J.; Tang, C. Therapeutic Effects of Ghrelin on Endotoxic Shock in Rats. Eur. J. Pharmacol. 2003, 473, 171–176. [Google Scholar] [CrossRef] [PubMed]
- Wu, R.; Dong, W.; Zhou, M.; Zhang, F.; Marini, C.P.; Ravikumar, T.S.; Wang, P. Ghrelin Attenuates Sepsis-Induced Acute Lung Injury and Mortality in Rats. Am. J. Respir. Crit. Care Med. 2007, 176, 805–813. [Google Scholar] [CrossRef]
- Granado, M.; Priego, T.; Martín, A.I.; Villanúa, M.Á.; López-Calderón, A. Anti-Inflammatory Effect of the Ghrelin Agonist Growth Hormone-Releasing Peptide-2 (GHRP-2) in Arthritic Rats. Am. J. Physiol.-Endocrinol. Metab. 2005, 288, E486–E492. [Google Scholar] [CrossRef] [PubMed]
- Delgado-Rizo, V.; Martínez-Guzmán, M.A.; Iñiguez-Gutierrez, L.; García-Orozco, A.; Alvarado-Navarro, A.; Fafutis-Morris, M. Neutrophil Extracellular Traps and Its Implications in Inflammation: An Overview. Front. Immunol. 2017, 8. [Google Scholar] [CrossRef]
- Vorobjeva, N.V.; Chernyak, B.V. NETosis: Molecular Mechanisms, Role in Physiology and Pathology. Biochem. Mosc. 2020, 85, 1178–1190. [Google Scholar] [CrossRef]
- Huang, J.; Hong, W.; Wan, M.; Zheng, L. Molecular Mechanisms and Therapeutic Target of NETosis in Diseases. MedComm 2022, 3, e162. [Google Scholar] [CrossRef]
- Papayannopoulos, V. Neutrophil Extracellular Traps in Immunity and Disease. Nat. Rev. Immunol. 2018, 18, 134–147. [Google Scholar] [CrossRef]
- Zhou, Y.; Xu, Z.; Liu, Z. Impact of Neutrophil Extracellular Traps on Thrombosis Formation: New Findings and Future Perspective. Front. Cell. Infect. Microbiol. 2022, 12, 910908. [Google Scholar] [CrossRef]
- Zhou, J.; Guo, P.; Hao, X.; Sun, X.; Feng, H.; Chen, Z. Neutrophil Extracellular Traps (NETs): A New Therapeutic Target for Neuroinflammation and Microthrombosis After Subarachnoid Hemorrhage? Transl. Stroke Res. 2023, 14, 443–445. [Google Scholar] [CrossRef]
- Murugesan, N.; Üstunkaya, T.; Feener, E. Thrombosis and Hemorrhage in Diabetic Retinopathy: A Perspective from an Inflammatory Standpoint. Semin. Thromb. Hemost. 2015, 41, 659–664. [Google Scholar] [CrossRef] [PubMed]
- Cho, E.H.; Park, S.-J.; Han, S.; Song, J.H.; Lee, K.; Chung, Y.-R. Potent Oral Hypoglycemic Agents for Microvascular Complication: Sodium-Glucose Cotransporter 2 Inhibitors for Diabetic Retinopathy. J. Diabetes Res. 2018, 2018, 1–7. [Google Scholar] [CrossRef] [PubMed]
- San Francisco, CA: American Academy of Ophthalmology Preferred Practice Pattern® Guidelines. Diabetic Retinopathy. 2014.
- Liu, X.; Guo, Y.; Li, Z.; Gong, Y. The Role of Acylated Ghrelin and Unacylated Ghrelin in the Blood and Hypothalamus and Their Interaction with Nonalcoholic Fatty Liver Disease. Iran. J. Basic Med. Sci. 2020, 23. [Google Scholar] [CrossRef]
Figure 1.
Serum levels of (A) total ghrelin (TG, pg/mL ± SD), (B) acylated ghrelin (AG, pg/mL ± SD) and (C) des-acylated ghrelin (DAG, pg/mL ± SD) in non-diabetic subjects with absence of ocular pathologies (N = 12, CTRL); diabetic patients with no signs of diabetic retinopathy (N = 15, Diabetic); diabetic patients with non-proliferative diabetic retinopathy (N = 15, NPDR) or proliferative retinopathy (N = 15, PDR); ** P < 0.01 vs CTRL; ° P < 0.05 and °°P < 0.01 vs Diabetic; ^ P < 0.05 vs NPDR.
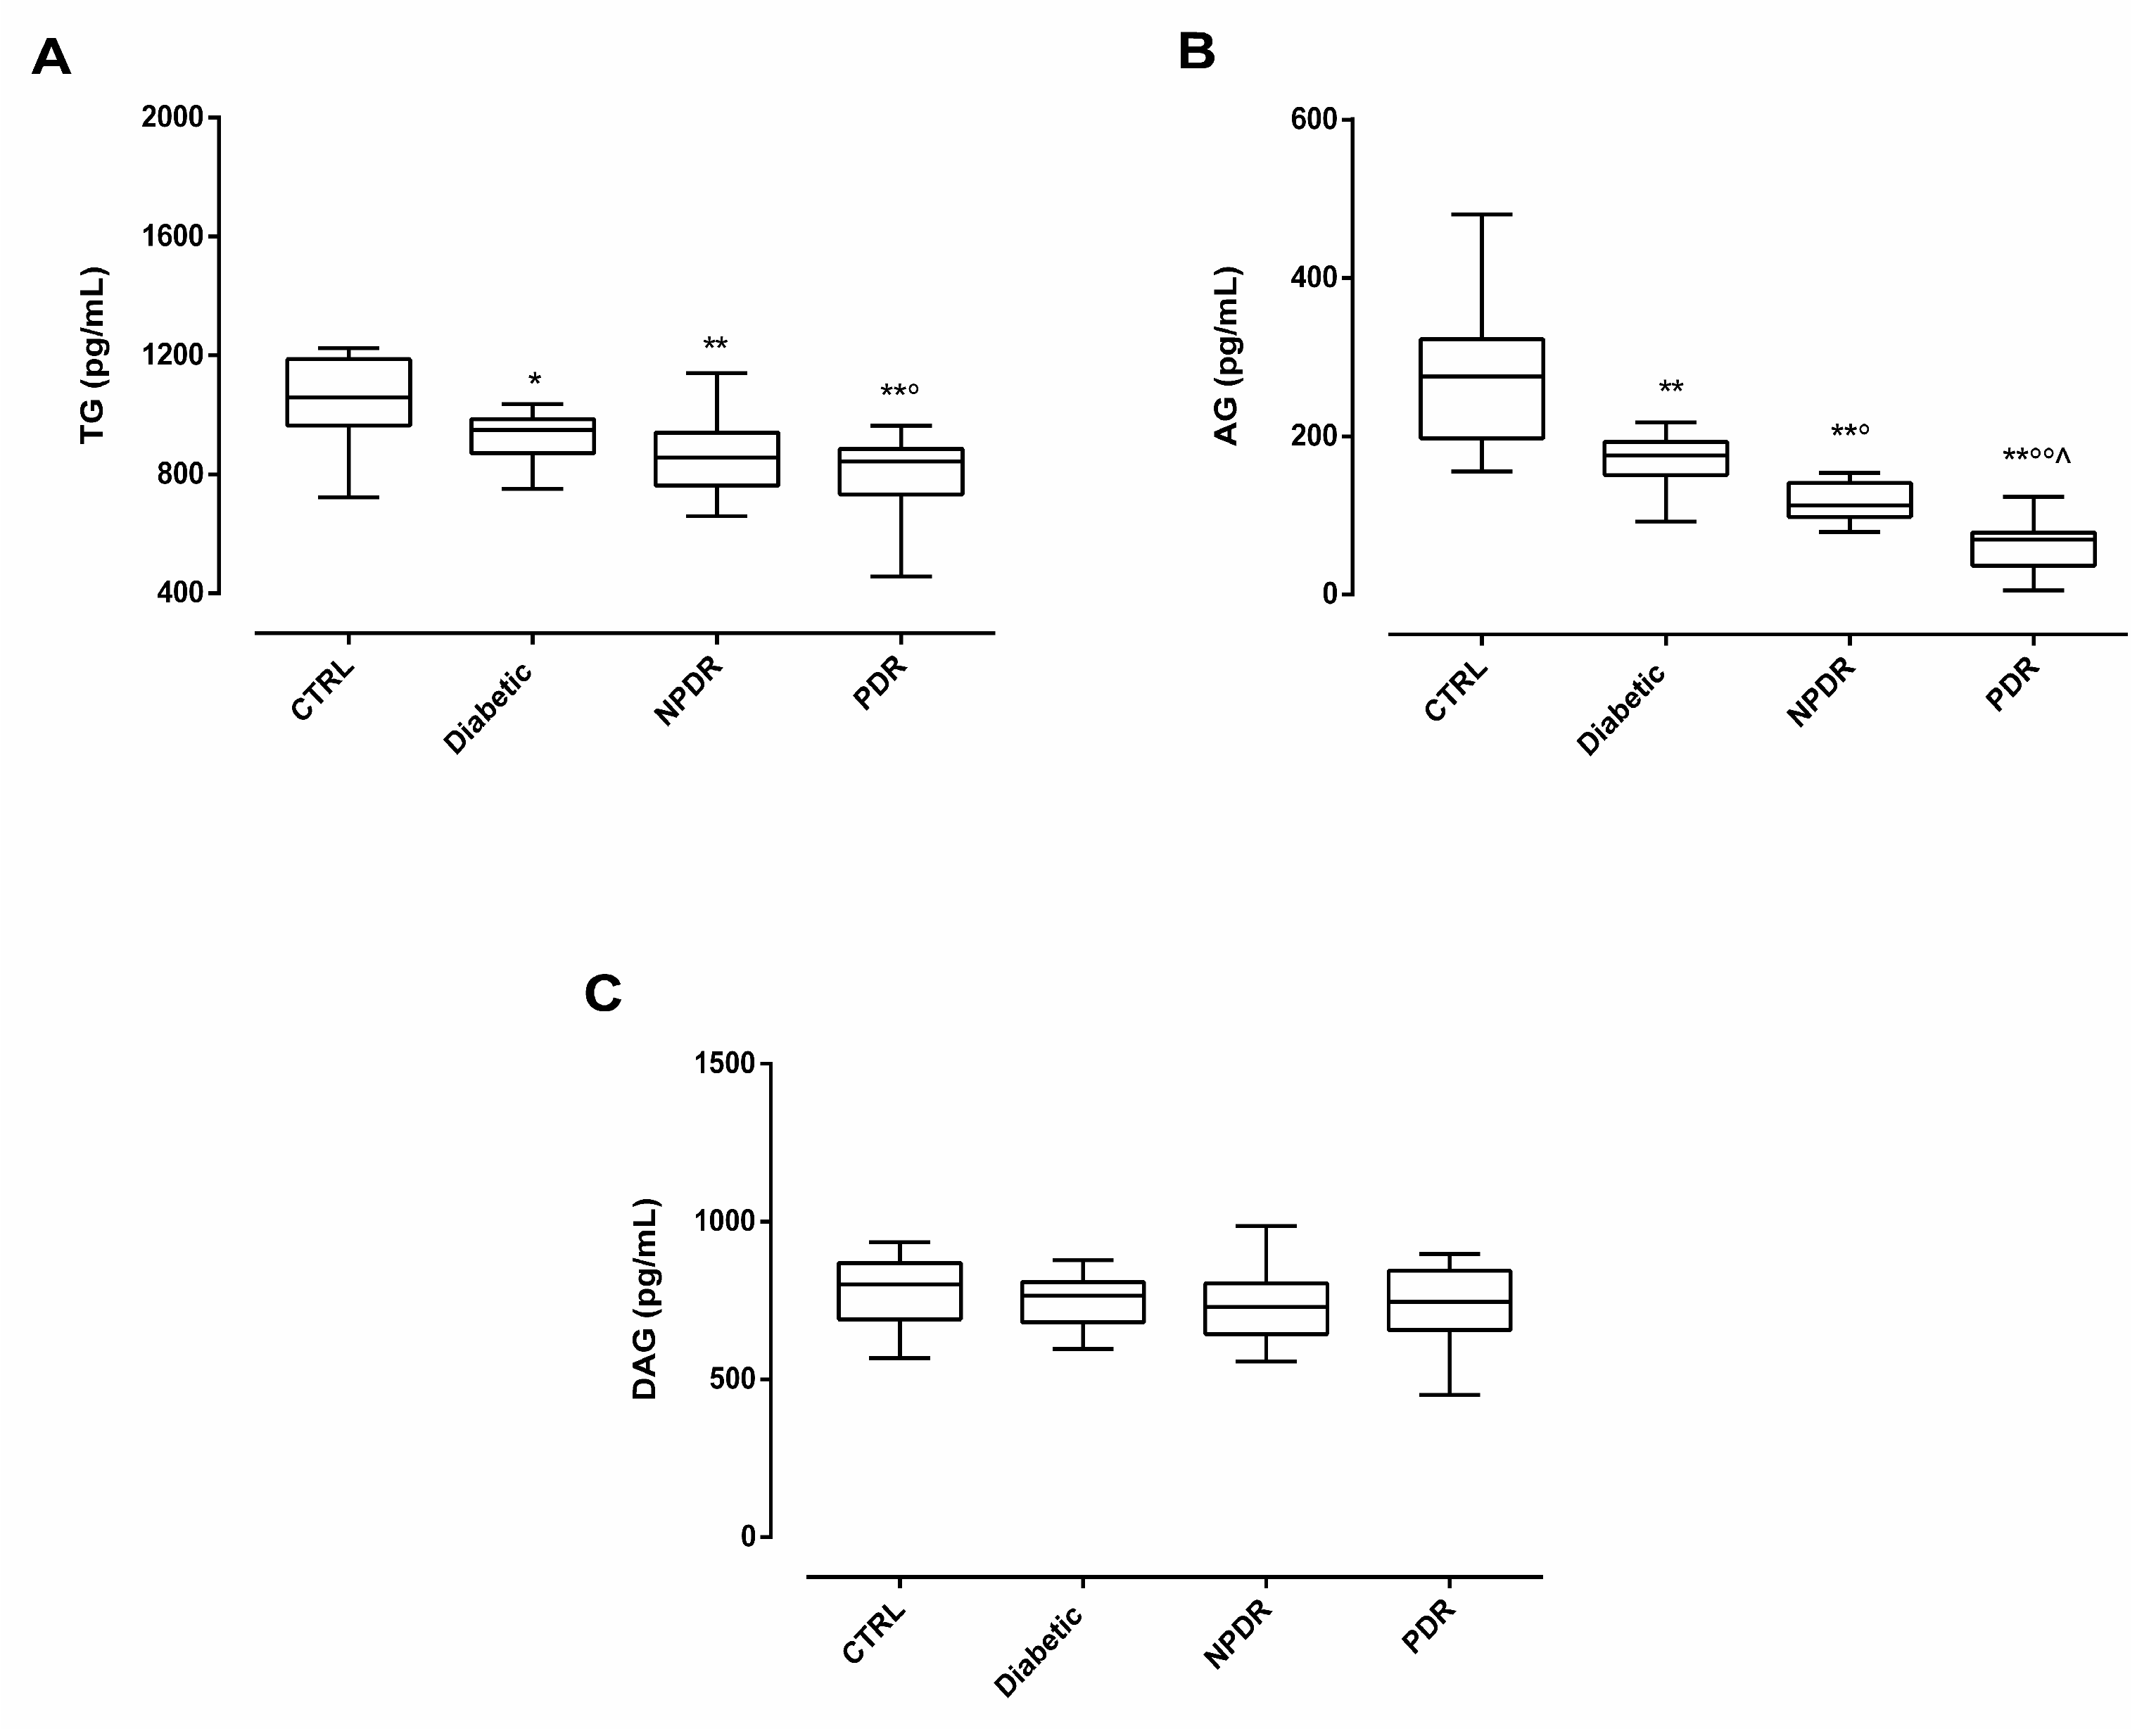
Figure 2.
(A) Serum AG/DAG ratio ± SD in non-diabetic subjects with absence of ocular pathologies (N = 12, CTRL); diabetic patients with no signs of diabetic retinopathy (N = 15, Diabetic); diabetic patients with non-proliferative diabetic retinopathy (N = 15, NPDR) or proliferative retinopathy (N = 15, PDR); (B) Representative retinography images of CTRL (normal retinal vasculature), Diabetic ( slight irregularity of the caliber and vessel course, without DR signs) NPDR (multiple microhemorrhages, microaneurysms and exudates in the macular region) and PDR groups (multiple microhemorrhages with extensive fibrovascular proliferation along the superior temporal vascular arch); (C) Pearson correlation coefficient (r = -0.83) and significance level (P < 0.01) for the correlation of AG/DAG ratio and DR progression in the 4 study groups. ** P < 0.01 vs CTRL; ° P < 0.05 and °°P < 0.01 vs Diabetic; ^ P < 0.05 vs NPDR.
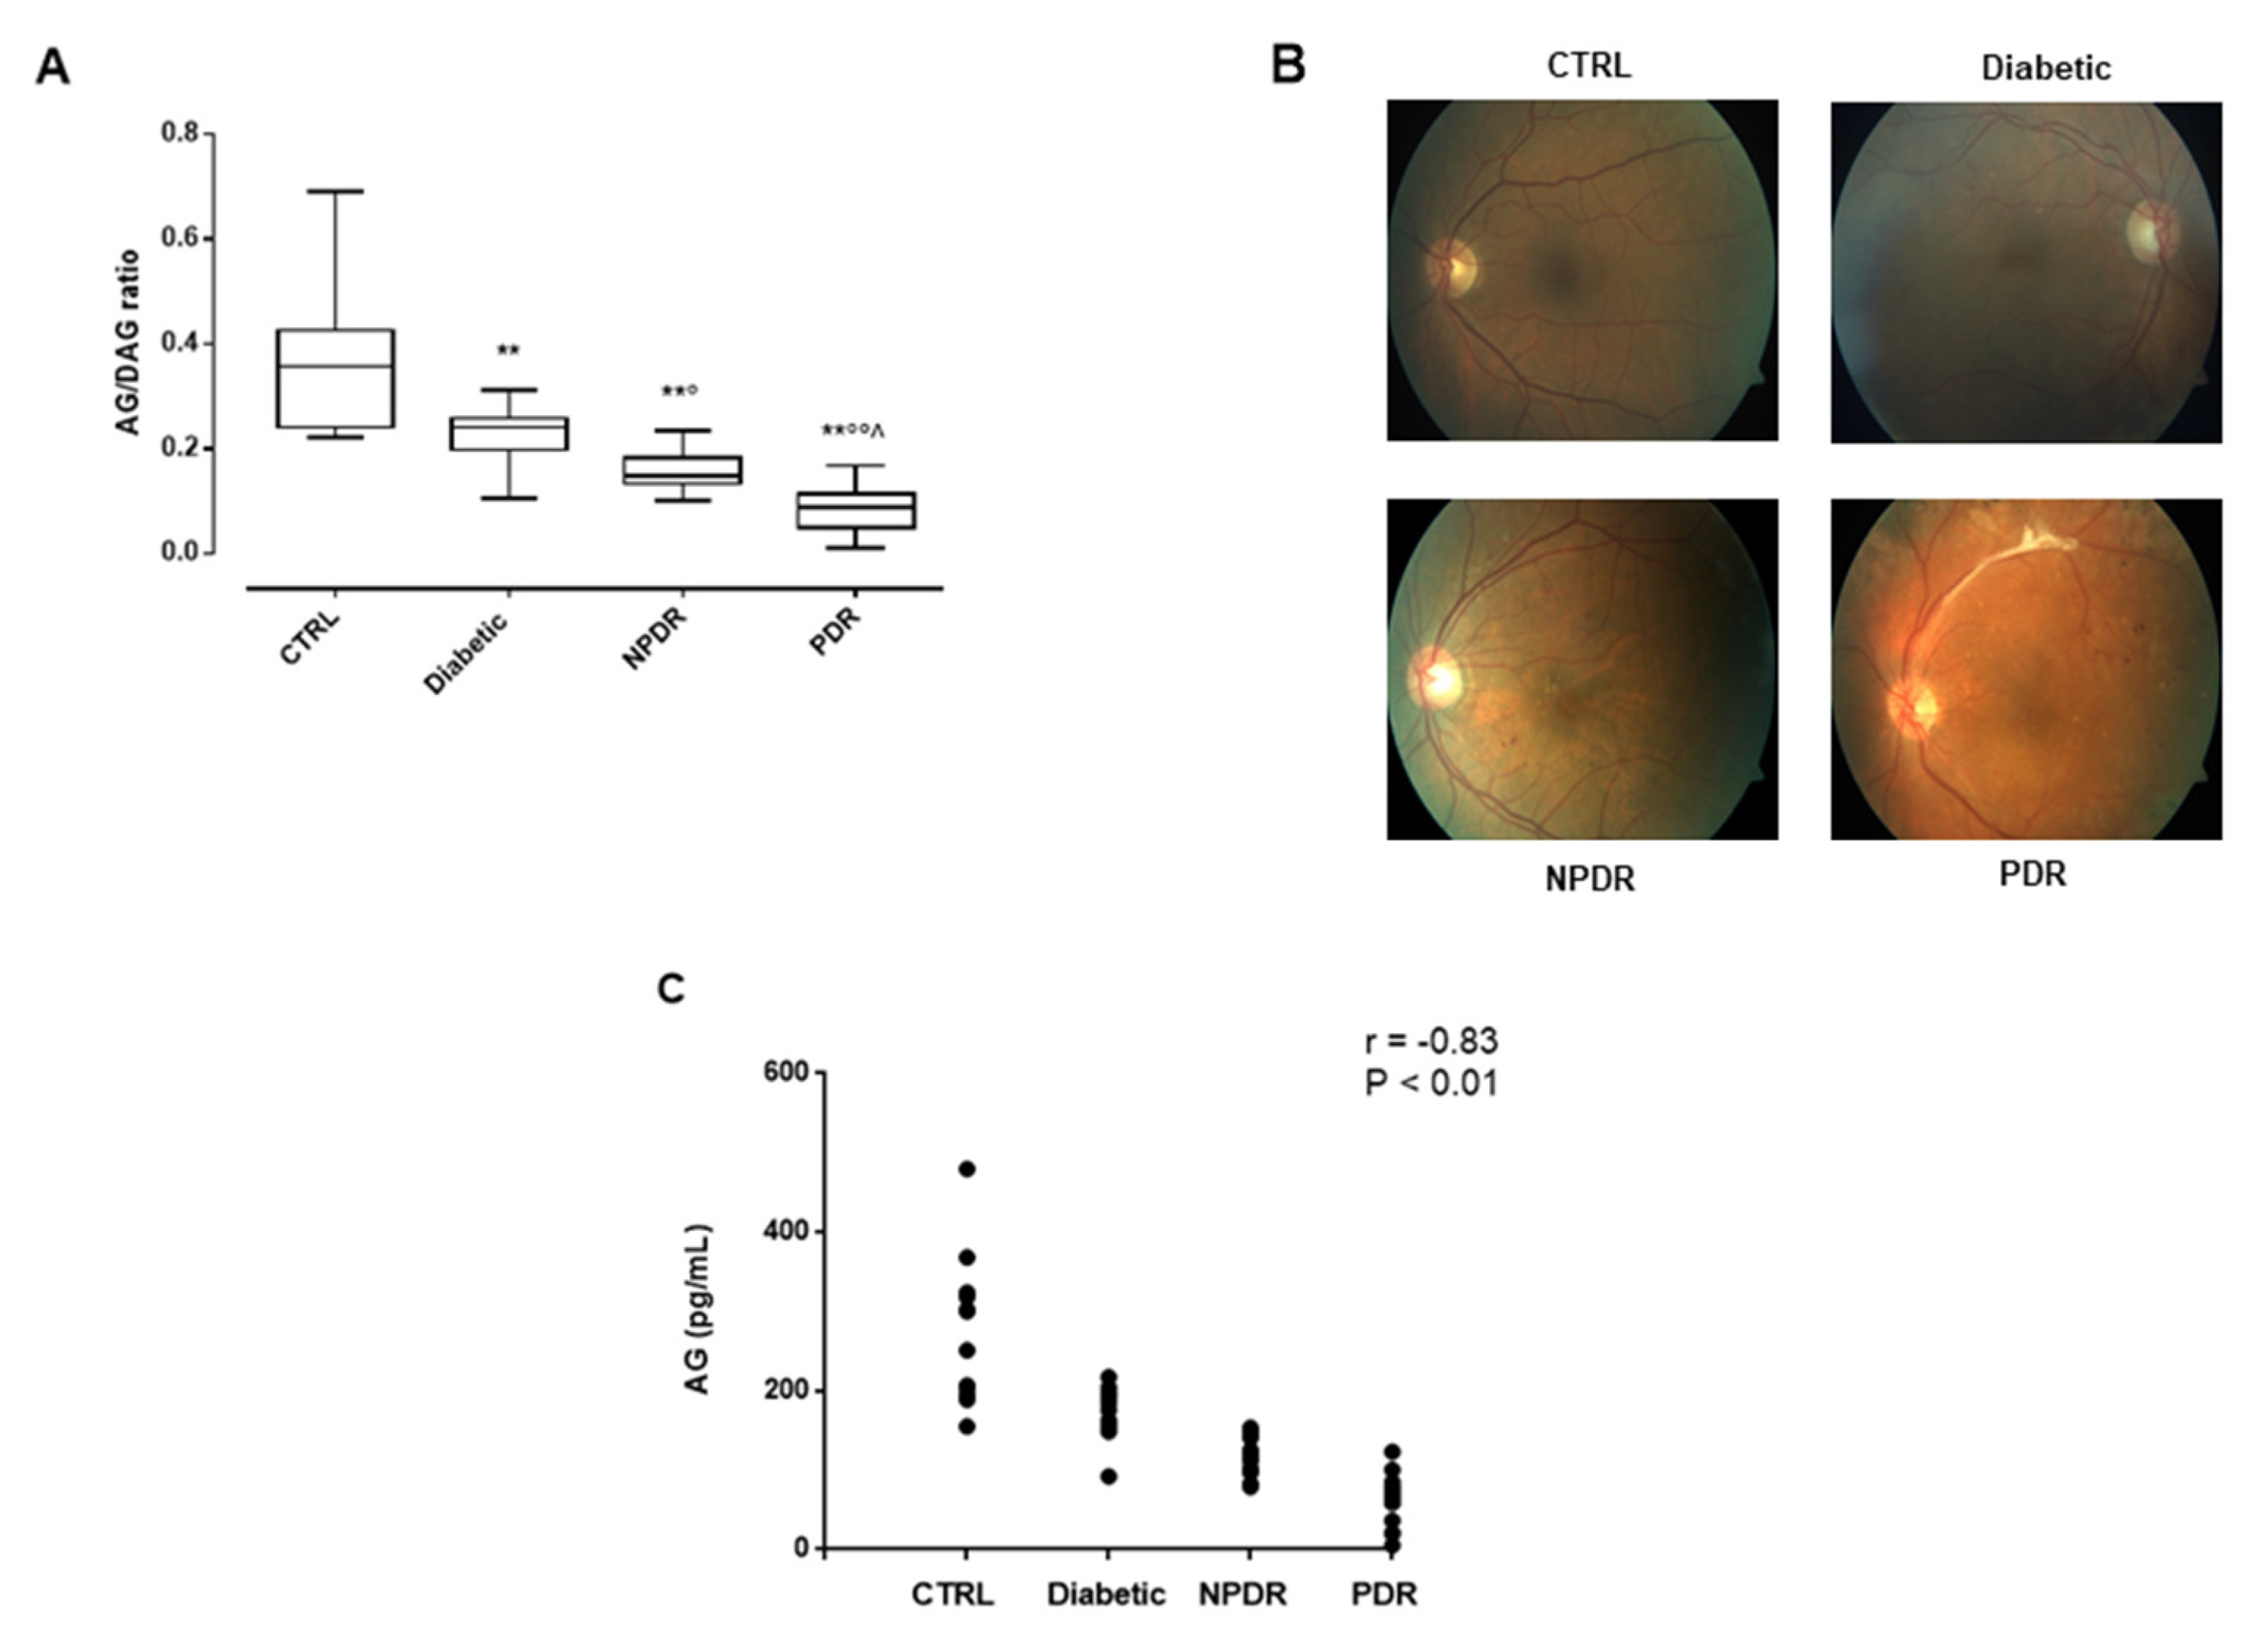
Figure 3.
(A) Pearson correlation coefficient (r) and significance level (P) for the correlation of neutrophils percentage (%) with serum AG levels (pg/mL ± SD; r = -0.74, P < 0.01) and (B) with serum NE levels (ng/mL ± SD; r = 0.80, P < 0.01) in non-diabetic subjects with absence of ocular pathologies (N = 12, CTRL); diabetic patients with no signs of diabetic retinopathy (N = 15, Diabetic); diabetic patients with non-proliferative diabetic retinopathy (N = 15, NPDR) or proliferative retinopathy (N = 15, PDR); (C) Serum NE levels (ng/mL ± SD) in the 4 groups; * P < 0.05 and ** P < 0.01 vs CTRL; °°P < 0.01 vs Diabetic; ^^ P < 0.01 vs NPDR; (D) Pearson correlation coefficient and significance level for the correlation of serum NE levels (ng/mL ± SD) with DR progression (r = 0.86, P < 0.01) and (E) with serum AG levels (pg/mL ± SD; r = -0.73, P < 0.01).
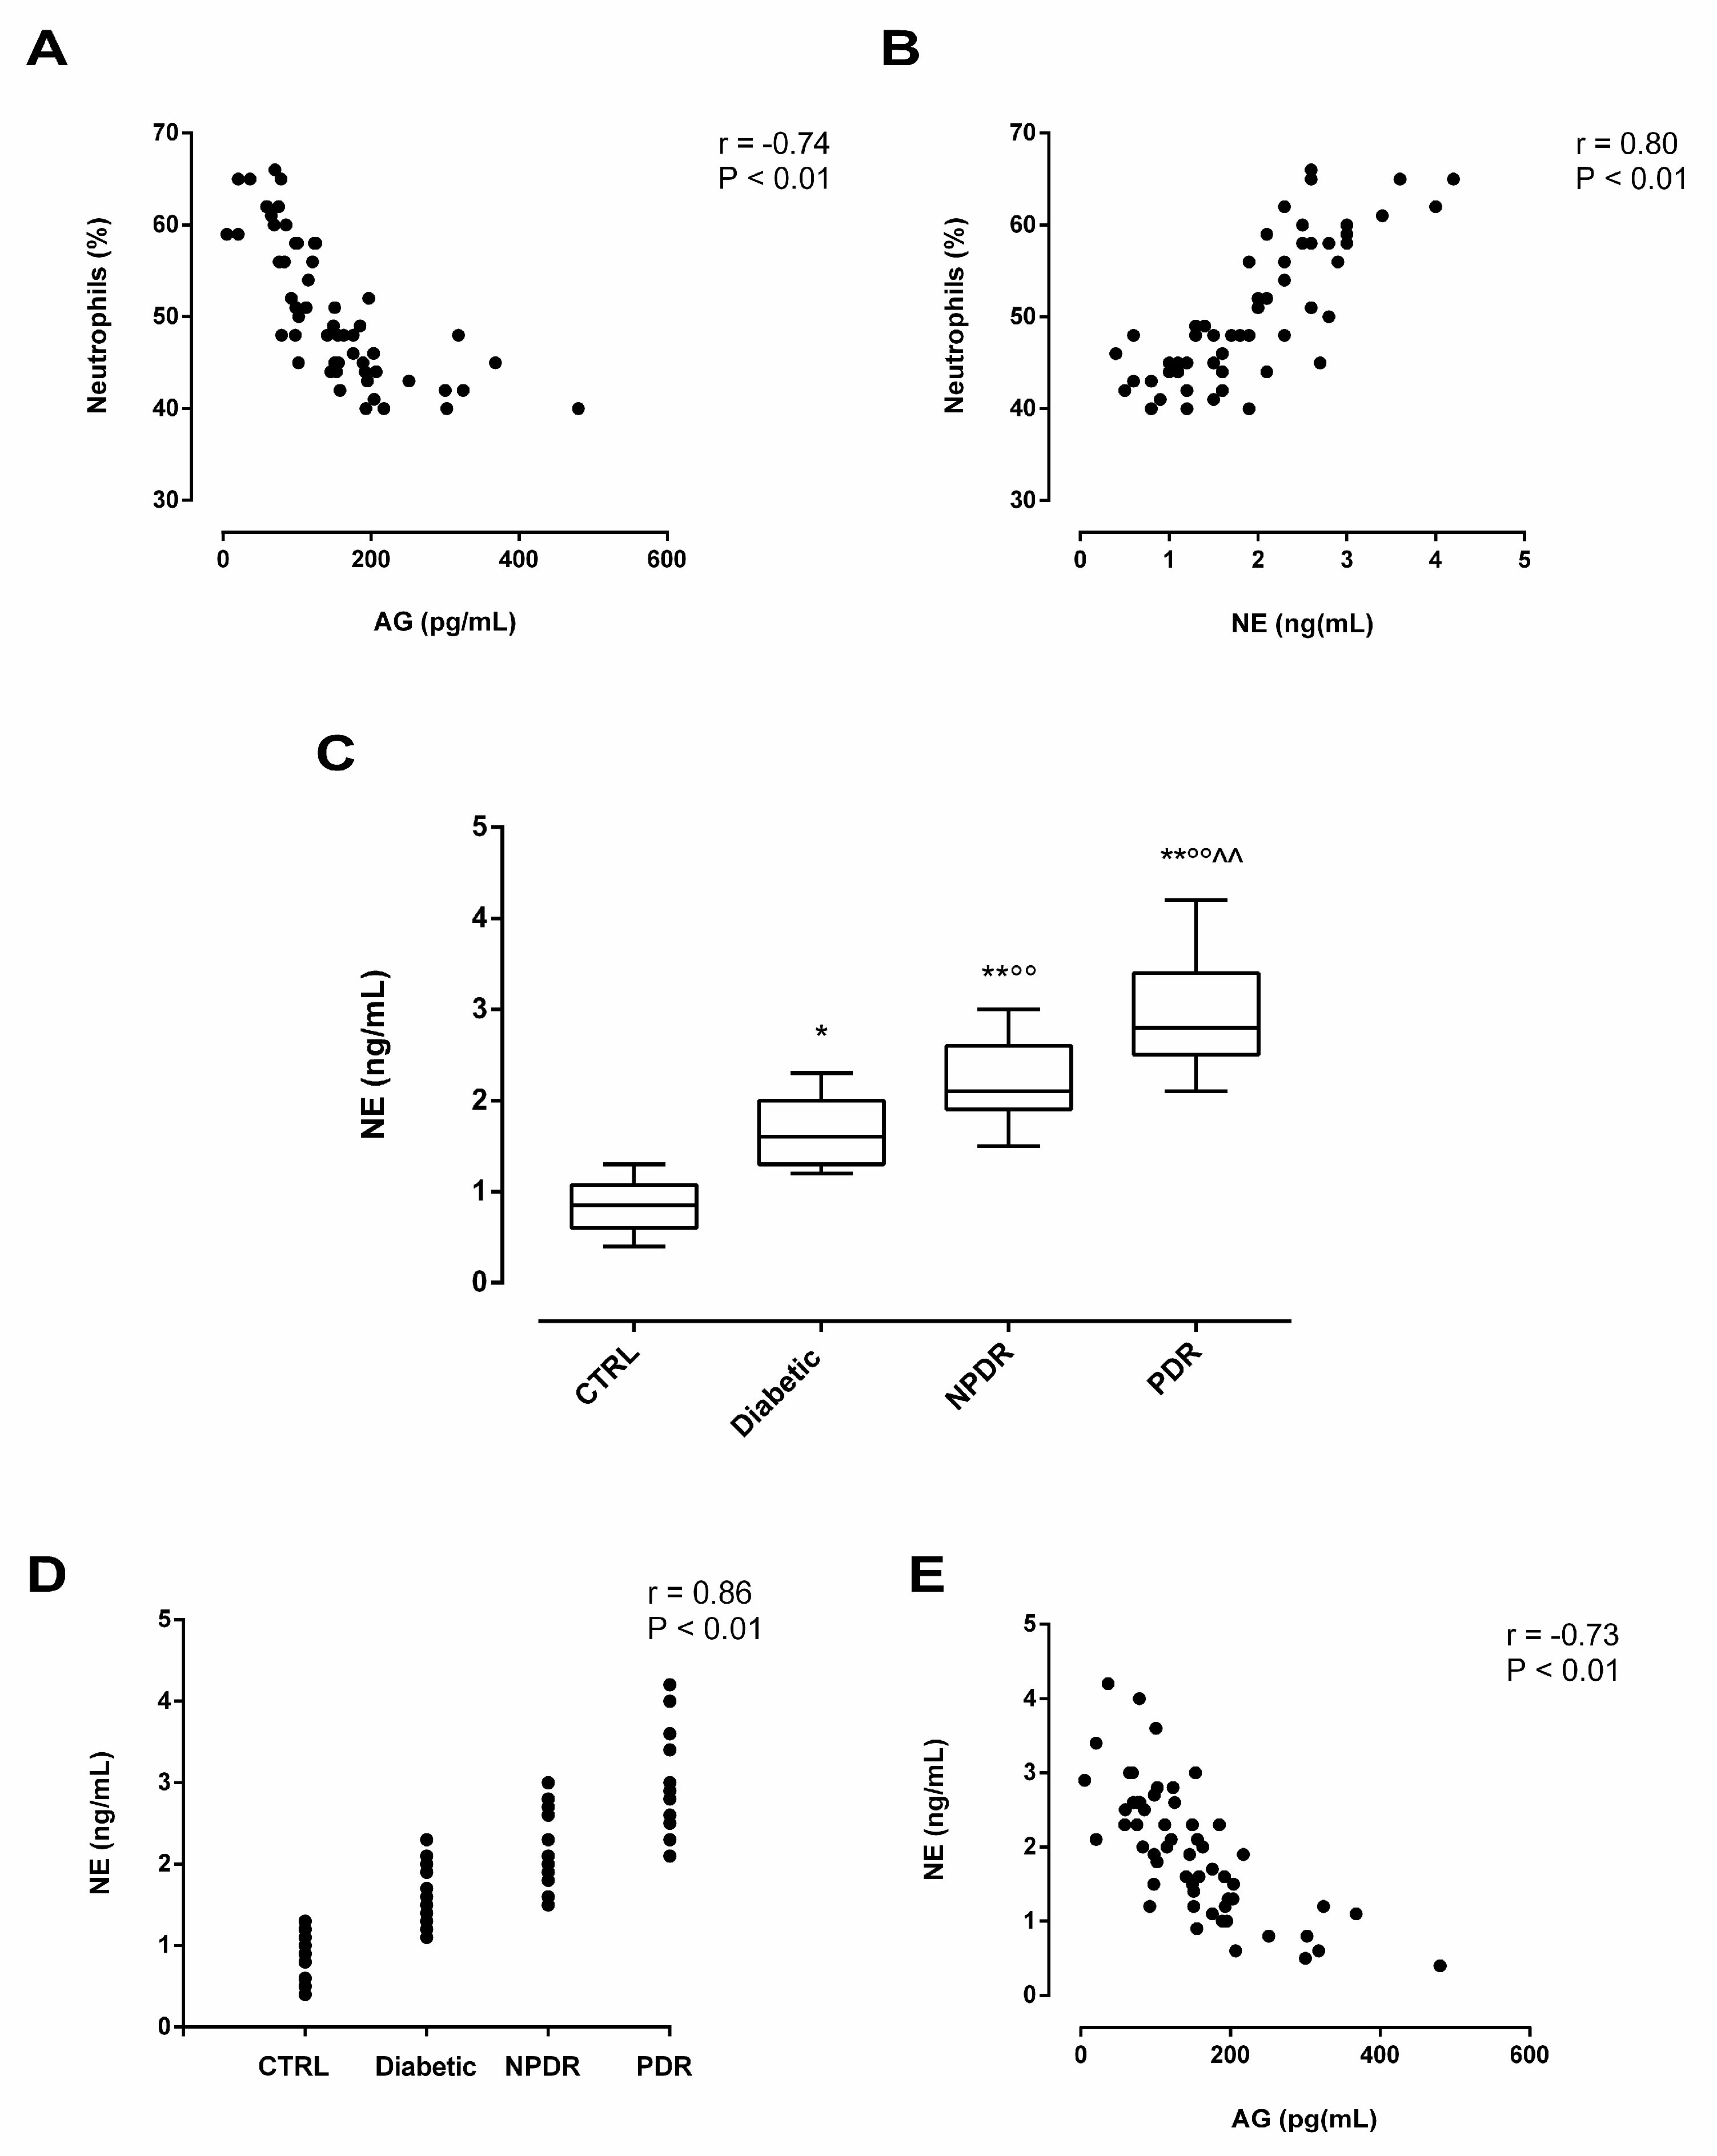

Table 1.
Clinical characteristics of CTRL, Diabetic, NPDR and PDR groups.
| CTRL | Diabetic | NPDR | PDR | |
|---|---|---|---|---|
| Female (N) | 6 | 7 | 7 | 6 |
| Male (N) | 6 | 8 | 8 | 9 |
| Mean age (years ± SD) | 64.2 ± 9 | 65.5 ± 6 | 69.9 ± 7 | 70.1 ± 5 |
| Age range (years) | 54-74 | 58-74 | 52-82 | 65-77 |
| Type I diabetes (%) | NA | 25 | 42 | 57 |
| Type II diabetes (%) | NA | 75 | 58 | 43 |
| Mean diabetes duration (years ± SD) | NA | 6.0 ± 0.8 | 6.8 ± 1 | 7.8 ± 1.1 |
| Mean time from DR diagnosis (years ± SD) |
NA | NA | 2.6 ± 0.2 | 3.1 ± 0.4 |
| Glycaemia (mg/dl) normal range (70-100 mg/dl) |
82 ± 15 | 140.2 ± 25** | 142.4 ± 20** | 200 ± 25°^ |
| Neutrophils (%± SD) normal range (40-70%) |
43.9 ± 2 | 45.4 ± 4 | 50.8 ± 5°° | 61.2 ± 3°°^^ |
NA: not applicable; CTRL: non-diabetic subjects with absence of ocular pathologies (N = 12); Diabetic: diabetic patients without DR signs (N = 15); NPDR: diabetic patients with diagnosis of non-proliferative DR (N = 15); PDR: diabetic patients with diagnosis of proliferative DR (N = 15 ). ** P < 0.01 vs CTRL; ° P < 0.05 vs Diabetic; ^ P < 0.05 vs NPDR. Control, Diabetic, NPDR, PDR.
Disclaimer/Publisher’s Note: The statements, opinions and data contained in all publications are solely those of the individual author(s) and contributor(s) and not of MDPI and/or the editor(s). MDPI and/or the editor(s) disclaim responsibility for any injury to people or property resulting from any ideas, methods, instructions or products referred to in the content. |
© 2023 by the authors. Licensee MDPI, Basel, Switzerland. This article is an open access article distributed under the terms and conditions of the Creative Commons Attribution (CC BY) license (http://creativecommons.org/licenses/by/4.0/).
Copyright: This open access article is published under a Creative Commons CC BY 4.0 license, which permit the free download, distribution, and reuse, provided that the author and preprint are cited in any reuse.


