
Submitted:
19 November 2023
Posted:
21 November 2023
You are already at the latest version
Abstract
The importance of the national security of supply has been emphasized in recent years due to the COVID-19 pandemic and changes in operating environments. Thanks to autonomy and resiliency in fuel procurement, organizations with decentralized energy plants may be able to quickly adapt to the changing needs of society. The main aim of this study was to increase the sustainability of a Finnish CHP plant's wood procurement by determining the company's profitable wood procurement region while keeping the forests renewable. The income received from the sale of energy and the costs incurred from the procurement of wood were collected from the ERP system as input data for the developed DSS. The environmental sustainability of wood procurement was assessed by considering the additional costs caused through the EEAP mechanism if the carbon sink of the forest worsened due to wood procurement in the area. The supply chains were compared so that the CHP plant managers could adopt the best energy wood value chains. The results showed that updating the procurement strategy would be necessary. The CHP plant managers should purchase energy wood from a larger procurement area than the current one and focus on roadside purchases of wood. The Techno-Economic Wood Payment Ability Model was a useful part of the DSS to guide wood buyers toward sustainable wood procurement by increasing the share of renewable forests.
Keywords:
logistics value chain
; internal pricing mechanism
; emission allowance price
; carbon sink
; renewable forest
; security of wood supply
1. Introduction
1.1. The security of energy supply
When society faces a crisis like the COVID-19 pandemic and the resulting security of supply risks, the autonomy and resilience of the organizations responsible for the logistics value chains of energy plants help decision makers to organize energy supply and fuel procurement in line with the availability of critical resources. In addition, thanks to self-sufficiency in fuel procurement, energy plants can adapt to the needs of a changing society via their operating environments. This study examines these positive operational culture changes in the post-pandemic period.
Along with the pandemic, climate change and the resulting green transition affect the important functions of society's energy sector in an unpredictable way (Figure 1). This complicates preparing for crises and planning necessary measures. From the perspective of the national security of supply, the key issues related to climate change are the energy crisis, the effects of extreme weather events on the operational reliability of infrastructure, and climate risks for forestry. The Finnish Commerce Committee pays particular attention to the energy crisis caused via the green transition, which affects the security of supply in many ways [1]. In addition, climate change increases the probability of risks related to sustainable forestry, which are reflected globally as effects that cross national borders. In this regard, the forest industry and the related energy supply are identified as critical industries.
Sufficient energy supply requires the functionality of critical logistics infrastructure. Examples of critical infrastructures are combined heat and power (CHP) plants, heat distribution networks, as well as road and rail networks, among others (Figure 2). Securing the related digital transmission and distribution systems as well as transport and storage systems is also important. A significant part of the infrastructure is managed via the integrated material and energy industry (IMEI). Therefore, the Commerce Committee considers it essential that, in a changing operating environment, the infrastructure means are further strengthened through the cooperation of authorities, research institutes, and companies of the IMEI [1]. During the development of such a techno-economic model, the capabilities of regional actors, such as municipalities, should also be considered and utilized.
Managing the green transition is a challenging task [3]. In order to manage the security of energy supply, the green transition requires competently utilizing different energy fuels. However, the green transition helps to break away from Russia's dependence on imports and, thus, improves the security of supply in the energy sector [4,5]. With the green transition, Finland has the opportunity to become energy self-sufficient. At the same time, the use of domestic fuels also creates employment. Overall, the maintenance and development of techniques and technology that support and utilize the green transition is important in terms of crisis preparedness.
According to the Finance Committee, investments in the processing, use, and storage of emission-free energy should be made, and innovations that produce new and cost-effective energy solutions should be encouraged [6]. Investments in new cost-effective technologies would strengthen Finland's competitiveness and, thus, the security of supply. However, the Finance Committee refers to the Audit Committee's statement (TrVL 4/2022 vp — VNS 8/2022 vp), stating that reducing the use of fossil fuels as part of the green transition has significant, direct, negative state financial effects, as energy taxes and the security of supply fees are currently charged mostly from fossil fuels [7]. However, in the green energy transition, the most cost-effective technologies should be identified and invested in as soon as possible [8].
Sustainable energy supply in the energy transition
The energy transition must center around sustainable energy conversion and, therefore, utilize fuels more efficiently than at present. The efficient procurement of fuels can also contribute to the green transition of energy conversion [8]. The COVID-19 pandemic showed that global fuel supply chains used by the industry are not as balanced as assumed. Moreover, geopolitical conflicts and cyber-attacks simultaneously made access to fuel difficult. Therefore, there is a need for fuel procurement processes that are more stable, resilient, and autonomous than the current ones.
From the perspective of sustainable energy conversion, the right strategic fuel procurement decisions are important in the long term. Renewable energy sources include biomass, wind, water, and the sun. In Finland, the most important renewable fuel is wood (Figure 2) [9]. Peat is also renewable, albeit very slowly. Recently, the total volume of secure stocks has been increased by starting a backup storage of energy peat, which, at the same time, expands fuel selection [10]. Special attention has been paid to securing the energy supply of district heating networks. In this regard, the Finance Committee refers to its report, TaVM 33/2022 vp, according to which the goal of the peat reserve is to secure the functionality of heat supply in times of crisis and to manage the transition to a carbon-neutral society, which is a part of the energy transition.
The law of conservation of energy (the first law of thermodynamics) states that the amount of energy is constant, so energy can neither be created nor destroyed. In other words, energy can be changed from one form to another, i.e., refined (Figure 2). This is how new strategic energy supply chains and their logistics value chains can be formed. The future of the energy transition can be anticipated with the help of a strategic planning system that produces the right information, through which autonomous wood procurement organizations can react to changes in the processing of sustainable energy. In the strategic work of this research, firstly, a realistic annual plan is made for the procurement of renewable wood fuel while determining the most profitable wood supply chains (WSCs) for practical operations. In addition, a clear operational roadmap is made, which prepares operational wood procurement organizations for the green transition of sustainable energy supply.
It seems that several elements of sustainable wood procurement in the energy transition must be integrated into the planning systems of the logistics value chain network when wood procurement is digitized and automated. It can be assumed that the automation of wood procurement sub-processes will increase the capacity of WSCs and, at the same time, make them more cost-effective and resilient. Indeed, the operative work of wood procurement has been rapidly mechanized in recent decades, but the related planning and management work only started to be automated in the 2010s with digitalization [11]. Entrepreneurs still select work sites and plan transportation while looking at a computer screen. This type of manual wood procurement management is slow and prone to errors that could be avoided with automation. The automatic planning and control of wood fuel purchases would also increase the resilience of energy conversion organizations.
A relatively large amount of energy is needed in Finland [4,12]. The reasons for this include the country’s northern location in a cool climate zone, large transportation distances due to the sparse population, raw-material-intensive industries, and the high household consumption associated with a high standard of living. Much energy is needed for heating and cooling buildings, transport fuel and industrial power, and household electricity. A considerable part of the fuels used in Finland's energy processing is imported from abroad [4,12]. For example, fossil fuels cannot be obtained in the country, so they are imported via ships or pipelines, which are vulnerable to sabotage from foreign powers.
Finland's energy system has been developed toward a decentralized infrastructure (Figure 3). In a centralized system, one energy plant operates, while in a decentralized system, instead, a network of many plants operates, which have their own energy wood procurement areas [13,14]. The decentralized system diversifies the use of energy fuels, processing both heat and electricity in numerous small units that form an energy network. At the same time, the utilization of bio, wind, and solar energy can be increased and rural employment can be provided. Decentralization also introduces flexibility to the energy system, i.e., electricity can be transferred in two directions in the network. In this way, fluctuations in consumption and processing can be smoothed out. The goal is the so-called intelligent network or smart grid [14].
Logistics value chains
Successful supply chain management of logistics is a way to achieve operational Energy Management System and Environmental System in the IMEI [15,16,17], which is important for assuring energy supply security, for increasing economic competitiveness, as well as for mitigating greenhouse gases. Sustainable development of logistics is in a contradictory situation after the crisis caused by the COVID-19 pandemic. During the pandemic, the state of the environment improved considerably in many places. However, due to its damaging economic effects, such as recession or reductions in consumer consumption, it is possible that normal logistics emissions are quickly reached and even exceeded, compensating for welfare losses. Still, the operation of logistics is necessary to secure critical operations in many sectors for successful national climate and energy strategy [18]. Therefore, the Finance Committee states, like the Transport and Communications Committee, that transport routes must operate throughout the country, and emphasizes the importance of being prepared for energy and fuel supply in all circumstances [19].
In the broad picture, logistics value chains cover, for example, road and rail transport as well as the related material, money, and information flows [20]. During the last decades, the logistics value chains of companies have become strongly internationalized. Such value chains are often very complex and difficult to trace and, thus, partly prone to disruptions that are difficult to prepare for or quickly correct. Therefore, the national energy sector has tried to diversify the value chains that are important to operations in the country to avoid dependence on only one foreign supplier. In this way, the goal is to increase delivery reliability and even automate deliveries of key fuels. The Finance Committee draws attention to the fact that the operation of the logistics and transport sector is largely dependent on the operation of private companies [19]. Therefore, the operation must be profitable and competitive so that the operating conditions of these companies are preserved, even during unforeseen changes in the operating environment, such as increases in the price of car fuels or changes in the price of refined energy. Many companies in the transport industry are SMEs; thus, identifying subcontracting and supply chain entities in the industry and understanding the operating principles are important to maintaining the profitability of CHP plants.
Logistically, it makes sense to refine electricity and, especially, district heating as close as possible to end users. It is particularly energy efficient to refine electricity and district heating together. Electricity is generated in the thermal power plant's generators, and the power needed for rotation is obtained via turbines, driven using the pressure of hot steam. The generated heat can be used, for example, as district heating. Unnecessary transfers of fossil fuels consume energy, so such thermal power plants should be in the immediate vicinity of import ports. However, in Finland's distributed energy system, most CHP plants use energy wood as fuel (Figure 2). This study focuses on the development of the logistics value chains of these energy facilities. Recently, electricity pricing has changed in markets that provide cheap electricity at night, e.g., for hydrogen and energy storage technologies [19]. However, this topic is omitted in this study.
Relevant data collected from the logistics value network of supply chains would enable the automated planning of fuel supply chains that support the wood procurement of CHP plants [22]. The selection of forest sites and the planning of car transportation is a repetitive manual task when using a computer, the automation of which makes the operation both socially sustainable and even more attractive in the minds of potential employees. Automated planning allows employees to focus on autonomous operational development, as the content of work changes from time-consuming manual repetitive tasks to more creative tasks. Efficient automatic wood procurement planning would also increase ecological sustainability, as it reduces the environmental footprint of energy processing for the entire value chain. For example, the environmental burden of energy refining can be minimized through a more precise control of emissions from the transport of energy wood. In a broader picture, the autonomous procurement of energy wood through resilient organizations enables the processing of more environmentally friendly wood fuel alternatives than ever before [11].
At the heart of future energy wood procurement are cloud-based logistics systems using artificial intelligence, which help companies automate transport and tracking, optimize routes and fleet capacity, determine when and where to take breaks, plan loads, etc. Future systems can already be tested with information modeling, optimization, and simulation. Recently, an internal pricing mechanism using the payment ability of the integrated material and energy industry (IMEI) to pay for wood supply chain (WSC) costs was introduced for the analysis of logistics value chains [23], which can be used as a model in techno-economic analysis from renewable forests (TERF model). Each new step toward a more resilient and faster supply of energy wood makes energy utility customers more satisfied and helps companies involved in the operation develop better sustainability profiles. In this regard, data analytic technologies integrated into data modeling help to include the necessary datasets of energy wood supply chains for the analysis of the entire logistics value chain network (Figure 4). For example, the payment ability parameters may be determined to retain renewable forests at a local level. Then, a payment ability model may be developed and used for the optimization of procurement amounts (m3), locations, costs, and profitability (EUR) for decentralized CHP plants.
Forest based green circular industry (IMEI) has been developed towards sustainable wood procurement [24,25]. In terms of the sustainable development of energy wood procurement, decentralized energy processing is an innovative solution for the green transition. The goal is to break away from fossil energy sources and start utilizing the sun's inexhaustible energy (Figure 1). In less than an hour, the sun radiates as much energy to the earth as humanity uses in a year. However, the sun radiates unevenly on only parts of the Earth. In this regard, storing energy wood for its timely use is a major logistics, technical, and economic challenge (Figure 2) [22]. Therefore, a distributed energy system that enables the management of the energy transition is an important solution for societies located far from densely populated cities [14]. However, during the green transition, the procurement of energy wood increases, and procurement areas partially overlap, causing competition and, possibly, local excessive felling, endangering the annual growth of renewable forests and sustainable carbon sinks in these areas. This increases the amount of information needed in planning systems. Therefore, it is important to automate the procurement of renewable fuel by using the TERF Model to choose the best sustainable logistics value chains for energy processing. The objectives of this study are as follows:
- i)
- Evaluate the payment ability under alternative WSCs using the general TERF Model;
- ii)
- Identify the most sustainable and profitable WSCs near CHP plants;
- iii)
- Anticipate an environmentally sustainable region to increase the wood procurement amount from 60,000 m3 to 100,000 m3.
Material and Methods
The research material was collected from Eastern Finland, which is located near the Russian border. In this area, the competition between plants of the IMEI that use wood as raw material has increased since the importation of wood from Russia stopped. Even during the pandemic, the share of imported wood was 10–15% of all wood used [12]. Savonlinna is a typical small city with a well-functioning CHP plant and district heating network. The plant also supports electricity supply for several sparsely populated municipalities (Figure 5). In order to ensure the security of energy supply in the area, the procurement of wood fuel must be increased in the municipalities surrounding Savonlinna, taking into account the sustainability of wood procurement. The plant organization's strategy also aims at autonomous operation and increasing the resiliency of operations. Logistics faces specific challenges in the operating environment, as waterways may prevent direct wood transport from the forest to the CHP plant.
In Finland, inventorying of the country's forests has been recorded for a long time, from which sufficiently accurate predictions can be obtained for wood procurement planning of both the wood-processing industry and wood-burning plants. In addition to quantities, predictions are also made for the annual growth of forests [26]. Luke publishes these statistics based on the municipality and wood assortment (Table 1). For this study, two forest inventory materials were collected from the municipalities surrounding Savonlinna. Table 1 presents the growth of forests as a percentage of the amount of industrial wood. Table 2 presents the area's energy wood potential for energy conversion plants. In this study, it is assumed that the growth in Table 1 can be used to calculate annual sustainable wood procurement amounts as well as wood assortment amounts in Table 2.
Maintaining the carbon sink of a sustainable forest requires, in addition to wood harvesting quantities, knowledge of forest growth, which increases data and calculations in the planning system. Excessive regional wood harvesting can be avoided if the amount of wood procurement is lower than the amount of growth. In this study, calculations are made for municipalities and a period of one year. Table 3 describes the potential energy wood quantities of the reference procurement region, and Table 4 describes the energy wood quantities of the experimental wood procurement region. These amounts are available for all energy plants in the area. In order to choose the best sustainable logistics value chains for energy refining, the municipal market shares of the organization's wood procurement are also needed for the calculation.
Wood Supply Chains
By using the WSC options, CHP plants receive wood fuel to generate energy. Wood fuel is delivered from the forest to the plant in various ways, according to a trade agreement made by the forest owner and the wood buyer. Accordingly, buyers from the CHP plant purchase several wood fuel assortments from forest owners, with the most common ones shown in Figure 6.
Different types of energy wood from wood fuels can be identified and named for the planning and management of WSCs. According to selected technologies, suitable energy wood assortments are used within the limits of the possibilities of the wood procurement operating environment. The following energy wood assortments are used in this study:
P1: The stumpage trade is used to buy energy wood suitable for whole-tree harvesting. The chipping takes place at the roadside.
P2: The stumpage trade is used to buy thinnings, from which small-energy trunks are harvested and chipped at the roadside.
P3: The stumpage trade is used to buy thinnings, from which the energy trunks are harvested, transported to the terminal, and chipped at an appropriate time with efficient equipment.
P4: Whole wood is bought at the roadside, where chipping also takes place.
P5: Energy trunks are bought at the roadside, where chipping also takes place.
P6: Energy trunks are bought at the roadside, transported to the terminal, and chipped at an appropriate time with efficient equipment.
P7: Energy trunks are purchased for factory delivery, transported to the terminal, and chipped at an appropriate time with efficient equipment.
The general payment ability model of the IMEI
Alongside the implementation of standards for environmental and energy management, the fostering of renewable energy sources on energy use in the IMEI has happened by using the European Emissions Trading Scheme [27]. For renewable forests, the carbon neutrality of wood procurement technology simply means that the relative calculation difference between the largest sustainable and realized wood harvesting amounts (m3/m3) is more than one. In addition to the carbon neutrality of technology, the TERF Model should be used to optimize the profitability of wood procurement by considering all cost and revenue elements (EUR/m3) of WSCs. This can be achieved through payment ability models for pricing mechanisms [23], facilitating profitability management in wood procurement for the IMEI (Model 1).
where PEUR/MWh represents the ability to pay for wood at the given costs and the price of sold energy, EEUR/MWh represents the market value of the energy content of the sold wood energy in euros, GHG emission costs represent the EU’s emission allowance price (EEAP) in euros [28], and wood supply costs represent the costs of wood harvesting and transport operations in euros.
PEUR/MWh = EEUR/MWh – GHG emission costs – wood supply costs
The application of a general model for the Savonlinna CHP plant
The wood procurement needs of industrial plants as well as the operating environments are different. Consequently, a general wood payment ability model for CHP plants must be specified separately. Model 2 describes such a model, which applies to the collected material. It takes into account the cost factors of wood procurement and the revenue factors of energy conversion (EUR/m3). The calculation can be performed in Excel, which has a new module for the procurement of energy wood with GHG emission costs (EEAP), which is updated by monitoring renewable wood stocks in forests based on the energy wood stock data of municipalities (Table 3 and Table 4) [26].
P = S × E × R ˗ (GHG emission costs + (S × (C1 + C2)) + C3 + C4 + C5 + C6 + C7)
The model parameters are as follows:
P Payment ability to buy a solid cubic meter of wood, EUR/m3;
S The ratio of solid cubic meter to chip cubic meter, m3/c-m3;
E The energy content of wood chips, MWh/c-m3;
R The price of the energy content of wood fuel, EUR/MWh;
C1 The costs of transporting or transferring the wood chips, EUR/c-m3;
C2 The chipping cost of wood, EUR/c-m3;
C3 The terminal cost of a solid cubic meter of wood, EUR/m3;
C4 The long-distance transport cost of round wood, EUR/m3;
C5 The cost of wood harvesting from the stump to the roadside, EUR/m3;
C6 The common costs of wood procurement, EUR/m3;
C7 Interest on tied-up capital: euros per solid cubic meter, EUR/m3;
GHG emission costs are the EU’s emission allowance price (EEAP), EUR/t CO2 eq.
Calculation mechanism using the payment ability model of the CHP plant
The procurement data were collected from the enterprise resource planning (ERP) system by the wood procurement organization of the CHP plant. The research data contained the amount of energy wood from all WSCs of the CHP plant, which were harvested and transported via entrepreneurs from the 1st of January to the 31st of December 2018. In addition, the cost and revenue data of the WSCs were collected from the ERP system. Furthermore, three EEAPs were selected for sensitivity analysis, namely, 70, 85, and 100 EUR/t CO2 eq. The EEAP is often used for investigating the relationship between the prices of fossil fuel and carbon emissions in the European Union Emissions Trading System [29,30]. Carbon emissions trading and pricing mechanisms have also been developed in China’s fossil energy markets [31,32,33]. Instead of fossil fuels this mechanism uses the mechanism with renewable wood fuels. The mechanism updated old cost values during the calculation process, which used forestry machinery and truck cost indices for operation costs [34]. If cost information was absent, annual averaged wood procurement information and costs were used according to [35]. If revenue data of the WSCs was absent, annual average revenues were used according to [36].
The TERF Model can be used to automate wood procurement planning and calculate payment ability for alternative WSCs [23]. It was developed during the COVID-19 pandemic to automate wood procurement for the IMEI. In this study, a payment ability model was developed specifically for CHP plants to analyze the sustainability of logistics value chains for energy refining. In addition to environmentally sustainable WSCs, it can be used both to select economically profitable WSCs around the CHP plant and determine wood procurement regions to increase procurement amounts.
Results
The results indicate the payment ability of WSCs to determine sustainable wood procurement regions if the procurement amount is increased from 60,000 m3 to 100,000 m3. The TERF Model automatically selects the three most profitable energy wood assortments. Then, managers can choose a suitable strategy for a CHP’s energy wood logistics. This is performed by analyzing the effects of the forest carbon sink (renewable wood share) and EEAP (70, 85, and 100 EUR/t CO2 eq.) on selecting the most environmentally sustainable logistics value chains for energy refining.
The market share of renewable wood was 39.8%, and the transport distance varied from 20 to 40 km during the wood procurement reference year. Further, the payment ability solutions of wood procurement area A for 60,000 m3 showed that the renewable wood share (forest carbon sink) would retain over 100% if the market share was over 49.8%. If the market share value was lower, EEAPs affected the CHP’s payment ability to buy energy wood assortments in the wood procurement area. When comparing the strategies of wood procurement, it is useful to compare planning alternatives of the energy wood assortment P5, as it is mainly used in energy conversion, and all operations of the WSC are in the hands of the procurement organization of the CHP plant. Under the current wood procurement conditions, the payment ability of P5 was 27 EUR/m-3. It was calculated with a renewable wood share of 80% when the EEAP was 70 EUR/t CO2 eq.
The managers of the CHP plant considered expanding the procurement area into the territory of several municipalities. This measure was supposed to increase the amount of renewable wood used and, at the same time, reduce emission costs. The payment ability solutions of wood procurement area B for 60,000 m3 show that the renewable wood share was over 100% for all wood procurement alternatives (Table 6). The market share of renewable wood was 27.3%, and the transport distance varied from 30 to 50 km. EEAPs did not affect CHP’s payment ability to buy energy wood assortments for a wood procurement amount of 60,000 m3. When comparing the wood procurement conditions (transport distance, 40 km), the payment ability of P5 would be 37 EUR/m-3.
In addition to expanding the procurement area, the CHP plant’s managers also considered increasing the procurement volume from 60,000 m3 to 100,000 m3. This strategy was supposed to replace fossil fuels and secure the area’s national energy wood supply. At the same time, the impact of the increase in the amount of used non-renewable wood on emission costs was also investigated. Notably, the available stocks of energy wood in forests was 120,609 m3 (Figure 7). First, the effect of the increase in the procurement quantity in procurement area A was investigated by comparing the results (Table 5 and Table 7). In this foresight analysis, the wood procurement conditions and the market share of renewable wood remained the same without affecting the ability to pay for wood. Here, the payment ability solutions for 100,000 m3 show that the renewable wood share was between 48 and 60%. It never reached 100% in any strategic alternatives of wood procurement. Further, the EEAPs decreased the payment ability of CHP conversion to buy energy wood assortments. For a wood procurement amount of 100,000 m3, the payment ability of P5 was 10 EUR/m-3. This was calculated for a renewable wood share of 48% when the EEAP was 70 EUR/t CO2 eq.
Table 8 shows the results of the simultaneous effects of both a larger procurement quantity and a larger procurement area on the ability to pay for energy wood, the operating environment, and the transport distance. The payment ability solutions of wood procurement area B for 100,000 m3 show that the renewable wood share was over 100% if the market share was 45.4%. If the market share of renewable wood was 40.9%, the renewable wood share was 90%. Further, the transport distance was 40 km. Notably, the available stock of energy wood was 220,135 m3 (Figure 7). This operating environment can be used to compare the strategy with the results presented in Table 5, Table 6 and Table 7, as it is close to the reference in Table 5, which describes the current operating environment. Although the EEAPs affected the payment ability of CHP conversion to buy energy wood assortments for a procurement amount of 100,000 m3, the payment ability of P5 was 32 EUR/m-3.
Discussion
The main aim of this study was to develop and test the general TERF Model of the IMEI to anticipate wood procurement for a more stable and secure energy wood supply of a decentralized CHP plant. This is important because the Finnish government has emphasized the national security of supply in recent years due to changes in operating environments. During the COVID-19 pandemic, the forest industry started to automate wood procurement planning and operations to quickly adapt to the changing needs of society. Recently, climate issues have also challenged the operating environment of organizations. Therefore, to automatize planning in CHP plants, organizations have developed an internal pricing mechanism in DSS. This planning model anticipates the ability to pay for energy wood assortments, for which the income from the sale of energy and the costs incurred from the purchase of wood are required as collected input data (Model 2). As input data, the EEAP is also an important cost factor. After formulating the model, seven WSCs between whole wood (trunks, branches, and tops) and trunk wood were automatically compared. The developed mechanism selected the three most profitable alternatives for manual consideration in this study. However, the number of WSCs may be changed under the different operating environments of CHP plants. In this case, the mechanism operated successfully with three alternatives, allowing the CHP plant managers to choose the most profitable WSC. Given the current market share (39.8%) and strategy (Table 5), the energy trunk assortment (a payment ability of 27 EUR/m-3) was chosen, which is purchased from the roadside, where chipping also occurs.
This study also aimed to decide on a long-term strategy for determining the CHP plant's wood procurement region while keeping the forest renewable. Table 6 shows how increases in the size of the area and the amount of renewable wood (from 120,609 m3 to 220,135 m3) preserve renewable forests and reduce emission costs, thus increasing payment ability. However, the use of wood as a source of energy should be environmentally sustainable, even if wood procurement is increased from 60,000 m3 to 100,000 m3. Figure 7 shows how yellow area A was too small for a wood procurement amount of 100,000 m3, while red area B was large enough to secure profitable wood procurement and preserve renewable forests. When considering the available amount of wood fuel based on the regional forest data of municipalities, it can be stated that an increase in the procurement amount was impossible to implement using the current procurement strategy (Table 5 and Table 7), as the total annual procurement amount exceeds annual forest growth (>20%). Under these circumstances, forests would be non-renewable. In addition, environmentally sustainable wood procurement from a small area with a 10% increase in market share would also increase competition among buyers due to the limited wood supply, thereby increasing prices. It seems that by using the novel mechanism as a DSS, the CHP plant managers can pivot strategies toward more sustainable wood procurement logistics.
Table 8 presents strategy options for future operating environments, one of which is discussed with respect to the current operating environments. Three factors of the organization’s operating environment were compared: renewable wood share (80%), market share (39.8%), and transport distance (40 km). Autonomous organizations may affect these factors by changing their long-term strategies. In this study, it was assumed that the market share was as stable as possible without increasing competition between wood procurement organizations. This assumption provides constant cost effects and allows for calculating the share of renewable wood and the transport distance by utilizing forest stock data of municipalities as the initial data of the mechanism. An important sustainability aim was to increase the renewable wood share, which was 90% in the new plausible strategy, indicating this goal was successfully reached (Table 8). This is the first step toward 100% renewable forests, which can be reached later with adjustments to the strategy. Consequently, EEAPs may have a significant effect on the payment ability of organizations (5 EUR) when purchasing energy wood from renewable forests (Table 8). This is an important issue that will need additional cost analysis in the future. So far, wood procurement strategy of renewable forest carbon sink with the EEAP has not been optimized in the IMEI.
The mechanism used EEAP model 2 if the carbon sink of the forest worsened due to wood procurement in the area. The calculation was made in Excel, which has a novel so-called carbon sink module and is updated by monitoring renewable wood stocks in forests based on regional forest growth data. Given the cost structure used in this study and the renewable forest carbon sinks, it is evident that updating the wood procurement strategy would be necessary. The Techno-Economic Wood Payment Ability Model with the EEAP parameter developed in this study proved to be a useful part of the DSS when guiding wood buyers toward environmentally sustainable wood procurement.
In the IMEI, a large share of energy wood has been harvested as residual whole wood. It is harvested after industrial wood, which is a practically impossible harvesting method for this single CHP plant. Due to the factors affecting carbon sinks, even in the larger wood procurement area, the focus should, at least initially, be mainly on roadside purchases, provided the price ratios for energy sales do not change significantly. In other words, if sellers deliver wood to the roadside, the purchase of both whole wood and trunk wood would be possible at used prices. However, it can be suggested that with the current procurement strategy, it is possible to profitably buy whole wood through the thinning method from forests located near the energy production plant when the buyer conducts wood harvesting in the forest and transports it to the plant. However, wood procurement is unprofitable at harvesting sites where only small trees are felled and large trees are left to grow.
Conclusions
In this study, an internal pricing mechanism was developed for CHP plants. It successfully applied the IMEI’s general TERF Model to manage the carbon sink of renewable forests at the local level around a CHP plant. In addition, the developed mechanism proved to be a useful part of DSS. It can be used to guide wood buyers toward more sustainable wood procurement.
In this mechanism, data analytics produced the payment ability parameters that can also be used in optimization models based on CHP and IMEI data. By updating fuel procurement data, the carbon sink of the forest in the CHP plant’s wood procurement region could be preserved through profit maximization subjected to the EAAP. The results showed that with the current market share the CHP plant managers should purchase wood from a larger procurement area because it increased the share of renewable forests by 10%. Due to the factors that affect the carbon sink, even in the larger procurement area, the focus should, at least initially, be mainly on roadside purchases of energy wood, provided the price ratios for energy sales do not change significantly.
The proposed mechanism can be used to improve wood procurement strategies for autonomous and resilient organizations of decentralized CHP plants. These strategies can secure renewable forests as carbon sinks and local preparedness for the security of energy supply during crises like the COVID-19 pandemic. With respect to national preparedness, these strategies improve market-based logistics services and functioning infrastructure, which make preparedness possible through cooperation between the business world, research institutes, and authorities.
References
- Ministry of Economic Affairs and Employment of Finland. 2023. Available online: https://tem.fi/en/-/energy-investments-of-finland-s-sustainable-growth-programme-promote-the-green-transition (accessed on 13 April 2023).
- Palander, T.; Takkinen, J. The Optimum Wood Procurement Scenario and Its Dynamic Management for Integrated Energy and Material Production in Carbon-Neutral Forest Industry. Energies 2021, 14, 4404. [Google Scholar] [CrossRef]
- Ministry of the Environment of Finland. 2023. Available online: https://ym.fi/en/what-is-the-green-transition (accessed on 13 April 2023).
- Statistics of Finland. 2023. Available online: https://www.stat.fi/julkaisu/clhomy00rtq7g0buvlkdxhfig (accessed on 13 April 2023).
- National Emergency Supply Agency. 2023. Available online: https://www.huoltovarmuuskeskus.fi/toimialat/energiahuolto/ (accessed on 12 April 2019).
- Ministry of Finance of Finland. 2023. Available online: https://vm.fi/en/finlands-recovery-and-resilience-plan (accessed on 13 April 2023).
- TrVL 4/2022 vp — VNS 8/2022, vp. Valtioneuvoston huoltovarmuusselonteko. Available online: https://www.eduskunta.fi/FI/vaski/Lausunto/Documents/TrVL_4+2022.pdf (accessed on 13 April 2023).
- European Council 2023. Fit for 55 - The EU’s plan for a green transition – Consilium. Available online: https://www.consilium.europa.eu/en/policies/green-deal/fit-for-55-the-eu-plan-for-a-green-transition/ (accessed on 13 April 2023).
- Ministry of Agriculture and Forestry of Finland 2023. Wood fuels in energy generation in Finland. Available online: https://mmm.fi/en/en/forests/use-of-wood/wood-based-energy (accessed on 13 April 2023).
- TaVM 33/2022, vp. Lakialoite turpeen energiakäytön lopettamiseksi. https://www.eduskunta.fi/FI/vaski/Mietinto/Sivut/TaVM_33+2022.aspx. (accessed on 13 April 2023).
- Palander, T. Outsourcing Issues of Wood Supply Chain Management in the Forest Industry. For. Sci. 2022, 68, 521–532. [Google Scholar] [CrossRef]
- Statistics of Finland 2021. Share of energy imported from Russia 34 per cent of total energy consumption in 2021 - Statistics Finland. Available online: https://www.stat.fi/en/publication/cl1xmekvw1pp80buvn1cznxmy (accessed on 13 April 2023).
- Alstone, P.; Gershenson, D.; Kammen, D. Decentralized energy systems for clean electricity access. Nature Climate Change 2015, 5, 305–314. [Google Scholar] [CrossRef]
- Kainiemi, L.; Eloneva, S.; Levänen, J. Transition towards a decentralised energy system: analysing prospects for innovation facilitation and regime destabilisation in Finland. Technol. Anal. Strateg. Manag. 2019, 31, 1003–1015. [Google Scholar] [CrossRef]
- Marchi, B.; Zanoni, S. Supply Chain Management for Improved Energy Efficiency: Review and Opportunities. Energies 2017, 10, 1618. [Google Scholar] [CrossRef]
- Wehner, J.; Deilami, N.T.N.; Vural, C.A.; Halldórsson, Á. Logistics service providers' energy efficiency initiatives for environmental sustainability. Int. J. Logist. Manag. 2022, 33, 1–26. [Google Scholar] [CrossRef]
- Nilsson, F.R.; Sternberg, H.; Klaas-Wissing, T. Who controls transport emissions and who cares? Investigating the monitoring of environmental sustainability from a logistics service provider’s perspective. Int. J. Logist. Manag. 2017, 28, 798–820. [Google Scholar] [CrossRef]
- The Ministry of Economic Affairs and Employment of Finland. Carbon neutral Finland 2035 – national climate and energy strategy. 2022. Available online: https://urn.fi/URN:ISBN:978-952-327-843-1 (accessed on 13 April 2023).
- VaVM 14/2022 vp — VNS 2/2022, vp. Valtioneuvoston selonteko julkisen talouden suunnitelmasta vuosille 2023—2026. Available online: https://www.eduskunta.fi/FI/vaski/Mietinto/Documents/VaVM_14+2022.pdf (accessed on 13 April 2023).
- Palander, T. Tactical Models of Wood-Procurement Teams for Geographically Decentralized Group Decision-Making. Ph.D. Thesis, University of Eastern Finland, Joensuu, Finland, 1998. Available online: https://www.researchgate.net/publication/44364975_Tactical_models_of_wood-procurement_teams_for_geographically_decentralized_group_decision-making_Teijo_Palander (accessed on 12 April 2019).
- European Commission 2023. Hydrogen. Available online: https://energy.ec.europa.eu/topics/energy-systems-integration/hydrogen_en (accessed on 13 April 2023).
- Palander, T.; Voutilainen, J. A decision support system for optimal storing and supply of wood in a Finnish CHP plant. Renew. Energy 2013, 52, 88–94. [Google Scholar] [CrossRef]
- Palander, T. Data-Driven Internal Carbon Pricing Mechanism for Improving Wood Procurement in Integrated Energy and Material Production. Energies 2023, 16, 3473. [Google Scholar] [CrossRef]
- Palander, T.; Haavikko, H.; Kärhä, K. Towards sustainable wood procurement in forest industry—The energy efficiency of larger and heavier vehicles in Finland. Renew Sustain. Energy Rev. 2018, 96, 100–118. [Google Scholar] [CrossRef]
- Palander, T.; Haavikko, H.; Kortelainen, E.; Kärhä, K. Comparison of Energy Efficiency Indicators of Road Transportation for Modeling Environmental Sustainability in “Green” Circular Industry. Sustainability 2020, 12, 2740. [Google Scholar] [CrossRef]
- NFI13. 13th National Forest Inventory of Finland. Natural Resources Institute Finland. 2020. https://www.luke.fi/en/blogs/nfi-helps-to-develop-sustainable-forest-management . (accessed on 13 April 2023).
- Uriarte-Romero, R.; Gil-Samaniego, M.; Valenzuela-Mondaca, E.; Ceballos-Corral, J. Methodology for the Successful Integration of an Energy Management System to an Operational Environmental System. Sustainability 2017, 9, 1304. [Google Scholar] [CrossRef]
- Palander, T.; Takkinen, J. Data-driven modeling of CO2 emission-allowance compensation for wood-purchasing optimization toward carbon–neutral forest industry. Optim. Eng. 2022, 23, 2091–2110. [Google Scholar] [CrossRef]
- Carnero, M.A.; Olmo, J.; Pascual, L. Modelling the Dynamics of Fuel and EU Allowance Prices during Phase 3 of the EU ETS. Energies 2018, 11, 3148. [Google Scholar] [CrossRef]
- Lawrence, A.; Thollander, P.; Karlsson, M. Drivers, Barriers, and Success Factors for Improving Energy Management in the Pulp and Paper Industry. Sustainability 2018, 10, 1851. [Google Scholar] [CrossRef]
- Yang, X.; Zhang, C.; Yang, Y.; Wu, Y.; Yun, P.; Wagan, Z.A. China’s Carbon Pricing Based on Heterogeneous Tail Distribution. Sustainability 2020, 12, 2754. [Google Scholar] [CrossRef]
- Tong, X.; Li, X.; Tong, L.; Jiang, X. Spatial spillover and the influencing factors relating to provincial carbon emissions in China based on the spatial panel data model. Sustainability 2018, 10, 4739. [Google Scholar] [CrossRef]
- Liu, Y.; Xiao, H.W.; Zikhali, P.; Lv, Y.K. Carbon Emissions in China: A Spatial Econometric Analysis, at the regional level. Sustainability 2014, 6, 6005–6023. [Google Scholar] [CrossRef]
- Statistics of Finland. Forestry Machinery and Truck Cost Index; Statistics Finland: Helsinki, Finland, 2021; Available online: https://www.stat.fi/til/ (accessed on 23 April 2022).
- Strandström, M. Timber Harvesting and Long-Distance Transportation of Roundwood in 2018; Result Series; Metsäteho: Helsinki, Finland, 2019; Available online: https://www.metsateho.fi/timber-harvesting-and-long-distance-transportation-of-roundwood-2018/ (accessed on 13 April 2023).
- Energiateollisuus. 2023. Available online: https://energia.fi/tilastot/kaukolammon-hintatilasto/ (accessed on 13 April 2023).
Figure 1.
The techno-economic model of renewable forests (TERF) supports the green transition and society’s energy system transition to avoid climate warming.
Figure 1.
The techno-economic model of renewable forests (TERF) supports the green transition and society’s energy system transition to avoid climate warming.
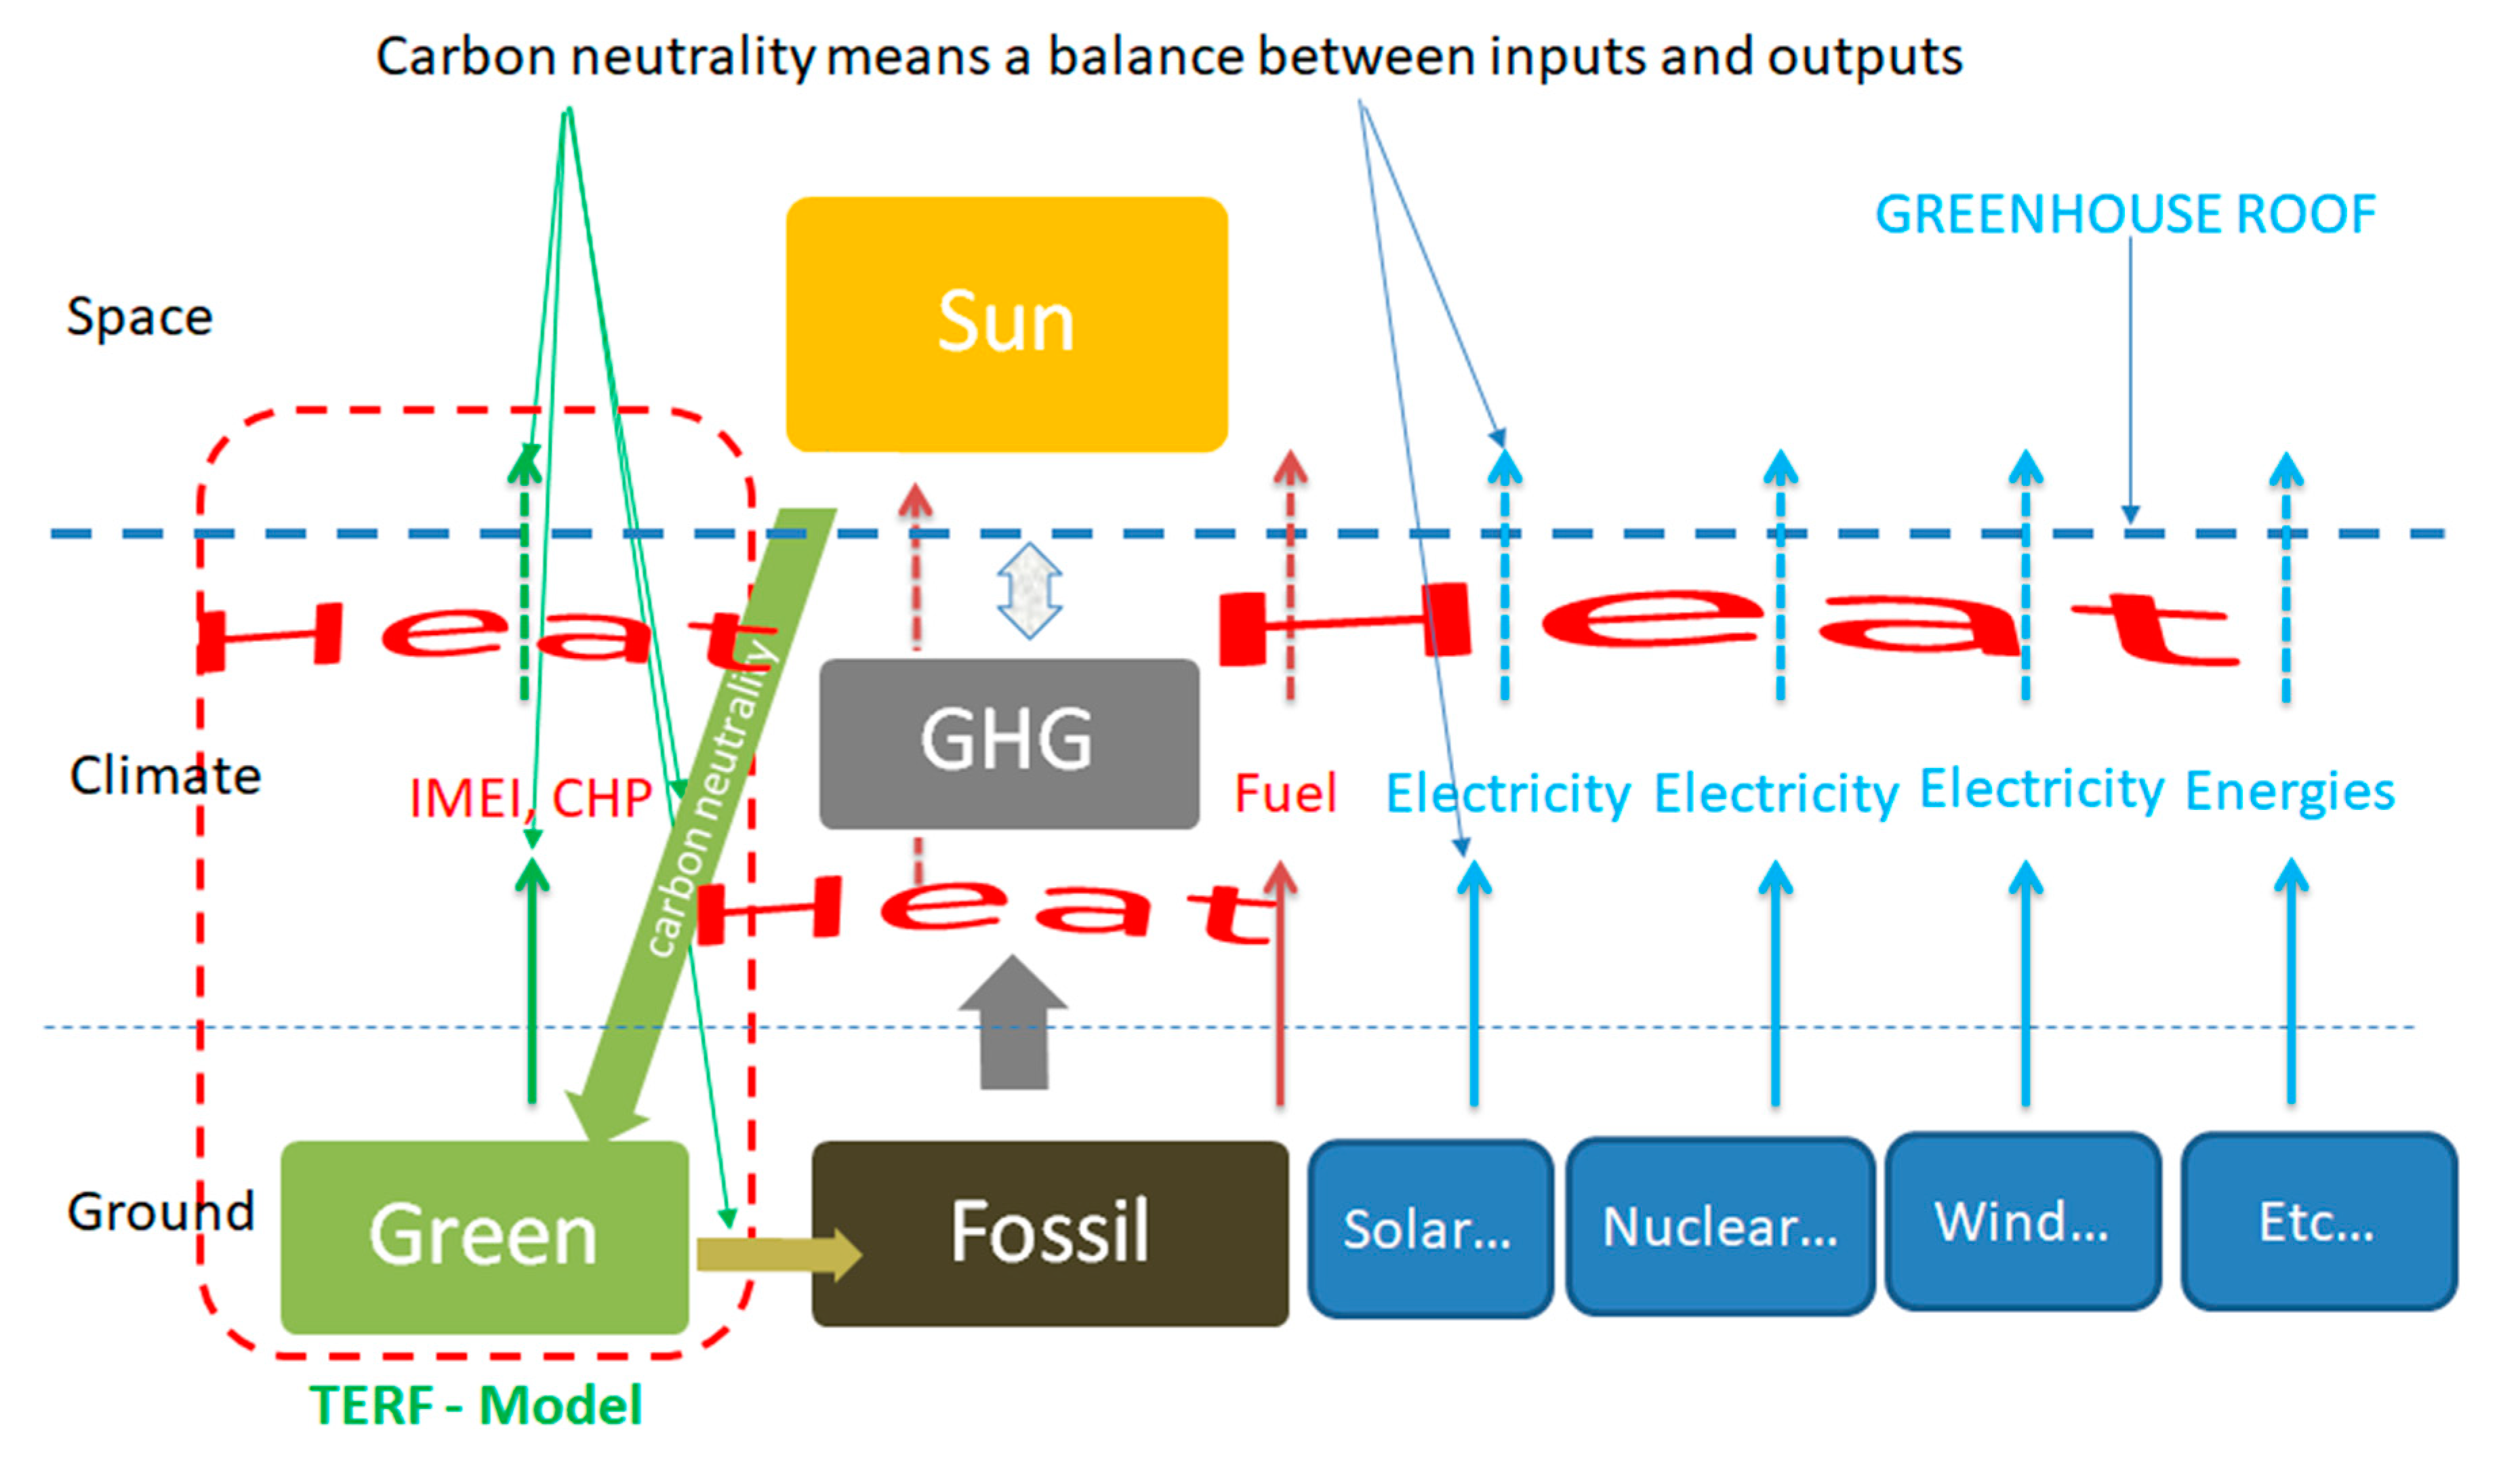
Figure 2.
The critical infrastructure of forest industry logistics from renewable forests to consumers. Modified for this study from [2].
Figure 2.
The critical infrastructure of forest industry logistics from renewable forests to consumers. Modified for this study from [2].
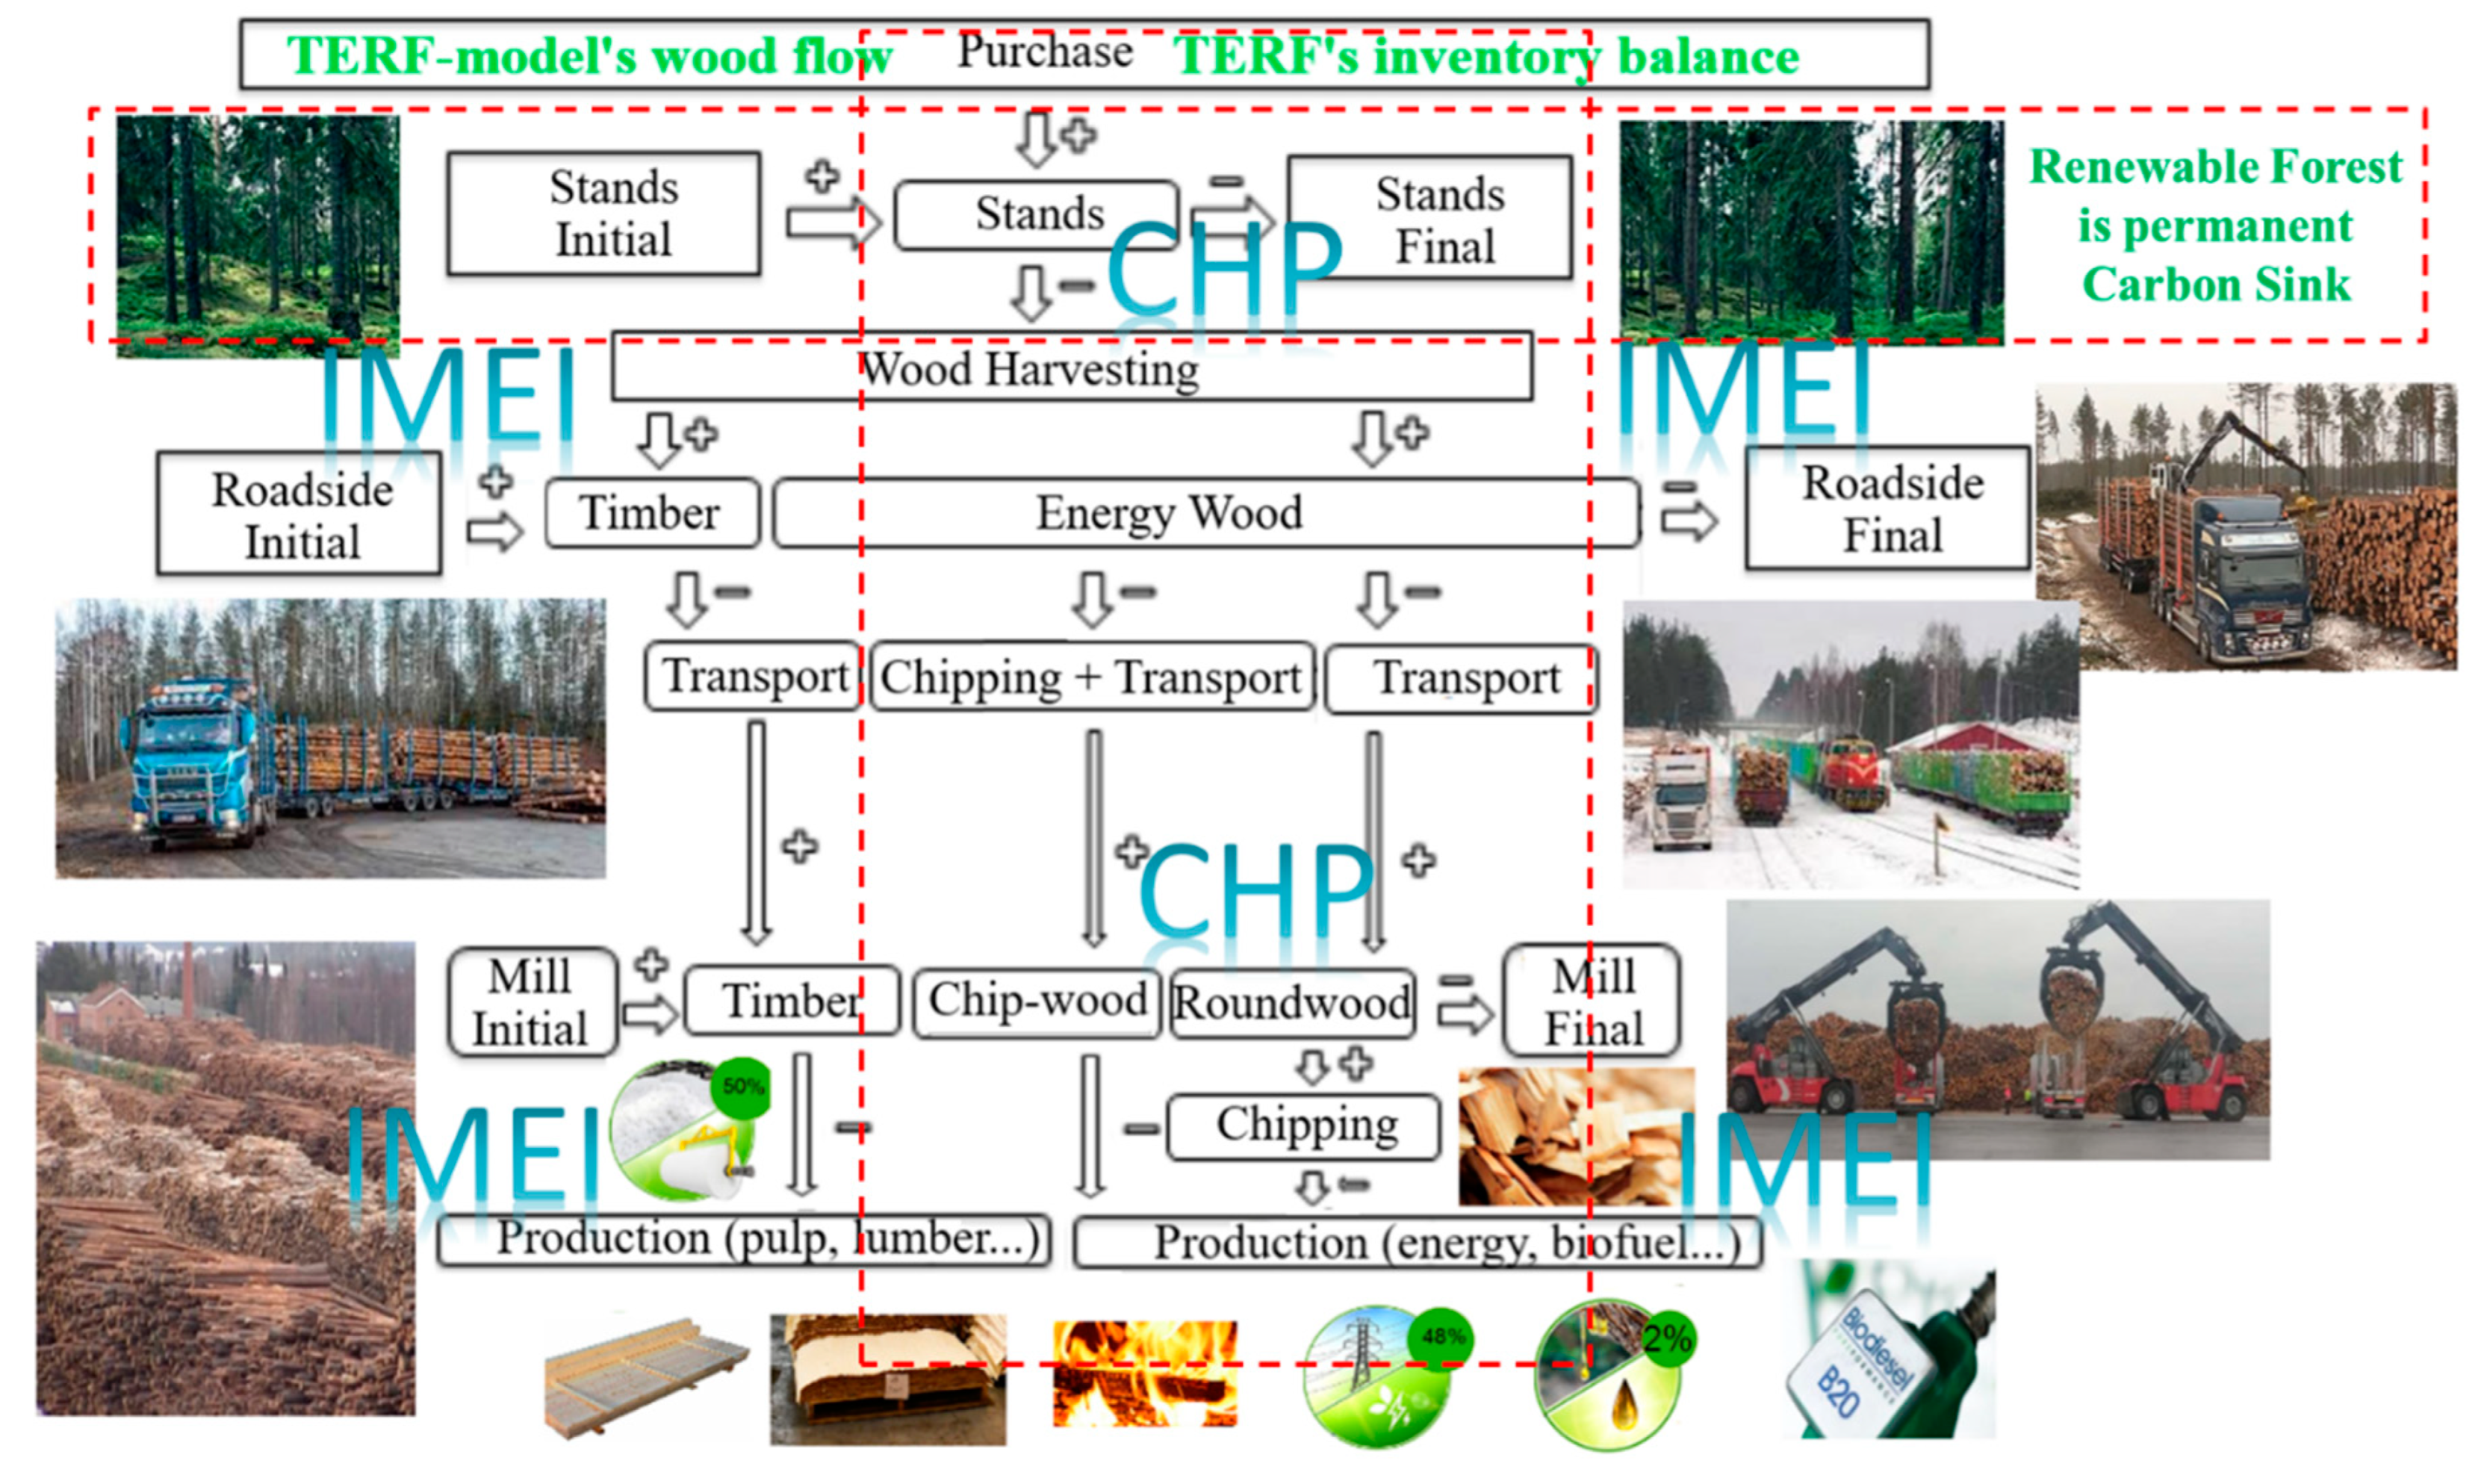
Figure 3.
Energy distribution systems and procurement areas of renewable wood fuel. Centralized system is on the left and decentralized system is on the right. = Energy plant, = Wood-procurement region, = Energy supply network.
Figure 3.
Energy distribution systems and procurement areas of renewable wood fuel. Centralized system is on the left and decentralized system is on the right. = Energy plant, = Wood-procurement region, = Energy supply network.
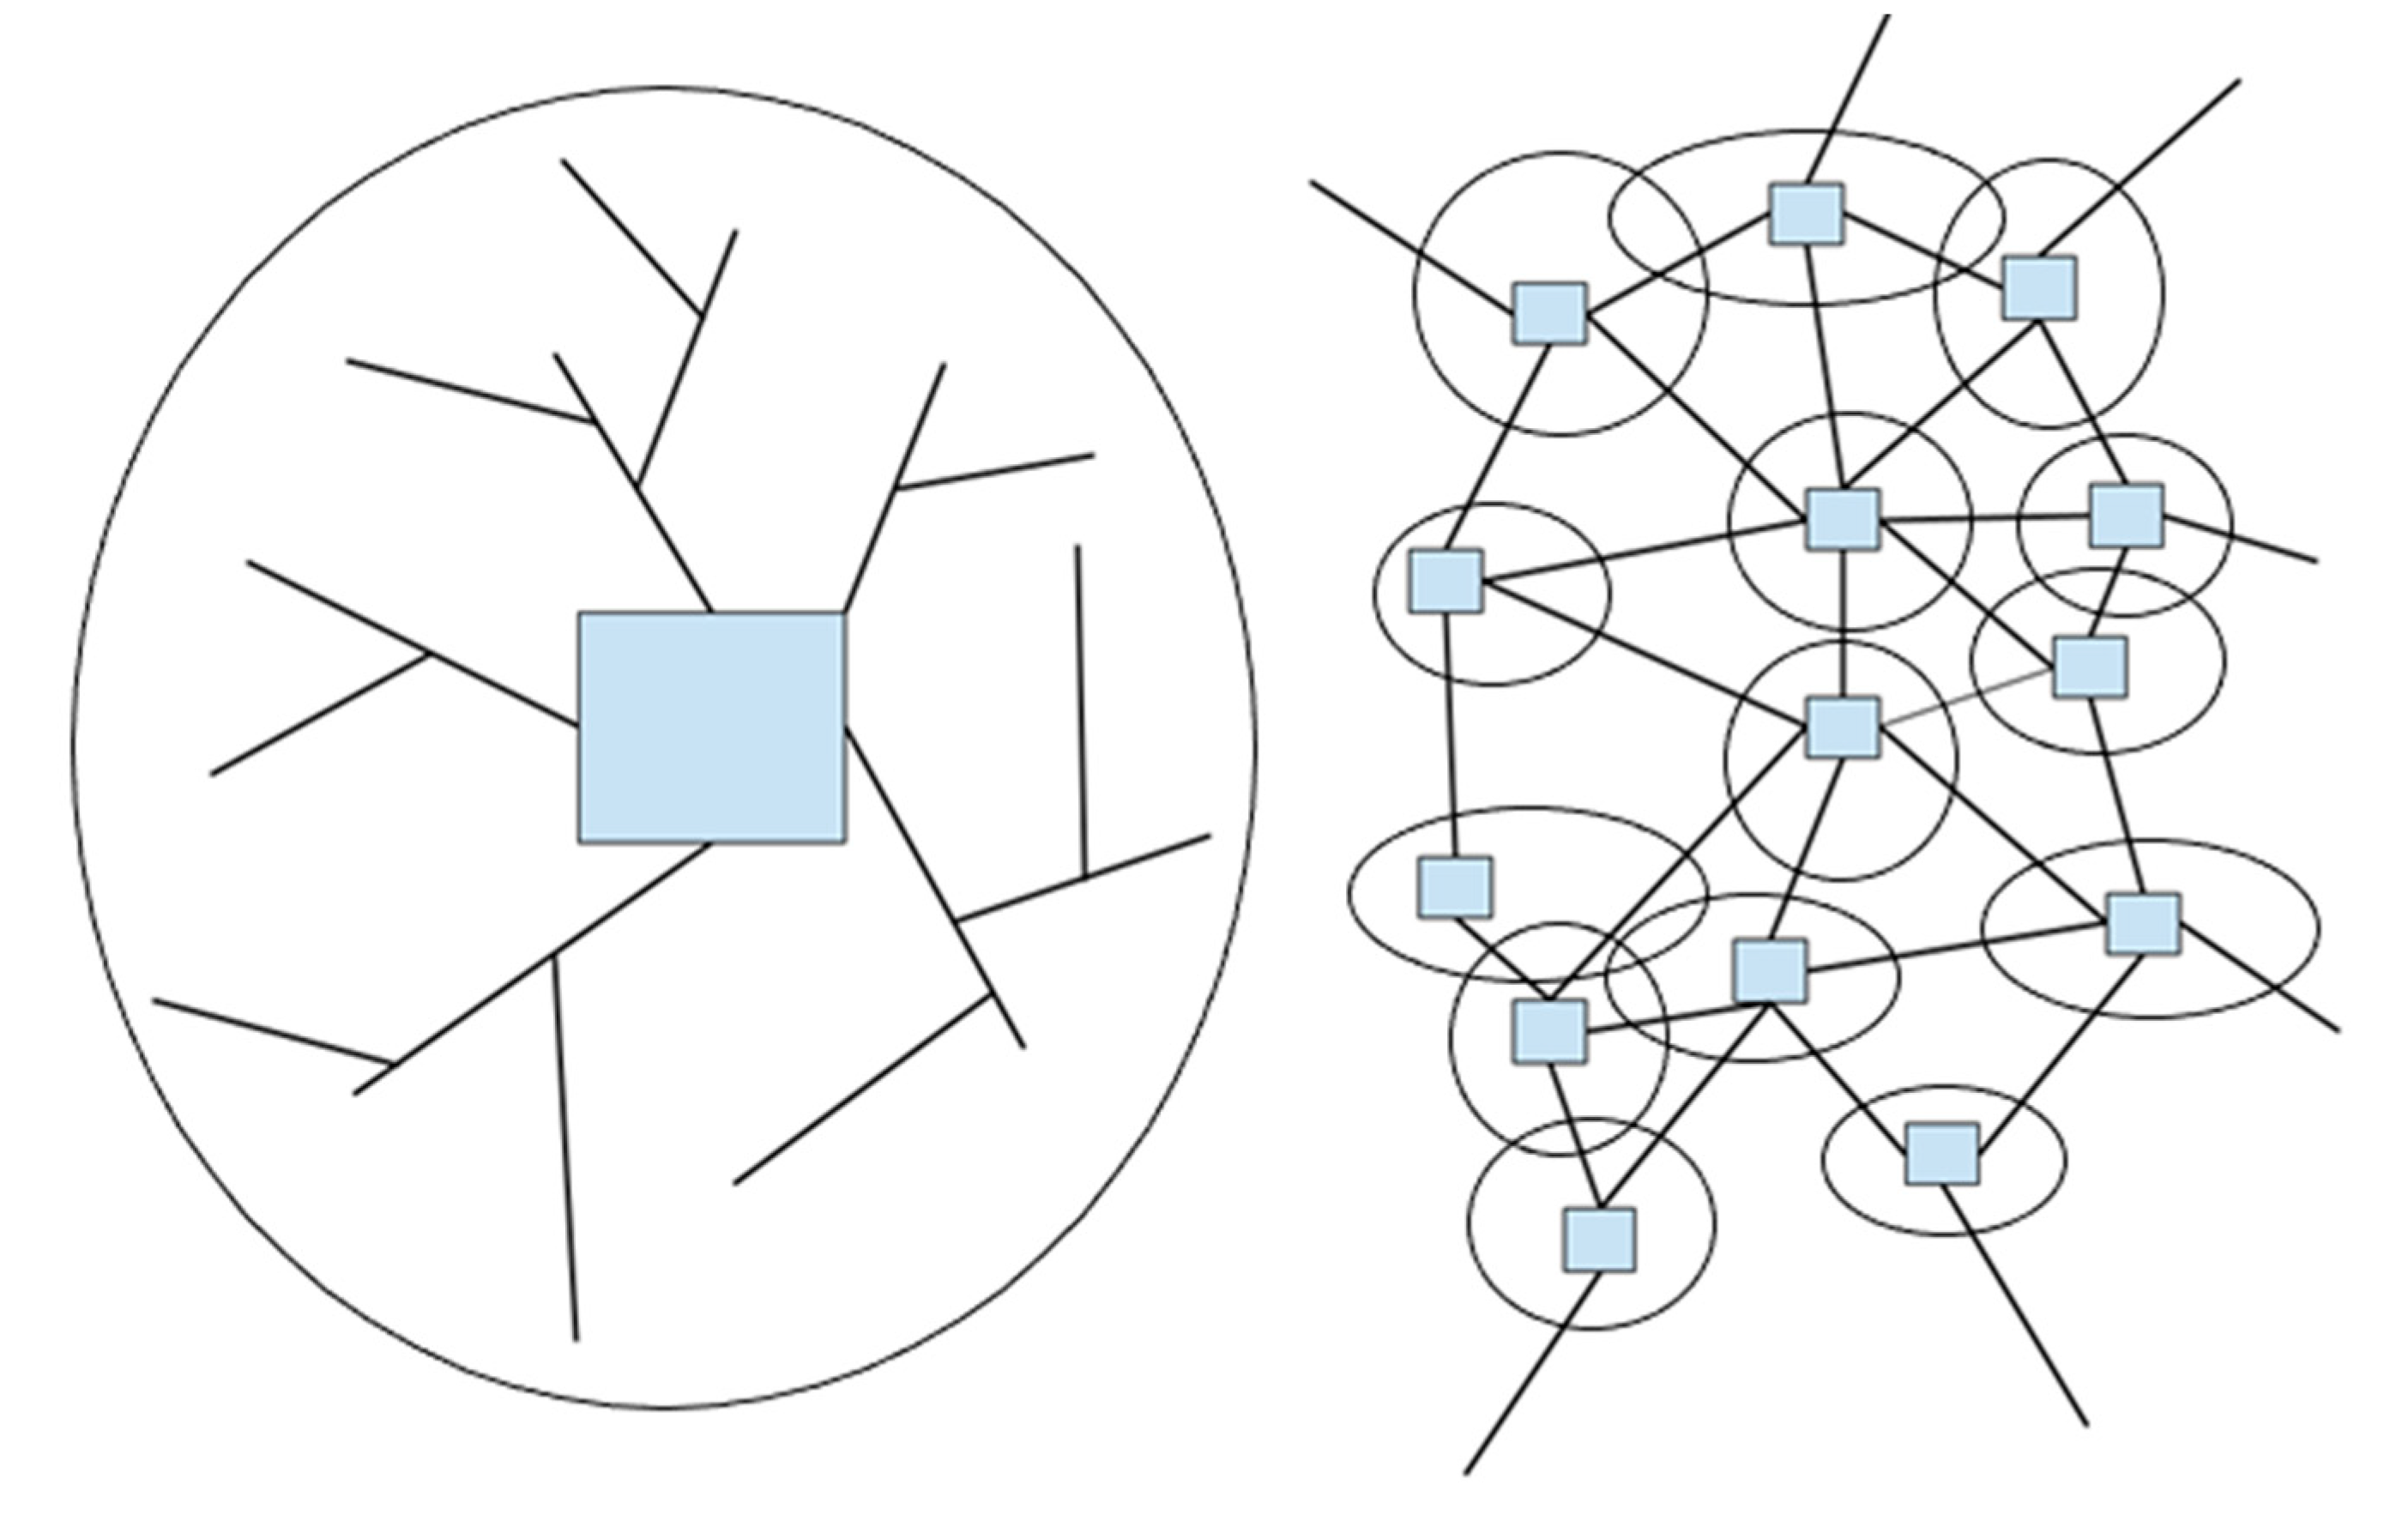
Figure 4.
Analysis of logistics value chains via the TERF Model by using data analytics of the payment ability of WSCs. Modified for this study from [23].
Figure 4.
Analysis of logistics value chains via the TERF Model by using data analytics of the payment ability of WSCs. Modified for this study from [23].
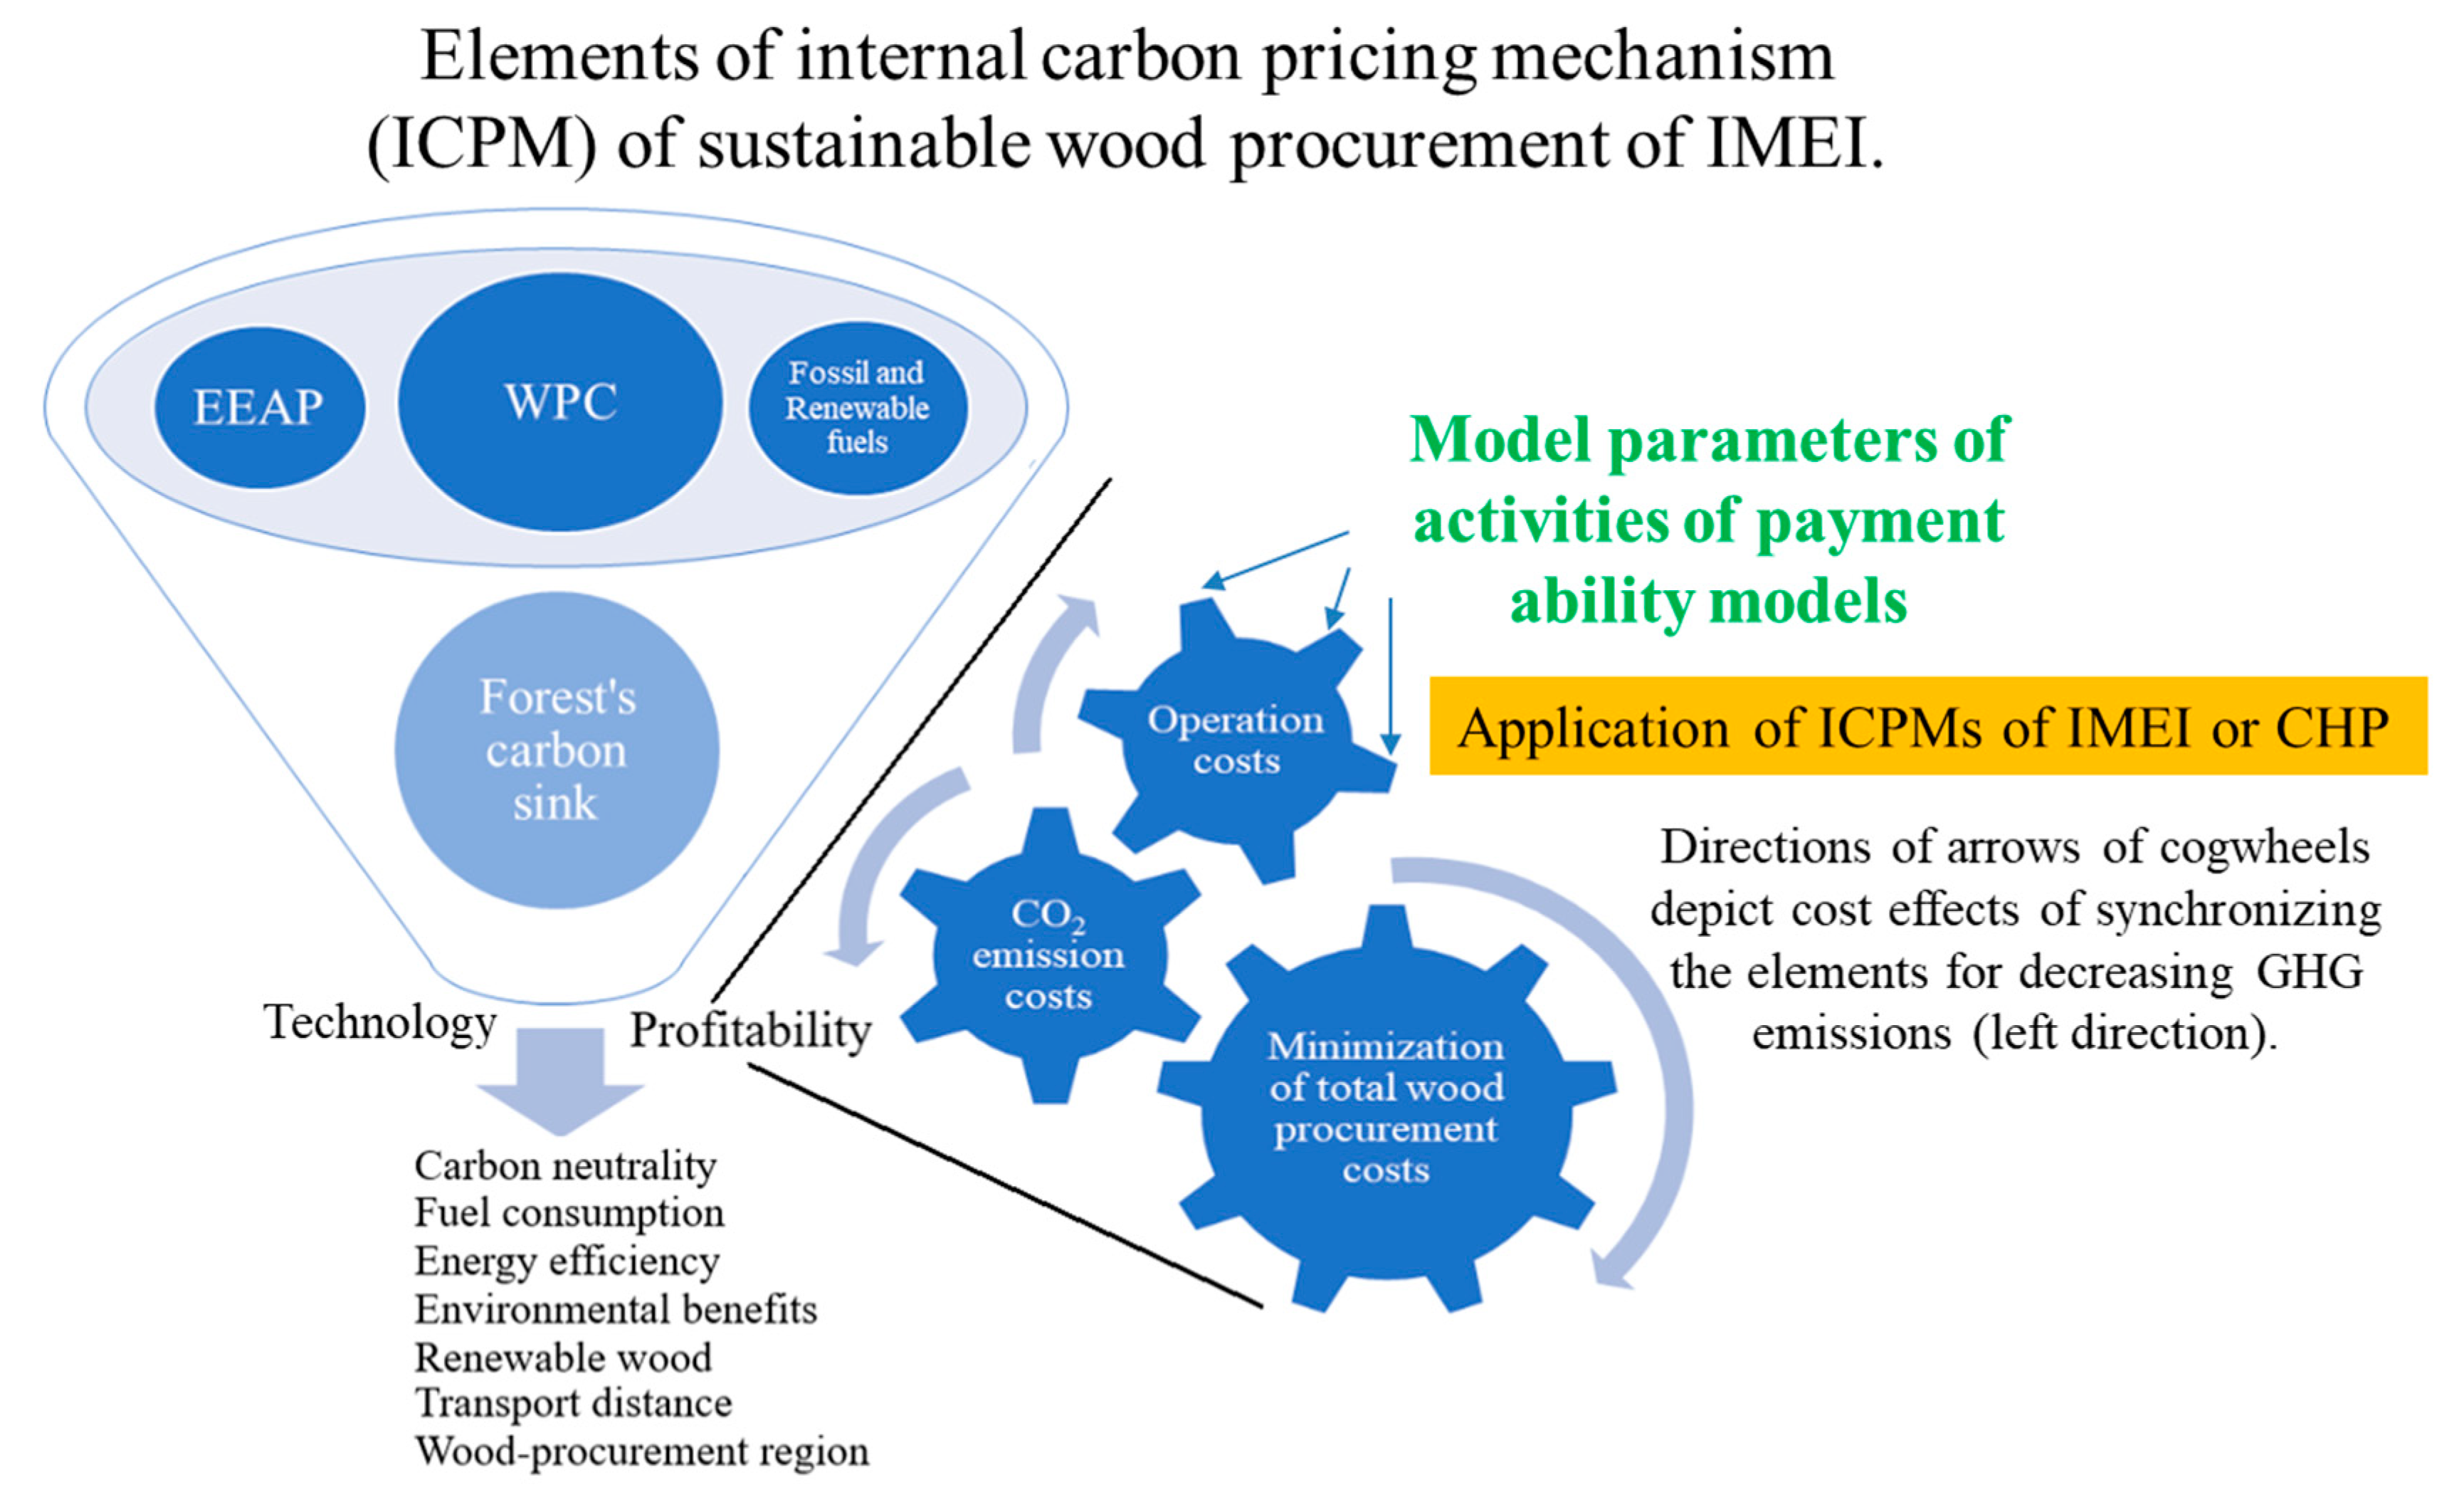
Figure 5.
The location of the study area near the CHP plant in Savonlinna, Finland.
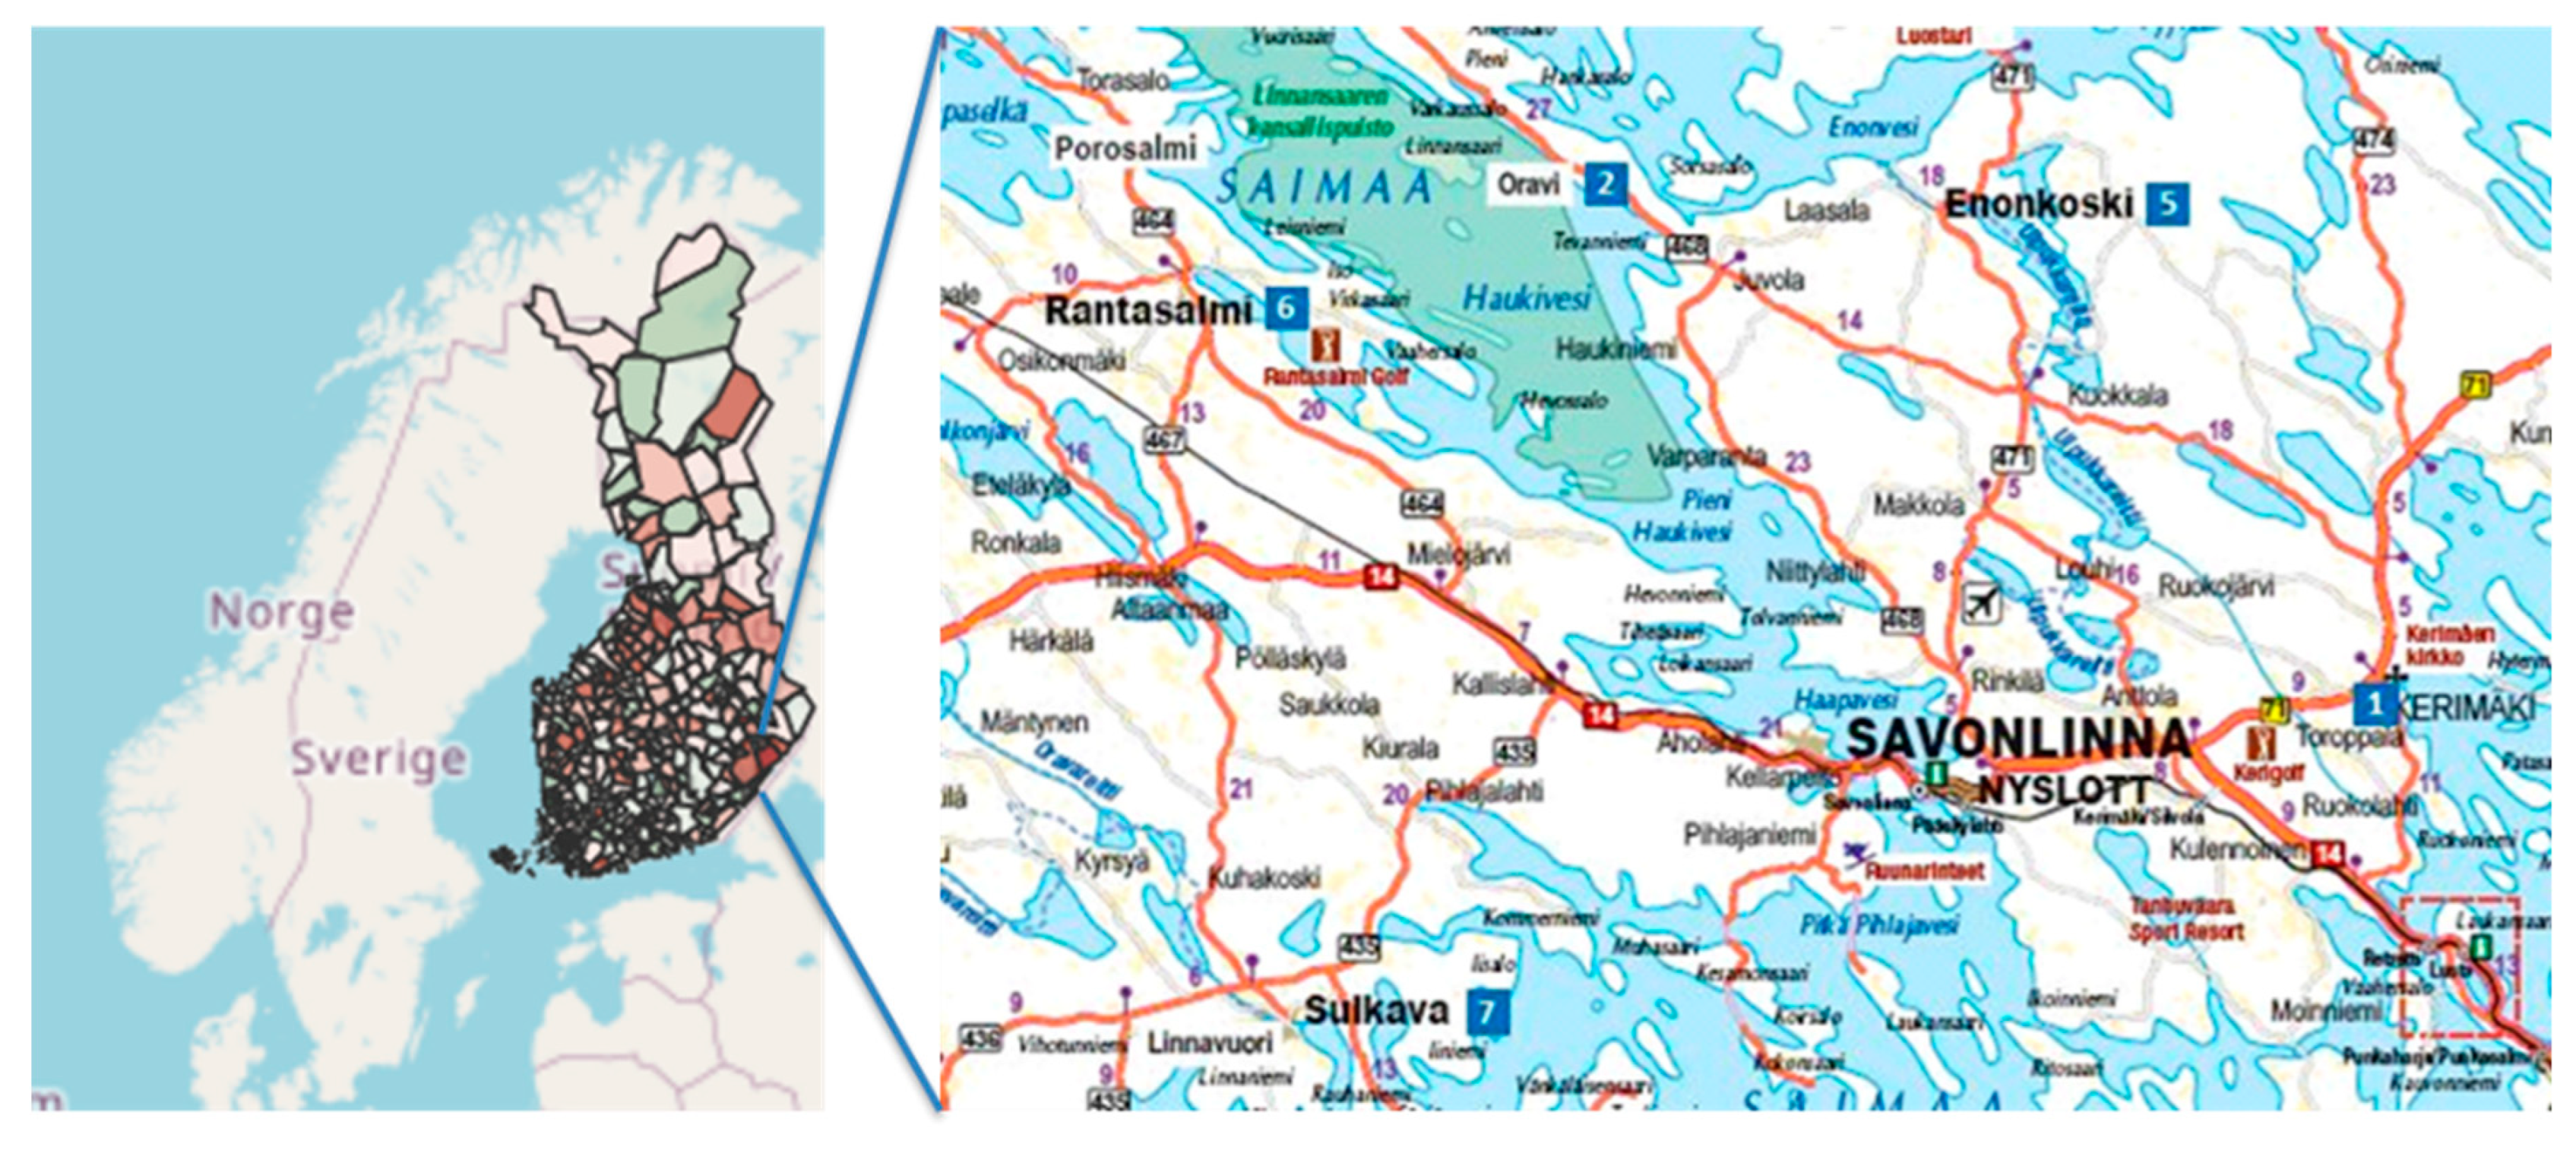
Figure 6.
Energy wood piles in Finnish forests.
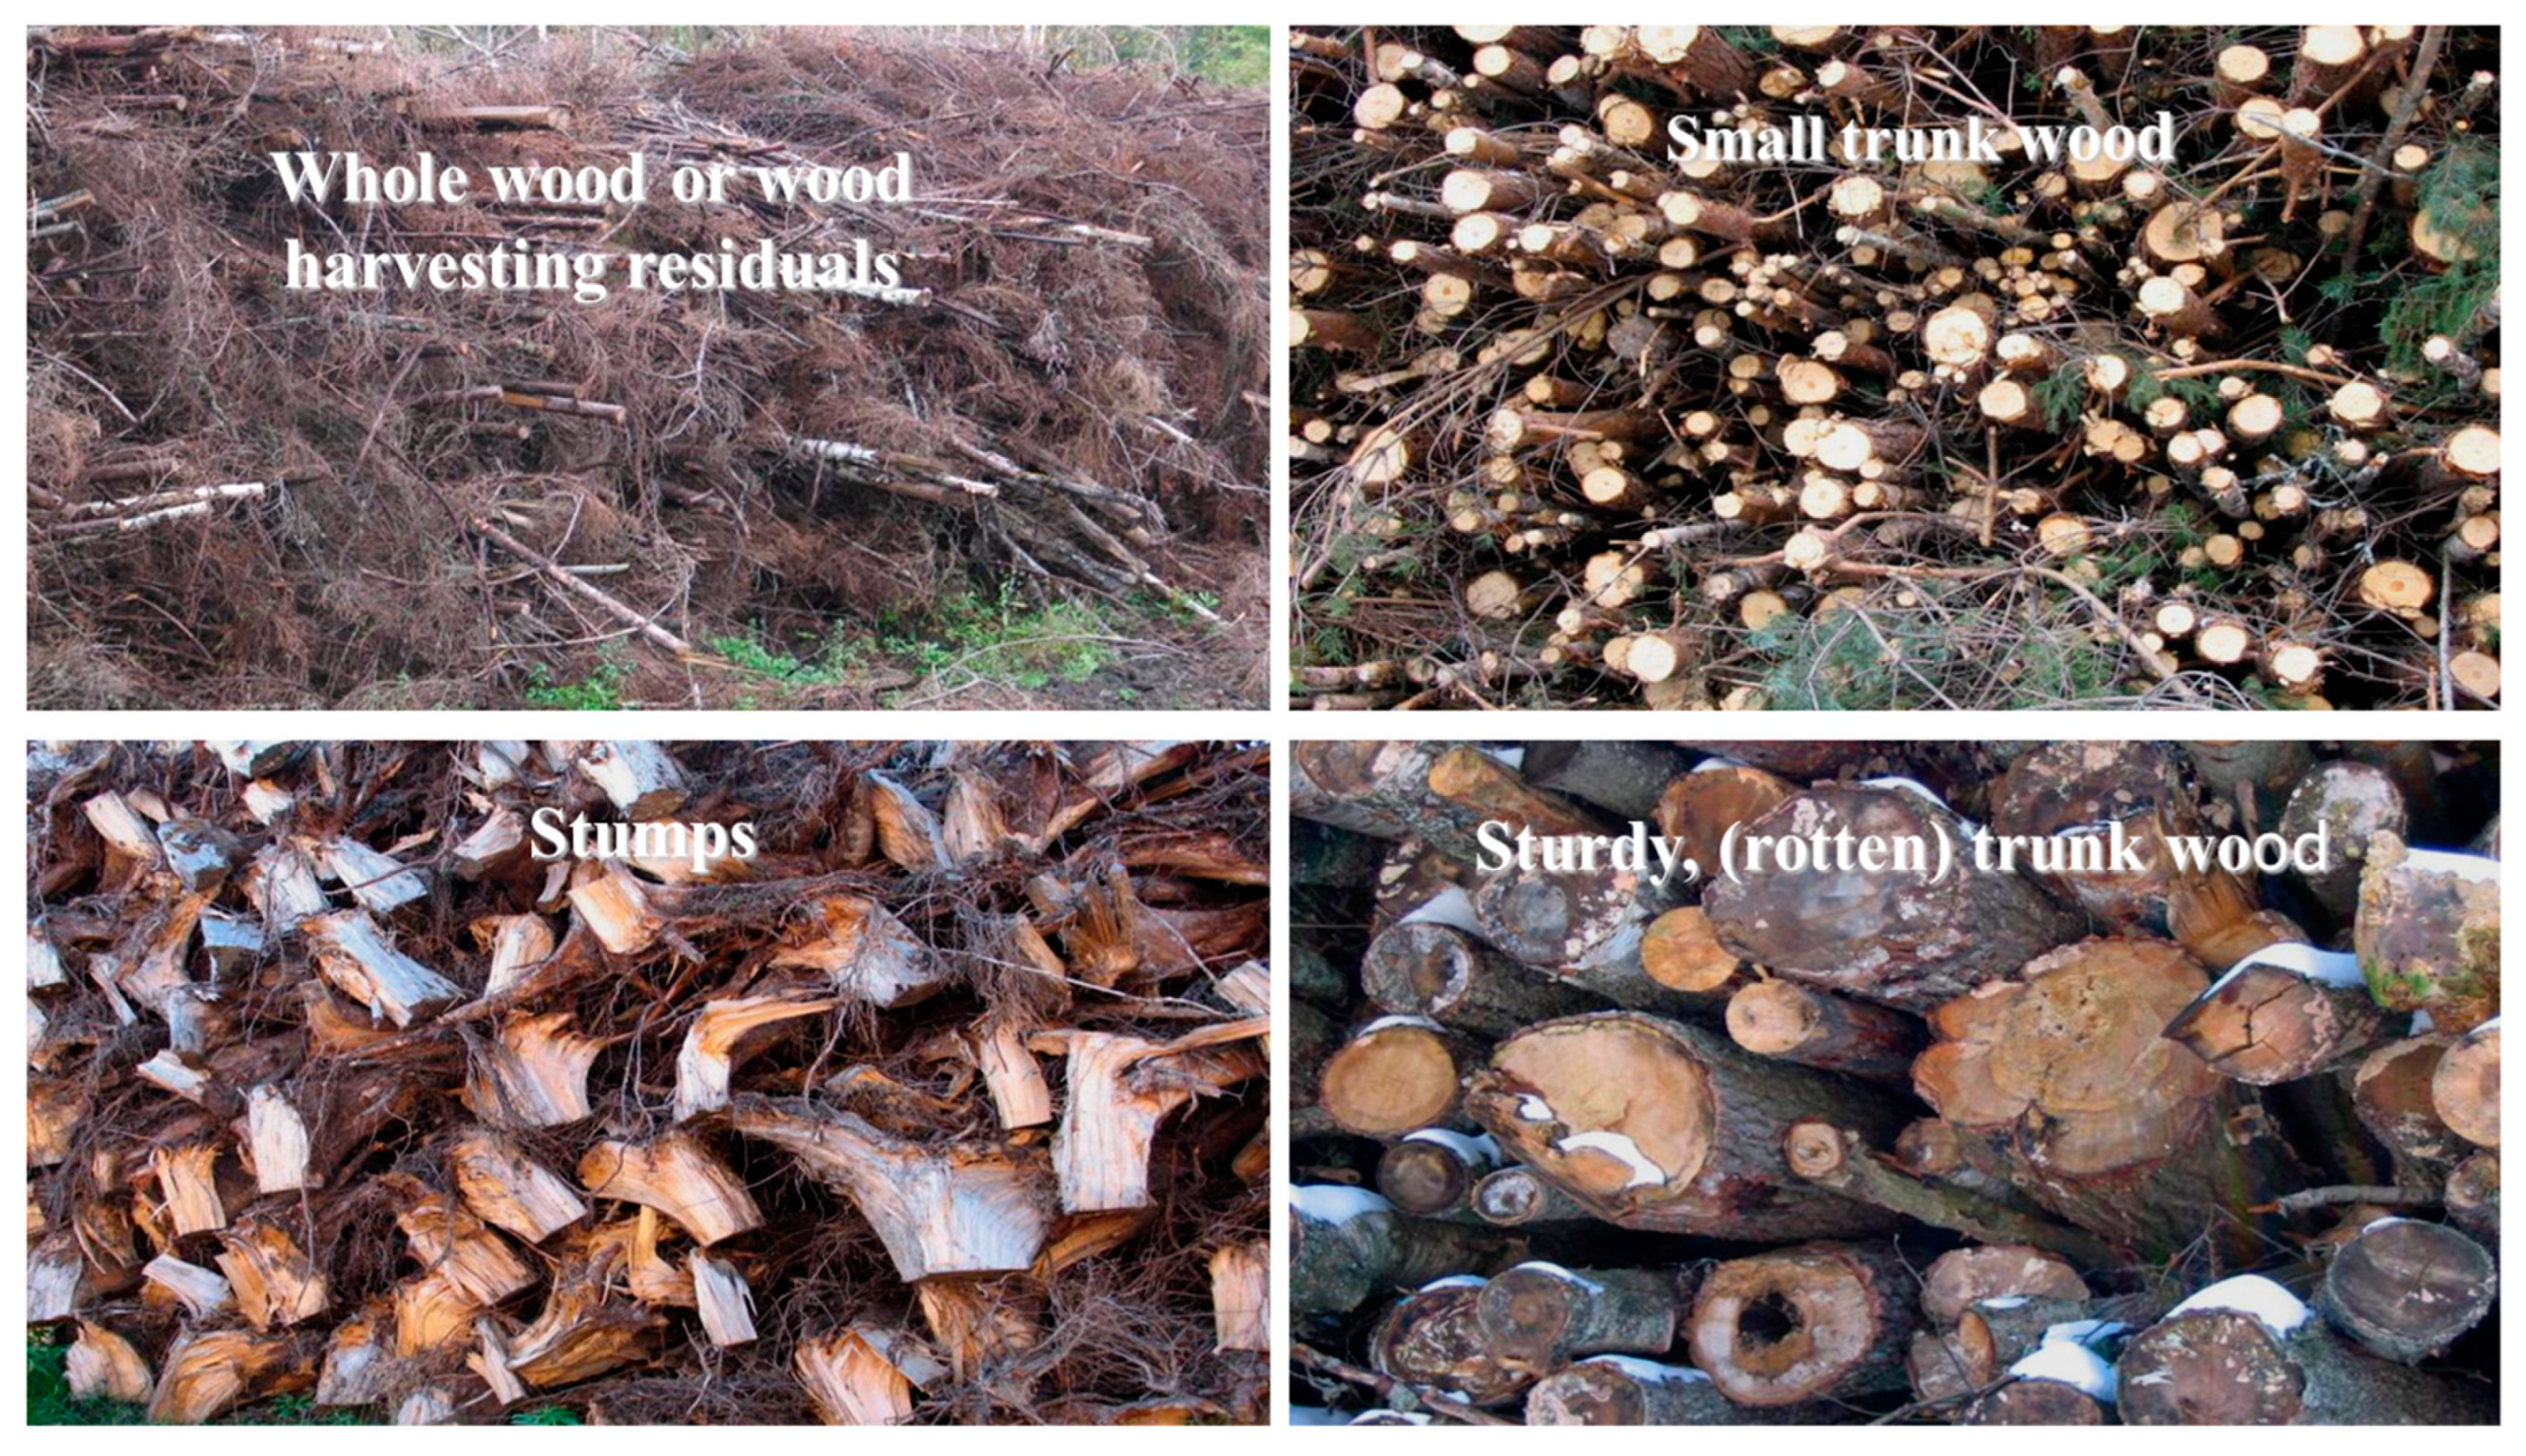
Figure 7.
Wood procurement areas around the CHP plant: A—the unsustainable region in non-renewable forests (yellow), B—the sustainable techno-economic region in renewable forests (red).
Figure 7.
Wood procurement areas around the CHP plant: A—the unsustainable region in non-renewable forests (yellow), B—the sustainable techno-economic region in renewable forests (red).
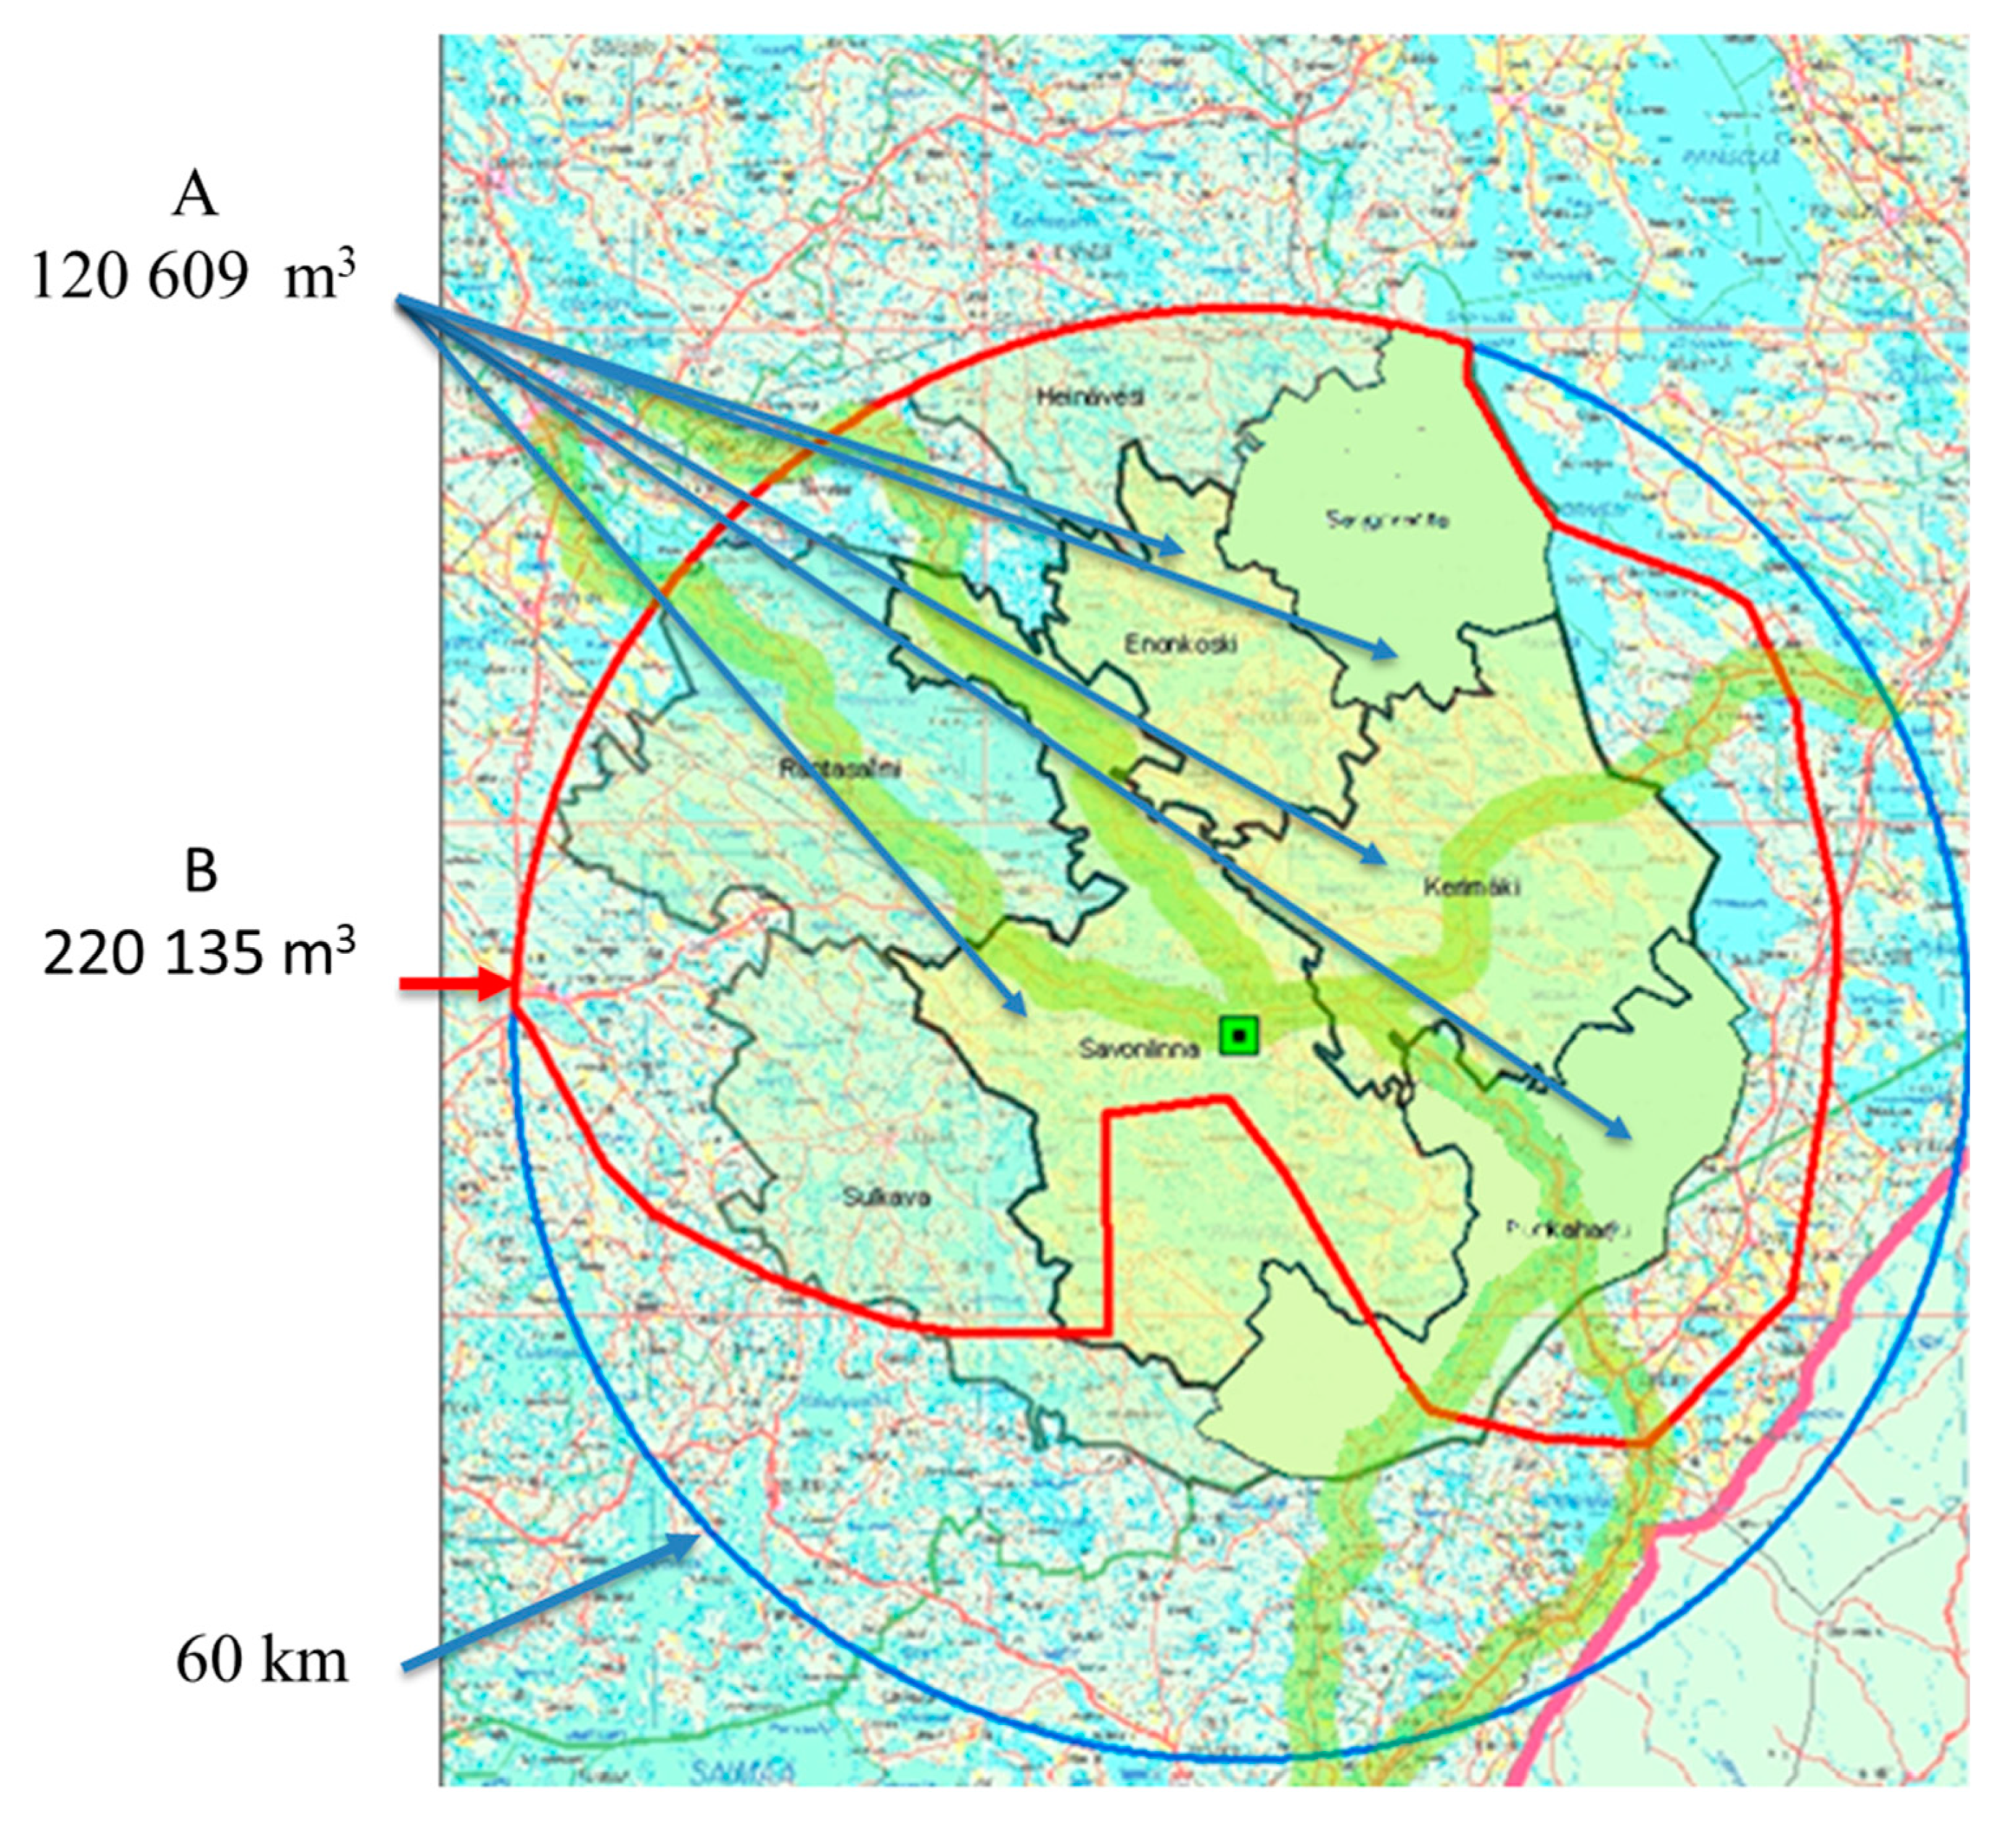

Table 1.
Growing stock volume and the average annual growth for tree species and roundwood assortment on forest land available for wood supply of the IMEI. P—pine, S—spruce, B—birch, OD—other deciduous species, t—total, l—log, p—pulpwood.
Table 1.
Growing stock volume and the average annual growth for tree species and roundwood assortment on forest land available for wood supply of the IMEI. P—pine, S—spruce, B—birch, OD—other deciduous species, t—total, l—log, p—pulpwood.
| Municipality | Growth | Pt | Pl | Pp | St | Sl | Sp | Bt | Bl | Bp | ODt | ODl | ODp | All |
|---|---|---|---|---|---|---|---|---|---|---|---|---|---|---|
| % | m3/1 000 | |||||||||||||
| Enonkoski | 6.6 | 1353 | 726 | 584 | 1577 | 824 | 654 | 645 | 108 | 461 | 139 | 16 | 79 | 3714 |
| Heinävesi | 6.1 | 5100 | 2677 | 2280 | 6480 | 3305 | 2777 | 2250 | 320 | 1635 | 430 | 46 | 267 | 14260 |
| Juva | 6.4 | 6836 | 3568 | 3055 | 5093 | 2631 | 2133 | 2507 | 366 | 1801 | 708 | 43 | 462 | 15145 |
| Kitee | 5.9 | 6386 | 3093 | 3021 | 5205 | 2637 | 2223 | 3146 | 449 | 2355 | 475 | 48 | 238 | 15212 |
| Parikkala | 6.6 | 2369 | 1203 | 1076 | 2371 | 1244 | 1015 | 1419 | 241 | 1064 | 508 | 56 | 298 | 6667 |
| Puumala | 6.0 | 5779 | 2959 | 2620 | 2364 | 1228 | 991 | 1628 | 274 | 1192 | 344 | 47 | 209 | 10116 |
| Rääkkylä | 5.3 | 1641 | 826 | 759 | 2212 | 1190 | 897 | 1159 | 189 | 842 | 223 | 26 | 122 | 5235 |
| Rantasalmi | 7.1 | 2304 | 1201 | 1033 | 2633 | 1427 | 1047 | 1411 | 239 | 992 | 417 | 37 | 266 | 6765 |
| Rautjärvi | 5.8 | 1159 | 563 | 546 | 1363 | 584 | 661 | 711 | 100 | 519 | 315 | 24 | 198 | 3548 |
| Ruokolahti | 5.5 | 5884 | 2971 | 2706 | 3773 | 1915 | 1616 | 1918 | 311 | 1375 | 437 | 49 | 259 | 12012 |
| Savonlinna | 6.9 | 11580 | 6085 | 5107 | 10754 | 5837 | 4298 | 5272 | 866 | 3813 | 1259 | 151 | 692 | 28865 |
| Sulkava | 6.5 | 3372 | 1722 | 1531 | 2004 | 1003 | 861 | 1244 | 190 | 900 | 312 | 23 | 185 | 6932 |
| Varkaus | 6.4 | 1759 | 900 | 811 | 2135 | 1149 | 861 | 1030 | 162 | 748 | 233 | 34 | 144 | 5157 |
Table 2.
Growing stock volume for tree species and roundwood assortment on forest land available for wood supply of energy plants. P—pine, S—spruce, B—broadleaved, A—all tree species, b—branch, foliage, and stem residual, sr—stumps and big roots.
Table 2.
Growing stock volume for tree species and roundwood assortment on forest land available for wood supply of energy plants. P—pine, S—spruce, B—broadleaved, A—all tree species, b—branch, foliage, and stem residual, sr—stumps and big roots.
| Municipality | Pb | Psr | Sb | Ssr | Bb | Bsr | Ab | Asr |
|---|---|---|---|---|---|---|---|---|
| m3/1 000 | ||||||||
| Enonkoski | 55 | 61 | 104 | 73 | 49 | 23 | 208 | 157 |
| Heinävesi | 176 | 190 | 416 | 313 | 169 | 67 | 761 | 570 |
| Juva | 212 | 235 | 387 | 259 | 211 | 104 | 810 | 598 |
| Kitee | 246 | 235 | 343 | 226 | 229 | 110 | 818 | 571 |
| Parikkala | 74 | 81 | 121 | 87 | 105 | 73 | 300 | 241 |
| Puumala | 189 | 190 | 173 | 121 | 151 | 79 | 513 | 390 |
| Rääkkylä | 66 | 68 | 141 | 96 | 93 | 40 | 300 | 204 |
| Rantasalmi | 77 | 87 | 191 | 136 | 122 | 63 | 390 | 286 |
| Rautjärvi | 35 | 33 | 68 | 41 | 60 | 29 | 163 | 103 |
| Ruokolahti | 197 | 192 | 241 | 173 | 175 | 92 | 613 | 457 |
| Savonlinna | 428 | 459 | 694 | 509 | 427 | 208 | 1549 | 1176 |
| Sulkava | 116 | 114 | 155 | 100 | 120 | 50 | 391 | 264 |
| Varkaus | 64 | 73 | 162 | 125 | 90 | 44 | 316 | 242 |
Table 3.
The amount of annual growth (1000 m3) for tree species and roundwood assortments in wood procurement region A available for the wood supply of the CHP plant. P—pine, S—spruce, B—broadleaved, A—all tree species, b—branch, foliage, and stem residual.
Table 3.
The amount of annual growth (1000 m3) for tree species and roundwood assortments in wood procurement region A available for the wood supply of the CHP plant. P—pine, S—spruce, B—broadleaved, A—all tree species, b—branch, foliage, and stem residual.
| Municipality | Pb | Sb | Bb | Ab |
|---|---|---|---|---|
| m3/1 000 | ||||
| Enonkoski | 55 | 104 | 49 | 208 |
| Savonlinna | 428 | 694 | 427 | 1549 |
| All | 483 | 798 | 476 | 1757 |
| Totals | 120609 | |||
Table 4.
The amount of annual growth (1000 m3) for tree species and roundwood assortments in wood procurement region B available for the wood supply of the CHP-plant. P—pine, S—spruce, B—broadleaved, A—all tree species, b—branch, foliage, and stem residual.
Table 4.
The amount of annual growth (1000 m3) for tree species and roundwood assortments in wood procurement region B available for the wood supply of the CHP-plant. P—pine, S—spruce, B—broadleaved, A—all tree species, b—branch, foliage, and stem residual.
| Municipality | Pb | Sb | Bb | Ab |
|---|---|---|---|---|
| m3/1 000 | ||||
| Enonkoski | 55 | 104 | 49 | 208 |
| Heinävesi | 176 | 416 | 169 | 761 |
| Rantasalmi | 77 | 191 | 122 | 390 |
| Savonlinna | 428 | 694 | 427 | 1549 |
| Sulkava | 116 | 155 | 120 | 391 |
| All | 852 | 1560 | 887 | 3299 |
| Totals | 220135 | |||
Table 5.
The payment ability of CHP conversion to buy the three most profitable energy wood assortments for a wood procurement amount of 60,000 m3 in the reference region A. P5—Energy trunks are bought at the roadside, where chipping also takes place. P6—Energy trunks are bought at the roadside, transported to the terminal, and chipped at an appropriate time with efficient equipment. P7—Energy trunks are purchased for factory delivery, transported to its terminal, and chipped at an appropriate time with efficient equipment.
| Renewable wood share |
Market share of renewable wood |
Transport distance |
EEAP | P5 | P6 | P7 |
|---|---|---|---|---|---|---|
| % | % | km | EUR/t CO2 eq | € m-3 | ||
| 80 | 39.8 | 40 | 70 | 27 | 32 | 42 |
| 90 | 44.7 | 30 | 70 | 33 | 40 | 49 |
| 100 | 49.8 | 20 | 70 | 40 | 49 | 55 |
| 80 | 39.8 | 40 | 85 | 24 | 29 | 40 |
| 90 | 44.7 | 30 | 85 | 32 | 39 | 48 |
| 100 | 49.8 | 20 | 85 | 40 | 49 | 55 |
| 80 | 39.8 | 40 | 100 | 22 | 27 | 37 |
| 90 | 44.7 | 30 | 100 | 31 | 38 | 46 |
| 100 | 49.8 | 20 | 100 | 40 | 49 | 55 |
Table 6.
The payment ability of CHP conversion to buy the three most profitable energy wood assortments for a wood procurement amount of 60,000 m3 in the region B. P5—Energy trunks are bought at the roadside, where chipping also takes place. P6—Energy trunks are bought at the roadside, transported to the terminal, and chipped at an appropriate time with efficient equipment. P7—Energy trunks are purchased for factory delivery, transported to its terminal, and chipped at an appropriate time with efficient equipment.
| Renewable wood share |
Market share-aim of renewable wood |
Transport distance |
EEAP | P5 | P6 | P7 |
|---|---|---|---|---|---|---|
| % | % | km | EUR/t CO2 eq | € m-3 | ||
| 100 | 27.3 | 50 | 70 | 35 | 38 | 51 |
| 100 | 27.3 | 40 | 70 | 37 | 42 | 52 |
| 100 | 27.3 | 30 | 70 | 38 | 46 | 54 |
| 100 | 27.3 | 50 | 85 | 35 | 38 | 51 |
| 100 | 27.3 | 40 | 85 | 37 | 42 | 52 |
| 100 | 27.3 | 30 | 85 | 38 | 46 | 54 |
| 100 | 27.3 | 50 | 100 | 35 | 38 | 51 |
| 100 | 27.3 | 40 | 100 | 37 | 42 | 52 |
| 100 | 27.3 | 30 | 100 | 38 | 46 | 54 |
Table 7.
The payment ability of CHP conversion to buy the three most profitable energy wood assortments for a wood procurement amount of 100,000 m3 in the reference region A. P5—Energy trunks are bought at the roadside, where chipping also takes place. P6—Energy trunks are bought at the roadside, transported to the terminal, and chipped at an appropriate time with efficient equipment. P7—Energy trunks are purchased for factory delivery, transported to its terminal, and chipped at an appropriate time with efficient equipment.
| Renewable wood share |
Market share of renewable wood |
Market share-aim of renewable wood |
Transport distance |
EEAP | P5 | P6 | P7 |
|---|---|---|---|---|---|---|---|
| % | % | % | km | EUR/t CO2 eq | € m-3 | ||
| 48 | 39.8 | 66.3 | 40 | 70 | 10 | 15 | 25 |
| 54 | 44.7 | 74.6 | 30 | 70 | 14 | 22 | 30 |
| 60 | 49.8 | 82.9 | 20 | 70 | 19 | 28 | 34 |
| 48 | 39.8 | 66.3 | 40 | 85 | 4 | 9 | 19 |
| 54 | 44.7 | 74.6 | 30 | 85 | 9 | 16 | 25 |
| 60 | 49.8 | 82.9 | 20 | 85 | 15 | 24 | 30 |
| 48 | 39.8 | 66.3 | 40 | 100 | 13 | 3 | -2 |
| 54 | 44.7 | 74.6 | 30 | 100 | 4 | 11 | 19 |
| 60 | 49.8 | 82.9 | 20 | 100 | 10 | 19 | 26 |
Table 8.
The payment ability of CHP conversion to buy the three most profitable energy wood assortments for a wood procurement amount of 100,000 m3 in the region B. P5—Energy trunks are bought at the roadside, where chipping also takes place. P6—Energy trunks are bought at the roadside, transported to the terminal, and chipped at an appropriate time with efficient equipment. P7—Energy trunks are purchased for factory delivery, transported to its terminal, and chipped at an appropriate time with efficient equipment.
| Renewable wood share |
Market share-aim of renewable wood |
Transport distance |
EEAP | P5 | P6 | P7 |
|---|---|---|---|---|---|---|
| % | % | km | EUR/t CO2 eq | € m-3 | ||
| 80 | 36.3 | 50 | 70 | 28 | 35 | 43 |
| 90 | 40.9 | 40 | 70 | 32 | 37 | 47 |
| 100 | 45.4 | 30 | 70 | 36 | 39 | 51 |
| 80 | 36.3 | 50 | 85 | 26 | 33 | 41 |
| 90 | 40.9 | 40 | 85 | 31 | 36 | 46 |
| 100 | 45.4 | 30 | 85 | 36 | 39 | 51 |
| 80 | 36.3 | 50 | 100 | 23 | 31 | 39 |
| 90 | 40.9 | 40 | 100 | 30 | 35 | 45 |
| 100 | 45.4 | 30 | 100 | 36 | 39 | 51 |
Disclaimer/Publisher’s Note: The statements, opinions and data contained in all publications are solely those of the individual author(s) and contributor(s) and not of MDPI and/or the editor(s). MDPI and/or the editor(s) disclaim responsibility for any injury to people or property resulting from any ideas, methods, instructions or products referred to in the content. |
© 2023 by the authors. Licensee MDPI, Basel, Switzerland. This article is an open access article distributed under the terms and conditions of the Creative Commons Attribution (CC BY) license (http://creativecommons.org/licenses/by/4.0/).
Copyright: This open access article is published under a Creative Commons CC BY 4.0 license, which permit the free download, distribution, and reuse, provided that the author and preprint are cited in any reuse.


