Submitted:
14 November 2023
Posted:
16 November 2023
You are already at the latest version
Preprints on COVID-19 and SARS-CoV-2
Abstract
Respiratory viral infections (RVI) are common reasons for healthcare consultations. The inpatient management of RVI consumes significant resources.
From 2009-2014, we assessed the costs of RVI management in 4776 hospitalized chil-dren aged 0-18 years participating in a quality improvement program, where all ILI patients underwent virologic testing at the National Reference Centre followed by de-tailed recording of their clinical course.
The direct (medical or non-medical) and indirect costs of inpatient management outside the ICU (“non-ICU”) versus management requiring ICU-care (“ICU”) added up to 2,767.14€ (non-ICU) vs. 29,941.71€ (ICU) for Influenza, 2,713.14€ (non-ICU) vs. 16,951.06€ (ICU) for RSV infections, and 2,767.33€ (non-ICU) vs. 14,394.02€ (ICU) for human rhinovirus (hRV) infections, respectively.
Non-ICU inpatient costs were similar for all 8 RVI studied: Influenza, RSV, hRV, ade-novirus (hAdV), metapneumovirus (hMPV), parainfluenzavirus (hPIV), bocavirus (hBoV) and seasonal coronavirus (hCoV) infections. ICU-costs for Influenza however, ex-ceeded all other RVI. At the time of the study, Influenza was the only RVI with antivi-ral treatment options available for children, but only 9.8% of Influenza patients (non-ICU) and 1.5% of ICU-patients with Influenza received antivirals; only 2.9% were vac-cinated. Future studies should investigate the economic impact of treatment and pre-vention of Influenza-, COVID-19-, and RSV post vaccine introduction.
Keywords:
influenza-like illness
; respiratory virus
; respiratory viral infection
; direct medical cost
; non-direct medical cost
; social determinants of health
Key Findings
- We studied the cost of hospitalization in 4776 children aged 0-18 years with symptomatic ILI and laboratory-confirmed infection with influenza virus, RSV, hAdV, hRV, hMPV, hPIV, hBoV and hCoV.
- In this pediatric hospital setting, the highest overall cost resulted from Influenza with 2,767.14€ (non-ICU) and 29,941.71€ (ICU), followed by RSV infection with 2,713.14€ (non-ICU) and 16,951.06€ (ICU).
- Of the patients with RSV infection, 77.2% were hospitalized. Of them, 33.3% required oxygen supplementation and 31.5% were admitted to the ICU, compared to 13.2 % with Influenza.
- In this pre-pandemic setting, only 2.9% of children with Influenza were vaccinated in the respective season, only 11.3% received antivirals. There was no universal influenza vaccine recommendation in Germany at this time.
- The impact of COVID and RSV vaccine introduction remain to be studied.
1. Introduction
The economic burden of influenza-like illness (ILI) associated with respiratory viruses (RV) is poorly understood. RV infections (RVI) are among the most common reasons for healthcare visits, especially in children [1, 2]. The inpatient management of RVI and ILI occupies significant personnel and institutional resources. During the COVID-19 pandemic it became evident that RVI may take clinics and hospitals to their limit. Some RVI, such as those caused by SARS-CoV-2, respiratory syncytial virus (RSV) and influenza virus, have since become vaccine preventable, and there are antiviral treatment options available for COVID-19 and Influenza [3, 4]. Additional antivirals against RVI are in development [5, 6], which will warrant adaptations in best practices and clinical decision making in the near future.
In this study, we make use of a unique setting in one of Europe’s largest pediatric academic hospitals to gain better understanding of the economic impact of the 8 most common respiratory viral infections in children: influenza virus, RSV, human adenovirus (hAdV), human rhinovirus (hRV), human metapneumovirus (hMPV), human parainfluenzavirus (hPIV), human bocavirus (hBoV) and human coronavirus (hCoV). We studied this question in the absence of universal pediatric vaccine recommendations for any of the 8 RVI.
The present study was conducted in the context of a six-year Quality Improvement (QI) program, where all patients aged 0-18 years who fulfilled a predefined ILI case definition (fever ≥38°C and ≥ 1 respiratory symptom or physician-documented ILI) received laboratory RT-PCR diagnostics [7]. To determine disease severity and risk factors consistently across all patients participating in the QI program, we used a previously published and validated composite clinical score, the VIVI Disease Severity Score, capturing key 22 variables in real-time via mobile app (the VIVI ScoreApp) [7-12]. Disease severity and individual risk factors were therefore systematically captured in all patients in compliance with clinical data standards. In addition, the QI team captured detailed clinical data throughout the hospital course such as standardized severity and risk scores and virologic testing, as well as clinical data including vaccination and treatment history. The QI team left the routine hospital system unchanged, therefore two systems “ran” simultaneously. This program, therefore, was suitable to compare QI system data with the clinical decision-making in routine care such as routine use of diagnostics, International Classification of Disease (ICD)-coding, hospital admission, ICU admission, oxygen support, use of mechanical ventilation, virologic and imaging studies, and so forth.
Our team participated in a previously published international collaborative study investigated the costs associated with RSV lower respiratory tract infection (LRTI) in hospitalized children [13]. In this present study, we expand the scope to include infections caused by seven other major RV to put RSV costs into context, to understand better, which RVI cause particularly high costs in the inpatient setting, and which RVI most frequently lead to inpatient admissions or respiratory support measures. This question is particularly interesting after the global COVID-19 pandemic when the cost of RVI management was widely discussed in the context of (a) ethics and equity and the fair allocation of resources, as well as (b) questions regarding the impact of immunization, antiviral therapy, and other interventions in cost and disease severity.
In this present study, we compare the costs of inpatient management and intensive care among children with laboratory-confirmed Influenza, (seasonal) coronavirus infection, RSV infection, and infections with 5 other common RV. We had the opportunity to study this question in a pre-(COVID-19) pandemic setting, where Influenza was the only RVI, for which vaccines and/or antiviral therapy were available. There was no pediatric influenza vaccine recommendation in Germany at the time [14], and antivirals were hardly, if ever, used. Therefore, this study informs about the impact of “natural” RVI without the mitigating effect of vaccines and antiviral therapy. The decision to admit to the ICU is often due to a patient’s need for mechanical ventilation, therefore we also recorded the requirement for mechanical ventilation.
Ever since 2003, Germany uses modifications of the most widely reimbursement system for inpatient health services, the Diagnosis-Related Groups (DRG) [15]. To make costs comparable with other countries, where no DRG system exists, and to assess the use of hospital resources in greater detail we also calculated cost based on individual line items.
The medical profession strives for equal treatment of all patients, but disparities in health care still exist. Especially during the COVID-19 pandemic, equality became an issue, and emergency room triage systems and access to diagnostic testing, mechanical ventilation, intensive care, as well as antivirals were questioned. We therefore investigate in our pre-pandemic cohort, whether social determinants of health (SDH) were influencing such decisions ( i.e., surrogate markers captured in the context of the QI program, such as ethnicity, race, migratory background, birth rank, number of children, individuals in the household, and education) can be linked to the likelihood of diagnostic procedures performed in the emergency department and/or the decision to admit to the hospital. We were interested in the questions whether SDH played any role or whether (as it should if there is equal access) the clinical decision to perform virological testing, to admit to hospital and/or ICU solely depended on the patient’s level of disease severity (as assessed by the VIVI ScoreApp) and/or individual risk.
The objectives of these analyses are as follows:
- (a)
- to identify the inpatient management costs associated with the 8 most common RVI in the pediatric age group.
- (b)
- to specificy costs associated with hospitalization in a general ward versus ICU-stay, and/or need for mechanical ventilation, continuous positive airway pressure (CPAP), or oxygen support.
- (c)
- to assess the relationship between risk factors, disease severity, and SDH (using surrogate markers) with regards to clinical decision making regarding: diagnostic tests performed in the emergency department (ED), admission to hospital/ICU, start of mechanical ventilation/CPAP/oxygen supply, respectively.
2. Materials and Methods
2.1. Cohort Analysis
As described previously [16, 17], from December 2009 to March 2014, a specifically trained QI team performed standardized clinical assessments and virologic testing of all ILI patients aged 0 to 18 years at the point of care. The QI program was approved by the institutional review board (Charité EA 24/008/10). Informed consent procedures were waived for the purpose of enhanced quality of care and infection control.
Throughout the year, the QI team screened daily all hospitalized patients (including patients in the intensive care units) on admission as well as throughout their hospital stay, in addition to all patients presenting to the ED (once a week). Patients with a documented physician diagnosis of ILI and/or fulfilling the QI ILI case definition automatically participated in the QI program. Influenza-like illness case criteria were defined as evidence of fever with a body temperature ≥38°C and ≥1 respiratory symptom (including cough, rhinitis/coryza, red/sore throat, ear ache, dyspnea, tachypnea, labored breathing, wheezing) [16]. Nasopharyngeal swabs were collected in universal transport medium (CopanTM, Copan Diagnostics, Murrieta, CA) and investigated at the National Reference Centre for Influenza at the Robert Koch-Institute, Berlin. Specimens were analyzed by real-time PCR for influenza A and B virus, RSV, hMPV, hAdV, hRV, hBoV (hBoV-1), hPIV (hPIV1-4), and hCoV (NL63, 229E, OC43) [18, 19, 9, 20-22].
2.2. RT-PCR Analysis
Nucleic acid was extracted from nasopharyngeal swabs by MagNA Pure 96 DNA and Viral NA Small Volume Kit (Roche, Basel, Switzerland), MagAttract Viral RNA M48 Kit (Qiagen, Venlo, Netherlands), or RTP DNA/RNA Virus Mini Kit (Invitek, Berlin, Germany) according to the manufacturer’s instructions using a specimen volume of 200, 300, and 400 μL, respectively. Twenty-five microliters of extracted RNA were subjected to cDNA synthesis applying 200 U M-MLV Reverse Transcriptase (Invitrogen, Carlsbad, USA) in a total reaction volume of 40 μL.
Specimens were analyzed for influenza A and B virus, RSV, hMPV, hAdV, and hRV by real-time PCR as published previously [8, 17, 21, 18-20]. Investigation of hCoV (NL63, 229E, OC43, and HKU1), hPIV1-4, and hBoV-1 was performed in a total reaction volume of 15 μL containing 1× PCR buffer, 4 mM MgCl2, 0.2 mM dNTP with dUTP, 40 ng/μL BSA, 0.3 U Platinum Taq Polymerase primers and probes and 5 μL of cDNA (or nucleic acid for hBoV-1). Amplification was carried out at 95°C for 300 seconds, followed by 45 cycles at 95°C for 15 seconds and 60°C for 30 seconds [9].
2.3. Patients’ Baseline Demographics
In this study, we examine relationships between variables in a contingency table by employing the chi-square test of independence. This function calculates the Pearson’s chi-squared statistic and corresponding p-value, which serve as indicators for testing the independence hypothesis among the observed frequencies in the contingency table. To compute the expected frequencies, we rely on the marginal sums under the assumption that the variables are independent [23].
To compute confidence intervals, we used the Wilson Score Interval method, which addresses the limitations of the normal approximation interval [24]. This technique introduces asymmetry into the process of interval estimation. The Wilson score interval, as opposed to the symmetric normal interval, avoids issues such as overshoot and zero-width intervals, making it a more robust option for analyzing small sample sizes and cases where the probability value is close to 0 or 1. This method of interval estimation is particularly useful for dealing with skewed observations and yields more precise results in statistical inference.
2.4. Analysis of Clinical Decision-Making
Key indicators of clinical decision-making assessed in the QI program included in the analysis were the same as above: (a) performance of diagnostic tests (see below), (b) admission to hospital or ICU, (c) placement of a patient on oxygen or CPAP or mechanical ventilation, respectively. Diagnostic testing included under (a) in our analysis were: chest X-ray and/or blood collection and/or performance of RV routine testing per commercial multiplex-PCR (Luminex xTAG® RVP FAST V2; Luminex Corporation, Austin, TX, USA).
2.5. Cost Analysis
The primary outcome for this study was the cost of ILI-associated hospitalization from admission to discharge as well as ED costs for those ILI patients who remained outpatients, i.e., were discharged directly from the ED. Costs for inpatients stays were split into costs at the intensive care unit (“ICU”, which included intermediate care units) versus non-ICU for the 8 different types of viral infection. We compared 3 age groups: 0-5 years, 6-12 years, and 13-18 years.
We determined total costs by combining direct costs of patient care including drug treatment cost, cost of hospital bed per day, nebulization, respiratory and physiotherapy, X-ray, consultation fees for physicians and affiliate health workers, laboratory tests, as well as non-medical direct costs including transportation costs and non-medical indirect cost due to loss of working hours by the caregiver.
Costs were then separately determined as per usual in Germany, i.e., using DRG (with the state prime rates of 2015). DRGs are a classification system that assign patients to different “DRG groups” that are clinically meaningful, with the goal to underwrite payment rates depending on the average effort and costs incurred be the management of patients with similar disease entities. To this end, DRGs are based on sociodemographic and diagnostic information and coded in line with the International Classification of Diseases, and therapeutic information routinely collected during hospitalization [25]. Therapeutic information is coded with country-specific procedure coding systems such as the Operation and Procedure Code used in Germany. In 2003 the German-diagnosis related groups were introduced for reimbursement of inpatient treatment [26].
Individual cost assessments in this study were based on interviews by QI staff and review of the Charité emolument agreement, wage agreement, and sales information for work medical equipment. We updated all costs to 2015 Euro/SU Dollar conversion rates using Bloomberg.com: exchange rate 1Eur = 1,09 USD as of 10 Dec 2015.
Our study’s cost data were analysed using the Two Factor ANOVA (without replication) technique [27]. This statistical method offers a robust framework for examining the effects of two factors on a response variable, allowing for the evaluation of both the main effects of each factor and their interaction effects on the dependent variable of interest. By employing this technique, we gained deeper understanding of the investigated factors and their effect on observed outcomes. The Two Factor ANOVA without Replication method provides a dependable method of statistical inference in situations characterized by limited resources.
2.6. Analysis of Clinical Decision-Making in Relation to Risk-Adjusted Disease Severity (raVIVI Score) vs. Social Determinants of Health (SDH)
For this analysis we assessed clinical decisions in relation to the patient’s risk-adjusted severity score (raVIVI Score) which is calculated from the VIVI Disease Severity Score (“VIVI Score”) and the VIVI Risk Factor Score as published previously: VIVI Disease Severity Score/(VIVI Risk Factor Score+1) [10]. The goal of the raVIVI Score is to simulate a clinician’s thinking, i.e. weighing the patient’s disease severity at the time of measurement, in relation to their individual risk of severe disease such as age or underlying conditions.
The raVIVI Score was measured with the help of the VIVI ScoreApp 1.0, a mobile application allowing healthcare professionals to grade disease severity and risk in their patients according to the criteria of the VIVI Score [28]. The VIVI Score is a previously published 22-item weighed clinical composite score, which was developed based on systematic literature review and WHO-criteria of uncomplicated and complicated disease [8]. The VIVI Score as well as the mobile app were subsequently validated in single and multi-center studies in Europe (PEDSIDEA) and the USA [10]. VIVI Scores can range from 0 to 48 [8, 10-12].
The VIVI Risk Factor Score captures underlying conditions that may lead to increased disease severity in patients with ILI and RVI, such as age <2 or >65 years, chronic underlying conditions, and premature birth [8]. After assessing for risk factors unique to each patient, the VIVI ScoreApp asks for the 22 items of disease severity as per VIVI Score, using terminologies and a data format fully compliant with CDISC standards [29].
For the purposes of this study, we assessed whether disease severity in relation to individual risk (i.e., the raVIVI Score) was the main driver of clinical decisions , as would be expected in a perfectly equitable and fair system.
For comparison, we evaluated whether the SDH Score factored into the doctor’s decision making. This would be an indicator of potential clinician bias in clinical decision-making. To this end, we set up an SDH Score calculated from the following patient characteristics: i) ethnicity (other than not Hispanic or Latino), ii) race (other than Caucasian or white), iii) migratory background, iv) birth rank (>1), v) number of children (>2), vi) number of individuals in the household (<3 or >3), and vii) level of education (high school graduation prior to 10th grade). If any of the SDH criteria are characteristics i)-vii) is present, they count for one point each, if a characteristic not present or unknown, it counts for 0 points.
For statistical examination, we used logistic regression models predicting a YES/NO outcome (e.g., ICU admission) based on a predictor (score), e.g., SDH Score versus raVIVI Score [30]. The coefficient for SDH Score for example, reflects how the likelihood of ICU admission changes with a one-unit change in the SDH Score. The intercept represents the log odds of being admitted to the ICU when the SDH Score is zero. The odds ratio indicates the multiplicative change in the odds of ICU admission for each one-unit increase in the SDH Score. For example, an odds ratio of 1.09 means that for every one-point increase in the SDH Score, the odds of being admitted to the ICU are 9% higher, assuming all other variables remain constant. The p-values indicate whether a score (SDH Score versus raVIVI Score) influences the likelihood of the outcome (e.g., ICU admission or diagnostic test).
3. Results
3.1. Patients’ Baseline Demographics
From December 2009 to March 2014, 4776 pediatric ILI patients participated as a part of the QI program (55.8% male, median age 1.6 years, age range 0-18.8). Patients with Influenza were older than the average RVI patients (median 4.3 years; range 0.1-18.8). Patients with RSV infection were younger on average (median 0.8 years; range 0.0-14.5) compared to patients with other types of RVI. There was a slight predominance of males among patients with hMPV and hBoV. Patients with hRV infection were slightly more likely to have underlying pulmonary conditions (11.4%, 95% CI 9.1,14.1), patients with hCoV infection were more likely to have underlying neurological conditions (9.2%, 95% CI 4.5,17.8) or to have been born prematurely (9.2%, 95% CI 4.5,17.8). Demographic characteristics and risk factors of patients with different RVI are displayed in Table 1.
3.2. Analysis of RVI in Relation to Clinical Decision-Making
- (a)
- Diagnostic Testing
We analysed the proportion of patients receiving diagnostic tests (as outlined in 1.5. in the Methods Section) in relation to the RVI detected in the respective patient (Figure 1).
Human coronavirus infection (40.8%, 95% CI 30.4,52.0) followed by human parainfluenzavirus infection (45.3%, 95% CI 38.4,52.4) were the rarest cause for diagnostic testing.
- (b)
- Hospitalization and ICU admission
Analysis of the proportion of patients with different RVI who required hospitalization versus ICU admission are summarized in Figure 2.
Hospitalization: RSV infection was the primary reason for hospitalization in 77.2% (95% CI 73.3,80.7) of the patients, hBoV infection followed with 72.1% (95% CI 66.2,77.2) hospitalization.
ICU admission: For ICU admission, hPIV infection was the second most commonly cause (24.2%; 95% CI 18.7,30.8) and hMPV infection the third most commonly cause (23.7%; 95% CI 17.2,31.6).
- (c)
- Mechanical Ventilation, CPAP and Oxygen Supplementation
We analyzed the use of mechanical ventilation, CPAP and O2 supplementation in relation to the RVI detected in the respective patient.
Mechanical Ventilation: Mechanical ventilation was most used in patients with Influenza (in 1%; 95% CI 0.4,2.5).
CPAP and O2-supplementation: CPAP and O2-supplementation were most used in patients with RSV: CPAP 1.8% (95% CI 0.8,3.4) and O2-supplementation 33.3% (95% CI 29.3,37.6), respectively.
Figure 3 shows the percentage of patients with specific RVI who required mechanical ventilation, CPAP, and oxygen support.
3.3. Cost Analysis
We assessed the same clincial decisions (see Methods 2.5.) with rgeards to cost of the respective line item vs DRG fees in patients with different types of RVI.
As shown in Table 2, mean costs for patients admitted to the ICU ranged from 4,260.40 € for hAdV infection to 29,261.31 € for Influenza in our setting. For patients in regular hospital wards (non-ICU), costs ranged from 1,498.38 € for hAdV infection to 1,975.53 € for hRV infection. Different age groups showed no significant differences, except with regards to outpatients with influenza A and B virus infection, or infection with hAdV, hRV, hBoV, and hCoV. The costs beetween different RVI were not significantly different, but the costs between ICU, non-ICU and outpatients for the same RVI were significantly different for Influenza and hBoV infection.
3.4. Clinical Decision-Making in Relation to Risk-Adjusted Disease Severity (raVIVI Score) and Social Determinants of Health (SDH)
For patients with similar levels of disease severity (VIVI Score) in relation to risk (VIVI Risk Factor Score) we investigated these are the main parameters linked to clincial decision making as outlined in Methods 2.5.
Risk-Adjusted Disease Severity Score (“raVIVI Score”) vs SDH
As outlined in the Methods Section 2.6. we expressed disease severity in relation to individual risk with the risk adjusted VIVI Disease Severity Score (raVIVI Score). We compared clincial decision making (as outlined in Methiods 2.5.) in relation to raVIVI Score versus SDH.
- (a)
- Diagnostic Testing
The coefficient for diagnostic testing compared to the raVIVIScore was 0.12 (95% CI 0.10,0.13), which means for an increasing raVIVIScore the odds ratio increases by 12% per raVIVIScore point (p-value <0.05).
- (b)
- Hospitalization and ICU admission
For hospitalization, the coefficient was -0.18 (95% CI -0.21,-0.17), p<0.05, for the raVIVI Score which means for an increasing raVIVIScore odds ratio falls by 17% per point. The coefficient was -0.25 (95% CI -0.29,-0.20), p-value <0.05, for the SDH score. The higher the SDH score, the more the odds ratio decrease (12% per SDH point).
For ICU admission, the coefficient for the raVIVI Score was 0.04 (95% CI 0.03,0.06), p-value <0.05, 4% increase of the odds ratio per raVIVI Score point, whereas it was 0.09 (95% CI 0.04,0.13), p-value <0.05 (9% increase of the odds ratio per point) for the SDH Score.
- (c)
- Mechanical ventilation, CPAP and O2 supplementation
For mechanical ventilation the coefficient was -0.01 (95%CI -0.06, 0.09) for the raVIVI Score, wheras the coefficient was -0.36 (95%CI -0.79, -0.00) for the SDH Score (30% decrease of the odds ratio per SDH Score point). The coefficient for CPAP was -0.02 (95% CI -0.08,0.06) for the raVIVI Score compared to 0.11 (95% CI -0.01,0.38) for the SDH Score. The odds ratio for O2-supplementation increases 10% for every more point of the raVIVI Score (coefficient 0.10, 95% CI 0.08,0.11) and 19% for every more point of the SDH Score (coefficient 0.19, 95% CI 0.14,0.23).
The findings for the assessment of (c) versus raVIVI Score and SDH are displayed in Table 3.
4. Discussion
4.1. RVI in Relation to Clinical Decision Making
We compared the costs of 8 types of RVI in 4776 pediatric patients aged 0-18 in an academic hospital setting. It was performed in the unique context of a QI program where all patients fulfilling the same ILI case definition were tested for the 8 most common RV and monitored according to standard operating procedure. The QI program was run independently, and in parallel to routine care, allowing for comparisons between the two systems. This unique inception cohort provided real-world data sufficient to model the actual costs elicited by different types of laboratory-conformed RVI with a known denominator.
A study by Al Amad et al. with 1811 patients (78% under 15 years of age) found an ICU admission rate of 23% in patients with Influenza, 40% in patients with RSV and hAdV infection, 33% in patients with hMPV infection and 42% in patients with hPIV infection [31]. These results are consistently higher than in our study. A retrospective Brazilian study with 12,160 children aged 0-12 years found a hospitalization rate of 47.6% (ICU admission rate 4.8%) in patients with Influenza, 59.5% (ICU 9.5%) in patients with RSV infection, 64.3% (ICU 14.3%) in patients with hAdV infection, and 63.8% (ICU 4.8%) in patients with hPIV infection in 2009 [32].
Immunization has proven to be one of the most effective interventions to prevent and control RVI [33]. Most recently, vaccines have become available not only against influenza, but also RSV and a pandemic coronavirus, SARS-CoV-2. No vaccines are available for other human coronaviruses, hRV, hMPV, hAdV, hBoV or hPIV, whereas some are in (pre)clinical development. Live oral vaccines show promise in reducing the risk of respiratory hAdV infection and are in routine use in the United States military but presently not available to civilians [34]. A hMPV vaccine is in development [35-37]. Attempts to produce a protective vaccine against hRV have failed due to large numbers of antigenically distinct serotypes and the lack of a suitable small animal infection model to test candidate vaccines [38].
Coverage rates for influenza vaccination in Germany have been low, with only 43.3% of the population aged 65 years and over in 2022 being immunized on average [39]. Small-scale policy interventions such as awareness campaigns have failed to increase influenza vaccine uptake [40, 39]. In our setting, only 1.1% of healthy children and 5.8% of at-risk children were vaccinated during the respective season. Influenza vaccination is not generally recommended for healthy children in Germany, but even at-risk patients are often undervaccinated (around 16% age 15 years and younger) [41], possibly due to vaccine hesitancy [42]. Other countries such as the U.S. with a general recommendation for influenza vaccination show influenza vaccine coverage rates around 50% in children [43]. Notably, our study was done prior to the COVID pandemic, and prior to introduction of COVID and RSV vaccines.
With the VIVI ScoreApp we had a quick and reliable way to classify disease severity and risk which comes in handy, especially in the ED. Use of automated risk adjusted severity scoring could help to speed up triage of patients with ILI and RVI during outbreaks and pandemics [44].
4.2. Cost Analysis
In our economic analyses, we used the actual RVI case numbers as the foundation for analysis, which is done two-fold: Once according to actual costs (incurred due to services rendered) i.e. individual line items, and secondly, according to the billing code used in Germany, the so-called G-DRG system. The G-DRG system is based on an average cost estimate per disease entity and is updated regularly using actual cost data from a representative sample of hospitals, as well as service data from all German hospitals. Cost data are determined uniformly for all participating hospitals using an actual cost approach on a full-cost basis according to a calculation manual. The calculation manual allows to determine raw case costs (for the participating hospitals). These raw case costs form the basis for determining the German valuation ratios. Most studies undertaken to date have set out to derive a national-level cost estimate of the impact of a specific disease, based on some version of the cost-of-illness approach, which was first formalized by Rice and colleagues in the late 1960s [45]. Using this approach, the possible economic consequences of specific illnesses are divided into 'direct costs' - the expenses incurred because of the illness itself (including medical care, travel costs, etc.) and 'indirect costs', the value of lost productivity due to sick leave. Direct and indirect costs are then summed up to provide the overall societal costs of an illness. According to WHO guidance, economic-impact studies raise multifaceted health policy considerations at both the macroeconomic level (society) and the microeconomic level (households, firms, governments) [46]. Economic burden studies help to identify possible strategies for reducing the cost of disease through preventive or treatment strategies.
Cost-of-illness studies are important for the evaluation of healthcare systems. Analyzing and comparing costs can be beneficial for stakeholders and policymakers. These analyses are significant because RVI, such as Influenza, COVID-19, and RSV, are widespread taking up significant resources. Prior to the COVID-19 pandemic, it has been estimated that RSV infections cause approximately 33 million acute LRTI worldwide, including 3.6 million hospital admissions and 26 300 deaths in children below 5 years of age [47]. The global direct medical costs for the management of RSV LRTI in children under 5 years of age was at 4.82 billion € [13].
Because virological testing is not done universally in patients with ILI [7, 48] estimating the economic burden associated with specific RVI remains a challenge. Our analysis demonstrated that Influenza caused the highest cost in patients requiring admission to the ICU, followed by infections with RSV, hRV, hMPV, hCoV, hBoV, hPIV and hAdV. The costs associated with influenza infection were 29,261.31 € for direct and non-direct medical costs and 680.40 € for indirect costs per ICU stay per patient. High costs for the management of influenza infection were caused by the longer duration of mechanical ventilation as well as the larger rate of patients requiring mechanical ventilation (average rate 1% with 12.25 days duration of mechanical ventilation for Influenza vs a rate of 0.41% and 10.5 days for RSV infection). This discrepancy might be due to the wide-spread use of high-flow oxygen and CPAP at our center. High-flow O2 and non-invasive ventilation as CPAP did not lead to high costs because they do not count as a ventilation bed during billing.
The published literature comparing the costs associated with RVI in children in different regions is sparse. Data from low middle income countries (LMIC) are even more challenging to come by. A study in Kenya with 275 patients of all ages defined 117.86 $ among inpatients with Influenza and 19.82 $ for outpatients [49]. Zhang et al presented a systematic review and meta-analysis of RSV-associated costs in children [13]. In 41 studies reporting data from 1987 to 2017, the average cost per episode was 3452€ and 299€ for inpatient and outpatient management, respectively, which compares well to our findings of 3584€ and 85€ derived from the DRG-system. In a retrospective study conducted in the United States involving 815 children <18 years with hMPV, hospital cost per patient was 5513$ [50].
Reimbursement policies may impact clinical decision making. For example, in Germany there is usually only a small per capita flat rate reimbursement for the treatment of a patient in the ED, regardless of which services were provided. Also, most test results are not ready at the time of the ED discharge to home or to the hospital ward. Diagnostic tests for RVI (including rapid tests for RSV, influenzavirus, and other RV) are therefore often deferred and reserved for inpatients where such tests will be reimbursed at a better rate. The disadvantage of such policies is that for example, children may be sent home with e.g., acute Influenza possibly infecting others, including immunocompromised individuals or elderly people [51]. The implications and societal costs may be considerable. With more vaccines and specific antiviral treatment options becoming available, and diagnostic tests becoming more sensitive and easier to perform, rapid turnaround diagnostics should be used more broadly in the emergency departments allowing for timely infection control and treatment [52]. Ever since the SARS-CoV-2 pandemic, rapid diagnostics have been introduced into the workflow, even of only temporarily. During the second phase of the COVID-19 pandemic from June 2022 to February 2023, every citizen of Germany was entitled to at least one free rapid SARS-CoV-2 antigen test per week. Patient advocacy organizations such as Families Fighting Flu in the United States [53] increasingly favor virological testing to be performed already in the emergency department so that RVI can be treated at the time when antivirals are most effective. Another benefit may be that unnecessary prescriptions of antibiotics can be saved. In the future, hospital workflow and triage protocols may need to be revised in this regard. Here, health insurers and politicians must create the conditions to implement change in reibmursement and best practices.
In the G-DRG System, diagnostic tests performed in inpatient units are not reimbursed separately in the per-case fee (except for SARS-CoV-2 test), which means that more expensive tests may not be performed (such as viral culture, sequencing, resistance tetsing, individual PCR or next-generation seuqencing for the detetcion of rare or emerging viruses).
We previously reported from the same QI program that even among hospitalized symptomatic ILI patients, only 8.7% ever had virus diagnostics done in routine care [7]. This means that RVI diagnoses are getting missed in routine care – which means that the specific RV detected will also not be ICD-coded and reimbursed via the DRG system. Thus, the implementation of DRGs represented a fundamental reorientation of hospital remuneration systems replacing the formerly prevailing principle of self-cost recovery, in which hospitals were able to include individual reasons for certain cost structures in their budget agreements [25]. In other words, diagnosis-based reimbursementy systems may be of questionable use from an infectious disease perspective, as billing does not fully reflect the actual effort or the timeliness of actions taken.
The present work has several limitations. We analyzed the costs of only one center in a high-income country in determined seasons. No statements can be made about developing countries or other countries. The data are pre-COVID, no results are available post-COVID. More research with post-COVID data needs to be done here.
We were able to study costs and medical decision-making with regards to specific RVI in a unique setting highly suitable to explore this question. In reality, a number of factors in a patient-doctor encounter will be influencing clinical management. Cultural stereotypes may not be conscious, but these and other factors may influence how information is processed, potentially leading to unintended implicit bias in decision-making. Research suggests that implicit bias may contribute to healthcare disparities along the lines of race, ethnicity, gender, and other characteristics [54, 55].
4.3. Clinical Decision-Making in Relation to Risk-Adjusted Disease Severity (raVIVI Score) and Social Determinants of Health (SDH)
In a setting where no bias exists in the management of RVI for example, treatment would entirely depend on disease severity and individual risk. Patients would only receive diagnostic tests or be admitted to inpatient units for the same level of disease severity. In a setting where bias exists, social determinants of health (SDH) will influence the doctor’s decision making with regards to inpatient admission, treatment, and duration of hospital stay [56, 54, 55]. In our study, we show that hospitalization and ICU admission depend not only from a risk factor but also from SDH.
Effective triage in busy ED settings may help streamline the workflow, improve equity and the overall quality of patient services [57]. Triage means not only ranking in terms of importance (prioritization) but also allocation of limited, insufficient medical resources. Survival, post epidemic-quality of life, and consumption of medical resources required to achieve the set goal are crucial [58]. Accurate and effective triage does not only save lives but also furthers the fair allocation of resources [59]. The VIVI ScoreApp is the only ILI/acute viral infection specific score that is independent of the type of RVI, can be used in children, during triage as well as follow-up, and has been validated in tenthousand and more patients by now. Effective systems have been shown that are not RVI specific. For example, White and colleagues proposed a simple algorithm in which each patient is evaluated using short-term survival (SOFA score), prognosed survival after discharge (concomitant diseases), and the likelihood of surviving subsequent life cycles (age in years). [60].
If SDH play a role in triage and access to care, bias is automatically introduced. Nacoti et al. reported from a hospital in Bergamo that in a (COVID-)pandemic, patient-centered care was inadequate and must be replaced by community-centered care. The situation there was dismal as they operated well below their normal standard of care. Wait times for an intensive care bed were hours long. Older patients had not been resuscitated and died alone without appropriate palliative care, while the family was notified over the phone, often by a well-intentioned, exhausted, and emotionally depleted physician with no prior contact [61]. The authors suggested a 3-level-procedure: Level 1: mild or moderate cases are treated at home; Level 2: severe cases receive care in community centers; Level 3: critical cases are admitted to the hospital [62]. We developed and suggest to use in the ED the VIVI ScoreApp allows physicians to measure disease severity at the point-of care within 1-2 minutes [8]. In addition to or instead of using Manchester Triage, it is a very quick and meaningful tool for assessing patient severity of illness.
5. Conclusions
Our study illustrated that the major costs for ICU-hospitalization were caused by influenzavirus, while RSV led to most ICU admissions. RSV also led to the most CPAP and O2-Supplementations. Diagnostic Approach and hospitalization depend not only on risk factors but also from SDH.
More studies on the costs of viral respiratory infections, especially during epidemics and pandemics, could help health policy makers make decisions about allocating resources for prevention such as investment in vaccine development and therapeutic interventions. The VIVI ScoreApp could work as an equity tool. It could help to make the decision in the ED fairer.
We conclude that standardization of risk factor and disease severity assessments (such as with the VIVI ScoreApp) as well as systematic recording of SDH may contribute to a greater degree of equity in patient management before, during and after epi/pandemics. Future studies will continue to monitor costs during the introduction of new vaccines againstCOVID-19 and RSV infections. Equal access matters with regards to vaccine prevention, antiviral treatment as well as the impact changes in care and their effects on cost effectiveness.
Author Contributions
B.A R.: review and editing (lead). M. A.: Conceptualization (lead); writing- original draft (lead). T.OF C.: Formal analysis. O. O.: review and editing (equal); P. E O.: Material collection (equal). X. M.: sample analysis (equal), B. S.: sample analysis (lead). All authors have read and agreed to the published version of the manuscript.
Funding
This research received no external funding.
Institutional Review Board Statement
The study was conducted in accordance with the Declaration of Helsinki and approved by the Institutional Review Board of Charité (Charité EA 24/008/10).
Informed Consent Statement
Informed consent was obtained from all subjects involved in the study.
Data Availability Statement
Data is contained within the article.
Acknowledgments
We acknowledge Lea Seeber, Susann Muehlhans, Xi Chen, Franziska Tief and Katharina Karsch for their support in data collecting. TC acknowledges support from the Ministry of research and education (BMBF) Germany (MODUS Covid, grant number 031L0302C).
Conflicts of Interest
The authors declare no conflict of interest.
Abbreviations
| CDISC | Clinical Data Interchange Standards Consortium |
| COVID-19 | coronavirus disease 2019 |
| CPAP | continuous positive airway pressure |
| DRG | diagnosis related groups |
| ED | emergency department |
| hAdV | human adenovirus |
| hBoV | human bocavirus |
| hCoV | human coronavirus |
| hMPV | human metapneumovirus |
| hPIV | human parainfluenzavirus |
| hRV | human rhinovirus |
| ICD | international statistical classification of diseases and related health problems |
| ICU | intensive care unit |
| ILI | influenza-like illness |
| LMIC | low middle income countries |
| LRTI | lower respiratory tract infection |
| QI | quality improvement |
| raVIVI Score | risk adjusted VIVI score |
| RSV | respiratory syncytial virus |
| RV | respiratory virus |
| RVI | respiratory viral infection |
| SARS-CoV-2 | severe acute respiratory syndrome coronavirus 2 |
| SDH | social determinants of health |
References
- Nair H, Simoes EA, Rudan I, Gessner BD, Azziz-Baumgartner E, Zhang JSF et al. Global and regional burden of hospital admissions for severe acute lower respiratory infections in young children in 2010: a systematic analysis. Lancet. 2013;381(9875):1380-90. [CrossRef]
- Wang X, Li Y, O'Brien KL, Madhi SA, Widdowson MA, Byass P et al. Global burden of respiratory infections associated with seasonal influenza in children under 5 years in 2018: a systematic review and modelling study. Lancet Glob Health. 2020;8(4):e497-e510. [CrossRef]
- Centers for Disease Control and Prevention (CDC), Influenza Antiviral Medication (accessed on 07 Sep 2023). https://www.cdc.gov/flu/professionals/antivirals/summary-clinicians.htm.
- Centers for Disease Control and Prevention (CDC), COVID-19 Treatments and Medications (assessed on 07 Sep 2023). https://www.cdc.gov/coronavirus/2019-ncov/your-health/treatments-for-severe-illness.html.
- Yin H, Jiang N, Shi W, Chi X, Liu S, Chen JL et al. Development and Effects of Influenza Antiviral Drugs. Molecules. 2021;26(4). [CrossRef]
- Saha B, Parks RJ. Recent Advances in Novel Antiviral Therapies against Human Adenovirus. Microorganisms. 2020;8(9). [CrossRef]
- Alchikh M, Conrad T, Hoppe C, Ma X, Broberg E, Penttinen P et al. Are we missing respiratory viral infections in infants and children? Comparison of a hospital-based quality management system with standard of care. Clin Microbiol Infect. 2019;25(3):380 e9- e16. [CrossRef]
- Rath B, Conrad T, Myles P, Alchikh M, Ma X, Hoppe C et al. Influenza and other respiratory viruses: standardizing disease severity in surveillance and clinical trials. Expert Rev Anti Infect Ther. 2017;15(6):545-68. [CrossRef]
- Ma X, Conrad T, Alchikh M, Reiche J, Schweiger B, Rath B. Can we distinguish respiratory viral infections based on clinical features? A prospective pediatric cohort compared to systematic literature review. Rev Med Virol. 2018;28(5):e1997. [CrossRef]
- Rath B, Maltezou HC, Papaevangelou V, Papagrigoriou-Theodoridou MA, Alchikh M, Myles P et al. Partnering for enhanced digital surveillance of influenza-like disease and the effect of antivirals and vaccines (PEDSIDEA). Influenza Other Respir Viruses. 2019;13(4):309-18. [CrossRef]
- Obermeier PE, Heim A, Biere B, Hage E, Alchikh M, Conrad T et al. Linking digital surveillance and in-depth virology to study clinical patterns of viral respiratory infections in vulnerable patient populations. iScience. 2022;25(5):104276. [CrossRef]
- Obermeier PE, Seeber LD, Alchikh M, Schweiger B, Rath BA. Incidence, Disease Severity, and Follow-Up of Influenza A/A, A/B, and B/B Virus Dual Infections in Children: A Hospital-Based Digital Surveillance Program. Viruses. 2022;14(3). [CrossRef]
- Zhang S, Akmar LZ, Bailey F, Rath BA, Alchikh M, Schweiger B et al. Cost of Respiratory Syncytial Virus-Associated Acute Lower Respiratory Infection Management in Young Children at the Regional and Global Level: A Systematic Review and Meta-Analysis. J Infect Dis. 2020;222(Suppl 7):S680-S7. [CrossRef]
- Robert Koch-Institute. Epidemiologisches Bulletin Nr. 30. availavle online: https://www.rki.de/DE/Content/Infekt/EpidBull/Archiv/2009/Ausgaben/30_09.pdf?__blob=publicationFile.
- Mathauer I, Wittenbecher F. Hospital payment systems based on diagnosis-related groups: experiences in low- and middle-income countries. Bull World Health Organ. 2013;91(10):746-56A. [CrossRef]
- Tief F, Hoppe C, Seeber L, Obermeier P, Chen X, Karsch K et al. An inception cohort study assessing the role of pneumococcal and other bacterial pathogens in children with influenza and ILI and a clinical decision model for stringent antibiotic use. Antivir Ther. 2016;21(5):413-24. [CrossRef]
- Tuttle R, Weick A, Schwarz WS, Chen X, Obermeier P, Seeber L et al. Evaluation of novel second-generation RSV and influenza rapid tests at the point of care. Diagn Microbiol Infect Dis. 2015;81(3):171-6. [CrossRef]
- Biere B, Bauer B, Schweiger B. Differentiation of influenza B virus lineages Yamagata and Victoria by real-time PCR. J Clin Microbiol. 2010;48(4):1425-7. [CrossRef]
- Chmielewicz B, Nitsche A, Schweiger B, Ellerbrok H. Development of a PCR-based assay for detection, quantification, and genotyping of human adenoviruses. Clin Chem. 2005;51(8):1365-73. [CrossRef]
- Reiche J, Jacobsen S, Neubauer K, Hafemann S, Nitsche A, Milde J et al. Human metapneumovirus: insights from a ten-year molecular and epidemiological analysis in Germany. PLoS One. 2014;9(2):e88342. [CrossRef]
- Schulze M, Nitsche A, Schweiger B, Biere B. Diagnostic approach for the differentiation of the pandemic influenza A(H1N1)v virus from recent human influenza viruses by real-time PCR. PLoS One. 2010;5(4):e9966. [CrossRef]
- Reiche J, Schweiger B. Genetic variability of group A human respiratory syncytial virus strains circulating in Germany from 1998 to 2007. J Clin Microbiol. 2009;47(6):1800-10. [CrossRef]
- McHugh ML. The chi-square test of independence. Biochem Med (Zagreb). 2013;23(2):143-9. [CrossRef]
- Brown, Lawrence D. and Cai, T. Tony and DasGupta, Anirban (2001). "Interval Estimation for a Binomial Proportion", Statistical Science 16 (2): 101–133.
- Kobel C TJ, Bellanger MM, Aavikso A, Pfeiffer K.. Diagnosis related group (DRG) systems and similar Patient Classification Systems in Europe. In: Busse R, Geissler A, Quentin W, Wiley MM, editors. Diagnosis related groups in Europe: moving towards transparency, efficiency and quality in hospitals? Maidenhead: Open University Press; 2011.
- S. S. Einführung eines durchgängig (fall)pauschalierenden Vergütungssystems für Krankenhausleistungen auf DRG-Basis. Sozialer Fortschritt. 2000;49(5):103–15.
- Fujikoshi Y. Two-way ANOVA models with unbalanced data Discrete Mathematics. 1993;116 (1): 315–334.
- The VIVI Score Mobile App ™. https://score.vi-vi.org.
- CDISC. Clinical Data Interchange Standards Consortium. https://www.cdisc.org.
- Stoltzfus JC. Logistic regression: a brief primer. Acad Emerg Med. 2011;18(10):1099-104. [CrossRef]
- Al Amad MA, Al Mahaqri AA, Al Serouri AA, Khader YS. Severe Acute Respiratory Infections With Influenza and Noninfluenza Respiratory Viruses: Yemen, 2011-2016. Inquiry. 2019;56:46958019850731. [CrossRef]
- de-Paris F, Beck C, Pires MR, dos Santos RP, Kuchenbecker Rde S, Barth AL. Viral epidemiology of respiratory infections among children at a tertiary hospital in Southern Brazil. Rev Soc Bras Med Trop. 2014;47(2):223-6. [CrossRef]
- Wilder-Smith A, Longini I, Zuber PL, Barnighausen T, Edmunds WJ, Dean N et al. The public health value of vaccines beyond efficacy: methods, measures and outcomes. BMC Med. 2017;15(1):138. [CrossRef]
- Kuschner RA, Russell KL, Abuja M, Bauer KM, Faix DJ, Hait H et al. A phase 3, randomized, double-blind, placebo-controlled study of the safety and efficacy of the live, oral adenovirus type 4 and type 7 vaccine, in U.S. military recruits. Vaccine. 2013;31(28):2963-71. [CrossRef]
- Herfst S, Fouchier RA. Vaccination approaches to combat human metapneumovirus lower respiratory tract infections. J Clin Virol. 2008;41(1):49-52. [CrossRef]
- Cseke G, Wright DW, Tollefson SJ, Johnson JE, Crowe JE, Jr., Williams JV. Human metapneumovirus fusion protein vaccines that are immunogenic and protective in cotton rats. J Virol. 2007;81(2):698-707. [CrossRef]
- Ren J, Phan T, Bao X. Recent vaccine development for human metapneumovirus. J Gen Virol. 2015;96(Pt 7):1515-20. [CrossRef]
- McLean GR. Developing a vaccine for human rhinoviruses. J Vaccines Immun. 2014;2(3):16-20. [CrossRef]
- OECD. Influenza vaccination rates. available: https://data.oecd.org/healthcare/influenza-vaccination-rates.htm (accessed on 30 Jul 2023).
- Neufeind J, Wenchel R, Boedeker B, Wicker S, Wichmann O. Monitoring influenza vaccination coverage and acceptance among health-care workers in German hospitals - results from three seasons. Hum Vaccin Immunother. 2021;17(3):664-72. [CrossRef]
- Riens B et al., Analyse regionaler Unterschiede der Influenza-Impfraten in der Impfsaison 2007/2008. in: Versorgungsatlas 2012; www.versorgungsatlas.de/fileadmin/ziva_docs/2/Influenza_Bericht_1.pdf (laccessed on 1 November 2023).
- Schmid P, Rauber D, Betsch C, Lidolt G, Denker ML. Barriers of Influenza Vaccination Intention and Behavior - A Systematic Review of Influenza Vaccine Hesitancy, 2005 - 2016. PLoS One. 2017;12(1):e0170550. [CrossRef]
- Olivier CW. Influenza vaccination coverage rate in children: reasons for a failure and how to go forward. Hum Vaccin Immunother. 2012;8(1):107-18. [CrossRef]
- Rath B. App assesses severity, risk of respiratory illnesses during pandemic. AAP article. 2020. https://publications.aap.org/aapnews/news/7504/App-assesses-severity-risk-of-respiratory.
- Rice DP. Estimating the cost of illness. Washington: Public Health Service, Division of Medical Care Administration, Health Economics Branch. 1966.
- World Health Organization. 2009. WHO Guide to identifying the economic consequences of disease and injury. https://apps.who.int/iris/bitstream/handle/10665/137037/9789241598293_eng.pdf.
- Li Y, Wang X, Blau DM, Caballero MT, Feikin DR, Gill CJ et al. Global, regional, and national disease burden estimates of acute lower respiratory infections due to respiratory syncytial virus in children younger than 5 years in 2019: a systematic analysis. Lancet. 2022;399(10340):2047-64. [CrossRef]
- Onwuchekwa C, Moreo LM, Menon S, Machado B, Curcio D, Kalina W et al. Underascertainment of Respiratory Syncytial Virus Infection in Adults Due to Diagnostic Testing Limitations: A Systematic Literature Review and Meta-analysis. J Infect Dis. 2023;228(2):173-84. [CrossRef]
- Emukule GO, Ndegwa LK, Washington ML, Paget JW, Duque J, Chaves SS et al. The cost of influenza-associated hospitalizations and outpatient visits in Kenya. BMC Public Health. 2019;19(Suppl 3):471. [CrossRef]
- Davis CR, Stockmann C, Pavia AT, Byington CL, Blaschke AJ, Hersh AL et al. Incidence, Morbidity, and Costs of Human Metapneumovirus Infection in Hospitalized Children. J Pediatric Infect Dis Soc. 2016;5(3):303-11. [CrossRef]
- Li ML, Wang H, Song BJ, Ma JL. The spread of influenza-like-illness within the household in Shanghai, China. Math Biosci Eng. 2019;17(2):1889-900. [CrossRef]
- Ferrani S, Prazuck T, Bechet S, Lesne F, Cohen R, Levy C. Diagnostic accuracy of a rapid antigen triple test (SARS-CoV-2, respiratory syncytial virus, and influenza) using anterior nasal swabs versus multiplex RT-PCR in children in an emergency department. Infect Dis Now. 2023;53(7):104769. [CrossRef]
- Families Fighting Flu. Available online: https://www.familiesfightingflu.org (assecced on 19 September 2023).
- Canto JG, Allison JJ, Kiefe CI, Fincher C, Farmer R, Sekar P et al. Relation of race and sex to the use of reperfusion therapy in Medicare beneficiaries with acute myocardial infarction. N Engl J Med. 2000;342(15):1094-100. [CrossRef]
- Pletcher MJ, Kertesz SG, Kohn MA, Gonzales R. Trends in opioid prescribing by race/ethnicity for patients seeking care in US emergency departments. JAMA. 2008;299(1):70-8. [CrossRef]
- Chapman EN, Kaatz A, Carnes M. Physicians and implicit bias: how doctors may unwittingly perpetuate health care disparities. J Gen Intern Med. 2013;28(11):1504-10. [CrossRef]
- Wang Q, Wang X, Lin H. The role of triage in the prevention and control of COVID-19. Infect Control Hosp Epidemiol. 2020;41(7):772-6. [CrossRef]
- Christian MD. Triage. Crit Care Clin. 2019;35(4):575-89. [CrossRef]
- Thomas JC, Dasgupta N, Martinot A. Ethics in a pandemic: a survey of the state pandemic influenza plans. Am J Public Health. 2007;97 Suppl 1(Suppl 1):S26-31. [CrossRef]
- White DB, Katz MH, Luce JM, Lo B. Who should receive life support during a public health emergency? Using ethical principles to improve allocation decisions. Ann Intern Med. 2009;150(2):132-8. [CrossRef]
- Nacoti Mirco, Ciocca Andrea, Giupponi Angelo, Brambillasca Pie-tro, Lussana Federico, Pisano Michele, Goisis Giuseppe, et al. 2020. “At the Epicenter of the COVID-19 Pandemic and Humani-tarian Crises in Italy: Changing Perspectives on Preparation and Mitigation.” Commentary, NEJM Catalyst: Innovations in Care De-livery, March 21.
- Nacoti M, Ciocca A, Brambillasca P, Fazzi F, Pisano M, Giupponi M et al. A Community-Based Model to the COVID-19 Humanitarian Crisis. Front Cell Infect Microbiol. 2021;11:639579. [CrossRef]
Figure 1.
Proportion of patients with different RVI who required diagnostic testing.
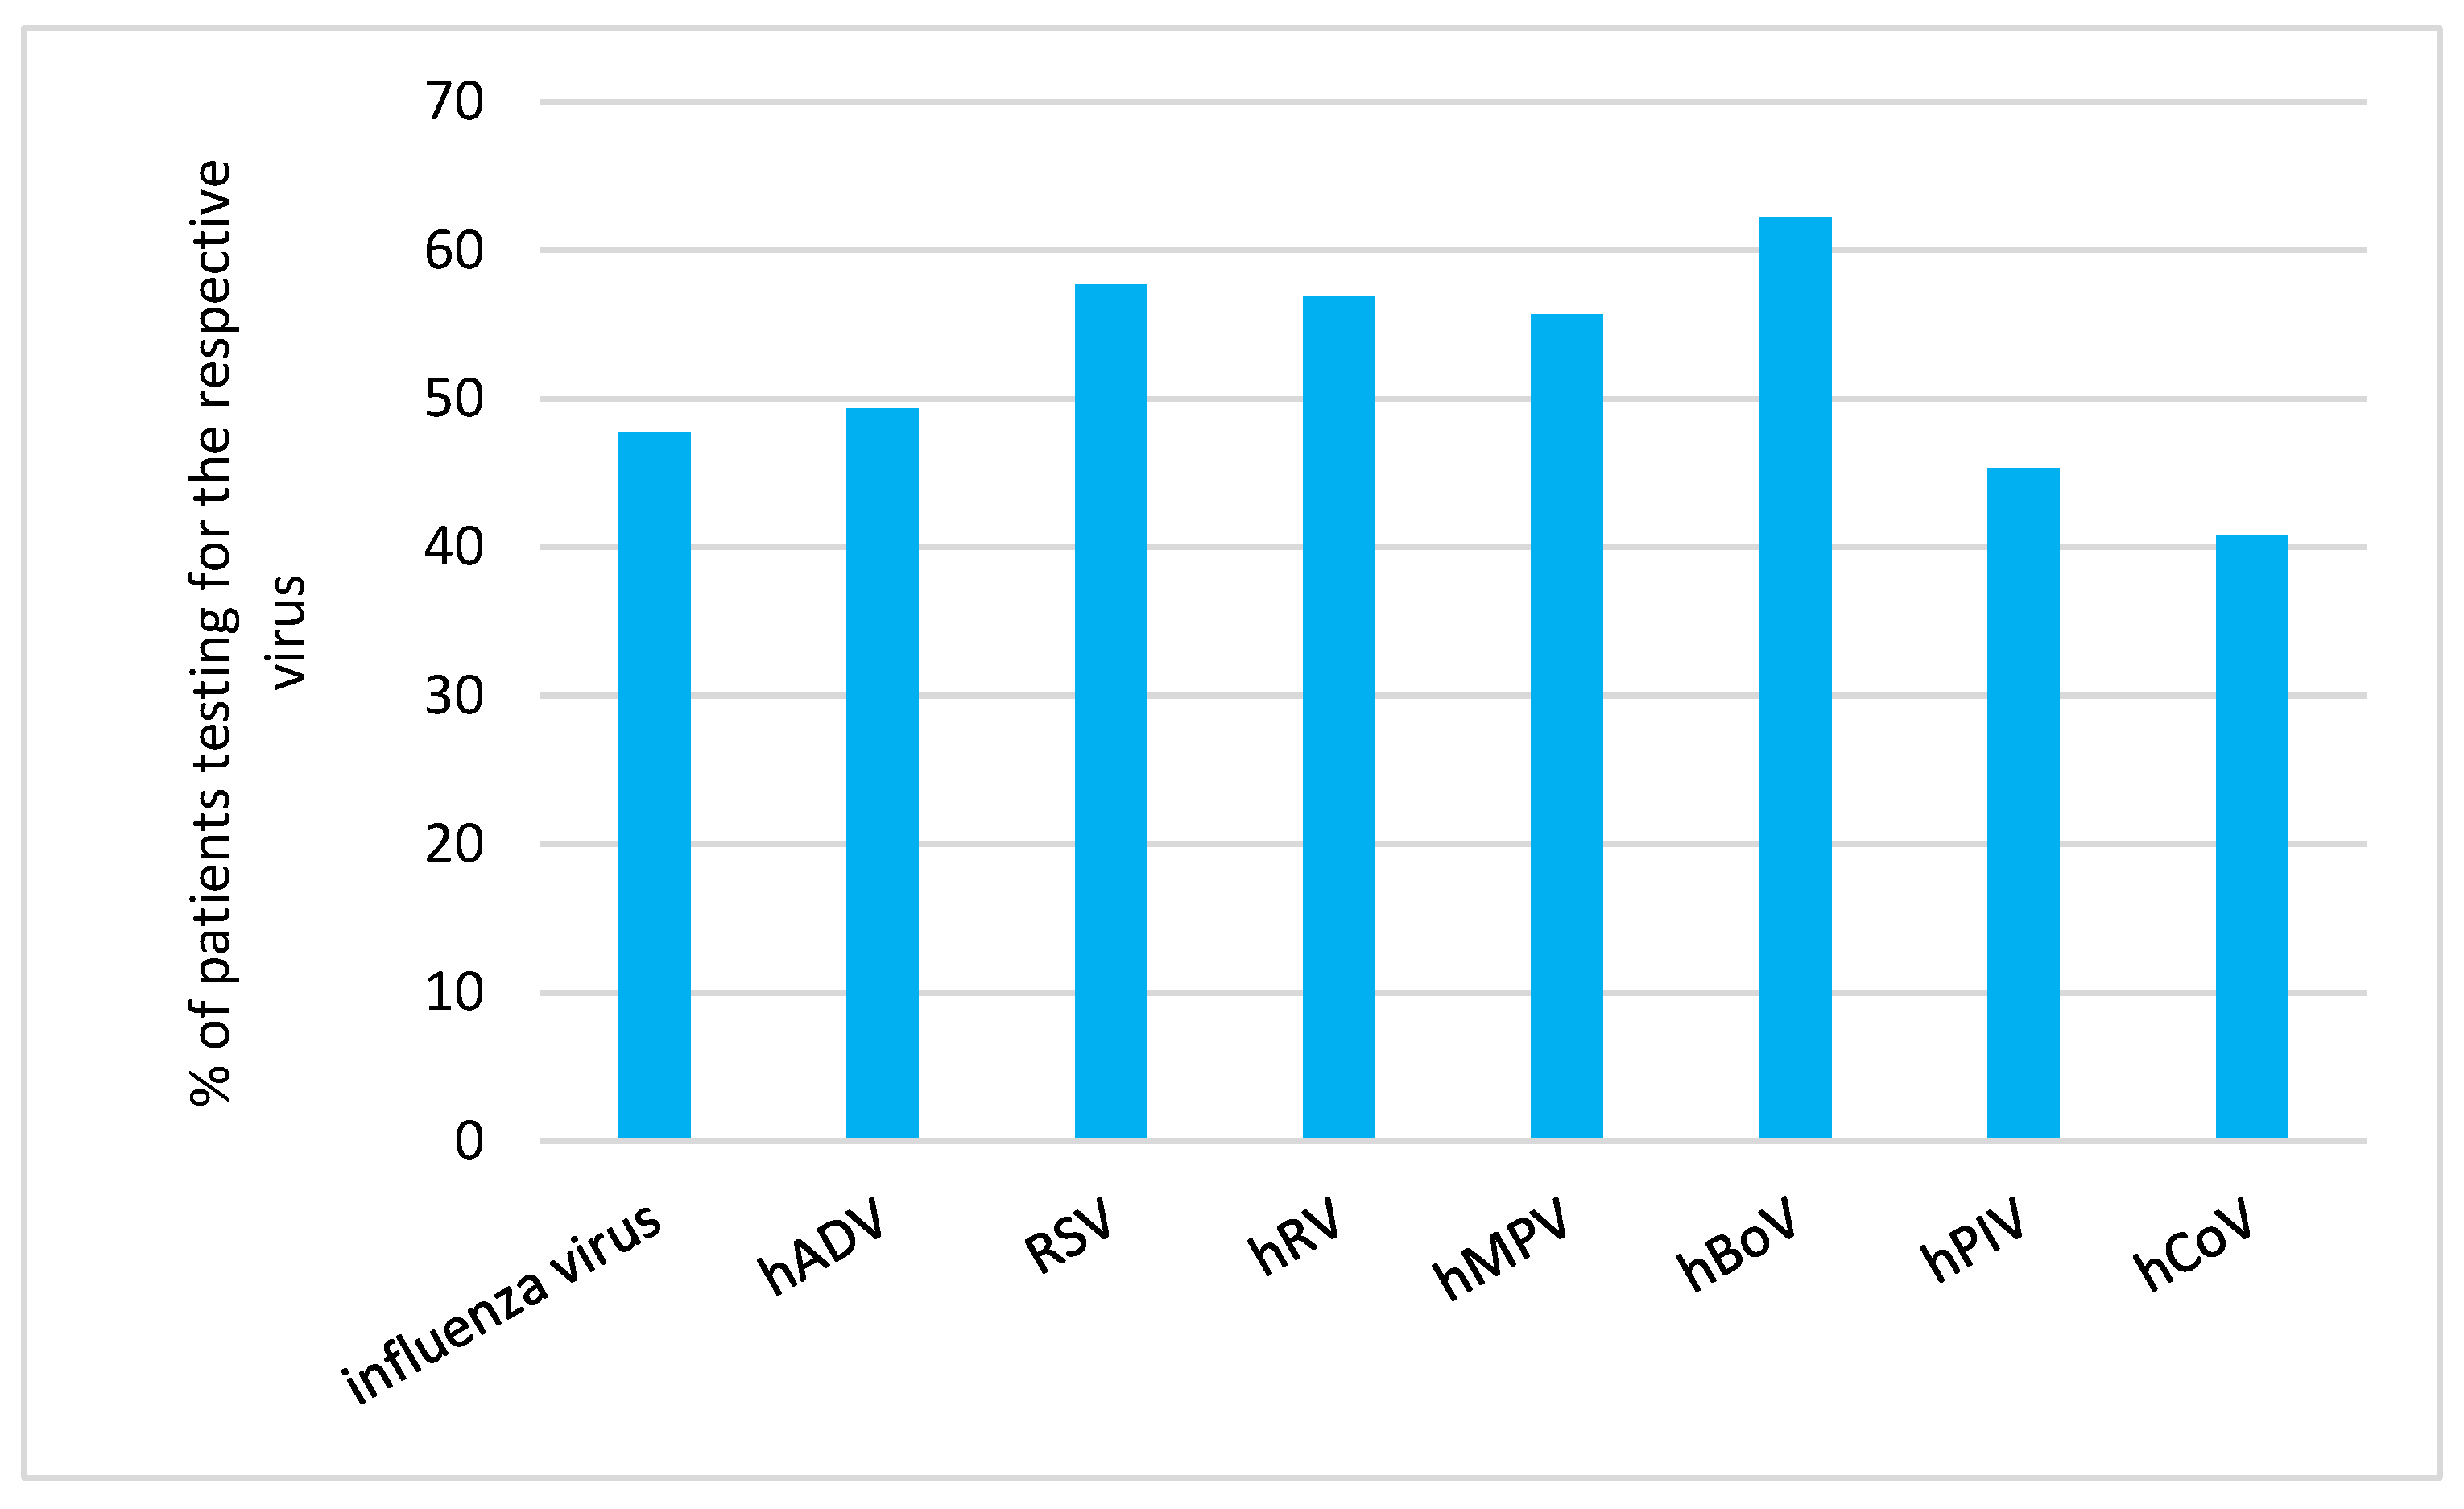
Figure 2.
Proportion of patients with different RVI who required hospitalization (blue) vs ICU admission (red).
Figure 2.
Proportion of patients with different RVI who required hospitalization (blue) vs ICU admission (red).
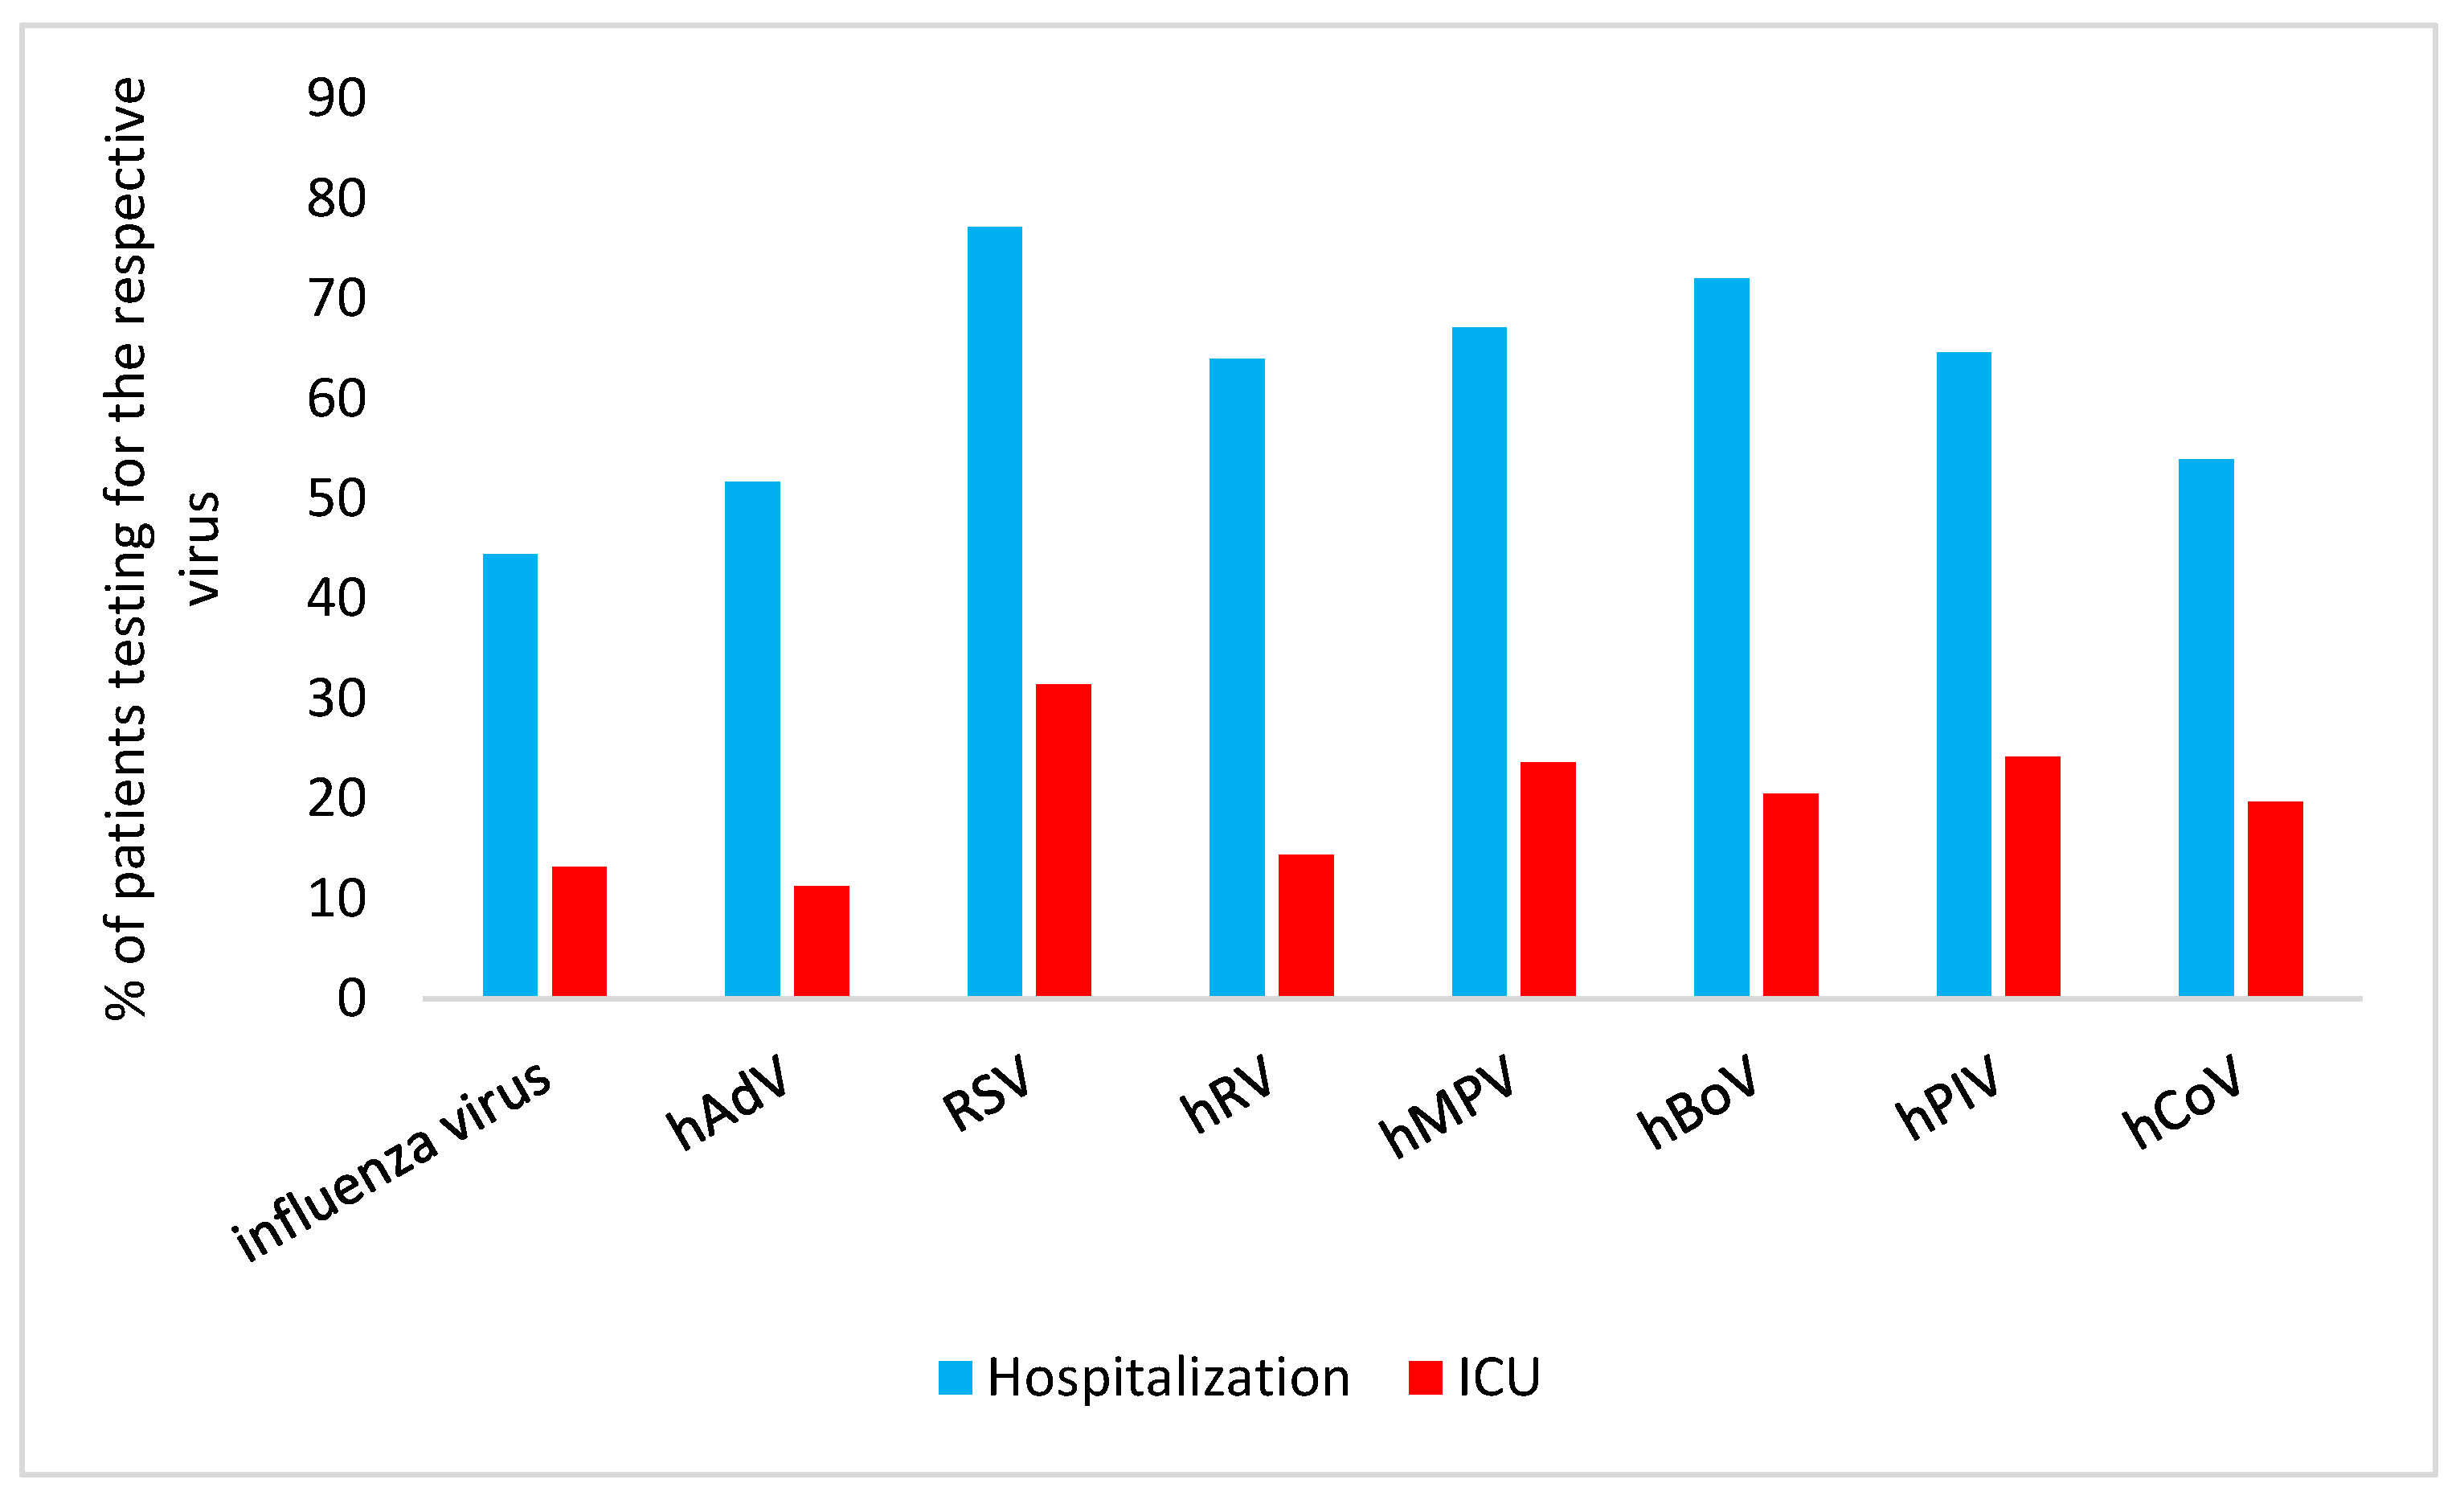
Figure 3.
Percentage of patients with specific RVI who required oxygen support (blue), CPAP (red) and mechanical ventilation (green).
Figure 3.
Percentage of patients with specific RVI who required oxygen support (blue), CPAP (red) and mechanical ventilation (green).
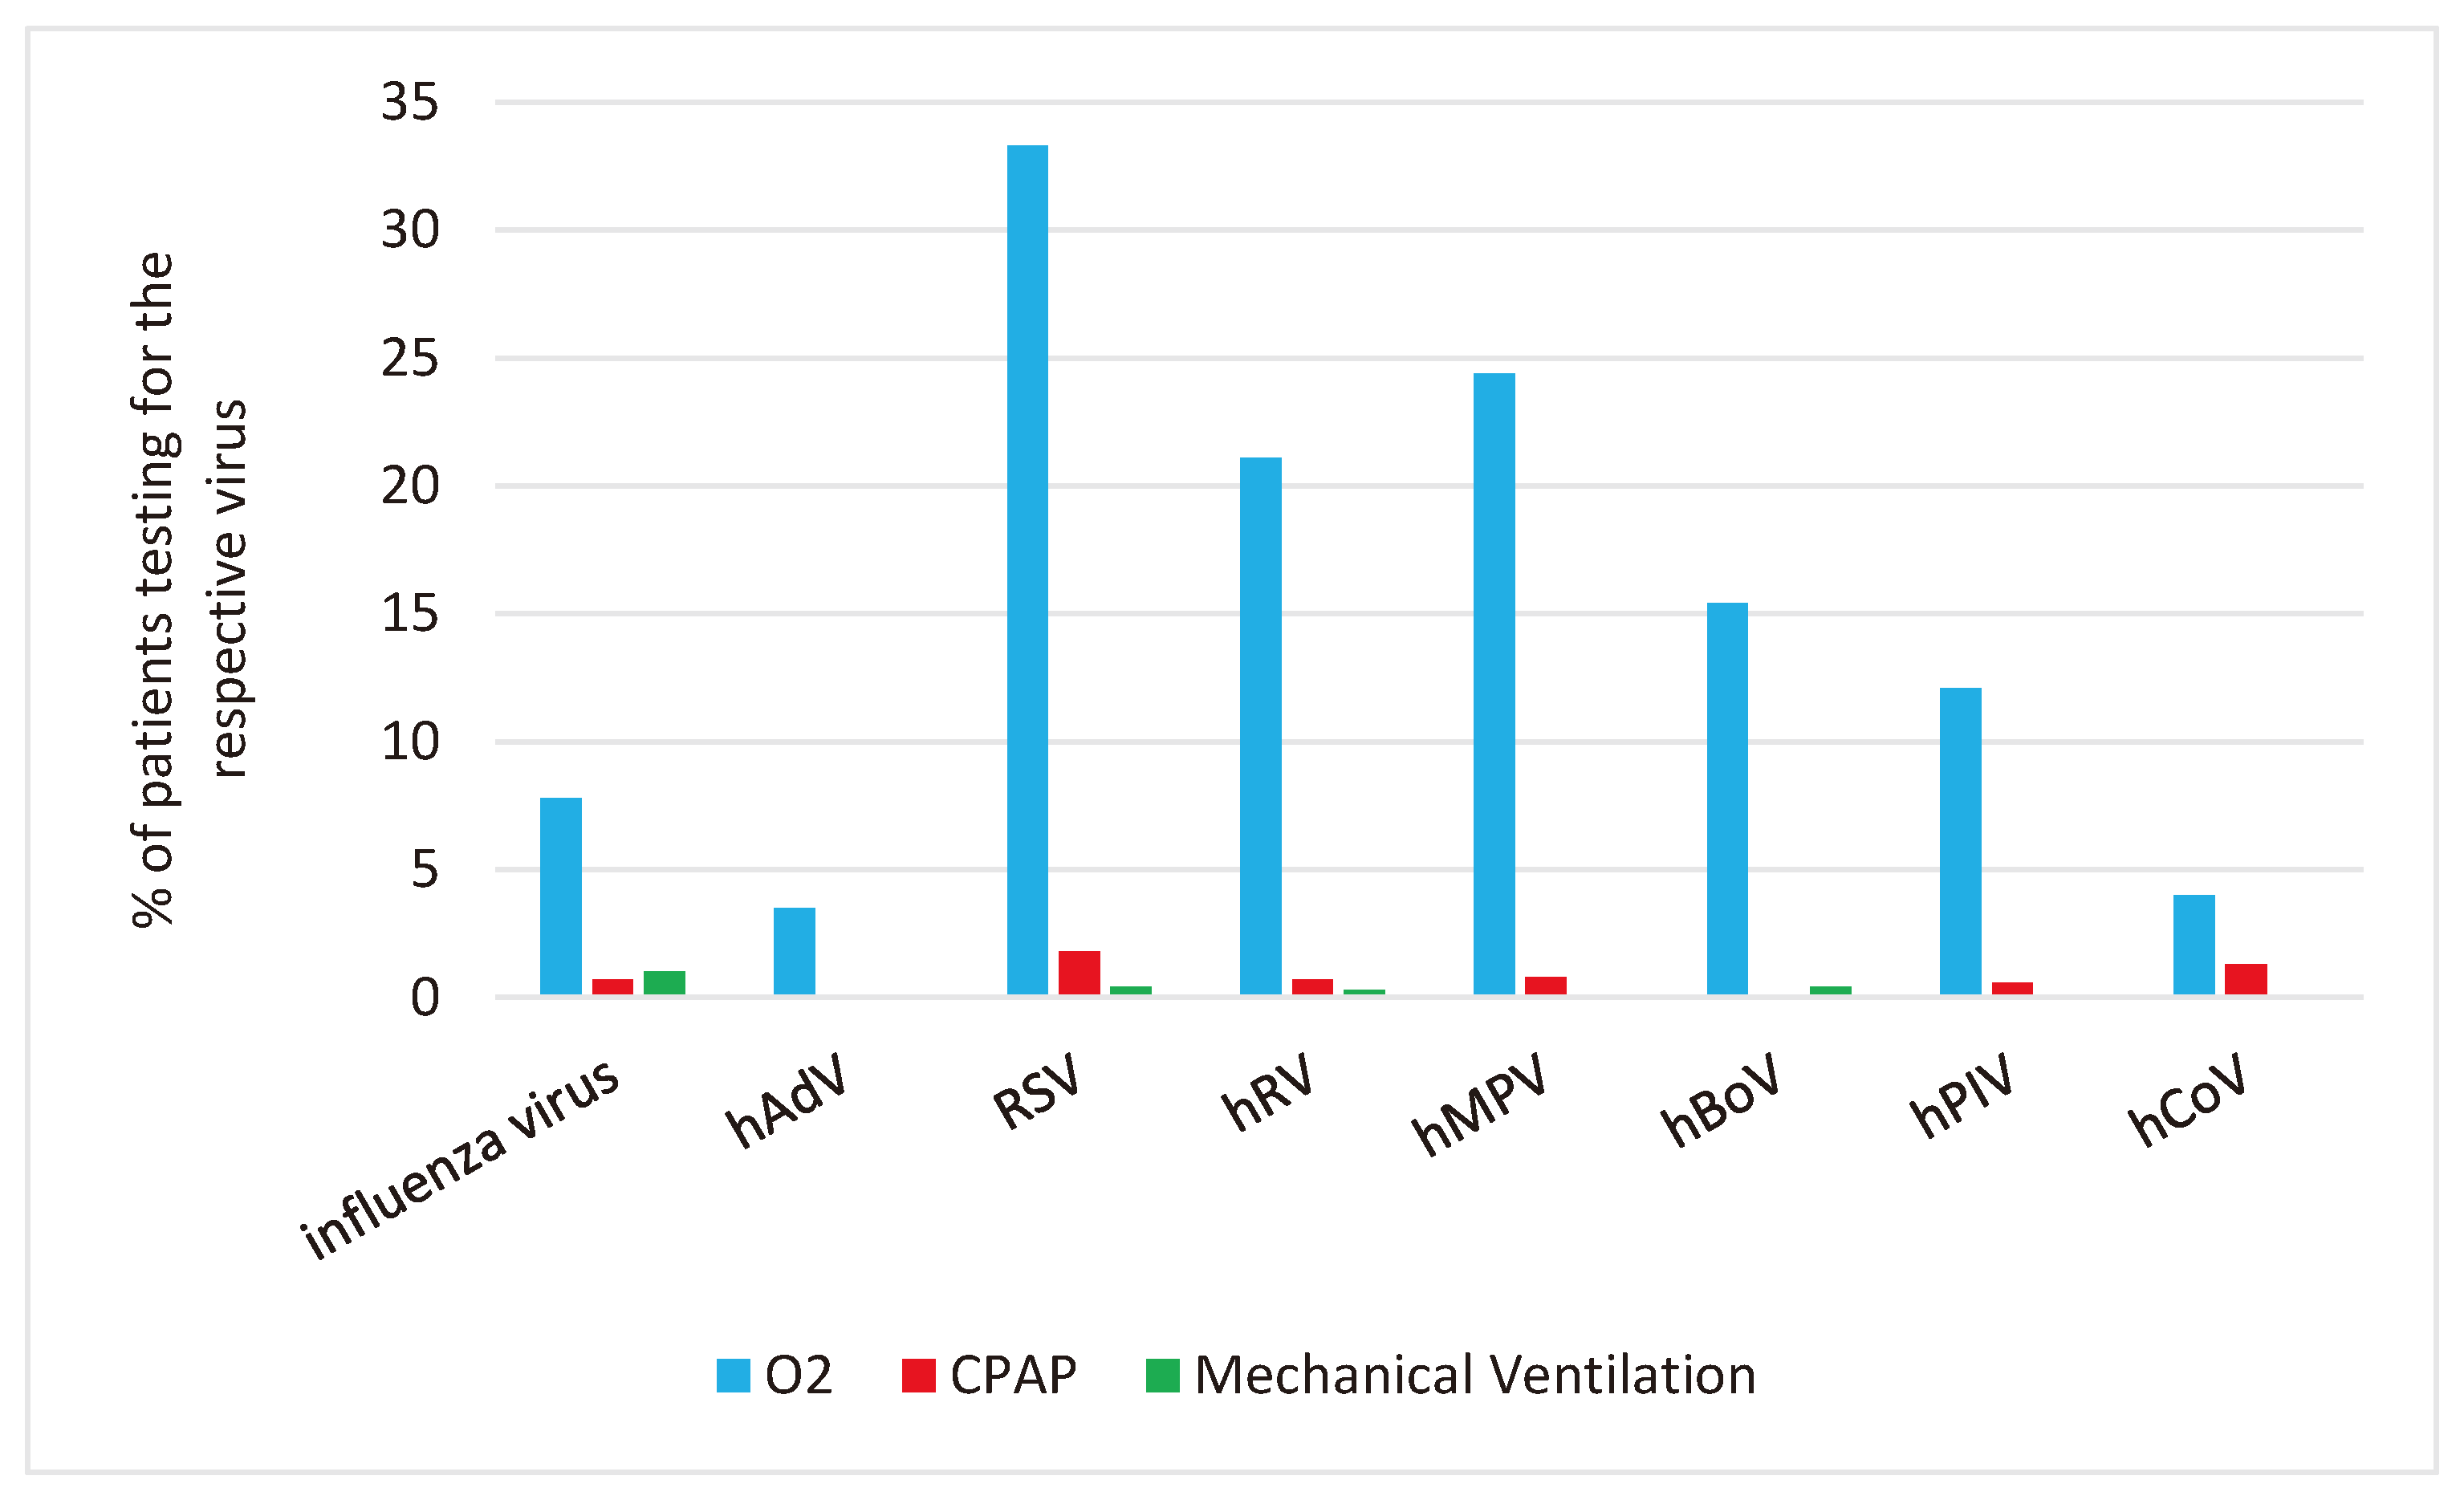

Table 1.
Demographics characteristics and underlying risk factors for all ILI patients, patients with different RVI, RV co-infections, and no RV detected.
Table 1.
Demographics characteristics and underlying risk factors for all ILI patients, patients with different RVI, RV co-infections, and no RV detected.
| All pa-tients | Influ-enza-virus | hAdV | RSV | hRV | hMPV | hBoV | hPIV | hCoV | Co-infec-tion | No virus detected | p-value* | |
|---|---|---|---|---|---|---|---|---|---|---|---|---|
| n (% of total) | 4776 (100) | 409 (8.6) | 203 (4.3) | 492 (10.3) | 617 (12.9) | 131 (2.7) | 254 (5.3) | 190 (4.0) | 76 (1.6) | 969 (20.3) | 1435 (30.1) | |
|
Age (years) Median[range] |
1.6 [0.0-18.8] |
4.3 [0.1-18.8] |
1.8 [0.1-16.2] |
0.8 [0.0-14.5] |
1.6 [0.0-17.9] |
1.6 [0.1-11.4] |
1.5 [0.0-17.9] |
1.4 [0.1-15.7] |
1.2 [0.1-14.9] |
1.3 [0.0-16.8] |
2.1 [0.0-17.9] |
0.50 |
|
Gender Male (%) |
55.8 |
54.5 |
57.1 |
56.7 |
60.1 |
60.3 |
58.3 |
51.6 |
61.8 |
55.8 |
53.3 |
0.79 |
|
Chronic condition Pulmonary (95% CI) |
8.1% (7.4-8.9) |
7.3% (5.2-10.3) |
2.5% (1.1-5.6) |
8.5% (6.4-11.3) |
11.4% (9.1-14.1) |
8.4% (4.8-14.4) |
10.6% (7.4-15.0) |
10.0% (6.5-15.1) |
7.9% (3.7-16.2) |
7.4% (5.9-9.3) |
7.3% (6.1-8.8) |
0.20 |
| Cardiac (95% CI) | 7.5% (6.7-8.2) | 5.9% (4.0-8.6) | 4.4% (2.4-8.2) | 6.9% (5.0-9.5) | 8.8% (6.8-11.2) | 6.9% (3.7-12.5) | 6.7% (4.2-10.5) | 9.5% (6.1-14.5) | 5.3% (2.1-12.8) | 5.9% (4.6-7.6) | 9.1% (7.7-10.7) | 0.54 |
| Metabolic (95% CI) | 3.5% (3.0-4.1) | 5.6% (3.8-8.3) | 3.0% (1.4-6.3) | 2.4% (1.4-4.2) | 4.4% (3.0-6.3) | 2.3% (0.8-6.5) | 2.8% (1.3-5.6) | 4.7% (2.5-8.8) | 2.6% (0.7-9.1) | 2.5% (1.7-3.7) | 4.9% (3.9-6.1) | 0.42 |
| Hepatorenal (95% CI) | 2.7% (2.3-3.3) | 1.2% (0.5-2.8) | 3.0% (1.4-6.3) | 2.6% (1.6-4.5) | 3.7% (2.5-5.5) | 1.5% (0.4-5.4) | 2.0% (0.8-4.5) | 2.6% (1.1-6.0) | 2.6% (0.7-9.1) | 2.4% (1.6-3.5) | 0.5% (0.2-1.0) | <0.05 |
| Neurological (95% CI) | 5.0% (4.4-5.6) | 5.4% (3.6-8.0) | 2.0% (0.8-5.0) | 3.3% (2.0-5.2) | 4.9% (3.4-6.9) | 5.3% (2.6-10.6) | 3.9% (2.2-7.1) | 4.2% (2.2-8.1) | 9.2% (4.5-17.8) | 4.5% (3.4-6.0) | 6.3% (5.1-7.7) | 0.56 |
| Haemato-oncological/ immunological (95% CI) | 2.4% (2.0-2.9) | 2.7% (1.5-4.8) | 1.5% (0.5-4.3) | 1.6% (0.8-3.2) | 2.6% (1.6-4.2) | 3.8% (1.6-8.6) | 2.4% (1.1-5.1) | 2.6% (1.1-6.0) | 1.3% (0.2-7.1) | 1.9% (1.2-2.9) | 0.2% (0.1-0.6) | <0.05 |
| Prematurity <33 weeks GA (95% CI) | 5.2% (4.6-5.9) | 4.2% (2.6-6.6) | 3.0% (1.4-6.3) | 4.7% (3.1-6.9) | 6.0% (4.4-8.2) | 6.9% (3.7-12.5) | 5.1% (3.0-8.6) | 5.8% (3.3-10.1) | 9.2% (4.5-17.8) | 4.2% (3.1-5.7) | 5.9% (4.8-7.3) | 0.90 |
| Any (95% CI) | 24.4% (23.2-25.7) | 19.3% (15.8-23.4) | 13.8% (9.7-19.2) | 12.4% (9.8-15.6) | 15.7% (13.1-18.8) | 22.1% (15.9-30.0) | 12.6% (9.1-17.2) | 19.5% (14.5-25.7) | 15.7% (9.3-25.6) | 16.3% (14.1-18.8) | 19.8% (17.8-21.9) | 0.10 |
*p-value: if < 0.05 then there is difference in the groups.
Table 2.
Total cost per episode for DRG and individual line items in € (direct and non-direct medical costs) and indirect costs per episode for patients with different laboratory confirmed RVI.
Table 2.
Total cost per episode for DRG and individual line items in € (direct and non-direct medical costs) and indirect costs per episode for patients with different laboratory confirmed RVI.
| Diagnosis related groups (DRG) (direct+non-direct medical cost)-total cost per episode (€) | Summary of individual items (direct+non-direct medical cost)-total cost per episode (€) |
Indirect cost-total cost per episode (€) |
Total of individual items (direct+non-direct medical cost) and indirect cost (€) | |||
|---|---|---|---|---|---|---|
| Influenzavirus n=409 | ||||||
| ICU n=54 |
7,854,24 |
29,261.31* |
680.40 |
29,941.71 | ||
| 0-5 years n=32 |
5,624.56 |
4,262.32 |
680.40 |
4,942.72 |
||
| 6-12 years n=16 |
7,943.44 |
30,632.53 |
907.20 |
31,539.73 |
||
| 13-18 years n=6 |
3,511.87 |
1,500.98 |
1,360.80 |
2,861.78 |
||
| Non-ICU n=128 | 1,668.35 |
1,973.34* |
793.80 |
2,767.14 |
||
| 0-5 years n=88 |
1,761.25 |
1,507.83 |
793.80 |
2,301.63 |
||
| 6-12 years n=19 |
1,569.35 |
2,419.47 |
992.25 |
3,411.72 |
||
| 13-18 years n=21 |
1,533.18 |
1,483.31 |
595.35 |
2,078.66 |
||
| Outpatient n=227 | 85.00 |
88.33* |
340.20 |
428.53 |
||
| 0-5 years n=131 |
85.00 |
95.17 |
340.20** |
435.37 |
||
| 6-12 years n=65 |
85.00 |
88.33 |
340.20** |
428.53 |
||
| 13-18 years n=31 |
85.00 |
87.03 |
340.20** |
427.23 |
||
|
hAdV n=203 |
||||||
| ICU n=23 |
3,881.00 |
4,260.40 |
680.40 |
4,940.80 |
||
| 0-5 years n=22 |
3,893.12 |
3,471.61 |
567.00 |
4,038.61 |
||
| 6-12 years n=0 |
NA | NA |
NA |
NA | ||
| 13-18 years n=1 |
3,582.43 |
4,247.96 |
680.40 |
4,928.36 |
||
| Non-ICU n=82 | 1,622.04 | 1,498.38 |
595.35 |
2,093.73 |
||
| 0-5 years n=79 |
1,611.92 |
1,498.38 |
595.35 |
2,093.73 |
||
| 6-12 years n=2 |
1,784.26 |
2,357.88 |
992.25 |
3,350.13 |
||
| 13-18 years n=1 |
1,581.10 |
2,357.88 |
1,984.50 |
4,342.38 |
||
| Outpatient n=98 | 85.00 | 87.03 |
340.20 |
427.23 |
||
| 0-5 years n=89 |
85.00 |
87.03 |
340.20** |
427.23 |
||
| 6-12 years n=8 |
85.00 |
60.58 |
340.20** |
400.78 |
||
| 13-18 years n=1 |
85.00 |
60.58 |
340.20** |
400.78 |
||
|
RSV n=492 |
||||||
| ICU n=155 | 6,487.58 | 15,817.06 |
1,134.00 |
16,951.06 |
||
| 0-5 years n=152 |
6,356.71 |
14,436.10 |
907.20 |
15,343.30 |
||
| 6-12 years n=1 |
7,144.93 |
24,895.13 |
4,082.40 |
28,977.53 |
||
| 13-18 years n=2 |
5,581.03 |
15,223.48 |
2,494.80 |
17,718.28 |
||
| Non-ICU n=225 | 3,584.00 | 1,973.34 |
739.80 |
2,713.14 |
||
| 0-5 years n=223 |
3,781.44 |
1,973.65 |
793.80 |
2,767.45 |
||
| 6-12 years n=1 |
3,544.82 |
1,457.72 |
595.35 |
2,053.07 |
||
| 13-18 years n=1 |
3,132.45 |
2,848.09 |
1,190.70 |
4,038.79 |
||
| Outpatient n=112 | 85.00 | 87.57 |
340.20 |
427.77 |
||
| 0-5 years n=108 |
85.00 |
95.17 |
340.20 |
435.37 |
||
| 6-12 years n=4 |
85.00 |
86.81 |
340.20 |
427.01 |
||
| 13-18 years n=0 |
NA | NA |
NA |
NA | ||
|
hRV n=617 |
||||||
| ICU n=89 |
6,451.92 | 13,486.82 |
907.20 |
14,394.02 |
||
| 0-5 years n=76 |
6,684.73 |
13,486.31 |
907.20 |
14,393.51 |
||
| 6-12 years n=13 |
6,253.43 |
4,269.72 |
680.40 |
4,950.12 |
||
| 13-18 years n=0 |
NA | NA |
NA |
NA | ||
| Non-ICU n=306 | 1,792.65 | 1,973.53 |
793.80 |
2,767.33 |
||
| 0-5 years n=276 |
1,852.98 |
1,973.51 |
793.80 |
2,767.31 |
||
| 6-12 years n=24 |
1,791.21 |
2,438.78 |
992.25 |
3,431.03 |
||
| 13-18 years n=6 |
1,782.43 |
1,939.73 |
793.80 |
2,733.53 |
||
| Outpatient n=222 | 85.00 | 87.57 |
340.20 |
427.77 |
||
| 0-5 years n=185 |
85.00 |
88.33 |
340.20** |
428.53 |
||
| 6-12 years n=30 |
85.00 |
87.57 |
340.20** |
427.77 |
||
| 13-18 years n=7 |
85.00 |
60.58 |
340.20** |
400.78 |
||
|
hMPV n=131 |
||||||
| ICU n=31 |
4,259.31 | 5,653.70 |
907.20 |
5,653.70 |
||
| 0-5 years n=31 |
4,259.31 | 5,653.70 |
907.20 |
6,560.90 |
||
| 6-12 years n=0 |
NA | NA | NA | NA | ||
| 13-18 years n=0 |
NA | NA | NA | NA | ||
| Non-ICU n=57 | 2,133.87 | 1,508.05 |
595.35 |
2,103.40 |
||
| 0-5 years n=53 |
2,384.78 | 1,508.01 |
595.35 |
2,103.36 |
||
| 6-12 years n=4 |
2,044.68 | 1,711.53 |
694.58 |
2,406.11 |
||
| 13-18 years n=0 |
NA | NA | NA |
NA | ||
| Outpatient n=43 | 85.00 | 87.57 |
340.20 |
427.77 |
||
| 0-5 years n=38 |
85.00 | 87.57 |
340.20 |
427.77 |
||
| 6-12 years n=5 |
85.00 | 86.81 |
340.20 |
427.01 |
||
| 13-18 years n=0 |
NA | NA |
NA |
NA | ||
|
hBoV n=254 |
||||||
| ICU n=52 |
4,231.89 | 5,863.96* |
680.40 |
6,544.36 |
||
| 0-5 years n=46 |
4,287.90 | 5,863.96 |
680.40 |
6,544.36 |
||
| 6-12 years n=4 |
4,256.98 | 9,067.01 |
1,474.20 |
5,728.92 |
||
| 13-18 years n=2 |
4,178.61 | 4,254.72 |
680.40 |
9,747.41 |
||
| Non-ICU n=131 | 1,973.40* |
793.80 |
2,767.20 |
|||
| 0-5 years n=114 |
2,383.77 | 1,507.98 |
595.35 |
2,103.33 |
||
| 6-12 years n=14 |
2,159.62 | 1,945.65 |
793.80 |
2,739.45 |
||
| 13-18 years n=3 |
2,256.30 | 4,209.63 |
1,786.05 |
5,995.68 |
||
| Outpatient n=71 | 87.57* |
340.20 |
427.77 |
|||
| 0-5 years n=66 |
85.00 | 87.57 |
340.20** |
427.77 |
||
| 6-12 years n=3 |
85.00 | 60.58 |
340.20** |
400.78 |
||
| 13-18 years n=2 |
85.00 | 60.58 |
340.20** |
400.74 |
||
|
hPIV n=190 |
||||||
| ICU n=46 |
3,883.92 | 4,274.76 |
680.40 |
4,955.16 |
||
| 0-5 years n=43 |
3,973.11 | 4,274.76 |
680.40 |
4,955.16 |
||
| 6-12 years n=0 |
NA | NA | NA | NA | ||
| 13-18 years n=3 |
3,631.74 | 4,247.12 |
680.40 |
4,927.52 |
||
| Non-ICU n=77 | 1,799.54 | 1,973.14 |
793.80 |
2,766.94 |
||
| 0-5 years n=70 |
1,832.85 | 1,973.07 |
793.80 |
2,766.87 |
||
| 6-12 years n=7 |
1,746.22 | 1,938.67 |
793.80 |
2,732.47 |
||
| 13-18 years n=0 |
NA | NA |
NA |
NA | ||
| Outpatient n=67 | 85.00 | 87.57 |
340.20 |
427.77 |
||
| 0-5 years n=64 |
85.00 | 87.57 |
340.20 |
427.77 |
||
| 6-12 years n=3 |
85.00 | 41.38 |
340.20 |
381.58 |
||
| 13-18 years n=0 |
NA | NA |
NA | NA | ||
|
hCoV n=76 |
||||||
| ICU n=15 |
4,894.56 | 5,644.87 |
907.20 |
6,552.07 |
||
| 0-5 years n=14 |
4,174.00 | 5,632.71 | 907.20 |
6,539.91 |
||
| 6-12 years n=0 |
NA | NA | NA | NA | ||
| 13-18 years n=1 |
6,422.98 | 8,370.77 |
1,360.80 |
9,731.57 |
||
| Non-ICU n=26 | 2,464.31 | 1,498.42 |
595.35 |
2,093.77 |
||
| 0-5 years n=23 |
2,581.74 | 1,498.42 |
595.35 |
2,093.77 |
||
| 6-12 years n=2 |
2,478.73 |
3,072.61 |
1,289.93 |
4,362.54 |
||
| 13-18 years n=1 |
2,347.91 |
3,734.62 |
1,587.60 |
5,322.22 |
||
| Outpatient n=35 | 85.00 | 88.33 |
340.20 |
428.53 |
||
| 0-5 years n=29 |
85.00 | 87.57 |
340.20** |
427.77 |
||
| 6-12 years n=5 |
85.00 | 60.58 |
340.20** |
400.78 |
||
| 13-18 years n=1 |
85.00 | 31.85 |
340.20** |
372.05 |
* p<0.05 significant difference in costs between ICU admission/non-ICU admission/outpatient of the viruses; ** p< 0.05 significant difference in costs between the age groups; Groups with n=0 were not included.
Table 3.
Clincial decision-making depending on raVIVI Score and SDH.
| Predictor | Outcome | Coefficient | 95% CI | Odds Ratio | P-value |
| raVIVI Score | Diagnostic Test | 0.12 | 0.10, 0.13 | 1.12 | <0.05 |
| raVIVI Score | Hospitalization | -0.18 | -0.21,-0.17 | 0.83 | <0.05 |
| raVIVI Score | ICU admission | 0.04 | 0.03, 0.06 | 1.04 | <0.05 |
| raVIVI Score | O2-Supplementation | 0.10 | 0.08, 0.11 | 1.11 | <0.05 |
| raVIVI Score | CPAP | -0.02 | -0.08, 0.06 | 0.98 | >0.05 |
| raVIVI Score | Mechanical ventilation | -0.01 | -0.06, 0.09 | 0.99 | >0.05 |
| SDH Score | Diagnostic Test | -0.02 | -0.07, 0.01 | 0.98 | >0.05 |
| SDH Score | Hospitalization | -0.25 | -0.29, -0.20 | 0.78 | <0.05 |
| SDH Score | ICU admission | 0.09 | 0.04, 0.13 | 1.09 | <0.05 |
| SDH Score | O2-Supplementation | 0.19 | 0.14, 0.23 | 1.21 | <0.05 |
| SDH Score | CPAP | 0.11 | -0.01, 0.38 | 1.12 | >0.05 |
| SDH Score | Mechnical ventilation | -0.36 | -0.79, -0.00 | 0.70 | <0.05 |
Disclaimer/Publisher’s Note: The statements, opinions and data contained in all publications are solely those of the individual author(s) and contributor(s) and not of MDPI and/or the editor(s). MDPI and/or the editor(s) disclaim responsibility for any injury to people or property resulting from any ideas, methods, instructions or products referred to in the content. |
© 2023 by the authors. Licensee MDPI, Basel, Switzerland. This article is an open access article distributed under the terms and conditions of the Creative Commons Attribution (CC BY) license (http://creativecommons.org/licenses/by/4.0/).
Copyright: This open access article is published under a Creative Commons CC BY 4.0 license, which permit the free download, distribution, and reuse, provided that the author and preprint are cited in any reuse.


