Submitted:
01 November 2023
Posted:
02 November 2023
You are already at the latest version
Abstract
Meteorological observations over the last four decades are of paramount importance to investigate the ongoing climate change. The assessment of the reliability of any climatic time series is thus mandatory to draw correct conclusions. This evaluation involves homogeneity tests to detect artificial discontinuities whose identification is facilitated by metadata availability. In this work, daily minimum and maximum temperature measurements collected in Padua, Italy, between 1980 and 2022, are examined. Hourly observations began in 1993 and since the aim is to study long term behavior of the temperature, the focus is on daily averages and extremes. Over this period, the weather station of Padua center underwent many changes, in location or instrument; therefore, some tests have been used to identify and remove the effects of these variations and obtain a homogeneous time series. The homogeneity tests applied must be able to identify change-points both in the middle and at the extremes of the series. Some well-known absolute tests have been applied to investigate shift in the mean value: Standard Normal Homogeneity test (SNH), Buishand U and range tests, Pettitt test, F-test, STARS. Some relative tests have been applied too, which are generally more reliable than absolute tests, because they consider the information from neighboring stations. As relative tests rely on the homogeneity and quality of the reference series, several nearby stations and two reanalysis datasets (ERA5 and MERIDA) have been considered, to enhance the picture of the local situation and provide more robust conclusions. The applied tests identify change-points in the years in which a change in instrument or location of the station have occurred, confirming that these changes have compromised the homogeneity of the series. The sub-series obtained splitting the observations in correspondence of these change-points have been homogenized with respect a selected period; corrections must be applied also to future measurements to extend the time series properly.
Keywords:
homogeneity tests
; daily temperature series
; correction methodology
; climate change
1. Introduction
Temperature observations in Padua have a very long history, being one of the oldest continuous series in the world with regular measurements starting in 1725 [1] and some sporadic records taken even before [2]. The modern observations in the city center, from 1980 to present day, were started by the University of Padua at the historical Botanical Garden. In 1993 the original weather station was substituted and since 2000 measurements have been under the control of ARPAV (Regional Agency for Environmental Protection of Veneto), when the weather station was changed again and translated of some meters in the Botanical Garden. In 2019 the station was relocated ~2 km away in a less urban environment (see Figure 1a).
Hence, over the 1980-2022 period, some inhomogeneities in the temperature records can arise because of the changes of instrument and relocation. The availability of the metadata in combination with statistical methods provides the most complete and effective way to identify inhomogeneities, with the final aim to bring out the climate signal from human interventions.
The statistical methods used for this scope are commonly known as homogeneity tests, which are widely described in the literature [e.g., 3,4]. A possible classification divides absolute from relative tests: the former use the series itself while the latter use the information from neighboring stations, called reference stations, supposedly homogeneous. The most common type of shifts, i.e., in the mean, was considered in this study, defined as “differing average climatic levels over a multi-annual duration” [5]. Several studies [e.g., 6] recommend applying relative homogeneity tests when one or more reliable reference stations are available, with high level of correlation with the test station. Relative tests are generally more powerful and reliable than absolute ones [3], but their result highly depends on the quality of the reference series; consequently, they have to be used with at least one absolute test to detect possible inhomogeneities in the reference series. On the other hand, relative tests cannot deal with concurrent changes in both the test and the reference stations, as it happens when climate variations occur. However, if the aim is to assess the presence of artificial change-points in the time series because of changes in the instrument and/or location, then relative tests can indubitably help.
The evaluation of the reliability of the temperature series of Padua is essential to investigate climate change in the last decades in the Mediterranean region, a hotspot due to the enhanced warming trend [7]. Therefore, the aim of this study is to assess the presence of change-points in the modern Padua daily temperature time series, obtained by composing different records over the last forty years. In the modern era, four different records are available, which are almost complete and whose metadata (location, instruments) are known. Starting from 1980, daily minimum and maximum temperatures have been continuously recorded while, sub-daily measurements began only later, in October 1993; hence, the focus has been on the daily observations.
The consequent homogenization of the observations allows the extension of the time series in the future once the procedure to blend new observations into the adjusted time series is known. Besides, as homogeneity tests sometimes fail to provide unique results, or have limited reliability, this analysis offers the possibility to evaluate them in presence of a clear knowledge of the metadata.
2. Materials and Methods
In this study, daily minimum and maximum temperatures over the period January 1980 – December 2022 are considered, collected in the station located in the Padua center. Four main periods can be distinguished:
- January 1980 – December 1993: observations collected at the Botanical Garden by the University of Padua (hereinafter referred to as OB_UNIPD), using a SPIGE mechanical thermohygrograph (measurements were copied from the strip chart into a log) and, from 1984 to 1990, two SPIGE minima and maxima glass thermometers. On 24 October 1990 modern electronic instruments were installed and observations were sampled automatically at unknown intervals [1];
- October 1993 – November 2001: observations sampled every hour (it is unknown whether instantaneous or mean values) collected with a new instrument at the Botanical Garden by the University of Padua (OB_micros_UNIPD);
- May 2000 – 10 March 2019: observations sampled every 15 minutes (instantaneous values) collected with a new instrument at the Botanical Garden, some tens of meters far with respect to the previous sensors, by ARPAV (OB_ARPAV);
- 11 March 2019 up to present: on 11 March 2019 the station was relocated ~2 km east, in the University Sports Center (CUS_ARPAV), where it is located nowadays.
The overlapping intervals between these periods are extremely short, or even absent. Quality checks were not applied before the homogeneity tests, as the measurements were already validated by means of automatic and manual procedures by ARPAV. In Table 1 the record availability for each station is reported.
Because of the shortness of the overlapping periods, it is not possible to find specific transfer functions between the different datasets, to build a single homogeneous series. Therefore, a new series was composed simply merging the datasets one after the other (so from 1 January 1980 to 30 September 1993 data are from OB_UNIPD, from 1 October 1993 to 30 April 2000 from OB_micros_UNIPD, from 1 May 2000 to 10 March 2019 from OB_ARPAV and from 11 March 2019 from CUS_ARPAV) and the presence of change-points by means of homogeneity tests was verified.
Eight absolute homogeneity tests were selected: the Standard Normal Homogeneity test (SNH) for a single break [8], the Buishand U and range test [9], the Pettitt test [10], the F-test [11], the STARS (Sequential T-test Analysis of Regime Shifts) [12], the cpt.mean [13] and the Von Neumann ratio (VN) test [14]. Only VN test does not give information on the timing of the change-point. The others are timing-specific tests, but they don’t have the same sensitivity in all parts of the time series, as they are based on different principles. The SNH test is more sensitive to breaks near the beginning or the end of a series, while the Buishand and the Pettitt tests detect more easily breaks in the middle [15]. The F-test is one of the best performing absolute test, able to identify a change-point even if a trend in the series is present [3,4]. The STARS method also works well in the presence of a trend, although it requires the setting of certain parameters, i.e., the significance level and cutoff length, that have to be optimized after several trials. The STARS algorithm finds the most likely significant change-point (based on a t-test), splits the series at that point and searches for further changes in each segment, repeating iteratively the procedure until no more change-points are detected or the sub-time series become smaller than the minimum cutoff length [12]. The cpt.mean algorithm detects changes in the mean using an exact or approximate method, which can identify either a single or multiple change-point. The PELT (Pruned Exact Linear Time) method [16] was chosen, which is exact and quick, using the asymptotic penalty, which provides a compromise between lots of small changes and no changes at all.
However, there are some limits in the applicability of these tests: first of all, except the STARS and cpt.mean-PELT methods, they can detect a single change-point in the time series. Secondly, with the exception of the F-test, STAR and cpt.mean-PELT, the mean-shift tests may not work properly if there is a trend in the series and a change-point can be incorrectly identified in the proximity of the middle of the series. Therefore, it is important to check if a trend in the test series is statistically significant and, in such a case, to interpret the results of the homogenization tests critically. To determine whether or not a trend exists in a time series the Mann-Kendall trend test was used. Being a non-parametric test, there is no underlying assumption about the normality of the data [17,18,19].
All the methods were applied using R and are summarized in Table 2, while in Table 3 the coordinates and data availability for all the stations used with the relative tests are reported (see also the map in Figure 1b).
Concerning relative tests, two reanalysis datasets were also considered as reference time series over the whole period: ERA5 and MERIDA. The ERA5 reanalysis, produced by the Copernicus Climate Change Service (C3S) at ECMWF [20], represents the state-of-the-art in the field of global meteorological reanalysis, and the time series was extracted in the grid point closest to Padua. ERA5 has a horizontal resolution of 31 km and the pixel selected has to be at the same altitude of Padua, not containing the near Euganean Hills, located south-west of the city center. The ERA5 synthetic station was used because of its reliability as it well captures the mean and extreme temperatures in particular in plain regions of Italy [21] and being the most complete.
The Meteorological Reanalysis Italian Dataset (MERIDA) is a reanalysis product developed for Italy and surrounding areas which use ERA5 as initial and boundary conditions for the numerical simulations conducted with the Advanced Research core of the Weather Research and Forecasting (WRF-ARW) mesoscale model [22]. Simulated data are provided on a 7 km horizontal resolution grid at hourly steps and exploit observations (temperature and precipitation) from the meteorological stations of the Regional Agencies for Environmental Protection (ARPA), not assimilated by ERA5, distributed throughout the national territory. These data are continually validated by the agencies but are cross-validated again in this context through spatial and temporal consistency criteria [22], and the weather stations meet the WMO guidelines. MERIDA covers the most recent period, from 1990 to present, but only the 1993-2022 period was used because the unbroken observations performed by most of the ARPAV stations located in the area of interest, and assimilated by the model, started from 1993.
All the homogeneity tests, both absolute and relative, were applied to monthly anomalies time series calculated with respect to the 30-year period 1993-2022 to detect more precisely the timing of the change-points.
Among the relative tests, the R package Climatol [23] was also applied, developed by the Spanish State Meteorological Agency (AEMET), that performs quality control, homogenization and infilling of missing data in a set of daily series of any climatic variable. The homogenization is based on the SNH test [8], considering reference stations to detect inhomogeneities in the test series: when the SNH test statistics are greater than a prescribed threshold, the series is split at the point of maximum SNH, moving all data before the break to a new series that is incorporated into the data pool. This procedure is performed iteratively, splitting only the series with the higher SNH values at every cycle, until no inhomogeneous series is found. As the core test, SNH test was originally designed to detect no more than a single change-point in a series; to overcome this problem, the test was first applied to stepped overlapping temporal windows, and then to the complete series. Finally, the method infills missing data in all homogeneous series and sub-series. Details on the package can be found in [23]. As reference stations to be used by the algorithm, fourteen stations within a 25 km radius from Padua were selected (top of Table 3) and farther five stations of the Italian Air Force selected because of their longer available time series (last five rows of Table 3) (Figure 1b). The ERA5 time series was added, instead MERIDA was not, because it is a derived product obtained from ERA5 and the stations themselves. To infill the missing data and compute the homogeneity tests, the algorithm does not use the proximity criterion but evaluates the correlation between datasets. The stations selected are all located on a plain terrain, but the algorithm was also successfully applied to orographically complex areas, e.g., Spain and Southern Italy [23,24].
3. Results
3.1. Absolute tests
The results of the absolute tests applied to the maximum and minimum temperatures in Padua are reported in Table 4. Tests are performed over the 1980-2022 period using monthly anomalies with respect to 1993-2022 climatology. STARS and cpt.mean tests require input parameters which provide sensibility thresholds for the number of change-points and they can be quite sensitive to these choices. For STARS, a cutoff length has to be selected, that is the minimum length of a subdivision of the time series needed to confirm that a change-point is present at a given time. Since a potential change-point is in March 2019, when the station was moved, a value less than ~3.5 years had to be chosen, i.e., before the time series ends, otherwise the algorithm would not be able to detect it. Therefore, several trials were made in the range 12-42 months (i.e., 1-3.5 years) and the most frequent change-points the algorithm provided were selected. Similarly, in cpt.mean test a penalty value controls the maximum number of potential change-points. An “elbow plot” was used to find the most reliable penalty value: the number of changes decreases as the penalty value increases, until it becomes constant. A value on the last part of this curve was selected to reduce change-points induced by noise. Nonetheless, both cpt.mean and STARS tests retrieved many change-points, in particular for maximum temperature, most of them caused by the noise in the time series and without any specific meaning. This was assessed by the comparison of the results with metadata.
The only change-point found by all the absolute tests is at the beginning of 2000 (February-March) for both minimum and maximum temperatures. This result can be referred to the time at which the change and relocation of instruments took place, i.e., between April and May 2000. However, further analysis is required to confirm this finding.
3.2. Relative tests
Relative tests make use of reference stations and study the difference between the test and the reference datasets. Therefore, they required the selection of one or more datasets recorded continuously over the same period of the Padua time series. A few stations apart from Padua have observations over the whole 1980-2022 period (see Table 3). But, these series may present change-points not related to climate, but to substitution of sensors, maintenance, presence of vegetation, etc. For example, some relative tests were applied to the monthly differences between Padua and Legnaro, which is one of the stations most similar to Padua (see Table 5) and for which the maintenance history is known. Results indicate a change-point in the minimum temperature anomalies in the first months of 2002, that corresponds to the change of the station’s radiation shield material from metal to plastic in May 2002. As expected, the tests are sensitive to change-point not related to any climatic signal.
For this reason, in the absence of certain and complete metadata, the reanalysis datasets were considered as references for relative tests. Firstly, the data extracted from these products have to be reliable. Therefore, their robustness was checked by comparing the Pearson correlation coefficients and the Root Mean Square Errors (RMSE) obtained coupling the reference time series and the Padua observations. In Table 5 these indicators are reported for ERA5, MERIDA and some stations listed in Table 3 for which data are available over 1993-2022. Some observations go even further back in time, but the time frame common to all datasets was selected to have a reliable comparison.
All the correlations coefficients are very high, even excluding the seasonal components of the time series, and the MERIDA reanalysis shows a clear improvement with respect to ERA5. RMSE for minimum temperature from MERIDA is even the best among all cases. On the other hand, RMSE of maximum temperature from MERIDA shows no improvement with respect to the stations, but it is still comparable. Overall, these indicators support the idea of using MERIDA time series as reference for the relative tests. However, since MERIDA covers only the 1993-2022 period and not knowing the maintenance history of the Air Force stations (which also have some gaps), there was no choice but using ERA5 to explore the whole 1980-2022 period to evaluate the presence of change-points around 1993, the first time the instrument changed. In Table 6 and 7 the results of the relative tests using ERA5 and MERIDA as reference, respectively, are reported.

Table 6.
Relative tests results for monthly temperature series in Padua using ERA5 as reference, over 1980 – 2022.
Table 6.
Relative tests results for monthly temperature series in Padua using ERA5 as reference, over 1980 – 2022.
| Test | Padua-ERA5 Change-points | |
|---|---|---|
| Minimum temperature | Maximum temperature | |
| F-test | Jun 2018 1 | Apr 2000 2 |
| cpt.mean | Feb 1991 2 Jun 2004 2 Mar 2019 2 |
Aug 1980 2 Apr 1983 2 Feb 1993 2 Apr 2000 2 |
| STARS | May 1983 3 Mar 1991 3 Jul 1996 3 Oct 2000 3 Apr 2019 3 |
May 1983 3 Dec 1990 3 Feb 1994 3 May 2000 3 Sep 2003 3 |
- 1 p-value < 0.01.
- 2 The package does not calculate traditional p-values directly related to the changes.
- 3 p-value ≤ 0.01 and cutoff length in the range 12-42 months (i.e., 1-3.5 years).
Table 7.
Relative tests results for monthly temperature series in Padua using MERIDA as reference, over 1993 – 2022.
Table 7.
Relative tests results for monthly temperature series in Padua using MERIDA as reference, over 1993 – 2022.
| Test | Padua-MERIDA Change-points | |
|---|---|---|
| Minimum temperature | Maximum temperature | |
| F-test | Nov 2018 1 | Apr 2000 2 |
| cpt.mean | Nov 2018 2 | May 1996 2 Apr 2000 2 Aug 2003 2 |
| STARS | Aug 1996 3 May 2016 3 Apr 2019 3 |
Jun 1996 3 Oct 1998 3 May 2000 3 Sep 2003 3 Jan 2004 3 May 2015 3 |
- 1 p-value < 0.01.
- 2 The package does not calculate traditional p-values directly related to the changes.
- 3 p-value ≤ 0.01 and cutoff length in the range 12-42 months (i.e., 1-3.5 years).
Once again, cpt.mean and STARS identified many change-points but most of them are disregardable and not linked to climatic signals or changes in the station. Additionally, the Climatol package, which use all the available observations, even the very sparse ones (reported in Table 3), was also applied. Climatol identified two change-points for minimum temperature in May 1991 and April 2019 and three change-points for maximum temperatures, in May 1983, May 1994 and May 2000.
In conclusion, the relative tests applied to Padua time series quite agree in identifying two change-points for minimum temperature in 1991 and 2019, and three change-points for maximum temperature in 1983, at the end of 1993/beginning of 1994, and in 2000. The timing of some change-points has more variability with respect to the others, as the tests not always agree on the precise month they occurred and meteorological variability overlaps with the signal affecting the outcome of the tests. Nonetheless, the exact months of these change-points were identified according to the station metadata changes. The main difference with the absolute tests is that the latter also indicated a change-point for minimum temperature in February or March 2000. This change-point is probably fictitious, i.e., an artifact caused by the trend present in the time series. Indeed, both for monthly minimum and maximum temperatures the Mann-Kendall test detects significant trend (p-value < 0.01) over the 1980-2022 period. Since a trend could sometimes deceive some homogeneity tests, leading to the indication of a fictitious change-point usually in the middle of the time series, and since no relative test has detected the 2000 timing, this change-point for minimum temperature was excluded. The final selected change-points are reported in Table 8.
3.3. Homogeneization
Once the change-points have been identified, the sub-periods have to be corrected to homogenize the time series. As the overlapping windows (Table 1) are very short or absent, the Climatol package was used again. OB_ARPAV was chosen as reference with respect the other time series have to be corrected to, because it is the longest available homogeneous series. The current station CUS_ARPAV wasn’t considered because the location is supposed to be temporary and the station could be relocated again in the future. For minimum temperature three homogeneous subperiods are available: i.e., Jan 1980 – Oct 1990 (1), Nov 1990 – Feb 2019 (2) and Mar 2019 – Dec 2022 (3), and (1) and (3) should be corrected to make them homogeneous with respect to (2). For the maximum temperature, four homogeneous subperiods are available: i.e., Jan 1980 – Dec 1983 (1), Jan 1984 – Sep 1993 (2), Oct 1993 – Apr 2000 (3), May 2000 – Dec 2022 (4). In addition, (1), (2) and (3) should be corrected to make them homogeneous with respect to (4). Climatol allows the reconstruction, back and forward in time, of the sub-time series identified by splitting the time series by means of the change-points, to cover the whole period 1980-2022. In this way, the time series overlap enough to perform a proper comparison and calculate transfer functions. These transfer functions are evaluated as previously done for older Padua observations [25]: they are the least square interpolation polynomials obtained comparing, month by month, one time series with the other, excluding measurements exceeding 10th and 90th percentiles of the series of daily differences between the two series. Results are reported in Table 9 and 10 for minimum temperature, and in Table 11, 12 and 13 for maximum temperature.
Table 9.
Transfer functions from OB_UNIPD of the period 1 Jan 1980 – 23 Oct 1990 to OB_ARPAV for minimum temperature.
Table 9.
Transfer functions from OB_UNIPD of the period 1 Jan 1980 – 23 Oct 1990 to OB_ARPAV for minimum temperature.
| 1980-2022 | OB_UNIPD (1 Jan 1980 – 23 Oct 1990) to OB_ ARPAV | |
|---|---|---|
| Month | Tmin (°C) | r2 |
| January | Y = 0.9768 · X - 0.44 | 0.991 |
| February | Y = 0.9847 · X - 0.26 | 0.957 |
| March | Y = 0.9500 · X - 0.07 | 0.953 |
| April | Y = 0.9640 · X - 0.09 | 0.948 |
| May | Y = 0.9882 · X - 0.34 | 0.943 |
| June | Y = 1.0136 · X - 0.69 | 0.942 |
| July | Y = 0.9961 · X - 0.30 | 0.915 |
| August | Y = 1.0010 · X - 0.38 | 0.926 |
| September | Y = 0.9416 · X + 0.52 | 0.946 |
| October | Y = 0.9443 · X + 0.14 | 0.970 |
| November | Y = 0.9408 · X - 0.11 | 0.977 |
| December | Y = 0.9408 · X - 0.35 | 0.968 |
Table 10.
Transfer functions from CUS_ARPAV to OB_ARPAV for minimum temperature.
| 1980-2022 | CUS_ARPAV to OB_ ARPAV | |
|---|---|---|
| Month | Tmin (°C) | r2 |
| January | Y = 0.9701 · X + 0.28 | 0.968 |
| February | Y = 0.9913 · X + 0.39 | 0.921 |
| March | Y = 0.9781 · X + 0.65 | 0.910 |
| April | Y = 0.9915 · X + 0.79 | 0.906 |
| May | Y = 1.0328 · X + 0.43 | 0.904 |
| June | Y = 1.0617 · X + 0.02 | 0.909 |
| July | Y = 1.0380 · X + 0.54 | 0.872 |
| August | Y = 1.0403 · X + 0.52 | 0.884 |
| September | Y = 0.9749 · X + 1.36 | 0.910 |
| October | Y = 0.9735 · X + 0.99 | 0.934 |
| November | Y = 0.9682 · X + 0.70 | 0.954 |
| December | Y = 0.9758 · X + 0.32 | 0.939 |
Table 11.
Transfer functions from OB_UNIPD of the period 1 Jan 1980 – 31 Dec 1983 to OB_ARPAV for maximum temperature.
Table 11.
Transfer functions from OB_UNIPD of the period 1 Jan 1980 – 31 Dec 1983 to OB_ARPAV for maximum temperature.
| 1980-2022 | OB_UNIPD (1 Jan 1980 – 31 Dec 1983) to OB_ ARPAV | |
|---|---|---|
| Month | Tmax (°C) | r2 |
| January | Y = 0.9938 · X + 0.65 | 0.996 |
| February | Y = 0.9803 · X + 0.84 | 0.978 |
| March | Y = 1.0032 · X + 0.70 | 0.980 |
| April | Y = 1.0160 · X + 0.40 | 0.975 |
| May | Y = 1.0117 · X + 0.27 | 0.977 |
| June | Y = 0.9983 · X + 0.46 | 0.975 |
| July | Y = 0.9992 · X + 0.46 | 0.967 |
| August | Y = 1.0147 · X + 0.04 | 0.971 |
| September | Y = 0.9868 · X + 0.69 | 0.969 |
| October | Y = 0.9731 · X + 0.80 | 0.971 |
| November | Y = 0.9529 · X + 0.97 | 0.973 |
| December | Y = 0.9675 · X + 0.89 | 0.959 |
Table 12.
Transfer functions from OB_UNIPD of the period 1 Jan 1984 – 30 Sep 1993 to OB_ARPAV for maximum temperature.
Table 12.
Transfer functions from OB_UNIPD of the period 1 Jan 1984 – 30 Sep 1993 to OB_ARPAV for maximum temperature.
| 1980-2022 | OB_UNIPD (1 Jan 1984 – 30 Sep 1993) to OB_ ARPAV | |
|---|---|---|
| Month | Tmax (°C) | r2 |
| January | Y = 1.0010 · X - 0.31 | 0.992 |
| February | Y = 0.9739 · X - 0.02 | 0.969 |
| March | Y = 0.9979 · X - 0.13 | 0.968 |
| April | Y = 1.0112 · X - 0.34 | 0.966 |
| May | Y = 1.0088 · X - 0.38 | 0.971 |
| June | Y = 1.0044 · X - 0.33 | 0.968 |
| July | Y = 1.0047 · X - 0.27 | 0.960 |
| August | Y = 1.0274 · X - 0.92 | 0.962 |
| September | Y = 0.9983 · X - 0.26 | 0.962 |
| October | Y = 0.9742 · X + 0.01 | 0.964 |
| November | Y = 0.9490 · X + 0.21 | 0.964 |
| December | Y = 0.9611 · X + 0.00 | 0.951 |
Table 13.
Transfer functions from OB_micros_UNIPD to OB_ARPAV for maximum temperature.
| 1980-2022 | OB_micros_UNIPD to OB_ ARPAV | |
|---|---|---|
| Month | Tmax (°C) | r2 |
| January | Y = 1.0401 · X - 0.15 | 0.997 |
| February | Y = 1.0661 · X - 0.29 | 0.988 |
| March | Y = 1.0795 · X - 0.44 | 0.988 |
| April | Y = 1.0900 · X - 0.72 | 0.983 |
| May | Y = 1.0831 · X - 0.80 | 0.986 |
| June | Y = 1.0748 · X - 0.77 | 0.985 |
| July | Y = 1.0738 · X - 0.77 | 0.975 |
| August | Y = 1.0836 · X - 1.02 | 0.977 |
| September | Y = 1.0703 · X - 0.71 | 0.980 |
| October | Y = 1.0546 · X - 0.48 | 0.982 |
| November | Y = 1.0238 · X - 0.05 | 0.983 |
| December | Y = 1.0410 · X - 0.17 | 0.972 |
More measurements are expected to be included to extend the time series and keep it up to date. Therefore, the use of the transfer functions is the more practical and immediate way to include future observations from CUS_ARPAV. Minimum temperature values must be converted in the future using the transfer functions of Table 10, while future maximum temperatures do not need correction.
In Figure 2a the daily corrections to the minimum temperature are shown, with most of them ranging from -1.0°C to +0.1°C in Jan 1980 – Oct 1990 and +0.1°C to +1.5°C in Mar 2019 – Dec 2022. Figure 2b compares the yearly values of both the corrected and the original time series.
Figure 2.
(a) Daily corrections applied to minimum temperature; (b) Yearly mean of the original time series (black) and the corrected one (red).
Figure 2.
(a) Daily corrections applied to minimum temperature; (b) Yearly mean of the original time series (black) and the corrected one (red).
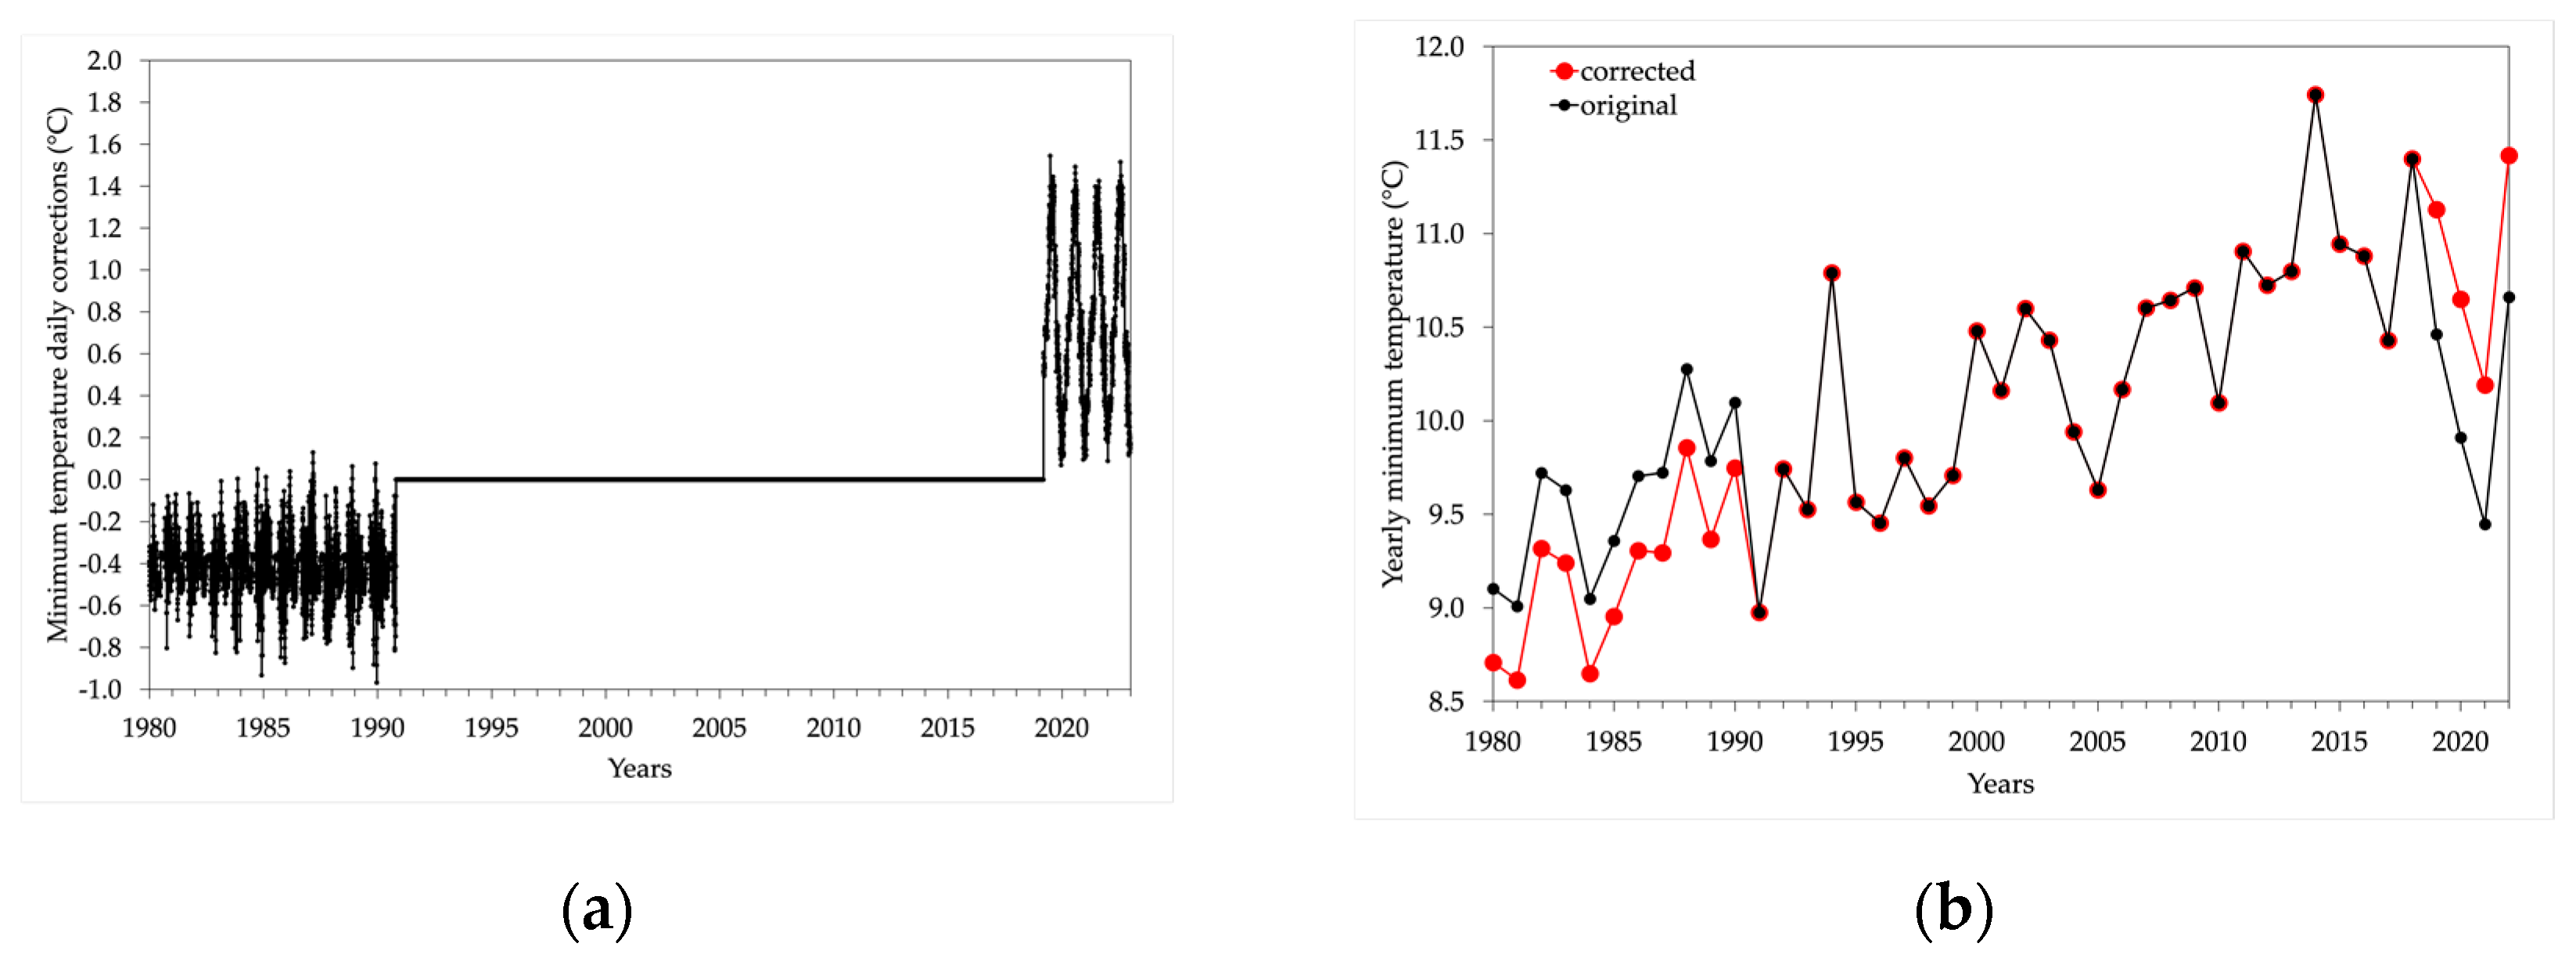
Figure 3.
(a) Daily corrections applied to maximum temperature; (b) Yearly mean of the original time series (black) and the correction (red).
Figure 3.
(a) Daily corrections applied to maximum temperature; (b) Yearly mean of the original time series (black) and the correction (red).
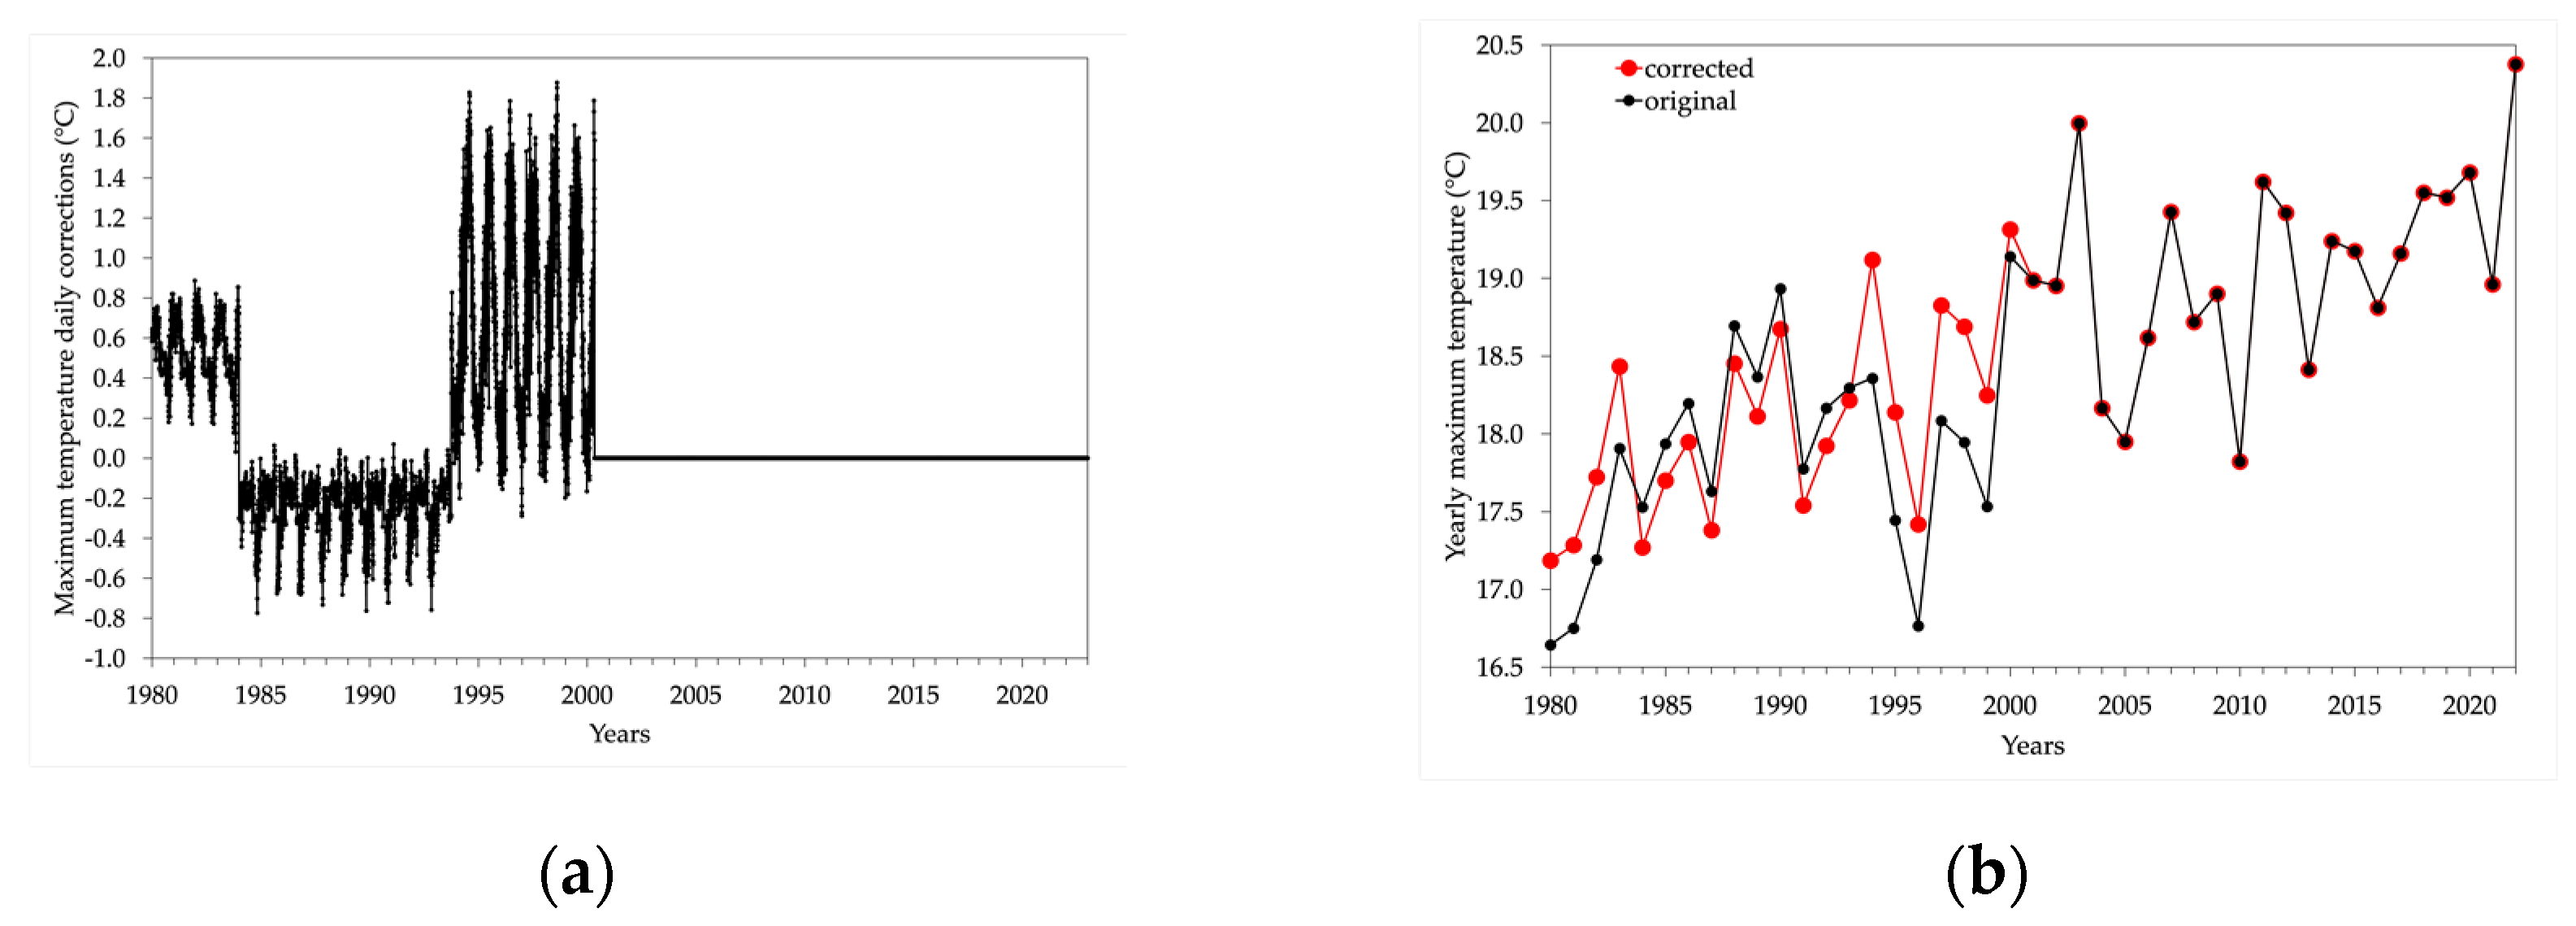
Figure 3 shows the same analysis but for the daily corrections of the maximum temperature, with most of the corrections of the Jan 1980 – Dec 1983 period ranging from +0.2°C to +0.9°C, of the Jan 1984 – Sep 1993 period ranging from -0.8°C to +0.0°C and of the Oct 1993 – Apr 2000 period ranging from -0.3°C and +1.9°C.
4. Discussion
Change-points in the monthly time series of minimum and maximum temperatures in Padua have been investigated with absolute and relative tests. Results showed two change-points for the minimum temperatures, in 1991 and 2019, and three change-points for maximum temperatures, in 1983, 1993 and 2000. By applying the R package Climatol to the sub-time series identified by the change-points, they have been extended back and forward, to have a consistent overlapping window of more than forty years, between 1980 and 2022, from which it was possible to calculate the transfer functions and homogenize the 1980-2022 time series with respect to the central period, 2000-2019, when OB_ARPAV was active.
Lastly, the yearly differences between the Padua and ERA5 temperature time series over 1980-2022 and between the MERIDA one, over 1993-2022, for both the original and corrected time series, were calculated. Results are reported in Figure 4a and 4b for minimum and maximum temperatures, respectively. As already shown in Section 3.2, ERA5 has a larger bias than MERIDA for minimum temperature. The corrected Padua time series exhibits a more coherent behavior in the first and last years with respect to the original one. The range of the differences between the original Padua minimum temperature series and ERA5 is 3.3°C, that decreases to 1.0°C after correction. Considering MERIDA, the range decreases from 1.1°C to 0.7°C (Figure 4a). Regarding maximum temperatures, there is a strong improvement after correction in the 1980-1993 period using ERA5 as reference dataset, and in the 1993-2000 period using both ERA5 and MERIDA. The range of the differences between the original Padua time series and ERA5 is 1.8°C, while after correction the range is 1.2°C; considering MERIDA, the range decreases from 1.7°C to 1.1°C (Figure 4b). Overall, the corrections applied to the Padua time series, for both minimum and maximum temperatures, provide more consistent differences with respect to the reanalysis products, exhibiting more stable evolutions.
The effect of these corrections on the overall trend was also explored. Considering the monthly anomalies time series over the 1993-2022 period, the slopes of the linear regression are reported in Table 14, while the slopes calculated over the whole 1980-2022 period are shown in Table 15. The slopes of the Padua corrected time series are closer to the reanalysis datasets in all cases except for maximum temperatures over the 1980-2022 period, for which the original slope was already consistent with ERA5. This confirms the goodness of the corrections to the Padua time series.
5. Conclusions
In this paper, the daily minimum and maximum temperatures recorded in the city center of Padua, Italy, from 1980 to 2022 have been examined. Four main different sub-periods are present in this time frame, determined by change of instruments or location or both. Fortunately, the dates of these changes are known, as well as the spatial coordinates of each new location. The application of the most used and performing absolute and relative homogeneity tests allow to identify the timing of the artificial change-points caused by these changes, not related to climatic signals. Two change-points were found for minimum temperature, in 1991 and 2019, and three change-points for maximum temperature, in 1983, 1993 and 2000, all supported by changes in the metadata.
Once the homogeneous sub-periods have been identified, the complete, homogeneous time series by means of monthly transfer functions have been obtained. Since the overlaps between the sub-time series are very short or absent, the Climatol algorithm provided by R [23] has been used to extrapolate the values of all the time series over the entire 1980-2022 period. In this way, very long overlapping periods have been obtained to calculate the transfer functions which also allow the blending of future measurements.
A comparison of the differences between the original and corrected Padua time series with the ERA5 and MERIDA reanalysis datasets confirms that the obtained reconstructions are reliable and more coherent with the modern warming trend. The meteorological observations of Padua have a very long history, as daily minimum and maximum temperatures are available since 1774 and daily mean values since 1725. Previous works reconstructed and homogenized the observations with respect to the XVIII – mid XIX century period [1,2]. A future work will address the problem of homogenizing observations before 1980 to the modern era to add new records correctly and continue the nearly 300-year time series, thus exploring the entire transition from the pre-industrial to the modern era.
Author Contributions
All authors have read and agreed to the published version of the manuscript.
Funding
This research received no external funding.
Data Availability Statement
The original and corrected Padua temperature data presented in this study are openly available in FigShare at https://doi.org/10.6084/m9.figshare.24460528.
Conflicts of Interest
The authors declare no conflict of interest.
References
- Camuffo, D. History of the Long Series of Daily Air Temperature in Padova (1725–1998). Climatic Change 2002, 53, 7–75. [Google Scholar] [CrossRef]
- Camuffo, D.; Bertolin, C. Recovery of the early period of long instrumental time series of air temperature in Padua, Italy (1716–2007). Phys Chem Earth, Parts A/B/C, Elsevier BV, 2012, Vol. 40-41, pp. 23-31. [CrossRef]
- Yozgatligil, C.;Yazici, C. Comparison of homogeneity tests for temperature using a simulation study. International Journal of Climatology, Wiley, 2015, Vol. 36(1), pp. 62-81. [CrossRef]
- Militino, A.; Moradi, M.; Ugarte, M. D. On the Performances of Trend and Change-Point Detection Methods for Remote Sensing Data Remote Sensing, MDPI AG, 2020, Vol. 12(6), pp. 1008. [CrossRef]
- Overland, J. E.; Percival, D. B.; Mofjel H. O. Regime shifts and red noise in the North Pacific. Deep Sea Research Part I: Oceanographic Research Papers, Elsevier BV, 2006, Vol. 53(4), pp. 582-588. [CrossRef]
- Peterson, T. C.; Easterling, D. R.; Karl, T. R.; Groisman, P.; Nicholls, N.; Plummer, N.; Torok, S.; Auer, I.; Böhm, R.; Gullett, D.; Vincent, L.; Heino, R.; Tuomenvirta, H.; Mestre, O.; Szentimrey, T.; Salinger, J.; Førland, E. J.; Hanssen-Bauer, I.; Alexandersson, H.; Jones, P. E.; Parker, D. Homogeneity adjustments of in situ atmospheric climate data: a review. Int J Climatol, 1998, Vol. 18(13), pp. 1493-1517. [CrossRef]
- Cos J., Doblas-Reyes F., Jury M., Marcos R., Bretonnière P. A., Samsó M. The Mediterranean climate change hotspot in the CMIP5 and CMIP6 projections, Earth Syst. Dynam., 2022, 13, 321–340. [CrossRef]
- Alexandersson, H. A homogeneity test applied to precipitation data. Journal of Climatology, Wiley, 1986, Vol. 6(6), pp. 661-675. [CrossRef]
- Buishand, T. Some methods for testing the homogeneity of rainfall records. Hydr., Elsevier BV, 1982, Vol. 58(1-2), pp. 11-27. -27. [CrossRef]
- Pettitt, A. N.; A Non-Parametric Approach to the Change-Point Problem. Applied Statistics, JSTOR, 1979, Vol. 28(2), pp. 126. [CrossRef]
- Chow, G. C. Tests of Equality Between Sets of Coefficients in Two Linear Regressions. Econometrica, JSTOR, 1960, Vol. 28(3), pp. 591. [CrossRef]
- Rodionov, S. N. A sequential algorithm for testing climate regime shifts. Geophysical Research Letters, American Geophysical Union (AGU), 2004, Vol. 31(9). [CrossRef]
- Changepoint, https://github.com/rkillick/changepoint/ (accessed on 30 September 2023).
- von Neumann, J. Distribution of the Ratio of the Mean Square Successive Difference to the Variance. The Annals of Mathematical Statistics, Institute of Mathematical Statistics, 1941, Vol. 12(4), pp. 367-395. [CrossRef]
- Hawkins, D. M. Testing a Sequence of Observations for a Shift in Location. Journal of the American Statistical Association, Informa UK Limited, 1977, Vol. 72(357), pp. 180-186. [CrossRef]
- Wambui G. D., Waititu G. A., Wanjoya A. The Power of the Pruned Exact Linear Time(PELT) Test in Multiple Changepoint Detection, Am. J. Theor. Appl. Stat. 2015, Vol. 4(6), pp. 581-586. [CrossRef]
- Mann, H. B. Nonparametric Tests Against Trend. Econometrica, JSTOR, 1945, Vol. 13(3), pp. 245. [CrossRef]
- Kendall, M.G. Rank Correlation Methods, 4th edition; Charles Griffin: London, 1975. [Google Scholar]
- Gilbert, R.O. Statistical Methods for Environmental Pollution Monitoring; Wiley: NY, 1987. [Google Scholar]
- Hersbach, H., Bell, B., Berrisford, P., Biavati, G., Horányi, A., Sabater, J. M., Nicolas, J., Peubey, C., Radu, R., Rozum, I., Schepers, D., Simmons, A., Soci, C., Dee, D., and Thépaut, J.-N. ERA5 hourly data on single levels from 1979 to present, 2018. [CrossRef]
- Velikou K., Lazoglou G., Tolika K., Anagnostopoulou C. Reliability of the ERA5 in Replicating Mean and Extreme Temperatures across Europe, Water 2022, 14, 543. [CrossRef]
- Bonanno R., Lacavalla M., Sperati S. A new high-resolution Meteorological Reanalysis Italian Dataset: MERIDA, Q J R Meteorol Soc. 2019, 145:1756–1779. [CrossRef]
- Guijarro, J. A. User’s guide of the climatol R Package. Unpublished, 2023.
- Caloiero, T., Filice, E., Coscarelli, R., Pellicone, G. A Homogeneous Dataset for Rainfall Trend Analysis in the Calabria Region (Southern Italy), Water, MDPI AG, 2020, Vol. 12(9), pp. 2541. [CrossRef]
- Cocheo, C., Camuffo, D. Corrections of Systematic Errors and Data Homogenisation in the Daily Temperature Padova Series (1725–1998). Climatic Change, 2002, 53, 77–100. [CrossRef]
Figure 1.
Locations of the meteorological stations considered in this study: (a) Padua city center; (b) Veneto region.
Figure 1.
Locations of the meteorological stations considered in this study: (a) Padua city center; (b) Veneto region.
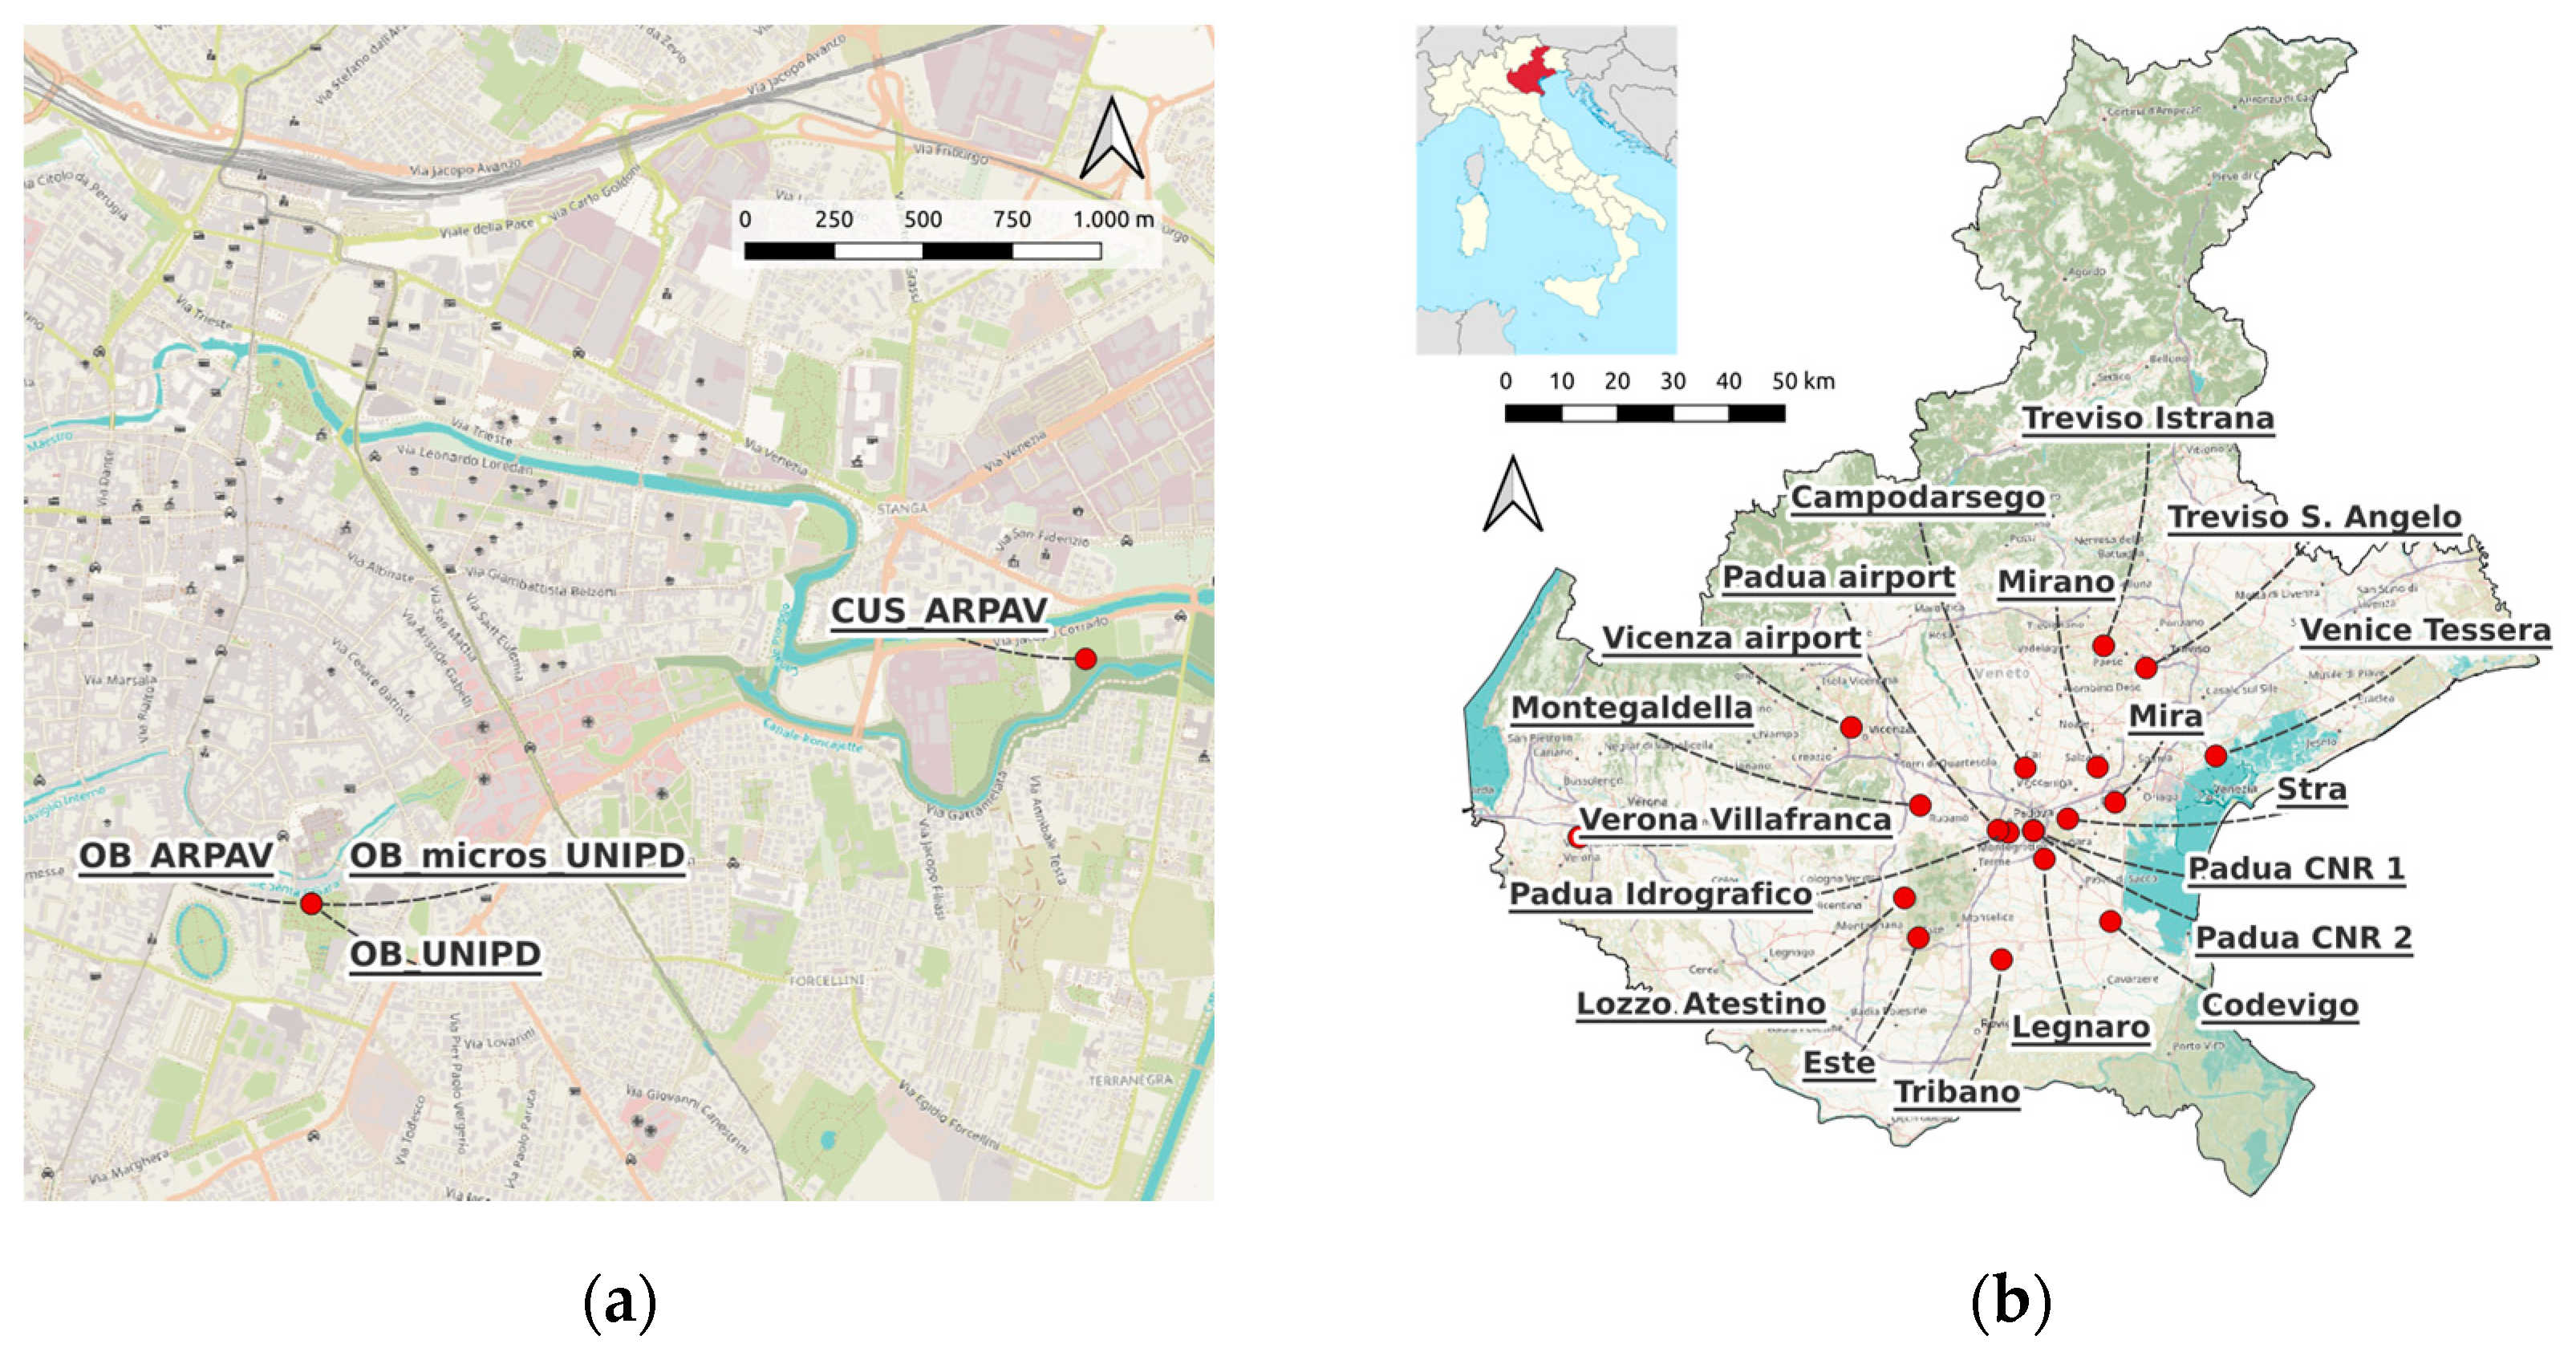
Figure 4.
(a) Difference of yearly minimum temperatures between the Padua, original and corrected, and ERA5 time series over 1980-2022 (green) and between MERIDA over 1993-2022 (orange); (b) the same but for maximum temperature. The continuous lines highlight the zero.
Figure 4.
(a) Difference of yearly minimum temperatures between the Padua, original and corrected, and ERA5 time series over 1980-2022 (green) and between MERIDA over 1993-2022 (orange); (b) the same but for maximum temperature. The continuous lines highlight the zero.
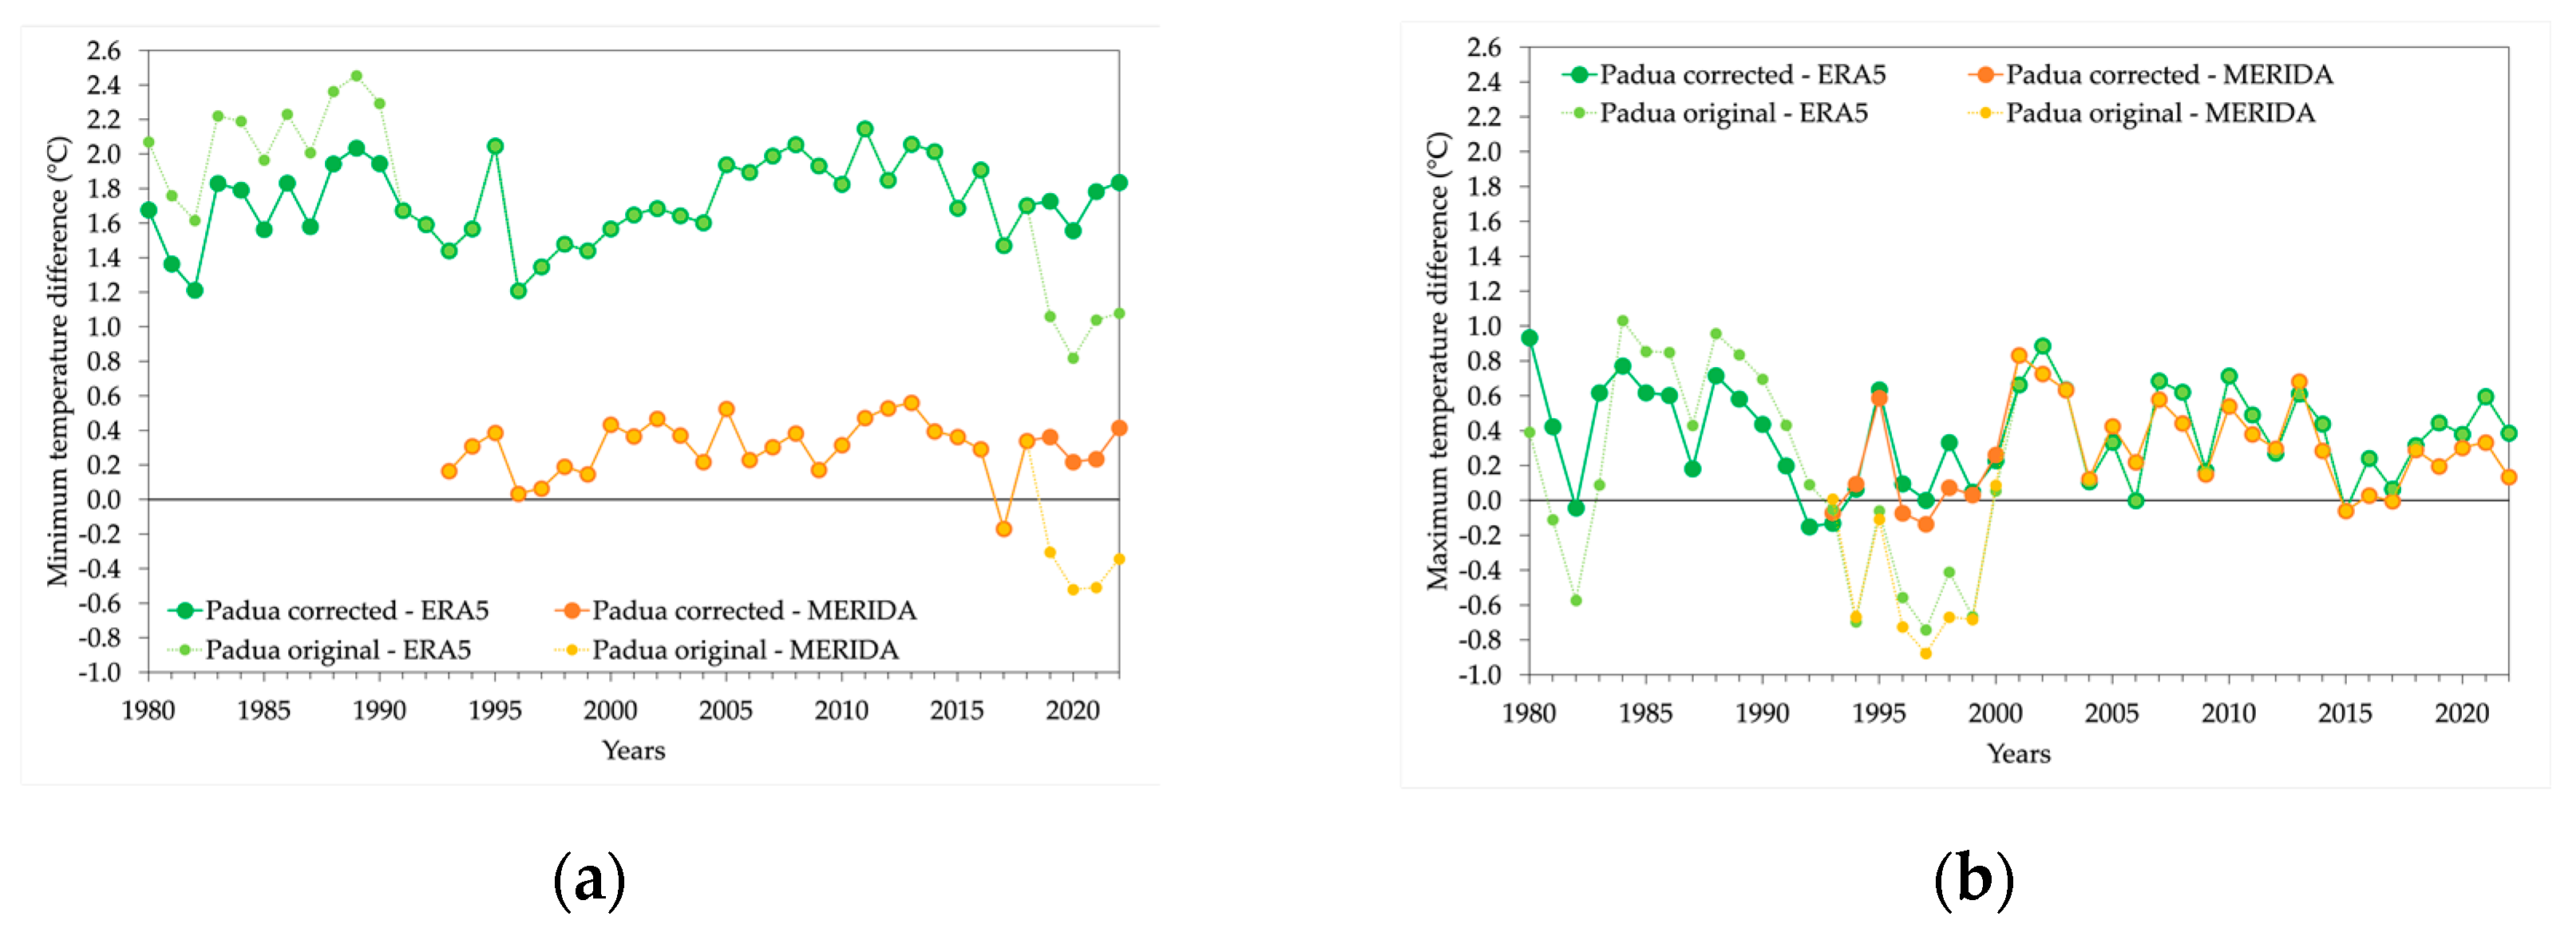
Table 1.
Daily temperature datasets for the center of Padua in the period 1980-2022.
| Station shortname | Longitude | Latitude | Elevation | Data availability |
|---|---|---|---|---|
| OB_UNIPD | 11.8805 | 45.3993 | 12 m | 1 Jan 1980 – 31 Dec 1993 (99.6%) |
| OB_micros_UNIPD | 11.8805 | 45.3993 | 12 m | 1 Oct 1993 – 30 Nov 2001 (91.0%) |
| OB_ARPAV | 11.8805 | 45.3993 | 12 m | 1 May 2000 – 10 Mar 2019 (100.0%) |
| CUS_ARPAV | 11.9085 | 45.4050 | 12 m | 11 Mar 2019 – 31 Dec 2022 (99.9%) |
Table 2.
Homogeneity tests and their R implementations used in this study. Absolute and relative classification is reported.
Table 2.
Homogeneity tests and their R implementations used in this study. Absolute and relative classification is reported.
| R package | Test | Function | Abs./Rel. |
|---|---|---|---|
| trend 1.1.5 | SNH | snh.test | Abs. |
| Pettitt | pettitt.test | Abs. | |
| Buishand U Buishand Range |
bu.test br.test |
Abs. Abs. |
|
| DescTools 0.99.47 | Von Neumann ratio | VonNeumannTest | Abs. |
| strucchange 1.5-3 | F-test | Fstats | Both |
| changepoint 2.2.4 | cpt.mean | cpt.mean | Both |
| rshift 2.2.2 | STARS | Rodionov | Both |
| climatol 4.0.0 | Climatol | homogen | Rel. |
Table 3.
Daily temperature availability for the reference stations.
| Station shortname | Longitude | Latitude | Elevation | Data Availability |
|---|---|---|---|---|
| Padua Idrografico | 11.8716 | 45.3912 | 13 m | 1 Jan 1986 – 31 Dec 1996 (50.9%) |
| Padua airport | 11.8483 | 45.3953 | 13 m | 1 Jan 1980 – 29 Dec 1990 (98.8%) |
| Padua CNR 1 | 11.9290 | 45.3931 | 10 m | 10 Apr 1984 – 31 Dec 1986 (51.4%) |
| Padua CNR 2 | 11.9290 | 45.3931 | 10 m | 29 Oct 1993 – 29 Dec 2008 (78.3%) |
| Codevigo | 12.1000 | 45.2430 | 0 m | 18 Feb 1992 – 31 Dec 2022 (99.6%) |
| Tribano | 11.8490 | 45.1860 | 4 m | 1 Jan 1996 – 31 Dec 2022 (100.0%) |
| Mira | 12.1177 | 45.4353 | 5 m | 5 May 1992 – 31 Dec 2022 (99.9%) |
| Campodarsego | 11.9137 | 45.4948 | 15 m | 1 Jan 1993 – 31 Dec 2022 (100.0%) |
| Legnaro | 11.9524 | 45.3467 | 10 m | 17 Jul 1991 – 31 Dec 2022 (99.3%) |
| Este | 11.6606 | 45.2244 | 12 m | 1 Feb 1980 – 31 Dec 1999 (78.4%) |
| Lozzo Atestino | 11.6307 | 45.2893 | 15 m | 1 Jan 1985 – 31 Dec 1996 (79.3%) |
| Stra | 12.0084 | 45.4107 | 9 m | 28 Jan 1985 – 31 Dec 2004 (88.1%) |
| Mirano | 12.0797 | 45.4930 | 10 m | 1 Jan 1988 – 30 Nov 2004 (100.0%) |
| Montegaldella | 11.6710 | 45.4383 | 22 m | 1 Apr 1993 – 31 Dec 2004 (98.6%) |
| Treviso Istrana | 12.1013 | 45.6887 | 41 m | 1 Jan 1980 – 31 Dec 2022 (98.6%) |
| Treviso S. Angelo | 12.1978 | 45.6508 | 17 m | 1 Jan 1980 – 31 Dec 2022 (97.0%) |
| Venice Tessera | 12.3519 | 45.5053 | 2 m | 1 Jan 1980 – 31 Dec 2022 (99.8%) |
| Vicenza airport | 11.5167 | 45.5667 | 39 m | 1 Jan 1980 – 29 Feb 2008 (98.1%) |
| Verona Villafranca | 10.8881 | 45.3964 | 72 m | 1 Jan 1980 – 31 Dec 2022 (98.8%) |
Table 4.
Results of absolute tests applied to monthly minimum and maximum temperatures in Padua over the period 1980 – 2022.
Table 4.
Results of absolute tests applied to monthly minimum and maximum temperatures in Padua over the period 1980 – 2022.
| Test | Change-points | |
|---|---|---|
| Minimum temperature | Maximum temperature | |
| SNH1 | Feb 2000 | Mar 2000 |
| Pettitt1 | Feb 2000 | Mar 2000 |
| Buishand U1 | Feb 2000 | Mar 2000 |
| Buishand Range1 | Feb 2000 | Mar 2000 |
| Von Neumann ratio1 | yes | yes |
| F-test1 | Feb 2000 | Mar 2000 |
| cpt.mean2 | Mar 2000 | Apr 1982 Mar 2000 Apr 2003 Aug 2003 Feb 2011 |
| STARS3 | Sep 1987 Jul 2013 Mar 2020 |
Jul 1985 Apr 2000 Jan 2004 Sep 2006 |
- 1 p-value < 0.01.
- 2 The package does not calculate traditional p-values directly related to the changes.
- 3 p-value ≤ 0.01 and cutoff length in the range 12-42 (i.e., 1-3.5 years).
Table 5.
Pearson correlation coefficient (c_Pearson) and RMSE obtained comparing Padua daily observations to the ones of other stations and to reanalysis data over 1993-2022. In parenthesis the values obtained after having removed the seasonal components (using R package “stlplus”).
Table 5.
Pearson correlation coefficient (c_Pearson) and RMSE obtained comparing Padua daily observations to the ones of other stations and to reanalysis data over 1993-2022. In parenthesis the values obtained after having removed the seasonal components (using R package “stlplus”).
| Datasets over 1993-2022 | Minimum temperature | Maximum temperature | ||
|---|---|---|---|---|
| c_Pearson | RMSE (°C) | c_Pearson | RMSE (°C) | |
| ERA5 | 0.980 (0.866) | 2.25 | 0.986 (0.904) | 1.48 |
| MERIDA | 0.987 (0.912) | 1.17 | 0.990 (0.926) | 1.28 |
| Campodarsego | 0.982 (0.911) | 2.47 | 0.995 (0.965) | 1.01 |
| Legnaro | 0.986 (0.923) | 1.83 | 0.994 (0.962) | 0.93 |
| Codevigo | 0.983 (0.904) | 1.76 | 0.991 (0.936) | 1.22 |
| Mira | 0.983 (0.915) | 2.25 | 0.992 (0.953) | 1.08 |
| Tribano 1 | 0.985 (0.912) | 1.88 | 0.992 (0.946) | 1.23 |
| Treviso Istrana | 0.983 (0.898) | 1.86 | 0.991 (0.936) | 1.37 |
| Treviso S. Angelo | 0.987 (0.919) | 1.56 | 0.991 (0.941) | 1.26 |
| Venice Tessera | 0.990 (0.929) | 1.22 | 0.986 (0.908) | 1.62 |
| Verona Villafranca | 0.982 (0.884) | 2.06 | 0.987 (0.908) | 1.50 |
1 1996-2022.
Table 8.
Summary of the change-points identified by the absolute and relative tests for the Padua minimum and maximum time series over the period 1980-2022.
Table 8.
Summary of the change-points identified by the absolute and relative tests for the Padua minimum and maximum time series over the period 1980-2022.
| Change-points | ||
|---|---|---|
| Timing | Cause | |
| Minimum temperature | 24 Oct 1990 11 Mar 2019 |
Instrument change Location change |
| Maximum temperature | 1 Jan 1984 1 Oct 1993 1 May 2000 |
Instrument change Instrument change Instrument and location change |
Table 14.
Slopes of linear regressions for the Padua original and corrected time series and MERIDA over the period 1993-2022.
Table 14.
Slopes of linear regressions for the Padua original and corrected time series and MERIDA over the period 1993-2022.
| 1993-2022 | Slopes (°C/decade) | |
|---|---|---|
| Minimum temperature | Maximum temperature | |
| Padua original | +0.31 ± 0.08 | +0.61 ± 0.09 |
| Padua corrected | +0.48 ± 0.08 | +0.40 ± 0.09 |
| MERIDA | +0.46 ± 0.07 | +0.39 ± 0.09 |
Table 15.
Same of Table 14 but for ERA5 and the period 1980-2022.
Table 15.
Same of Table 14 but for ERA5 and the period 1980-2022.
| 1980-2022 | Slopes (°C/decade) | |
|---|---|---|
| Minimum temperature | Maximum temperature | |
| Padua original | +0.35 ± 0.05 | +0.52 ± 0.06 |
| Padua corrected | +0.54 ± 0.05 | +0.48 ± 0.05 |
| ERA5 | +0.49 ± 0.05 | +0.50 ± 0.06 |
Disclaimer/Publisher’s Note: The statements, opinions and data contained in all publications are solely those of the individual author(s) and contributor(s) and not of MDPI and/or the editor(s). MDPI and/or the editor(s) disclaim responsibility for any injury to people or property resulting from any ideas, methods, instructions or products referred to in the content. |
© 2023 by the authors. Licensee MDPI, Basel, Switzerland. This article is an open access article distributed under the terms and conditions of the Creative Commons Attribution (CC BY) license (http://creativecommons.org/licenses/by/4.0/).
Copyright: This open access article is published under a Creative Commons CC BY 4.0 license, which permit the free download, distribution, and reuse, provided that the author and preprint are cited in any reuse.


