Submitted:
24 October 2023
Posted:
25 October 2023
You are already at the latest version
Abstract
The classical joint economic lot-sizing (JELS) policy in a single-vendor single-buyer system generates an equal production quantity in all cycles, where the input parameters remain static indefinitely. In this paper, a new two-echelon supply chain inventory model is developed involving a hybrid production system that simultaneously focuses on green and regular production methods with optimal allocation fraction of green and regular productions. Unlike the classical mathematical formulation, each cycle is independent from the previous one, and consequently, the input parameters can be adjusted to be responsive to the dynamic nature of demand rate and price fluctuation. A rigorous heuristic approach is used to derive a global optimal solution for a joint hybrid production system. The model accounts for carbon emissions from production and storage activities related to green and regular produced items along with transportation activity under a multi-level emission-taxing scheme. The results emphasize the significant impact of green production on emissions. That is, the higher the allocation fraction of green production the lower the total amount of emissions generated by the system, i.e., the system becoming more sustainable. Adopting a hybrid production method not only decreases the greenhouse gas (GHG) emissions dramatically, but also reduces the per unit time total cost when compared with regular production. One of the main findings is that the total system cost generated by the base closed-form formula of the proposed model is considerably lower than that of the existing literature i.e., 33.59% (16.13%) lower in the first cycle (subsequent cycles) when the regular production method is assumed. Moreover, the optimal production rate generated by the proposed model is the one that minimizes the emissions production function. Illustrative examples and special cases that reflect different realistic situations are compared to outline managerial insights.
Keywords:
vendor-managed inventory
; hybrid production
; optimal fraction of green production
; carbon emissions
; emissions tax and penalty
; first-time interval.
1. Introduction
Nowadays, global warming and
environmental change emerge as a challenge facing governments and the
United Nations (UN). This can be attributed to the dramatic increase in greenhouse gas (GHG) over the last decade with a rate of increase,
almost twice as that recorded for the last three decades [1]. The impact of such increase has forced governments to design regulations to limit GHG
emissions omitted into the environment. Carbon emission reduction regulations
may comprise carbon tax, carbon offset, carbon caps, or carbon cap-and-trade
policies. These polices have been established by the UN and the European Union
(EU) to reflect the 2030 Agenda for Sustainable Development Goals (SDGs) [2]. In response to the regulations, several
countries made a commitment to limit GHG emissions.
Manufacturing and transportation are among the biggest
sectors in the world that contribute to GHG emissions [3]. For, example, 29% of
total GHG emissions in the U.S. is omitted by transportation activities, which
is recognized as the largest sector that generates GHG emissions [4]. To comply with the GHG
emissions policies established by the governments, the
manufacturers need to focus on sustainable development of logistics
systems that minimize overall emissions. In this regard, adopting
green technology is one of the most effective strategies to
reduce carbon dioxide (CO2) emissions in their supply chain
activities [5,6]. Implementing green technology leads to green production
that reflects environmentally friendly inventions. The
aim is to use renewable energy, reduce energy use, generate lower
emissions, and emphasize awareness of health and safety
concerns. Although green production reduces GHG
emissions dramatically when compared with the regular production, it may
result in higher operating costs [7–9].
Therefore, it is perhaps more cost effective if the
manufacturer uses a hybrid production system that combines green and regular
productions. This entails a mechanism that balances green and regular
production activities considering operating costs.
Supply chain management (SCM) aims to decrease
costs and enhances coordination between supply chain members. One of the main
objectives of such coordination is to achieve economic balance among supply
chain entities. This can be attained by sharing accurate and
timely information towards effective use of recourses. In the classical
two-level supply chain consisting of a vendor and a buyer, the lot sizing
strategy is optimized independently. Whereas a joint economic lot sizing (JELS)
refines traditional independent inventory control methods for a joint strategy
that simultaneously determines optimal production quantity and the number of
shipments per time interval [10–13]. It has
been introduced by many researchers to show that a joint
production and inventory policy is a key determinant in carbon
emission reduction [14–16].
The Vendor-Managed Inventory (VMI) represents a two-echelon supply chain system
that involves information sharing between the vendor and the buyer. Through
collaborative relationship, the vendor adjusts the production-inventory policy
to replenish multiple lot sizes to the buyer subject to the buyer’s information
related to demand and stock-level. Sustainable supply chain cooperation between
a vendor and a buyer emerges as an opportunity beyond cost-sharing efficiency.
In the VMI systems, a collaborative relationship may lead to a more profitable
joint policy, carbon emissions reduction, inventory cost reduction, and
logistic flexibility. This partnership also implies that economic, social
interests, and environmental aspects are nested inside each other, i.e., the
system becoming more sustainable [17–19]. The
highlights of this manuscript are summarized below:
A two-echelon supply chain inventory model is
developed for a VMI system. The developed model considers a
hybrid production system involving green and regular
production methods with optimal allocation fraction of green and regular
productions. The proposed model accounts for carbon
emissions omitted from production and storage activities
related to green and regular produced items along with transportation activity.
The cost function includes penalty charge for exceeding the permissible
emissions limits, however, the system earns revenue by selling excess
quota in the case that the total emissions generated by the system is less than
that of the emission cap, which reflects the cap-and-trade policy. The
mathematical formulation considers that the initial on-hand inventory of the
buyer is zero in the first-time interval, which can be attributed to the fact
that no items have been produced yet. Therefore, two models are developed. The
first model reflects the mathematical formulation of the first cycle, whereas
the second considers subsequent cycles. Each cycle is independent from the
previous one, and consequently, the input parameters can be adjusted to be
responsive to the dynamic nature of demand rate and price fluctuation. Results show that the base closed-form formula of the proposed model generates optimal results with considerable
total system cost reduction when compared with the existing literature. The
optimal production rate generated by the proposed model is the one that minimizes
the emission production function. That is, it generates
the lowest emission possible when compared with the existing literature. For
subsequent cycles, production process starts at the time needed to produce and
deliver the first lot size. Such displacement in time prevents keeping items at
the vendor’s warehouse for extra time that is associated with the consumption
of the last lot that has been delivered to the buyer from previous cycle.
2. Literature Review
The first approach that formulate a joint inventory
model was introduced by Goyal [20]. The author
investigated the vendor production-inventory policy assuming instantaneous
production rate, where a lot-for-lot (LFL) policy is considered for delivering
the lot sizes to the buyer. Banerjee [13]
considered the model of Goyal [20] under the
assumption of a finite production rate. Wahab et al. [21]
proposed inventory models considering emissions costs from transportation
activity. The models determine the optimal production quantity and shipments
frequency for imperfect quality items. Hua et al. [22]
investigated the model for carbon footprints along with carbon emissions
trading. They examined the effects of carbon taxes, carbon cap, and carbon
trade on total cost, order quantity, and carbon emissions. Wangsa [23] examined the JELS model considering industrial
and transport emissions under penalties and incentives. Ben-Daya and Hariga [24] investigated the model where the lead time is a
function of the lot size quantity. Hariga et al. [25]
evaluated the effect of carbon emissions in a multistage supply chain of a cold
item during storage and transportation activities. Gautam et al. [26] studied the model, where the carbon emission is
caused by transportation activity. Halat and Hafezalkotob [27] considered a
multi-stage green supply chain inventory model under four different types of
carbon regulations. They examined the effect of coordinated and non-coordinated
structures on inventory cost and carbon emissions. Khouja and Mehrez [28] investigated
the case when the unit production cost is a function of the production
rate. They assumed that the increase of the
production rate deteriorates the quality of the production process. Eiamkanchanalai and Banerjee [29] considered
the case when the unit production cost is a quadratic function of the production
rate in a single-level inventory model. Ghosh et al. [30] considered strict carbon cap policy on a multi-echelon
supply chain inventory model. They considered emissions related to production,
inventory, and transportation activities. Saga et al. [31] investigated the
model for imperfect production processes and inspection errors. The carbon emissions are related to energy generated from
transportation and production activities, where incentive and penalty policy
are assumed for carbon emission reduction. Huang et al. [32] investigated the
effect of green technology on a two-echelon supply chain with carbon emissions
related to production, transportation, and storage activities along with carbon
taxes, limited total carbon emissions, and cap-and-trade policies.
Chen et al. [33]
provided conditions to reducing emission by modifying order quantities. They
discussed factors affecting emission reduction and cost increase. Kumar and
Uthayakumar [34] considered five different
stock control policies for unequal shipments to the buyer. The cost function
comprises taxes and penalties to reducing emission from production. Zanoni et
al. [35] presented a JELS model with
consignment stock (CS) agreement considering emissions taxes, penalty costs,
and an emission-trading scheme. Jaber et al. [36]
examined the effect of carbon emissions on the JELS inventory models. They
accounted for carbon taxes and penalties, where the production rate is assumed
as a function of the rate of the carbon emission. Turken et al. [37] considered various environmental regulations in
a multiple buyers-single vendor inventory model. Bazan et al. [38] proposed two models that investigate emissions
costs from transportation activity along with energy used for production. The
first model underlies the traditional coordination strategy and the second
underlies CS agreement strategy.
Astanti et al. [39]
considered a VMI model for imperfect quality items and deterioration. The model
is associated with carbon emissions related to transportation and production
operations. Malik and Kim [40] investigated
the model considering defect from production operation, where the production
rate is a function of the carbon emission. Jauhari et al. [41] proposed a VMI model for a
hybrid production system involving green and regular productions. They assumed carbon emissions related to transportation, storage, and production
activities.
The above-cited references are
directly relevant to the proposed model. However, the effects of carbon emission reduction on the JELS models have been
extended in several ways. Many researchers have accounted for cases that are
not limited to, deterministic and stochastic demand, imperfect quality items
related to production process, equal or unequal shipments policies, and
deterioration [42–55]. For
more details on the mathematical modeling of the
JELS and the related research (see [6,10]). Recently, Alamri [56] pointed out that the classical
formulation of the joint VMI system assumed an infinite planning horizon and
ignored the fact that the inventory level at the buyer’s warehouse is zero in
the first cycle since the production process has not yet started. The
author rectified the model of Jaber et al. [36]
and provided a closed-form formula that generates considerably lower total
cost. Two models were developed involving carbon emissions
from production, storage, and transportation activities. The first model
formulates the total cost function for the first cycle, whereas the second
formulates the function of subsequent cycles. The author also showed
that ignorance of the physical transportation cost does not affect the optimal
production quantity. Table 1 below depicts and compares the proposed model with some related
previously published works.

Table 1.
A comparison between the proposed model with respect to some selected previous studies.
| No | Authors | First cycle | Adjustable parameters | Adjustable production rate | Hybrid production | Emissions | Carbon regulations |
|---|---|---|---|---|---|---|---|
| 1 | Wahab et al. [21] | Transportation | Carbon tax | ||||
| 2 | Hariga et al. [25] | Storage, Transportation | Carbon tax | ||||
| 3 | Jaber et al. [36] | Production | Carbon tax, Penalty | ||||
| 4 | Bazan et al. [38] | Production, Transportation | Carbon tax, Penalty | ||||
| 5 | Kumar and Uthayakumar [34] | Production | Carbon tax, Penalty | ||||
| 6 | Zanoni et al. [35] | Production | Carbon tax, Penalty | ||||
| 7 | Konur [57] | Transportation | Carbon cap | ||||
| 8 | Astanti et al. [39] | Production, Transportation | Carbon tax | ||||
| 9 | Malik and Kim [40] | Production | |||||
| 10 | Bouchery [58] | Transportation | |||||
| 11 | Jauhari et al. [41] | Production, Transportation, Storage | Carbon tax | ||||
| 13 | Alamri [56] | Production, Transportation, Storage | Carbon tax,Carbon cap | ||||
| 14 | Proposed model | Production, Transportation, Storage | Carbon tax, Carbon cap, Penalty |
3. Research Contribution
The mathematical formulation of the classical JELS
inventory model generates an equal production quantity in all
cycles. This can be attributed to the fact that the formulation assumes
an infinite planning horizon. Such assumption suggests a
static production process that is associated with a fixed multiplier in all
cycles including the first cycle. However, the initial on-hand inventory of the
buyer is zero in the first-time interval since no items have been produced yet.
This necessitates a production policy that distinguishes the first cycle from
subsequent cycles. Therefore, two mathematical formulations that reflect the
behavior of the first and subsequent cycles are needed. The first mathematical
formulation derives distinct optimal solution for the first cycle, while the
other generates distinct optimal solution for subsequent cycles. Therefore,
each subsequent cycle can be associated with its distinct input parameters to
ensure that it is independent from the previous one. It is worth noting here
that such consideration overcomes the implicit assumption associated with the
classical formulation that input parameters remain static indefinitely. This is
so, because the classical formulation assumes that the production process for
subsequent cycles begins to generate the same lot sizes equal that of the last
lot that has been produced in previous cycle, which represents the initial
on-hand inventory of the buyer. Accordingly, if the situation warrants and the
decision-maker obliged to deviate from the current policy, then the optimal
production quantity as the classical formulation would then suggest cannot be considered as the optimal
quantity for subsequent cycles.
The proposed model considers the abovementioned
issues and, therefore, allowing for the adjustment of the input parameters for
any subsequent cycle. This also guarantees that the model remains viable and
keeps generating optimal results for subsequent cycles subjected to the
desirable adjustment of the input parameters. In practice, input parameters
encounter adjustment due to many realistic situations. Such adjustment may
occur because of external competitiveness and/or internal
challenges or as a response to the dynamic nature of demand rate and/or
price fluctuation. Moreover, implementing of a new policy due to acquiring new
knowledge, periodic review applications, and machine maintenance scheduling
activities may trigger situations that force the decision-maker to consider a
suitable adjustment of the input parameters [59,60].
In this paper, we propose a VMI inventory model
that investigates the effect of carbon emissions together with the
implementation of green technology. The developed model
considers a hybrid production system that simultaneously focuses on
green and regular production methods with optimal allocation
fraction of green and regular productions. In this model, emissions are
released from production and storage activities related to
green and regular produced items along with transportation activity. The
carbon emissions are relatively associated with carbon taxes and penalties for
exceeding the allowable emissions limits. The model also
assumes that the system earns revenue by selling excess quota in the case
that the total emission generated by the system is less than that of the emission
cap, which reflects the cap-and-trade policy. Unlike traditional modeling,
hybrid production implies simultaneous production fractions associated with
green and regular productions, where each is associated with its distinct released
emission level. In this case, the demand is satisfied from a collection of
green and regular produced items. This method enables decision-maker to
trade-off between the production cost and emissions. For subsequent cycles, the
production process starts at the time needed to produce and deliver the first
lot size. Such displacement in time prevents keeping items at the vendor’s
warehouse for extra time that is associated with the consumption of the last
lot that has been delivered to the buyer.
Transportation service that is associated with
inventory mathematical modeling is either the Truck Load (TL) or Less than
Truck Load (LTL) services. An TL service applies such that the cost incurs for
the whole truck [57,61,62]. Whereas an LTL
service refers to the case when the cost is paid per unit of item that is
transported. To entice manufacturers, logistics companies often offer the option
for utilizing both LT and LTL services. Therefore, the decision-maker needs to
allocate the fraction based on the capacity of the truck that renders LT
transportation service or a mixed services of LT and LTL minimizes the
transportation cost. That said, the allocation fraction is associated with a
positive integer multiplier representing the number of trucks (TL) required for
each shipment along with the remaining quantity that needs to be transported by
(LTL) service. The remainder of this paper is organized as follows:
In section 4, the cost components related to the
joint hybrid production system are presented to formulate the first and
subsequent cycles. Illustrative examples and special cases that reflect the
application of the joint model are given in Section
5. Section 6 represents model
overview and managerial insights. In Section 7,
the concluding remarks and further research are provided. Finally, the holding
cost functions related to the joint hybrid model are given in Appendix A, whereas the solution procedure for
the first and subsequent cycles are given in Appendix
B.
4. Formulation of the Joint Model
4.1. Notations
The list of notations used to develop the joint hybrid
inventory system are given in Table 2
below:
Table 2.
List of notations used to develop the hybrid green and regular production joint model.
| denotes regular production | |
| refers to the first cycle and refers to the subsequent cycles | |
| Buyer’s demand rate (units/unit time) | |
| The time to produce units | |
| The lead time (order point) to deliver the order quantity of size | |
| The time to consume units | |
| Cycle time | |
| The time to consume units | |
| The idle time before commencing the production process for subsequent cycles | |
| CO2 emissions from electricity (ton CO2/kWh) | |
| Buyer’s energy consummation for keeping items in storage (kWh/unit/unit time) | |
| Vendor’s energy consummation for keeping items in storage (kWh/unit/unit time) | |
| CO2 emissions generated by the buyer’s facility (ton CO2/unit) | |
| Buyer’s CO2 emissions tax ($/ton CO2) | |
| The truck capacity (units/truck) | |
| Fixed transportation cost per truck ($/truck) | |
| Fixed transportation cost per unit ($/unit), where | |
| Product’s weight (ton/unit) | |
| Distance from the freight to the vendor (km) | |
| Distance from the vendor to the buyer (km) | |
| The amount of fuel consumed by an empty truck (liters/km) | |
| The amount of fuel consumed by a truckload (liters/km/ton) | |
| Variable transportation cost associated with fuel consumption ($/liter) | |
| CO2 emissions from truck fuel (ton CO2/liter) | |
| CO2 emissions generated by the vendor’s facility (ton CO2/unit) | |
| The total amount of CO2 emissions (ton CO2/unit), where | |
| CO2 emissions limit (ton CO2/unit time) | |
| CO2 emissions penalty that the system incurs for exceeding emissions limit ($ /unit time) | |
| CO2 emissions cap (ton CO2), where | |
| Vendor’s CO2 emissions tax ($/ton CO2) | |
| Vendor’s CO2 emissions revenue earned for selling excess quota ($/ton CO2) | |
| Vendor’s CO2 emissions tax for transportation ($ /ton CO2) | |
| CO2 emissions function parameter for production (kg CO2 unit time2/unit3) | |
| CO2 emissions function parameter for production (kg CO2 unit time/unit2) | |
| CO2 emissions function parameter for production (kg CO2/unit) | |
| The per unit time cost to run the machine independent of production rate ($/unit time) | |
| The increase in unit machining cost associated with the increase of one unit in production rate ($ unit time/unit2); | |
| Buyer’s ordering cost | |
| Vendor’s set-up cost | |
| Vendor’s holding cost | |
| Decision variables: | |
| Vendor’s coordination multiplier, where and integer | |
| Vendor’s allocation fraction of green production, where | |
| Production rate (units/unit time), where | |
| Order quantity (units/unit time), where | |
| Number of trucks required to deliver , where and integer |
4.2. Assumptions
The following assumptions have been considered:
- A single item is manufactured by a combination of green and regular production methods.
- The demand rate is satisfied from a collection of green and regular produced items.
- Any order size of placed at time arrives the buyer just prior to the depletion of the on-hand inventory of that same period. In the first period of the first cycle, the buyer’s initial inventory is zero because no items have been manufactured yet. Accordingly, the vendor delivers the first lot size, once it has been accumulated from green and regular produced items by time and, will reach the buyer after a transportation time . Therefore, shortages are allowed in the first period of the first cycle and fully backordered by time . Thus, we restrict that in the first cycle, i.e., the second replenishment will reach the buyer before the depletion of the on-hand inventory of the first period, i.e., no later than time .
4.3. The Mathematical Formulation of the Joint Model
Figures 1 and 2
depict, respectively, inventory variation of the proposed joint model for a
tow-echelon supply chain consisting of a vendor and a buyer for the first and
subsequent cycles. At the beginning of the first cycle, the production process
of green and regular produced items starts at a rate . At time , the vendor delivers the first lot of size units that have been accumulated from green and
regular produced items. This quantity satisfies demand and shortages that has
been accumulated during time . As can been seen from Figures 1 and 2, holding cost are applied for lots for both the vendor and the buyer. This is so,
because the vendor must deliver two lots by time to avoid shortages for the second period.
Therefore, the first lot that has been replenished at time reaches the buyer at time to satisfy demand and shortages. Whereas the second
reaches the buyer just before the inventory level becomes zero, i.e., by time . In the subsequent cycles, the production process
starts at time . That is, the production time is displaced until
the time required to produce and deliver the first lot.
Figure 1.
Inventory variation for a coordinated two-echelon supply chain in the first cycle
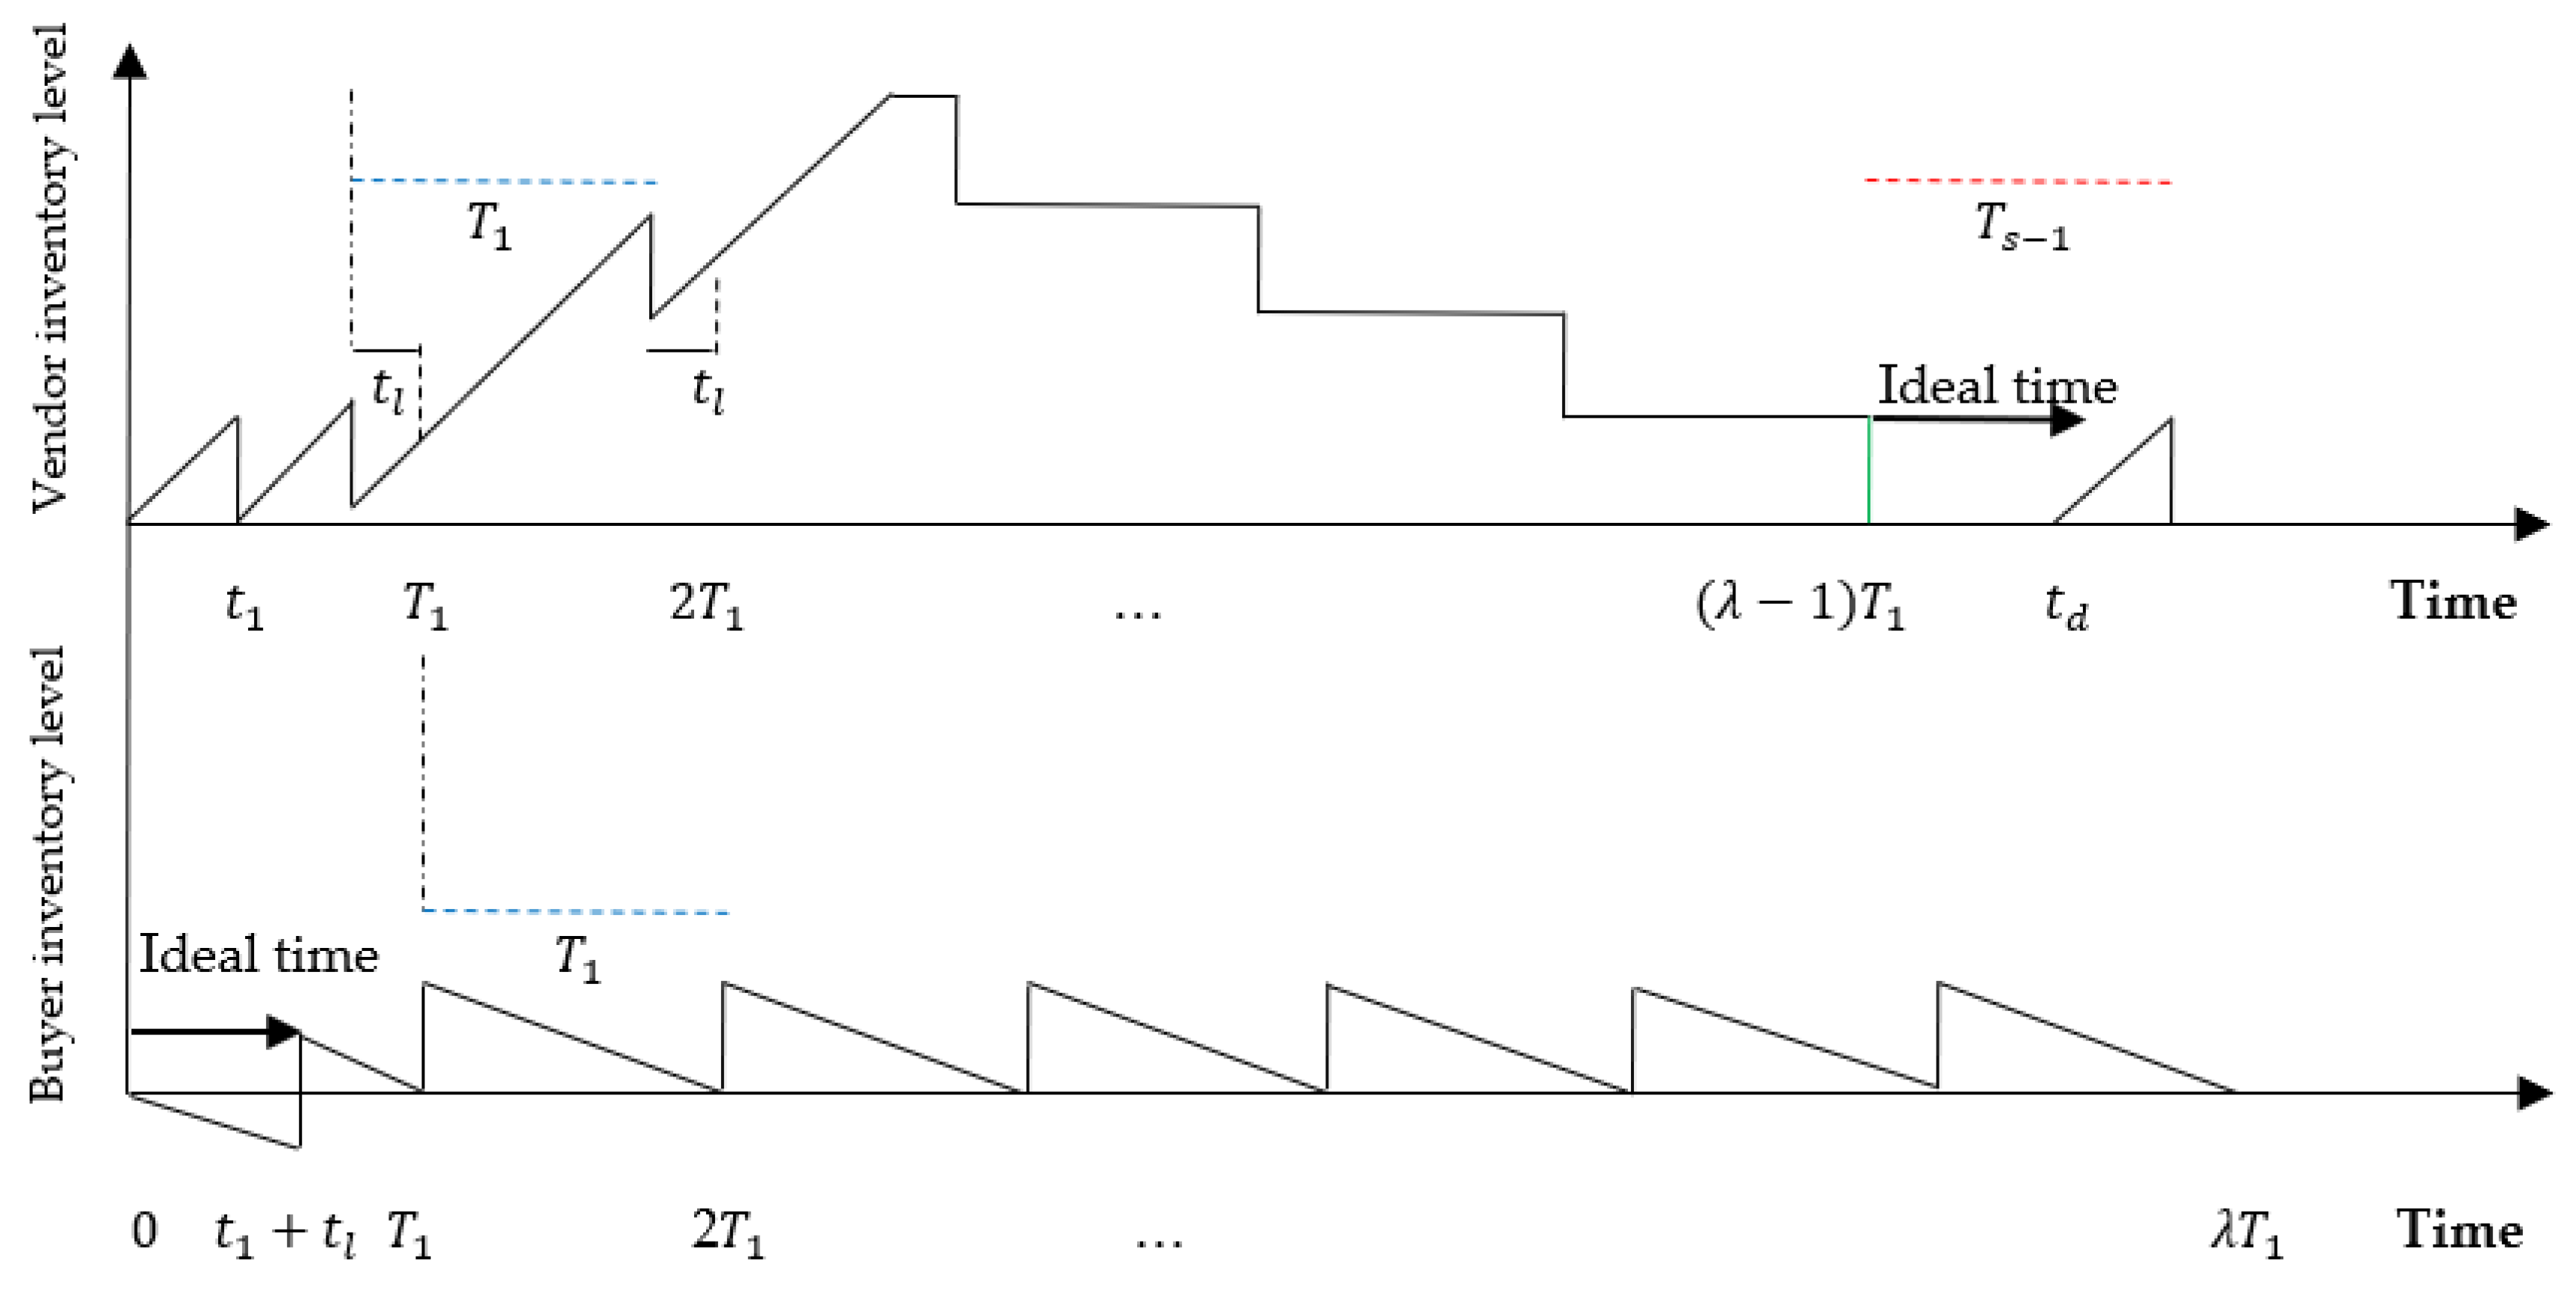
Figure 2.
Inventory variation for a coordinated two-echelon supply chain in the subsequent cycles
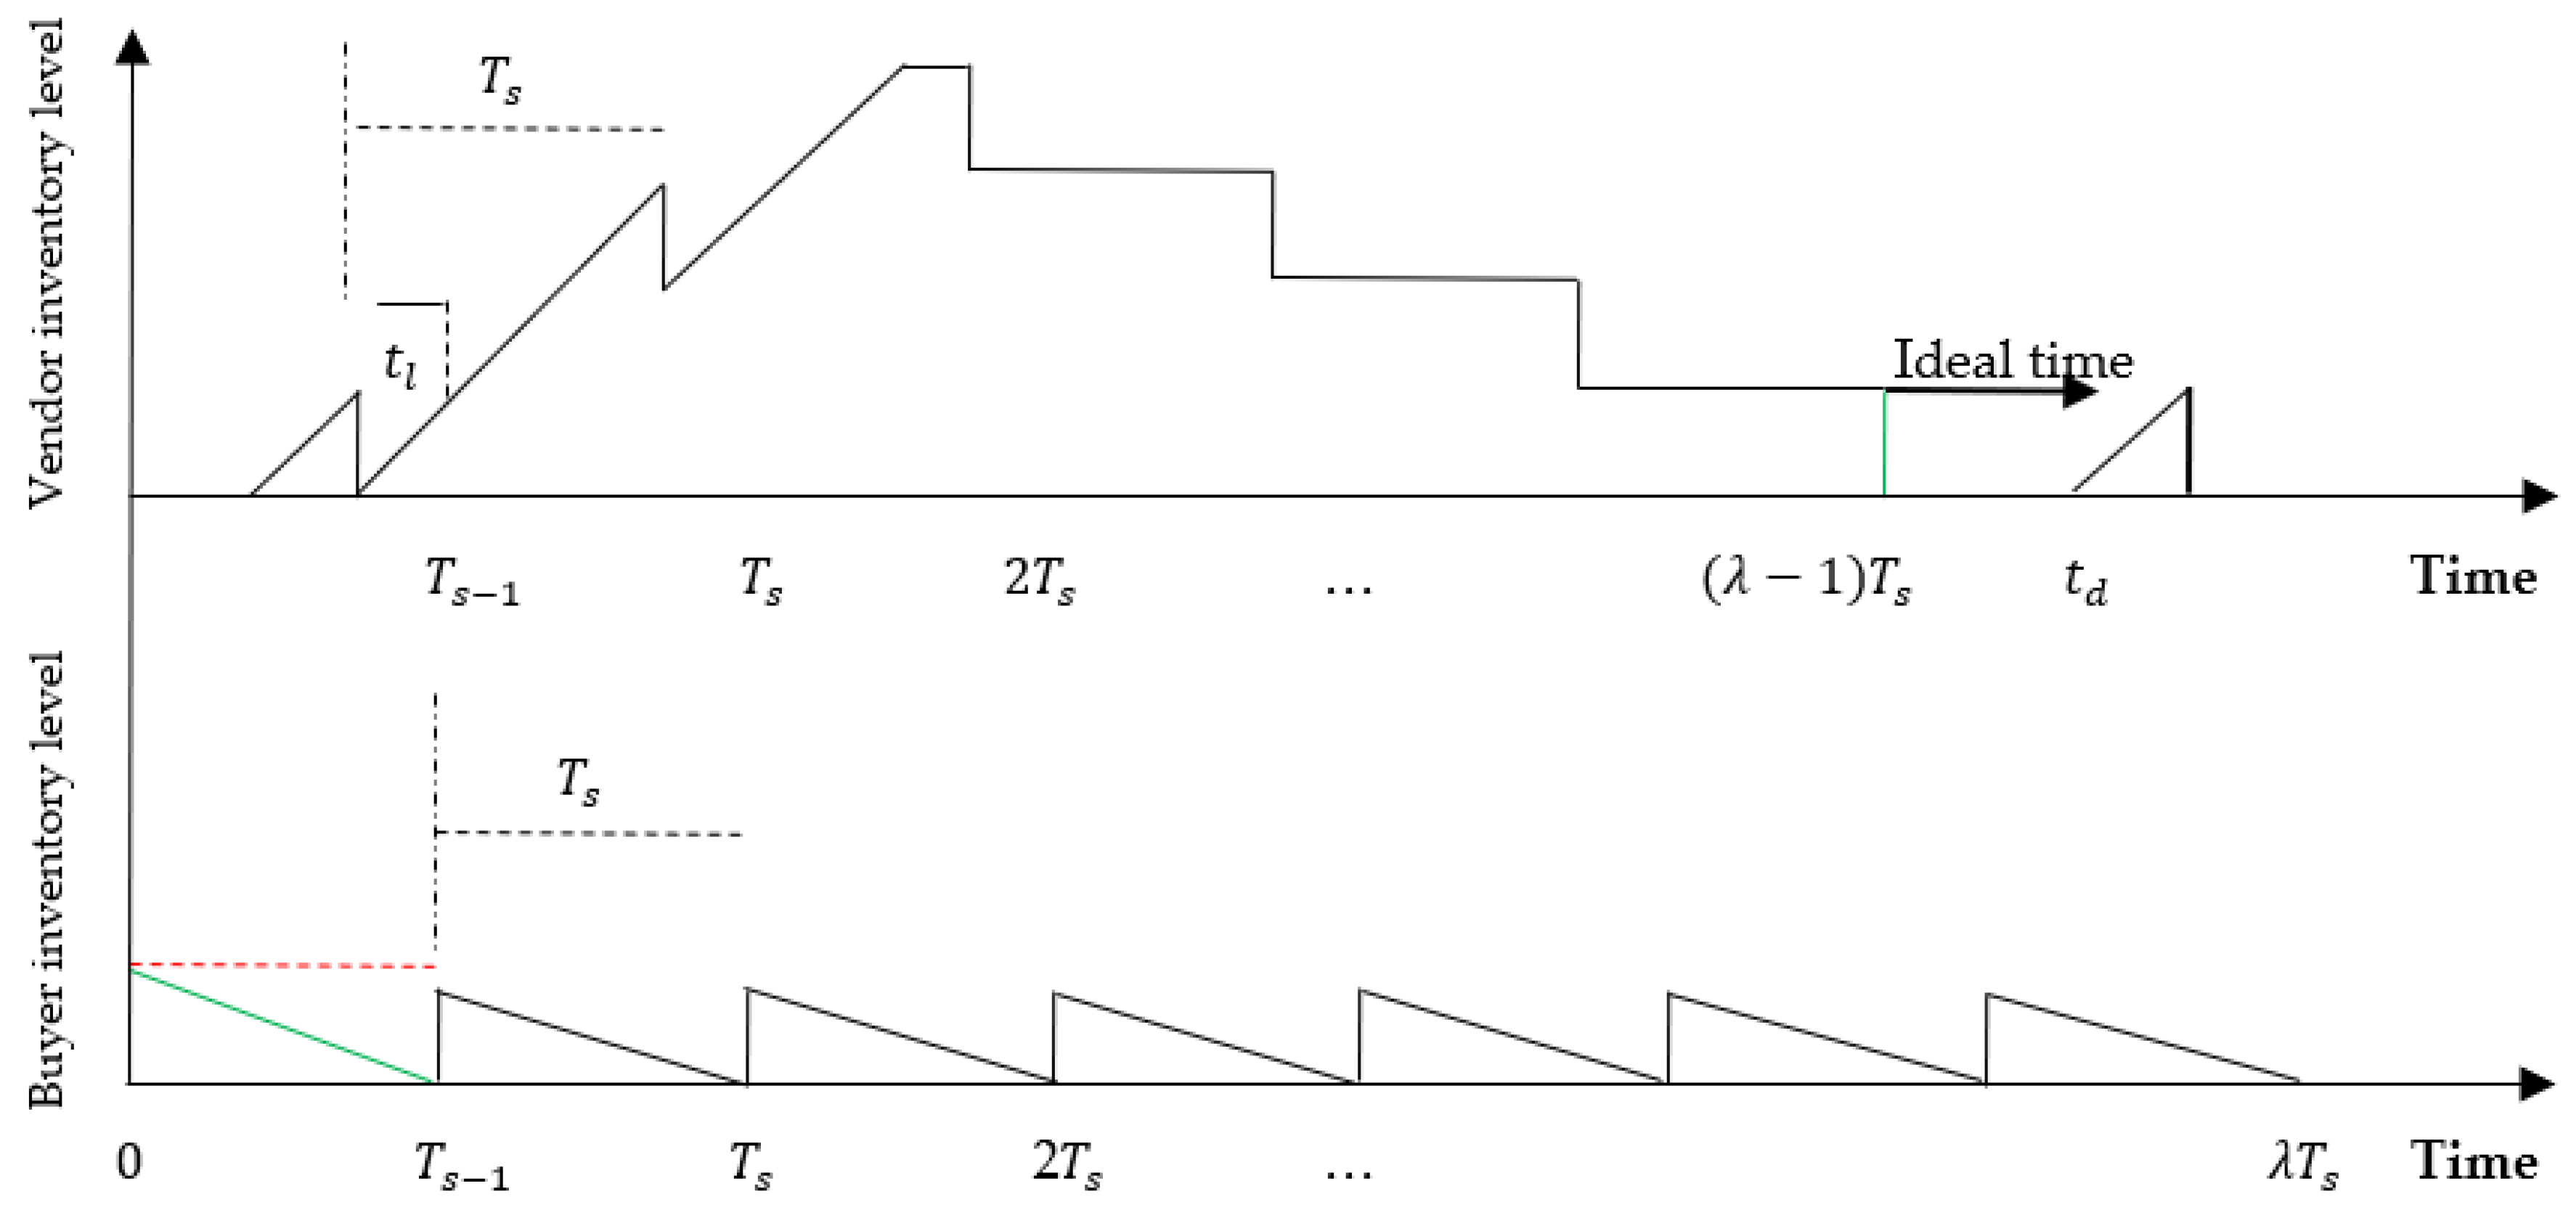
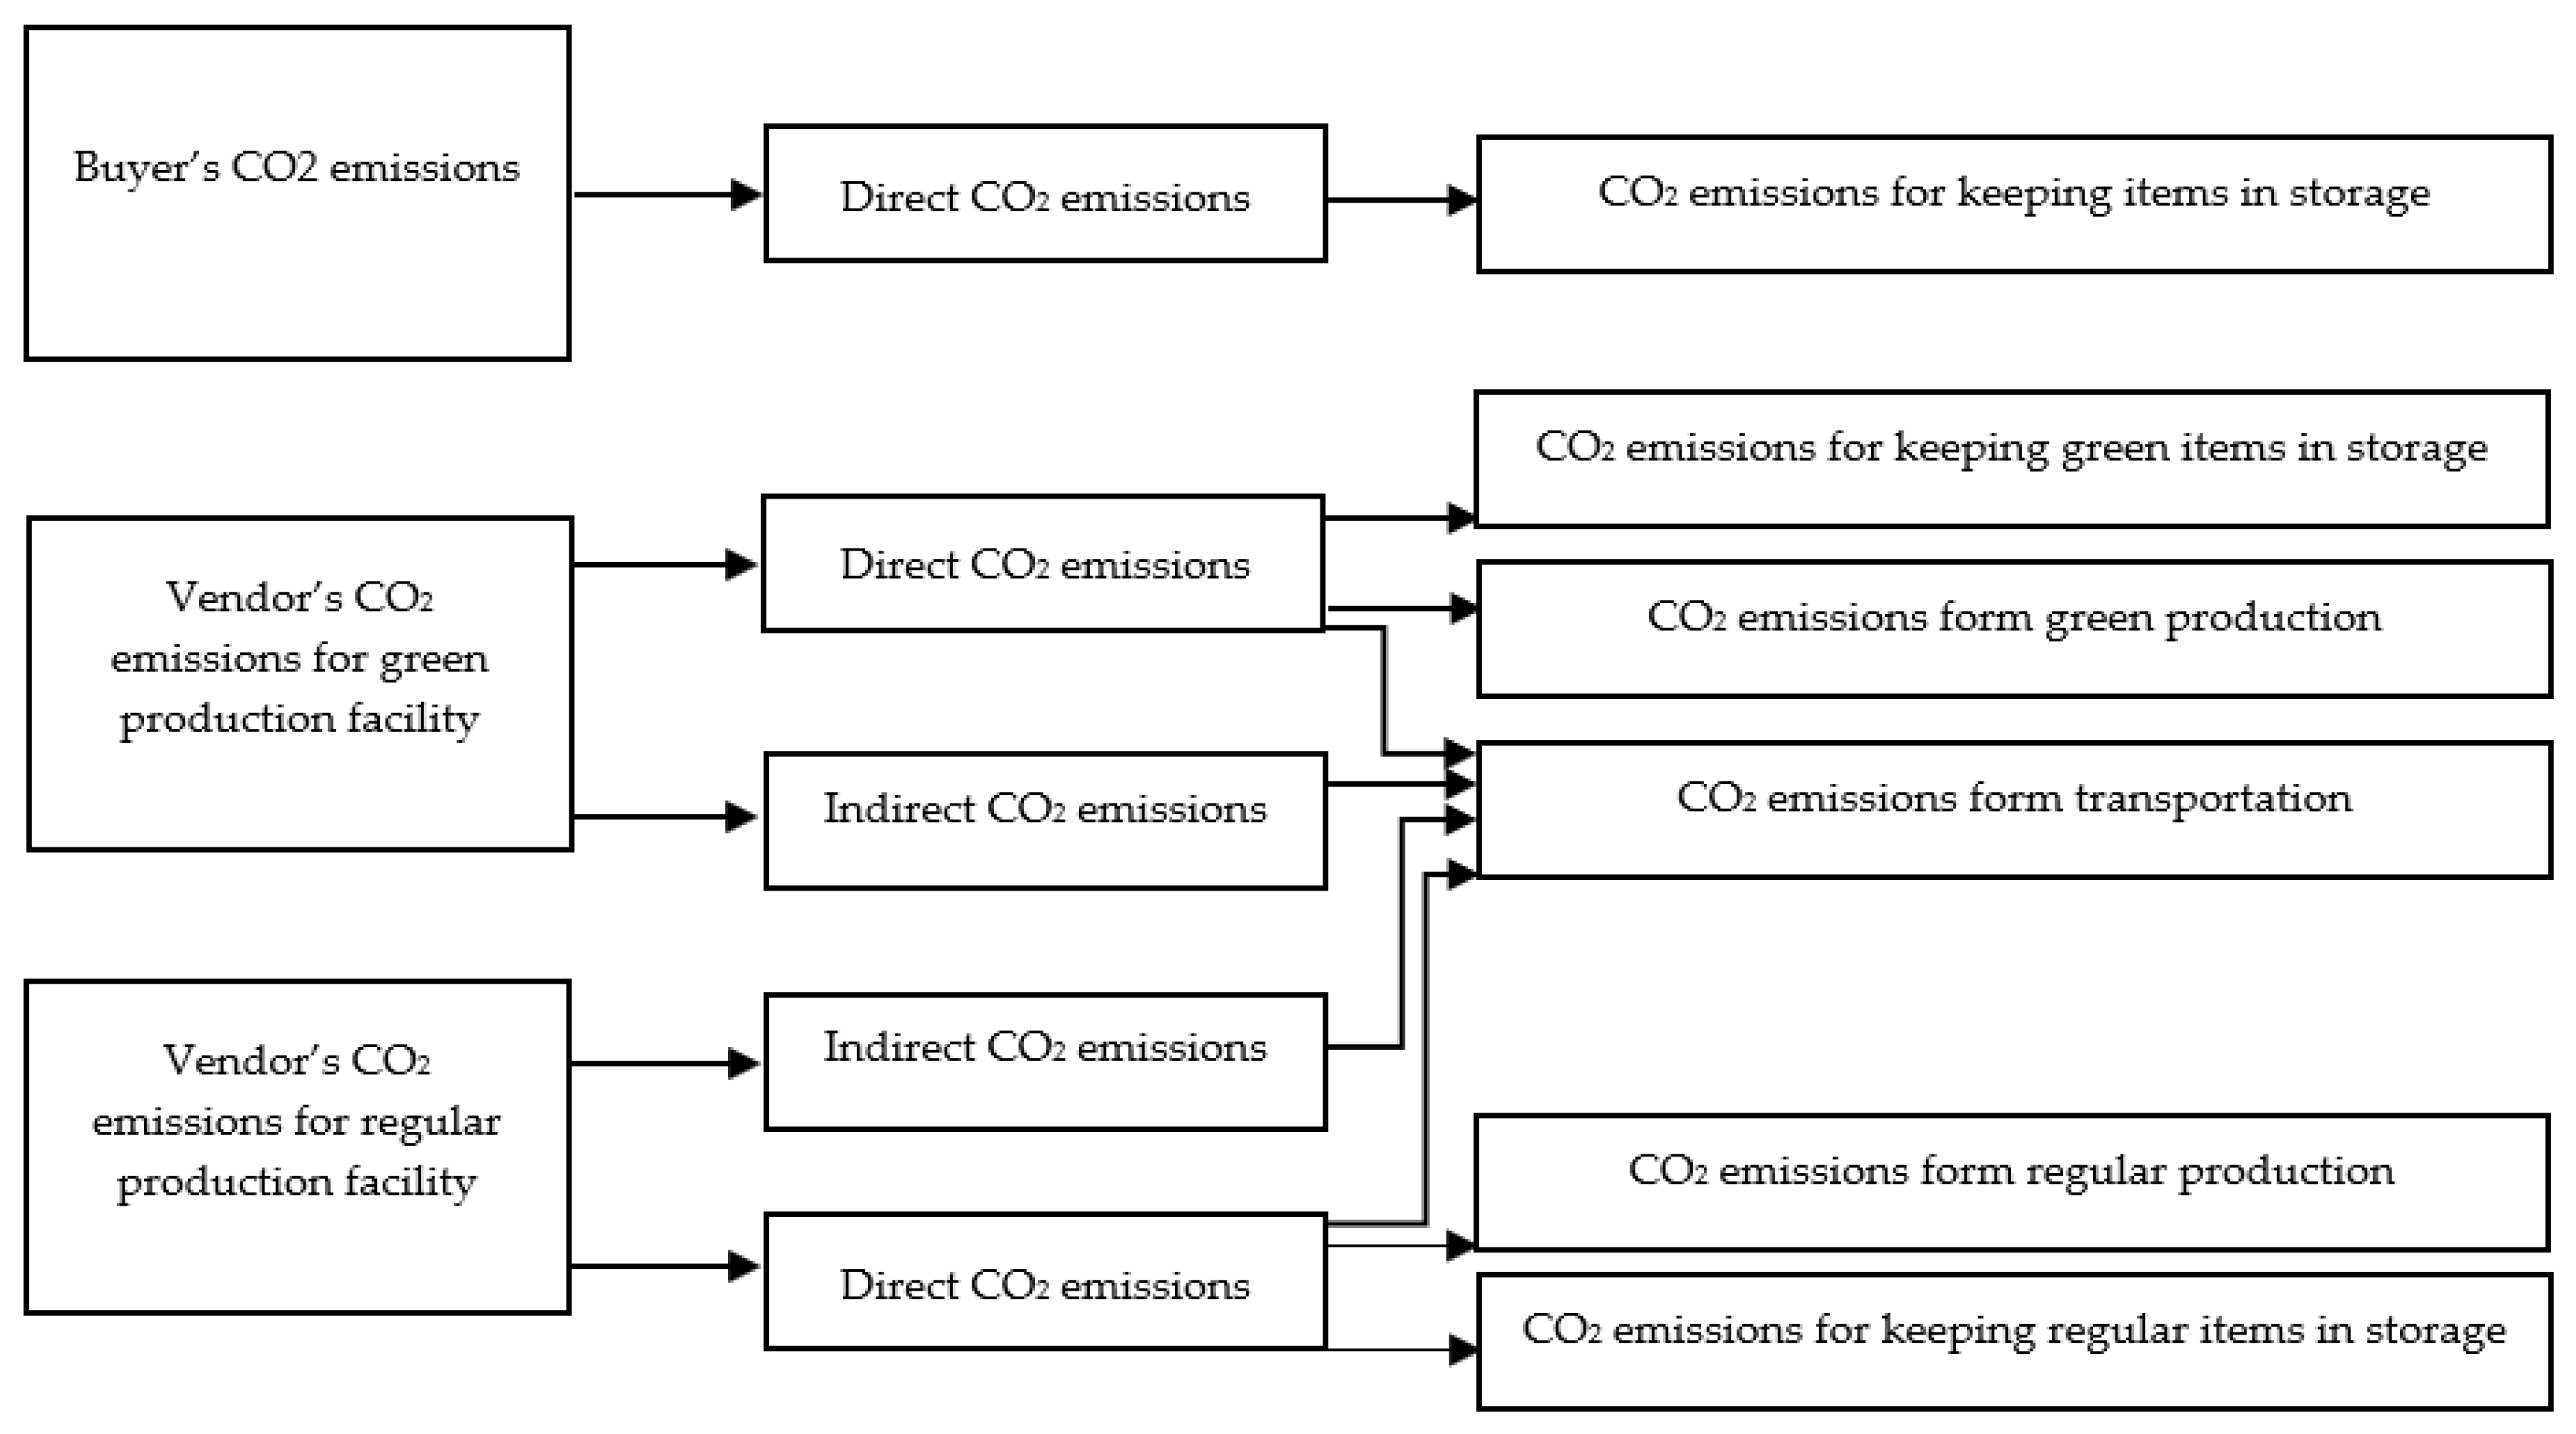
Figure 3 represents the
direct and indirect CO2 emissions generated by the buyer and the
vendor activities. The buyer experiences direct CO2 emissions, which
are related to amount of GHG emissions generated for keeping items in storage.
Whereas the vendor experiences both direct and indirect CO2 emissions.
The direct CO2 emissions occur due to production and storge
activities for both green and regular produced items. The vender is responsible
for transportation activity, which is associated with direct and indirect CO2
emissions. The direct CO2 emissions related to transportation
involves product’s weight. Whereas the indirect CO2 emissions
related to transportation includes shipments frequency, distance travelled from
freight to vendor, distance travelled from vendor to buyer, and fuel
consumption.
Figure 3.
Classification of CO2 emissions of the joint hybrid model for the vendor and the buyer.
4.3.1. The Mathematical Formulation of the First Cycle
The
per unit time holding cost function (see
Appendix
A) for
the base model depicted by
Figure 1 (first cycle) is
given by:
Below we introduce the relevant elements related to
the inventory model with environmental effect:
In addition to the holding cost that is applied for
the buyer’s base model represented by the first three terms of Equation (1),
the buyer incurs an ordering cost per lot size. The buyer also encounters a
cost related to the emissions generated during inventory storage of items
because of warehousing activities, which depends on the buyer’s inventory level
[27,39,58,63]. Considering the above and
Equation (1), the per unit time total cost function for the buyer in the first
cycle is given by:
The CO2 emissions generated by the buyer
is given by:
Similarly, in addition to the holding cost that is
applied for the vendor’s base model, the vendor incurs a set-up cost as well as
the following transportation and carbon emissions costs:
As that of the buyer, the vendor also incurs a cost
related to the emissions generated during inventory storages, which depend on
the vendor’s inventory levels of green and regular produced items.
Transportation is associated with direct and
indirect carbon emissions. The direct emission level underlies the wight of the
product transferred to the buyer. The indirect emission level underlies the
shipments frequency, distance travelled from freight to vendor, distance
travelled from vendor to buyer, and fuel consumption [58].
Transportation is also associated with a cost for delivering each lot size to
the buyer. In this regard, the vendor may deliver each lot size using a
combination of LTL and TL services. Hence, let
represents the quantity with identical transportation
cost by either service. In addition, let denotes the portion of truck capacity that needs
to be delivered using either TL or LTL. If , then it is more cost effective for the vendor to
use a combination of LTL and TL services, i.e., . Alternatively, if then it is more beneficial for the vendor to use TL
service, i.e., trucks. Accordingly, we set if the TL service is utilized and if a mixed policy of LTL and TL services is
implemented. Therefore, the physical and emissions transportation costs per
unit time for the vendor are given by:
The vendor has two production options, i.e., green,
and regular production, where each generates distinct emission level. In this
case, is produced by the green production method with a
production rate and the rest, i.e., is produced by the regular production method with
a production rate . This implies that the first lot size , is delivered to the buyer once both quantities
accumulate the sum of units, i.e., at time . Accordingly, the mathematical modeling of the
duration time for holding inventories in storage for both methods is identical
with that of the base model except that each method is associated with its distinct
input parameters.
The production costs associated with the green
production are higher than those of the regular one. This can be attribute to
the fact that the green production is equipped with machine tools that are
based on green technology, and consequently, . Here, we assume that decreases (increases) as production rate increases
(decreases). For example, the more items that are accomplished by the worker,
the lower the wage per unit time is paid by the company. Similarly, as the
production rate increases, tools and rework cost increase due to the increase
off defective items resulting from tool wear [64].
Therefore, the production costs per unit time are, respectively, given by:
Carbon emission released from production is
represented by a function that links the production rate with the rate of emission
[36,38]. However, the vendor invests in the green
production facility aiming to reduce CO2 emissions. Therefore, the
vendor reaps the benefit of such investment that renders produced items greener,
and consequently, the vendor reduces the cost incurred for emissions. The emissions
costs for green and regular productions per unit time are, respectively, given
by:
According to Fandel [65]
and Narita [66], machines constructed for
green production generate a lower level of emission due to the use of green
technology, and consequently, . Thus, the CO2 emissions generated by
the green and regular facilities are, respectively, given by:
Note that the emissions related to transportation
applies only once, therefore it is included either for or .
In addition, the joint system either earns revenue
from selling excess quota or incurs a penalty cost for exceeding the allowable
limits [36,38]. The penalty cost is given by:
where
, if and , otherwise, where .
The cap-and-trade regulations is given by:
where
, if and , otherwise.
Now, considering the above and Equation (1), the
total cost functions per unit time for the vendor in the first cycle for green
and regular productions are, respectively, given by:
Note that the physical and emissions transportation
costs, cap-and-trade revenue, and penalty cost apply only once, therefore they
are included either for or . Therefore, the per unit time total joint cost
function in the first cycle considering Equations (2), (13) and (14) is given
by:
For simplicity, let . Thus, Equation (15) can be rewritten as:
4.3.2. The Mathematical Formulation of the Subsequent Cycles
The per unit time holding cost function (see Appendix A) for the base model depicted by Figure 2 (subsequent cycles) is given by:
Therefore, by a similar above-discussed approach
for the first cycle, the per unit time total joint cost function for subsequent
cycles is given by:
From Equation (18) we note that the CO2
emissions generated by the buyer in subsequent cycles is:
From Equation (18), the CO2 emissions
generated by the green and regular facilities in subsequent cycles are,
respectively, given by:
Our goal is to minimize given by Equations (16) and (18) subject to
integer values of .
Therefore, the goal is to solve the following
optimization problem.
From Equations (A.51) and (A.52) (see Appendix B), and are, respectively, given by Equations (23) and (24)
below:
As can be seen, Equations (23) and (24) still
depend on and , therefore, no closed form formulation have been
found for and . Thus, their optimal values can be obtained using
numerical search from which Equations (23) and (24) are minimized subject to and . Then, from Equations A.49 (A.50) (see Appendix B) we can find , if , then we set in Equations 16 (18). Otherwise, i.e., , then we set in Equations 16 (18). Note that represents the integer value of plus the fraction .
5. Numerical Examples
In this section, we present examples and special
cases to illustrate the application of the proposed model in different sittings.
The problems have been coded in MATLAB for the set of
input parameters that are listed in Tables 3 and
4 below. Table 3 shows the input
parameters illustrating the application of the proposed model, whereas Table 4 represents the emissions penalties
schedule for exceeding allowable limits.
Table 3.
Input parameters for Example 1.
| 2500 | 2000 | 0.0008 | 0.0004 | 1.6 | 2 |
| USD/month | USD/month | USD month /unit2 | USD month /unit2 | USD/ton CO2 | USD/ton CO2 |
| 0.0026 | 0.064 | 0.32 | 0.01 | 2 | 0.75 |
| ton CO2/liter | liters/km/ton | liters/km | ton/unit | USD/ton CO2 | USD/liter |
| 80 | 300 | 400 | 5 | 4 | 3 |
| km | km | ton CO2/month | USD/unit/month | USD/unit/month | USD/unit/month |
| 0.08 | 2 | 2 | 1000 | 4000 | 1200 |
| month | USD/ton CO2 | USD/ton CO2 | units/month | units/month | units/month |
| 1200 | 800 | 400 | 500 | 300 | 2 |
| USD/set-up | USD/set-up | USD/order | USD/truck | units/truck | USD/unit |
| 0.0000003 | 0.0012 | 1.4 | 0.0000005 | 0.0008 | 1.5 |
| ton CO2 month 2/unit3 | ton CO2 month /unit2 | ton CO2/unit | ton CO2 month 2/unit3 | ton CO2 month /unit2 | ton CO2/unit |
| 1.44 | 1 | 1.44 | 0.0005 | ||
| kWh/unit/month | kWh/unit/month | kWh/unit/month | ton CO2/kWh | ||
Table 4.
CO2 emissions penalties scheme.
| (ton CO2/unit time) | Penalty scheme | (USD /unit time) | |
|---|---|---|---|
| 1 | 400 | 0 | |
| 2 | 500 | 500 | |
| 3 | 600 | 1000 | |
| 4 | 700 | 1500 | |
| 5 | 800 | 2000 | |
| 6 | 800 | 2500 |
5.1. Example 1
In
this example, we consider the set of values that are presented in
Tables 3 and 4 to observe the behavior of the system.
Table 5
depicts the effect of the hybrid production system on the first and subsequent
cycles and summarizes the optimal values of .
Table 5.
Optimal results for a hybrid production system for example 1.
| First cycle | Mixed strategy | |||||||
|---|---|---|---|---|---|---|---|---|
| 0.686 | 2635.15 | 755.76 | 2 | 2 | 516.74 | 12,163.86 | ||
| Subsequent cycles | ||||||||
| 0.647 | 3427.72 | 1053.79 | 1 | 3 | 586.39 | 13,197.82 |
In the first cycle, the optimal production quantity of green and regular items is , which satisfies demand and shortages that have been accumulated in the first period, with . The optimal production rate is , with (68.6%) that comes from green production facility and the remaining fraction is produced in the regular production facility. Note that the demand is satisfied from a collection of green and regular produced items. From Equation (A.49), , where This is so, since . Therefore, indicates the fraction of truck capacity that needs to be transported by LTL service. In this case, . That is, we set and in Equation (16). The total cost per month is , with GHG emissions being generated due to production, storage, and transportation activities equals to . The vast majority (71.82%) of the emissions is related to regular production activities () even though less than 32% of the production quantity has been produced in the regular facility. Note that this amount does not include emissions related to transportation activity (recall Equation (10)). The amount of GHG emissions related to green production is , with being released due to transportation activity. Whereas the emissions related to storage activity of green and regular produced items at both warehouses are negligible, i.e., and , respectively. The emissions related to keeping items at the buyer’s warehouse is . Note that , i.e., .
In subsequent cycles, the optimal production quantity of green and regular items is 1053.79 , which satisfies demand in the first period, with and . That is, 64.7% of the demand is satisfied from green production and the remaining quantity is fulfilled from regular production with a production rate equals to . From Equation (A.50), we have . Thus, , which represents the fraction of truck capacity that needs to be transported by LTL service. Therefore, , from which we set and in Equation (18). The total cost per month is , with GHG emissions being generated from production, storage, and transportation activities equals to . The GHG emissions associated with regular production activities is , which represents 76.25% of the total emissions released into the environment. As that of the first cycle, this amount does not comprise emissions related to transportation activity (recall Equation (21)). The amount of GHG emissions related to green production is , with being generated from transportation activity. The amount of GHG emissions associated with keeping items in storage at both warehouses are and 0.066 , for green and regular produced items, respectively. Whereas the emissions related to keeping items at the buyer’s warehouse is . The system incurs penalties costs for exceeding the emissions allowance limit (), which occurs in both the first and subsequent cycles. That is, (recall Table 4).
Note that , i.e., the second cycle behaves differently and, therefore, it is independent form the first cycle. That is, the proposed model ensures that holds for subsequent cycles, which implies that the input parameters can be adjusted in any cycle. However, if the input parameters remain identical for the subsequent cycle (e.g., the third cycle). This also can be observed in both, the mathematical formulation and Figure 1 and Figure 2. That is, the associated costs of the last lot that has been delivered to the buyer from the previous cycle (the first lot that appears (shaded) for subsequent cycle for illustrative purposes only) are ignored in cycle but are considered in cycle (the same previous cycle) (Alamri [56]). Note also that the constraint does not apply for subsequent cycles. In this case, the constraint is sufficient.
Note that if the emission cap increased from its current allowance limit (), to , then the cap-and-trade regulations is applied, and the system earns revenue by selling excess quota. This revenue is set equal to . Note that in this case, the system also does not incur a cost applies for penalty charge. Therefore, , where the first term refers to the total cost of the first cycle of example 1 and the second term represents the penalty charge, whereas the third term refers to the revenue gained by selling excess quota. The same applies for subsequent cycles if the allowance limit increases from to .
It is worth noting here that the beginning of production time for subsequent cycles is displaced, i.e., the re-start-up production time is . This is key in the mathematical formulation and has two main roles. The first one stems from the fact that this displacement reduces the holding cost. That is, it prevents keeping items at the vendor’s warehouse for extra time that is associated with the consumption of the last lot that has been delivered to the buyer. The second ensures each subsequent cycle is independent from the previous one. Therefore, allowing for the adjustment of the input parameters for any subsequent cycle as a response to the dynamic nature of demand and/or price fluctuation. The latter also guarantees that the model remains viable and keeps generating optimal results for subsequent cycles subjected to the desirable adjustment of the input parameters. Further discussion related to this point is given in the next example.
5.2. Example 2
In this example, we observe the behavior of the system if the demand rate increases in the third cycle from 1000 units to 1200 units. The rest of the input parameters remain as that listed in Table 3 and Table 4. Such adjustment is important since the demand rate or any other input parameters are subject to adjustment due to many realistic situations. Moreover, such adjustment constitutes evidence that the proposed model remains as a viable solution and continues to generate optimal values that reflect the adjustment that might occur for subsequent cycles. Table 6 shows the behavior of the optimal values of when the demand rate increases in the third cycle from 1000 units to 1200 units. Note that the fourth raw of Table 6 represents the optimal values that were already derived for the subsequent cycles in Example 1, which now, is referred to as the second cycle.
Table 6.
Optimal results for example 1 when the demand rate increased to 1200 units in the third cycle.
Table 6.
Optimal results for example 1 when the demand rate increased to 1200 units in the third cycle.
| First cycle | Mixed strategy | |||||||
|---|---|---|---|---|---|---|---|---|
| 0.686 | 2635.15 | 755.76 | 2 | 2 | 516.74 | 12,163.86 | ||
| Second cycle | ||||||||
| 0.647 | 3427.72 | 1053.79 | 1 | 3 | 586.39 | 13,197.82 | ||
| Subsequent cycles | ||||||||
| 0.654 | 3102.41 | 667.01 | 2 | 2 | 663.81 | 16,776.23 |
A comparison between the results in Table 6 reveals that increasing the demand rate decreases both the optimal production quantity and the production rate. However, increasing the demand rate slightly increases the proportion of green production, i.e., it increased from to . The optimal production quantity is , which is lower than that of the second cycle. The total cost per month is , which can be attributed to the fact that, (Table 2). That is, the system encounters an additional penalty charge of . The system also experiences an extra cost associated with the increase in the amount of emissions generated by the system compared with that of the second cycle. It is worth noting here that the production rate decreased from to even though the emissions increased from to . This result is consistent with the finding in Alamri [56], i.e., the amount of GHG emissions generated by the system increases (decreases) as the demand rate increases (decreases). That is, fixing the production rate and increasing (decreasing) the demand rate increases (decreases) the amount of GHG emissions generated by the system. Note that the production rate that minimizes the emission production function is that of and . Given the input parameters of Table 3, then . Therefore, any deviation from , i.e., increasing (decreasing) increases the emissions generated by each production function. Note that from Table 6, we have . On the other hand, Equations (16) and (18) indicate that the demand rate is linked with each production function. In this case, increasing (decreasing) the demand rate increases (decreases) the emissions generated by the system, which is reflected in this example (Example 2). Therefore, we can deduce that the lower the demand rate the lower the emissions, which implies fewer multiple penalties charge associated with the boundaries of emissions (Table 4).
As can be seen, the proposed model is a viable solution and generates optimal values that reflect the adjustment of the demand rate, i.e., the validity and robustness of our model are ascertained.
5.3. Example 3
In this example, we repeat example 1 to investigate the behavior of the model in different settings for sensitivity analysis purposes subject to the set of values as listed in Table 3 and Table 4. Namely, the direct input parameters that affect the behavior of the model are considered and the results are summarized in Table 7 below.
Table 7.
Sensitivity analysis for optimal results for a hybrid production system in different settings.
Table 7.
Sensitivity analysis for optimal results for a hybrid production system in different settings.
| Parameter | First cycle | Mixed strategy | |||||||
|---|---|---|---|---|---|---|---|---|---|
| 0.697 | 2644.95 | 789.51 | 2 | 2 | 503.01 | 12,037.37 | |||
| Subsequent cycles | |||||||||
| 0.666 | 3083.21 | 636.70 | 2 | 2 | 537.83 | 13,000.38 | |||
| First cycle | Mixed strategy | ||||||||
| 0.648 | 3221.85 | 1189.00 | 1 | 4 | 566.89 | 12,213.34 | |||
| Subsequent cycles | |||||||||
| 0.648 | 3403.90 | 961.65 | 1 | 3 | 582.27 | 12,773.99 | |||
| First cycle | Mixed strategy | ||||||||
| 0.655 | 3166.62 | 1235.95 | 1 | 4 | 499.75 | 9,862.99 | |||
| Subsequent cycles | |||||||||
| 0.647 | 3423.41 | 1015.44 | 1 | 3 | 526.92 | 12,323.63 | |||
| First cycle | Mixed strategy | ||||||||
| 0.701 | 2476.57 | 767.30 | 2 | 2 | 508.67 | 11,968.41 | |||
| Subsequent cycles | |||||||||
| 0.649 | 3367.31 | 1050.79 | 1 | 3 | 577.90 | 13,050.79 |
Table 7 shows that the model behaves as expected in all cases. For instance, when the vendor allocates equal holding costs for the green and regular produced items, i.e., , then the model generates grater quantity in the first cycle than that of example 1, which is associated with lower total minimum cost. For subsequent cycles, both the total minimum cost per month and the optimal production quantity are lower than those of example 1. The total amount of GHG emissions generated by the system in both the first and subsequent cycles are lower than those of example 1. The production rate is higher (lower) in the first cycle (subsequent cycles) than that of example 1. The allocation fraction of green production in both the first and subsequent cycles is higher than that of example 1. For equal set-up costs, i.e., , the per unit time total minimum cost, total amount of GHG emissions, production rate, and the optimal production quantity in the first cycle (subsequent cycles) are higher (lower) than those of example 1. The allocation fraction of green production in the first cycle is lower than that of example 1 and slightly increases in subsequent cycles.
Decreasing the demand rate from 1000 units to 900 units decreases the total minimum cost per month and total amount of GHG emissions in the first and subsequent cycles. The optimal production quantity and the production rate increase (decrease) in the first cycle (subsequent cycles) compared with those of example 1. The allocation fraction of green production decreases in the first cycle and remains identical in subsequent cycles when compared with that of example 1. Finally, when the per unit time costs to run the machine independent of production rate are equal, i.e., , the model behaves differently. In particular, the per unit time total minimum cost, total amount of GHG emissions, and production rate in the first and subsequent cycles are lower than those of example 1. Whereas the allocation fraction of green production in the first and subsequent cycles is higher than that of example 1. The optimal production quantity in the first cycle (subsequent cycles) is higher (lower) than that of example 1.
As can be seen from the results obtained in Table 5, Table 6 and Table 7, the total amount of emissions generated by the system increases (decreases) with demand rate. Figure 4, Figure 5, Figure 6, Figure 7 and Figure 8 depict and compare the behavior of the model on the optimal production quantity, the amount of CO2 emissions released by the system, the per unit time total cost, production rate, and the allocation fraction of green production for the joint system in different settings.
5.4. Example 4
In this example, we investigate the behavior of the model for regular production option to observe the advantageous associated with the hybrid production scenario and how much saving the system may gain if a hybrid production option is considered. In this case we set in Equations (16) and (18) where the rest of the input parameters remain as that listed in Table 3 and Table 4. Table 8 depicts the behavior of the model for regular production option.
Table 8.
Optimal results for regular production scenario for example 1 when
| First cycle | Mixed strategy | Saving due to hybrid production | ||||||
|---|---|---|---|---|---|---|---|---|
| 2000.00 | 652.06 | 2 | 2 | 1900.08 | 19,745.98 | 38.40% | ||
| Subsequent cycles | ||||||||
| 1200.00 | 385.46 | 4 | 1 | 1261.00 | 19,765.70 | 33.23% |
A comparison between Table 5 and Table 8 indicates that adopting a hybrid production mode decreases the GHG emissions dramatically, which in turn reduces the per unit time total cost by 38.40% (33.23%) in the first cycle (subsequent cycles). From Table 8 we can see that the production rate and the optimal production quantity are less than those of hybrid production (Table 5). The total cost per month is in the first cycle and in the subsequent cycles, which can be attributed to the fact that, (Table 4). That is, the system encounters an additional penalty charge of in all cycles due to the dramatic increase of GHG emissions generated by the regular production. The GHG emissions related to storage and transportation activities are negligible, i.e., and 0.81 in the first cycle and subsequent cycles, respectively. Figure 9 and Figure 10 show and compare the behavior of the model on the optimal production quantity, the amount of CO2 emissions released by the system, the per unit time total cost, and production rate, with respect to hybrid and regular production options.
5.5. Example 5
In this example, we compare our model for the regular production scenario with the existing literature. In particular, the models of Jaber et al. [36] and Bazan et al. [38] since they have been extensively adopted by many researchers in the field. Therefore, only the input parameters that were considered by [36,38] have been addressed for comparison purposes and the rest of the values have been omitted from our regular model. The input parameters as that of example 3 (page 76) in Jaber et al. [36] are: . Table 9 represents CO2 emissions penalties scheme similar to that suggested by Jaber et al. [36].
Table 9.
CO2 emissions penalties scheme for comparison example.
| (ton CO2/unit time) | Penalty scheme | (USD /unit time) | |
|---|---|---|---|
| 1 | 220 | 0 | |
| 2 | 330 | 1000 | |
| 3 | 440 | 2000 | |
| 4 | 550 | 3000 | |
| 5 | 600 | 4000 | |
| 6 | 600 | 5000 |
The per unit time total cost functions that are presented for comparison purposes are, respectively, given by:
Equation (25) represents the model of the regular production in the first cycle, which is a modified version of Equation (23). Note that the lead time, i.e., as this time is not considered by Jaber et al. [36] and Bazan et al. [38]. Similarly, Equation (26) represents the model of the regular production in the subsequent cycles, which is a modified version of Equation (24). Equation (27) represents the models of Jaber et al. [36] and Bazan et al. [38]. It is clear to deduce that only the first term of Equations (25), (26), and (27) affects the optimal production quantity. In addition, the first term of Equations (25) and (26), is identical with that of Alamri [56], from which we conclude that the work of Alamri [56] constitutes a special case of our proposed model.
Now, by implementing the values determined above in Equations (25), (26), and (27), we obtain the following results:
The per unit time total minimum cost generated by Equation (27) is with a production rate equals to when . The amount of GHG emissions generated is . Therefore, no penalty charge is imposed though the emissions tax is . These results are identical with that of Jaber et al. [36] and Bazan et al. [38]. The per unit time total minimum cost generated by Equation (25) is with an optimal production rate quals to when . The amount of GHG emissions generated by our regular production model is . Similarly, no penalty charge is imposed though the emissions tax is . Note that the production rate that minimizes the emissions production function is that of (recall example 2). The optimal production quantity is , from which . For subsequent cycles, the minimum total cost generated by Equation (26) is with an optimal production rate quals to when and . The amount of GHG emissions is identical with that of the first cycle, i.e., with no penalty charge is imposed and the system incurs an emissions tax of . As that of the first cycle, the production rate that minimizes the emissions production function is that of .
As illustrated above, our model generates an optimal production quantity with a dramatic cost reduction. That is, in the first cycle the cost generated by our model is less than that of Jaber et al. [36] and Bazan et al. [38] by . For subsequent cycles, Equation (26) generates an optimal production quantity with a cost less than that of Jaber et al. [36] and Bazan et al. [38] by . This, indeed, constitutes a considerable saving and may interest both practitioners and researchers. Therefore, our model achieves three main features: (1) The proposed model generates optimal results associated with lower minimum total system cost; (2) The initial on-hand inventory at the buyer’s warehouse is zero in the first cycle, which reflects real-life settings and implies that the subsequent cycle is independent from the first one. Moreover, each subsequent cycle can be associated with its distinct input parameters to ensure that it is independent from the previous one (see also Example 2). This is key in the mathematical formulation, which implies that the input parameters can be adjusted for subsequent cycles; (3) The optimal production rate generated by our model is the one that minimizes the emissions production function. That is, the model generates the lowest emissions possible when compared with the existing literature.
6. Summary of implications and managerial insights
- Unlike the classical JELS inventory model that generates an equal production quantity in all cycles, the proposed model distinguishes the first cycle from subsequent cycles.
- Two mathematical models that reflect the behavior of the first and subsequent cycles are developed. The first model derives distinct optimal solution for the first cycle, while the other generates distinct optimal solution for subsequent cycles.
- The initial on-hand inventory of the buyer is zero in the first-time interval since no items have been produced yet.
- Each subsequent cycle can be associated with its distinct input parameters to ensure that it is independent from the previous one.
- The proposed model allowing for the adjustment of the input parameters for any subsequent cycle.
- The model remains viable and keeps generating optimal results for subsequent cycles subjected to the desirable adjustment of the input parameters as a response to the dynamic nature of demand rate and/or price fluctuation. Such adjustment may also reflect situations such as implementing of a new policy due to acquiring new knowledge, periodic review applications, or machine maintenance scheduling activities that may force decision-maker to consider a suitable adjustment of the input parameters.
- The developed model considers a hybrid production system that simultaneously focuses on green and regular production methods with optimal allocation fraction of green and regular productions.
- The proposed model enables decision-maker to utilize a mixed transportation policy that combines LT and LTL services, which reduces transportation cost.
- The demand is satisfied from a collection of green and regular produced items.
- The proposed model enables decision-maker to trade-off between the production cost and emissions.
- For subsequent cycles, production process starts at the time needed to produce and deliver the first lot size. Therefore, prevents keeping items at the vendor’s warehouse for extra time that is associated with the consumption of the last lot that has been delivered to the buyer, which implies further cost reduction.
- Emissions are released from production and storage activities related to green and regular produced items along with transportation activity.
- The carbon emissions are relatively associated with carbon taxes and penalties for exceeding the allowable emissions limits. However, the system earns revenue by selling excess quota in the case that the total emissions generated by the system is less than that of the emission cap, which reflects the cap-and-trade policy.
- The base closed-form formula of the proposed model produces optimal results with considerable total system cost reduction, i.e., 33.59% (16.13%) in the first cycle (subsequent cycles) when compared with existing literature.
- The optimal production rate generated by the proposed model is the one that minimizes the emissions production function. That is, it generates the lowest emissions possible when compared with the existing literature.
- Adopting a hybrid production method decreases the GHG emissions dramatically, which in turn reduces the per unit time total cost by 38.40% (33.23%) in the first cycle (subsequent cycles) when compared with regular production.
- The results indicate that the total amount of emissions generated by the system increases (decreases) with demand rate.
7. Conclusion and Further Research
This study developed a VMI model for a JELS policy under a multi-level emission-taxing scheme. Two mathematical formulations that reflect the behavior of the first and subsequent cycles are developed. This implies that each model generates distinct optimal solution associated with distinct fixed multiplier in all cycles to ensure that each cycle is independent from the previous one. Therefore, the model for subsequent cycles remains viable and keeps generating optimal results subjected to the desirable adjustment of the input parameters. Such adjustment is a response to the real-life settings that may reflect situations such as the dynamic nature of demand rate and/or price fluctuation, implementing of a new policy due to acquiring new knowledge, periodic review applications, or machine maintenance scheduling activities that may force decision-maker to consider a suitable adjustment of the input parameters.
This study investigated the effect of carbon emissions together with the implementation of green technology. The developed model considers a hybrid production system that simultaneously focuses on green and regular production methods with optimal allocation fraction of green and regular productions. In this model, emissions are released from production and storage activities related to green and regular produced items along with transportation activity. The carbon emissions are relatively associated with carbon taxes and penalties for exceeding the allowable emissions limits. The model also assumes that the system earns revenue by selling excess quota in the case that the total emissions generated by the system is less than that of the emission cap, which reflects the cap-and-trade policy. Hybrid production implies simultaneous production fractions associated with green and regular productions, where each is associated with its distinct released emissions level. In this case, the demand is satisfied from a collection of green and regular produced items.
This study enables decision-maker to trade-off between the production cost and emissions. For subsequent cycles, production process starts at the time needed to produce and deliver the first lot size, i.e., it prevents keeping items at the vendor’s warehouse for extra time that is associated with the consumption of the last lot that has been delivered to the buyer, which implies further cost reduction. In addition, the system reaps further cost reduction by utilizing a mixed transportation policy that combines LT and LTL services.
Illustrative examples emphasized the significant impact of the first cycle on the optimal results, i.e., the first cycle is associated with distinct optimal values. The viability, validity, and robustness of the proposed model are ascertained, where the optimal values are divergent for the case that the input parameters are adjusted. Sensitivity analysis is evaluated in different realist situations to highlight some important opportunities that may interest decision-makers. The results emphasized the significant impact of the demand rate on the total amount of emissions generated by the system, which increases (decreases) with demand rate. The results also emphasized the significant impact of green production on emissions. That is, the higher the allocation fraction of green production the lower the total amount of emissions generated by the system, i.e., the system becoming more sustainable. One of the main findings is that the total system cost generated by the base closed-form formula of the proposed model is considerably lower than that of the existing literature, i.e., 33.59% (16.13%) lower in the first cycle (subsequent cycles) when the regular production method is assumed. Moreover, the optimal production rate generated by the proposed model is the one that minimizes the emissions production function. That is, it generates the lowest emissions possible when compared with the existing literature. Adopting a hybrid production method not only decreases the GHG emissions dramatically, but also reduces the per unit time total cost by 38.40% (33.23%) in the first cycle (subsequent cycles) when compared with regular production.
Further research may include the formulation of imperfect quality items in the production process where each lot size is subjected to a 100 per cent inspection. Extending the model accounting for general functions of time of demand and deterioration rates is another interesting line of further research. The formulation of a closed-loop supply chain model involving manufacturing, remanufacturing, along with transportation under GHG emissions is also possible. Furthermore, it seems plausible to consider the formulation of single-vendor multi-buyers inventory model along with different emissions trading schemes. Finally, the proposed mathematical formulation can be further adopted to rectify existing VMI models or accounting for further inquiry related to VMI mathematical modeling.
Funding
This research received no external funding.
Conflicts of Interest
The author declares no conflict of interest.
Appendix A
Below we formulate the average inventory functions for the joint model.
First cycle (Figure 1)
Buyer’s average inventory function.
As can be seen from figure 1, the vendor delivers the first lot size, once it has been accumulated from green and regular produced items by time and, will reach the buyer after a transportation time .
Note that shortages are allowed in the first period of the first cycle and fully backordered by time . In this case, the maximum inventory level for the buyer is units, where .
In the first period, the buyer’s average inventory function is given by:
Figure 1 indicates that the buyer’s initial inventory level is zero and the last lot produced by the vendor represents the last lot consumed by the buyer. Therefore, we have
From Equation (A.1) and Figure 1, the average inventory function for the remaining lots is given by:
Therefore, the buyer average inventory function is given by:
From which, the per unit time holding cost function is given by:
Note that Equation (A.2) is identical with that of Alamri [56].
Vendor’s average inventory function.
Therefore, the per unit time holding cost function for green production is given by:
Similarly, the per unit time holding cost function for regular production is given by:
Note that for , Equations (A.4) and (A.5) reduce to that of Alamri [56].
Subsequent cycles (Figure 2)
Buyer’s average inventory function.
As can be seen from Figure 2, the buyer average inventory function is that of the EOQ. Therefore, the per unit time holding cost function is given by:
Vendor’s average inventory function.
Therefore, the per unit time holding cost function for green production is given by:
Similarly, the per unit time holding cost function for regular production is given by:
Note that for , Equations (A.7) and (A.8) reduce to that of Alamri [56].
Appendix B
The goal here is to derive the solution procedure that render achieves the unique and global optimal solution.
Solution Procedure
According to Alamri [56], ignoring the physical transportation cost does not affect the optimal production quantity, therefore, Equations (16) and (18) can be rewritten as:
Any existing solution of is a minimizing solution to if its Hessian matrix is positive definite calculated at any critical point of given by Equation A.11 (A.12) below:
where
Equation , if only the first two terms of Equation (A.14) are considered, then Equation if . Recall that and , then Equation . Note that and , from which Equation .
Similarly, for we have
Equations , if only the first term of Equation () is considered, then Equation if . Recall that and , from which Equation .
Moreover, by Stewart [67], Balkhi and Benkherouf [68], Emet [69], and Alamri [70], the symmetric matrix is positive definite if
Similarly,
Therefore, if conditions A.33-A.36 (A.37-A.40) hold, then they constitute the sufficient conditions under which the Hessian matrix is positive definite.
Thus, any existing solution of for which conditions A.33-A.36 (A.37-A.40) hold is the unique and global optimal solution to .
The necessary conditions for the minimum cost for are:
Similarly, the necessary conditions for the minimum cost for are:
From which we have
Hence, from Equations (A.49) and (A.50), and are, respectively, given by Equations (A.51) and (A.52) below:
The minimum and maximum values for can be found by setting the first partial derivative of Equations (A.51) and (A.52) with respect to equals to zero, where infeasible values of are omitted to get:
where , are respectively, given by:
For the first cycle, and
For the subsequent cycles.
References
- Wang, X.J.; Choi, S.H. Impacts of Carbon Emission Reduction Mechanisms on Uncertain Make-To-Order Manufacturing. Int J Prod Res 2016, 54, 3311–3328, doi:10.1080/00207543.2015.1106606. [CrossRef]
- Benjaafar, S.; Li, Y.; Daskin, M. Carbon Footprint and the Management of Supply Chains: Insights from Simple Models. IEEE transactions on automation science and engineering 2012, 10, 99–116. [CrossRef]
- Pachauri, R.K.; Reisinger, A. Climate Change 2007: Synthesis Report. Contribution of Working Groups I, II and III to the Fourth Assessment Report of the Intergovernmental Panel on Climate Change. Climate Change 2007. Working Groups I, II and III to the Fourth Assessment 2007.
- EPA. Carbon Pollution from Transportation. U.S. Environmental Protection Agency; 2022. Available online: https://www.epa.gov/transportation-air-pollution-and-climate-change/carbon-pollution-transportation#transportation.
- Damert, M.; Feng, Y.; Zhu, Q.; Baumgartner, R.J. Motivating Low-Carbon Initiatives among Suppliers: The Role of Risk and Opportunity Perception. Resour Conserv Recycl 2018, 136, 276–286. [CrossRef]
- Das, C.; Jharkharia, S. Low Carbon Supply Chain: A State-of-the-Art Literature Review. Journal of Manufacturing Technology Management 2018, 29, 398–428. [CrossRef]
- Phouratsamay, S.-L.; Cheng, T.C.E. The Single-Item Lot-Sizing Problem with Two Production Modes, Inventory Bounds, and Periodic Carbon Emissions Capacity. Operations Research Letters 2019, 47, 339–343. [CrossRef]
- Gong, X.; Zhou, S.X. Optimal Production Planning with Emissions Trading. Oper Res 2013, 61, 908–924. [CrossRef]
- Hong, Z.; Chu, C.; Yu, Y. Dual-Mode Production Planning for Manufacturing with Emission Constraints. Eur J Oper Res 2016, 251, 96–106. [CrossRef]
- Utama, D.M.; Santoso, I.; Hendrawan, Y.; Dania, W.A.P. Integrated Procurement-Production Inventory Model in Supply Chain: A Systematic Review. Operations Research Perspectives 2022, 100221. [CrossRef]
- Devy, N.L.; Ai, T.J.; Astanti, R.D. A Joint Replenishment Inventory Model with Lost Sales. In Proceedings of the IOP Conference Series: Materials Science and Engineering; IOP Publishing, 2018; Vol. 337, p. 12018.
- Dong, Y.; Xu, K. A Supply Chain Model of Vendor Managed Inventory. Transp Res E Logist Transp Rev 2002, 38, 75–95. [CrossRef]
- Banerjee, A. A Joint Economic-lot-size Model for Purchaser and Vendor. Decision sciences 1986, 17, 292–311. [CrossRef]
- Schaefer, B.; Konur, D. Economic and Environmental Considerations in a Continuous Review Inventory Control System with Integrated Transportation Decisions. Transp Res E Logist Transp Rev 2015, 80, 142–165. [CrossRef]
- Hovelaque, V.; Bironneau, L. The Carbon-Constrained EOQ Model with Carbon Emission Dependent Demand. Int J Prod Econ 2015, 164, 285–291. [CrossRef]
- Bouchery, Y.; Ghaffari, A.; Jemai, Z.; Dallery, Y. Including Sustainability Criteria into Inventory Models. Eur J Oper Res 2012, 222, 229–240. [CrossRef]
- Gunasekaran, A.; Irani, Z.; Papadopoulos, T. Modelling and Analysis of Sustainable Operations Management: Certain Investigations for Research and Applications. Journal of the Operational Research Society 2014, 65, 806–823. [CrossRef]
- Taleizadeh, A.A.; Soleymanfar, V.R.; Govindan, K. Sustainable Economic Production Quantity Models for Inventory Systems with Shortage. J Clean Prod 2018, 174, 1011–1020. [CrossRef]
- Montabon, F.; Pagell, M.; Wu, Z. Making Sustainability Sustainable. Journal of Supply Chain Management 2016, 52, 11–27. [CrossRef]
- Goyal, S.K. An Integrated Inventory Model for a Single Supplier-Single Customer Problem. The International Journal of Production Research 1977, 15, 107–111. [CrossRef]
- Wahab, M.I.M.; Mamun, S.M.H.; Ongkunaruk, P. EOQ Models for a Coordinated Two-Level International Supply Chain Considering Imperfect Items and Environmental Impact. Int J Prod Econ 2011, 134, 151–158. [CrossRef]
- Hua, G.; Cheng, T.C.E.; Wang, S. Managing Carbon Footprints in Inventory Management. Int J Prod Econ 2011, 132, 178–185. [CrossRef]
- Wangsa, I. Greenhouse Gas Penalty and Incentive Policies for a Joint Economic Lot Size Model with Industrial and Transport Emissions. International Journal of Industrial Engineering Computations 2017, 8, 453–480. [CrossRef]
- Ben-Daya, M.; Hariga, M. Integrated Single Vendor Single Buyer Model with Stochastic Demand and Variable Lead Time. Int J Prod Econ 2004, 92, 75–80. [CrossRef]
- Hariga, M.; As’ ad, R.; Shamayleh, A. Integrated Economic and Environmental Models for a Multi Stage Cold Supply Chain under Carbon Tax Regulation. J Clean Prod 2017, 166, 1357–1371. [CrossRef]
- Gautam, P.; Kishore, A.; Khanna, A.; Jaggi, C.K. Strategic Defect Management for a Sustainable Green Supply Chain. J Clean Prod 2019, 233, 226–241. [CrossRef]
- Halat, K.; Hafezalkotob, A. Modeling Carbon Regulation Policies in Inventory Decisions of a Multi-Stage Green Supply Chain: A Game Theory Approach. Comput Ind Eng 2019, 128, 807–830. [CrossRef]
- Khouja, M.; Mehrez, A. An Economic Production Lot Size Model with Imperfect Quality and Variable Production Rate. Journal of the Operational Research Society 1994, 45, 1405–1417. [CrossRef]
- Eiamkanchanalai, S.; Banerjee, A. Production Lot Sizing with Variable Production Rate and Explicit Idle Capacity Cost. Int J Prod Econ 1999, 59, 251–259. [CrossRef]
- Ghosh, A.; Jha, J.K.; Sarmah, S.P. Optimal Lot-Sizing under Strict Carbon Cap Policy Considering Stochastic Demand. Appl Math Model 2017, 44, 688–704. [CrossRef]
- Saga, R.S.; Jauhari, W.A.; Laksono, P.W.; Dwicahyani, A.R. Investigating Carbon Emissions in a Production-Inventory Model under Imperfect Production, Inspection Errors and Service-Level Constraint. International Journal of Logistics Systems and Management 2019, 34, 29–55. [CrossRef]
- Huang, Y.-S.; Fang, C.-C.; Lin, Y.-A. Inventory Management in Supply Chains with Consideration of Logistics, Green Investment and Different Carbon Emissions Policies. Comput Ind Eng 2020, 139, 106207. [CrossRef]
- Chen, X.; Benjaafar, S.; Elomri, A. The Carbon-Constrained EOQ. Operations Research Letters 2013, 41, 172–179. [CrossRef]
- Ganesh Kumar, M.; Uthayakumar, R. Modelling on Vendor-Managed Inventory Policies with Equal and Unequal Shipments under GHG Emission-Trading Scheme. Int J Prod Res 2019, 57, 3362–3381. [CrossRef]
- Zanoni, S.; Mazzoldi, L.; Jaber, M.Y. Vendor-Managed Inventory with Consignment Stock Agreement for Single Vendor–Single Buyer under the Emission-Trading Scheme. Int J Prod Res 2014, 52, 20–31. [CrossRef]
- Jaber, M.Y.; Glock, C.H.; El Saadany, A.M.A. Supply Chain Coordination with Emissions Reduction Incentives. Int J Prod Res 2013, 51, 69–82. [CrossRef]
- Turken, N.; Geda, A.; Takasi, V.D.G. The Impact of Co-Location in Emissions Regulation Clusters on Traditional and Vendor Managed Supply Chain Inventory Decisions. Ann Oper Res 2021, 1–50. [CrossRef]
- Bazan, E.; Jaber, M.Y.; Zanoni, S. Supply Chain Models with Greenhouse Gases Emissions, Energy Usage and Different Coordination Decisions. Appl Math Model 2015, 39, 5131–5151. [CrossRef]
- Astanti, R.D.; Daryanto, Y.; Dewa, P.K. Low-Carbon Supply Chain Model under a Vendor-Managed Inventory Partnership and Carbon Cap-and-Trade Policy. Journal of Open Innovation: Technology, Market, and Complexity 2022, 8, 30. [CrossRef]
- Malik, A.I.; Kim, B.S. A Constrained Production System Involving Production Flexibility and Carbon Emissions. Mathematics 2020, 8, 275. [CrossRef]
- Jauhari, W.A.; Pujawan, I.N.; Suef, M.; Govindan, K. Low Carbon Inventory Model for Vendor‒buyer System with Hybrid Production and Adjustable Production Rate under Stochastic Demand. Appl Math Model 2022, 108, 840–868. [CrossRef]
- Sarkar, B.; Saren, S. Product Inspection Policy for an Imperfect Production System with Inspection Errors and Warranty Cost. Eur J Oper Res 2016, 248, 263–271. [CrossRef]
- Rad, M.A.; Khoshalhan, F.; Glock, C.H. Optimal Production and Distribution Policies for a Two-Stage Supply Chain with Imperfect Items and Price-and Advertisement-Sensitive Demand: A Note. Appl Math Model 2018, 57, 625–632. [CrossRef]
- Kim, M.-S.; Kim, J.-S.; Sarkar, B.; Sarkar, M.; Iqbal, M.W. An Improved Way to Calculate Imperfect Items during Long-Run Production in an Integrated Inventory Model with Backorders. J Manuf Syst 2018, 47, 153–167. [CrossRef]
- De Giovanni, P.; Karray, S.; Martín-Herrán, G. Vendor Management Inventory with Consignment Contracts and the Benefits of Cooperative Advertising. Eur J Oper Res 2019, 272, 465–480. [CrossRef]
- Phan, D.A.; Vo, T.L.H.; Lai, A.N.; Nguyen, T.L.A. Coordinating Contracts for VMI Systems under Manufacturer-CSR and Retailer-Marketing Efforts. Int J Prod Econ 2019, 211, 98–118. [CrossRef]
- Ben-Daya, M.; As’ ad, R.; Nabi, K.A. A Single-Vendor Multi-Buyer Production Remanufacturing Inventory System under a Centralized Consignment Arrangement. Comput Ind Eng 2019, 135, 10–27. [CrossRef]
- Tarhini, H.; Karam, M.; Jaber, M.Y. An Integrated Single-Vendor Multi-Buyer Production Inventory Model with Transshipments between Buyers. Int J Prod Econ 2020, 225, 107568. [CrossRef]
- Dey, O.; Giri, B.C. A New Approach to Deal with Learning in Inspection in an Integrated Vendor-Buyer Model with Imperfect Production Process. Comput Ind Eng 2019, 131, 515–523. [CrossRef]
- Giri, B.C.; Chakraborty, A.; Maiti, T. Consignment Stock Policy with Unequal Shipments and Process Unreliability for a Two-Level Supply Chain. Int J Prod Res 2017, 55, 2489–2505. [CrossRef]
- Jauhari, W.A.; Sofiana, A.; Kurdhi, N.A.; Laksono, P.W. An Integrated Inventory Model for Supplier-Manufacturer-Retailer System with Imperfect Quality and Inspection Errors. International Journal of Logistics Systems and Management 2016, 24, 383–407. [CrossRef]
- Khan, M.; Hussain, M.; Cárdenas-Barrón, L.E. Learning and Screening Errors in an EPQ Inventory Model for Supply Chains with Stochastic Lead Time Demands. Int J Prod Res 2017, 55, 4816–4832. [CrossRef]
- Pal, S.; Mahapatra, G.S. A Manufacturing-Oriented Supply Chain Model for Imperfect Quality with Inspection Errors, Stochastic Demand under Rework and Shortages. Comput Ind Eng 2017, 106, 299–314. [CrossRef]
- Tiwari, S.; Kazemi, N.; Modak, N.M.; Cárdenas-Barrón, L.E.; Sarkar, S. The Effect of Human Errors on an Integrated Stochastic Supply Chain Model with Setup Cost Reduction and Backorder Price Discount. Int J Prod Econ 2020, 226, 107643. [CrossRef]
- Jaggi, C.K.; Tiwari, S.; Shafi, A.A. Effect of Deterioration on Two-Warehouse Inventory Model with Imperfect Quality. Comput Ind Eng 2015, 88, 378–385. [CrossRef]
- Alamri, A.A. Carbon Emissions Effect on Vendor-Managed Inventory System Considering Displaced Re-Start-Up Production Time. 2023, 7, 67, doi:10.3390/logistics7040067. [CrossRef]
- Konur, D. Carbon Constrained Integrated Inventory Control and Truckload Transportation with Heterogeneous Freight Trucks. Int J Prod Econ 2014, 153, 268–279. [CrossRef]
- Bouchery, Y.; Ghaffari, A.; Jemai, Z.; Tan, T. Impact of Coordination on Costs and Carbon Emissions for a Two-Echelon Serial Economic Order Quantity Problem. Eur J Oper Res 2017, 260, 520–533. [CrossRef]
- Alamri, A.A. A Sustainable Closed-Loop Supply Chains Inventory Model Considering Optimal Number of Remanufacturing Times. Sustainability 2023, 15. [CrossRef]
- Alamri, A.A. Exploring the Effect of the First Cycle on the Economic Production Quantity Repair and Waste Disposal Model. Appl Math Model 2021, 89, 519–540, doi:https://doi.org/10.1016/j.apm.2020.06.073. [CrossRef]
- Lippman, S.A. Economic Order Quantities and Multiple Set-up Costs. Manage Sci 1971, 18, 39–47. [CrossRef]
- Venkatachalam, S.; Narayanan, A. Efficient Formulation and Heuristics for Multi-Item Single Source Ordering Problem with Transportation Cost. Int J Prod Res 2016, 54, 4087–4103. [CrossRef]
- Kazemi, N.; Abdul-Rashid, S.H.; Ghazilla, R.A.R.; Shekarian, E.; Zanoni, S. Economic Order Quantity Models for Items with Imperfect Quality and Emission Considerations. International Journal of Systems Science: Operations & Logistics 2018, 5, 99–115. [CrossRef]
- Khouja, M.; Mehrez, A. Economic Production Lot Size Model with Variable Production Rate and Imperfect Quality. Journal of the Operational Research Society 1994, 45, 1405–1417. [CrossRef]
- Fandel, G. Production and Cost Theory. Berlin: Springer 1991, 10, 973–978.
- Narita, H. Environmental Burden Analyzer for Machine Tool Operations and Its Application. Manufacturing system 2012, 247–260.
- Stewart, G.W. Introduction to Matrix Computations, Acad 1973.
- Balkhi, Z.T.; Benkherouf, L. A Production Lot Size Inventory Model for Deteriorating Items and Arbitrary Production and Demand Rates. Eur J Oper Res 1996, 92, 302–309. [CrossRef]
- Emet, S. An Mixed Integer Approach for Optimizing Production Planning. In Proceedings of the Proceedings of the 13th WSEAS international conference on Applied mathematics; 2008; pp. 361–364.
- Alamri, A.A. Theory and Methodology on the Global Optimal Solution to a General Reverse Logistics Inventory Model for Deteriorating Items and Time-Varying Rates. Comput Ind Eng 2011, 60, doi:10.1016/j.cie.2010.11.005. [CrossRef]
Figure 4.
The behavior of the optimal production quantity in deferent settings.
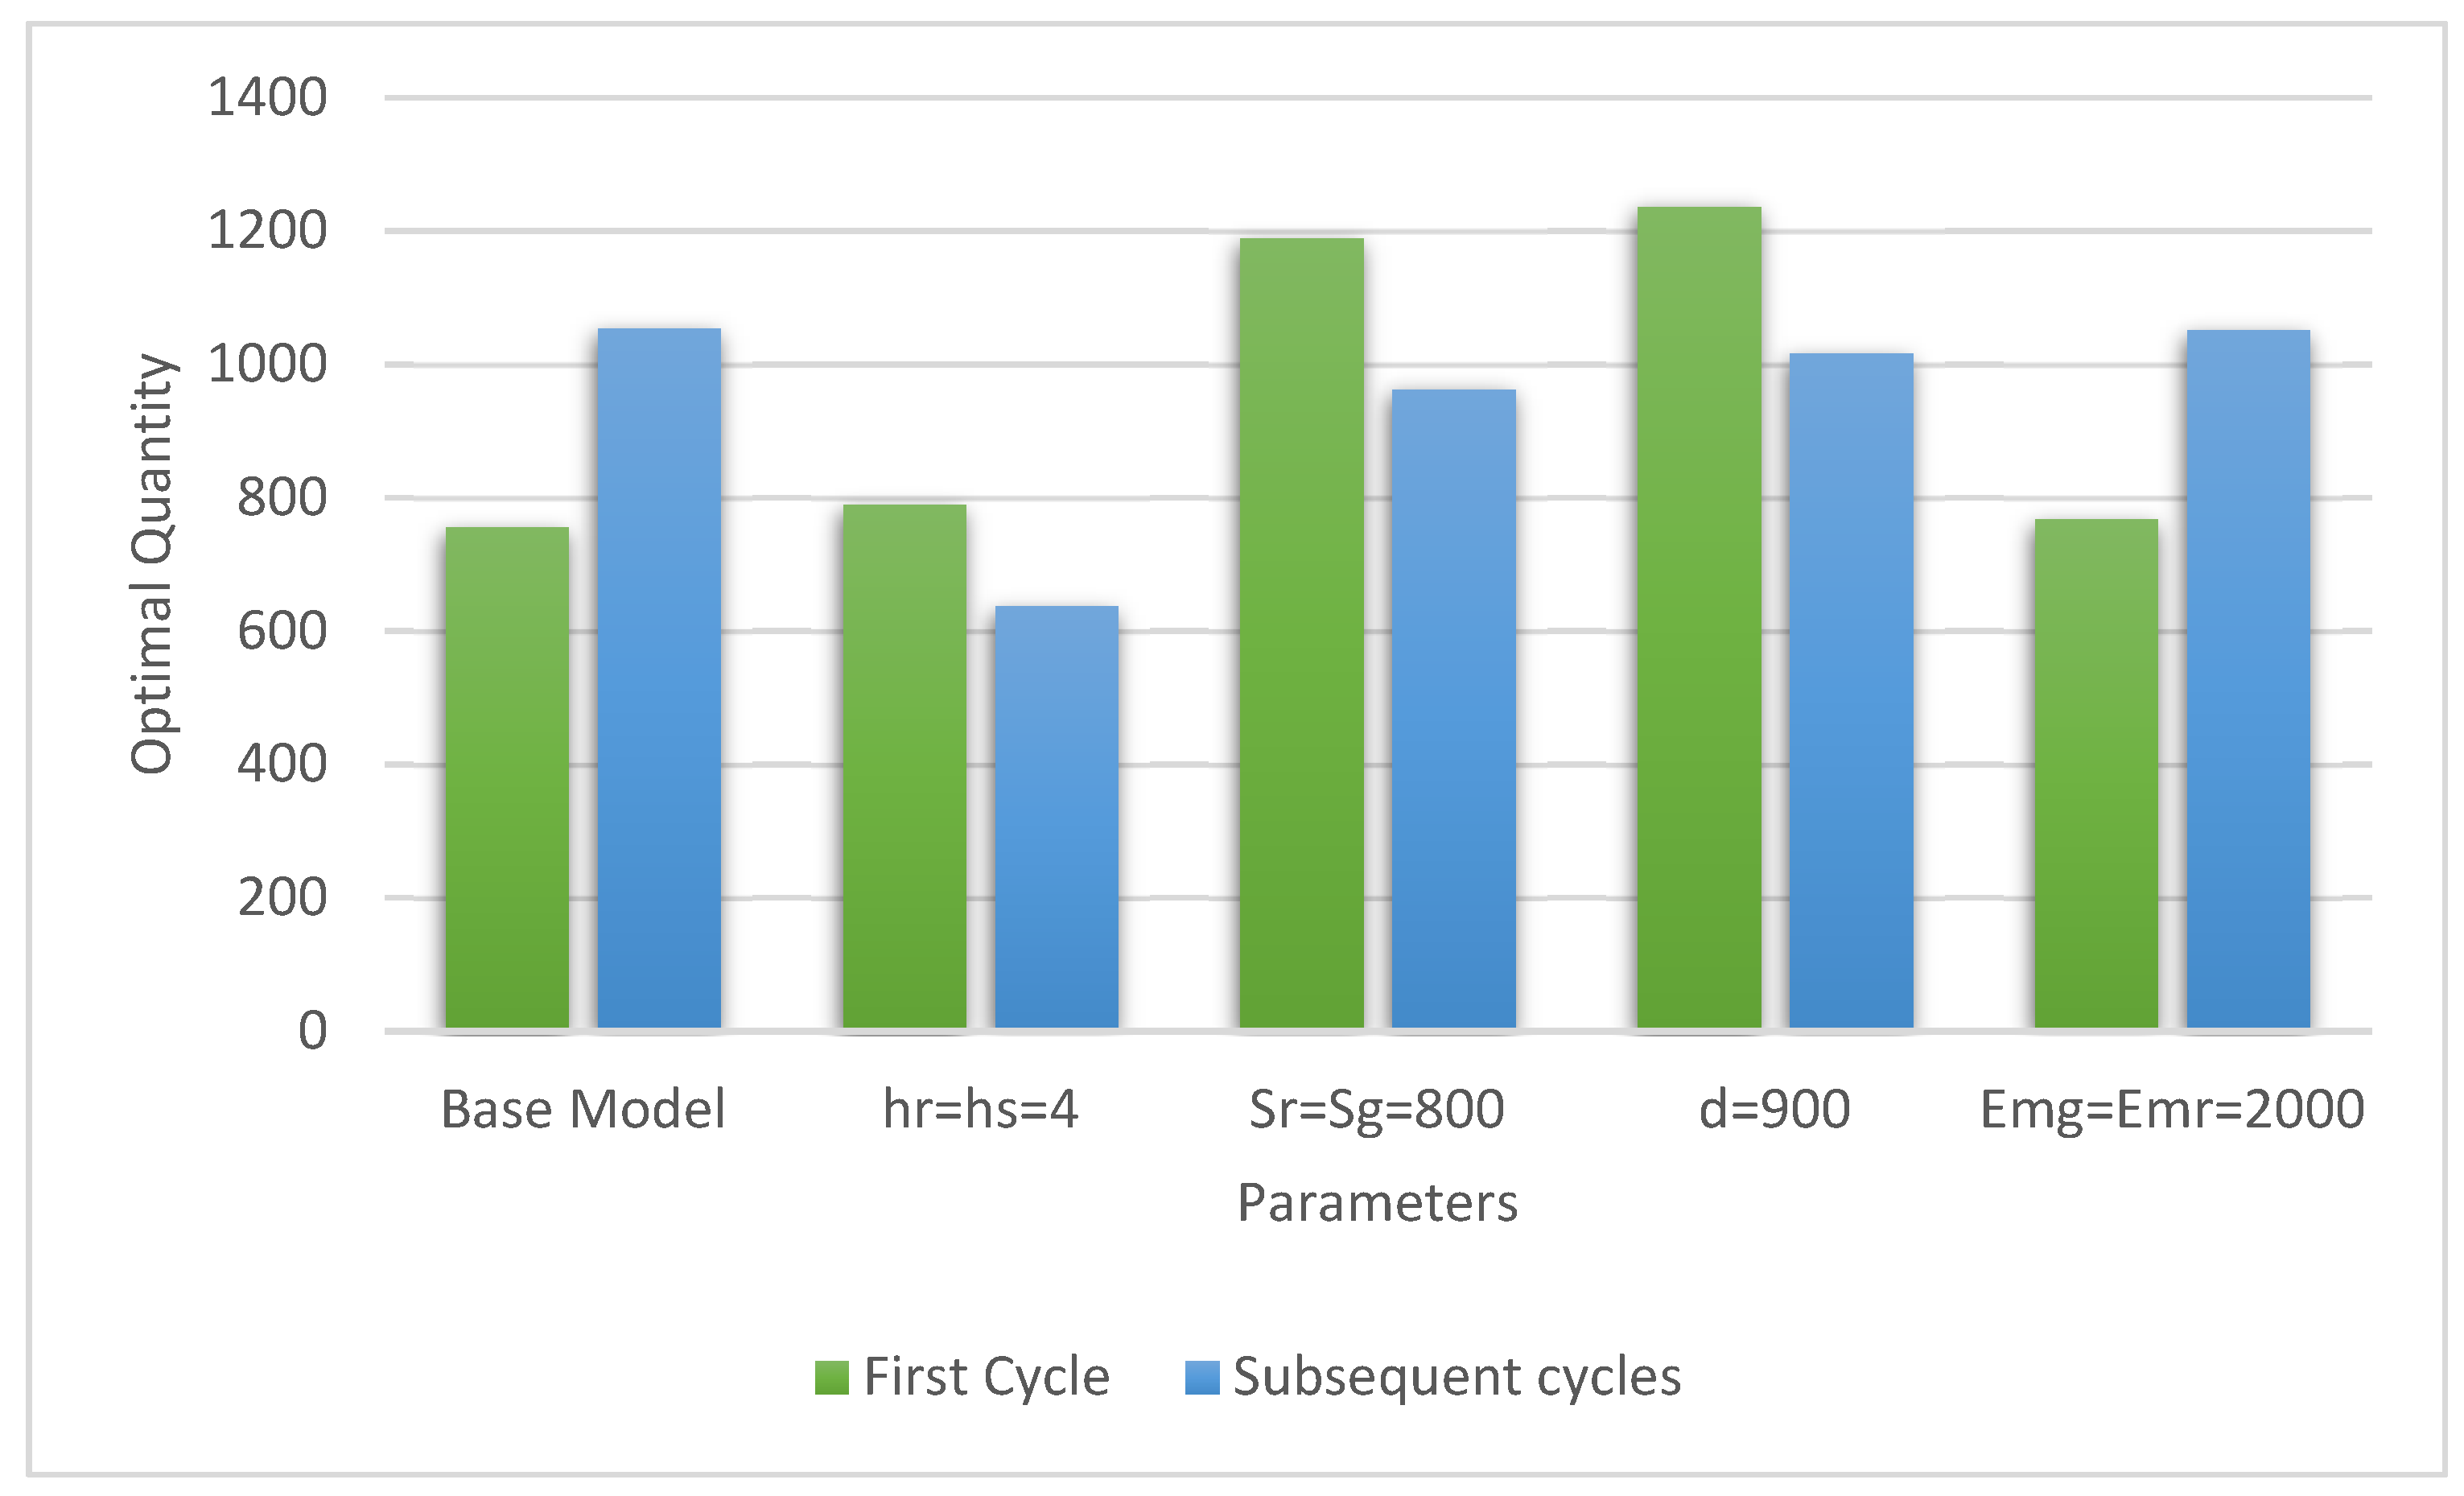
Figure 5.
The behavior of CO2 emissions in deferent settings.
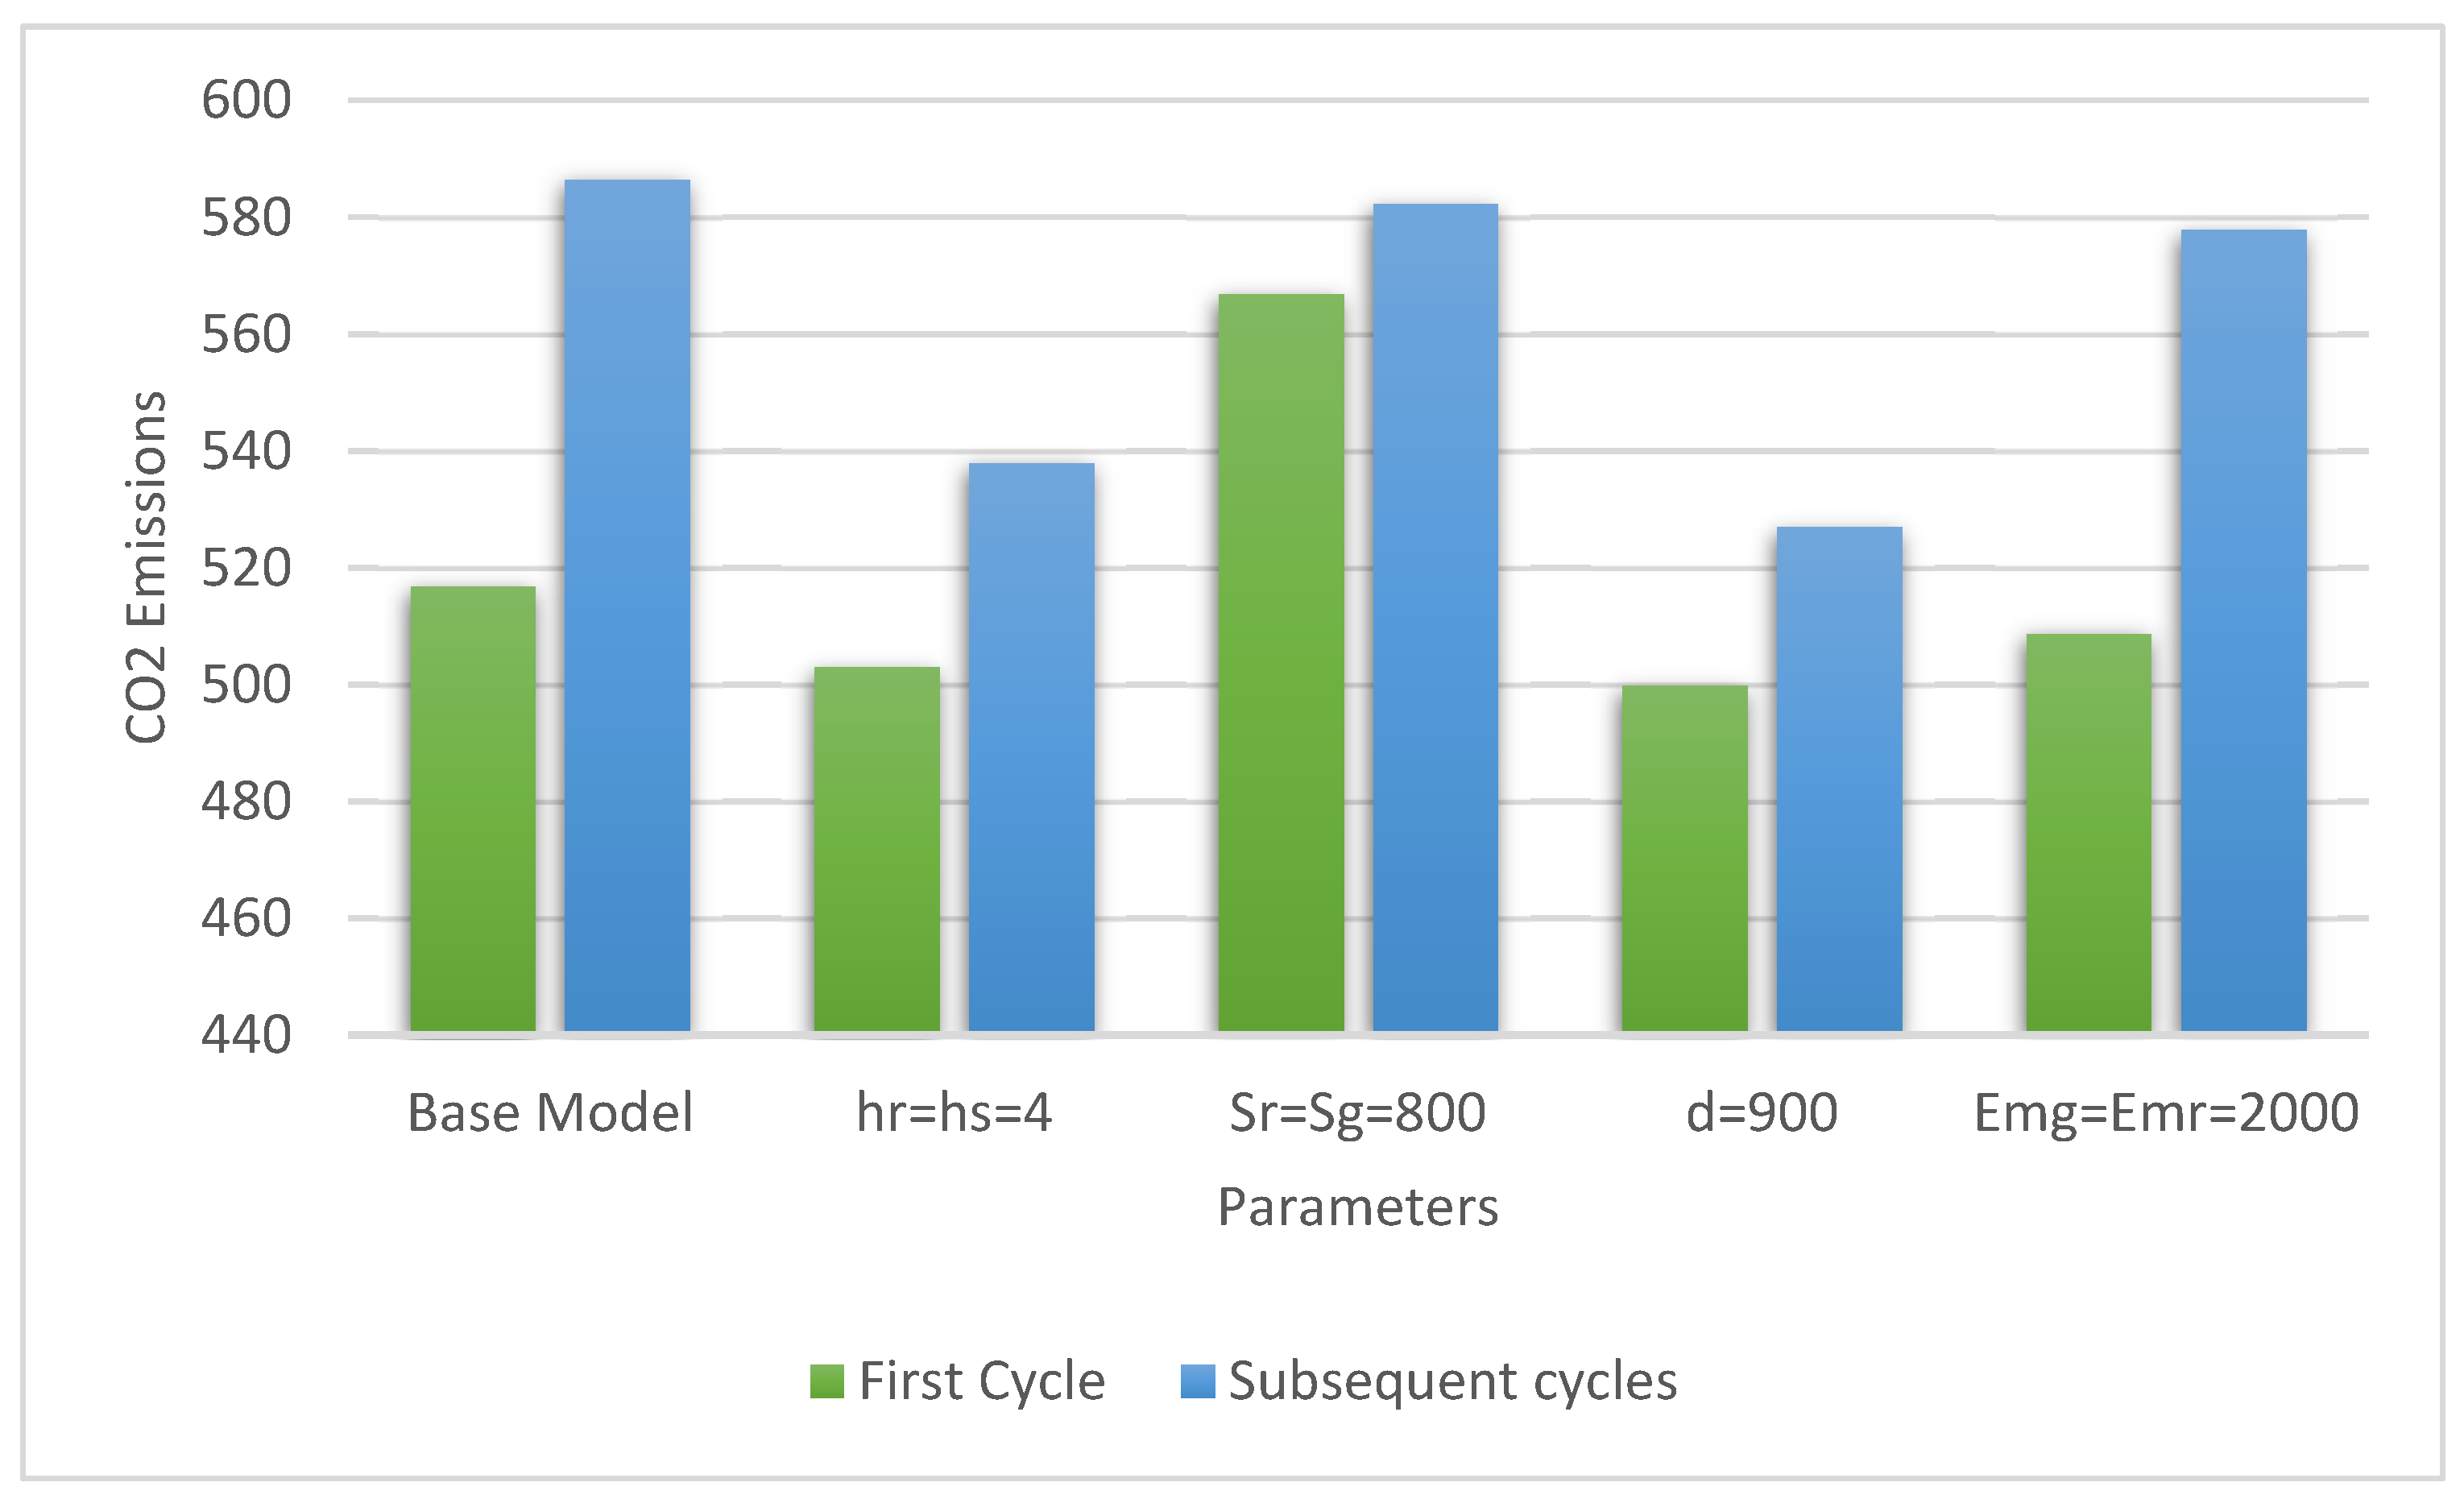
Figure 6.
The behavior of the minimum total cost per unit time in deferent settings.
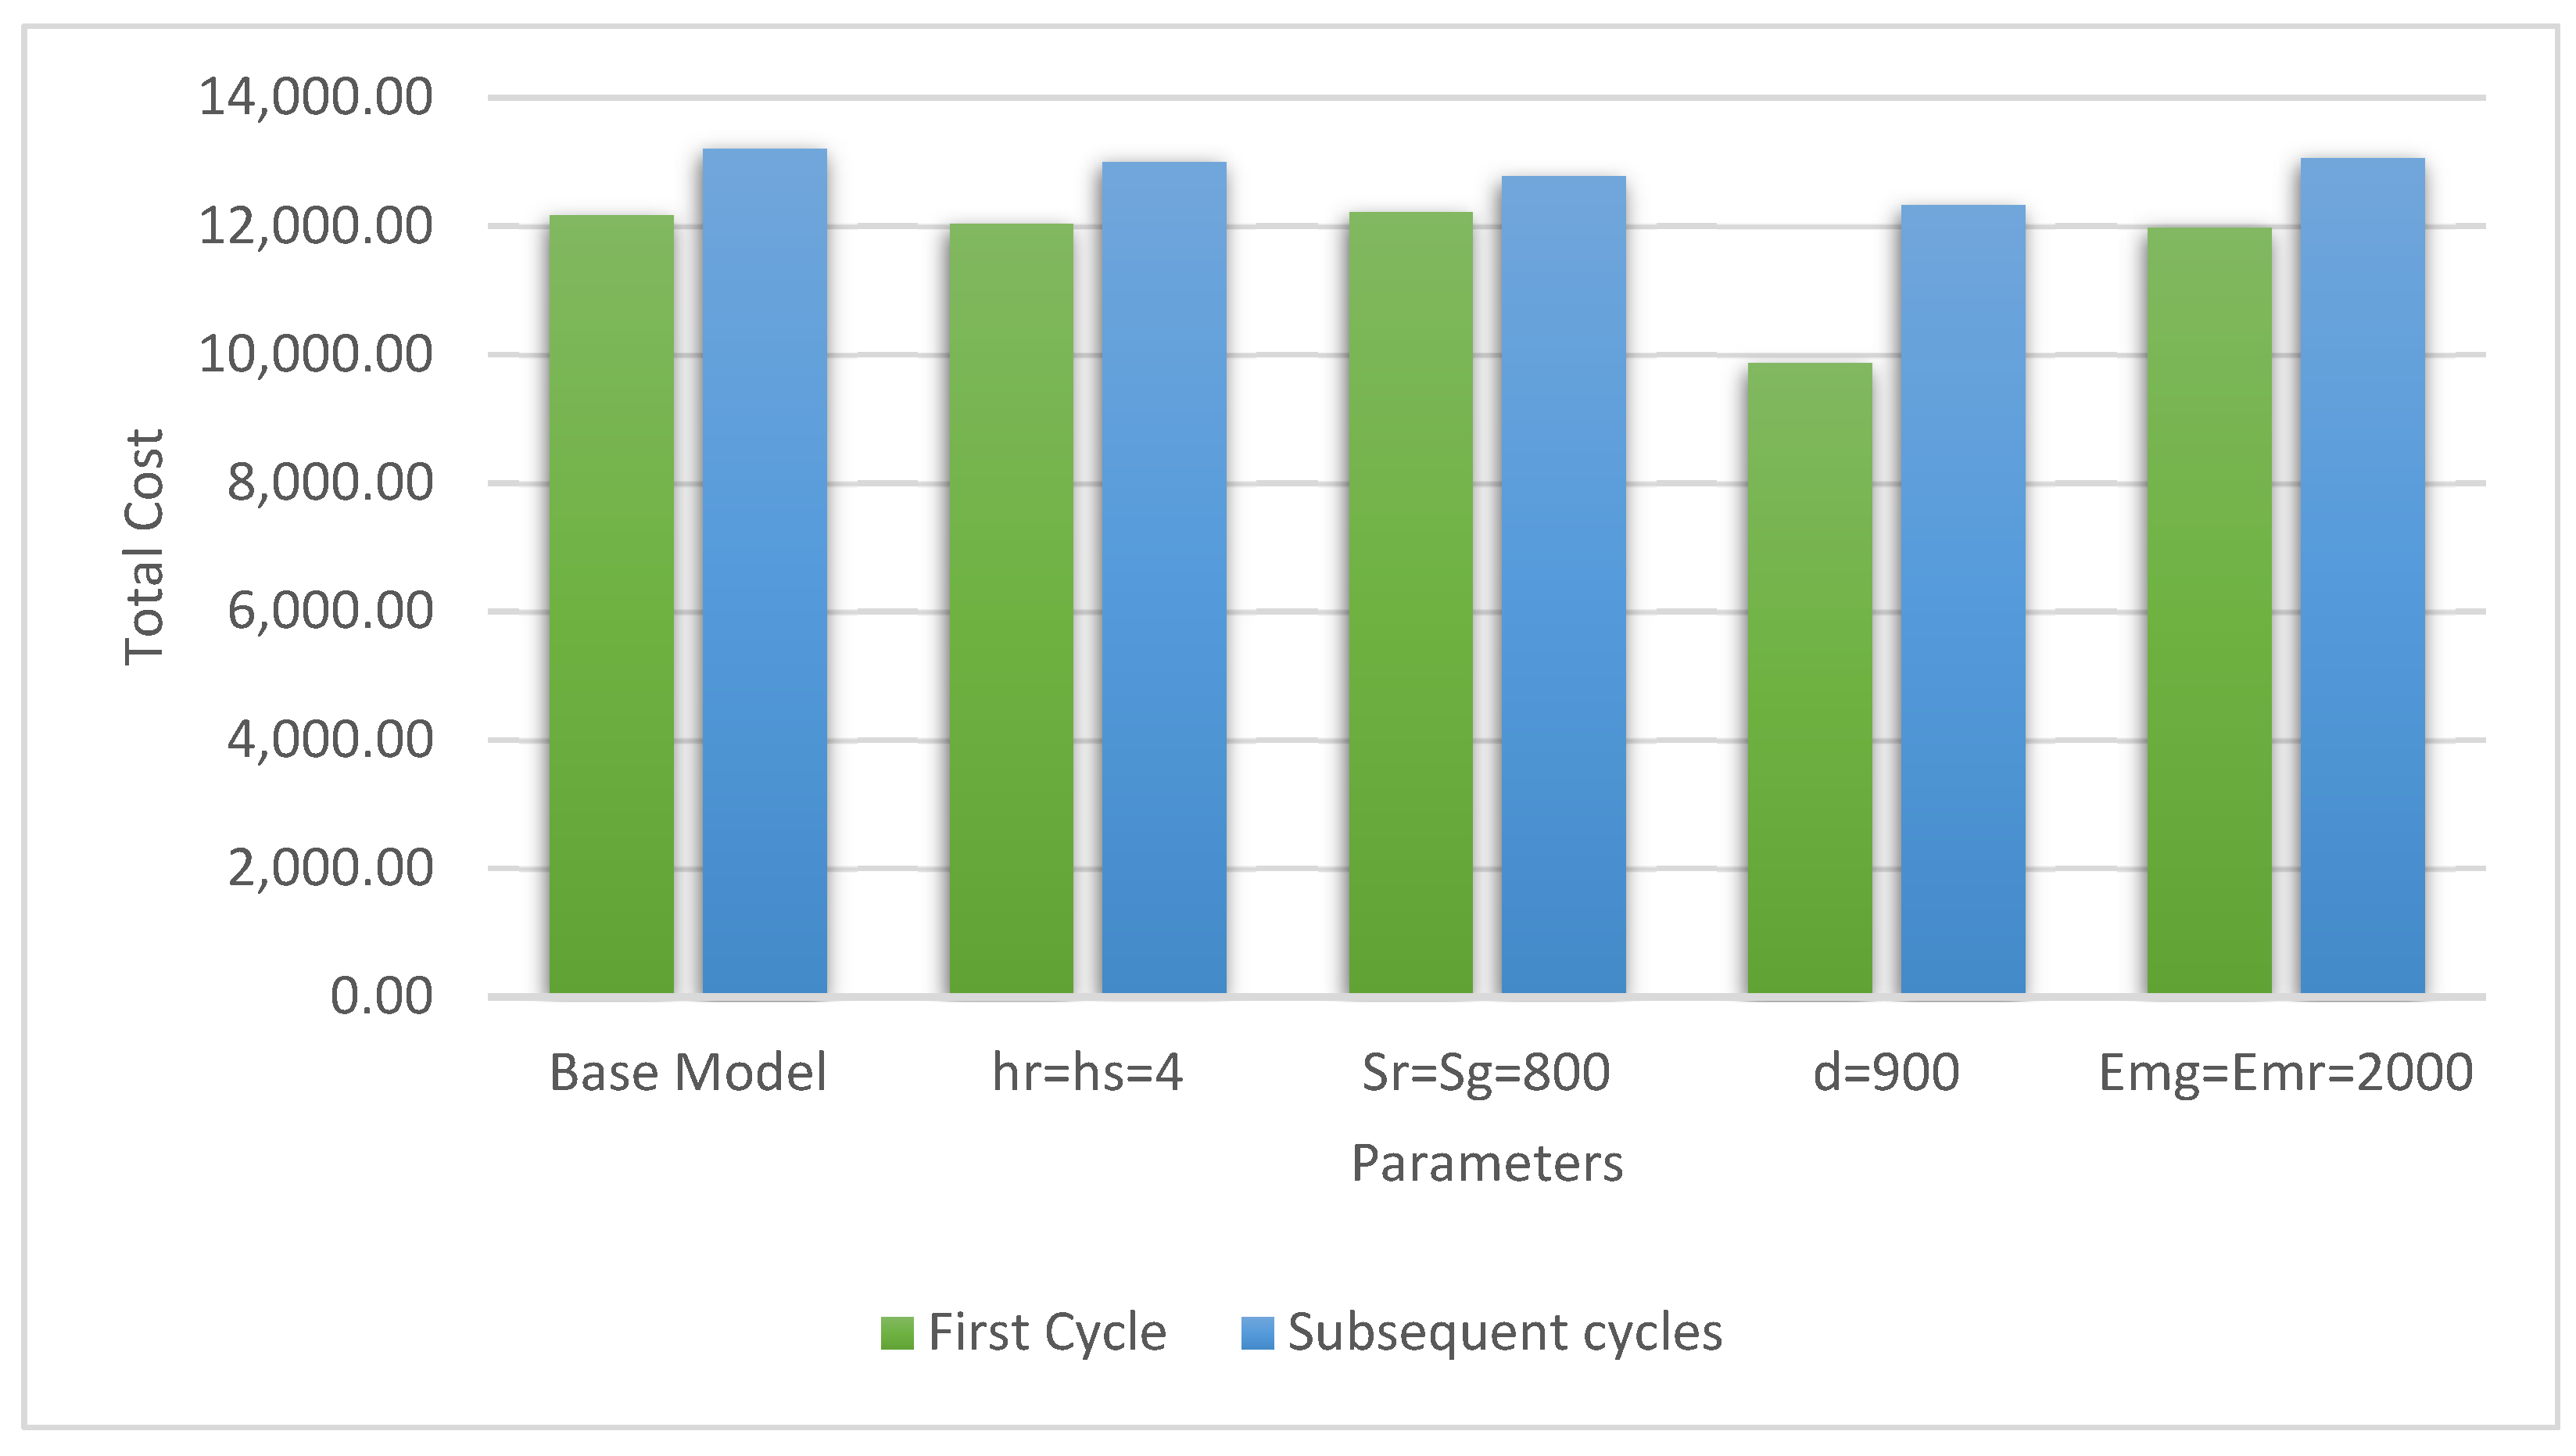
Figure 7.
The behavior of the optimal production rate in deferent settings.
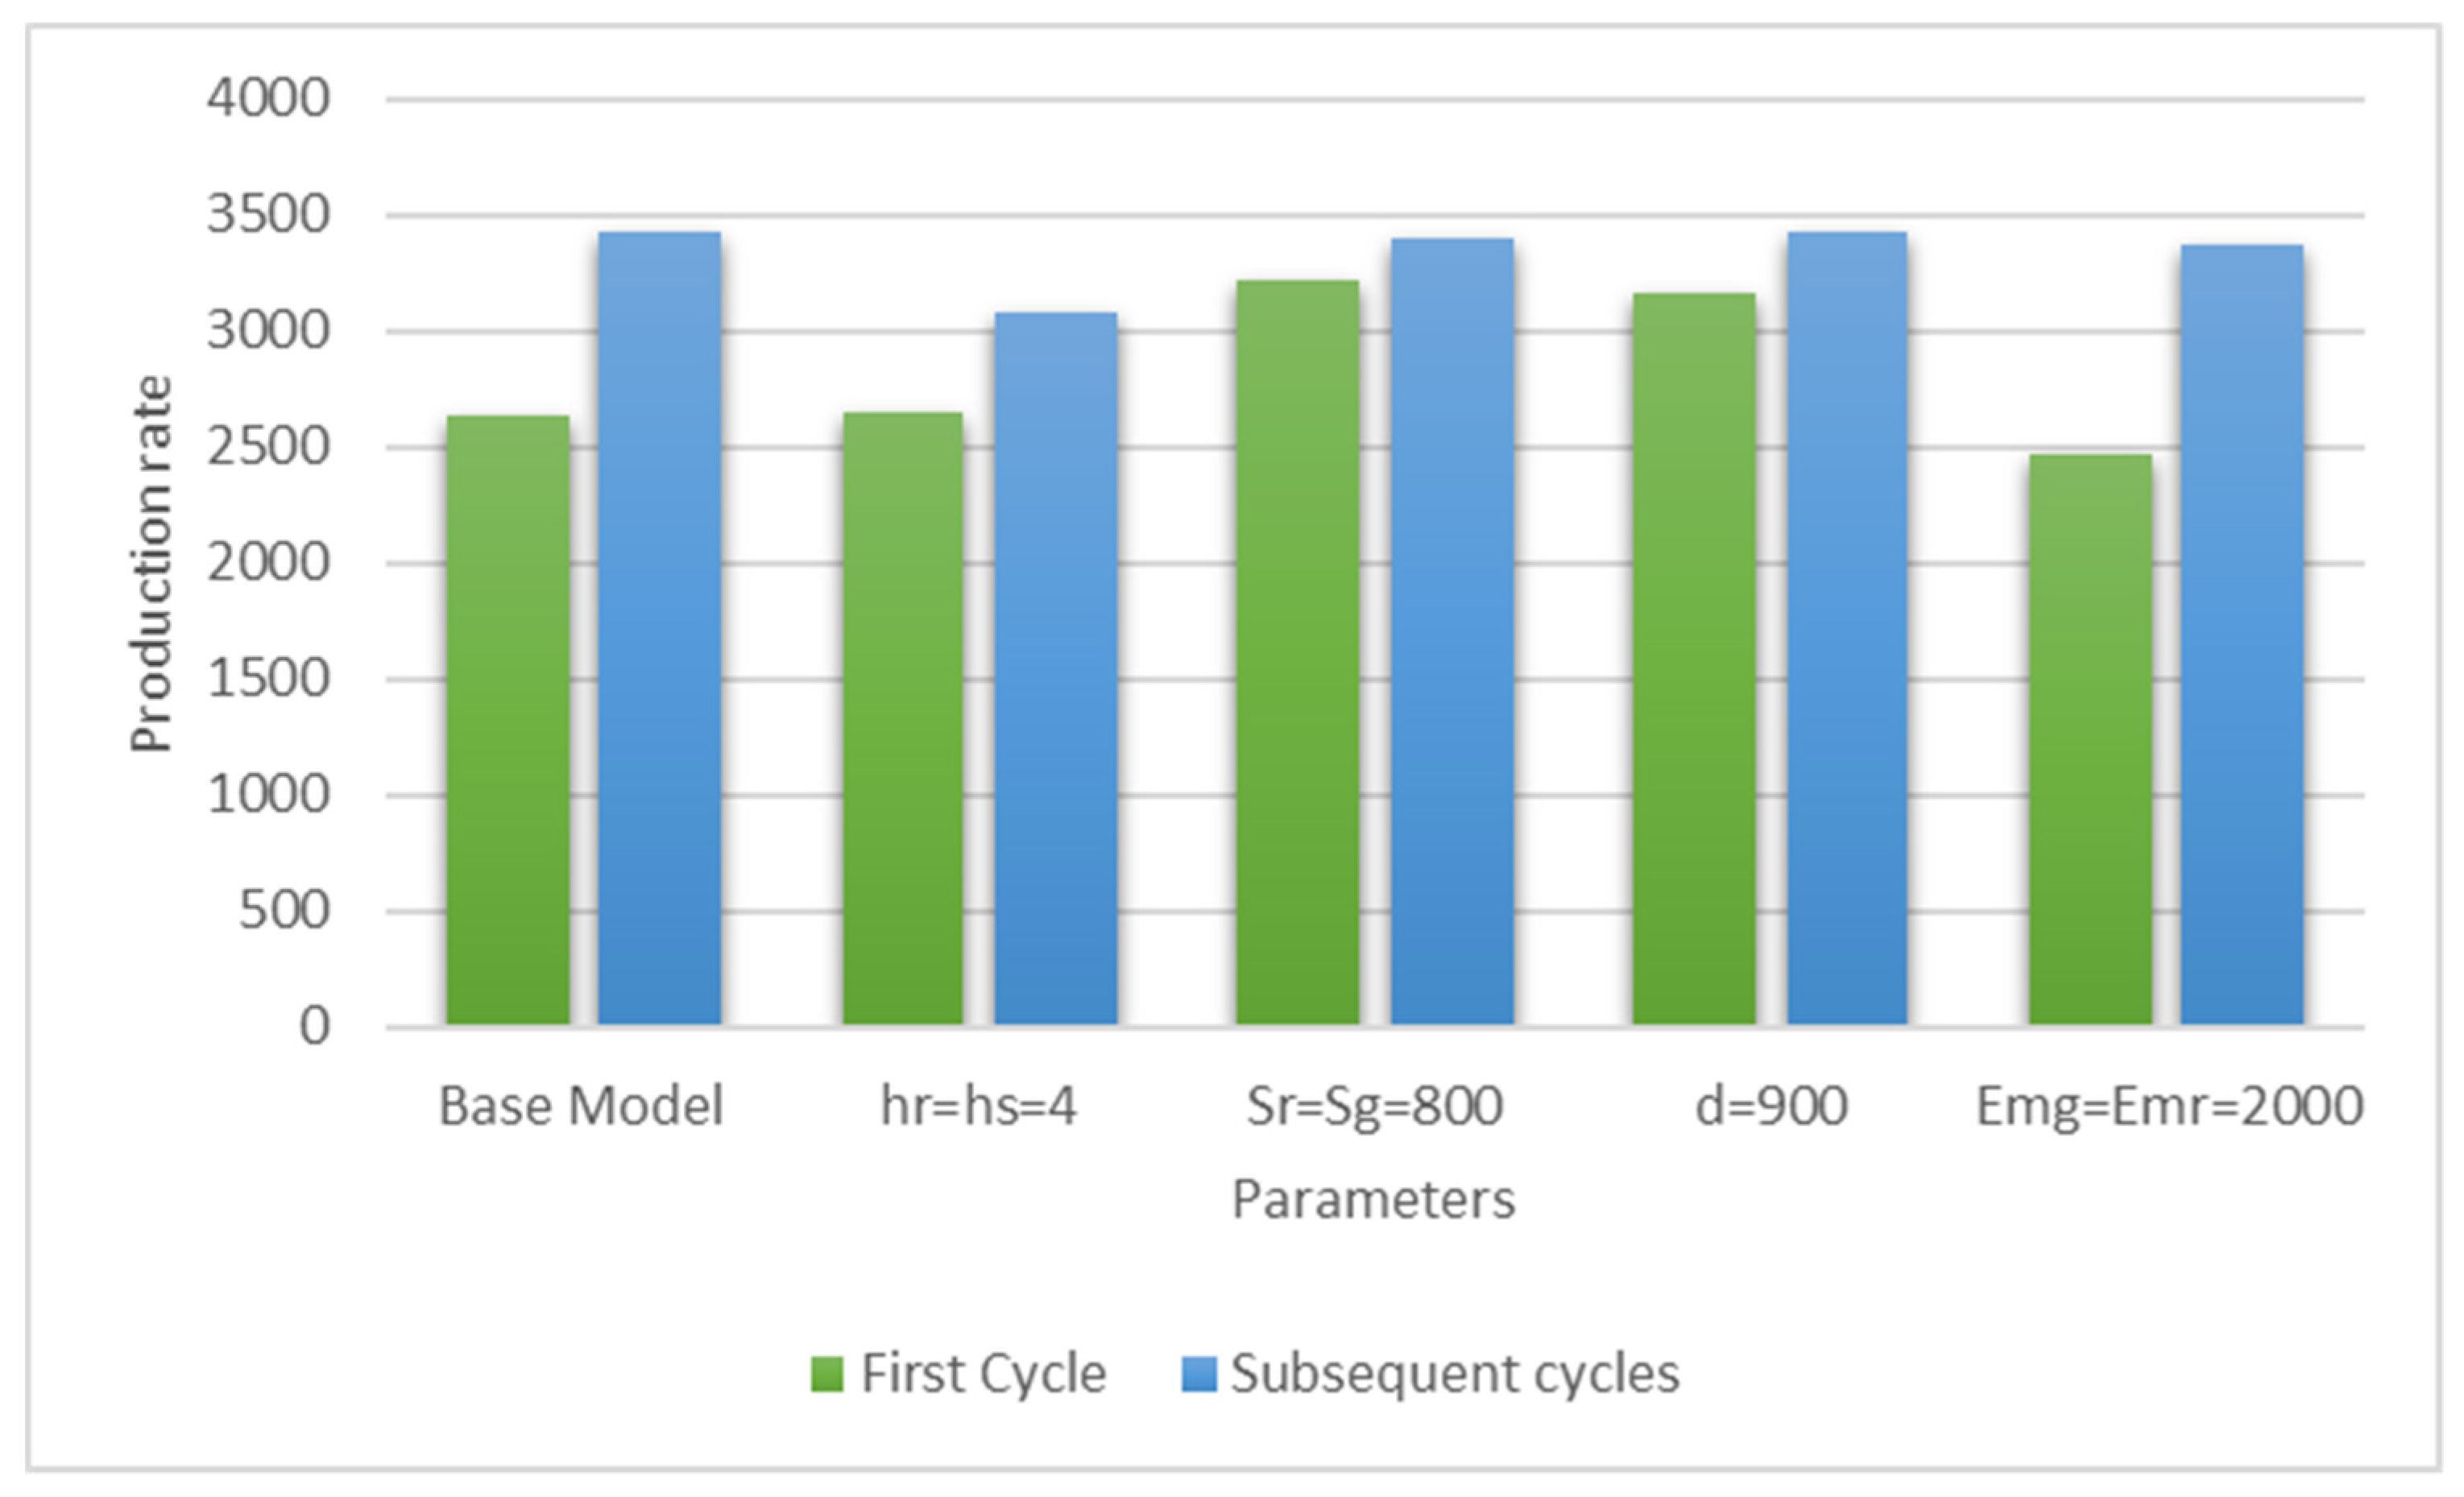
Figure 8.
The behavior of the optimal allocation fraction of green production in deferent settings.
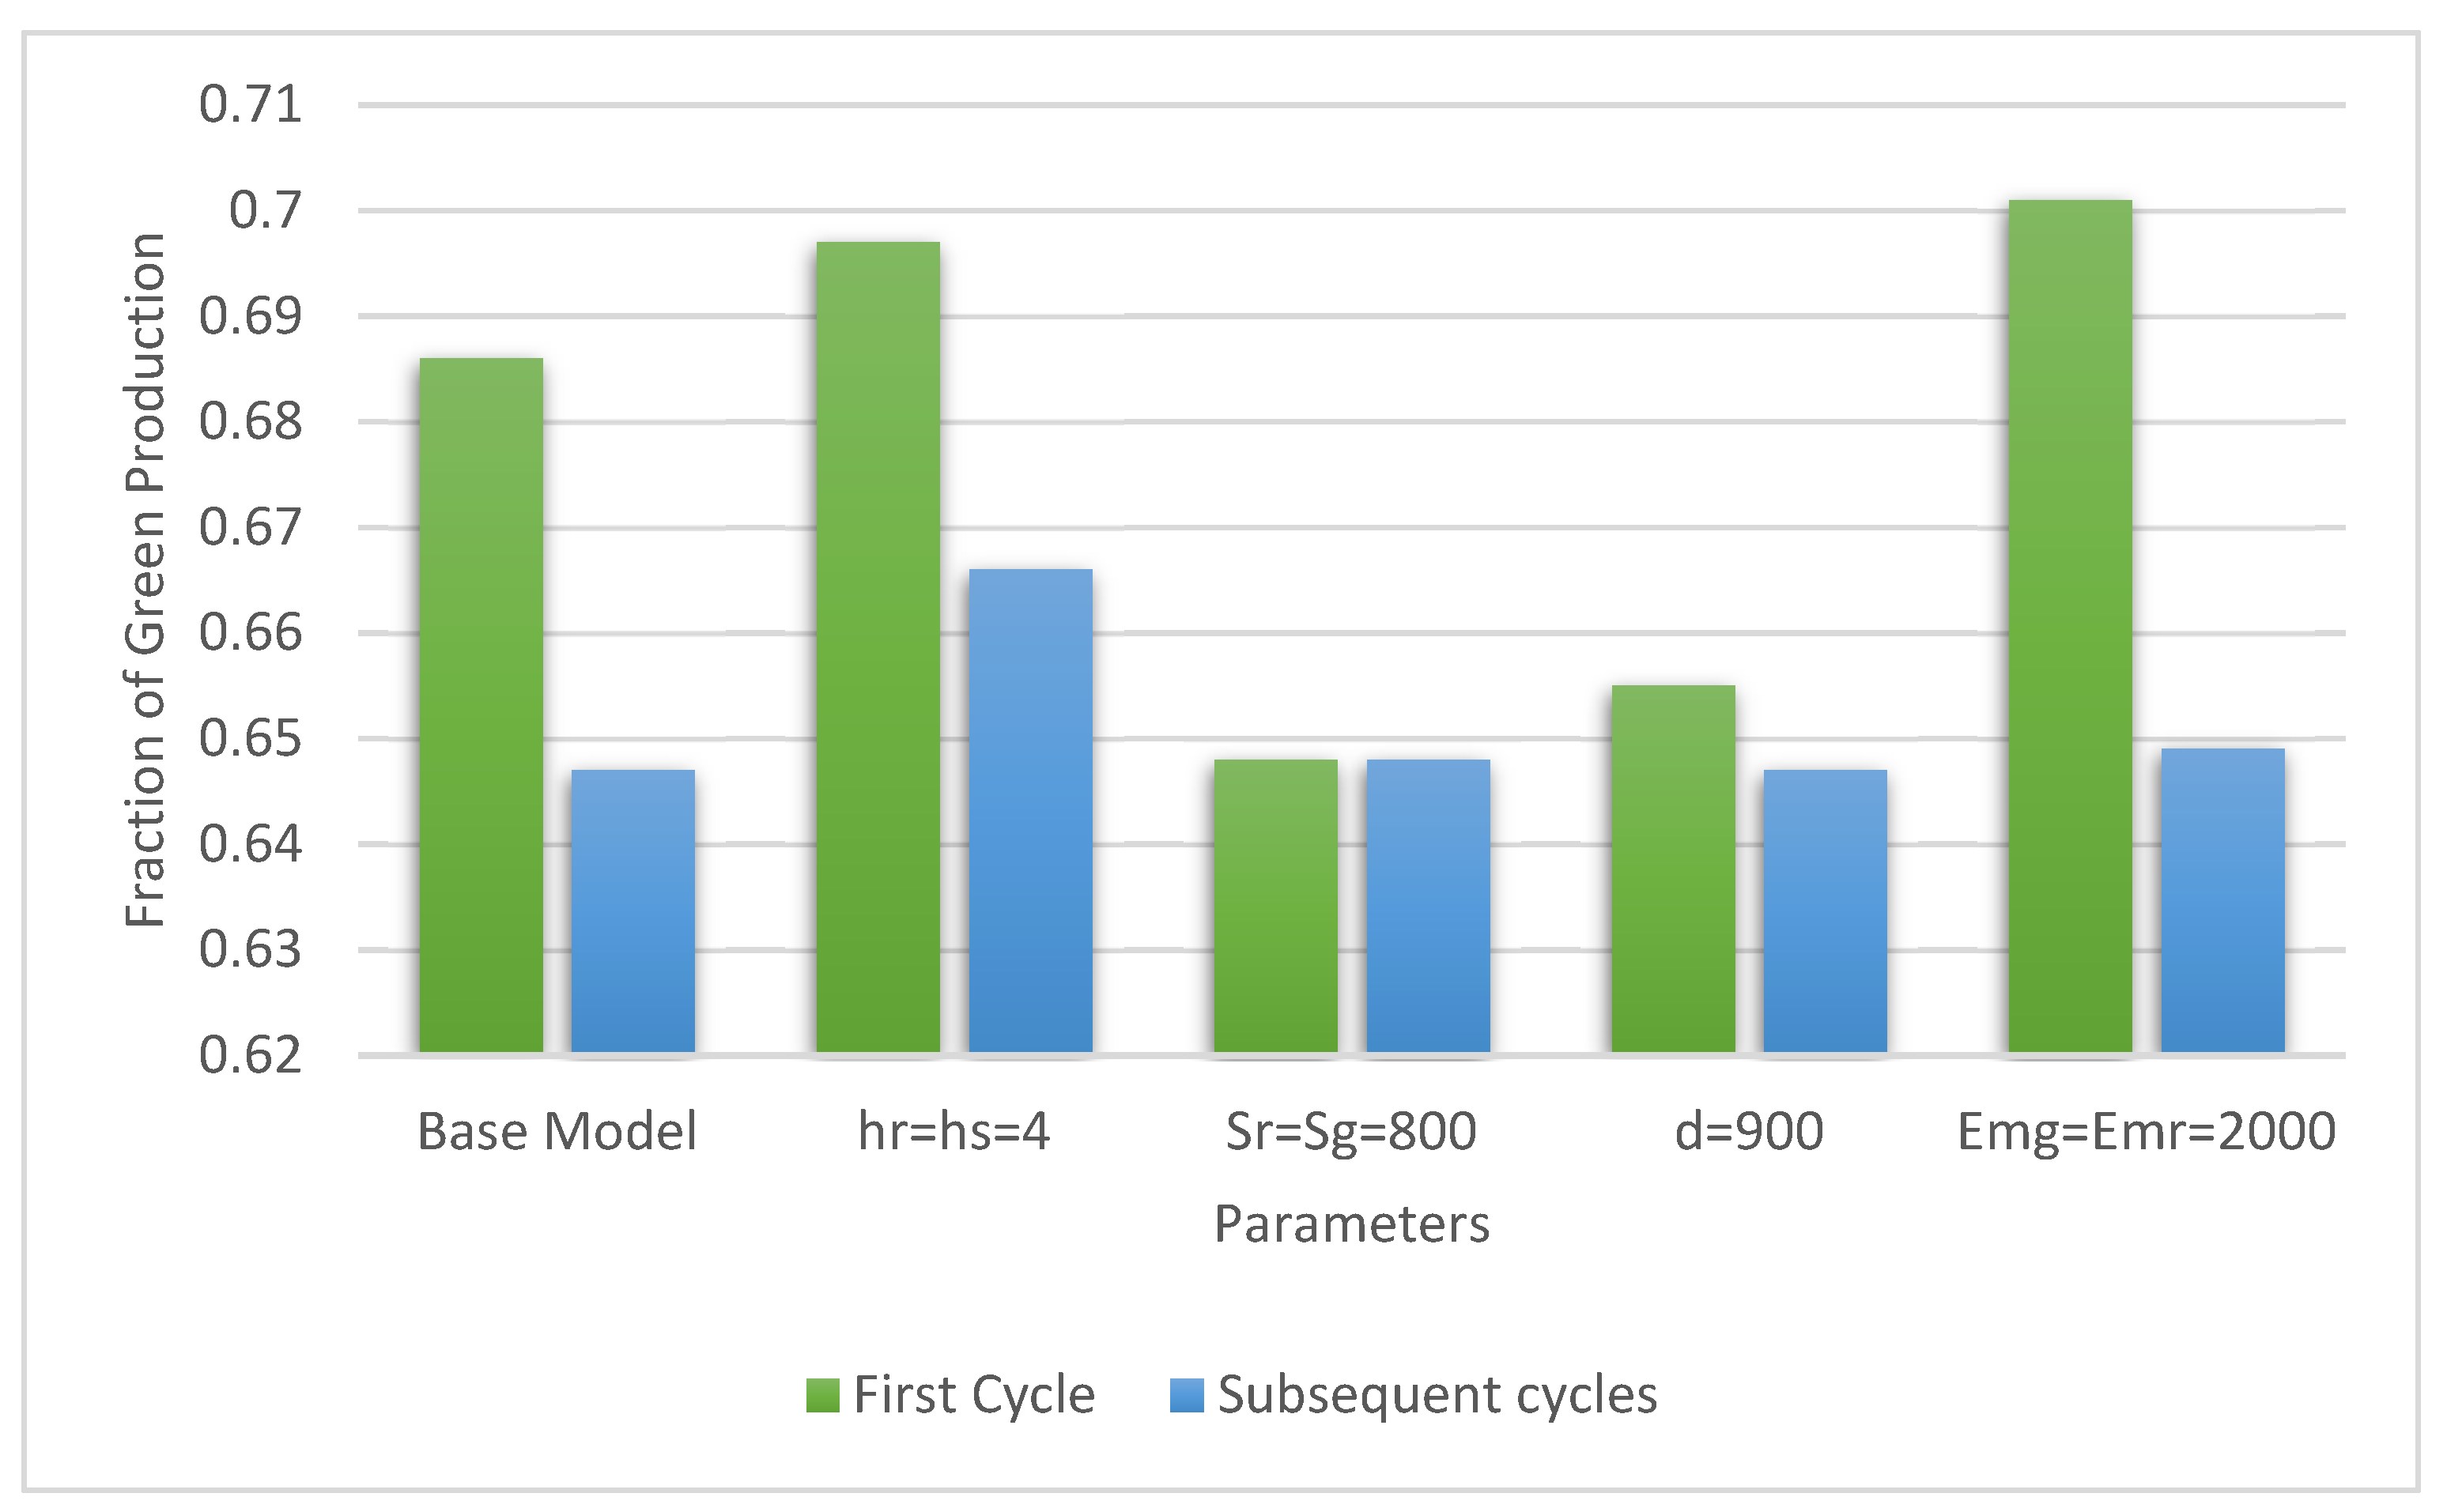
Figure 9.
A comparison of the optimal produced quantity, production rate, and carbon emissions with respect to hybrid and regular production methods.
Figure 9.
A comparison of the optimal produced quantity, production rate, and carbon emissions with respect to hybrid and regular production methods.
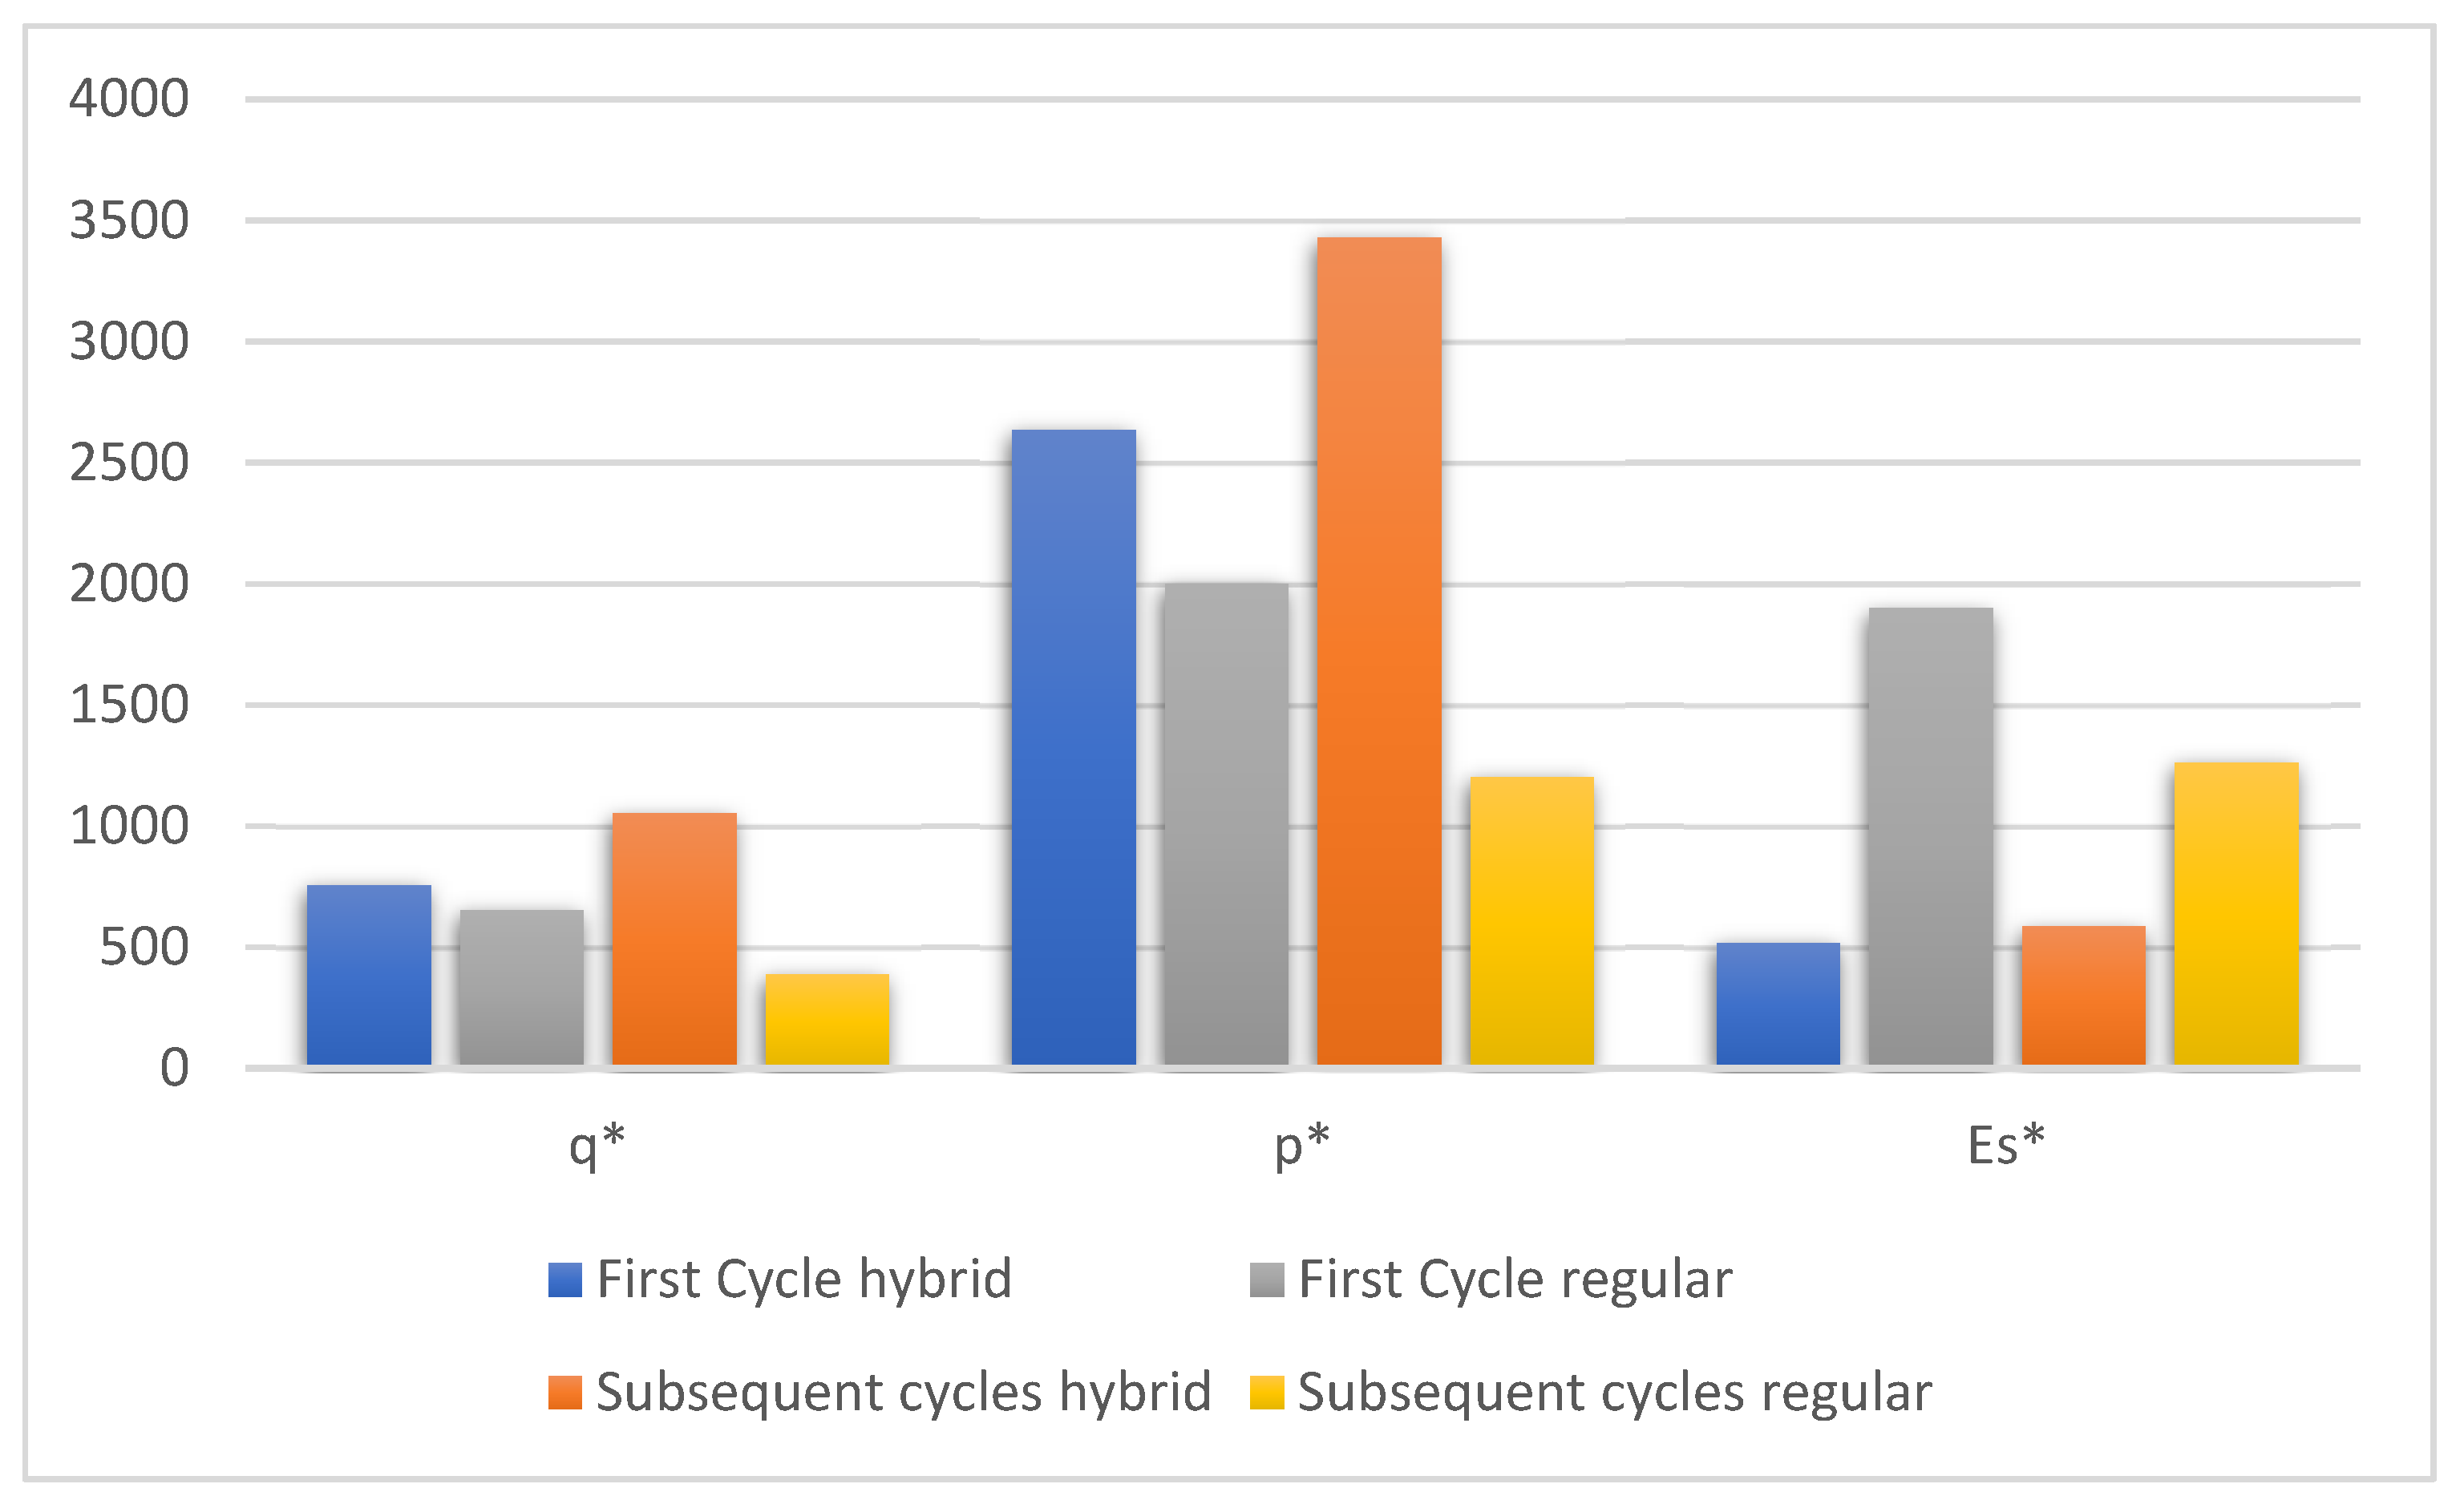
Figure 10.
A comparison of the optimal total cost of the system with respect to hybrid and regular roduction methods.
Figure 10.
A comparison of the optimal total cost of the system with respect to hybrid and regular roduction methods.
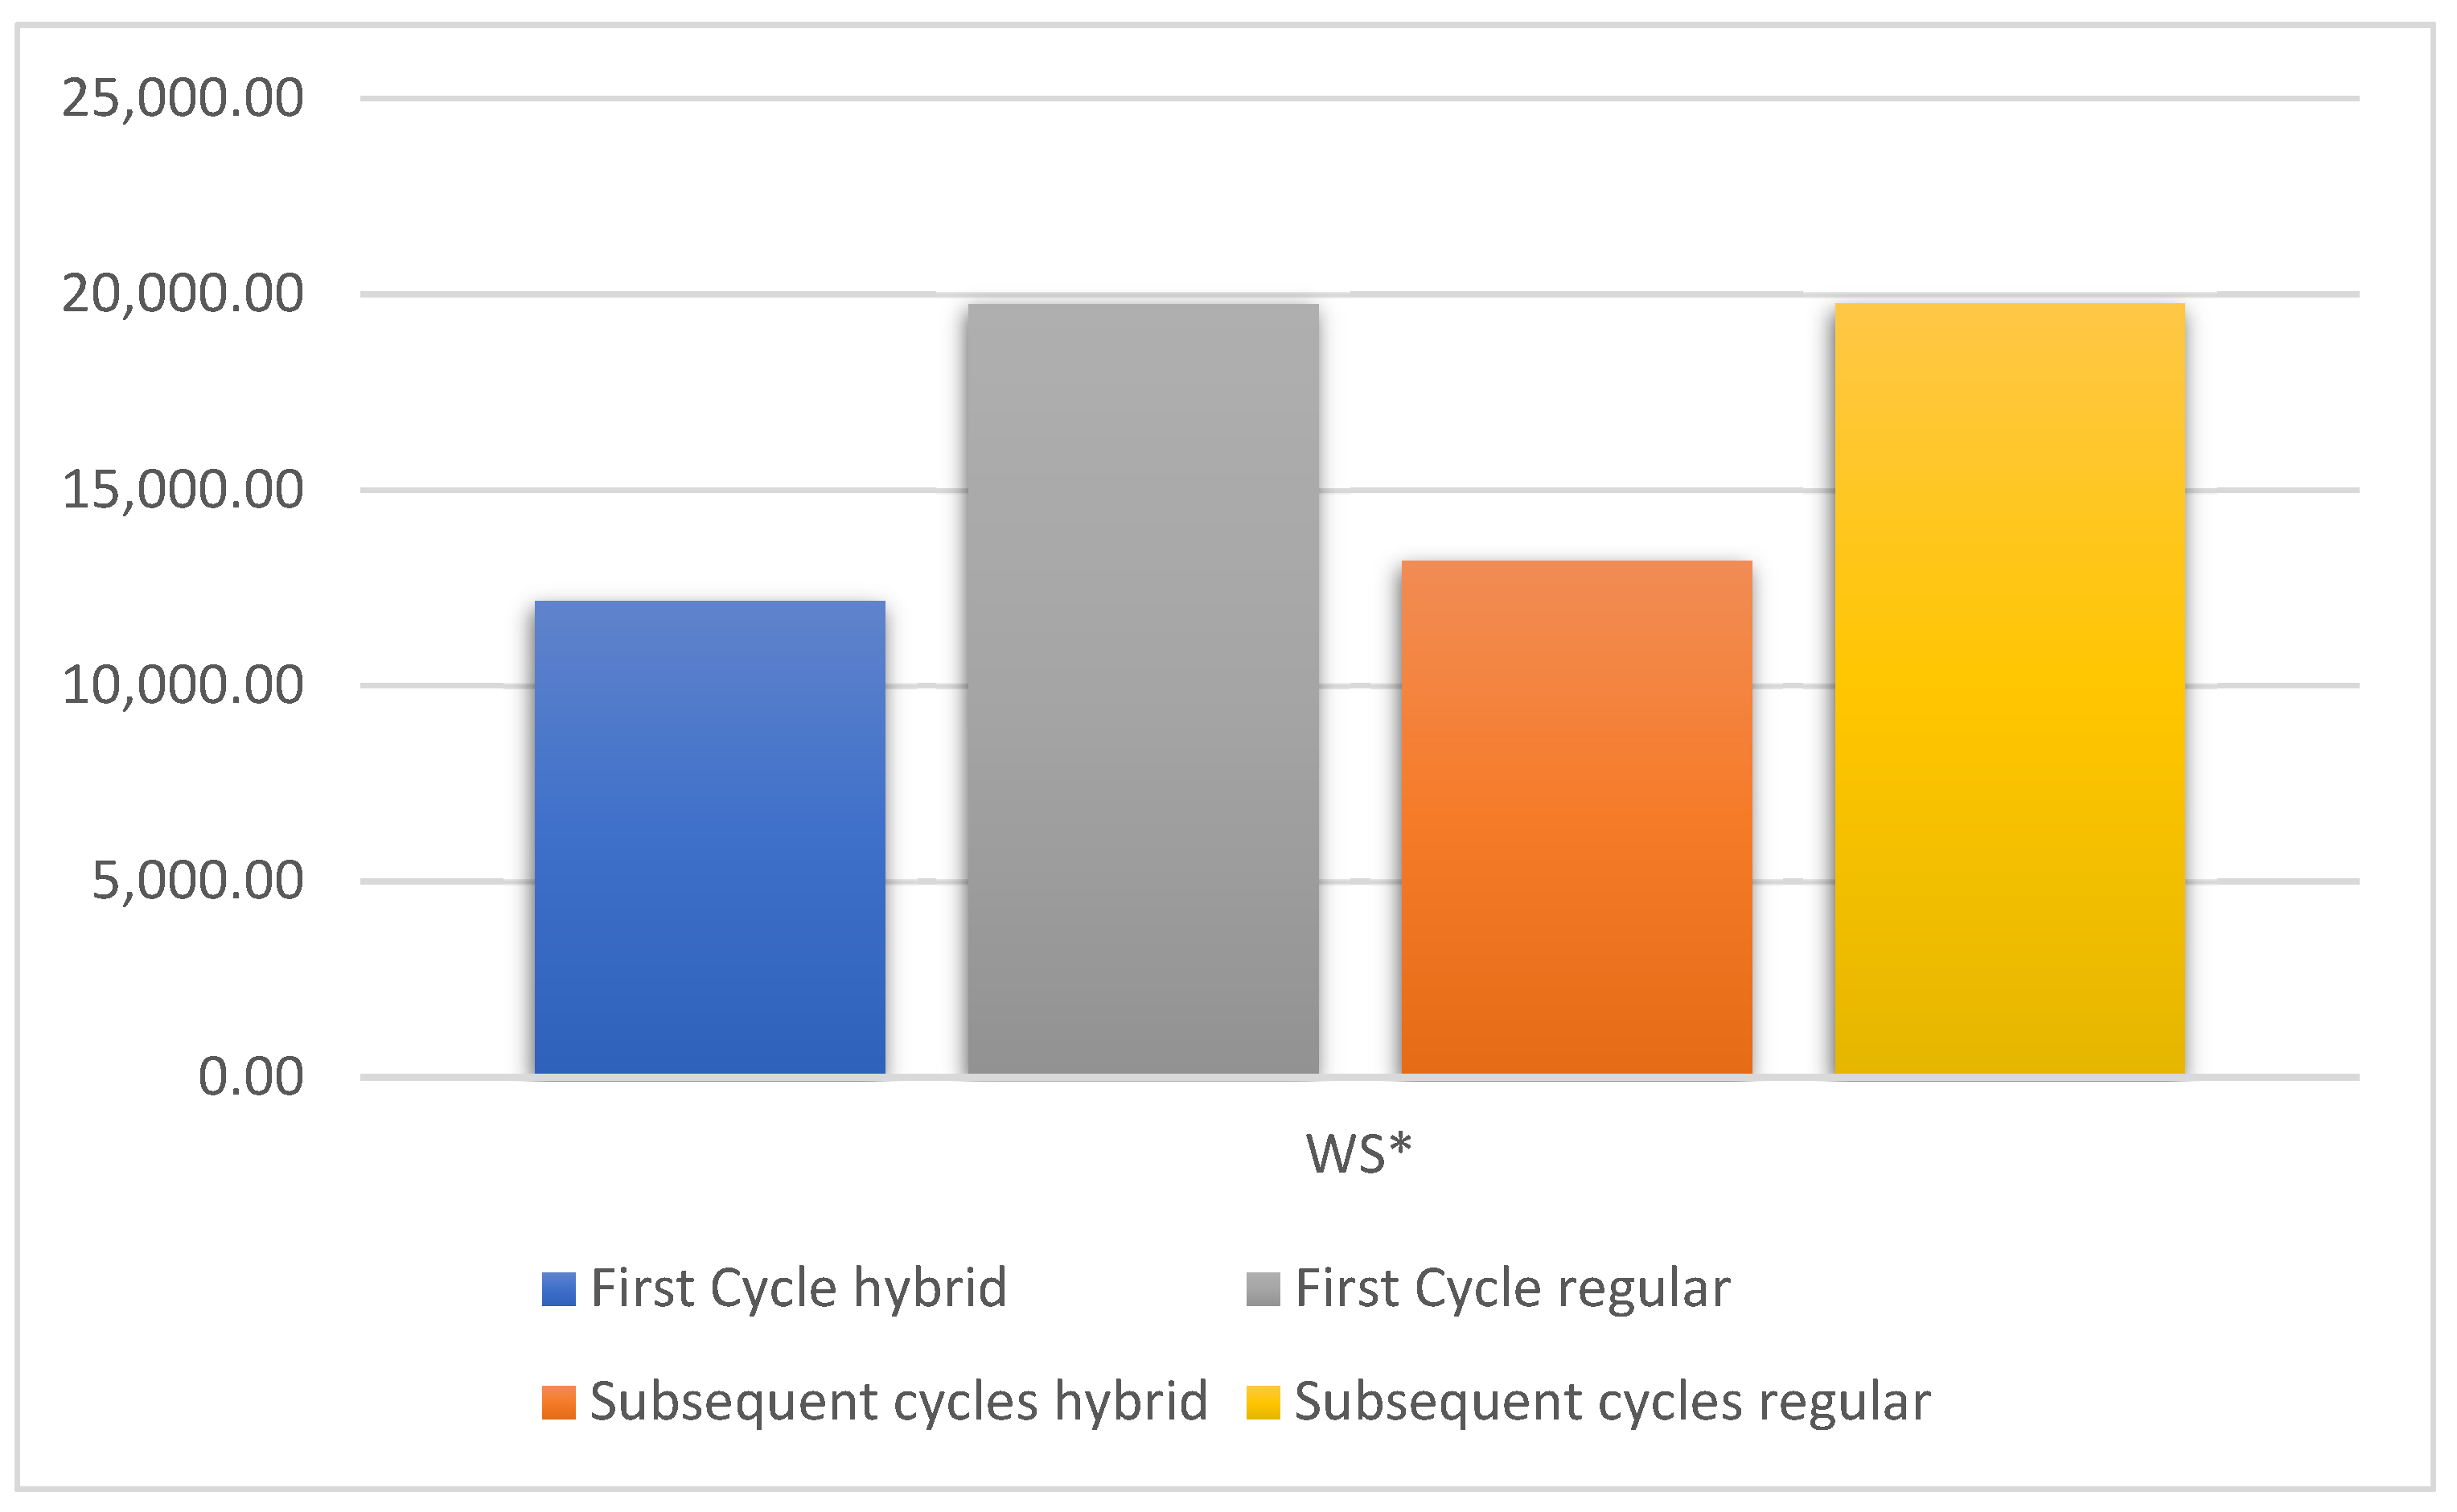
Disclaimer/Publisher’s Note: The statements, opinions and data contained in all publications are solely those of the individual author(s) and contributor(s) and not of MDPI and/or the editor(s). MDPI and/or the editor(s) disclaim responsibility for any injury to people or property resulting from any ideas, methods, instructions or products referred to in the content. |
© 2023 by the authors. Licensee MDPI, Basel, Switzerland. This article is an open access article distributed under the terms and conditions of the Creative Commons Attribution (CC BY) license (http://creativecommons.org/licenses/by/4.0/).
Copyright: This open access article is published under a Creative Commons CC BY 4.0 license, which permit the free download, distribution, and reuse, provided that the author and preprint are cited in any reuse.


