Submitted:
20 October 2023
Posted:
23 October 2023
You are already at the latest version
Abstract
At the beginning of 2019, the petroleum crisis impacted many economies dependent on this industry. The Mexican government started programs to identify points and government officials involved in the gasoline stealing from PEMEX (Petróleos Mexicanos), the country’s leading government petroleum company. The programs consisted of supervising and monitoring the Mexican country network of gasoline ducts to detect points where gasoline was being stolen. Consequently, large urban regions faced a lack and shortage of gasoline. This situation generated several reactions in social media and many open data in news media. Although the government provided open data about stealing gasoline locations related to crimes, it did not analyze the collected data to identify patterns, insights, and the spatio-temporal characterization of this phenomenon. This paper presents a study to deal with the regional semantics described in the social media locations of gasoline stealing. Thus, a framework to discover the trends that emerge from social media and how it is correlated with the government’s open data is also presented—the proposed methodology used machine learning techniques based on linguistic and semantic technologies. The analysis was applied to a dataset of 24,317 geo-referenced tweets. The obtained results reflected the Mexican thinking opinion regarding discovered social topics, polarization maps, and regional insights. According to discovered trends, there were long fuel lines between 1.5 and 5 kilometers (on average) at fuel stations in different Mexican states.
Keywords:
semantic and linguistic technologies
; spatial data mining
; spatial data analytics
; spatio-temporal characterization
; social media
1. Introduction
Nowadays, the study of the impact of a phenomenon or news in social networks has been carried out from different perspectives since measuring polarization and reactions to its implications [1,2,3]. Some of these approaches have focused on corruption, while an enormous amount of literature and most disciplines in the social science domain attempt to provide arguments and thoughts about it [4]. Thus, to give a context regarding the corruption concept, since we can find dozens of competing and sometimes contradictory definitions of corruption in the literature, this research study adopts the viewpoint of Transparency International, where ’corruption’ is defined as "the abuse of entrusted power for private gain". In practice, corruption takes countless forms; for instance, getting a birth certificate or a routine traffic stop in many countries involves a bribe. It can mean nepotism in the awarding of public contracts or lack of financial or operational transparency by public or government institutions, from the statehouse to the courts.
According to those mentioned above, our research work considers as a case study the political programs of the Mexican government against the corruption associated with gasoline stealing from the state-owned petroleum company (PEMEX). As a direct consequence of these programs, Mexico City and other large cities faced a lack of gasoline, which generated a crisis among the citizens, and diverse reactions were carried out in the newspapers, TV news programs, and social media. These reactions originated a new term to denominate colloquially by Mexican citizens gasoline stealing as "Huachicol".
Thus, the discourse of polarization in social media regarding this topic emerged over space and time, and it contains diverse social opinions. In addition, the Mexican government provided open data about gasoline stealing crimes. However, these data sources have not been analyzed to discover topics related to social motives, key events, and spatial factors, nor using spatial data science approaches that are presented by Lan and Li (2018) [5], Ferraresi et al. (2018) [6], and Silvestre et al. (2018) [7] nor statistical analysis. Therefore, our assumption implies that collective thinking from social media and its combination with open data could provide valuable information to discover social patterns and insights that explain the geographical behavior of gasoline stealing in Mexico from a social regression perspective, in terms of actors, causes, effects, and spatio-temporal characterization.
Some studies in the state-of-the-art have dealt with social media from different perspectives. Rathnayake and Suthers (2019) [2] examined the effects of polarization on the quality of voter decision-making in U.S. presidential elections. Another similar approach regarding polarization is presented by Lee et al. (2018) [8], where the authors showed how social media indirectly contributed to polarization through increased political engagement. Research works focused on the study of how social networks influence socio-political changes have had special attention. For instance, Ali et al. (2019) [9] described the role of social media in enacting socio-political change during the Egyptian revolution events in 2011. Banda and Cluverius (2018) [1] discussed that partisans respond to increasing levels of elite polarization by expressing higher levels of affective polarization, i.e., more negative evaluations of the opposing party relative to their own. Other research addresses are based on extracting and analyzing data from a collective perspective. For example, Støttrup et al. (2018) [10] presented an approach using coordinated citizen science and harvesting geospatial data on coastal fish, a spatial and seasonal coverage to investigate coastal ecosystems further and inform management.
Considering the research mentioned above works, we have identified that polarization and spatio-temporal analysis were applied but from different approaches. However, those studies have yet to focus on social media data for discovering geographic patterns associated with (gasoline) corruption through a geospatial data science perspective. Thus, this work addresses collective thinking gathered from Twitter and combines it with open data to discover social patterns and insights through a spatial data science approach that explains events, social behaviors, and geographical distribution related to gasoline stealing in Mexico. Accordingly, this work is oriented towards answering the following research questions: How to correlate open and social data considering the opinion diversity in regional perception? Furthermore, how do we deal with the regional semantics that describe specific circumstances about the gasoline crisis as they appear in social media?
The main contribution of this work is to propose a spatial data science approach based on open geospatial data that allows performing a data-driven analysis to discover social insights (e.g., social topics emerge at different times and locations), as well as Spatio-temporal topics distribution associated with the social effects of gasoline crisis around other Mexican states. Moreover, the proposed study shows to which degree open government data and social media (specifically Twitter) are correlated using different machine learning algorithms, dealing with linguistics and semantic issues associated with the gathered information. In addition, this approach is validated using a dataset composed of more than 100,000 tweets, which, after being pre-processed, 24,317 georeferenced tweets and diverse open datasets were obtained. Thus, open data include information about gasoline clandestine pipelines and their location per state, and the number of events per month are documented by the government for each one of these states in 2018. In conclusion, the obtained results showed several valuable patterns related to the characterization of the Mexican gasoline crisis in terms of social issues, polarization maps, and regional insights. These results extend the understanding of the phenomena in complement with open data analyses.
The research manuscript is structured as follows: Section 2 comprises the state-of-the-art related to the proposed approach. Section 3 presents the methodology and foundations concerning the proposed approach. Section 4 shows the experimental results that were obtained of this investigation. We present the conclusion and future work in Section 5.
2. Related work
There have been several studies related to the polarization phenomenon in different contexts. For example, Rathnayake and Suthers (2019) [2] have examined the effects of polarization on the quality of voter decision-making in U.S. presidential elections. The study concluded that polarization has positively affected voter decision-making quality; a related approach concerning polarization is presented by Lee et al. (2018) [8], where the results described how social media indirectly contributed to polarization by increasing political engagement. The study demonstrated the role of social media in activating political participation, which eventually pushes the users toward the ideological poles. However, these works should have studied the discovery of geographic patterns. Moreover, other studies have centered on how social networks influence socio-political changes. Ali et al. (2019) [9] described the role of social media played in enacting socio-political change in the country. Thus, historical events from the 2011 Egyptian revolution and beyond were depicted. The research study demonstrated that social media adoption led to political integration when there were different circumstances during the Egyptian revolution, and this led to citizen polarization when there was no contextual triggering effect.
On the other hand, Banda and Cluverius (2018) [1] answered questions such as how elite polarization informs affective polarization. Authors showed that partisans respond to increasing levels of elite polarization by expressing higher levels of affective polarization, i.e., more negative evaluations of the opposing party relative to their own. Motivated reasoning further encourages partisans to blame the opposing party more than their own. They further argue that increasing levels of political interest magnify the relationship between elite and affective polarization.
Moreover, Støttrup et al. (2018) [10] proposed an approach considering citizen-coordinated science and collecting geospatial data on coastal fish. The goal was to provide spatial and seasonal coverage to be used further for the investigation of coastal ecosystems. An example of the value of mobility data is discussed by Yao et al. (2018) [11], where an individual mobility pattern framework that can generate multiple spatial-temporal paths from social media data was proposed. The work reflected the diverse patterns existing in individual trajectories. The results concluded that individual mobility patterns reveal unique spatial and temporal trajectory regularity. At the same time, Støttrup et al. (2018) [10] used a social networking dataset for pattern recognition and applied the Bisecting K-Means algorithm over the collected data. This method first bisects the data into two parts, selects the part with more elements, and then spreads to cluster on it again until they have N clusters. As a result, the method found different patterns from the social networking dataset.
Social media provides massive data with spatial and temporal tags. Hence, it is significant to individual mobility patterns from social media data. However, data from social media usually have sparsity and uncertainty features and, therefore, cannot be handled efficiently by the existing mobility pattern mining methods. In Sinclair et al. (2019) [12], metadata of geotagged photographs to investigate the provision of recreational services by the network of wetland ecosystems in Kerala, India, was analyzed. The study employed data from social media and environmental quality data. The impacts of wetland aerial extension restoration and water quality improvement were explored to inform sustainable management strategies. The results are claimed to support the notion that passive crowdsourced data from social media has the potential to improve current ecosystem service analyses and environmental management practices in the context of developing countries.
Ali et al. (2019) [9] investigated spatial dispersion of crime committed by U.S. migrants on a macro (country) level, seeking (Police Force Area) scale indicators of the requirement for potential inter-state communication. Identifying the benefits to allied police forces in England from such interstate working now lies in developing further analysis at a police force scale, generally using non-publicly available data sources. This conceptual development calls for further research in human geography subdisciplines to consider the impact on a broader scale beyond that of impacting an offender or investigation. Similar approaches like Nohuddin et al. (2012) [3] presented a technique that uses frequent pattern mining to identify, group, and analyze trends in sequences of time-stamped social networks to identify “interesting” trends.
Finally, Caverlee et al. (2013) [13] analyzed large-scale geospatial footprints towards enabling new intelligent geo-social systems that leverage the footprints associated with the spatiotemporal activities of millions of people, which are collected by social media services (e.g., Facebook, Twitter, Foursquare, among others). In this way, the authors considered that these footprints open new possibilities for understanding how ideas flow globally, how people can organize for societal impact, and lay the foundation for new crowd-powered geo-social systems.
Based on the research works presented in the state-of-the-art, polarization and Spatiotemporal analysis have been applied to several studies and datasets in different ways. However, the proposed research is oriented towards employing social media data for discovering geographic patterns associated with (gasoline) corruption within a geospatial data science process in which none of those mentioned above investigations in the literature have centered on this particular issue.
3. Methods and materials
This section introduces the methods for gathering data associated with the gasoline crisis in Mexico in January 2019. Thus, using a spatial data science workflow, the proposed approach allows us to discover insights and identify spatiotemporal social patterns distribution. This proposal was inspired by the CRISP-DM (Cross Industry Standard Process for Data Mining) methodology, which provides a framework for carrying out data mining projects independently of any technology.
Thus, the proposed approach combines techniques and algorithms from Natural Language Processing (NLP) (e.g., topic modeling) and spatial analysis (e.g., buffering applied to social data extraction) to identify and describe social and Spatio-temporal events that occurred throughout the country on the gasoline-stealing phenomenon. Figure 1 depicts the methodological workflow whose stages are described in the following sub-sections.
According to Figure 1, the first stage consists of gathering data from social media. Filters were used to extract only information related to gasoline stealing. The second stage allows us to discover insights; in particular, this stage integrates three techniques: (1) exploration data from a data mining perspective, (2) topic modeling, and (3) sentiment analysis. The last stage presents the obtained results by mapping the geographic distribution of topics and social polarization.
3.1. The stage of data collection and filtering
This stage aims to filter data to ensure that only tweets that are a threat regarding topics related to gasoline stealing phenomena are selected. Thus, an iterative cleaning data process was used as follows. The iterative extraction of tweets consists of building a data extraction model driven by a semi-automatic process based on a visual exploration of data from citizens and verified social media accounts (new agencies and government officials).
Thus, the data extraction process was based on two criteria: (1) the extraction was implemented by applying spatial buffering with a radius between 5 and 10 km. In addition, the “gasoline” term was used as the primary filter keyword to retrieve information according to this criterion. (2) The second criterion monitored hashtags and terms related to “gasoline stealing” events. After the execution of the first criterion, a pre-processing clustering was run over the obtained data, including the results to extract data considering the cluster size.
For example, this cluster is composed of the hashtags: #NoFuel (in Spanish: “Sin Gasolina”), #GasolineFinding (in Spanish: “Buscando Gasolina”), and #PEMEX and has a size of between 8 and 500 tweets according to the extracted data. For this purpose, the words’ clouds as a visual technique are employed, where the more frequent and relevant terms are depicted. The cloud was obtained using the Term Frequency-Inverse Document Frequency (TF-IDF) and a semantic hierarchy implemented in the Ontology Web Language (OWL).
Thus, a visual exploration represented by a cloud of words to detect relevant terms in Spanish, considering the hashtags mentioned above, is shown in Figure 2.
The next step is to identify from the datasets the dominant word, which can be reused to make a new refined query, considering that the process repeats iteratively. At the same time, the number of tweets is reduced to 60%; as a result, we obtain a dataset of 24,317 geo-located tweets. Data were collected at the beginning of 2019 (during the gasoline crisis). This dataset covered locations in six Mexican states: Mexico City, Estado de México, Michoacán, Querétaro, Guanajuato, and Jalisco, where the government strategies affected the fuel distribution to retail stations.
- Data cleaning: The task consists of preparing the data for future processing and analysis. It is based on applying a linguistic extraction process as follows. First, a customized stop-words list is defined to filter the tweets’ dataset. So, when there is a match between the list of stop-words and the words of tweets, these are removed. This stop-words list identifies critical terms on explorations and key terms useful for the following data exploration task. The stop-words list also contains pronouns, symbols, and everyday words usually reported in opinions. An example of stop-words is the protocol name (e.g., “https”), emotional expressions (e.g., “Jajaja”), and irrelevant verbs. On the other hand, some examples of keyword terms for data exploration are specific names of accounts, such as SSP (Spanish acronym of the Ministry of Public Security) and politicians’ names, among others.
- Open data employing: Each stage mentioned above used open government data published by the Mexican government due to the impact produced by the gasoline crisis. These open datasets were collected in 2019 and made available in CSV format. The open data include information concerning gasoline clandestine pipelines and their location per state, the number of monthly occurred events, and the number of fuel thefts documented by the government in each particular state. Furthermore, a geospatial open dataset containing the country states’ administrative boundaries has also been considered. This dataset was provided by the Mexican Institute of Statistics and Geography (INEGI) and is available in shapefile format, presenting information at the 1:250,000 scale. In addition, the geospatial data contains the following attributes: "<idState>", "<name>", and "<geometry>" with the WGS84 geo-referenced style.
3.2. The discovery insights
In this stage, the filters in the input data and the topic modeling were used to identify trends in regional opinion topics that traditional social network analysis tools could not discover. Afterward, the trends regarding polarization, space, and time were analyzed to extend the comprehension of local social phenomena.
The topic modeling. Considering the geographic region, this task aims to detect the dominant terms regarding gasoline stealing phenomena. So, to find keywords or terms for describing the collective opinion, a K-Means clustering algorithm presented in [14] was applied, considering the previous work of Latent Dirichlet Allocation (LDA) [15]. The proposed algorithm is presented in Algorithm 1. It was implemented using Python, Scikit-learn, and Gensim libraries.
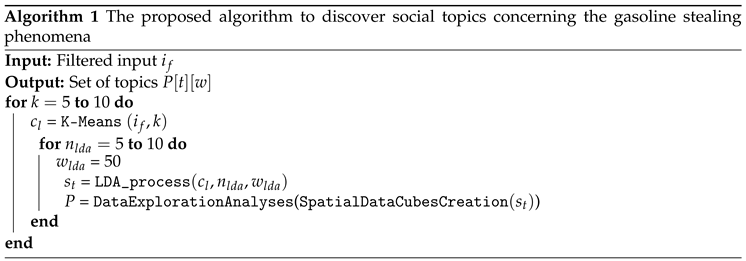 |
The text sentiment analysis. This task consisted of classifying the "polarization" of tweets, considering the filtering in space and time regarding positive, negative, and neutral categories, which is the component used for spatiotemporal insight analysis. The input dataset was filtered by geographic region, generating a cluster of geo-located tweets by the Mexican states.
Based on our previous work in Miranda et al. (2014) [16], the process follows two steps: (1) Introduce a Bayesian classifier with a sentiment-based reference dataset. As a result, it has more than 200 positive and negative comments. Thus, the classification performance is about 80 percent, and (2) Search words in an OWL semantic hierarchy, an adaptation of WordNet-Affect. The OWL hierarchy contains positive- and negative-labeled concepts and terms. This strategy commits and improves the results of the Bayesian process.
3.3. The spatiotemporal insight analysis
This stage is responsible for discovering relationships between the social perception and the polarization detected in gasoline stealing. So, it allows us to explain the gasoline crisis effects in the center of Mexico through regional and social polarization and detecting coincidences with gasoline crimes reported by the Mexican government using drill-down and roll-up SQL operations. The process was divided into three steps: (1) discover geographic and social topics, (2) locate the polarization distribution, and (3) make an open data analysis to obtain a regional description of gasoline crisis phenomena and how citizens use social media to report events concerning the crisis.
For example, Figure 3 depicts social topics that emerged in different cities, explaining specific problems, consequences, and experiences reported by citizens — all of it during the gasoline crisis period, where, officially, there are high gasoline stealing crime rates. For instance, the terms “steal” and “fuel stations” in different cities grouped comments about fuel stations’ locations closed. The fact was reported by stealing gasoline: “Fuel stations on Picacho Ajusco Highway with long lines”. Two of the four stations on the road are closed. The original tweet is linked in https://t.co/9x0YKEHW4i and is posted in Spanish.
Open data exploration. The geographic distribution regarding the stealing gasoline is shown in Figure 4. The central region of Mexico, composed of the states in red, orange, and yellow colors, has the highest number of clandestine shots registered in 2018. The computed events are on a scale between 375 and 1,547, according to information provided by the Mexican government, particularly by PEMEX. So, these states, including Mexico City, were considered to extract valuable tweets. Although the crime rate is low, the consequences of the gas shortage were significant, according to our results and news media [17]. For example, the discovered description for heavy traffic and long lines at the pumps to load gasoline around. To this purpose, a primary data cube structure was used for mapping crimes, taking into account the following features:
- Dimensions: [State][Month][Year]
- Measure: [Sum(CrimeEvents)]
The analysis included the applications of the geographic layers provided by the Mexican government.
Additionally, Figure 4 depicts the geographic distribution of Mexico’s gasoline-stealing crime rates.
Geographic and social topics distribution. This task discovers topics by each city in the country. First, the social data were filtered by states that belong to the center of Mexico for the clustering process. The clustering considered the news media and the majority of closed fuel stations in this region [17]. Thus, the clustering results included the cluster size, score, and cluster-ID. These attributes were combined and used in the primary data cube structure with the following features:
-
Dimensions: [idTweet][Topic][Date-Time],[Latitude][Longitude][idMexicanState]
- Measure: [Sum(ClusterSize)]
Finally, the discovered topics with values between 500 and 2,500 tweets were mapped, and a cloud of words to visualize an extended list of topics was generated. Thus, the discovered topics explain the gasoline crisis in Mexican regions (see Figure 3 and Figure 4).
Geographic polarization distribution. Polarization of collective thinking from social media is suitable to describe the tendency opinion in favor or against by region of Mexican government strategies. First, social data in the center of Mexico for the sentiment classification process were used. So, 80% of extracted tweets were classified into three polarity classes: Positive, Negative, and Neutral. The essential data cube employed structure was the following:
-
Dimensions: [idTweet][Topic][Date-Time],[Latitude][Longitude][idMexicanState][Polarity]
- Measure: [Count(Polarity)]
Data correlation. Exploration data was used to find coincidences, events, and insights between the open data, extracted tweets, and processed data iteratively. On the other hand, the results of the geographic distributions of topics and polarization served as query parameters for designing drill-down and roll-up SQL operations on temporal data cubes defined previously. For instance, to find [Polarity] and [Cities] and [Gasoline steal Events] in related tweets for <<topic value(s)>>, then it is possible to analyze the results set in detail.
4. Experimental results
In this section, we present the description and analysis of the gasoline crisis phenomenon at a regional level and how citizens use social media to manifest these events. Moreover, the section explains how the configuration for the experiments was carried out and the results discovered by applying the proposed methodology.
4.1. Results of the geographic and social topics distribution
Concerning the results of the geographic and social distribution, Figure 5 depicts an extended visualization based on a cloud of topic words. The size depends on the number of clusters, and each cluster is composed of tweets located in the 6 Mexican states related to the gasoline stealing phenomenon. Thus, the experiment revealed some associated terms with "gasoline steal", "selling gasoline", and "fuel stations", among others, where citizens reported locations of fuel stations with gasoline for selling.
Other topics, such as "gas shortage" emerged in the following states: Mexico City, the State of Mexico, Queretaro, and Guanajuato. The dataset comprises 3,156 tweets; this social insight matches news media reports. For example, PEMEX reported that most fuel stealing is located in the country’s central area. In Mexico City alone and the five adjacent states (among which are three of the seven entities that registered the most clandestine shots), 5,420 clandestine shots were recorded the last year, equivalent to 43% according to reported in [18].
Regarding social topics, there are positive and negative comments, at least 23%, about traffic reduction as a consequence of “gas shortage.” For instance, “#GasShortage on the bright side, there is less traffic, except near the fuel station”. The original tweet is linked in https://t.co/lXzLFL39aJ and is posted in Spanish.
On the other hand, the temporal behavior of social topics size concerning creation tweet day is shown in Figure 6. For example, the size of the topic “gas shortage” (“desabasto de Gasolina” in Spanish) increased on days 9 and 10. On January 10, the gas shortage lasted one week in Mexico (see reference [17]). The tag “other topics” represents keywords such as the names of politicians, among others.
Moreover, a social finding was obtained by experiments on data exploration using the following terms as query parameters: “steal” (“Robo”), “fuel station” (“Gasolinera in Spanish”), and “PEMEX” (visualized in Figure 5 considering the cluster size that groups between 350 and 2,000 tweets). Thus, a pattern discovered with at least 50 polarized tweets is understood to describe the long lines at fuel stations. The citizens describe lines between 1.5 and 5 kilometers in different Mexican states; for example: “2 km fuels long lines at the pumps to load gasoline, the gas shortage begins in Michoacán”. The original tweet is linked in https://t.co/Fsq804COfd and is posted in Spanish. This insight represents how people measure the effects of phenomena quantitatively and temporally.
4.2. Results of the geographic polarization distribution
The geographic polarization shows the perceptions of the citizens who suffered from the gasoline stealing crisis. Thus, Figure 7 presents a percentage estimation of the polarization considering the government’s strategies to face gasoline stealing by using a chart pie within a map, according to the crime rates.
The polarization in Mexico City and its surroundings was about 50% of positive comments (green disks) and 50% of negative comments (red disks). However, there were more negative comments than positive ones in cities with high crime rates of gasoline stealing, such as Jalisco (see Figure ??). Similarly, in Guanajuato and Puebla cities, the positive comments prevailed. In contrast, the statistics related to the impact of tweets demonstrated that positive comments generated more ’likes’ and ’shares’ than negative opinions (see Figure 7).
In addition, Figure 8 depicts the charts in which N is negative comments, NEU is neutral comments, and P refers to positive comments. On the other hand, valuable insight was that in the clusters appeared names of politicians, and it was advantageous to reveal what to explore the opinion polarization. After querying social data combined with politician names, polarization, locations, and impact of tweets data in terms of ’likes’ and ’shares’, there are comments in favor and against government strategies concerning gasoline stealing (see Figure 9). For instance, a politician commented on Twitter, "There is no lack of gasoline, the supply being regularized very soon. In Mexico City, let us not fall for panic purchases!". The original tweet is linked in https://t.co/JjNGIHmKqw and is posted in Spanish. This comment was classified as positive and produced 4,172 likes and 1,795 shares.
In contrast, the comment: "We have been almost 20 years of fuel stealing, it is convenient to open the pipelines for another month and fill the market with gasoline before reaching a national paralysis". Meanwhile, an intelligent strategy is defined to prevent theft. The original tweet is linked in https://t.co/IA0xHyD8Hx and is posted in Spanish. It could be classified as a negative comment that produced 2,132 likes and 753 shares.
As it is observed, Figure 9 displays the geographic distribution of ‘shares’ and ‘likes’ related to the crime rates. For example, 15,592 shares and 35,826 likes were published in Mexico City with low crime rates, contrasting with the 12,194 ‘shares’ and 26,650 ‘likes’ in the State of México with average crime rates.
Thus, Michoacán and Querétaro cities lack relevant information to compute the analysis, as visualized in the heat map in Figure 9.
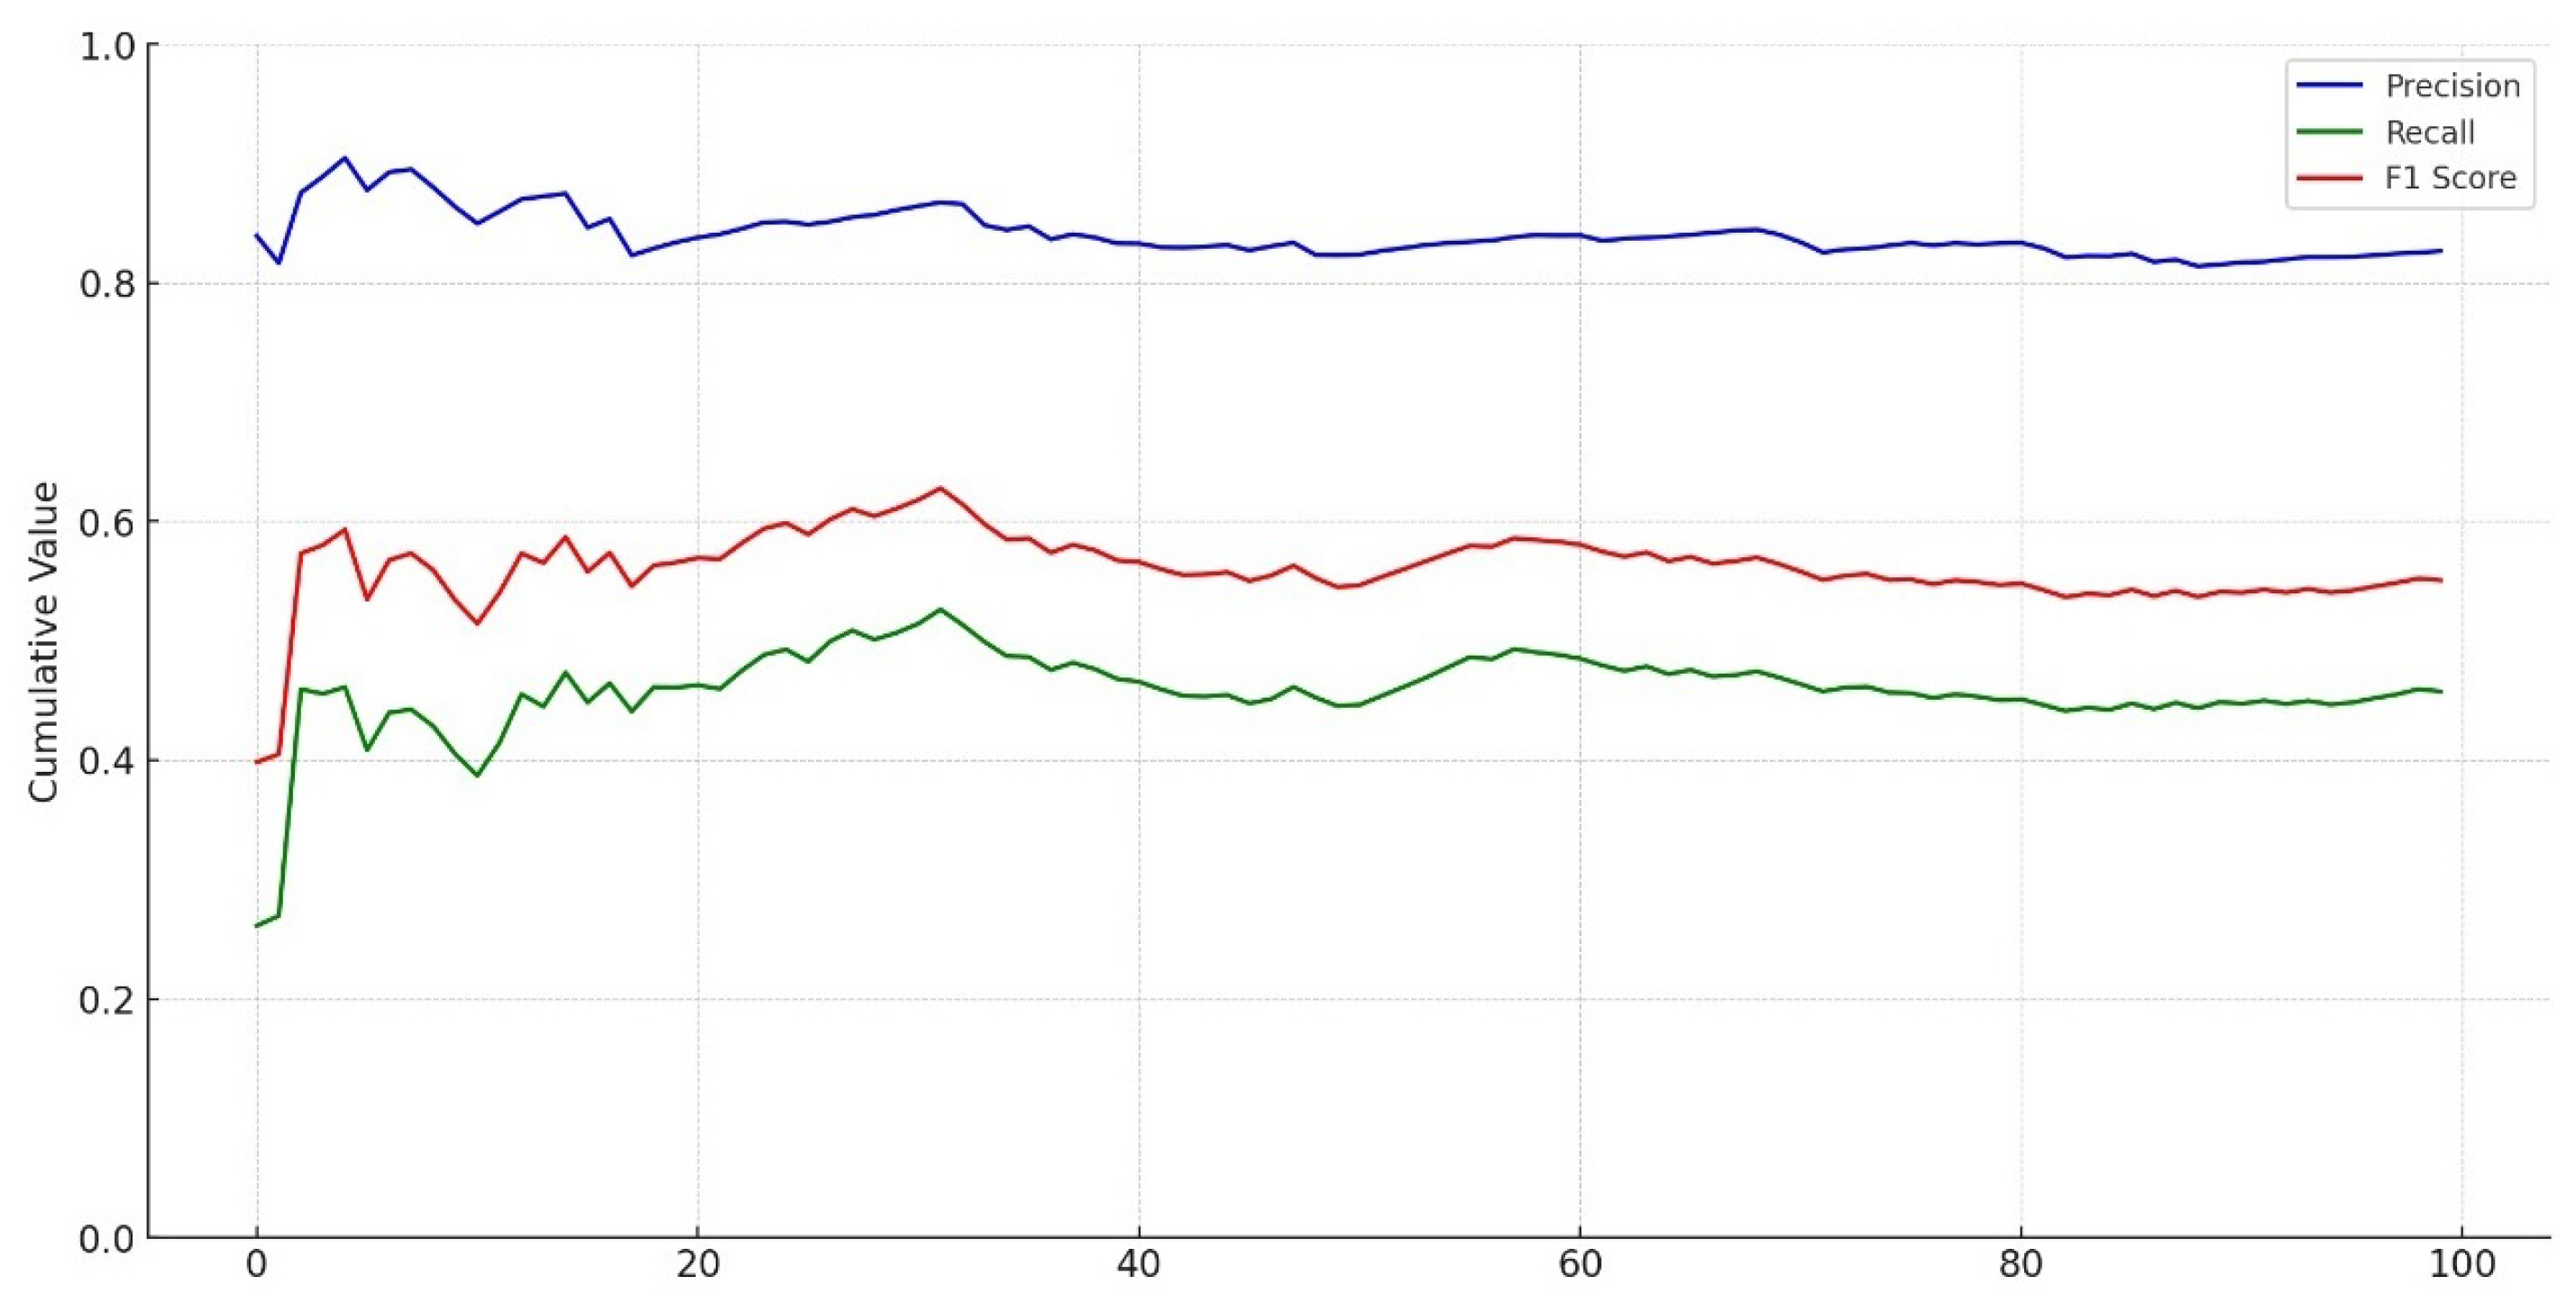
Figure 10 describes an evaluation of text sentiment classification. The training data set was improved by increasing the labeled tweets that contain enriched negative and positive narratives of gasoline stealing narratives. The precision rate is above 80 percent, indicating a high proficiency level in classifying tweets into sentiment categories. A Recall of 0.45 signifies that the model is less effective in detecting all true positive, negative, or neutral cases. In other words, it needs to include a significant portion of tweets belonging to these categories.
The high precision suggests that the model exhibits a relatively low rate of false positives, implying that it tends to be accurate using text deep learning algorithms when categorizing a tweet as positive, negative, or neutral.
5. Conclusions and future work
The proposed methodology is oriented toward analyzing data related to gasoline stealing and mapping distributions of geographic and social topics. Moreover, geographic polarization is proposed to discover social insights explaining the gasoline stealing crisis in January 2019 in Mexico. The novel contribution is focused on proposing a framework that is composed of six stages: (1) The K-means clustering process, (2) Sentiment analysis, (3) Data analysis, (4) Data mining process, (5) The mapping location, and 6) Data correlation. The dataset was integrated by different sources, such as textual information provided by Twitter streaming, geographic locations, and open data for spatiotemporal exploration. The dataset contains 24,317 tweets and 384 records of gasoline-stealing events since 2019.
Thus, discovered insights explain the case study at a regional level with social topics, findings events, and regional polarization. Moreover, subjective social data can provide helpful information, not only complaints. The extraction of tweets covered the period of the gasoline crisis and its central locations. In this sense, identifying key terms to extract data is a non-trivial task. Texting clustering helps detect terms for iterative extraction data extraction and exploration.
On the other hand, mapping regional topics allow for finding special events that describe the social effects during the gasoline crisis in specific time and regions, facilitating the definition of data mining and SQL operations. Moreover, historical trends correlation from open data and news media information lead to understanding regional social topics. While mapping social polarization provides regional patterns.
In this work, location and time are central components to understanding the behavior of gasoline stealing in Mexico. The spatial correlation among open and social data allows us to discover social insights, and natural language processing techniques allow us to deal with the regional semantics that describe social media locations of gasoline stealing.
In future work, we will develop real-time data analysis on social trends by applying entity recognition, grammar trees for linguistics, and deep learning clustering approaches on advanced natural language processing and spatial analysis methods.
Author Contributions
Conceptualization, R.Z.-F. and F.M.-R.; methodology, M.T.-R and R.Q.; software, V.S.B.-V. and R.Q.; validation, M.T.-R. and R.Z.-F.; formal analysis, F.M.-R. and M.T.-R; investigation, R.Q. and V.S.B.-V; resources, R.Z.-F. and F.M.-R.; data curation, M.T.-R. and V.S.B.-V.; writing—original draft preparation, R.Z.-F; writing—review and editing, M.T.-R. and G.G.; visualization, V.S.B.-V. and G.G.; supervision, F.M.-R.; project administration, J.O.J.-G.; funding acquisition, F.M.-R. and J.O.J.-G. All authors have read and agreed to the published version of the manuscript.
Funding
Work partially sponsored by Instituto Politécnico Nacional under grants 20230655 and 20230454. It also is sponsored by Consejo Nacional de Humanidades, Ciencias y Tecnologías (CONAHCYT) under grant 7051, and Secretaría de Educación, Ciencia, Tecnología e Innovación (SECTEI-182-23).
Institutional Review Board Statement
Not applicable.
Data Availability Statement
Not applicable.
Acknowledgments
We are thankful to the reviewers for their invaluable and constructive feedback that helped improve the quality of this paper.
Conflicts of Interest
The authors declare no conflict of interest.
References
- Banda, K.K.; Cluverius, J. Elite polarization, party extremity, and affective polarization. Electoral Studies 2018, 56, 90–101. [Google Scholar] [CrossRef]
- Rathnayake, C.; Suthers, D.D. ‘Enclaves of exposure’: A conceptual viewpoint to explore cross-ideology exposure on social network sites. The Social Science Journal 2019, 56, 145–155. [Google Scholar] [CrossRef]
- Nohuddin, P.N.; Coenen, F.; Christley, R.; Setzkorn, C.; Patel, Y.; Williams, S. Finding “interesting” trends in social networks using frequent pattern mining and self organizing maps. Knowledge-Based Systems 2012, 29, 104–113. [Google Scholar] [CrossRef]
- Jancsics, D. Interdisciplinary perspectives on corruption. Sociology Compass 2014, 8, 358–372. [Google Scholar] [CrossRef]
- Lan, X.; Li, W. Swiss watch cycles: Evidence of corruption during leadership transition in China. Journal of Comparative Economics 2018, 46, 1234–1252. [Google Scholar] [CrossRef]
- Ferraresi, M.; Kotsogiannis, C.; Rizzo, L. Decentralization and fuel subsidies. Energy Economics 2018, 74, 275–286. [Google Scholar] [CrossRef]
- Silvestre, H.C.; Gomes, R.C.; Lamba, J.R.; Correia, A.M. Implementation of Brazil’s energy policy through the national oil company: From institutional chaos to strategic order. Energy policy 2018, 119, 87–96. [Google Scholar] [CrossRef]
- Lee, C.; Shin, J.; Hong, A. Does social media use really make people politically polarized? Direct and indirect effects of social media use on political polarization in South Korea. Telematics and Informatics 2018, 35, 245–254. [Google Scholar] [CrossRef]
- Ali, M.; Azab, N.; Sorour, M.K.; Dora, M. Integration vs. polarisation among social media users: Perspectives through social capital theory on the recent Egyptian political landscape. Technological Forecasting and Social Change 2019, 145, 461–473. [Google Scholar] [CrossRef]
- Støttrup, J.G.; Kokkalis, A.; Brown, E.J.; Olsen, J.; Andersen, S.K.; Pedersen, E.M. Harvesting geo-spatial data on coastal fish assemblages through coordinated citizen science. Fisheries Research 2018, 208, 86–96. [Google Scholar] [CrossRef]
- Yao, H.; Xiong, M.; Zeng, D.; Gong, J. Mining multiple spatial–temporal paths from social media data. Future Generation Computer Systems 2018, 87, 782–791. [Google Scholar] [CrossRef]
- Sinclair, M.; Ghermandi, A.; Moses, S.A.; Joseph, S. Recreation and environmental quality of tropical wetlands: A social media based spatial analysis. Tourism Management 2019, 71, 179–186. [Google Scholar] [CrossRef]
- Caverlee, J.; Cheng, Z.; Sui, D.Z.; Kamath, K.Y. Towards Geo-Social Intelligence: Mining, Analyzing, and Leveraging Geospatial Footprints in Social Media. IEEE Data Eng. Bull. 2013, 36, 33–41. [Google Scholar]
- Srivastava, A.N.; Sahami, M. Text mining: Classification, clustering, and applications; CRC press, 2009. [Google Scholar]
- Aggarwal, C.C.; Aggarwal, C.C. Mining text data; Springer, 2015. [Google Scholar]
- Miranda, C.A.; Rodriguez, R.C.; Zagal-Flores, R. Arquitectura Web para análisis de sentimientos en Facebook con enfoque semántico. Res. Comput. Sci. 2014, 75, 59–69. [Google Scholar] [CrossRef]
- Specia, M. Long lines and guarded fuel: Mexico’s gas crisis, explained. The New York Times 2019. [Google Scholar]
- Peschard Mariscal, J.; Salazar Rebolledo, M.G.; Olea Gómez, O.A. ¿ Qué sabemos del robo de combustible en México? Claroscuros de un delito que no cede. Revista mexicana de ciencias políticas y sociales 2021, 66, 245–280. [Google Scholar] [CrossRef]
Figure 1.
The proposed methodology.
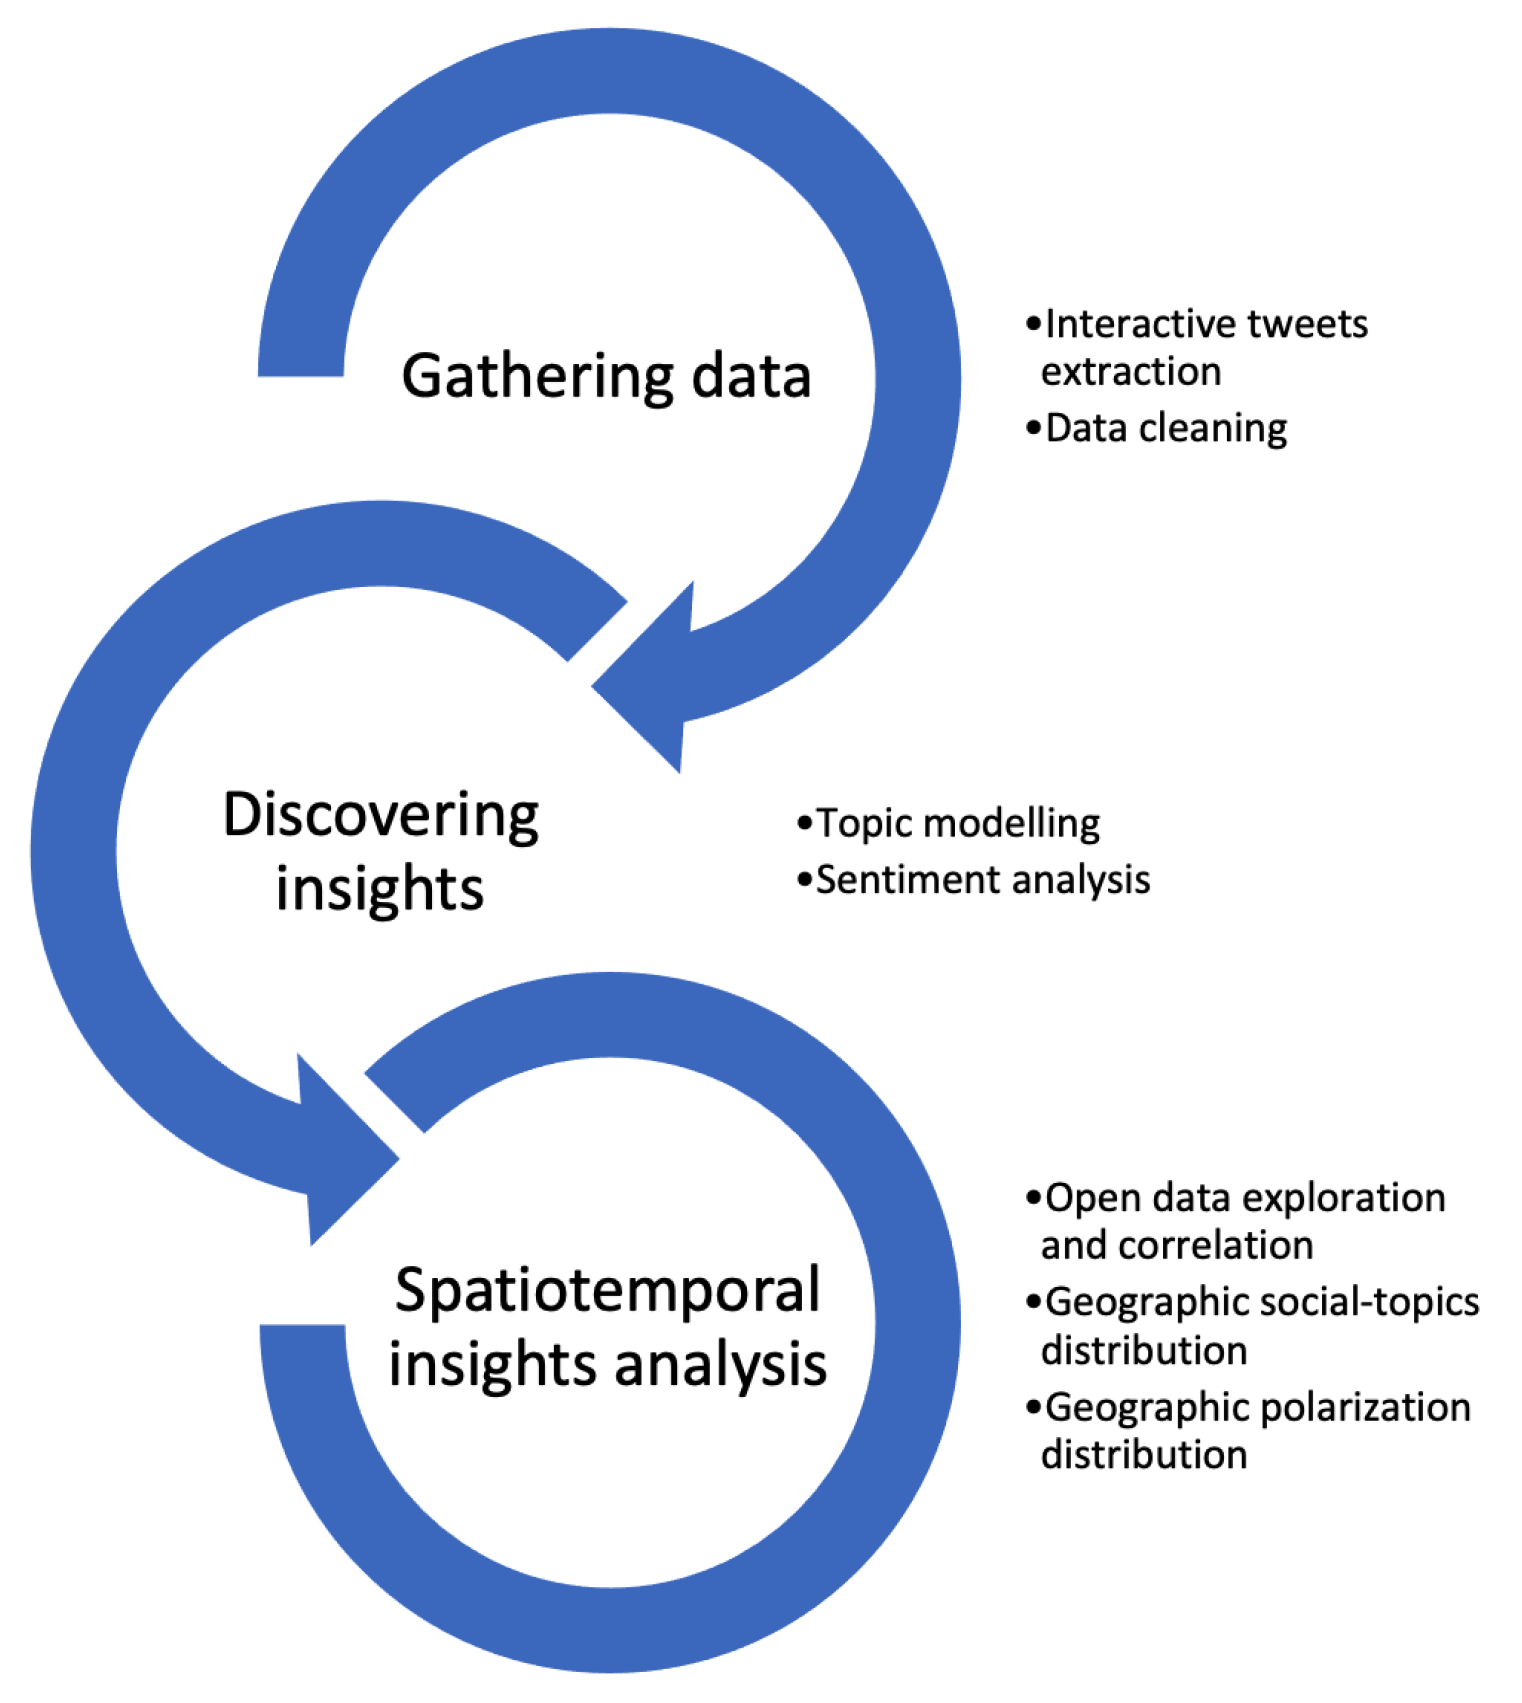
Figure 2.
Relevant terms in Spanish represented by a cloud of words.
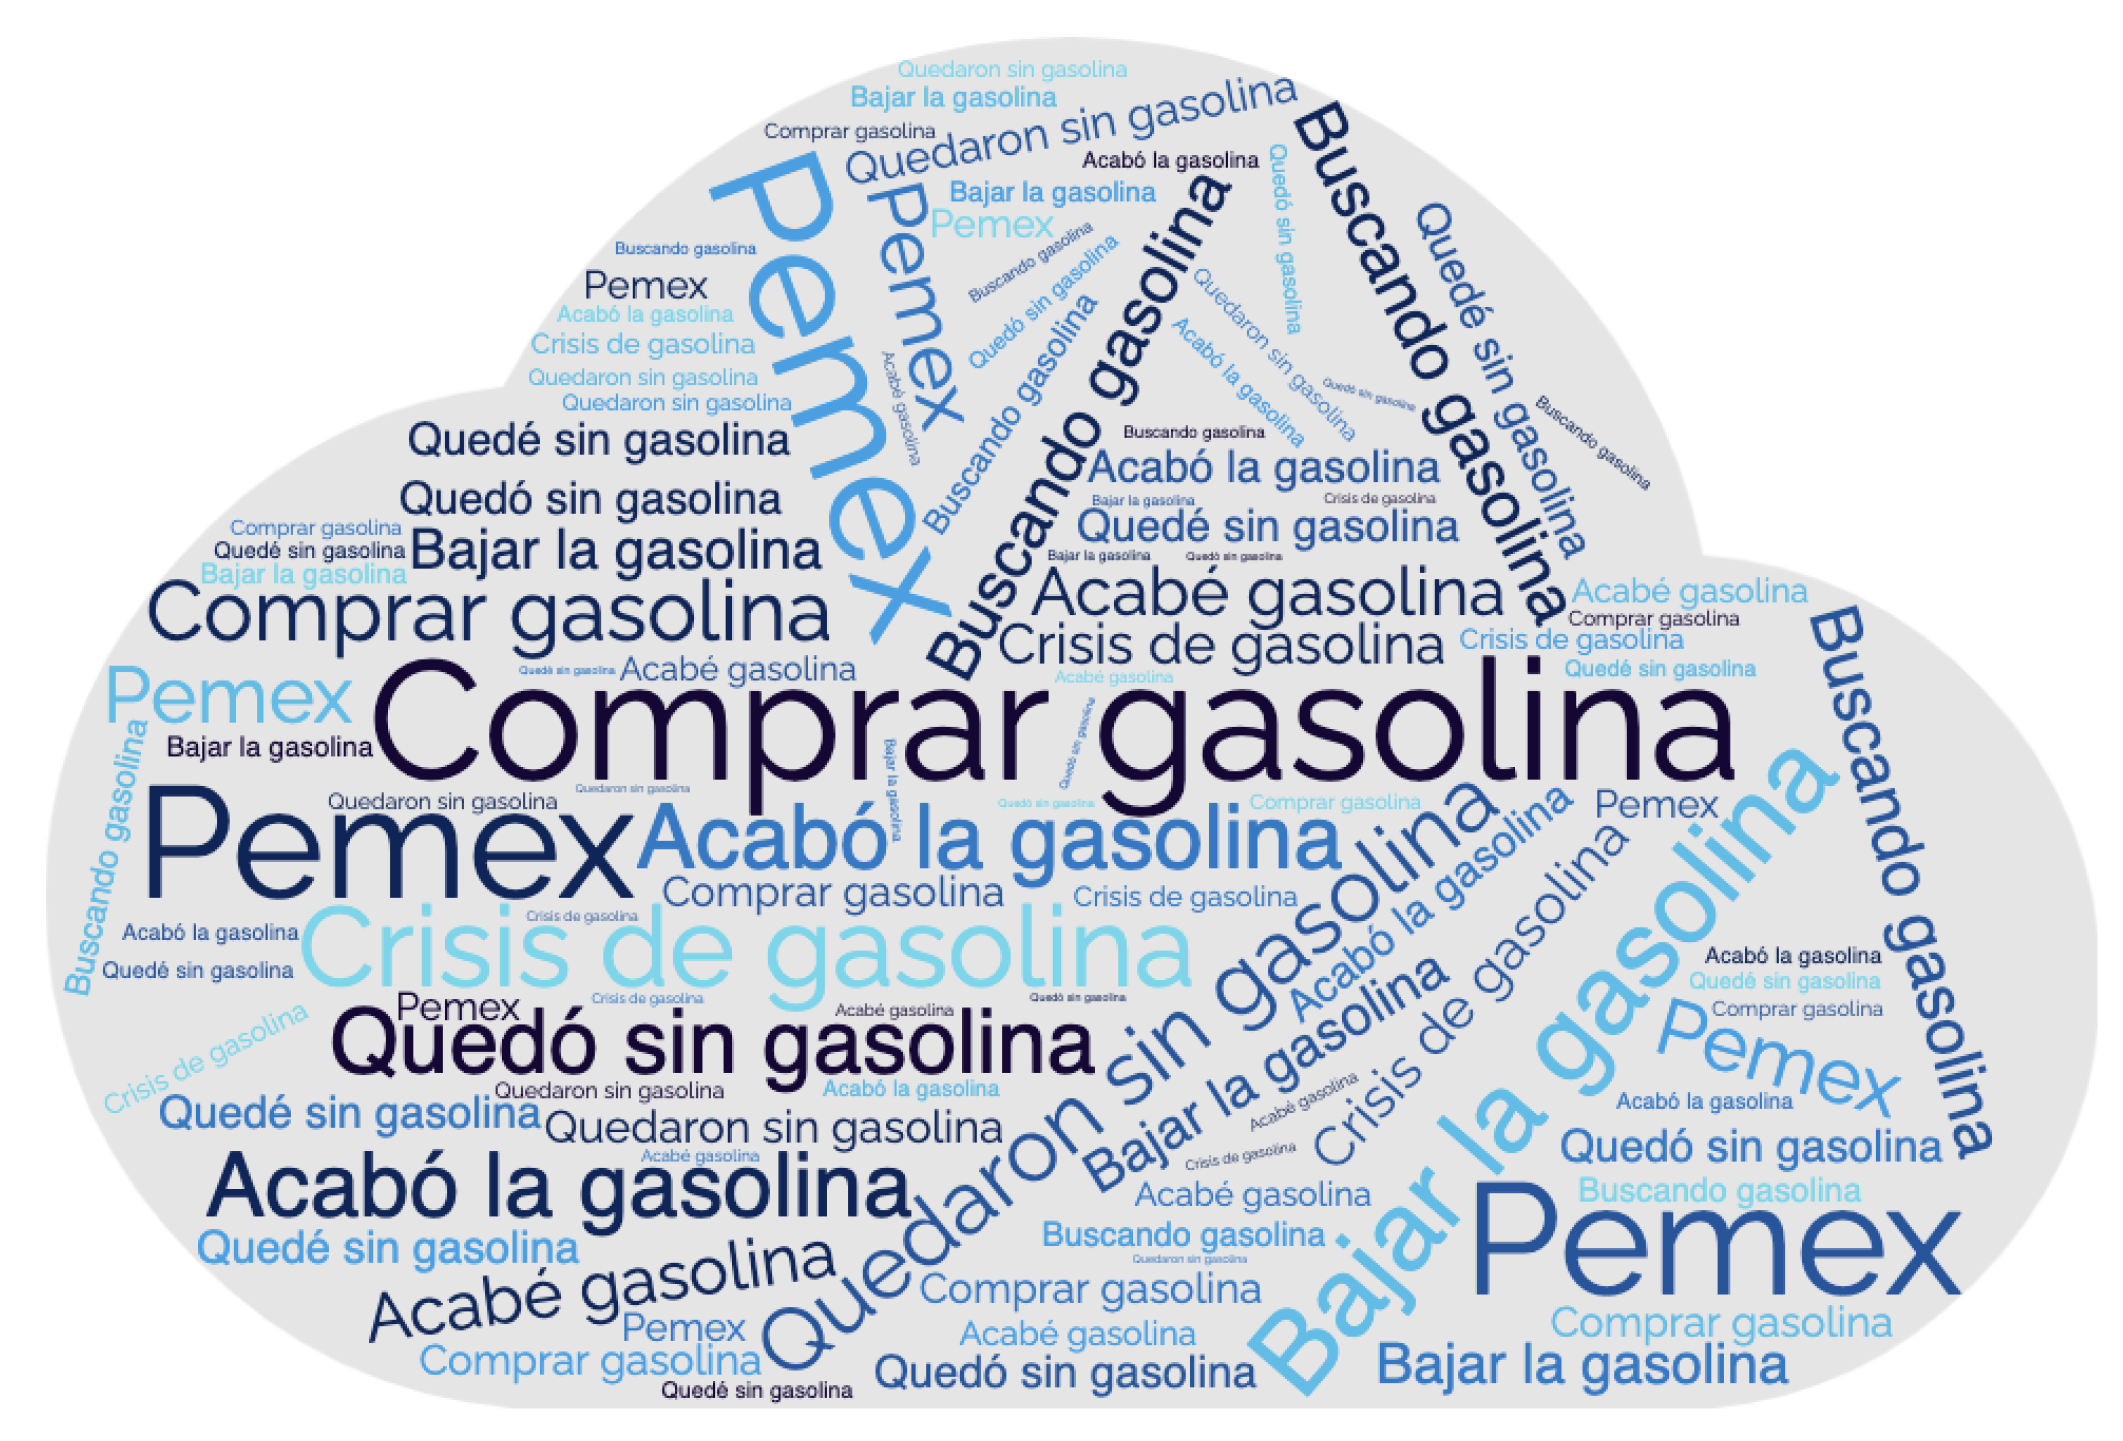
Figure 3.
Social topics discovered concerning the gasoline stealing crime events.
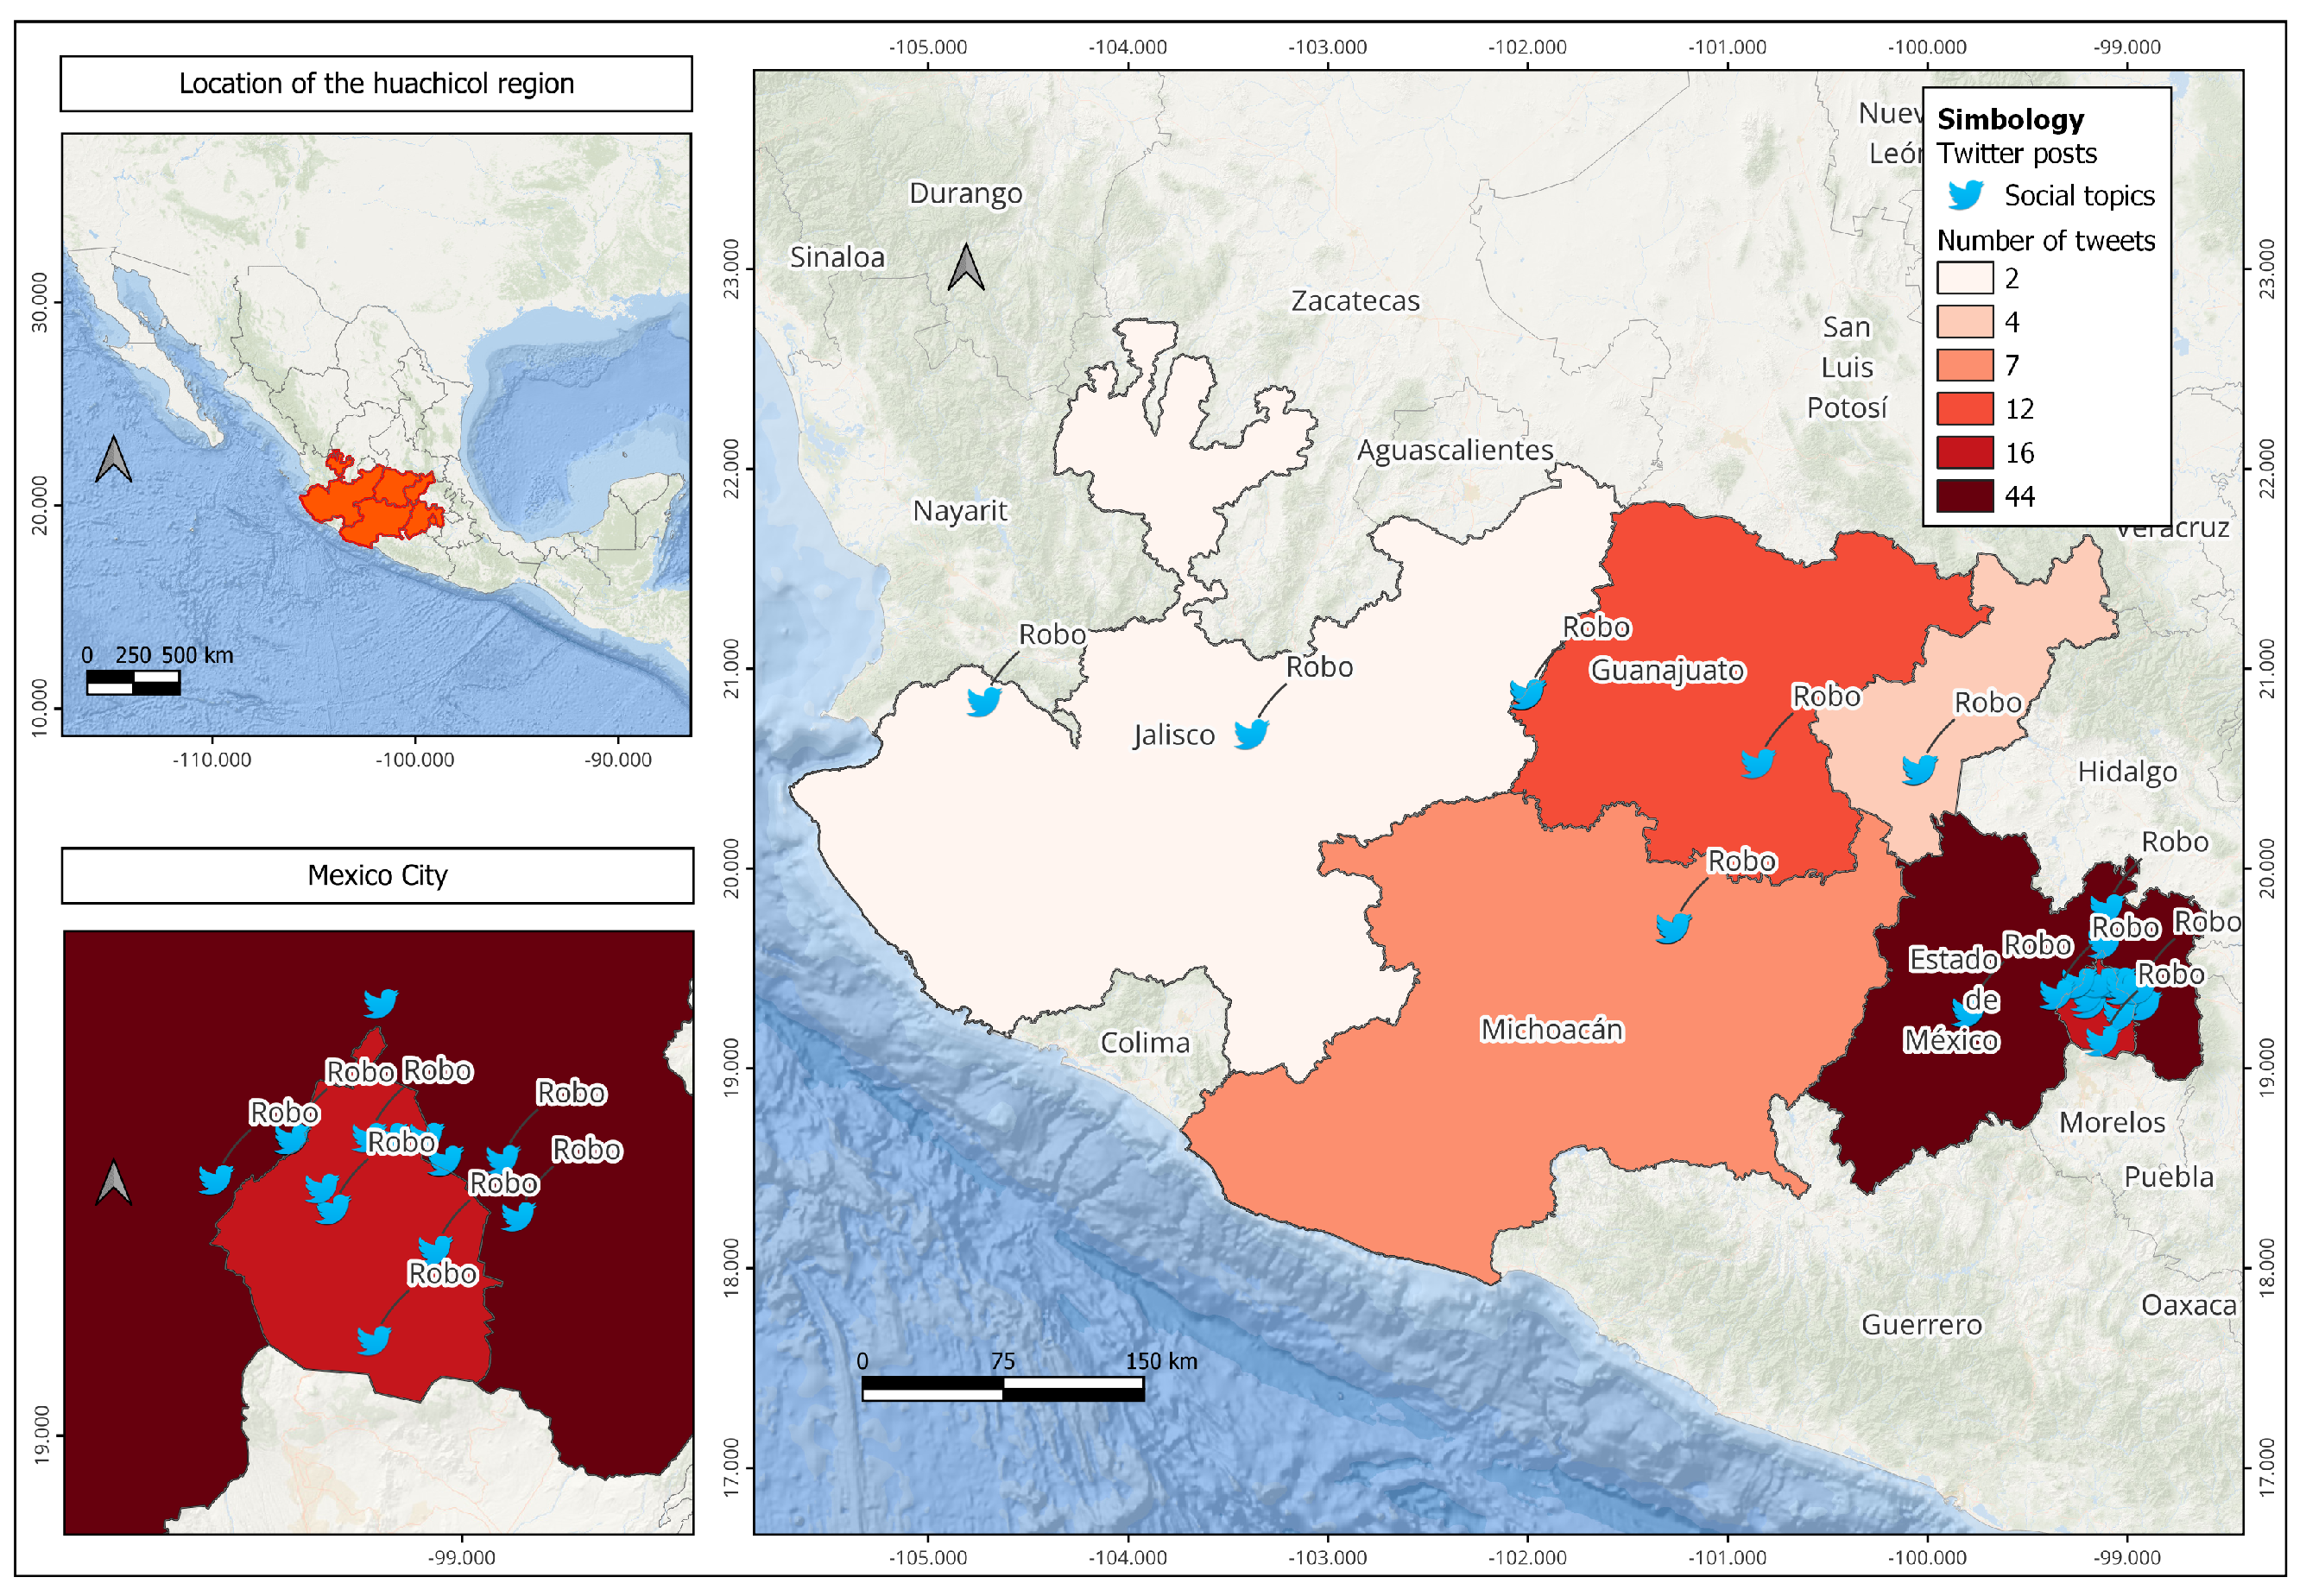
Figure 4.
Distribution of gasoline stealing reports in 2018 and gas stations registered in 2018.
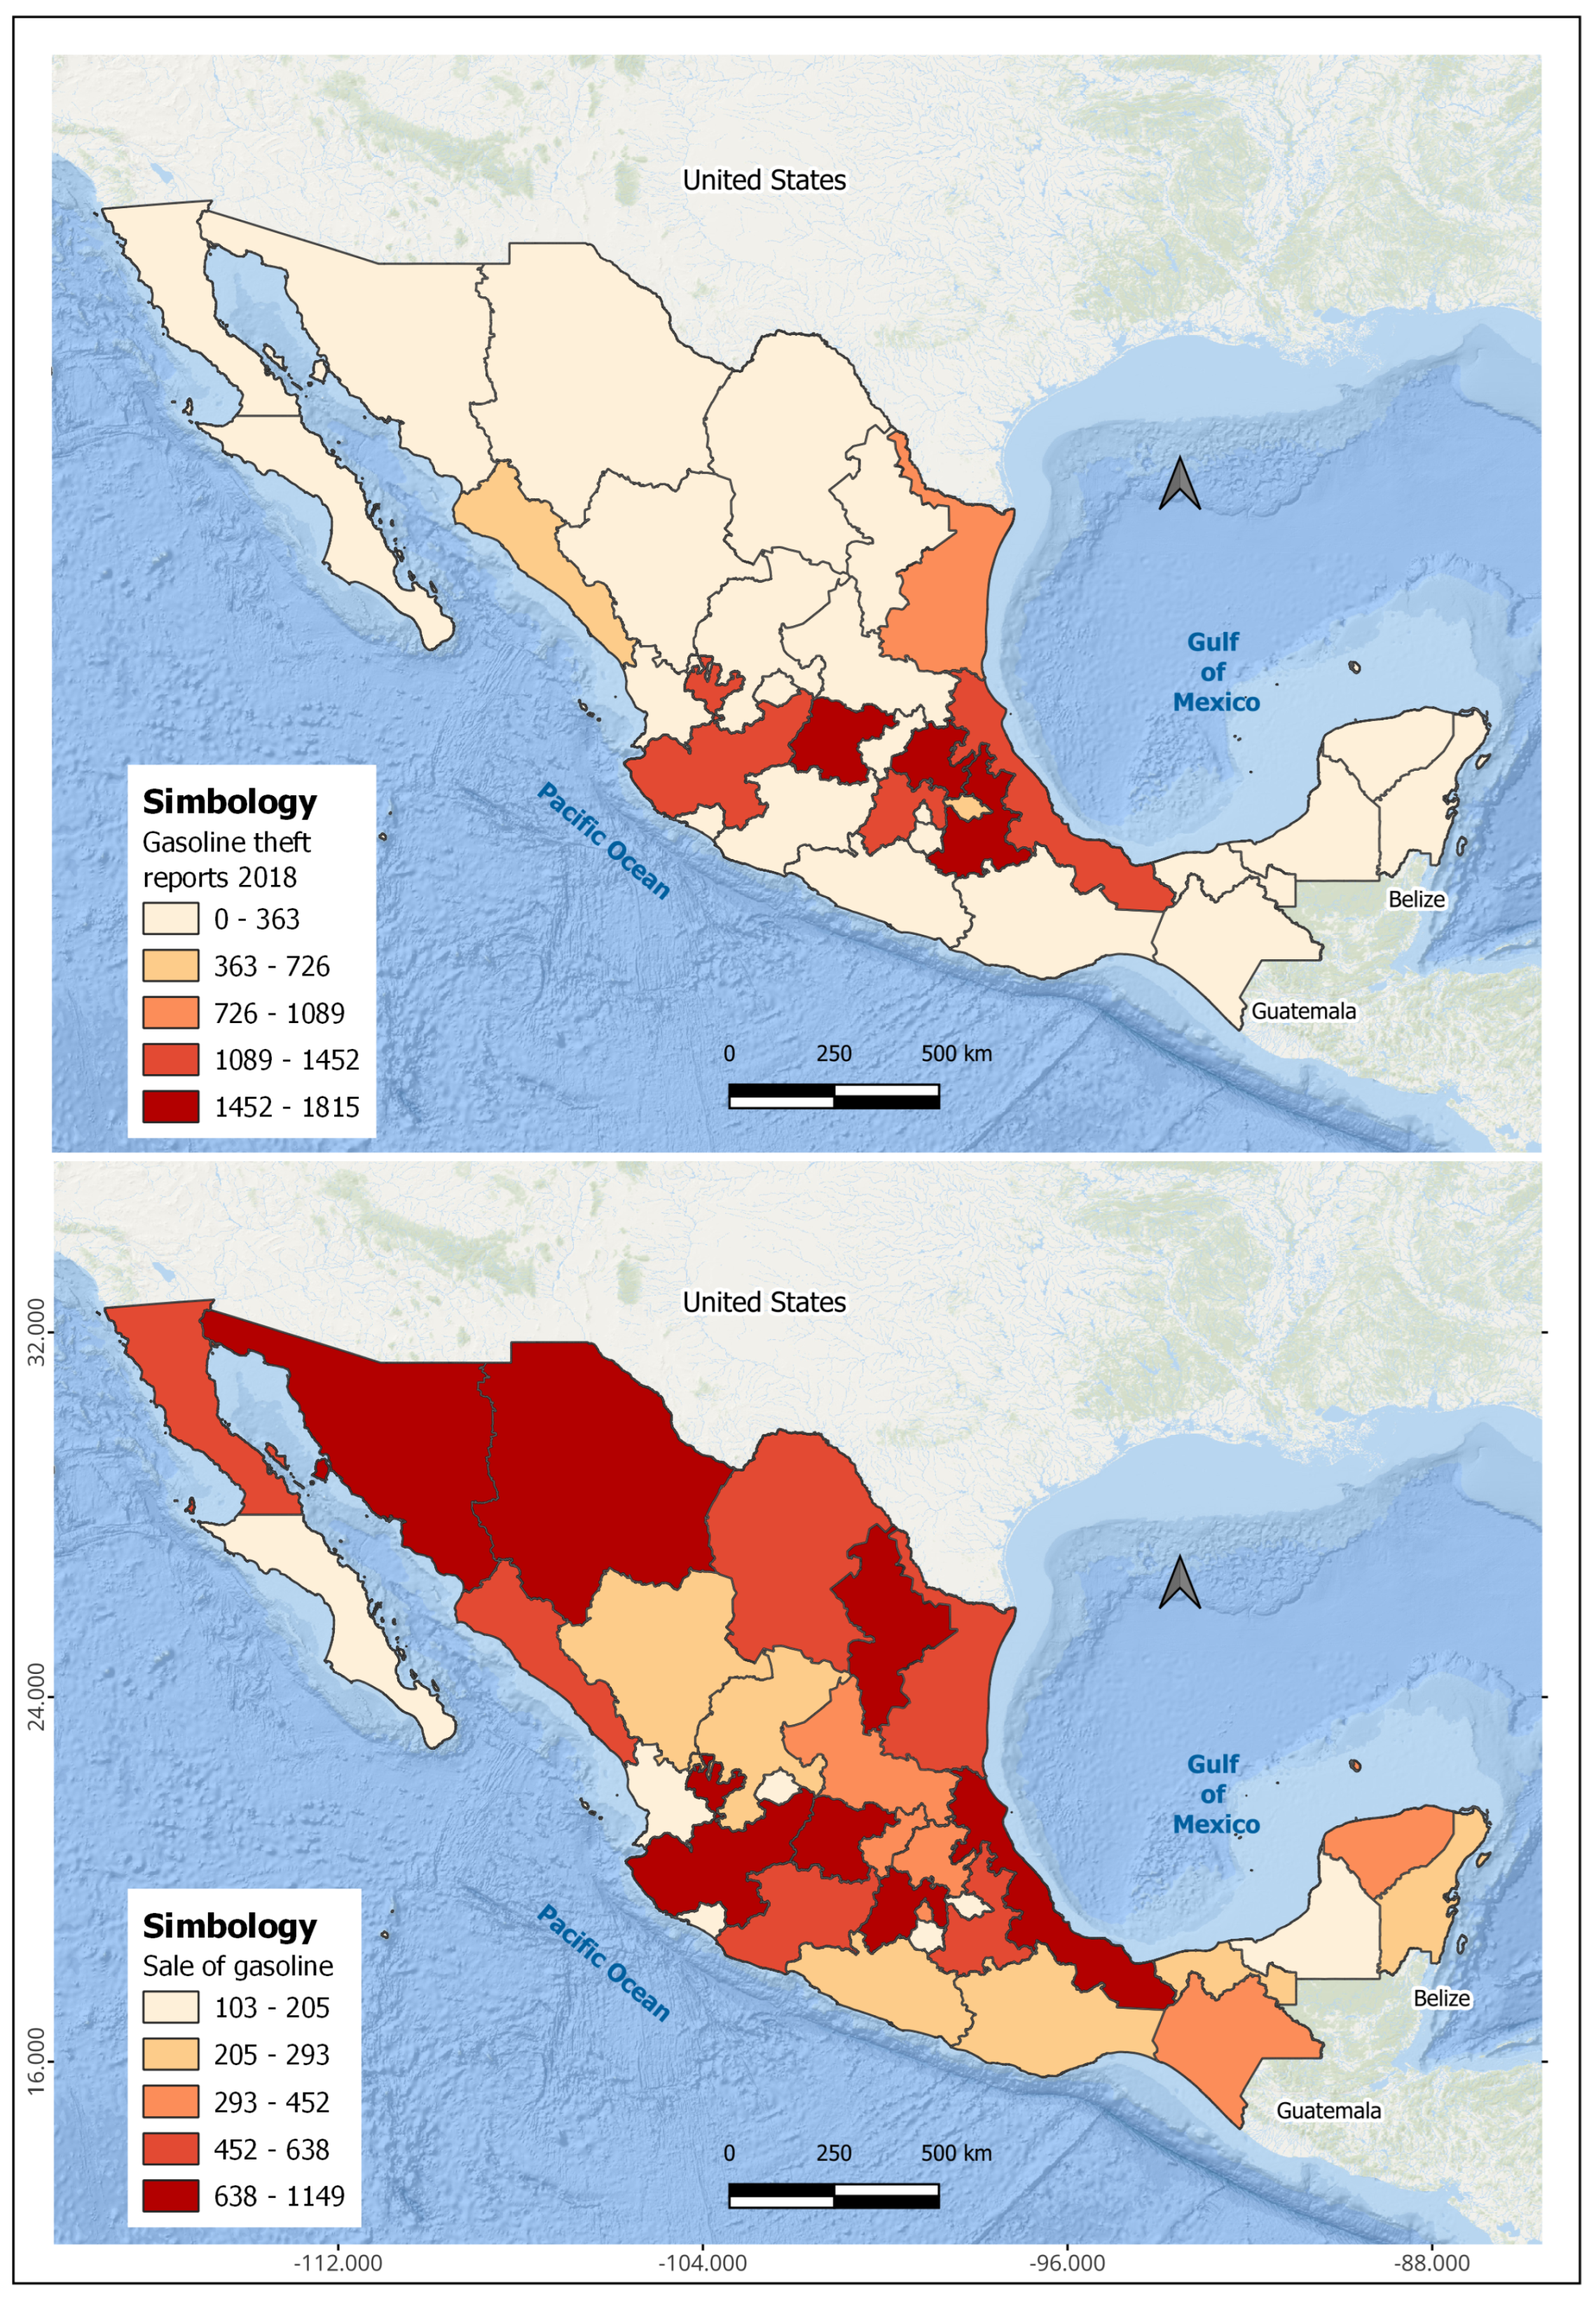
Figure 5.
Extended visualization of discovered social topics in Spanish by cities in Mexico.
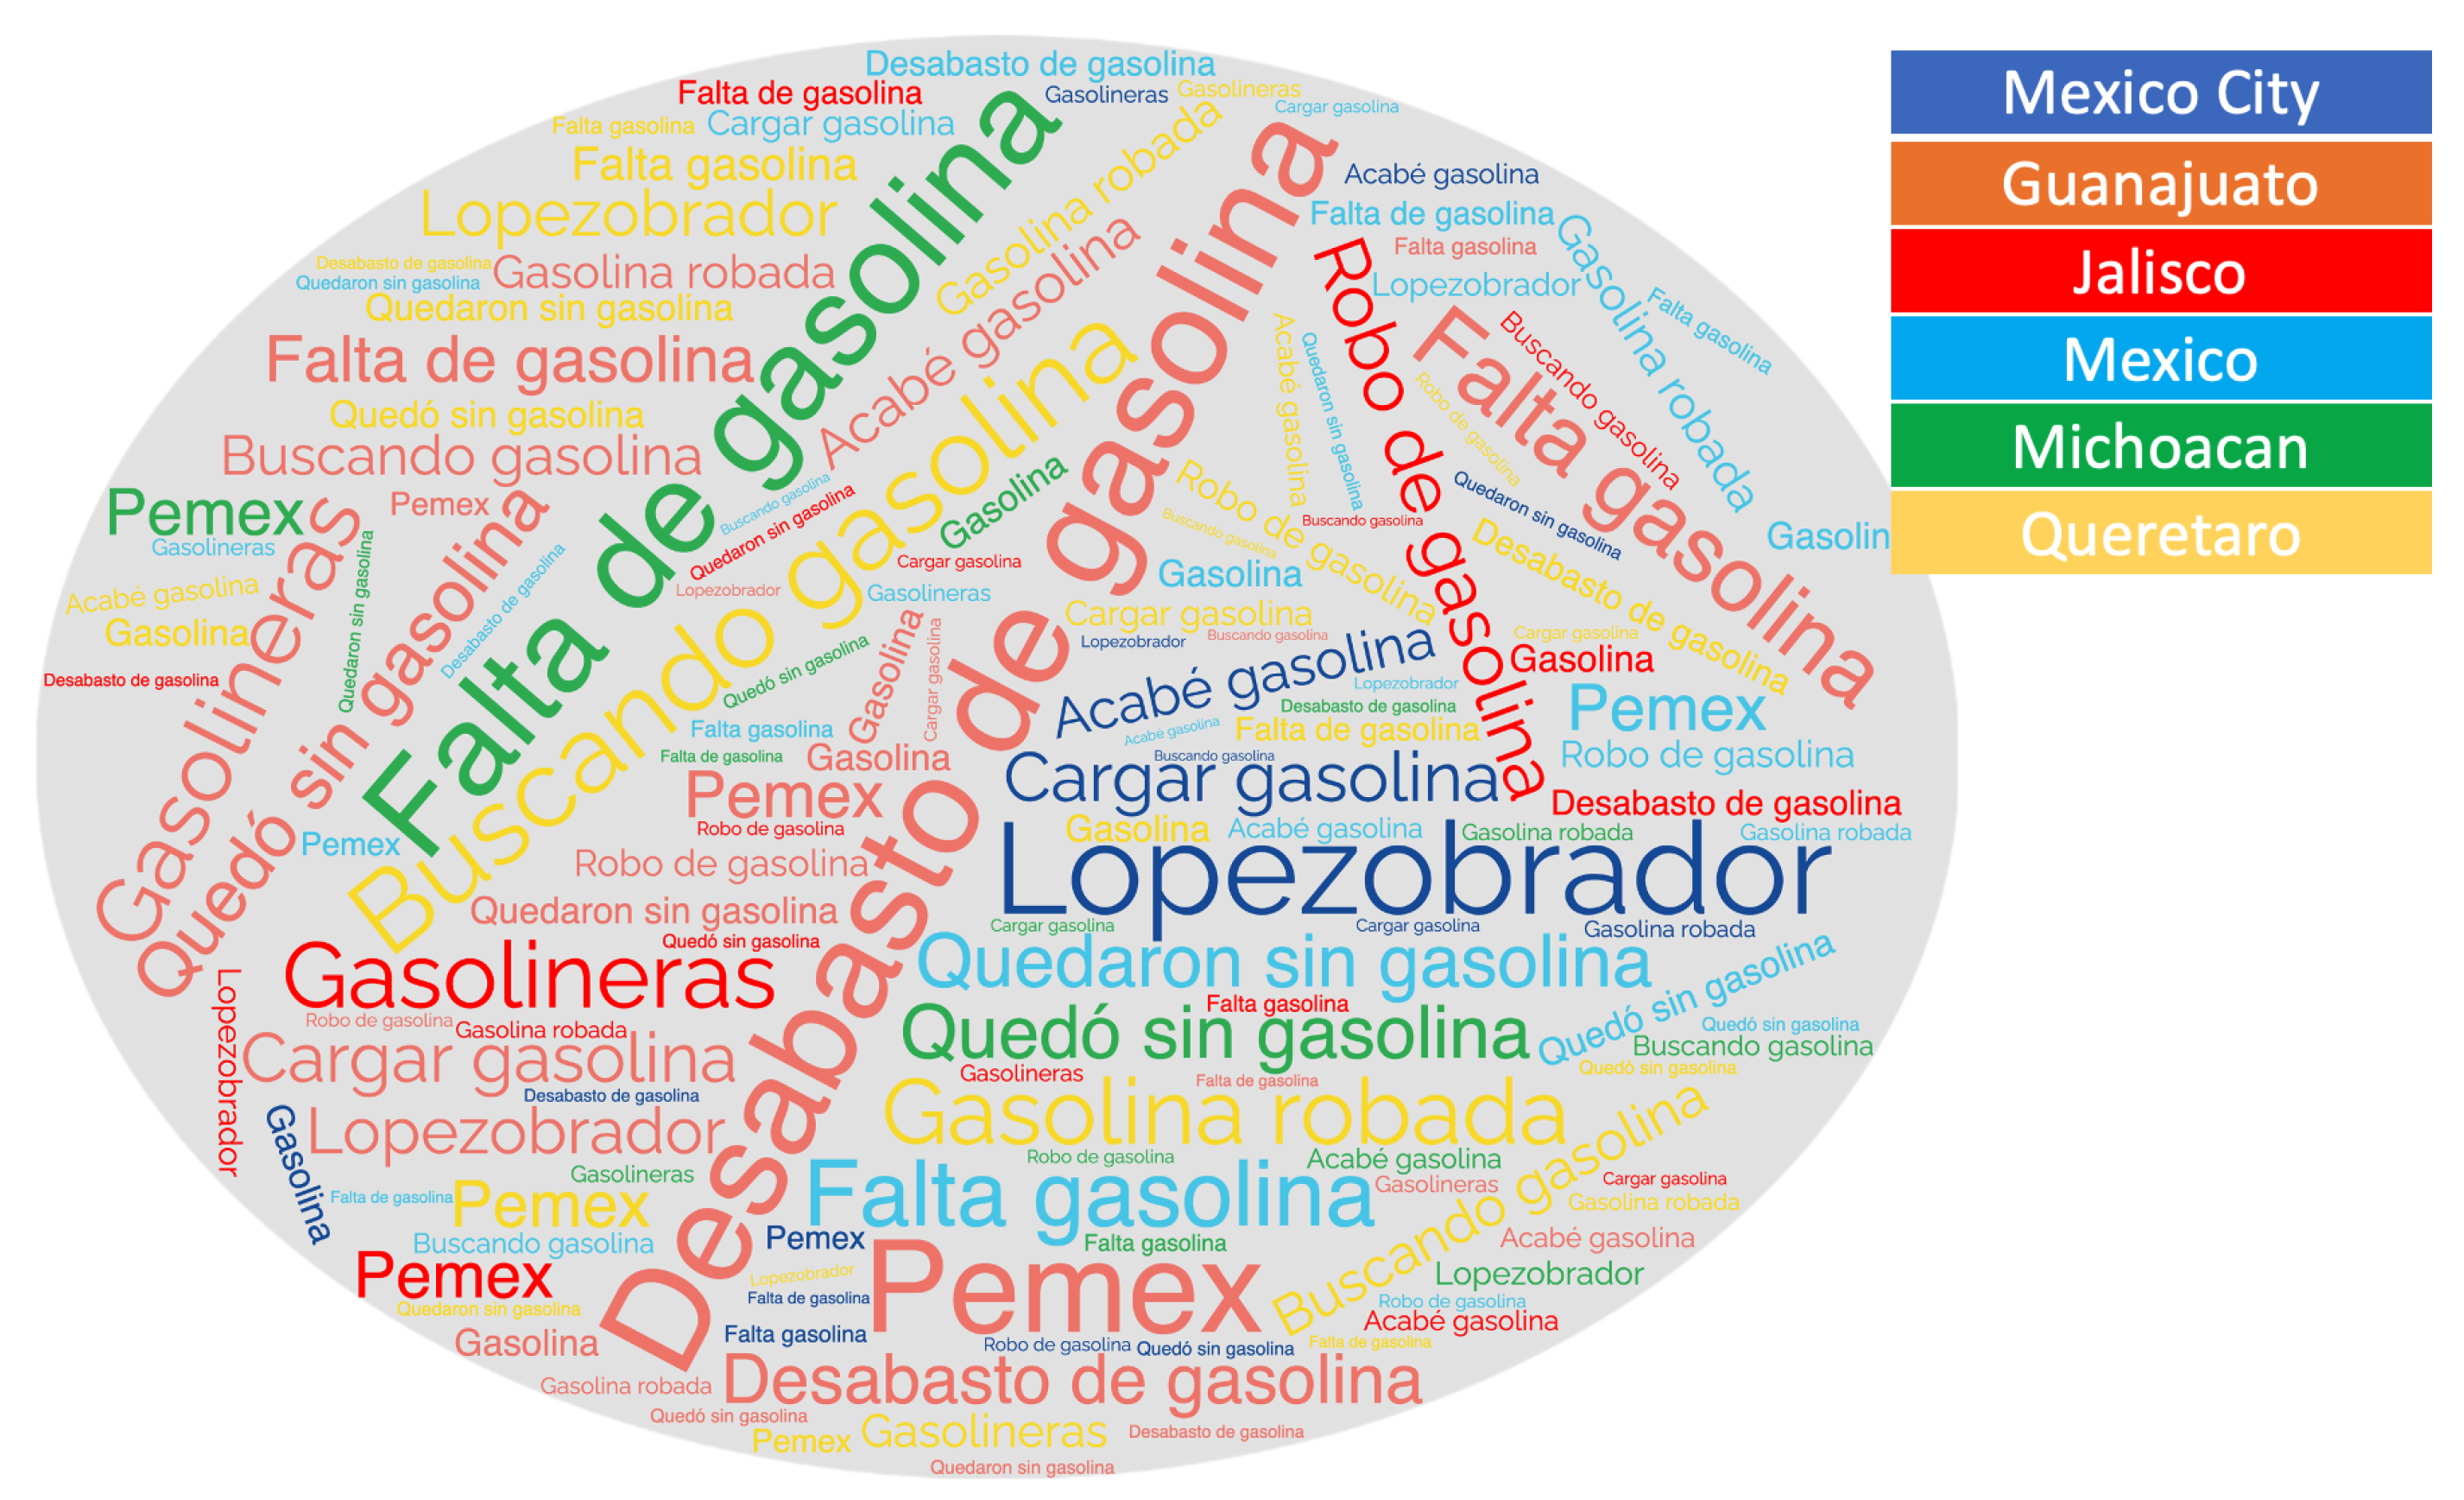
Figure 6.
Time emerging topics in the center of Mexico (cluster size vs. tweet creation day).
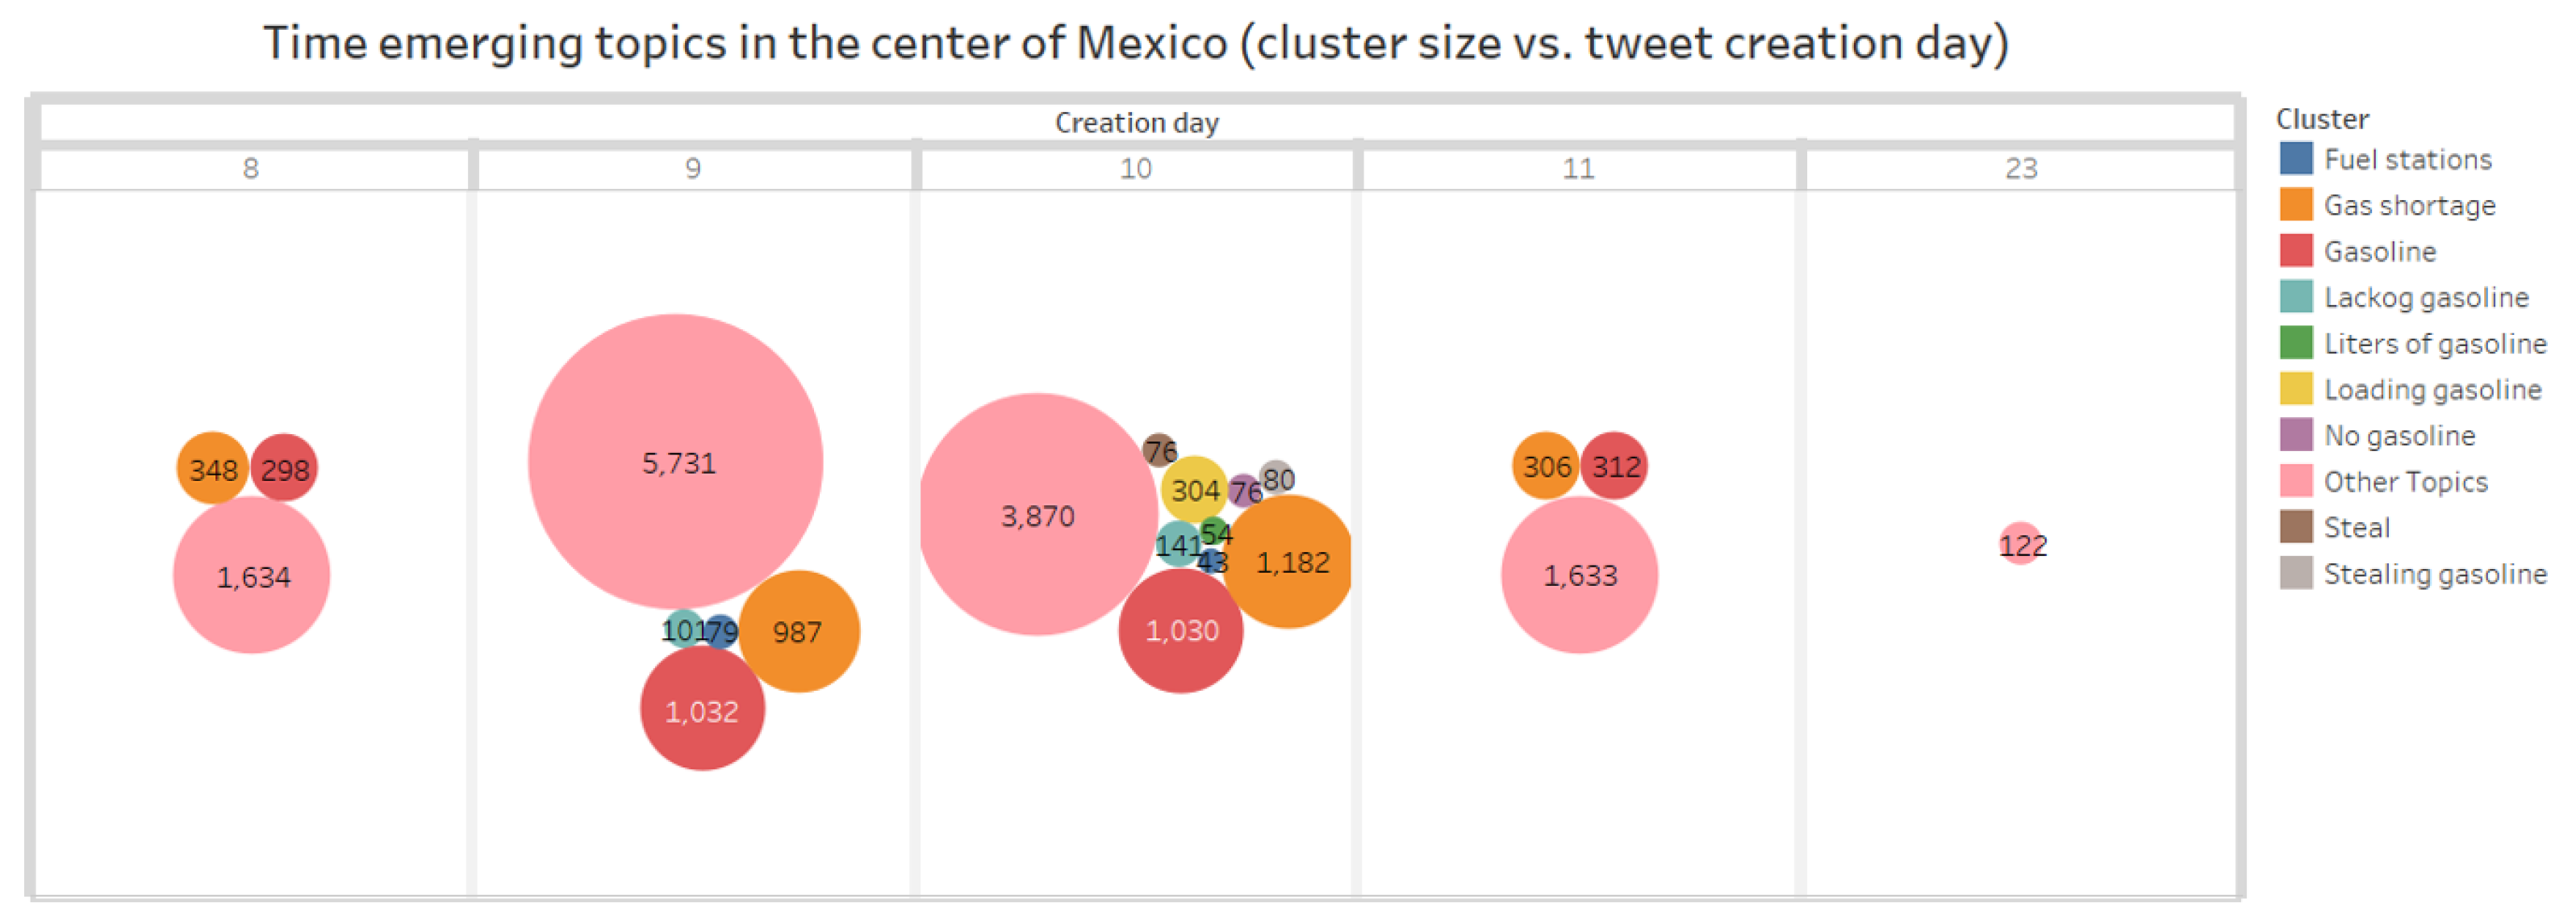
Figure 7.
Spatial polarization distribution in the most affecting Mexican states.
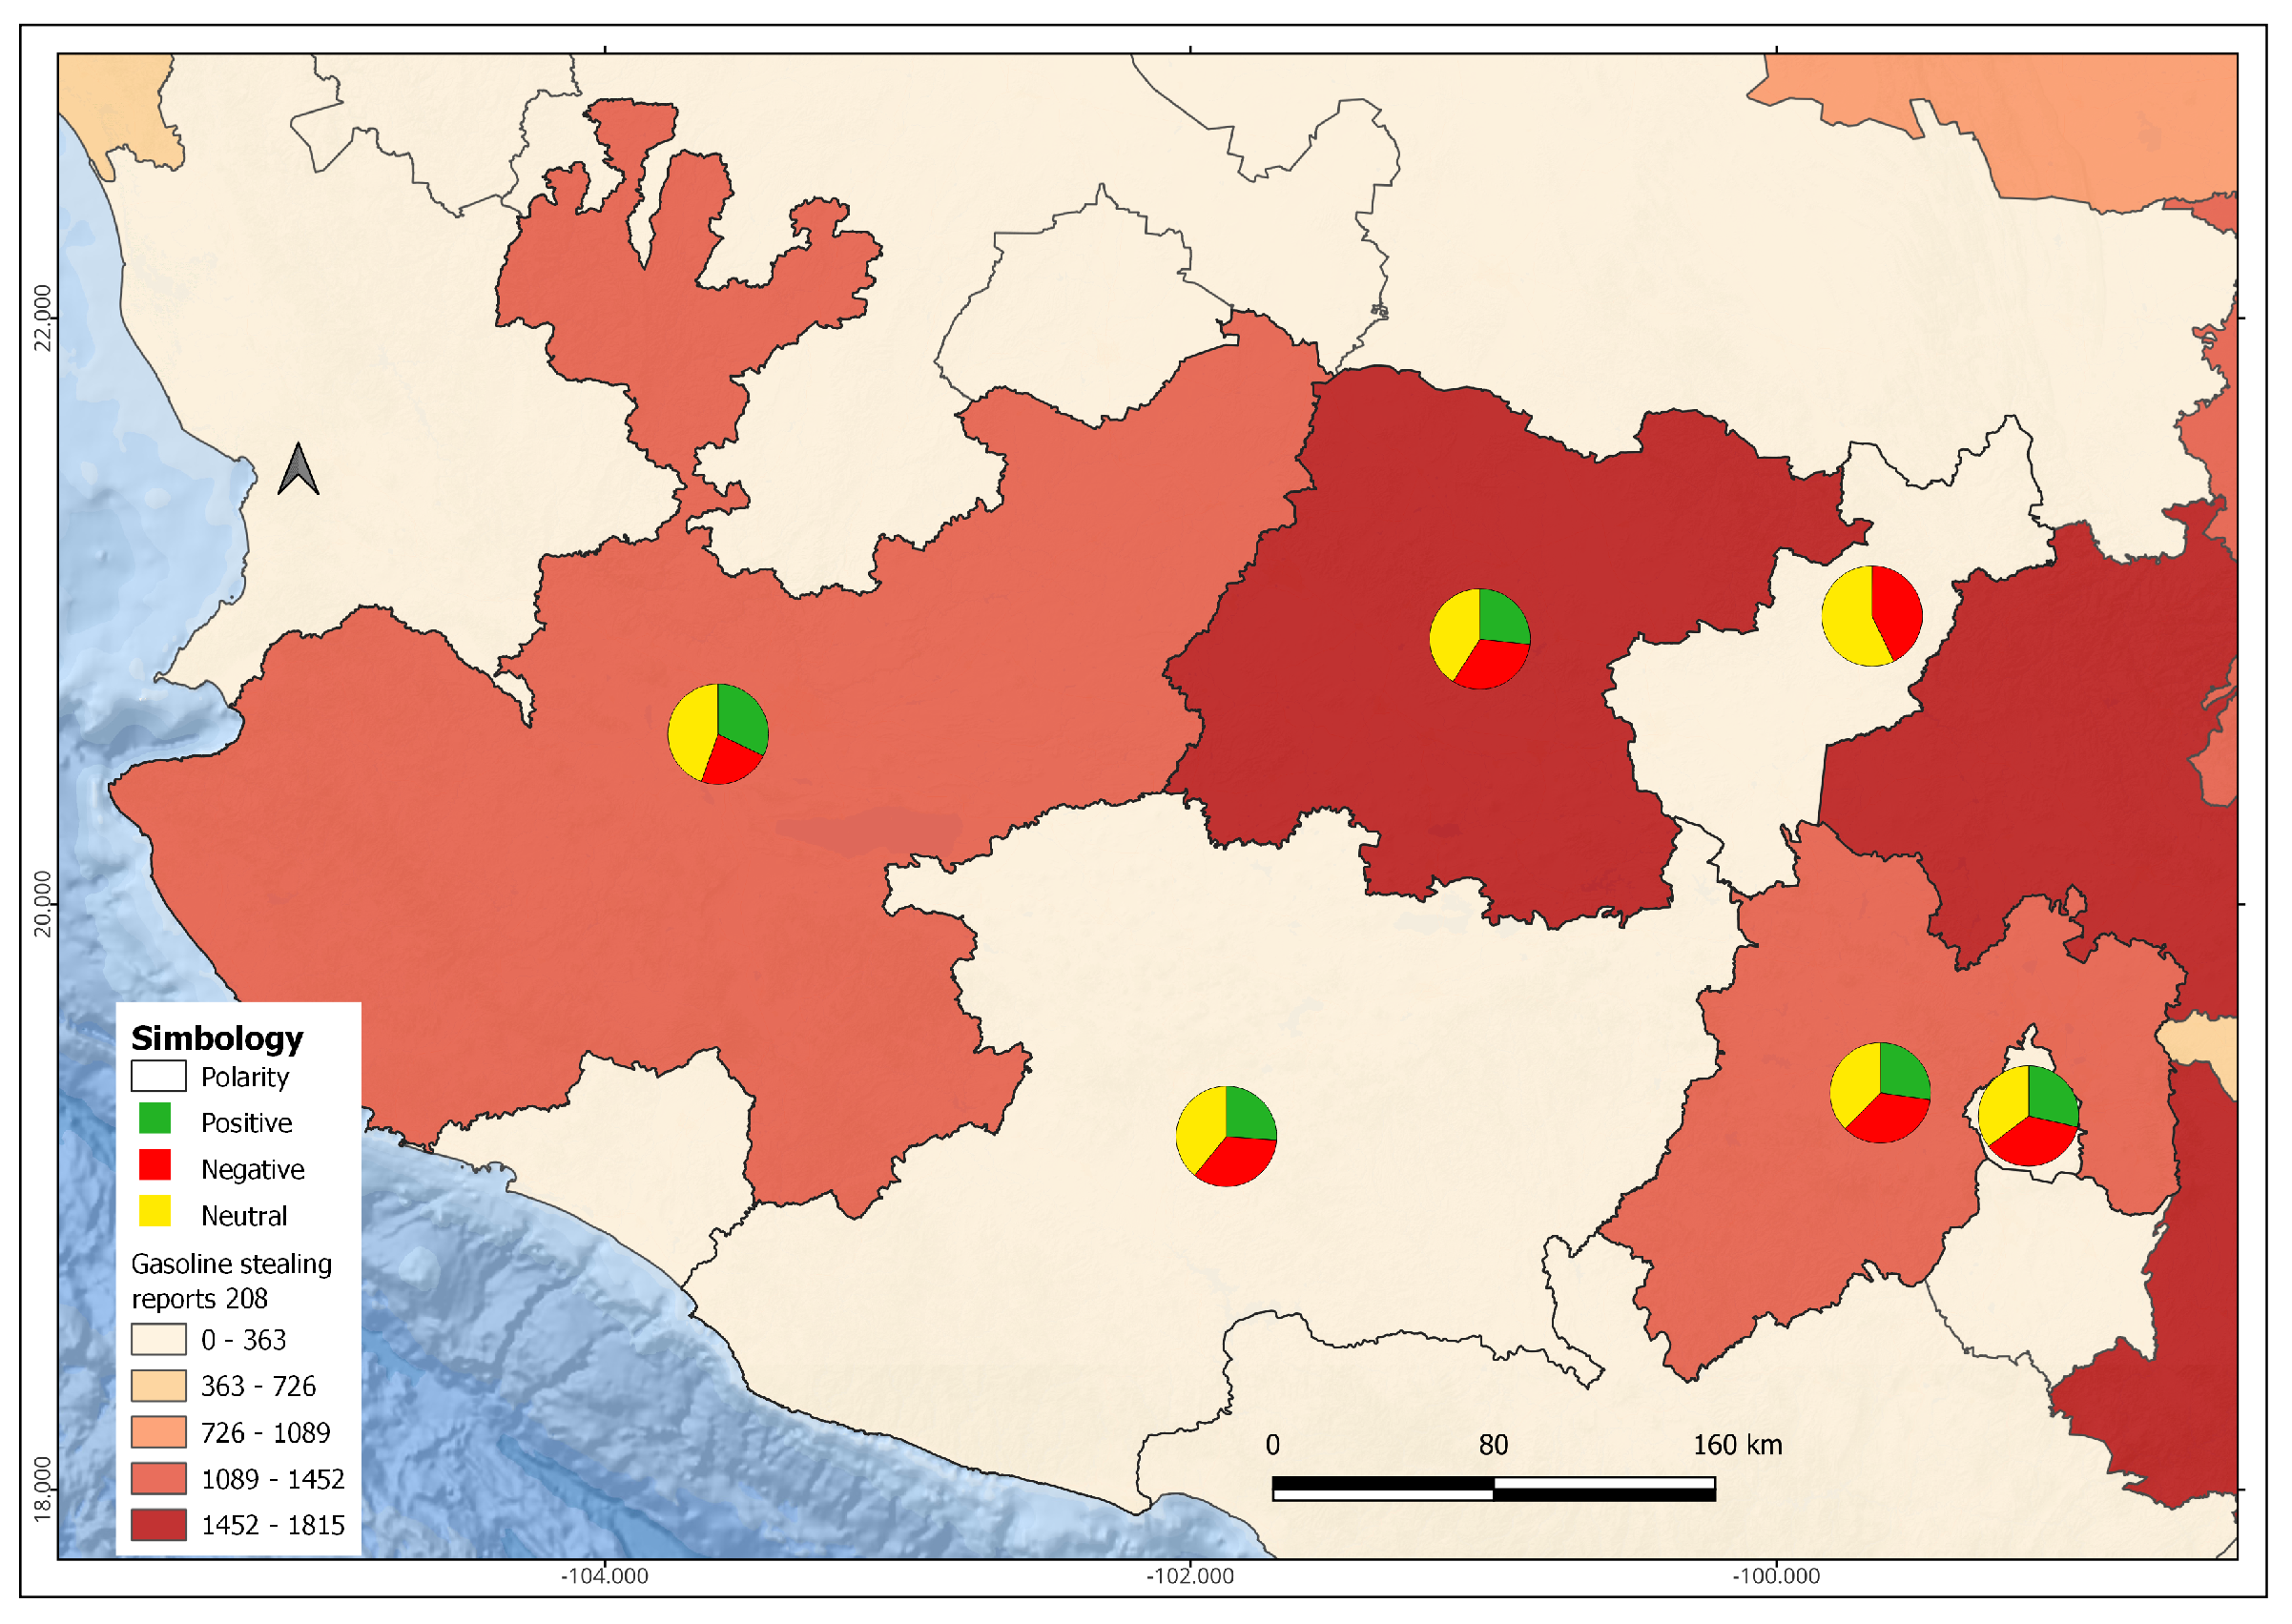
Figure 8.
Statistics of the extracted tweets related to the polarization of likes and shares.
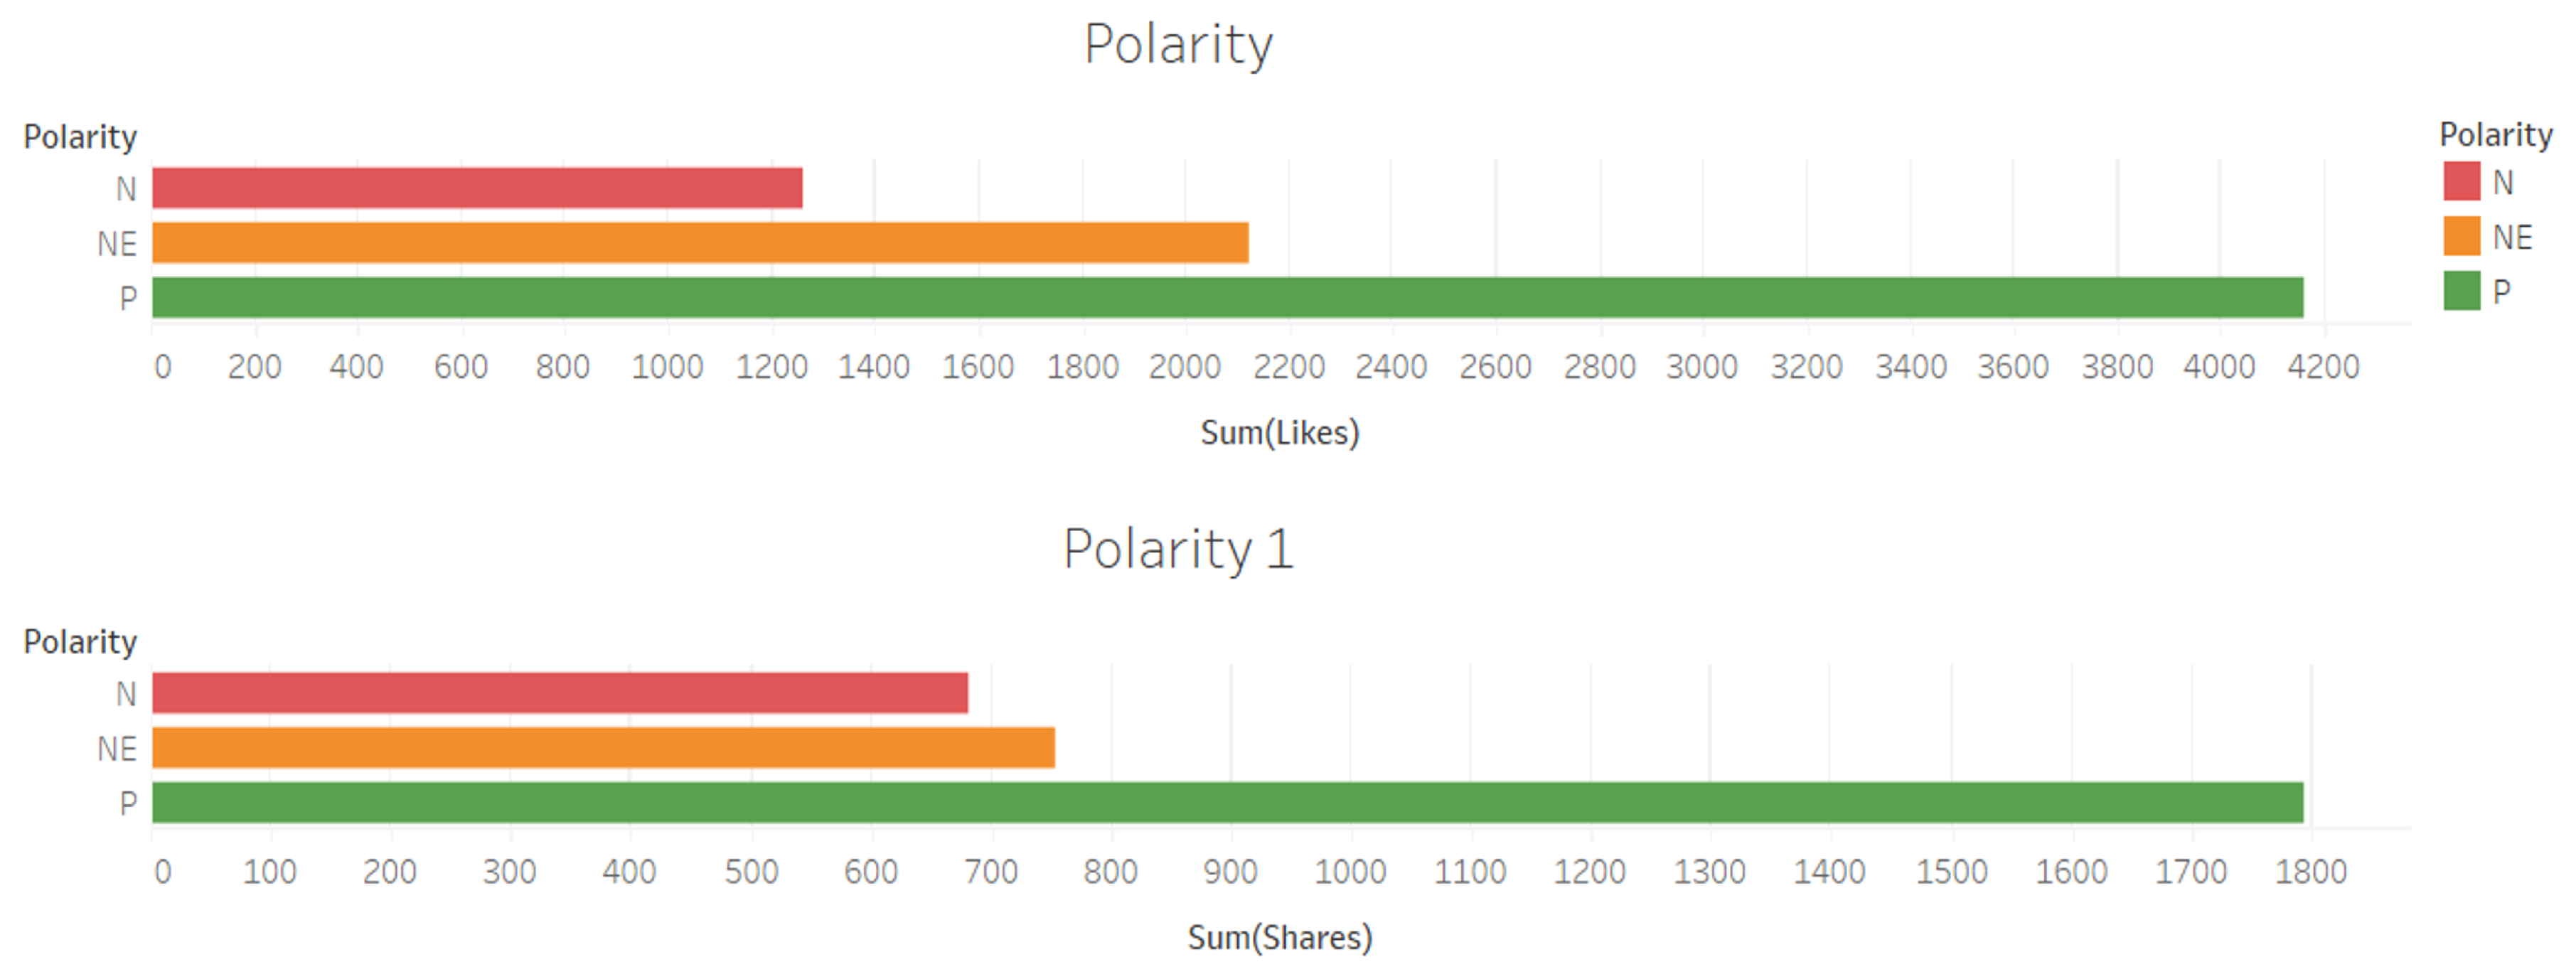
Figure 9.
Heat map related to the comparison of likes and shares per Mexican states.
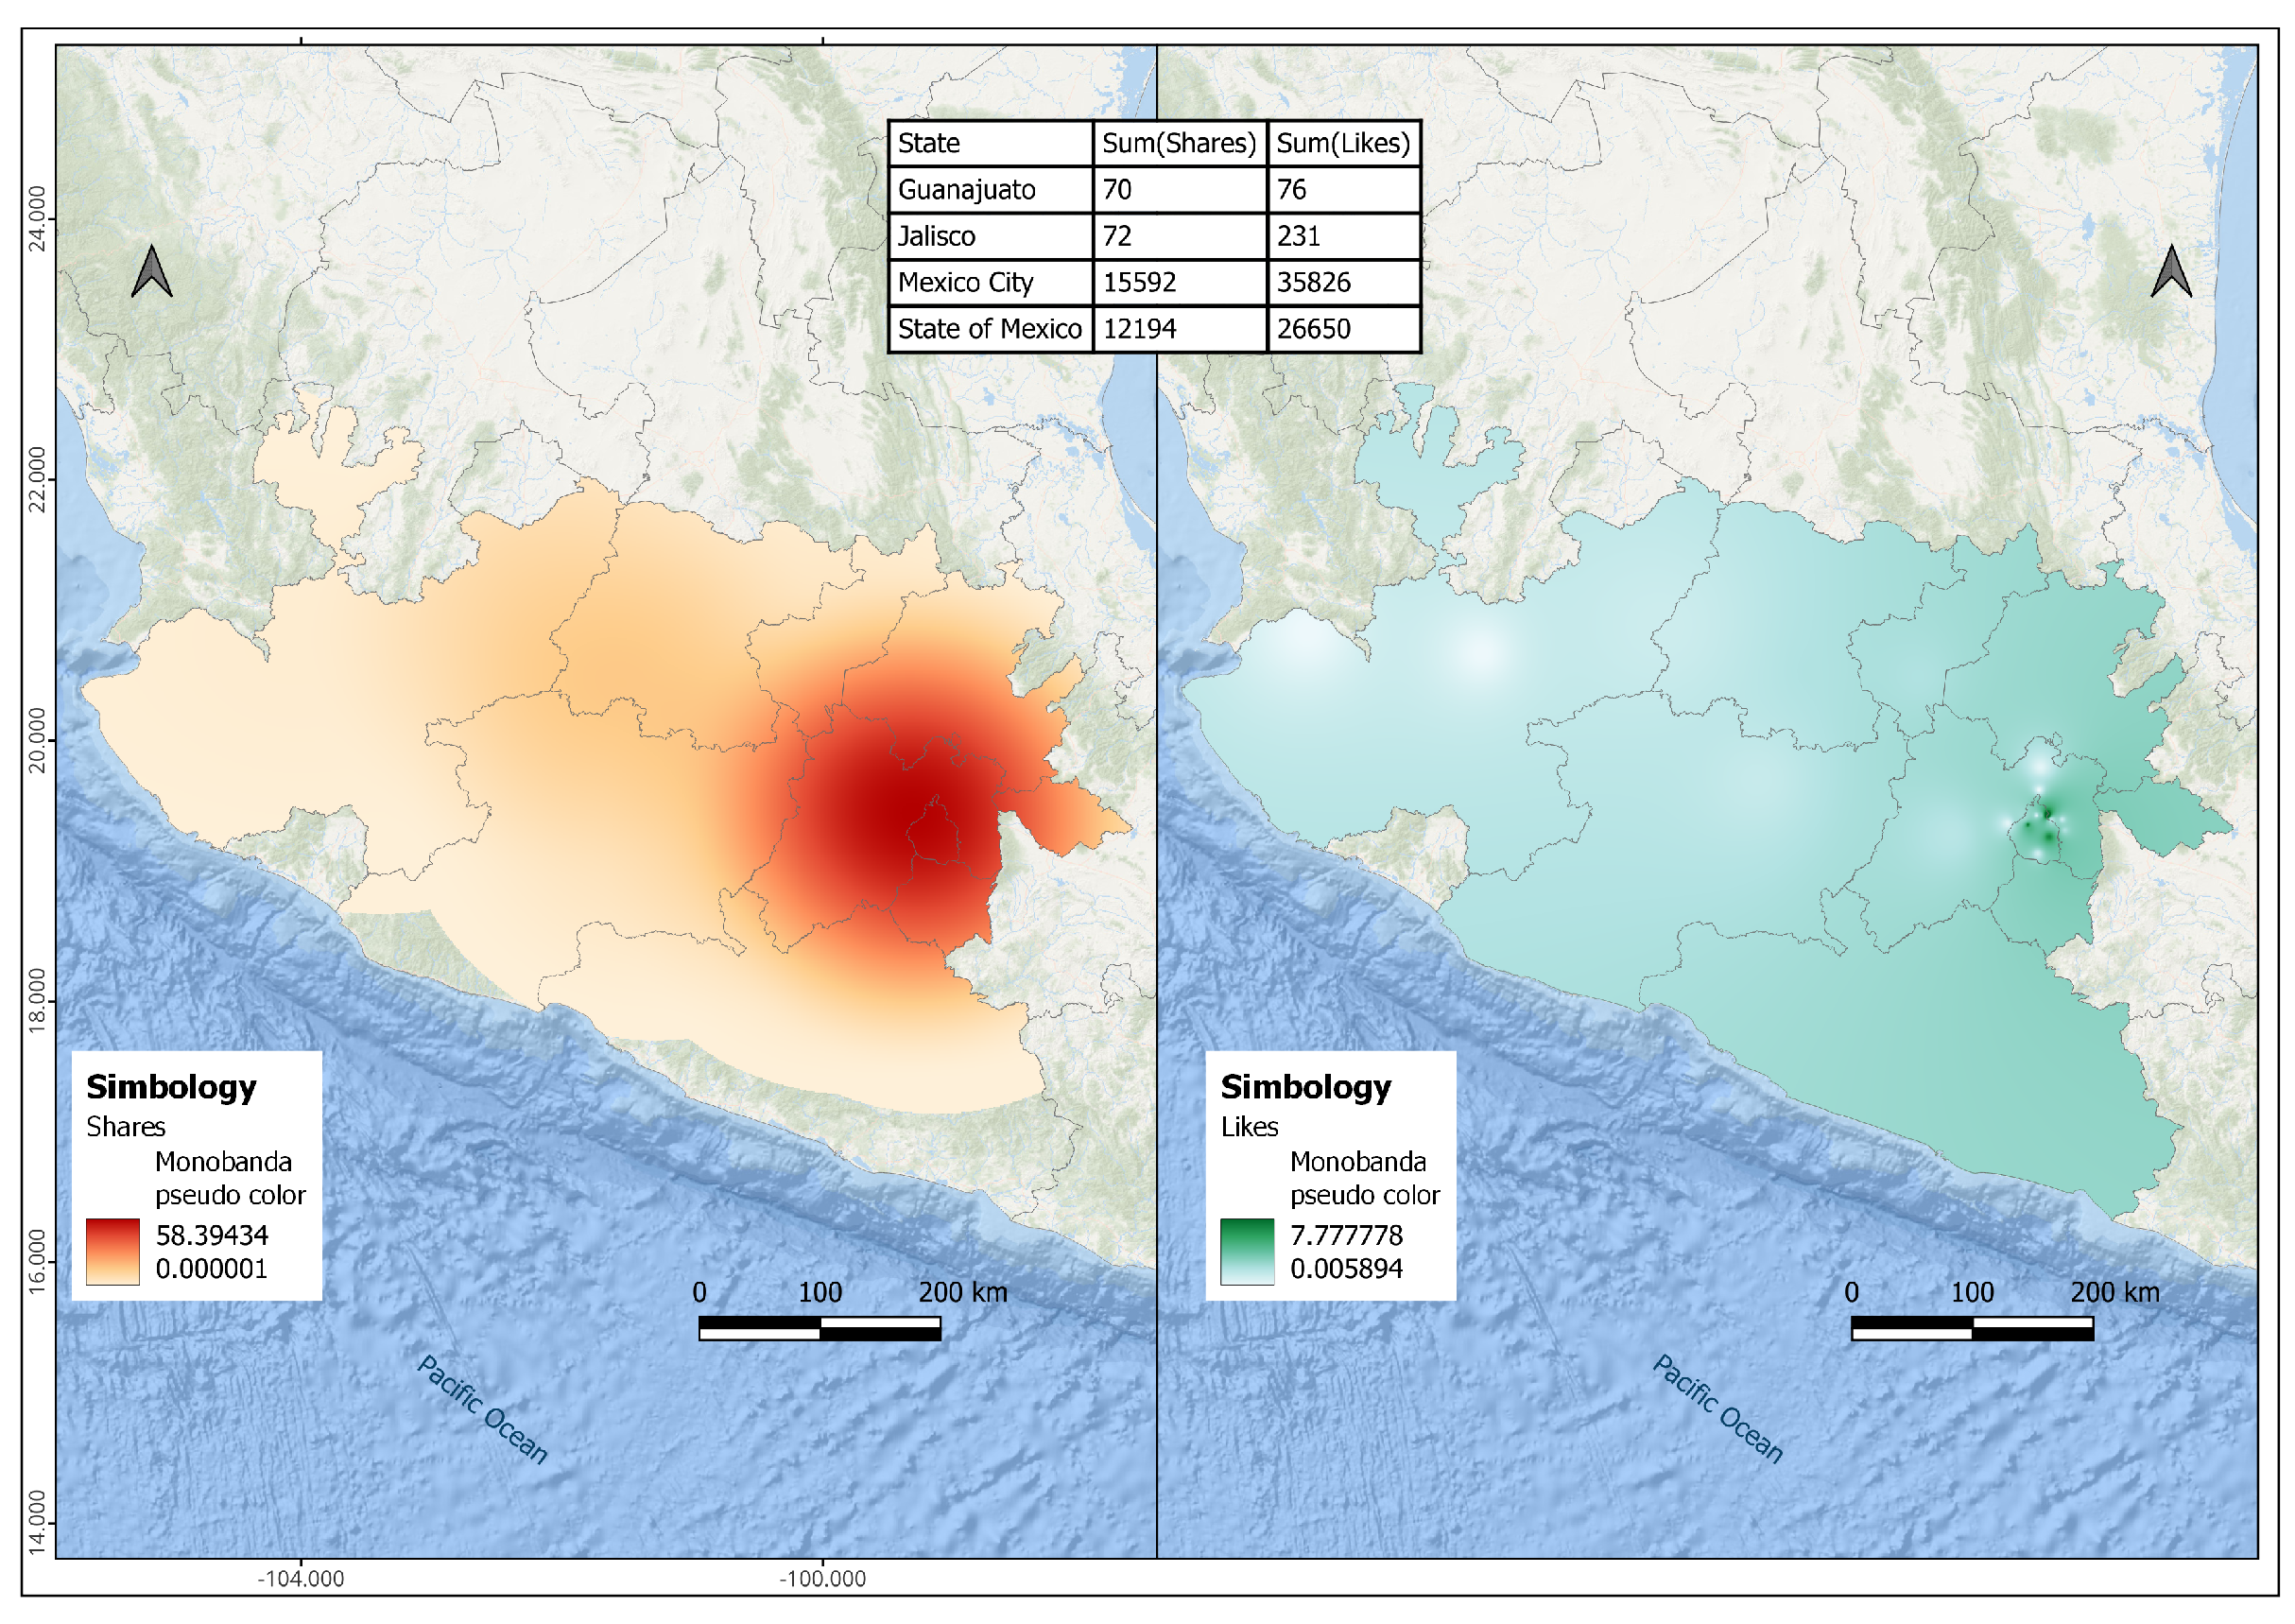
Figure 10.
Precision, recall and F1 Score of text sentiment classification.
Disclaimer/Publisher’s Note: The statements, opinions and data contained in all publications are solely those of the individual author(s) and contributor(s) and not of MDPI and/or the editor(s). MDPI and/or the editor(s) disclaim responsibility for any injury to people or property resulting from any ideas, methods, instructions or products referred to in the content. |
© 2023 by the authors. Licensee MDPI, Basel, Switzerland. This article is an open access article distributed under the terms and conditions of the Creative Commons Attribution (CC BY) license (http://creativecommons.org/licenses/by/4.0/).
Copyright: This open access article is published under a Creative Commons CC BY 4.0 license, which permit the free download, distribution, and reuse, provided that the author and preprint are cited in any reuse.


