

Submitted:
21 October 2023
Posted:
23 October 2023
You are already at the latest version
Abstract
Traffic signal control plays a key role in managing urban traffic flow, enhancing safety, and minimizing congestion and conflicts. Effective green time allocation is a critical element of this control process. This research explores the utilization of LiDAR sensor technology in the optimization of green time allocation for one phase of a traffic signal at a signalized intersection. LiDAR sensors provide precise and real-time data on vehicle presence and traffic patterns, enabling a data-driven approach to traffic signal control. The study begins with an analysis of the limitations of traditional traffic signal control strategies, which often rely on fixed-time plans or rudimentary vehicle detection systems. These approaches can lead to suboptimal green time allocation, resulting in inefficient traffic management and increased vehicle delays.The integration of LiDAR sensors provides detailed information on vehicle queues, arrival rates, and vehicle types. The research presents a practical framework for green time allocation optimization, considering factors such as intersection geometry, traffic volumes, and signal coordination. An intelligent control algorithm was developed that uses LiDAR data to determine the optimal green time for a specific phase, thereby reducing unnecessary waiting times and enhancing intersection efficiency. The effectiveness of the proposed LiDAR-based green time allocation strategy is demonstrated through extensive field tests. The results indicate significant improvements in intersection throughput, reduced delays, and enhanced traffic safety. In conclusion, this research highlights the transformative potential of LiDAR sensor technology in traffic signal control, specifically in the context of optimizing green time allocation. The findings support the notion that adaptive and data-driven strategies, when integrated with LiDAR sensors, can contribute to more efficient, sustainable, and safe urban traffic management. This research aims to provide valuable insights for transportation engineers, policymakers, and researchers seeking innovative solutions for modern urban traffic control.
Keywords:
LiDAR sensor technology
; signalized intersections
; green time allocation
; delay time
; vehicle volume
1. Introduction
The management of urban traffic is a continual challenge for municipalities worldwide, with signalized intersections serving as critical points of intervention to regulate vehicular flow, enhance safety, and mitigate congestion [1,2,3,4]. Within this context, one of the fundamental components of traffic signal control is the allocation of green time to various phases, each responsible for facilitating different traffic movements within the intersection. The optimal allocation of green time is crucial in achieving efficient traffic flow, minimizing vehicle delays, and enhancing overall intersection performance. Traditional traffic signal control systems have historically relied on fixed-time plans and basic vehicle detection mechanisms, which often result in static and less adaptive green time allocation strategies [5,6,7]. Such systems tend to be inflexible in the face of fluctuating traffic conditions, weather-related challenges, and evolving urban mobility patterns. Consequently, these static approaches can lead to suboptimal green time allocation, causing congestion, extended waiting times, and increased fuel consumption, thereby contributing to environmental concerns.
In response to these challenges, modern transportation engineering has seen a surge in the exploration and adoption of advanced technologies to revolutionize traffic signal control [8,9,10]. The integration of LiDAR (Light Detection and Ranging) sensor technology represents a significant leap in the quest for data-driven, adaptive, and intelligent traffic signal control. LiDAR technology, primarily known for its applications in remote sensing, robotics, and autonomous vehicles, offers an unprecedented ability to provide real-time, high-precision data on traffic conditions at signalized intersections [5,11]. LiDAR sensors are capable of measuring distances and detecting objects with remarkable accuracy, independent of external lighting and environmental factors. This attribute allows LiDAR sensors to continuously monitor traffic dynamics, identify vehicle queues, determine vehicle types, and capture real-time traffic patterns in all weather conditions, making them an ideal tool for traffic management.
In the context of traffic signal control, the integration of LiDAR sensor technology enables a paradigm shift from static to adaptive green time allocation. By leveraging the rich, real-time data provided by LiDAR sensors, it will be possible to develop and implement dynamic green time allocation strategies that respond to the instantaneous needs of the intersection, optimizing phase durations based on current traffic demands. This adaptability can significantly reduce delays, enhance intersection throughput, and ultimately improve overall urban traffic management.
This study explores the synergy between LiDAR sensor technology and green time allocation strategies at signalized intersections. It aims to provide an in-depth examination of the feasibility and benefits of LiDAR-based green time allocation while also considering factors such as intersection geometry, traffic volume fluctuations, and signal coordination with neighboring intersections. Additionally, a practical framework for optimizing green time allocation using LiDAR data, introduce an intelligent control algorithm, and illustrate the methodology through extensive field tests. The results and implications of this research are anticipated to have broad-reaching significance for urban transportation, energy efficiency, and environmental sustainability. By harnessing the capabilities of LiDAR technology, this study seeks to advance the understanding of adaptive traffic signal control and its potential to address the dynamic challenges of urban traffic management.
2. Data Analysis
As the case study, the intersection of Marlboro Pike and Brooks Dr. in Coral Hills, MD, USA was considered. In order to understand intersection signal timing conditions, LiDAR data from October 1st to 15th, 2023 was analyzed. Figure 1 shows the location of the intersection and the main land-uses surrounding the intersection. Two red circles illustrate the locations of the LiDAR sensors.
Figure 1.
Marlboro Pike & Brooks Dr. intersection [1].
Figure 1.
Marlboro Pike & Brooks Dr. intersection [1].
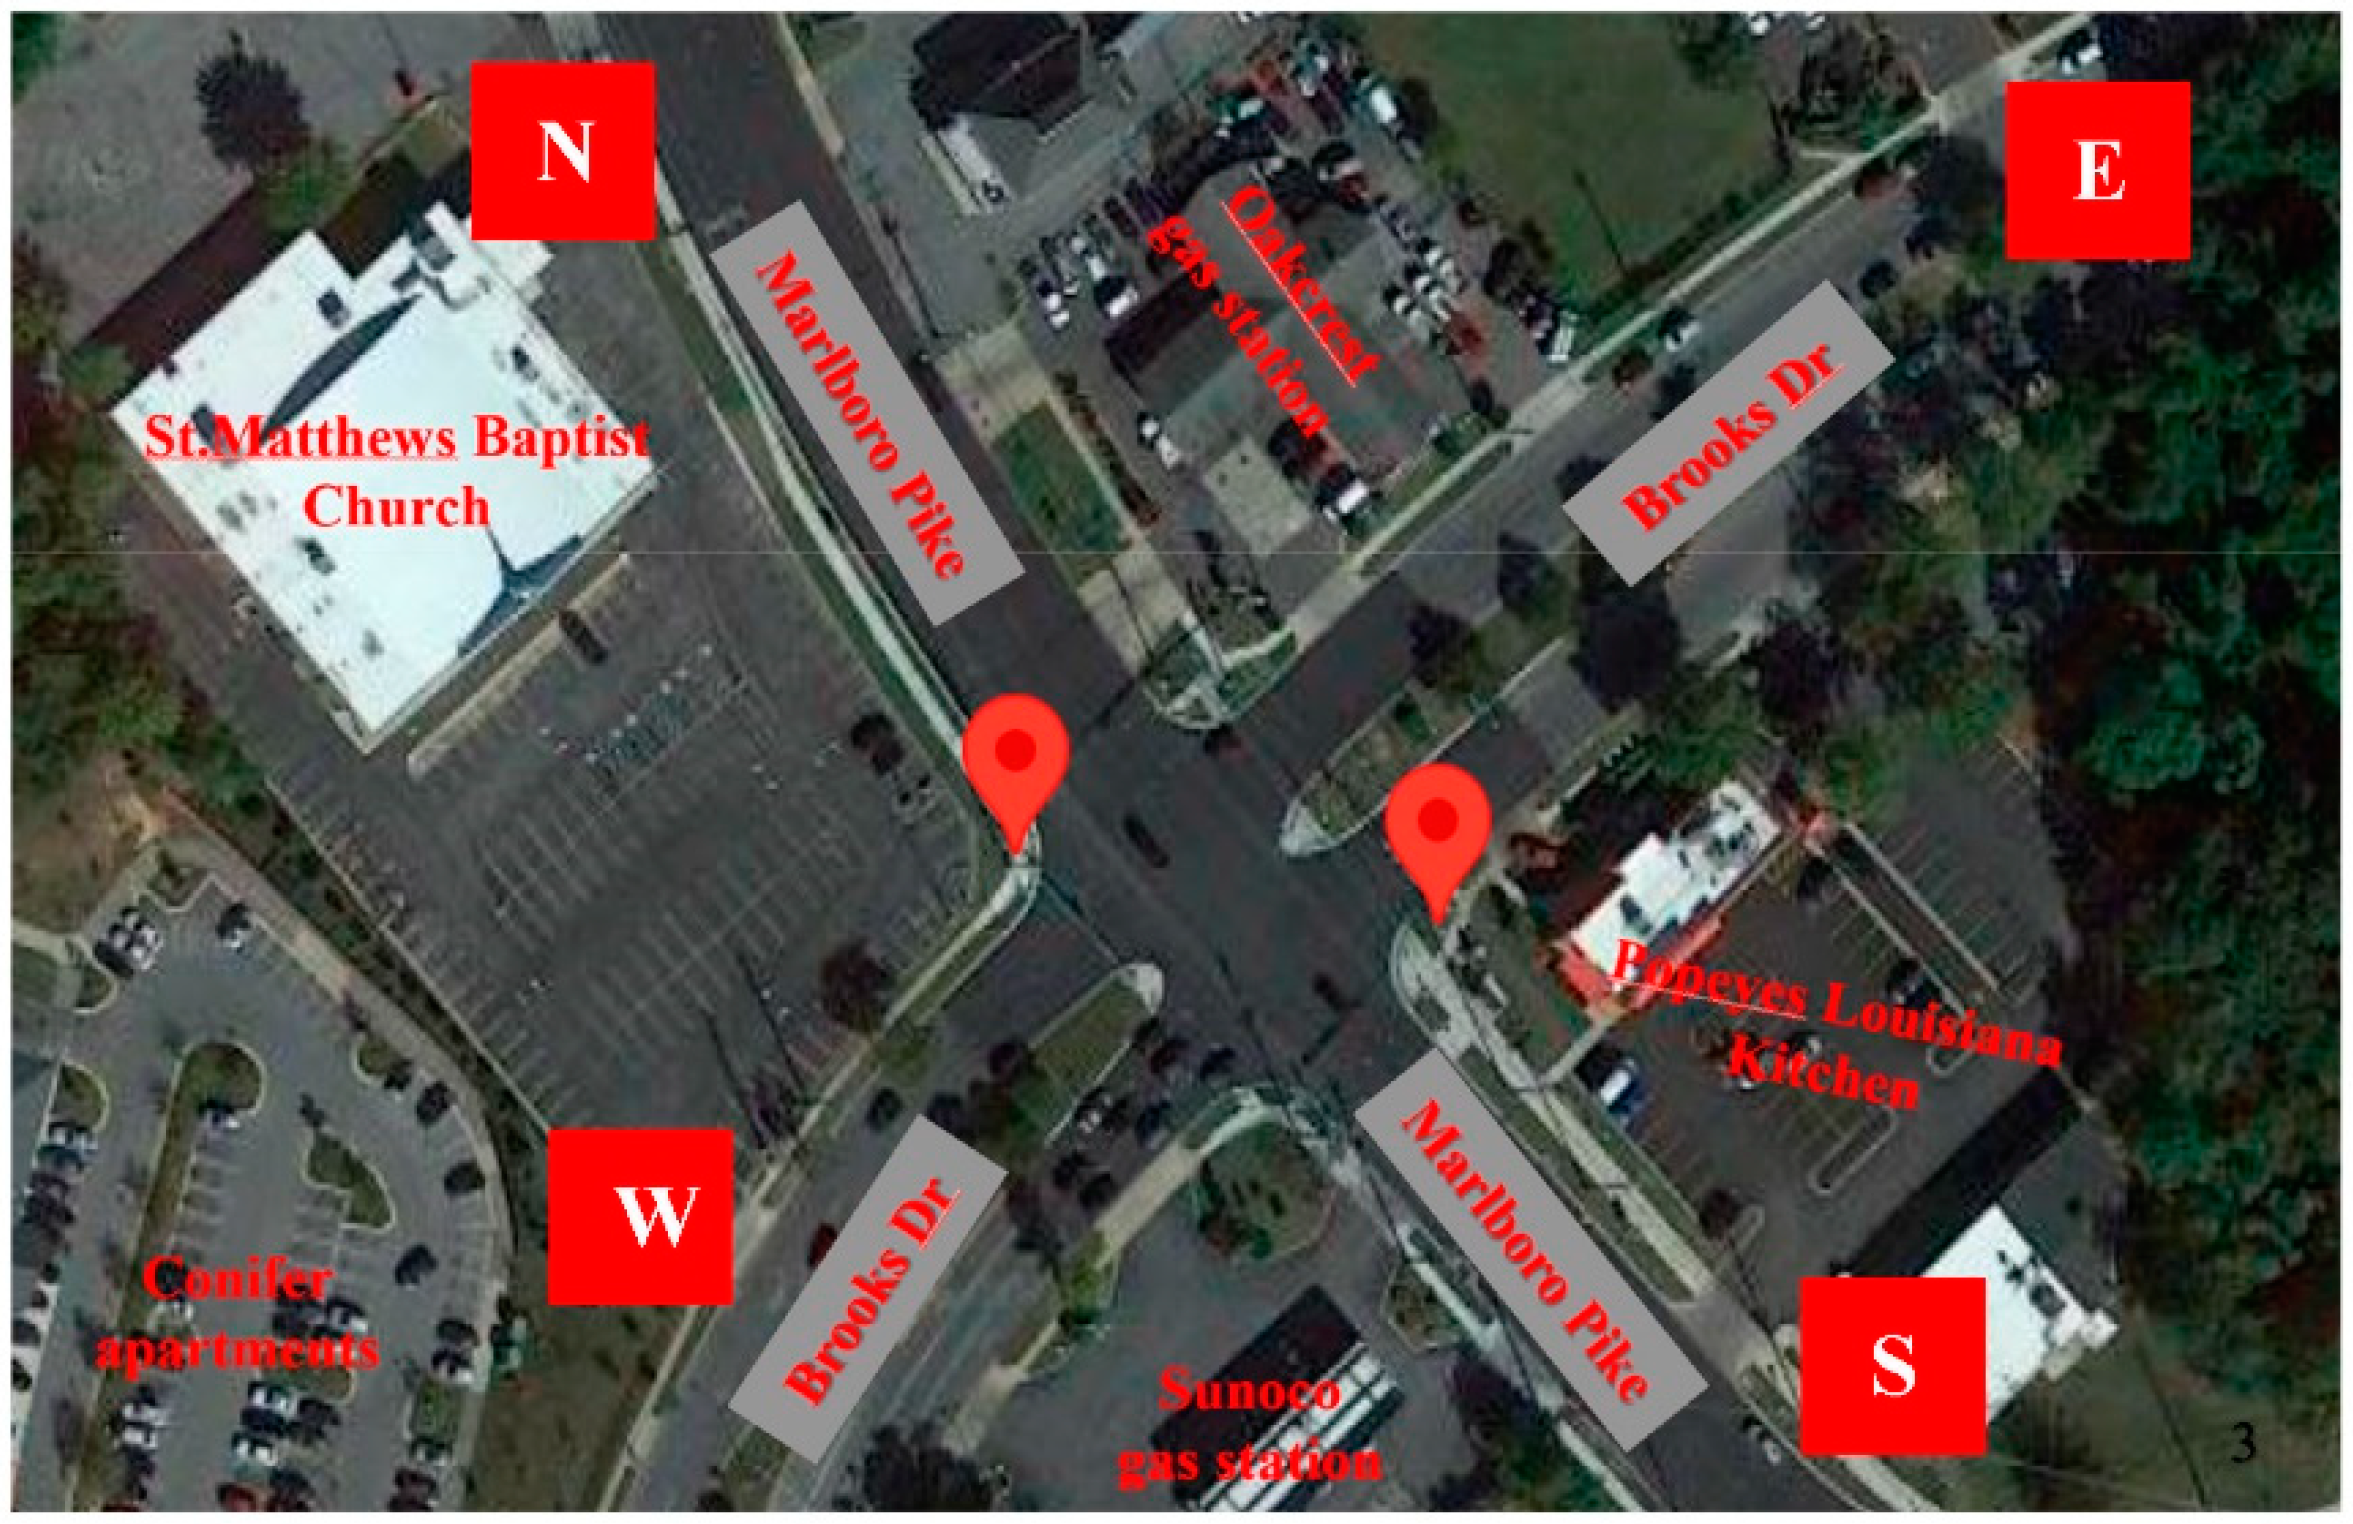
During the specified time interval (the first two weeks of October 2023), the volume of vehicles, pedestrians, and bicyclists was analyzed. Southbound of the intersection has three lanes (one for SBR, one for SBT, and one for SBL) and has a capacity for 1200 PCU/Hour for all three lanes. The research tries to concentrate on the phase #6 of the traffic signal that controls South Bound Straight Thru (SBT or NS), and South Bound Left Turn (SBL or NE) movements. This phase was selected due to the significant frequency of yellow and red light runners, and the frequency of V2V and V2P conflicts. Considering these two crucial movements at the intersection, this study attempts to determine the optimal green allocation that minimize the vehicle delay and congestion. Table 1 demonstrates the vehicle counts (total of NS and NE movements) from October 1st to 15th.

Table 1.
Hourly Vehicle Volume Collected by the LiDAR Sensor.
| Hourly Time Interval | 1-Oct | 2-Oct | 3-Oct | 4-Oct | 5-Oct | 6-Oct | 7-Oct | 8-Oct | 9-Oct | 10-Oct | 11-Oct | 12-Oct | 13-Oct | 14-Oct | 15-Oct |
|---|---|---|---|---|---|---|---|---|---|---|---|---|---|---|---|
| 00:00 - 01:00 AM | 123 | 68 | 55 | 58 | 66 | 95 | 93 | 100 | 63 | 64 | 68 | 52 | 75 | 103 | 68 |
| 01:00 - 02:00 AM | 114 | 42 | 34 | 31 | 37 | 55 | 80 | 55 | 54 | 35 | 40 | 27 | 48 | 52 | 68 |
| 02:00 - 03:00 AM | 58 | 24 | 27 | 20 | 37 | 37 | 48 | 35 | 37 | 25 | 34 | 18 | 25 | 46 | 26 |
| 03:00 - 04:00 AM | 49 | 31 | 29 | 39 | 32 | 41 | 44 | 37 | 15 | 19 | 25 | 20 | 29 | 47 | 21 |
| 04:00 - 05:00 AM | 43 | 35 | 51 | 35 | 30 | 45 | 23 | 36 | 28 | 32 | 33 | 42 | 45 | 48 | 22 |
| 05:00 - 06:00 AM | 32 | 78 | 70 | 74 | 74 | 84 | 41 | 35 | 47 | 75 | 71 | 63 | 79 | 63 | 49 |
| 06:00 - 07:00 AM | 60 | 93 | 105 | 110 | 112 | 104 | 78 | 54 | 90 | 95 | 113 | 93 | 104 | 50 | 49 |
| 07:00 - 08:00 AM | 106 | 219 | 222 | 218 | 218 | 187 | 145 | 106 | 125 | 228 | 224 | 205 | 182 | 129 | 86 |
| 08:00 - 09:00 AM | 222 | 272 | 261 | 281 | 302 | 300 | 207 | 192 | 205 | 314 | 307 | 331 | 306 | 220 | 181 |
| 09:00 - 10:00 AM | 283 | 287 | 257 | 264 | 319 | 328 | 273 | 292 | 275 | 287 | 304 | 319 | 349 | 276 | 281 |
| 10:00 - 11:00 AM | 377 | 357 | 291 | 295 | 309 | 404 | 262 | 320 | 321 | 259 | 333 | 367 | 385 | 304 | 292 |
| 11:00 - 12:00 AM | 396 | 343 | 352 | 379 | 416 | 408 | 337 | 332 | 349 | 328 | 387 | 300 | 386 | 351 | 363 |
| 12:00 - 13:00 PM | 527 | 395 | 358 | 357 | 354 | 454 | 481 | 475 | 446 | 350 | 396 | 405 | 461 | 309 | 449 |
| 13:00 - 14:00 PM | 525 | 412 | 328 | 446 | 376 | 393 | 497 | 502 | 394 | 408 | 409 | 395 | 358 | 325 | 460 |
| 14:00 - 15:00 PM | 452 | 466 | 416 | 446 | 493 | 432 | 411 | 464 | 466 | 465 | 376 | 425 | 490 | 397 | 437 |
| 15:00 - 16:00 PM | 414 | 426 | 504 | 448 | 524 | 564 | 392 | 375 | 464 | 451 | 543 | 435 | 498 | 336 | 396 |
| 16:00 - 17:00 PM | 393 | 565 | 561 | 598 | 572 | 568 | 462 | 447 | 437 | 589 | 617 | 564 | 542 | 413 | 396 |
| 17:00 - 18:00 PM | 424 | 633 | 608 | 606 | 646 | 566 | 500 | 343 | 460 | 627 | 603 | 629 | 595 | 377 | 352 |
| 18:00 - 19:00 PM | 326 | 494 | 626 | 627 | 582 | 439 | 476 | 326 | 432 | 481 | 539 | 572 | 502 | 297 | 334 |
| 19:00 - 20:00 PM | 343 | 367 | 421 | 390 | 336 | 355 | 381 | 251 | 317 | 366 | 363 | 408 | 461 | 283 | 304 |
| 20:00 - 21:00 PM | 248 | 225 | 307 | 338 | 308 | 334 | 266 | 223 | 266 | 269 | 281 | 289 | 356 | 193 | 248 |
| 21:00 - 22:00 PM | 178 | 187 | 211 | 228 | 173 | 280 | 200 | 143 | 174 | 153 | 178 | 220 | 271 | 132 | 123 |
| 22:00 - 23:00 PM | 126 | 130 | 128 | 145 | 150 | 227 | 186 | 106 | 129 | 121 | 156 | 176 | 230 | 161 | 125 |
| 23:00 - 24:00 PM | 89 | 100 | 112 | 104 | 108 | 162 | 145 | 94 | 70 | 91 | 103 | 103 | 162 | 139 | 90 |
| ADT* | 246 | 260 | 264 | 272 | 274 | 286 | 251 | 223 | 236 | 256 | 271 | 269 | 289 | 210 | 218 |
*Average Daily Traffic (ADT).
Table 2 shows the number of pedestrians passing from the southbound direction hourly between October 1st and 15th.
Table 2.
Hourly Pedestrian Volume Collected by the LiDAR Sensor.
| Hourly Time Interval | 1-Oct | 2-Oct | 3-Oct | 4-Oct | 5-Oct | 6-Oct | 7-Oct | 8-Oct | 9-Oct | 10-Oct | 11-Oct | 12-Oct | 13-Oct | 14-Oct | 15-Oct |
|---|---|---|---|---|---|---|---|---|---|---|---|---|---|---|---|
| 00:00 - 01:00 AM | 1 | 1 | 0 | 2 | 0 | 0 | 2 | 3 | 1 | 1 | 0 | 3 | 0 | 0 | 0 |
| 01:00 - 02:00 AM | 0 | 1 | 0 | 1 | 0 | 1 | 2 | 0 | 1 | 0 | 0 | 0 | 0 | 0 | 1 |
| 02:00 - 03:00 AM | 0 | 0 | 0 | 0 | 1 | 0 | 0 | 0 | 2 | 1 | 1 | 0 | 0 | 0 | 0 |
| 03:00 - 04:00 AM | 0 | 0 | 0 | 3 | 0 | 0 | 1 | 0 | 0 | 0 | 0 | 0 | 0 | 0 | 0 |
| 04:00 - 05:00 AM | 0 | 1 | 1 | 0 | 2 | 3 | 1 | 0 | 3 | 3 | 3 | 1 | 1 | 0 | 0 |
| 05:00 - 06:00 AM | 1 | 2 | 2 | 2 | 0 | 1 | 0 | 0 | 1 | 0 | 0 | 2 | 2 | 0 | 0 |
| 06:00 - 07:00 AM | 0 | 4 | 0 | 4 | 4 | 4 | 1 | 1 | 2 | 3 | 5 | 3 | 2 | 0 | 0 |
| 07:00 - 08:00 AM | 0 | 7 | 5 | 3 | 3 | 2 | 0 | 2 | 0 | 4 | 7 | 5 | 2 | 1 | 4 |
| 08:00 - 09:00 AM | 3 | 11 | 11 | 7 | 4 | 7 | 5 | 2 | 2 | 10 | 7 | 5 | 4 | 2 | 0 |
| 09:00 - 10:00 AM | 8 | 9 | 6 | 7 | 3 | 2 | 1 | 4 | 5 | 7 | 4 | 7 | 6 | 1 | 6 |
| 10:00 - 11:00 AM | 4 | 10 | 0 | 4 | 5 | 8 | 4 | 5 | 3 | 6 | 4 | 3 | 10 | 2 | 6 |
| 11:00 - 12:00 AM | 5 | 5 | 8 | 3 | 6 | 1 | 5 | 4 | 5 | 7 | 8 | 2 | 9 | 3 | 4 |
| 12:00 - 13:00 PM | 6 | 9 | 8 | 2 | 6 | 10 | 10 | 4 | 8 | 6 | 4 | 4 | 3 | 2 | 8 |
| 13:00 - 14:00 PM | 4 | 12 | 1 | 4 | 3 | 5 | 6 | 11 | 8 | 9 | 2 | 4 | 3 | 5 | 5 |
| 14:00 - 15:00 PM | 11 | 10 | 6 | 5 | 6 | 9 | 7 | 5 | 12 | 0 | 3 | 6 | 10 | 3 | 6 |
| 15:00 - 16:00 PM | 5 | 9 | 9 | 13 | 10 | 5 | 8 | 10 | 11 | 8 | 2 | 4 | 5 | 1 | 3 |
| 16:00 - 17:00 PM | 4 | 8 | 5 | 9 | 5 | 5 | 11 | 3 | 7 | 5 | 9 | 5 | 8 | 6 | 3 |
| 17:00 - 18:00 PM | 13 | 8 | 13 | 5 | 8 | 13 | 4 | 6 | 13 | 7 | 7 | 8 | 1 | 7 | 5 |
| 18:00 - 19:00 PM | 14 | 7 | 4 | 9 | 17 | 7 | 4 | 8 | 5 | 8 | 9 | 14 | 7 | 1 | 9 |
| 19:00 - 20:00 PM | 8 | 10 | 8 | 7 | 9 | 7 | 9 | 2 | 6 | 7 | 9 | 1 | 9 | 6 | 12 |
| 20:00 - 21:00 PM | 3 | 4 | 9 | 6 | 3 | 9 | 6 | 6 | 1 | 3 | 6 | 5 | 4 | 4 | 2 |
| 21:00 - 22:00 PM | 0 | 1 | 3 | 4 | 8 | 5 | 7 | 0 | 11 | 3 | 0 | 11 | 6 | 2 | 2 |
| 22:00 - 23:00 PM | 5 | 0 | 0 | 2 | 0 | 3 | 6 | 0 | 8 | 2 | 4 | 5 | 12 | 5 | 0 |
| 23:00 - 24:00 PM | 2 | 0 | 2 | 7 | 1 | 3 | 1 | 3 | 3 | 0 | 3 | 1 | 4 | 0 | 0 |
| ADT | 4 | 5 | 4 | 5 | 4 | 5 | 4 | 3 | 5 | 4 | 4 | 4 | 5 | 2 | 3 |
Table 3 shows the number of bicyclists passing from the southbound direction hourly between October 1st and 15th.
Table 3.
Hourly Bicyclist Volume Collected by the LiDAR Sensor.
| Hourly Time Interval | 1-Oct | 2-Oct | 3-Oct | 4-Oct | 5-Oct | 6-Oct | 7-Oct | 8-Oct | 9-Oct | 10-Oct | 11-Oct | 12-Oct | 13-Oct | 14-Oct | 15-Oct |
|---|---|---|---|---|---|---|---|---|---|---|---|---|---|---|---|
| 00:00 - 01:00 AM | 0 | 0 | 0 | 0 | 4 | 3 | 0 | 0 | 0 | 0 | 0 | 0 | 0 | 0 | 0 |
| 01:00 - 02:00 AM | 0 | 0 | 0 | 0 | 0 | 0 | 0 | 0 | 0 | 1 | 0 | 0 | 0 | 0 | 0 |
| 02:00 - 03:00 AM | 5 | 1 | 0 | 0 | 0 | 0 | 1 | 0 | 0 | 0 | 0 | 0 | 0 | 0 | 0 |
| 03:00 - 04:00 AM | 0 | 0 | 0 | 0 | 0 | 0 | 0 | 0 | 0 | 0 | 0 | 0 | 0 | 0 | 0 |
| 04:00 - 05:00 AM | 3 | 0 | 1 | 0 | 0 | 0 | 0 | 0 | 0 | 0 | 0 | 0 | 0 | 0 | 0 |
| 05:00 - 06:00 AM | 0 | 1 | 0 | 0 | 1 | 0 | 0 | 0 | 1 | 0 | 0 | 0 | 0 | 1 | 0 |
| 06:00 - 07:00 AM | 0 | 0 | 0 | 0 | 0 | 0 | 0 | 0 | 0 | 0 | 0 | 3 | 0 | 0 | 0 |
| 07:00 - 08:00 AM | 0 | 0 | 1 | 0 | 1 | 0 | 0 | 0 | 0 | 0 | 0 | 2 | 1 | 0 | 0 |
| 08:00 - 09:00 AM | 0 | 0 | 2 | 1 | 1 | 0 | 0 | 0 | 0 | 1 | 0 | 0 | 0 | 0 | 1 |
| 09:00 - 10:00 AM | 1 | 1 | 0 | 4 | 2 | 1 | 0 | 0 | 0 | 1 | 0 | 0 | 2 | 0 | 0 |
| 10:00 - 11:00 AM | 0 | 0 | 1 | 1 | 2 | 2 | 0 | 1 | 1 | 1 | 1 | 0 | 2 | 0 | 0 |
| 11:00 - 12:00 AM | 1 | 1 | 1 | 1 | 0 | 0 | 1 | 0 | 0 | 1 | 1 | 0 | 3 | 1 | 1 |
| 12:00 - 13:00 PM | 0 | 0 | 0 | 0 | 0 | 0 | 1 | 0 | 1 | 0 | 0 | 1 | 1 | 1 | 0 |
| 13:00 - 14:00 PM | 2 | 0 | 0 | 1 | 0 | 0 | 0 | 1 | 0 | 1 | 2 | 0 | 1 | 0 | 1 |
| 14:00 - 15:00 PM | 0 | 0 | 0 | 1 | 0 | 0 | 0 | 1 | 0 | 0 | 4 | 1 | 1 | 1 | 1 |
| 15:00 - 16:00 PM | 0 | 1 | 1 | 2 | 1 | 2 | 3 | 1 | 1 | 1 | 2 | 0 | 1 | 4 | 0 |
| 16:00 - 17:00 PM | 2 | 1 | 0 | 1 | 0 | 1 | 0 | 3 | 2 | 1 | 0 | 2 | 1 | 0 | 0 |
| 17:00 - 18:00 PM | 2 | 2 | 1 | 3 | 2 | 0 | 3 | 0 | 2 | 0 | 1 | 5 | 2 | 0 | 2 |
| 18:00 - 19:00 PM | 0 | 2 | 2 | 0 | 2 | 1 | 4 | 0 | 0 | 0 | 0 | 1 | 0 | 0 | 0 |
| 19:00 - 20:00 PM | 2 | 0 | 1 | 1 | 0 | 3 | 3 | 2 | 1 | 2 | 0 | 0 | 0 | 0 | 0 |
| 20:00 - 21:00 PM | 1 | 0 | 10 | 2 | 2 | 1 | 0 | 2 | 1 | 2 | 0 | 1 | 4 | 0 | 1 |
| 21:00 - 22:00 PM | 1 | 0 | 3 | 2 | 1 | 0 | 0 | 0 | 3 | 1 | 0 | 0 | 1 | 0 | 0 |
| 22:00 - 23:00 PM | 2 | 0 | 0 | 0 | 0 | 1 | 0 | 1 | 0 | 0 | 0 | 0 | 2 | 0 | 0 |
| 23:00 - 24:00 PM | 0 | 0 | 1 | 0 | 2 | 0 | 4 | 0 | 0 | 0 | 0 | 2 | 0 | 0 | 0 |
| ADT | 1 | 0 | 1 | 1 | 1 | 1 | 1 | 1 | 1 | 1 | 0 | 1 | 1 | 0 | 0 |
Figure 2 shows the changes in speed at the intersection’s different approaches.
Figure 2.
Speed Changes In Different Intersection’s Approaches - From October 1st to 15th.
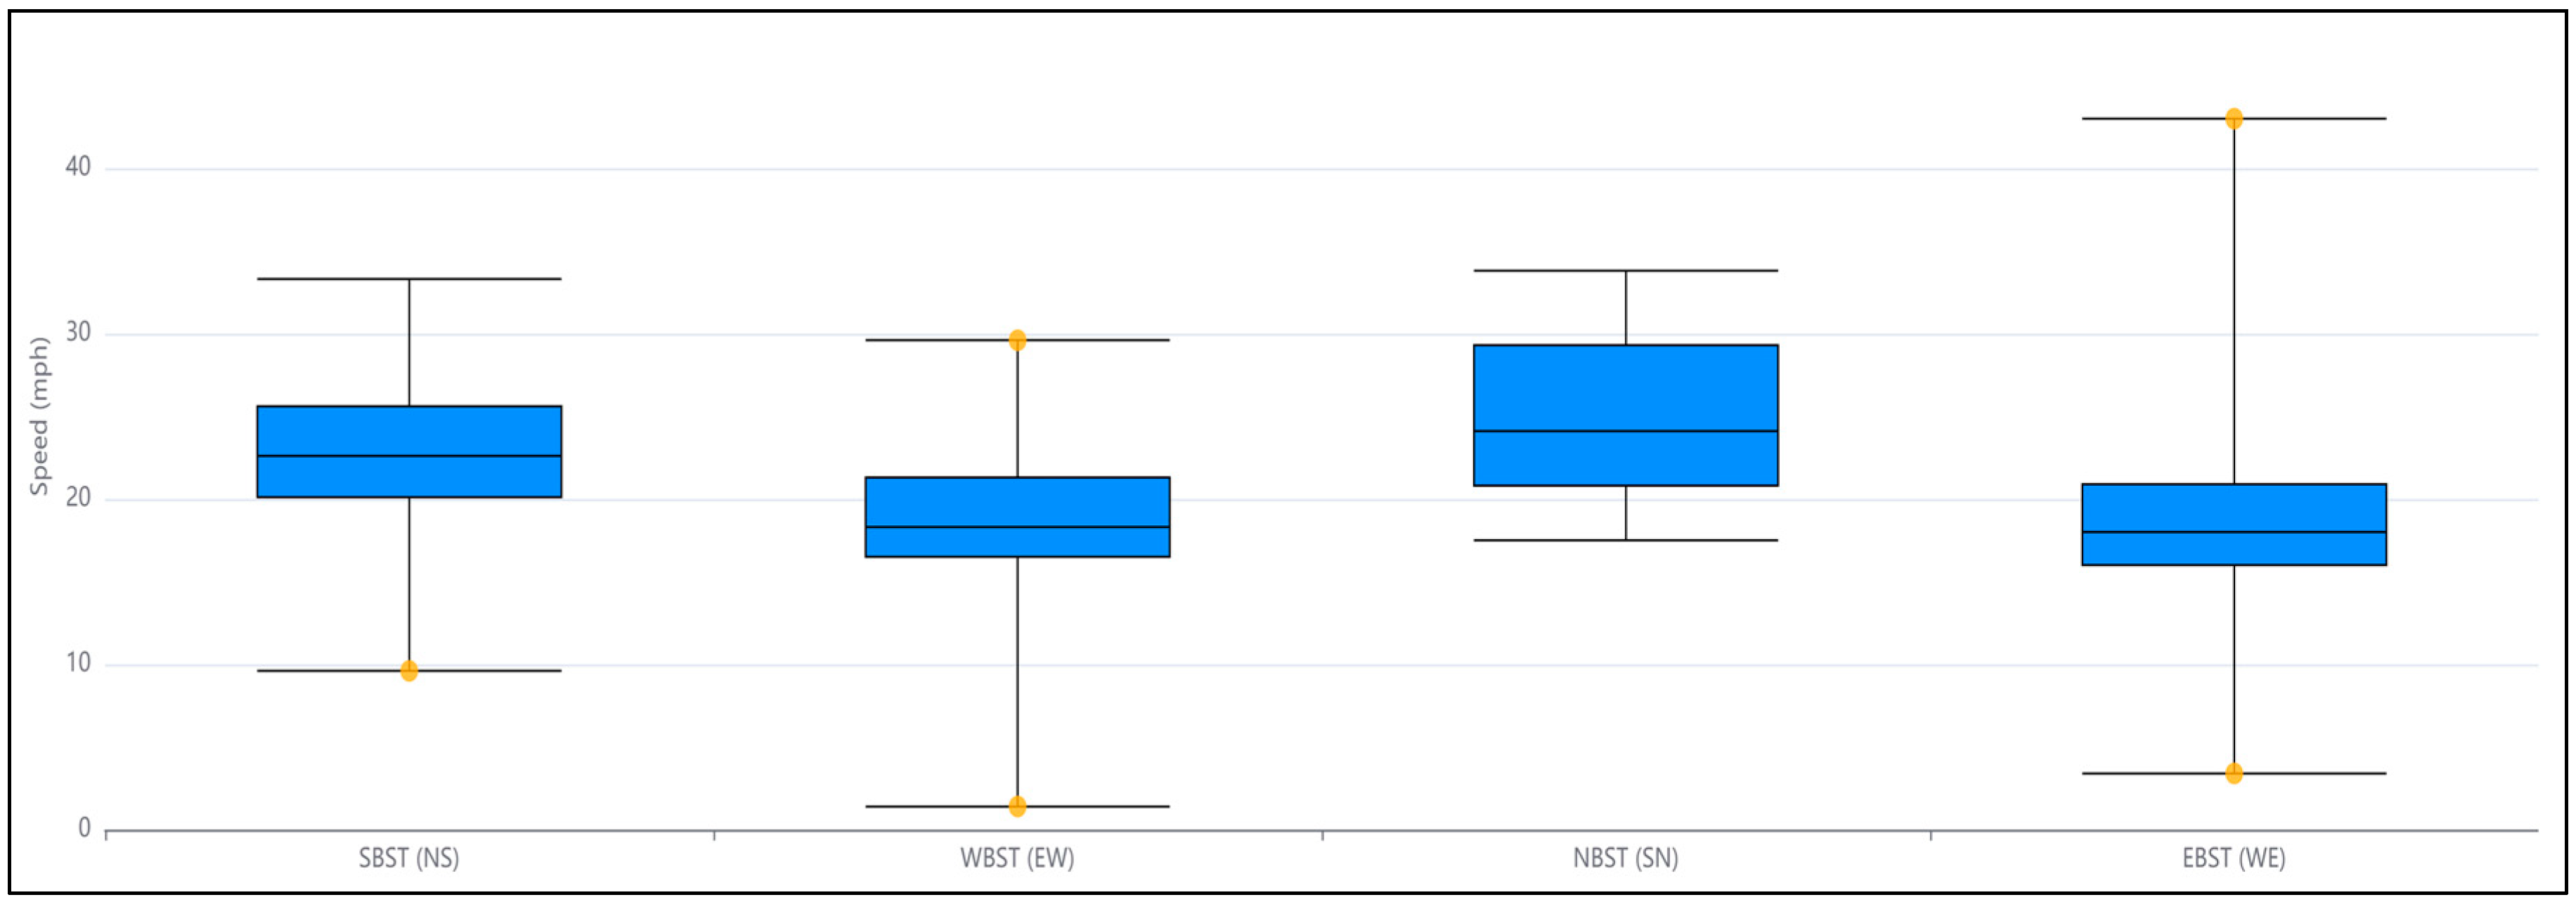
As can be seen in Figure 2, 22.6 mile/h, 18.3 mile/h, 24.1 mile/h, and 18 mile/h are collected by the LiDAR sensors as the average speeds in NS (SBT), EW (WBT), SN (NBT), and WE (EBT) movements. The speed diagram indicates that north-south approaches to the intersection have higher diurnal speeds.
3. Green Time Allocation
Signalized intersections serve as vital nodes within urban transportation networks, where streams of vehicles and pedestrians converge. Efficient traffic management at these intersections is essential to ensure the smooth flow of traffic, reduce congestion, enhance safety, and minimize environmental impacts. A key determinant of intersection performance is the allocation of green time to specific phases, each dedicated to regulating particular traffic movements [12,13]. The significance of optimal green time allocation cannot be overstated, as it directly affects the efficiency and effectiveness of an intersection’s operation. A fundamental contributor to congestion at signalized intersections is suboptimal green time allocation. Inefficient allocation can lead to vehicle queues, excessive delays, and reduced throughput [14,15]. Moreover, it exacerbates the environmental impact of transportation, as vehicles idling in traffic consume more fuel and produce greater emissions. To mitigate these challenges, advanced technologies have gained prominence in traffic management, and among them, LiDAR sensor technology stands out for its ability to provide precise, real-time data on traffic conditions. LiDAR sensors offer exceptional advantages in terms of accuracy and reliability. They operate in all weather conditions and are unaffected by lighting constraints. By continuously monitoring traffic, LiDAR sensors can detect the presence of vehicles, estimate their positions, and assess traffic patterns with high fidelity. This capability opens the door to data-driven and adaptive traffic signal control.
The integration of LiDAR sensors into traffic management systems can enable the dynamic allocation of green time based on real-time traffic demands, enhancing intersection efficiency and, in turn, mitigating congestion, reducing delays, and promoting geometry, and traffic volumes [16,17]. The central focus is on developing an intelligent control algorithm that leverages LiDAR data to dynamically adjust phase durations, thereby addressing the dynamic challenges of urban traffic management. Through extensive field tests, the effectiveness of this approach was examined and its implications were considered. This section concentrates on an exploration of the green time allocation at a signalized intersection. The green time allocation at a signalized intersection is a complex problem that involves various factors, including traffic volume, cycle length, and other parameters. Here are some key details to calculate the green time allocation for one phase of a traffic signal [18,19]:
- ⮚
- Cycle Length (C): The cycle length is the total time it takes for one complete cycle of all phases at the intersection. It is often determined based on traffic demand and other factors.
- ⮚
- Total Lost Time (L): Lost time represents the time during which the intersection is not effectively used by any approach. It includes the time required for clearing the intersection, pedestrian crossing time, and any other non-green time.
- ⮚
- Effective Green Time (G): The effective green time is the time allocated for a particular phase to serve its assigned traffic movement. It is usually the difference between the cycle length and the total lost time for the phase.
- ⮚
- Saturation Flow Rate (S): The saturation flow rate is the maximum rate at which vehicles can pass through an intersection during the green time for a phase. It is typically expressed in vehicles per hour per lane.
- ⮚
- Volume (V): The volume represents the number of vehicles arriving at the intersection during a given time period (interval). It can be calculated for each approach to the intersection.
- ⮚
-
Green Time Allocation (GTA): The green time allocation for a specific phase (e.g., southbound through or left-turn) can be calculated as shown in Equation (1):where:GTA = min (G, V / S)
- GTA is the green time allocation.
- G is the effective green time for the phase.
- V is the volume of vehicles for that phase.
- S is the saturation flow rate for that phase.
To calculate the saturation flow rate using LiDAR sensor technology, a systematic methodology is proposed. This approach includes the following steps:
- ⮚
- Data Collection: LiDAR sensors continuously monitor the traffic flow during the green phase. Data on vehicle presence and their position and speed are recorded.
- ⮚
- Vehicle Classification: The LiDAR data is used to classify vehicles based on their type (e.g., passenger cars, buses, trucks, bicycles). This classification allows for a more accurate estimation of saturation flow rates since different vehicle types exhibit varying flow characteristics.
- ⮚
- Queue Detection: LiDAR data is utilized to detect vehicle queues at the stop line, which is essential for determining the available space for vehicle movement.
- ⮚
- Saturation Flow Rate Calculation: The saturation flow rate is calculated as the maximum observed flow rate of a particular vehicle type during the green phase. This approach adapts to real-time conditions and accurately reflects the intersection’s current operational status.
- ⮚
- Vehicle Type-Specific Flow Rates (FR_c): The flow rate for each vehicle type (c) is calculated by counting the number of vehicles of that type passing the stop line during the green phase and dividing it by the duration of the green phase (T):FR_c = (Number of Vehicles of Type c) / T
- ⮚
- Maximum Saturation Flow Rate (SFR_max): The maximum saturation flow rate is determined by selecting the highest flow rate among all vehicle types:SFR_max = max(FR_c) for all vehicle types c
- ⮚
- Saturation Flow Rate (SFR): The overall saturation flow rate for the phase is the maximum observed flow rate across all vehicle types during the green phase:SFR = SFR_max
After monitoring the intersection’s southbound movements accurately from October 1st to 15th, the hourly GTA (green time allocation) was identified for phase #6. Table 4 illustrates the results of the optimal green time allocation for phase #6.
Table 4.
Optimal Green Time Allocation (sec) for Phase #6.
| Hourly Time | 1-Oct | 2-Oct | 3-Oct | 4-Oct | 5-Oct | 6-Oct | 7-Oct | 8-Oct | 9-Oct | 10-Oct | 11-Oct | 12-Oct | 13-Oct | 14-Oct | 15-Oct |
|---|---|---|---|---|---|---|---|---|---|---|---|---|---|---|---|
| 00:00 - 01:00 AM | 34.5 | 31.3 | 32.6 | 32.5 | 32.6 | 31.9 | 33.0 | 34.3 | 33.1 | 32.9 | 34.3 | 32.6 | 32.1 | 32.3 | 31.3 |
| 01:00 - 02:00 AM | 32.7 | 27.8 | 29.5 | 26.2 | 28.5 | 29.6 | 30.6 | 32.8 | 31.8 | 28.2 | 28.3 | 32.1 | 27.9 | 31.6 | 32.3 |
| 02:00 - 03:00 AM | 31.0 | 24.2 | 23.7 | 23.9 | 26.1 | 24.4 | 29.6 | 31.1 | 26.2 | 23.3 | 23.2 | 24.3 | 24.5 | 29.0 | 30.7 |
| 03:00 - 04:00 AM | 28.9 | 22.6 | 23.2 | 22.9 | 22.6 | 23.1 | 27.5 | 28.9 | 25.6 | 22.5 | 22.9 | 22.5 | 23.8 | 28.8 | 28.1 |
| 04:00 - 05:00 AM | 26.6 | 24.1 | 23.5 | 24.8 | 25.0 | 24.8 | 27.4 | 31.3 | 25.8 | 24.1 | 24.3 | 24.4 | 24.2 | 27.2 | 25.7 |
| 05:00 - 06:00 AM | 24.9 | 25.4 | 24.6 | 25.4 | 25.6 | 25.7 | 27.1 | 25.4 | 26.1 | 24.6 | 25.4 | 23.4 | 25.8 | 27.2 | 25.8 |
| 06:00 - 07:00 AM | 24.9 | 25.7 | 25.6 | 28.4 | 26.3 | 27.4 | 27.9 | 25.8 | 25.7 | 26.1 | 26.9 | 26.5 | 25.6 | 25.9 | 26.7 |
| 07:00 - 08:00 AM | 26.5 | 25.5 | 27.0 | 25.7 | 29.5 | 26.9 | 28.0 | 27.2 | 26.2 | 26.2 | 26.5 | 27.0 | 26.4 | 27.3 | 27.0 |
| 08:00 - 09:00 AM | 28.4 | 26.6 | 25.5 | 25.3 | 27.2 | 28.1 | 27.3 | 28.1 | 26.3 | 27.3 | 26.4 | 26.1 | 26.6 | 27.4 | 26.9 |
| 09:00 - 10:00 AM | 28.2 | 26.6 | 25.9 | 25.7 | 26.5 | 26.0 | 26.9 | 27.4 | 25.5 | 28.3 | 26.1 | 26.6 | 25.9 | 26.9 | 27.5 |
| 10:00 - 11:00 AM | 27.8 | 26.8 | 28.1 | 28.2 | 27.7 | 27.0 | 27.7 | 28.3 | 26.5 | 26.9 | 26.6 | 27.7 | 27.8 | 27.0 | 26.0 |
| 11:00 - 12:00 AM | 26.5 | 28.3 | 28.6 | 27.4 | 28.9 | 27.8 | 27.2 | 27.2 | 27.6 | 26.7 | 27.8 | 27.1 | 29.4 | 26.3 | 26.1 |
| 12:00 - 13:00 PM | 27.6 | 29.1 | 29.4 | 29.8 | 30.5 | 28.9 | 27.5 | 26.6 | 27.4 | 28.9 | 29.0 | 29.1 | 29.9 | 26.9 | 26.4 |
| 13:00 - 14:00 PM | 27.1 | 29.9 | 29.9 | 30.5 | 30.4 | 29.2 | 27.4 | 26.6 | 27.1 | 30.5 | 29.2 | 29.3 | 28.9 | 26.2 | 25.8 |
| 14:00 - 15:00 PM | 24.7 | 27.5 | 29.2 | 29.6 | 28.6 | 28.3 | 27.4 | 26.6 | 26.2 | 28.2 | 27.3 | 29.9 | 30.4 | 26.3 | 26.0 |
| 15:00 - 16:00 PM | 26.1 | 26.0 | 26.6 | 25.6 | 26.5 | 26.8 | 26.1 | 24.5 | 27.1 | 25.8 | 26.2 | 26.7 | 27.2 | 27.3 | 27.4 |
| 16:00 - 17:00 PM | 25.6 | 25.6 | 26.0 | 25.6 | 27.1 | 25.2 | 25.7 | 26.2 | 25.5 | 25.8 | 25.8 | 26.0 | 25.3 | 25.6 | 26.0 |
| 17:00 - 18:00 PM | 25.7 | 24.9 | 24.9 | 26.2 | 25.5 | 24.6 | 24.6 | 26.3 | 27.3 | 25.5 | 21.4 | 24.7 | 26.1 | 24.7 | 26.2 |
| 18:00 - 19:00 PM | 26.8 | 28.3 | 27.4 | 26.2 | 26.7 | 25.2 | 26.0 | 27.3 | 28.1 | 26.7 | 26.0 | 25.9 | 26.2 | 26.7 | 27.9 |
| 19:00 - 20:00 PM | 29.6 | 29.4 | 28.2 | 27.9 | 27.4 | 26.6 | 27.6 | 29.1 | 30.2 | 28.7 | 30.7 | 29.0 | 26.7 | 31.6 | 29.4 |
| 20:00 - 21:00 PM | 31.7 | 32.4 | 31.7 | 31.5 | 30.6 | 28.2 | 30.4 | 29.0 | 30.6 | 33.0 | 31.8 | 30.3 | 29.3 | 28.3 | 31.2 |
| 21:00 - 22:00 PM | 33.6 | 34.3 | 33.4 | 33.5 | 32.2 | 31.7 | 31.5 | 33.9 | 32.7 | 34.0 | 32.2 | 33.3 | 31.6 | 32.4 | 33.5 |
| 22:00 - 23:00 PM | 34.1 | 33.4 | 33.7 | 34.1 | 33.4 | 31.3 | 31.5 | 34.0 | 34.7 | 33.7 | 34.3 | 34.6 | 31.7 | 30.2 | 35.1 |
| 23:00 - 24:00 PM | 35.1 | 34.8 | 34.2 | 34.5 | 34.1 | 32.6 | 33.4 | 34.9 | 35.2 | 34.9 | 35.9 | 34.4 | 32.6 | 33.1 | 34.0 |
| Daily Average Green Time | 28.7 | 27.9 | 28.0 | 28.0 | 28.3 | 27.5 | 28.3 | 28.9 | 28.3 | 28.0 | 27.8 | 28.1 | 27.7 | 28.2 | 28.5 |
It is worth mentioning that the optimal GTA was specified based on the total number of cycles in one-hour and the average of optimal GTA of all cycles was presented in Table 4. To enhance the throughput of one specific approach at an intersection, the allocation of green time must be tailored to the real-time traffic conditions and the unique characteristics of that approach. Traditional fixed-time plans, while providing predictability, can fall short in accommodating dynamic traffic patterns. In contrast, adaptive signal control strategies leverage real-time data from various sensors, including advanced technologies like LiDAR, to dynamically adjust green time allocation. These strategies can account for fluctuations in traffic demand, pedestrian crossings, and unexpected events, ensuring that the green phase is optimally allocated to maximize the number of vehicles traversing the intersection during each cycle [20]. Furthermore, intelligent traffic signal controllers can synchronize adjacent intersections and employ predictive algorithms to reduce congestion and improve progression along a corridor, further boosting the throughput of a specific approach. Optimizing the green time allocation of one approach at a signalized intersection benefits extend beyond mere reductions in travel time and congestion. By fine-tuning green time allocation, traffic engineers and transportation authorities can contribute to the minimization of fuel consumption, vehicle emissions, and, ultimately, the carbon footprint of urban areas. These outcomes align with broader sustainability objectives and efforts to create more livable and environmentally responsible cities.
The throughput (T) at a signalized intersection, which represents the number of vehicles passing through a specific approach during a unit of time, is inherently tied to the optimal green time allocation (G) for that approach. While the exact relationship may vary depending on intersection-specific conditions and traffic patterns, the following generalized relationship [18,19] provides insights into the impact of green time allocation on throughput:
Where:
T = (G / C) * SFR
- T is the throughput of the approach.
- G is the green time allocated to the phase of the approach.
- C is the cycle length of the signal control.
- SFR is the saturation flow rate for the specific approach.
This relationship highlights that throughput is influenced by the green time allocation, which is a fraction of the cycle length (G / C), and the saturation flow rate (SFR) for that approach. The saturation flow rate represents the maximum rate at which vehicles can pass through the intersection during the green time. As the green time allocation increases, the throughput generally increases, provided that the saturation flow rate remains constant. However, there is a point of diminishing returns where further increases in green time may not significantly enhance throughput due to factors like diminishing marginal utility. Optimizing green time allocation is a key strategy for traffic engineers seeking to enhance throughput while maintaining efficient traffic flow and minimizing congestion. By continually assessing real-time traffic conditions, the dynamic allocation of green time can adapt to fluctuations in demand, pedestrian crossings, and other variables, thus maximizing the throughput potential of a signalized intersection.
4. Conclusion
The study explored the accuracy of LiDAR sensors in calculating optimal green time allocation at a signalized intersection. In this study, the untapped potential of advanced technology, specifically LiDAR sensor technology was investigated, in the domain of optimizing green time allocation for enhancing the throughput of a single approach at a signalized intersection. The allocation of optimal green time is an intricate and indispensable aspect of achieving these objectives, as it dictates the flow and coordination of vehicles within the urban landscapes. This research has contributed to the burgeoning field of intelligent traffic control by demonstrating the transformative capabilities of LiDAR sensors, which offer unparalleled precision and adaptability in the quest for optimized green time allocation.
The findings underscore the viability and promise of LiDAR technology for real-time data collection and its integration into the dynamic control of signalized intersections. The shift towards adaptive green time allocation through the lens of LiDAR sensors holds significant potential to alleviate urban congestion, minimize vehicle delays, and reduce environmental impacts. The synergy between LiDAR technology and traffic signal control represents a bold stride towards harnessing data-driven intelligence for more efficient transportation systems. By continuously monitoring the Marlboro Pike and Brooks Dr. intersection in the state of Maryland, two installed LiDAR sensors enabled the identification of vehicle queues, assessment of traffic patterns, and classification of vehicle types, all of which contribute to more accurate and dynamic green time allocation.
The results, based on simulations and field tests, revealed substantial enhancements in the throughput of the selected approach. The ability to adapt green time allocation in response to real-time conditions ensures that precious seconds are not wasted and that every vehicle movement is optimized. The seamless coordination of vehicle phases further exemplified the transformative potential of this approach. The results not only affirm the feasibility of the LiDAR-based methodology but also highlight its positive repercussions for urban traffic management.
Consequently, it is imperative to recognize that the journey towards optimized green time allocation at signalized intersections equipped with LiDAR sensor technology is just beginning. Future endeavors should aim to refine the intricacies of this approach, exploring the integration of predictive analytics and advanced control strategies to enhance intersection efficiency. As cities evolve and adapt to the ever-changing demands of urban life, the role of LiDAR sensor technology in traffic signal control offers a glimpse into a future where congestion is minimized, environmental sustainability is prioritized, and the daily lives of urban dwellers are significantly improved. In this evolving landscape, the integration of LiDAR technology into traffic engineering practices holds the potential to transform the way we perceive and manage urban mobility, ushering in a new era of intelligent, data-driven, and efficient transportation systems.
As we stand at the intersection of innovation and practical application, several avenues for future studies and research initiatives emerge.
1. Advanced Machine Learning and Predictive Algorithms: The integration of advanced machine learning algorithms in conjunction with LiDAR sensor data holds the potential for even more adaptive and predictive green time allocation. Future research could delve into the development of machine learning models that use historical and real-time data to anticipate traffic patterns and allocate green time with remarkable accuracy. By incorporating predictive analytics, signalized intersections could proactively respond to changing conditions, thus further reducing delays and congestion.
2. Multi-Intersection Coordination: While this study focused primarily on optimizing green time allocation for a single approach, there is a pressing need to investigate the possibilities of multi-intersection coordination. The effective synchronization of signals at adjacent intersections, especially in urban corridors, remains a challenge. Future research should explore how LiDAR technology can facilitate real-time communication between neighboring signalized intersections, enabling the orchestration of green time allocation along a corridor. Such studies could significantly enhance the uninterrupted flow of traffic for more extensive networks.
3. Environmental Implications: The impact of LiDAR-assisted green time allocation on environmental sustainability warrants further exploration. Research efforts should consider the influence of this technology on reducing vehicle emissions, fuel consumption, and overall air quality within urban areas. Assessing the environmental implications of dynamic green time allocation offers the potential to align transportation engineering with sustainability goals and emissions reduction targets.
4. Integration with Autonomous Vehicles: With the ongoing proliferation of autonomous vehicles, future research should address the integration of LiDAR technology in traffic management systems and its synergy with autonomous vehicles. Understanding how LiDAR-equipped vehicles and infrastructure can communicate and collaborate to optimize green time allocation is vital in ensuring a seamless transition to an autonomous and interconnected transportation ecosystem.
5. Real-World Implementation Challenges: Further studies should also delve into the real-world implementation challenges of LiDAR sensor technology, including cost-effectiveness, maintenance, privacy concerns, and public acceptance. As LiDAR becomes more commonplace in urban infrastructure, understanding these practical considerations is essential for its successful integration into traffic engineering practices.
In conclusion, the present research has opened the door to a multitude of future studies and investigations that can advance the state of traffic signal control, intersection efficiency, and urban mobility. LiDAR sensor technology, as demonstrated in this study, represents a powerful tool in the pursuit of intelligent, data-driven traffic management. The journey to optimizing green time allocation is an evolving one, and by exploring these future research directions, it will be possible to continue to transform the way we experience and navigate urban transportation systems.
References
- Ansariyar, A. (2023). Precision in Motion: Assessing the Accuracy of LiDAR Sensors for Delay Time Calculation at Signalized Intersections. [CrossRef]
- Ansariyar, A. (2023). Real-time Traffic Control and Safety Measures Analysis Using LiDAR Sensor during Traffic Signal Failures. [CrossRef]
- Ansariyar, A., (2023), Providing a comprehensive traffic safety analysis collected by two LiDAR sensors at a signalized intersection. [CrossRef]
- Gunes, F., Bayrakli, S., & Zaim, A. H. (2021). Smart cities and data analytics for intelligent transportation systems: an analytical model for scheduling phases and traffic lights at signalized intersections. Applied Sciences, 11(15), 6816. [CrossRef]
- Ansariyar, A., & Taherpour, A. (2023). Investigating the accuracy rate of vehicle-vehicle conflicts by LIDAR technology and microsimulation in VISSIM and AIMSUN. Advances in Transportation Studies, 61.
- Khayatian, M., Mehrabian, M., Andert, E., Dedinsky, R., Choudhary, S., Lou, Y., & Shirvastava, A. (2020). A survey on intersection management of connected autonomous vehicles. ACM Transactions on Cyber-Physical Systems, 4(4), 1-27. [CrossRef]
- Namazi, E., Li, J., & Lu, C. (2019). Intelligent intersection management systems considering autonomous vehicles: A systematic literature review. IEEE Access, 7, 91946-91965. [CrossRef]
- Chen, L., & Englund, C. (2015). Cooperative intersection management: A survey. IEEE transactions on intelligent transportation systems, 17(2), 570-586.
- Shirazi, M. S., & Morris, B. T. (2016). Looking at intersections: a survey of intersection monitoring, behavior and safety analysis of recent studies. IEEE Transactions on Intelligent Transportation Systems, 18(1), 4-24. [CrossRef]
- Leitner, D., Meleby, P., & Miao, L. (2022). Recent advances in traffic signal performance evaluation. Journal of traffic and transportation engineering (English edition).
- Ansariyar, A., & Taherpour, A. (2023). Statistical analysis of vehicle-vehicle conflicts with a LIDAR sensor in a signalized intersection. Advances in Transportation Studies, 60.
- Abdelghaffar, H. M., & Rakha, H. A. (2019). A novel decentralized game-theoretic adaptive traffic signal controller: Large-scale testing. Sensors, 19(10), 2282. [CrossRef]
- Pourmehrab, M., Emami, P., Martin-Gasulla, M., Wilson, J., Elefteriadou, L., & Ranka, S. (2020). Signalized intersection performance with automated and conventional vehicles: A comparative study. Journal of Transportation Engineering, Part A: Systems, 146(9), 04020089. [CrossRef]
- Yao, R., & Michael Zhang, H. (2013). Optimal allocation of lane space and green splits of isolated signalized intersections with short left-turn lanes. Journal of Transportation Engineering, 139(7), 667-677. [CrossRef]
- Chen, S., & Sun, D. J. (2016). An improved adaptive signal control method for isolated signalized intersection based on dynamic programming. IEEE Intelligent Transportation Systems Magazine, 8(4), 4-14. [CrossRef]
- Yao, R., Zhou, H., & Ge, Y. E. (2018). Optimizing signal phase plan, green splits and lane length for isolated signalized intersections. Transport, 33(2), 520-535. [CrossRef]
- Li, Z., Elefteriadou, L., & Ranka, S. (2014). Signal control optimization for automated vehicles at isolated signalized intersections. Transportation Research Part C: Emerging Technologies, 49, 1-18. [CrossRef]
- Part, D. (2010). Highway safety manual. American Association of State Highway and Transportation Officials: Washington, DC, USA, 19192.
- Highway Capacity Manual 7th Edition, (2022), A Guide for Multimodal Mobility Analysis, Washington, DC, USA, https://nap.nationalacademies.org/catalog/26432/highway-capacity-manual-7th-edition-a-guide-for-multimodal-mobility.
- Liu, H., Balke, K. N., & Lin, W. H. (2008). A reverse causal-effect modeling approach for signal control of an oversaturated intersection. Transportation Research Part C: Emerging Technologies, 16(6), 742-754. [CrossRef]
Disclaimer/Publisher’s Note: The statements, opinions and data contained in all publications are solely those of the individual author(s) and contributor(s) and not of MDPI and/or the editor(s). MDPI and/or the editor(s) disclaim responsibility for any injury to people or property resulting from any ideas, methods, instructions or products referred to in the content. |
© 2023 by the authors. Licensee MDPI, Basel, Switzerland. This article is an open access article distributed under the terms and conditions of the Creative Commons Attribution (CC BY) license (http://creativecommons.org/licenses/by/4.0/).
Copyright: This open access article is published under a Creative Commons CC BY 4.0 license, which permit the free download, distribution, and reuse, provided that the author and preprint are cited in any reuse.