

Submitted:
17 October 2023
Posted:
18 October 2023
You are already at the latest version
Abstract
Omega-3 polyunsaturated fatty acids (PUFA) play a pivotal role in health, wellbeing, and inflammatory diseases in humans. Lack of omega-3 consumption is associated with diseases. Specialized Pro-resolving Mediators (SPM) are produced from Omega-3-PUFAs and accelerate resolution of inflammation. They are classified as resolvins, maresins, protectins, and lipoxins. SPMs actions in resolution consist in limiting neutrophilic infiltration, promote the clearance of apoptotic cell and cellular debris, enhancing efferocytosis and phagocytosis, counter regulate the production of pro-inflammatory mediators such as chemokines and cytokines, and promote pro-resolving macrophage phenotype. We identified temporal plasma and serum increases of SPMs after 6 g of oral supplementation of SPM-enriched emulsion in ten healthy subjects. We also described temporal increases of omega-3, as well as pharmacokinetics fundamentals in plasma and serum using LC-MS/MS lipid profiling. These results provide evidence of temporal increases of SPMs that together support the idea that given oral supplementation is a good source of essential bioactive SPMs.
Keywords:
lipids
; omega3
; resolution
; polyunsaturated fatty acids
; Specialized pro-resolving mediators
; immune function
; autoimmune disease
; resolvins.
1. Introduction
In 1971 Bang, Dyerberg, and Nielsen discovered the importance of omega3 fatty acids in health and its benefits in inflammatory diseases, by analyzing the plasma of 130 Eskimos from Umanak, a district on the northern part of the west coast in Greenland [1]. These essential nutrients must be taken from food sources since their production in mammals is limited. Over the years, interest in supplementation with omega-3 fatty acids has been proposed to counteract the hampers of inflammatory diseases. Therefore, it seems a good approach to supplement humans with these essential nutrients [2]. While most epidemiological evidence and randomized control trials (RCTs) indicate the protective role of omega-3 on general health and wellbeing, there are some clinical studies that have shown no effect [3]. Of note, the mechanisms of these protective effects are poorly understood. To this, Prof. Serhan discovered that termination of inflammation is an active process orchestrated by natural lipid mediators, namely specialized pro-resolving mediators (SPM) [4,5,6,7,8].
Eicosapentaenoic acid (EPA) and docosahexaenoic acid (DHA), are needed nutrients in humans diet at all stages of life for the resolution of inflammation [9]. Free fatty acids (FFA) EPA, DHA, arachidonic acid (AA), and docosapentaenoic acid (DPA) are the substrates required for enzymes to convert from omegas ultimately into SPMs. This conversion of FFA first to monohydroxylated mediators, also known as monohydroxylated SPMs, and then to di- and tri- hydroxo SPMs, follow complex synthetic pathways that involve epoxydated transient intermediates as well as a variety of enzymes (e.g., cyclooxygenases, lipoxygenases) [10,11,12]. SPMs are a family of lipid mediators classified in Lipoxins (Lx), Resolvins (Rv), Maresins (MaR), and Protectins (PD). Lipoxins derive from AA, while D-series Rv (RvD), MaR, and PD derive from DHA, and E-series Rv (RvE) derive from EPA. SPMs carry their actions via GPCR receptors and have critical roles in cell signaling [13,14,15] and they have been involved in arthritis [16], atherosclerosis [17], diabetes, Alzheimer’s disease [18], sepsis [14], and inflammatory bowel disease among others [19].
SPMs act by limiting neutrophilic infiltration to the inflammatory focus, promoting the clearance of apoptotic cell and cellular debris, enhancing efferocytosis, counter regulating the production of pro-inflammatory mediators such as chemokines and cytokines, and promoting pro-resolving macrophage skewing. Another action of the SPMs is to instruct the adaptive immune system or guide tissue repairment and regeneration processes [16,20]. Their bioactive concentrations have been established in different human organs, tissues, and fluids such as brain [21,22], vagus nerve [23], lymph node [24], spleen [24,25], adipose tissue [26], placenta [27], bone marrow [28], cerebral spinal fluid [29], synovial fluid [30], breast milk [31], urine [32], as well as plasma and serum [33]. These observations support the hypothesis that supplementing with omega-3 fatty acid, will increase SPMs amounts in circulation as well as in organs, tissues and their protective actions are mediated via the upregulation of SPM biosynthesis. Recent studies have described that after supplementation of omega-3 rich oils, elevate SPMs amounts in plasma [34]. Nonetheless, the interrelationship between supplementation and increased concentrations of SPMs, their biosynthesis in organs and reprogramming of the immune systems is not well understood yet.
Here, we aim to determine the interconnection between intake of essential nutrients like SPM-enriched oil and how to increase concentrations of the bioactive lipid mediators in peripheral blood. We also intend to determine the pharmacokinetic fundamentals. In order to attain this, we studied the temporal amounts of circulating SPMs, in 10 healthy individuals after consumption of 100ml of SPM-enriched emulsion, in plasma and serum by profiling lipid mediators including pro-inflammatory, pro-resolving, and their precursors using LC-MS/MS. We studied at 0, 3, 6, 9, 12 and 24 hours without SPM-enriched supplementation and at same time points after the nutrition intervention. Results from this study demonstrated that supplementation with an SPM-enriched marine oil leads to an increase in peripheral blood SPM concentration, indicating a role for SPM in mediating the actions of this supplement.
2. Results
Ten healthy volunteers were recruited (five women, five men) and all completed the study. For demographics information see Table 1. The average age was 31.81 ± 5.95 years and the BMI mean of 23.94 ± 3.41 kg/m2. No participants reported any side effects after supplementation, and it was well-tolerated for all during the study. To study the time dependent levels of SPMs in circulation after enriched SPM marine oil supplementation, plasma and serum at 0, 3, 6, 9, 12 and 24h were submitted to targeted lipidomics profiling using LC-MS/MS (see method section).
First, we established a control group by profiling the same time points but giving an oral drinking dose of 100 ml of water. After assessing lipid mediators profiling in plasma (Table 2, Figure 1). We observed that volunteers with oral dosing of water showed no increase or a little decrease in omega-3 FFA from time 0 to 24h. Indeed, the time point at 9h showed a reduction in DPA or at 12h a reduction in EPA and DPA. By contrast, after oral supplementation of SPM-enriched emulsion, we observed a statistically significant increase at almost all times for EPA and DPA compared to time 0h. EPA, was increased at all time points and remained elevated. It increased statistically significantly 2.6 fold times at all measured times, except at 6h was 3.3 fold. DPA was elevated at all time points except for 9h. This FFA peaked at 6h with an increase of 4.2 fold. Interestingly concentrations of AA did not change as well as DHA. When analyzing control serum samples from the same subjects the tendencies of relative abundances of FFAs in serum (Table 3, Figure 1), were similar to plasma. AA and DHA remained unaltered while EPA and DPA were statistically increased after SPM-enriched oil supplementation. Although, DPA was increased only from 3h to 6h and picked at 6h by 2.5 fold. In addition, when we analyzed serum samples after oral dose of water, there were no changes in its FFA over time. Together, this suggests that profiling for FFA either plasma or serum was equally important.
Figure 1.
Median changes in plasma and serum free fatty acids. Mean changes in FFAs concentrations at 3, 6, 9, 12 and 24 hours relative to baseline after water or enriched-SPM marine oil intake. Values are expressed in ng/ml. Diagrams represent control plasma ( ), supplemented plasma (
 ), control serum (
 ) and supplemented serum (
 ). Statistical significance for the time effect was determined by Wilcoxon Signed Rank test (*p<0.05; **p<0.01).
), supplemented plasma (), control serum () and supplemented serum (). Statistical significance for the time effect was determined by Wilcoxon Signed Rank test (*p<0.05; **p<0.01).
Figure 1.
Median changes in plasma and serum free fatty acids. Mean changes in FFAs concentrations at 3, 6, 9, 12 and 24 hours relative to baseline after water or enriched-SPM marine oil intake. Values are expressed in ng/ml. Diagrams represent control plasma (), supplemented plasma (), control serum () and supplemented serum (). Statistical significance for the time effect was determined by Wilcoxon Signed Rank test (*p<0.05; **p<0.01).
), supplemented plasma (), control serum () and supplemented serum (). Statistical significance for the time effect was determined by Wilcoxon Signed Rank test (*p<0.05; **p<0.01).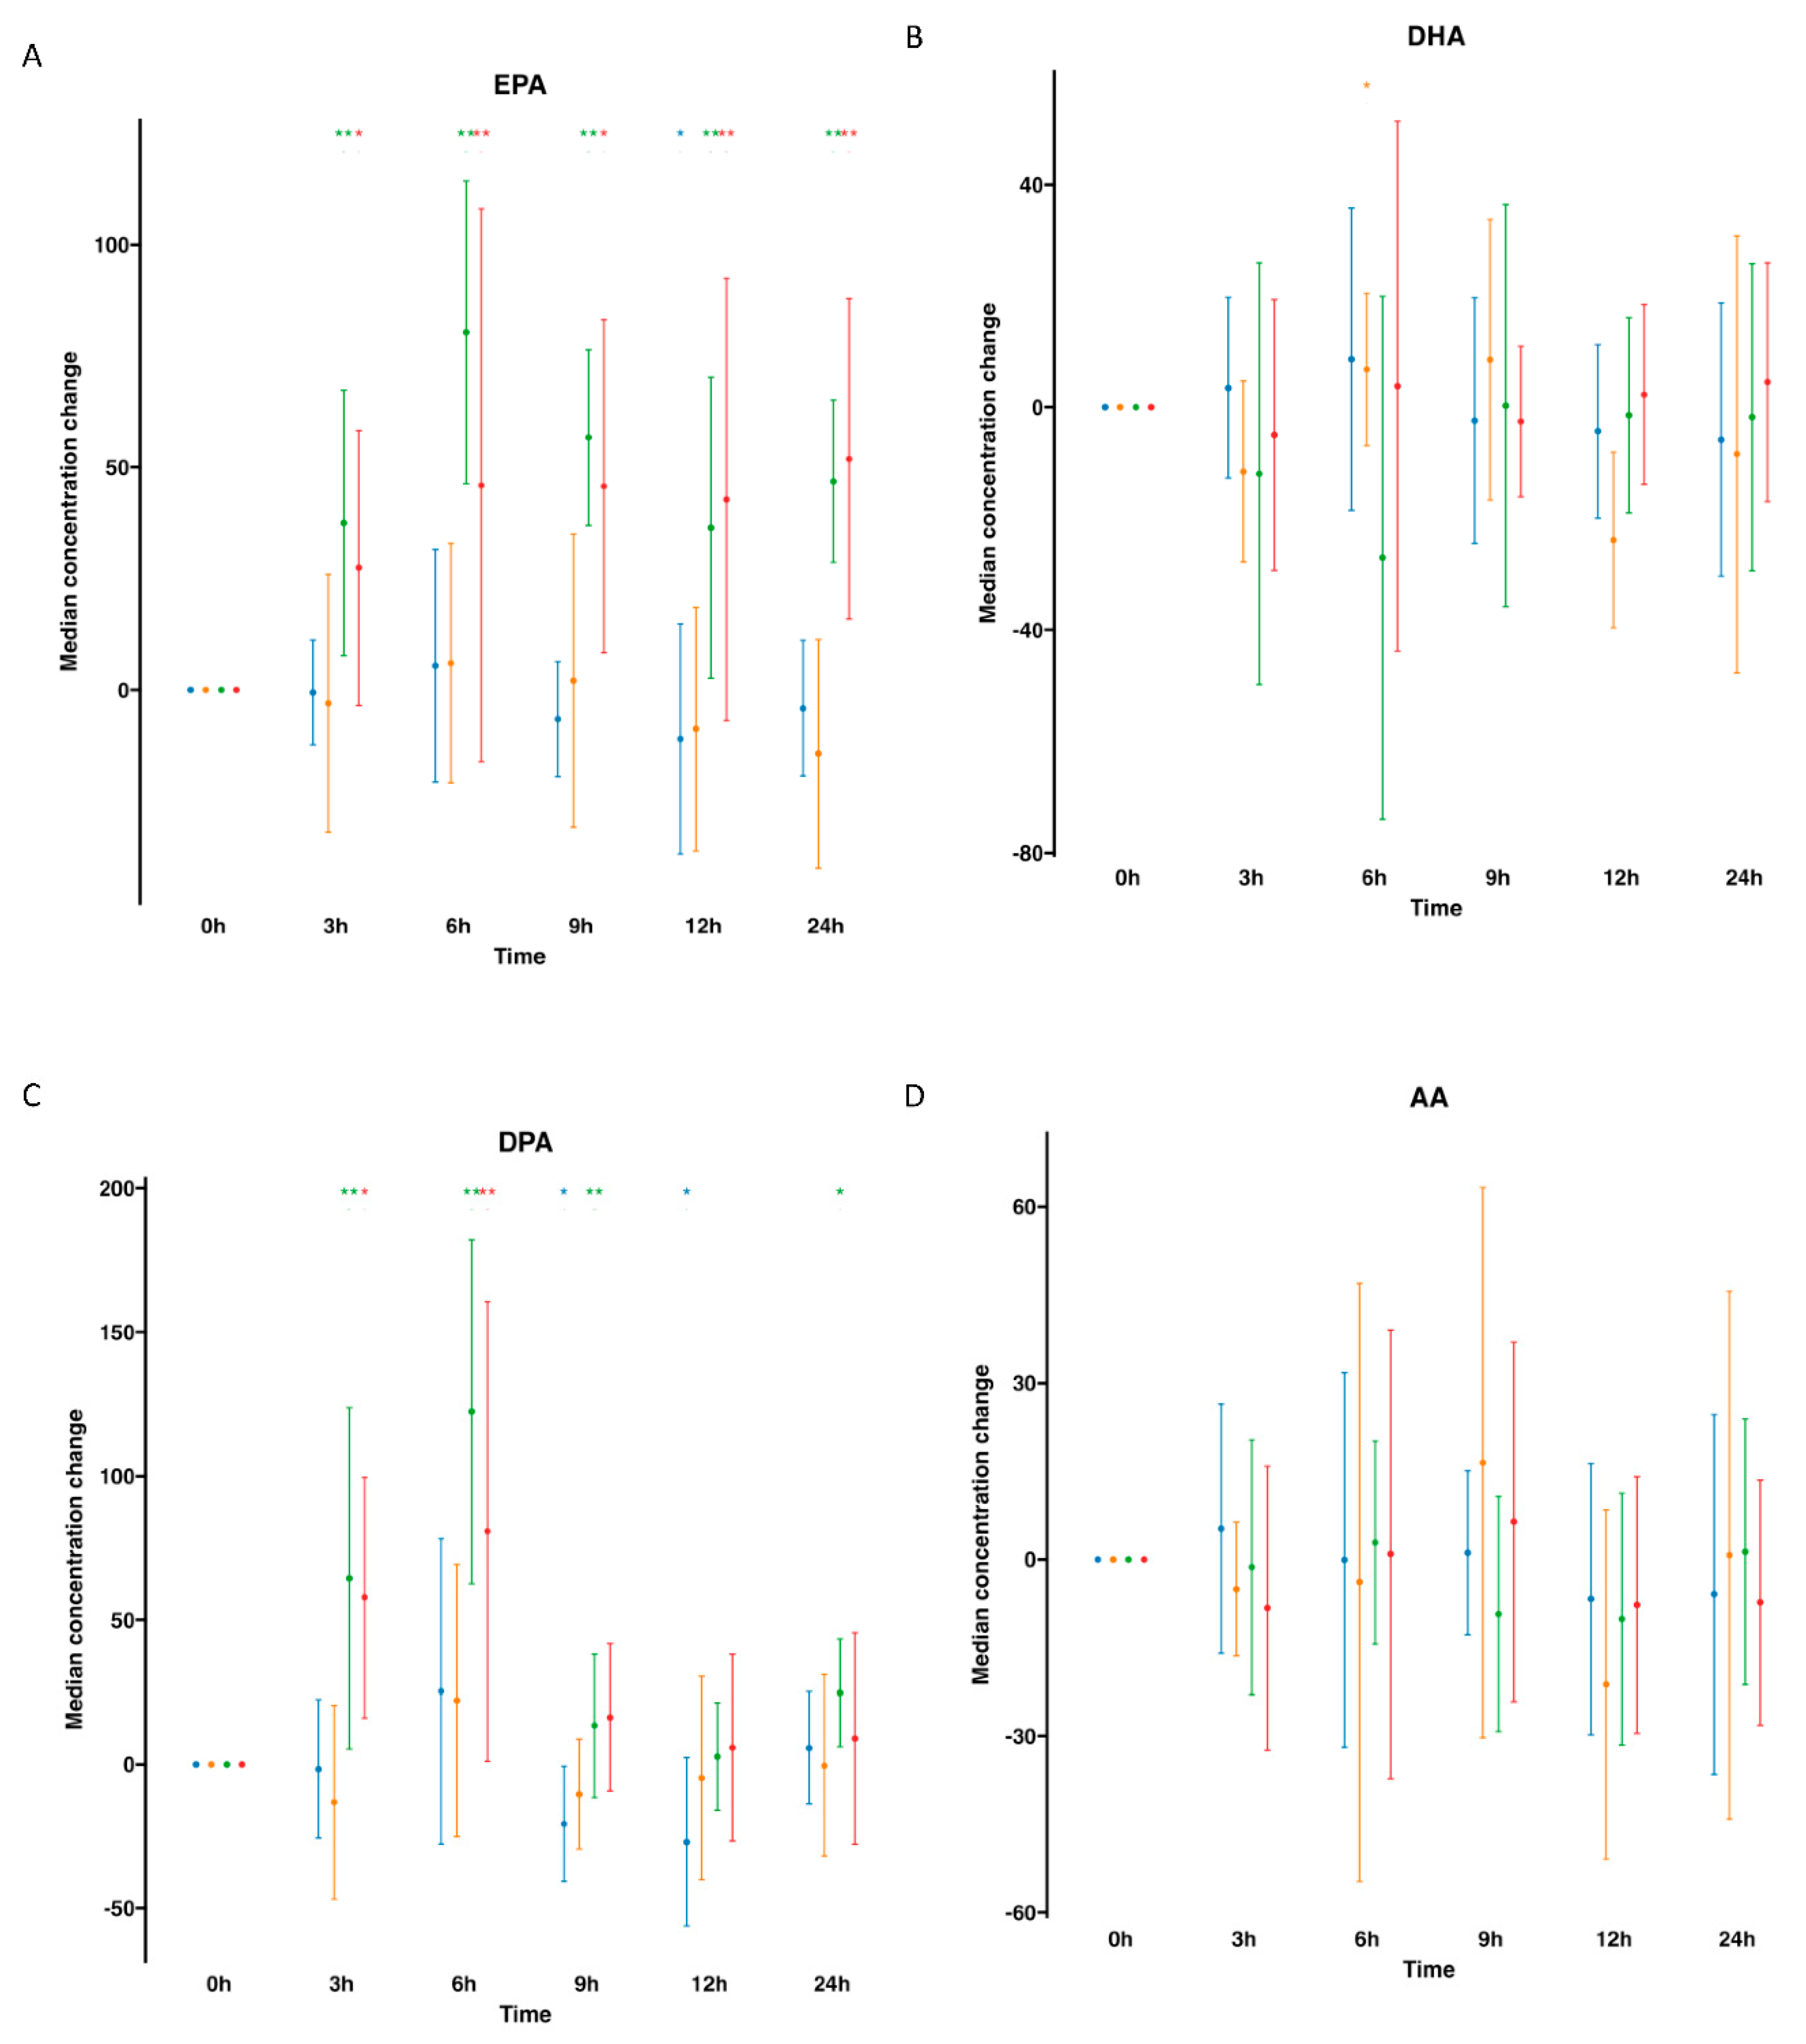
We next focused on SPM-metabolomes, either plasma or serum were profiled. The EPA metabolome included 18-HEPE and RvE1. For human plasmas after water ingestion, their profiles indicated that there were no changes of the metabolites analyzed. For example, 18-HEPE remained unaltered over time compared to time 0. However interestingly, this metabolite was statistically significantly elevated after SPM-enriched oil supplementation at any time point from 3 to 24h compared to time 0. In fact, it increased 134.1 fold times at 3h and progressively reduced over time by 74.5 at 6h, 12 at 9h, 4.1 at 12h, and 3.1 at 24h fold times after supplementation (Table 2, Figure 2). Next, we profiled the serums and analyzed the same EPA metabolome. For serum samples, the EPA metabolome analysis indicated no changes after oral drinking water, except for a slight reduction on 18-HEPE at 12h. On the other hand, after SPM supplementation we found a statistical significance increase in 18-HEPE, that was around 10 fold times from 3 to 6 hour period. Later, 18-HEPE levels diminished over time, returning to basal level. Further metabolites in the synthetic EPA pathway such as RvE1, were not detected either in plasma or serum regardless of supplementation with SPM-enriched oil or given drinking water in these settings (Table 3, Figure 2).
Figure 2.
Median changes in plasma and serum EPA-derived lipid mediators. Mean changes in EPA-derived lipid mediators’ concentrations at 3, 6, 9, 12 and 24 hours relative to baseline after water or enriched-SPM marine oil intake. Values are expressed in ng/ml for 18-HEPE and pg/ml for RvE1. Diagrams represent control plasma ( ), supplemented plasma (
 ), control serum (
 ) and supplemented serum (
 ). Statistical significance for the time effect was determined by Wilcoxon Signed Rank test (*p<0.05; **p<0.01).
), supplemented plasma (), control serum () and supplemented serum (). Statistical significance for the time effect was determined by Wilcoxon Signed Rank test (*p<0.05; **p<0.01).
Figure 2.
Median changes in plasma and serum EPA-derived lipid mediators. Mean changes in EPA-derived lipid mediators’ concentrations at 3, 6, 9, 12 and 24 hours relative to baseline after water or enriched-SPM marine oil intake. Values are expressed in ng/ml for 18-HEPE and pg/ml for RvE1. Diagrams represent control plasma (), supplemented plasma (), control serum () and supplemented serum (). Statistical significance for the time effect was determined by Wilcoxon Signed Rank test (*p<0.05; **p<0.01).
), supplemented plasma (), control serum () and supplemented serum (). Statistical significance for the time effect was determined by Wilcoxon Signed Rank test (*p<0.05; **p<0.01).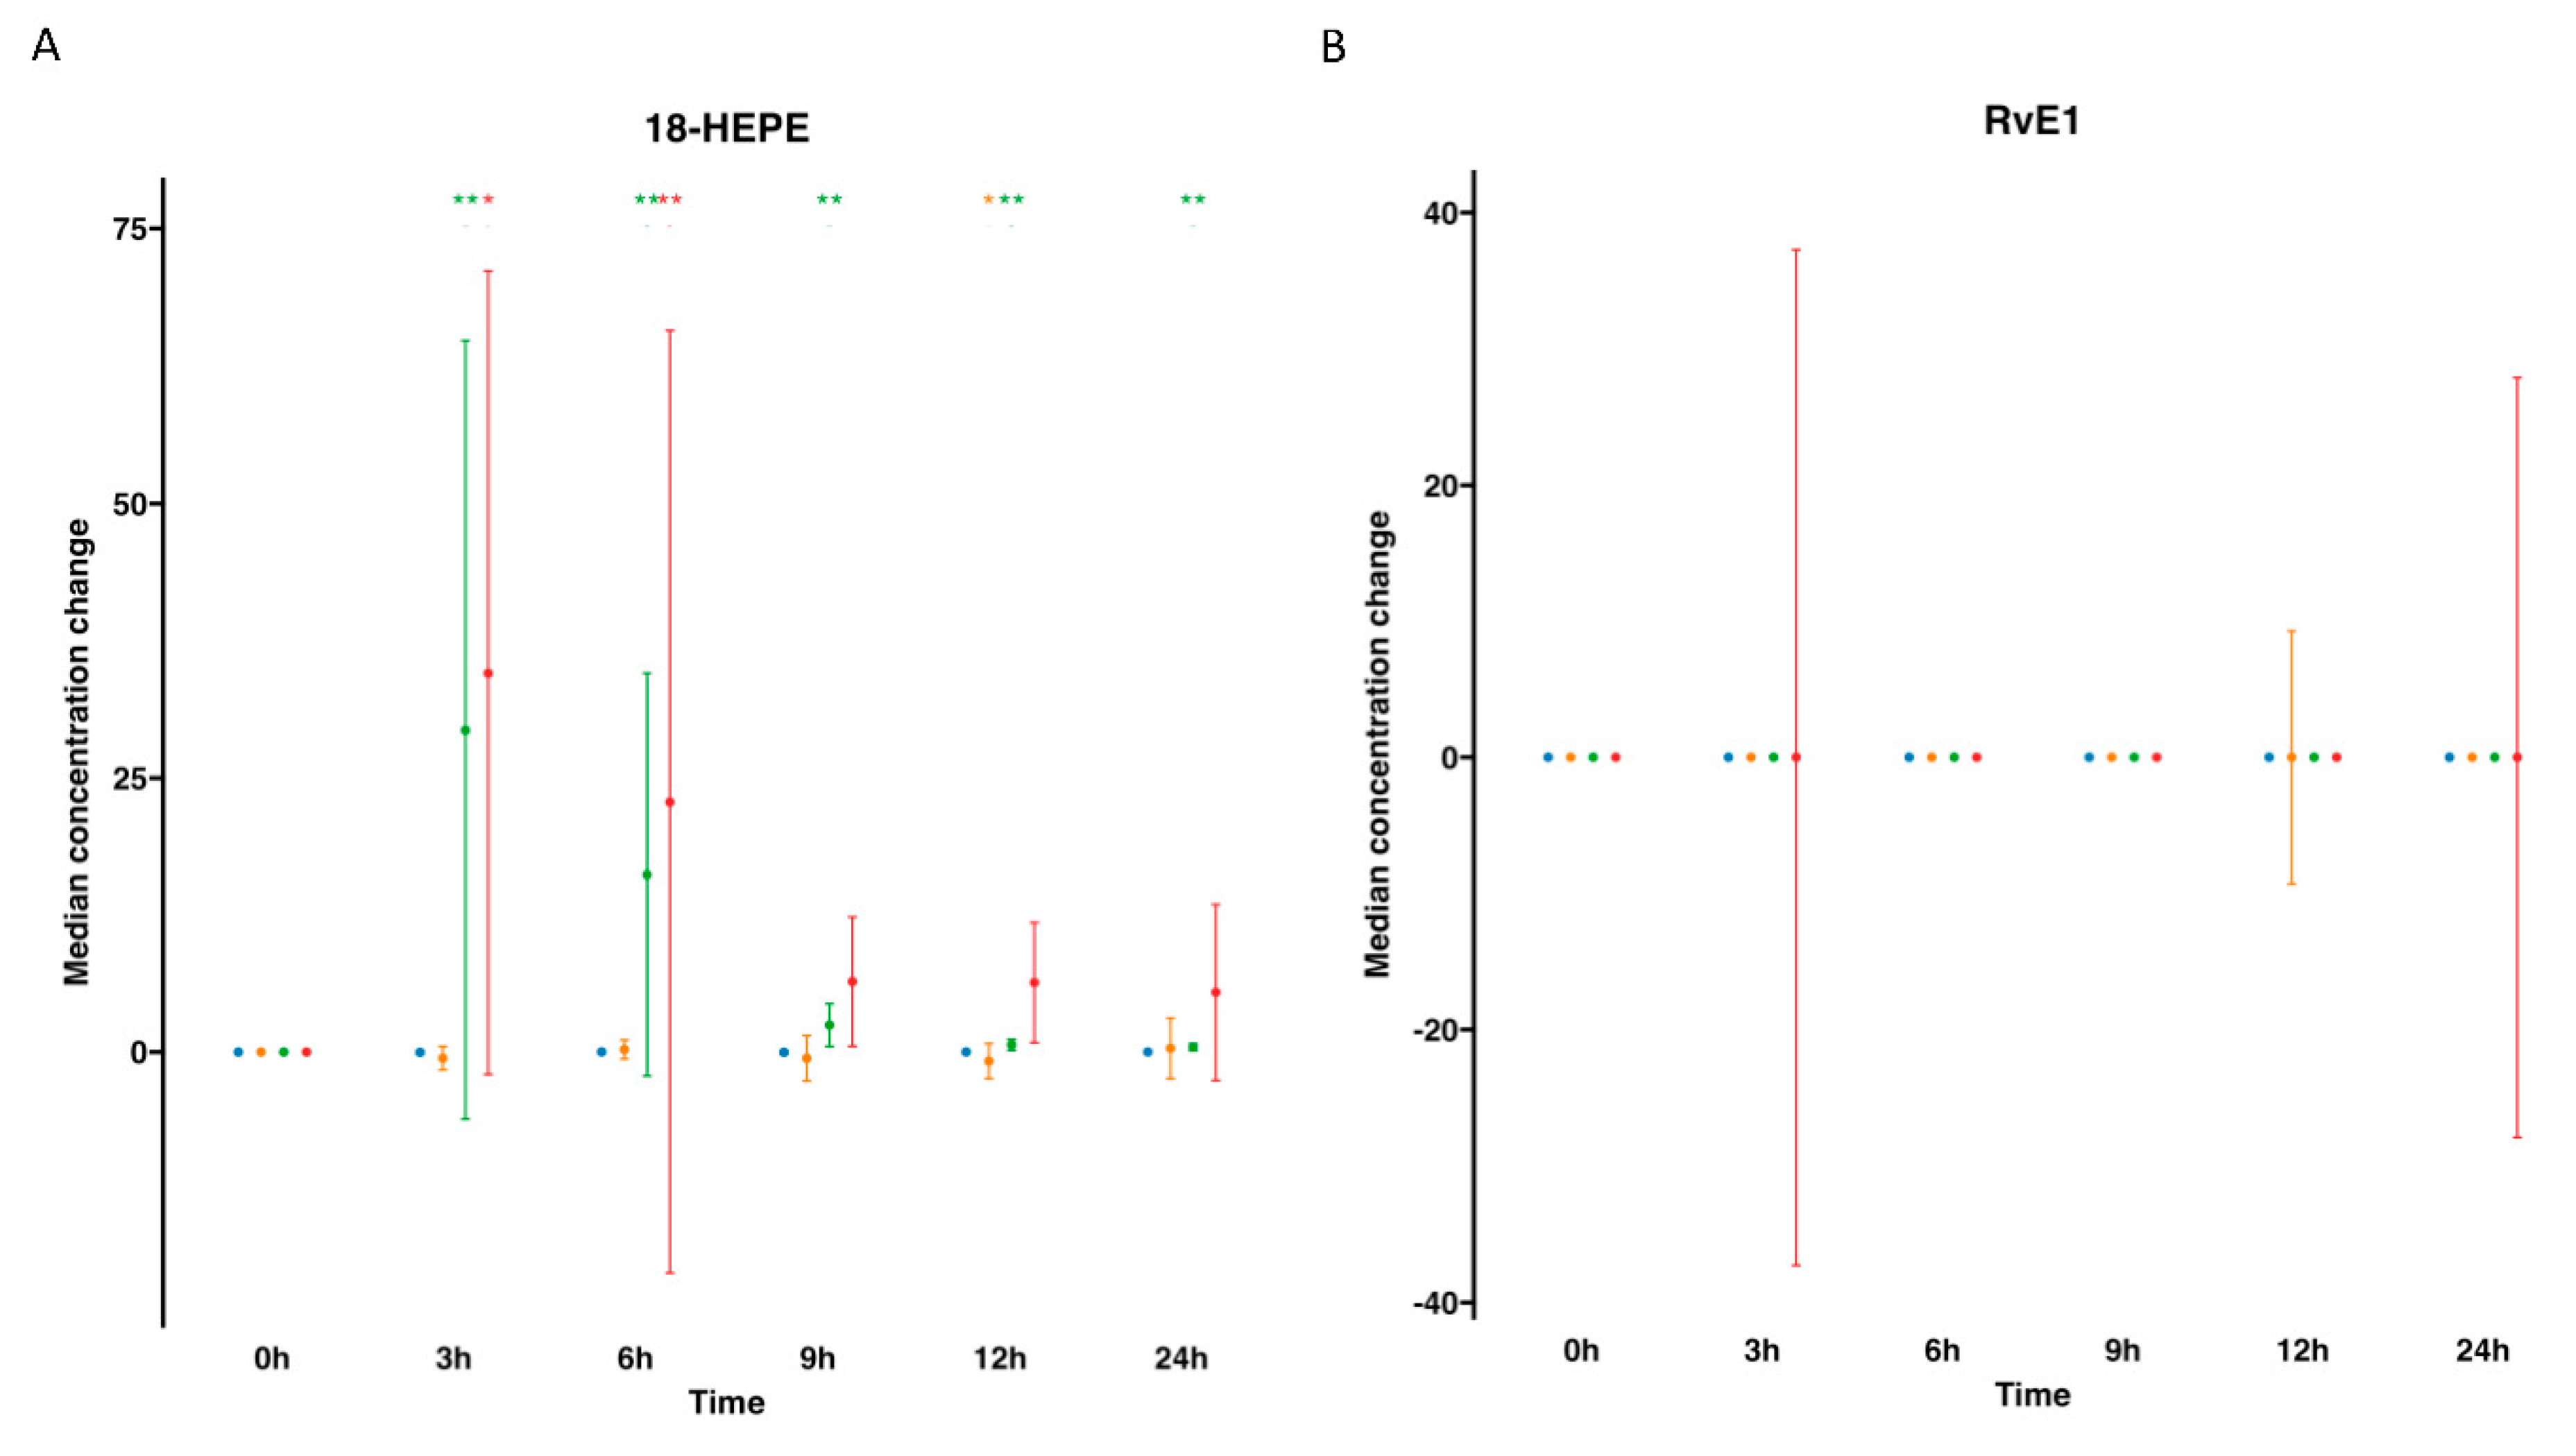
The DHA metabolome included 14-HDHA, 17-HDHA, D-series Rv (RvD1 to RvD5), MaR1, MaR2, PDX, and PD1. For human plasmas after water ingestion, overall did not alter its metabolites levels over time compared to time 0. Although there was an increase in one metabolite (PDX) for one time point (3h). By contrast, after the supplementation, we found a statistically significant increase in median values of several DHA derived SPMs (eg., RvD5, PDx, PD1, MaR1, MaR2, 14-HDHA, and 17-HDHA). The time course progression relative to the levels of these SPMs was for RvD5, 11.8 fold at 3 hours and 4.8 fold at 6 hours. For PDx, 16.5 at 3 hours, and 6.7 at 6 hours. For PD1, 3.7 at 3 hours, and 2.6 at 6 hours. For MaR1, 2.0 fold at 3 hours. MaR2, with a basal median value of 0.0 pg/ml, increased upon supplementation to 39.34, 23.08, 3.23, 2.81 and 1.74 pg/ml at 3, 6, 9, 12 and 24 h, respectively. For 17-HDHA, 38.0 fold from 3 to 6 h, 4.3 and 1.7 fold at 9 and 12 hours, respectively. For 14-HDHA, 24.9 and 45.9 fold at 3h, and 6 h, respectively. (Table 2, Figure 3). Interestingly, we found an increase of RvD1 amounts at 6h by 3.6 fold. Also, RvD3 was increased by 2.2 fold times at 9h post supplementation. This suggested that after oral ω-3 enriched in SPMs supplementation, as early of 3h from the ingestion, the levels of SPMs in circulating blood increased, specifically for RvD5, PDX, PD1, MaR1, MaR2, 14-HDHA, and 17-HDHA and later at 6h for RvD1 and at 9h for RvD3.
Next, we focused on the same DHA metabolome, but analyzing the serum samples (Table 3, Figure 3). For human serum after water ingestion, only point variations of metabolites levels compared to time 0 were registered, mainly reductions in 17-HDHA, PD1 and PDX at 12h and in 14-HDHA at 9 and 12h, except for the increased MaR1 amounts at 3h and 9h. By contrast, after the supplementation, as happened in plasma, we found a statistically significant median increase in several DHA derived SPMs (eg., RvD5, PDx, PD1, MaR2, 14-HDHA, and 17-HDHA). The time course progression relative to basal median levels of these SPMs was for RvD5, around 3.6 fold at 3 and 6 hours. For PD1, 1.6 fold at 3 hours. At 6 hours, 2.9 fold for PDX, 2.2 for 14-HDHA and 4.5 fold for 17-HDHA were increased. That is to say, after oral supplementation, levels of serum SPMs increased as soon as 3 hours for RvD5 and PD1 and at 6 hours for PDX, MaR2, 14-HDHA and 17-HDHA.
The AA metabolome included proresolving lipoxins (LXA4 y LXB4) and pro-inflammatory derived eicosanoids (PGE2, PGD2, PGF2α, LTB4 and TXB2). For human plasmas after water ingestion, there were no changes in the analytes studied except for LTB4 that increased unexpectedly at 9, and 24h, and a slight decrease of PGE2 at 12h. After emulsion supplementation all metabolites analyzed remained mainly unaltered except for PGE2 that augmented at 3 to 6h and TxB2 at a single time point at 3h. Relative to the AA metabolome but in serum samples, without supplementation we did not observe any changes over time. However, when supplemented with SPM emulsion there was reduction of PGD2 at 6h and of LXA4 at 9-12h after supplementation (Table 4 and Table 5, Figure 4).
Figure 3.
Median changes in plasma and serum DHA-derived lipid mediators. Mean changes in DHA-derived lipid mediators’ concentrations at 3, 6, 9, 12 and 24 hours relative to baseline after water or enriched-SPM marine oil intake. Values are expressed in pg/ml except for 14/17-HDHA that are expressed in ng/ml. Diagrams represent control plasma ( ), supplemented plasma (
 ), control serum (
 ) and supplemented serum (
 ). Statistical significance for the time effect was determined by Wilcoxon Signed Rank test (*p<0.05; **p<0.01).
), supplemented plasma (), control serum () and supplemented serum (). Statistical significance for the time effect was determined by Wilcoxon Signed Rank test (*p<0.05; **p<0.01).
Figure 3.
Median changes in plasma and serum DHA-derived lipid mediators. Mean changes in DHA-derived lipid mediators’ concentrations at 3, 6, 9, 12 and 24 hours relative to baseline after water or enriched-SPM marine oil intake. Values are expressed in pg/ml except for 14/17-HDHA that are expressed in ng/ml. Diagrams represent control plasma (), supplemented plasma (), control serum () and supplemented serum (). Statistical significance for the time effect was determined by Wilcoxon Signed Rank test (*p<0.05; **p<0.01).
), supplemented plasma (), control serum () and supplemented serum (). Statistical significance for the time effect was determined by Wilcoxon Signed Rank test (*p<0.05; **p<0.01).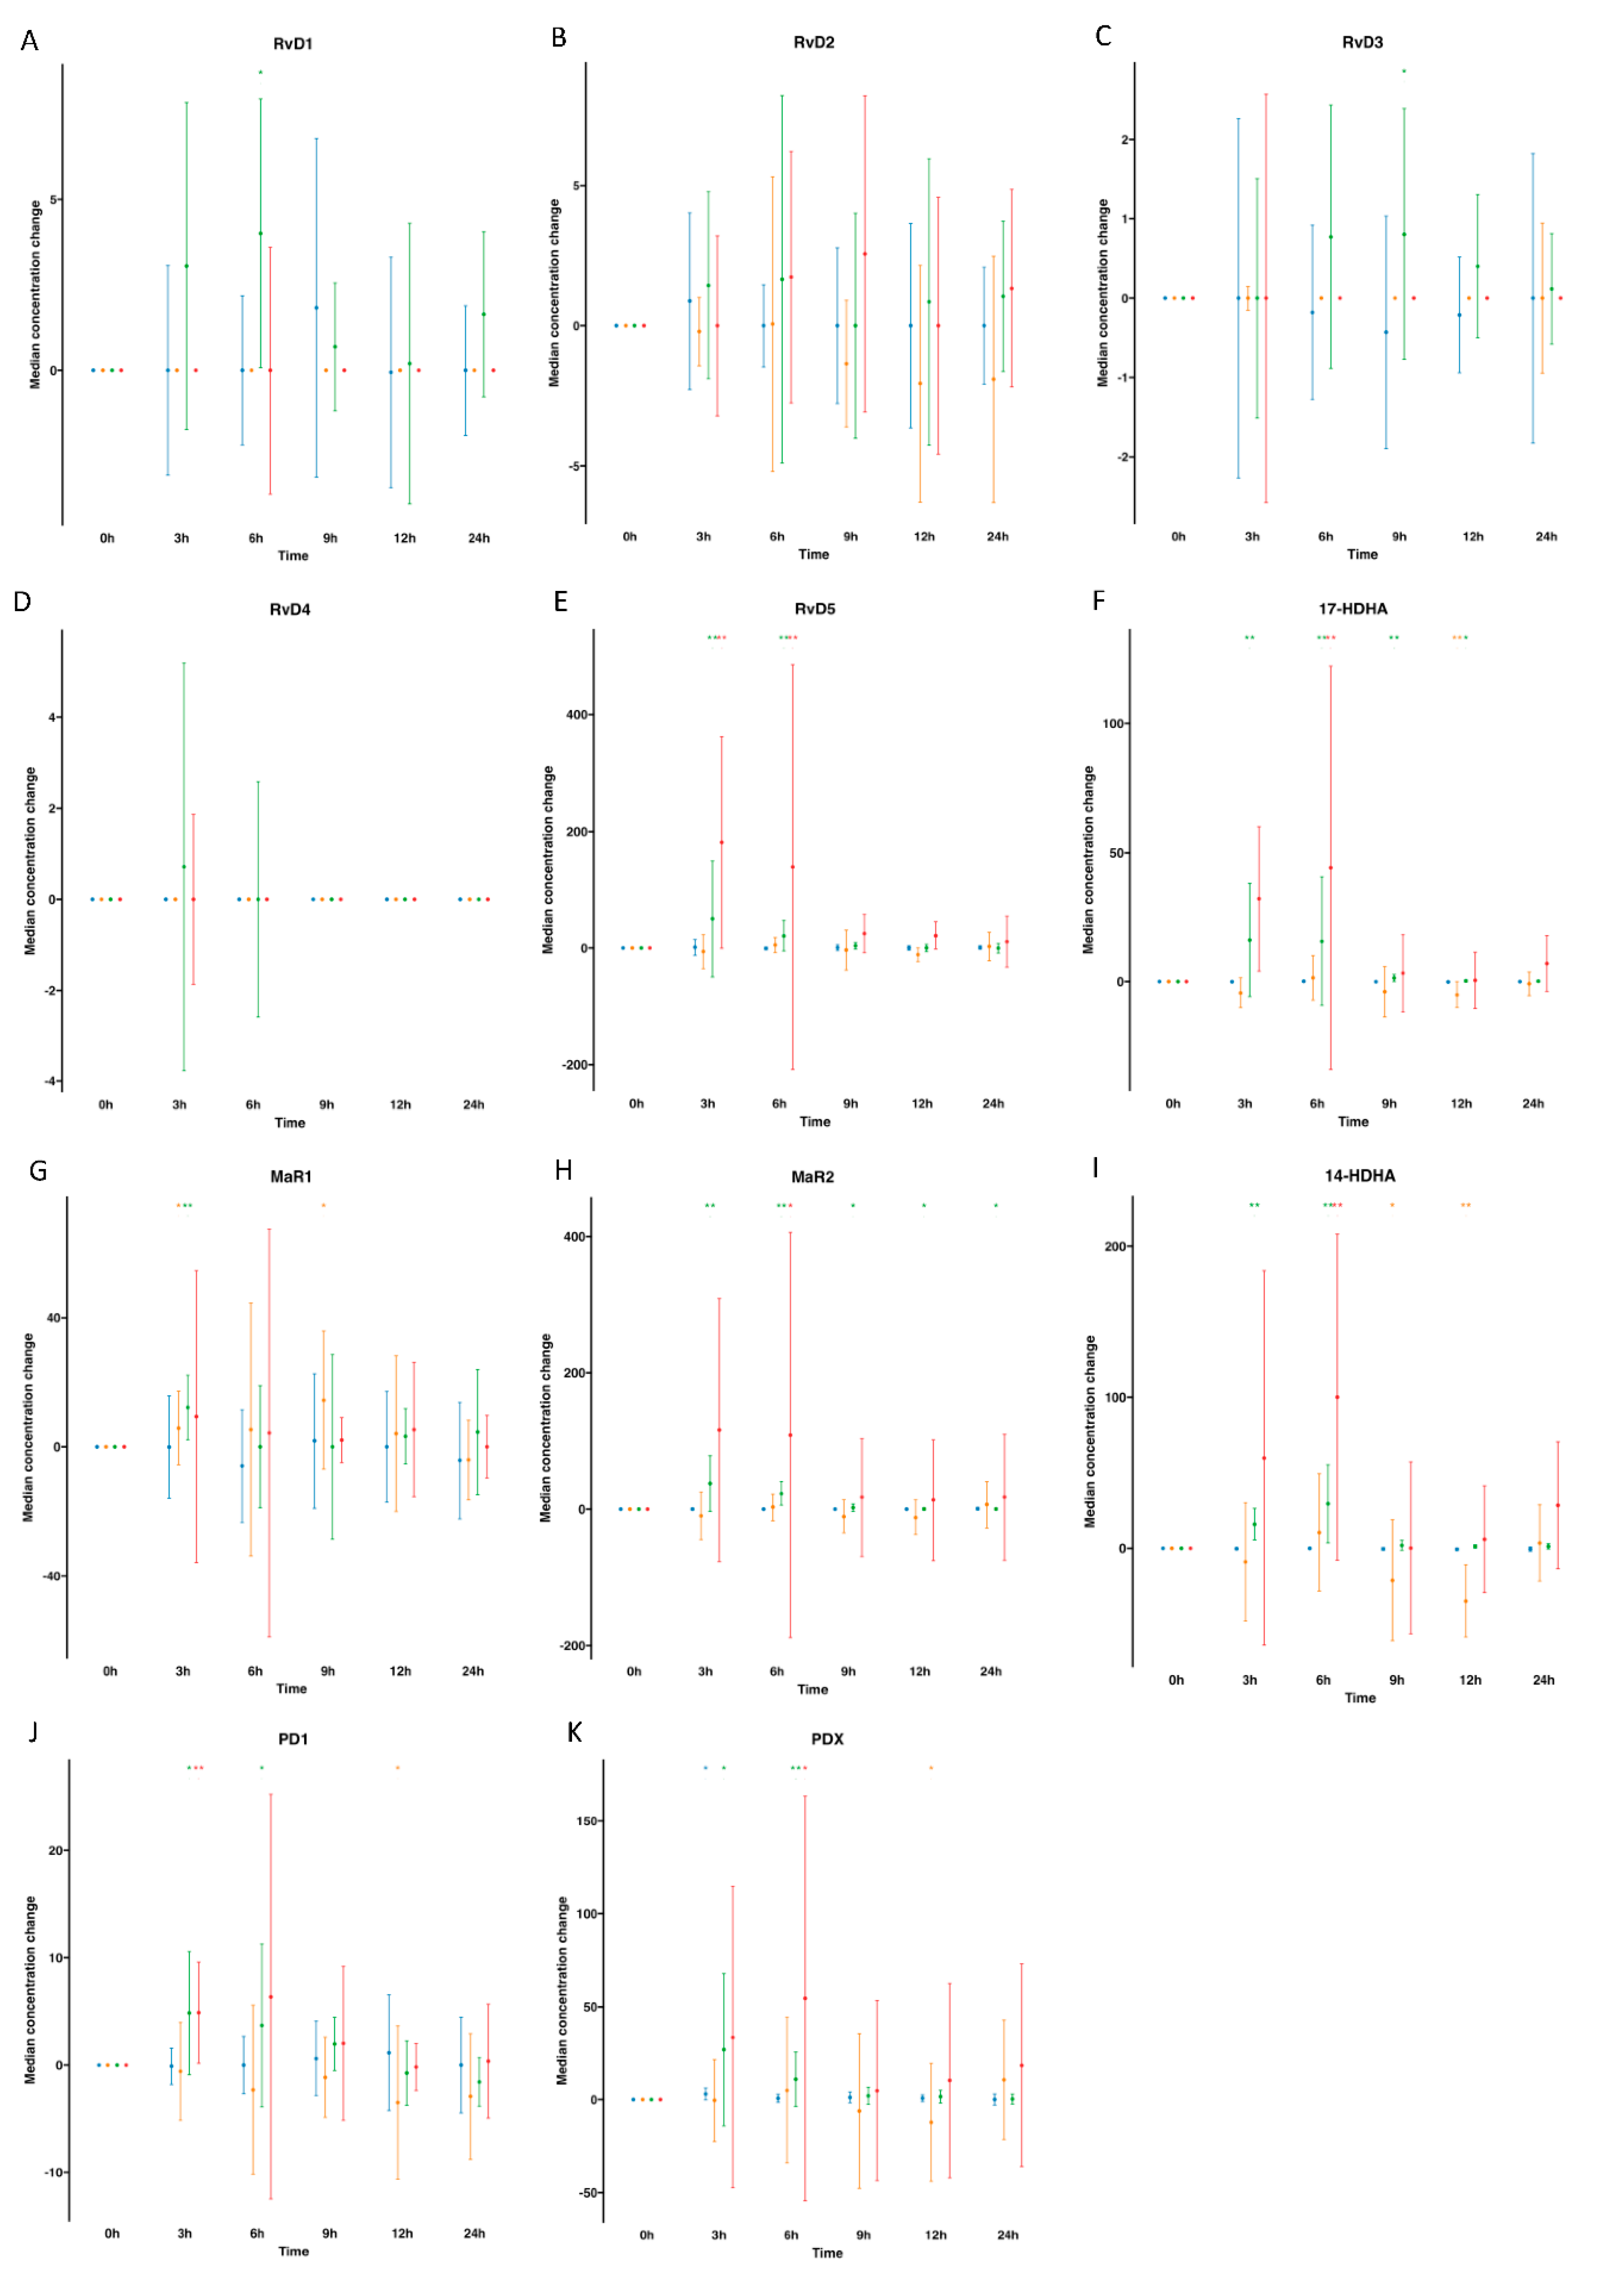
Figure 4.
Median changes in plasma and serum AA-derived lipid mediators. Mean changes in AA-derived lipid mediators’ concentrations at 3, 6, 9, 12 and 24 hours relative to baseline after water or enriched-SPM marine oil intake. Values are expressed in pg/ml. Diagrams represent control plasma ( ), supplemented plasma (
 ), control serum (
 ) and supplemented serum (
 ). Statistical significance for the time effect was determined by Wilcoxon Signed Rank test (*p<0.05; **p<0.01).
), supplemented plasma (), control serum () and supplemented serum (). Statistical significance for the time effect was determined by Wilcoxon Signed Rank test (*p<0.05; **p<0.01).
Figure 4.
Median changes in plasma and serum AA-derived lipid mediators. Mean changes in AA-derived lipid mediators’ concentrations at 3, 6, 9, 12 and 24 hours relative to baseline after water or enriched-SPM marine oil intake. Values are expressed in pg/ml. Diagrams represent control plasma (), supplemented plasma (), control serum () and supplemented serum (). Statistical significance for the time effect was determined by Wilcoxon Signed Rank test (*p<0.05; **p<0.01).
), supplemented plasma (), control serum () and supplemented serum (). Statistical significance for the time effect was determined by Wilcoxon Signed Rank test (*p<0.05; **p<0.01).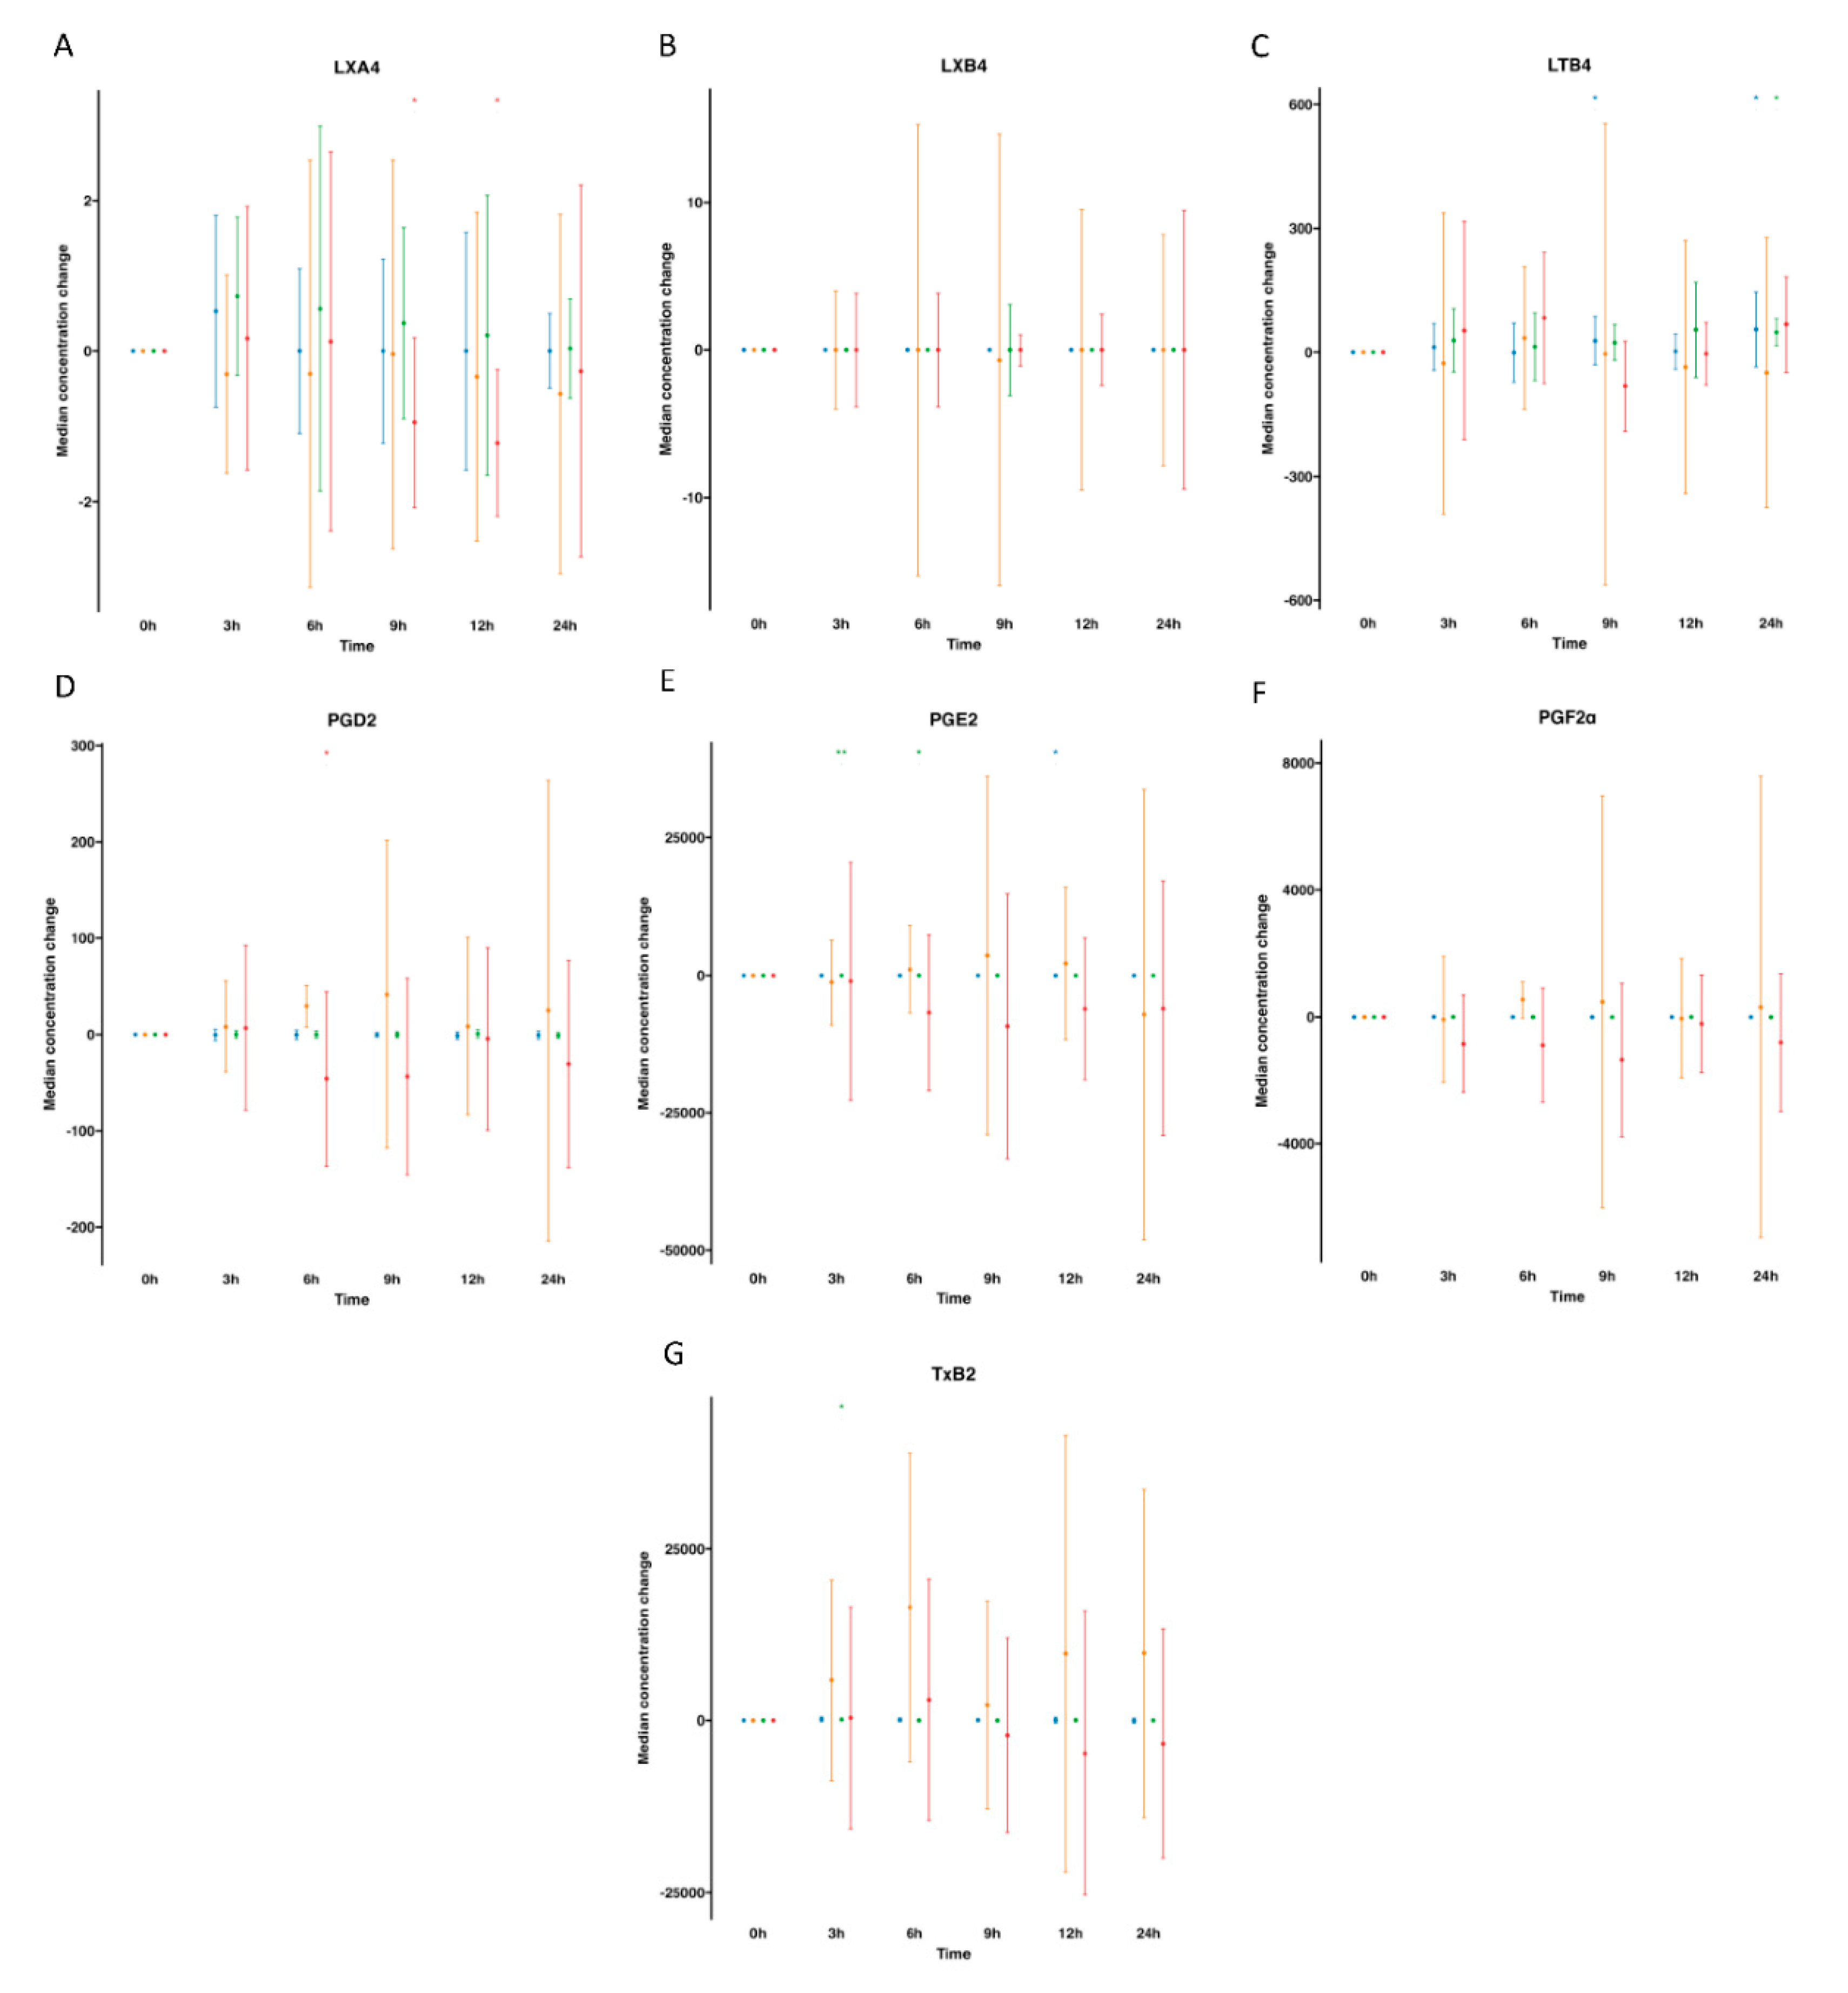
After observing increased pro-resolving mediators in circulation after a single dose of supplementation, we deepen into statistical studies. We used PSL-DA regression model rooted in the differential expression of lipid mediators’ concentrations, comparing from the non-supplemented phase (oral drinking water) and the supplementation with omega-3 enriched in SPMs, in order to identify the key lipid mediators upregulated after dosing. Plasma plots of variable selection outputs at 3-6 hour post supplementation shows differentially increased PDX, PD1, RvD5, MaR2, 14-HDHA, 17-HDHA, 18-HEPE, together with omega-3 DPA and EPA. At 6h post supplementation RvD1 and RvD2 were also differentially increased on treatment group (Figure 5). Relative to serum variable selection outputs at 3-6 hours post supplementation are similarly to that showed in plasma, PDX, PD1, RvD5, MaR2, 14-HDHA, 17-HDHA, 18-HEPE, together with omega-3 DPA and EPA (Figure 6). So, this concludes that apart from EPA, 18-HEPE, 14-HDHA and 17-HDHA included in the emulsion, PDX, PD1, MaR2, RvD5 and DPA were major contributors to supplemented and non-supplemented phases separation.
Figure 5.
Plasma PLS-DA analysis. Results of partial least squares discriminant analysis in plasma. Left panel shows the sample plots from sPLS-DA including 95% confidence ellipses ( , control;
  , supplemented). Right panel plots display the lipid mediator variable importance from component 1, colours indicate the group in which the median is maximum for each analyte (
 , control;
  , supplemented).
, control; , supplemented). Right panel plots display the lipid mediator variable importance from component 1, colours indicate the group in which the median is maximum for each analyte (, control; , supplemented).
Figure 5.
Plasma PLS-DA analysis. Results of partial least squares discriminant analysis in plasma. Left panel shows the sample plots from sPLS-DA including 95% confidence ellipses (, control; , supplemented). Right panel plots display the lipid mediator variable importance from component 1, colours indicate the group in which the median is maximum for each analyte (, control; , supplemented).
, control; , supplemented). Right panel plots display the lipid mediator variable importance from component 1, colours indicate the group in which the median is maximum for each analyte (, control; , supplemented).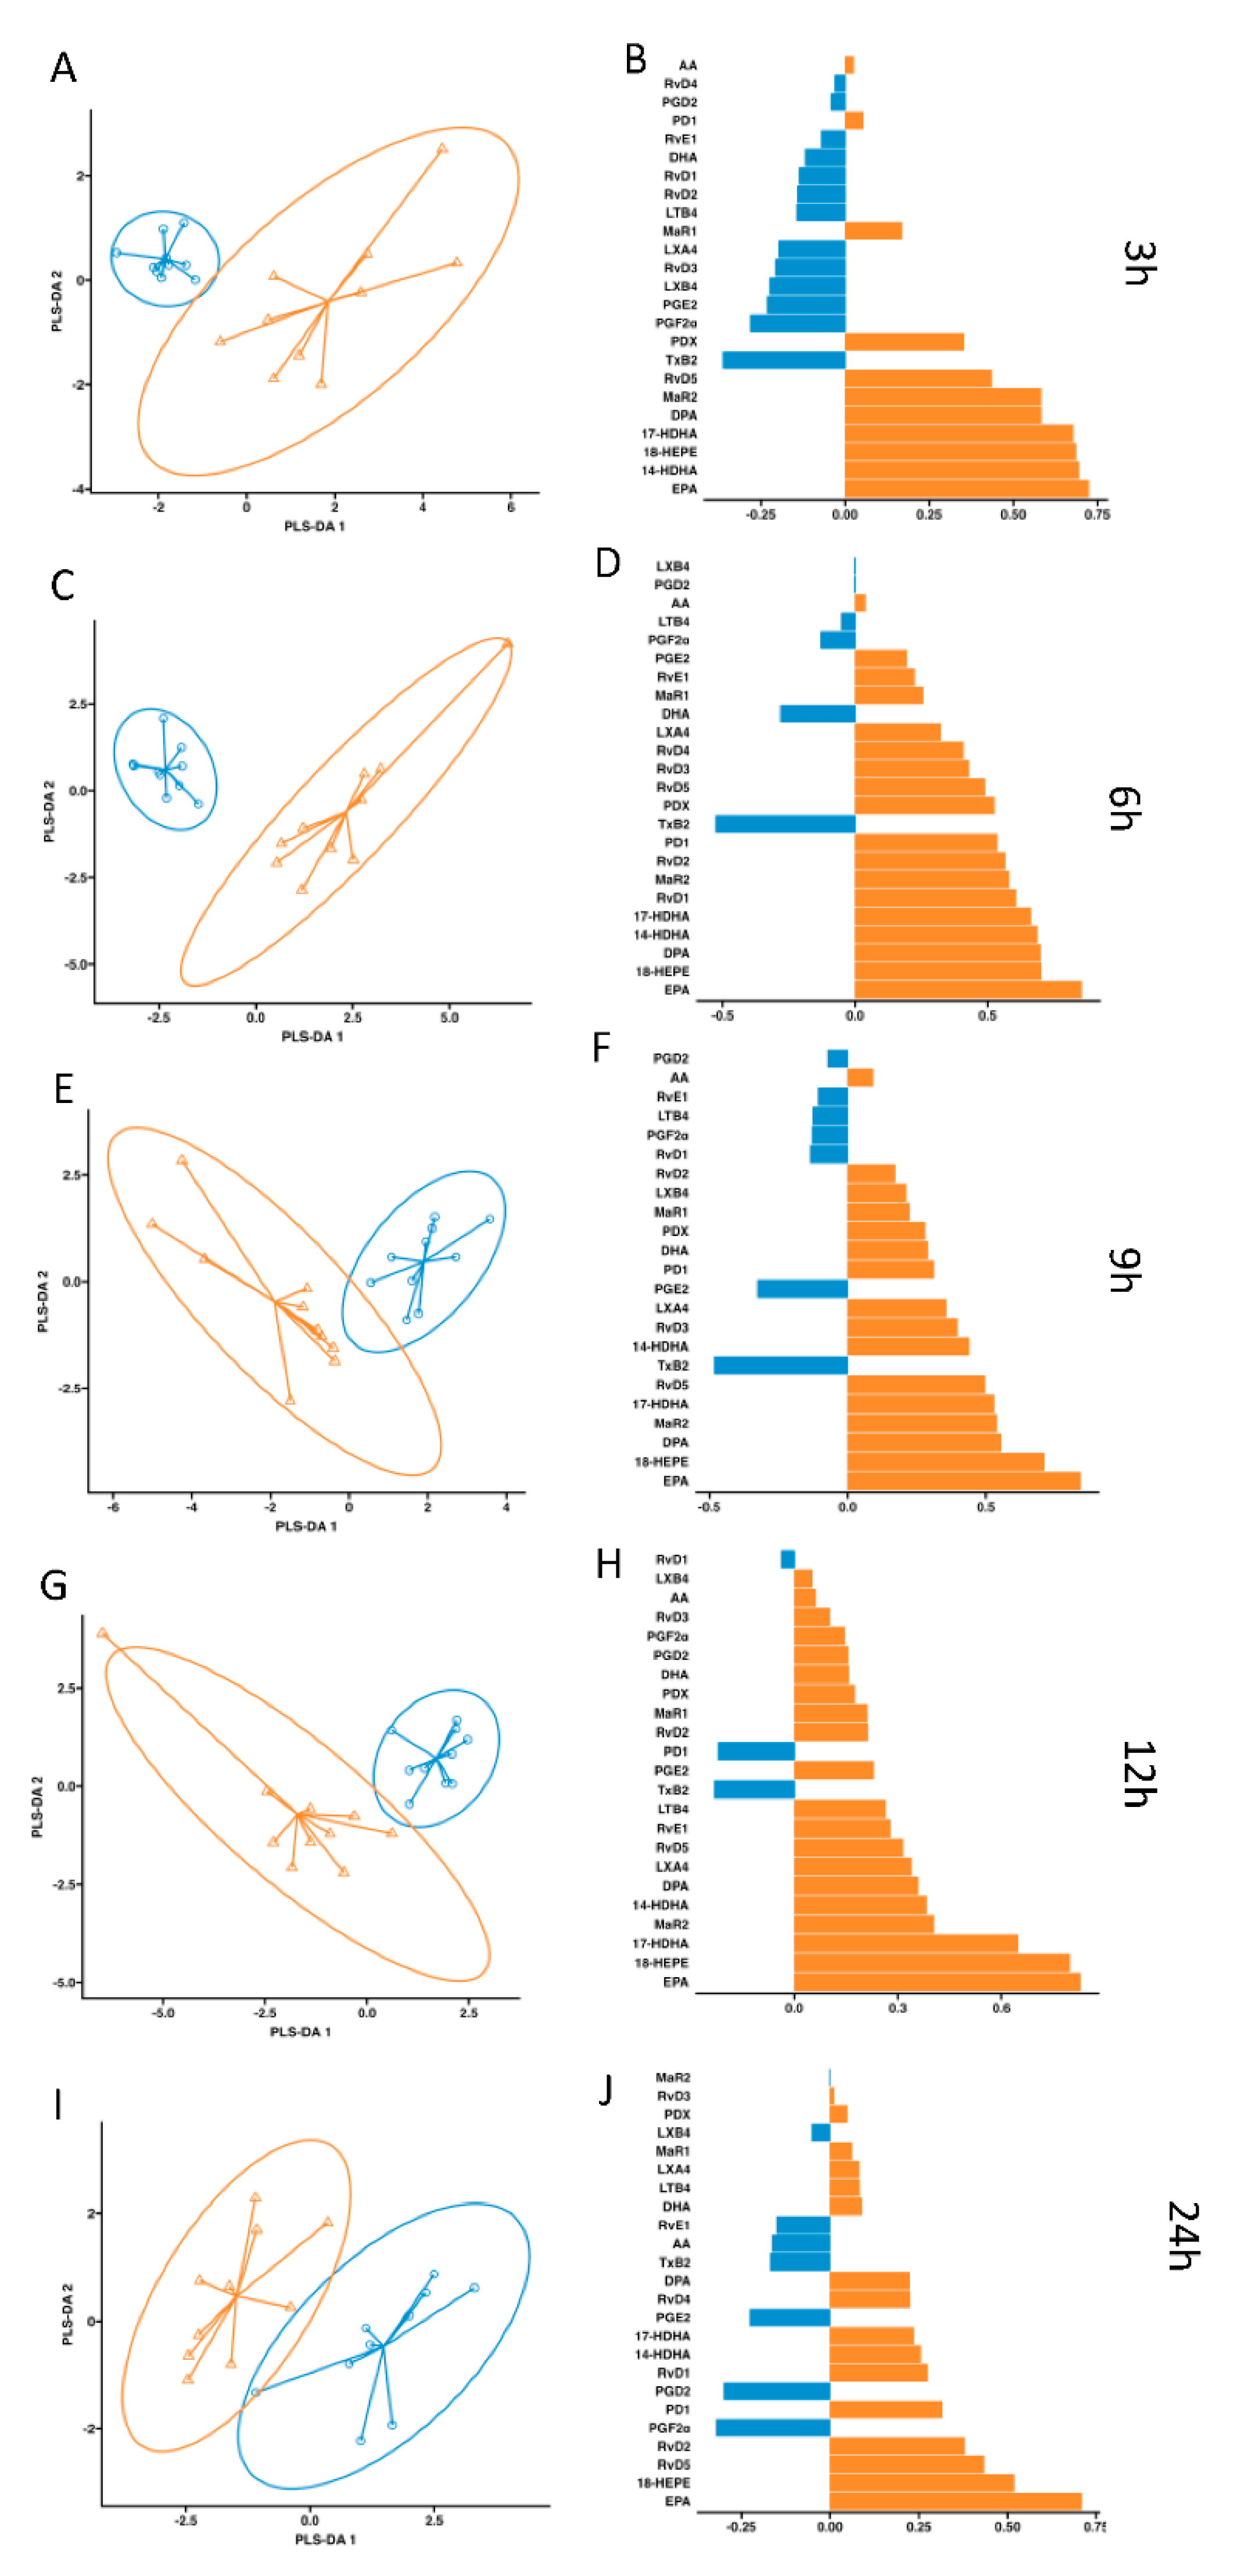
Having established the concentrations over time after oral supplementation of SPM-enriched dose in peripheral blood, we assessed the pharmacokinetic parameters (e.g, Cmax, Tmax and AUC(0-24h)) for EPA, DHA, 14-HDHA, 17-HDHA and 18-HEPE and their derived SPMs in plasma and serum. A single dose of the SPMs-enriched marine oil in healthy subjects increased significantly compared to the control group (dose of water), plasma Cmax and AUC(0-24h) of EPA, 18-HEPE, 14-HDHA, 17-HDHA, RvD5, MaR2, and DPA. In addition, a decrease in Tmax was observed for PD1 and 14-HDHA and increased AUC(0-24h) for PDX (Table 4). Relative to serum determinations, like that described in plasma, supplementation increased significantly compared to the control phase both, plasma Cmax and AUC(0-24h) of EPA, 18-HEPE, 14-HDHA, 17-HDHA, RvD5, MaR2, and DPA. In contrast to that observed in plasma, increased Cmax and AUC(0-24h) for PD1 and increased not only AUC(0-24h) but also Cmax and decreased Tmax was observed for PDX. Changes in serum parameters for some AA-derived metabolites were also found reductions in Cmax and AUC(0-24h) for PGD2, and in Tmax and AUC(0-24h) for PDF2α. A reduction of Tmax was also observed for 18-HEPE (Table 5).
Figure 6.
Serum PLS-DA analysis. Results of partial least squares discriminant analysis in serum Left panel shows the sample plots from sPLS-DA including 95% confidence ellipses ( , control;
  , supplemented). Right panel plots display the lipid mediator variable importance from component 1 (right panel).
, control; , supplemented). Right panel plots display the lipid mediator variable importance from component 1 (right panel).
Figure 6.
Serum PLS-DA analysis. Results of partial least squares discriminant analysis in serum Left panel shows the sample plots from sPLS-DA including 95% confidence ellipses (, control; , supplemented). Right panel plots display the lipid mediator variable importance from component 1 (right panel).
, control; , supplemented). Right panel plots display the lipid mediator variable importance from component 1 (right panel).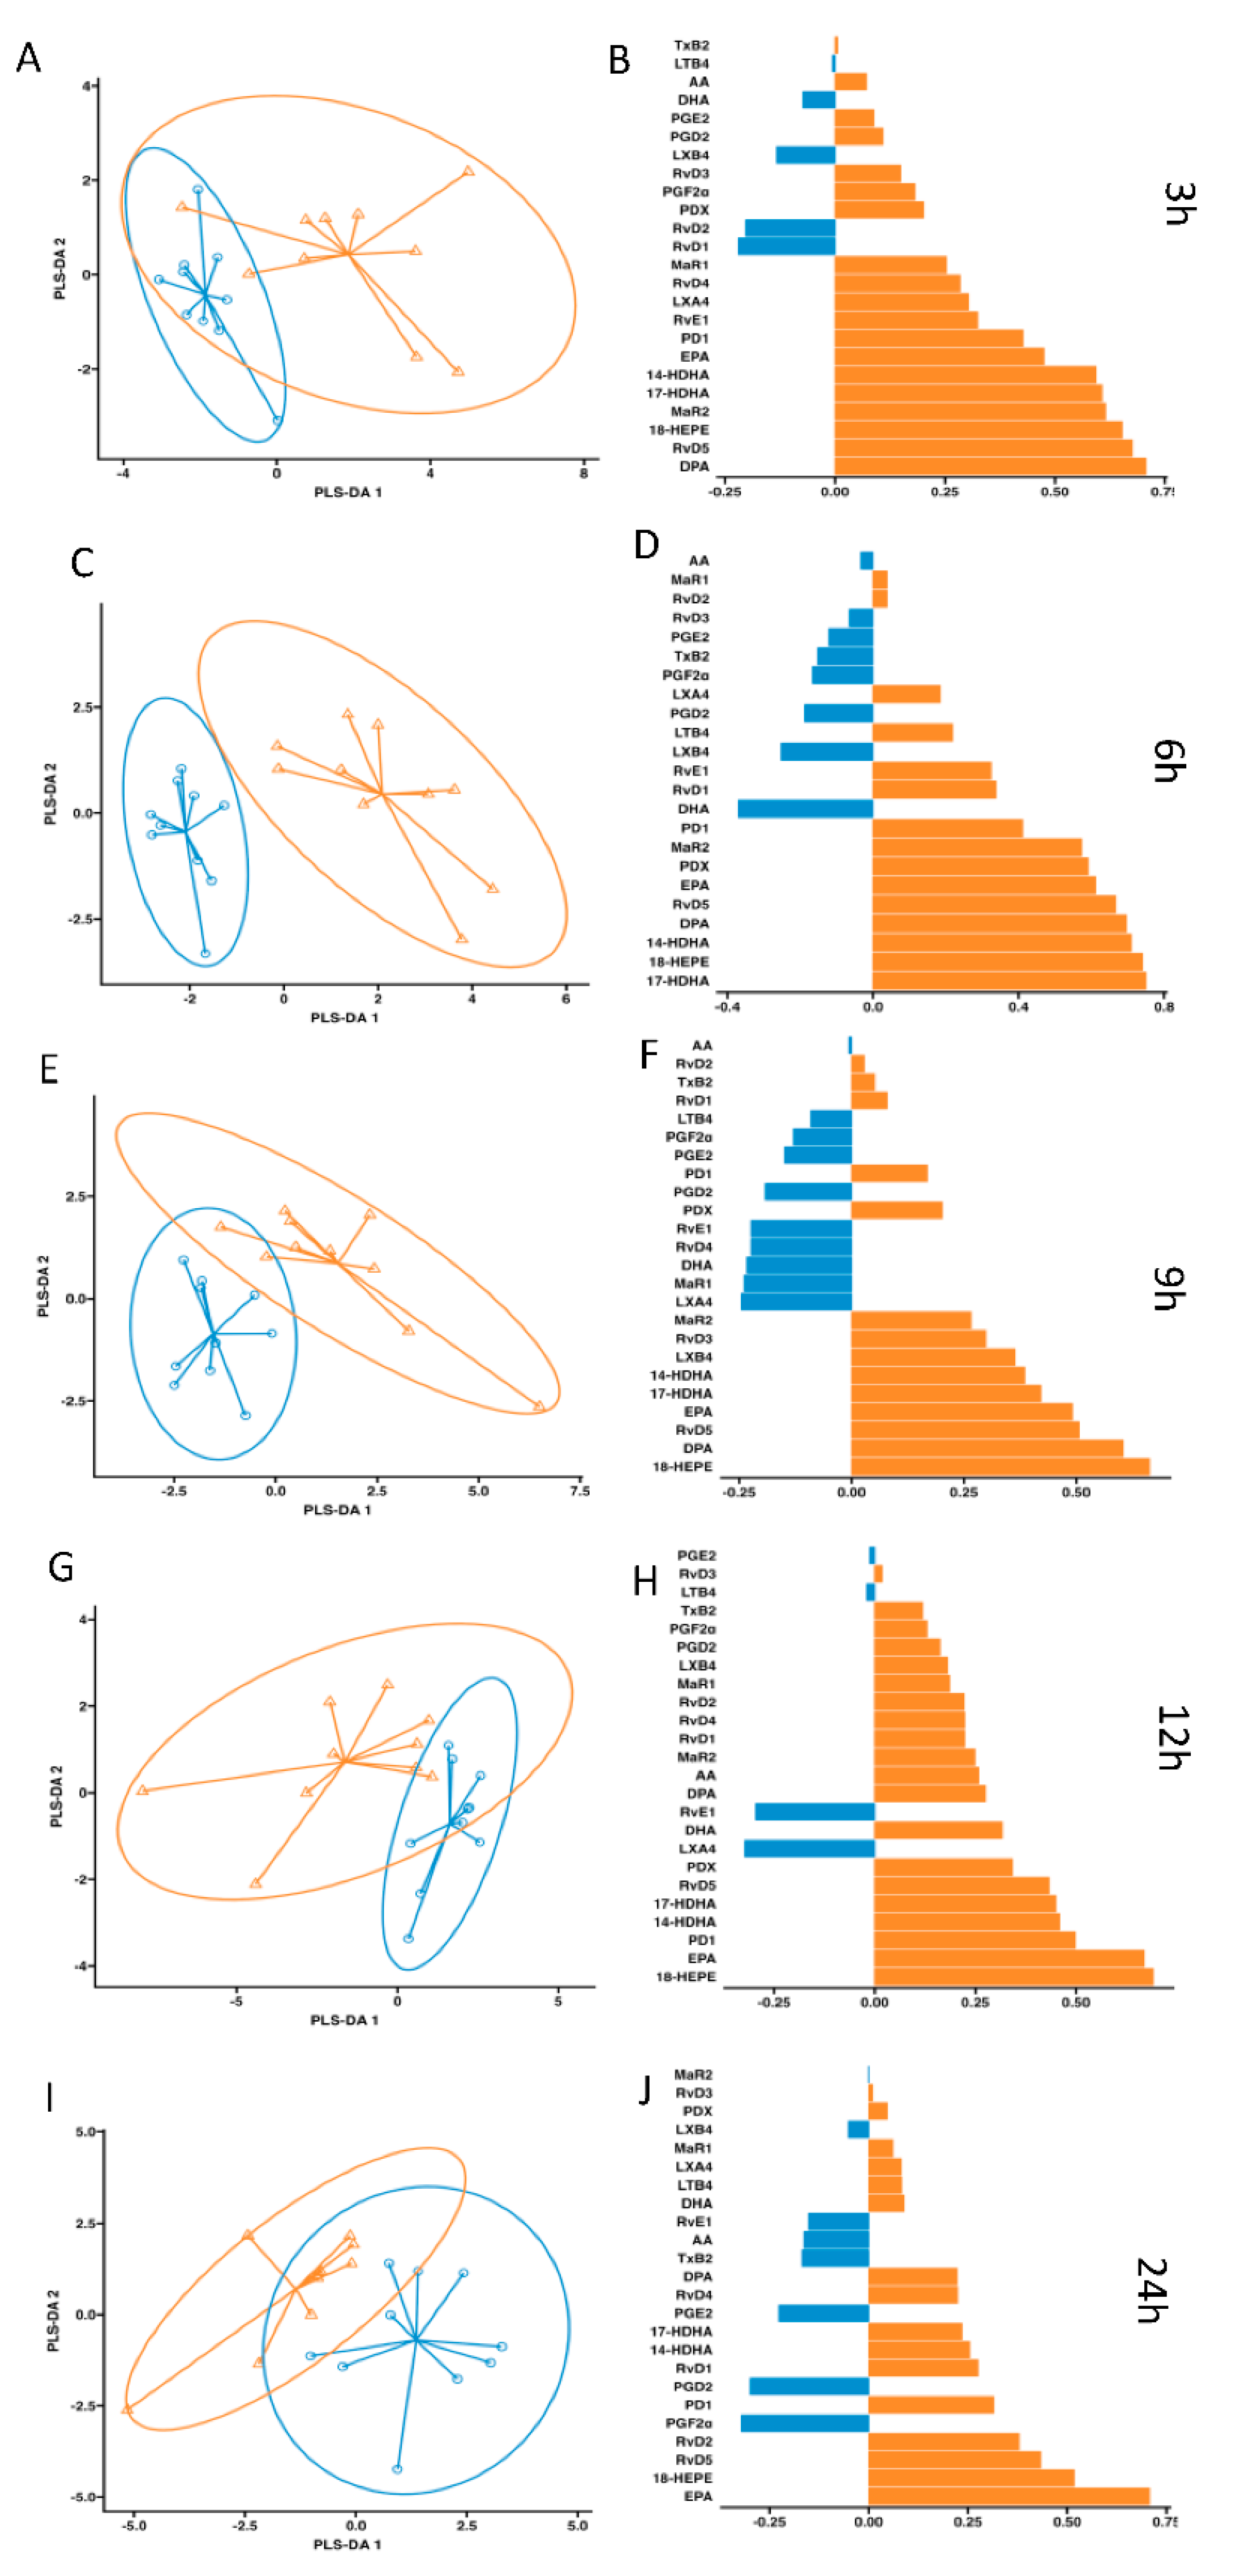
3. Discussion
Omega-3s play a pivotal role in health, wellbeing, and inflammatory diseases in humans. When sufficiently acquired in the diet, they protect individuals from excessive inflammation and counteract internecine inflammatory mediators to convey homeostasis, in part via actions carried by the bioactive omega-3 further metabolites like SPMs. The origin of resolvins, maresins, lipoxins, protectins, and monohydroxylated SPMs in plasma and serum remain to be identified. Probably conceivable in organs that produce SPM such as bone marrow [35], adipose tissue [36], spleen [37], brain [38], or produced via local thrombotic events [39] are later evoked in circulation. Further clinical studies need to be performed in order to establish their full potential as pharmaceutics for resolving inflammation [4]. Meanwhile, supplementation of them seems a good strategy to increase their amounts in circulation. Several endogenous mechanisms for synthesis of novo SPMs have been elucidated. One method to increase sufficient levels of omega-3 is for example, the transgenic mice for the FAT-1 gene that increased the synthesis of RvE1, RvD3, and PD1. These animals presented protection in an inflammatory model of colitis [40]. Also, some gases have been reported to elevate SPMs. In fact, when inhaled carbon monoxide accelerated resolution via the SPM-Heme Oxygenase-1 axis [41]. Also, AT-LXA4 produced after low dose of aspirin, synthesizes nitric oxide (NO), which promotes resolution by reducing leukocyte addition and limiting infiltration [42]. Moreover, aspirin triggers the synthesis of lipid metabolites that directly halt neutrophil trafficking and rattle pro-resolution actions [43]. RvD2 triggers NO production in human umbilical vein endothelial cells (HUVEC) and promotes resolution reducing neutrophil trafficking [44]. Recently, in an animal model of neurodegenerative disease, showed that sphingosine kinase1 (SphK1) acetylates COX-2 increasing AT-LXA4 and RvE1 endogenous production, resulting in reduced pathology by enhancing phagocytosis of the microglial cells [45]. In addition, some drugs also increase SPM amounts such as aspirin, statins, and dexamethasone [46,47,48]. The increase in SPMs triggered by drugs can also be attributed in part to endogenous mechanisms. Its summation endogenously produced in addition to those supplemented or triggered by medicines, would convey in a homeostatic and balanced scenario [4]. Together, all these strategies to increase SPMs, offer a rationale for SPM therapy to promote resolution of inflammation.
In humans, prenatal omega-3 supplementation increases 18-HEPE and 17-HDHA concentration in placenta and umbilical blood that might support immune functions [49]. Human breast milk also contains SPMs and when infection (mastitis) occurred, presented a distinct metabolipidomics profile skewed to proinflammatory mediators [31]. All these may contribute to the newborn immune system and microflora as well as the resolution after delivery. Bioactive concentration has been reported in human lymphoid organs such as spleen, lymph nodes, as well as in plasma, serum or after omega-3 supplementation.
After resistance exercise, recovery in healthy humans correlates with elevated serum SPMs and, more interestingly, this is blocked by pretreatment with ibuprofen, a known NSAID [50]. After an omega-3 enhanced diet, for people that suffer from migraine, pain reduction coincides with the intervention that reduces omega-6 and increases omega-3 in the diet. Interestingly the elevated mediators in plasma were found to be monohydroxylated SPMs 17-HDHA, 18-HEPE and tri- hydroxylated RvD2 [51]. Patients with sepsis in ICU showed that their peripheral blood SPM-lipid mediator profiles correlate with survival and acute respiratory distress syndrome development, thus suggesting plausible biologic targets for critical illness [52]. RvD3 was reduced in serum from rheumatoid arthritis patients [53]. Also, RvD1 was significantly reduced in vulnerable regions of atherosclerotic plaques [54]. Visceral fat tissue from obese patients presented an imbalance of pro-resolving mediators vs pro-inflammatory mediators. Interestingly, omental fatty tissue from these obese patients did not have the capacity to produce same amounts of SPMs denoting not functional synthetic pathways for SPM although omega-3 FFA were present [55].
It is now well appreciated how important is to treat impaired resolution and regulate inflammation [4,56]. There is also growing evidence that supplementation of SPMs is a valid source of these active lipid mediators that will increase in circulation to reset or reprogram the immune system [34]. In another study they observed that oral supplementation of SPM-enriched oil improved quality of life, reduced pain intensity or interference, and improved mood within 4 weeks of intervention in adults with chronic pain [57]. Schaller, found that short-term supplementation dramatically remodels this synthetic pro-resolving pathway and induces a less inflammatory phenotype in circulating leukocytes too [58]. In a clinical trial led by Prof. S.R. Shaikh described that obese patients increase levels of SPMs after supplementation in plasma, but interestingly modified their adaptative immune system [59]. So, an interesting next-step would be to address whether patients of a variety of inflammatory diseases have similar or dysregulated temporal synthesis of SPMs and reprogram with supplementation of SPM-enriched oils.
Here, we provide evidence that after 6g of enriched SPM-marine oil supplementation taken in only one dose, augmented SPM concentrations in peripheral blood (plasma and serum) in healthy subjects. Moreover, we provide evidence of pharmacokinetics parameters of these mediators. Whether these increases of circulating SPMs are synthesized from endogenous mechanisms or absorbed after supplementation remains to be determined in further studies. Nevertheless, given that SPM amounts or synthesis of them are altered in disease, it seems oral supplementation is a good source of essential SPMs. In this line, the deficient production of SPMs in obese patient due to dysfunctional enzymatic activity of 15-LOX was recovered by incubation with 17-HDHA, pointing to a bigger efficiency of SPM supplementation with products similar to the present study, versus using only their ω-3 precursors supplementation [36]. Further studies are needed to evaluate the clinical potential of this enriched SPM-marine oil emulsion in diseases characterized by some grade of inflammation and/or with impaired ability to synthesize SPMs.
4. Materials and Methods
Study participants
Participants were healthy, non-smoking or without use of nicotine-containing products within the last 6 months, men and women, 18 to 50 years, with a body mass index between 20 and 29 kg/m2, having good health according to medical history, vital signs, and routine laboratory test (biochemistry, hematology and coagulation analysis). Subjects declared to be in good health, and not to take any dexamethasone or statins. Exclusion criteria were: allergy to ω-3 acid or fish; positive screen for Sars-CoV-2 infection; consumption of xanthine and/or caffeine-products, alcohol or vitamin supplements within 24 hours; grapefruit and poppy-containing foods within 48 hours; use of anti-inflammatory drugs within 7 days; consumption of fish oil supplements within 1 month; pregnant, breastfeeding women or using contraceptive treatment within 3 months of the enrolling; subjects taking treatments that can interfere with the absorption, distribution, metabolism or excretion of the product under research. Samples from 10 healthy subjects were included. All participants signed an informed consent document before any study procedures were performed.
Study Design
All participants (n=10) underwent a first blood extraction (plasma and serum) after a fasting period of at least 10 hours prior to dosing and was established as time zero (t=0). The times when participants received the meals (relative to the blood draw) were the following: For breakfast: immediately after 0-hours blood collection, for lunch: immediately after 6-hours blood collection, for snack: immediately after 9-hours blood collection, and for dinner: immediately after 12-hours blood collection. Then, as a basal value for each individual, participants were given 100 ml of water at breakfast time and subsequent phlebotomy extractions were performed at 3, 6, 9 12, and 24 hours. At least 7 days after, the same phlebotomy protocol was assessed but this time the same participants received a single oral dose of 100 ml of the experimental supplementation emulsion instead of water. This emulsion was an enriched-SPM marine oil that contained 1556 mg EPA-FFA, 3441 mg DHA-FFA, 1.45 mg 17-HDHA, 1.68 mg 14-HDHA, 2.88 mg 18-HEPE (in summation 5981 mg total). Intervention compliance was assured by supervised administration of the control or intervention products by qualified study personnel of the research group. Standardized meals were provided during the 24-hour extraction periods. A description of the diet is shown in Table 6.
Safety analysis.
Participants were asked to report any side effects suffered after the supplement ingestion during the study days and when they returned for the 24 hours sampling.
Biological samples processing.
Samples were collected and processed as described here [60]. In brief, Peripheral blood samples were collected in 10 U/ml heparin and immediately centrifuged at 120g for 20 minutes without braking to ensure that layers will not be disrupted. Then, plasma was transferred to 1.5 ml tubes, topped with a nitrogen gas, capped and immediately stored at -80 ºC for further processing. Serum samples were generated as described earlier by Norris et al. [39]. In brief, were incubated overnight at 37 ºC allowing coagulation to occur and then, separated by centrifugation with the same protocol.
Lipid mediator extraction and profiling (LC-MS/MS)
Lipid mediators (LMs) were extracted from human serum samples according to a previously described solid-phase extraction (SPE) method [61]. In brief, each sample (plasma and serum, 1 ml) stored at -80 ᵒC was thawed on ice. Internal labeled standards containing d8-5-HETE, d5-RvD2, d5-LXA4, d4-LTB4, d4-PGE2 (500 pg each, Cayman Chemical Company) in 4 ml of methanol (Methanol Optima LC/MS Grade, Fisher Chemical) were added to each sample. Known concentrations of LMs in labeled standards were used for quantification purposes and posterior calculations on the recovery of LMs during the extraction process. Then, the samples were placed at -80 ᵒC for 30 minutes for protein precipitation. Next, they were centrifuged at 890 g, 10 min, 4 ᵒC. SPE columns were conditioned with 4 ml methanol and 4 ml water. Furthermore, Supernatants were quickly acidified to pH=3.5 with 9 ml of acidic water (HCl) just prior to loading onto conditioned-SPE columns (100mg, 10 ml, Biotage) and pH neutralized with 4 ml of MilliQ water, followed by a 4 ml of n-hexane wash step. After that, compounds were eluted with 9 ml of methyl format. Extracts from the SPE were dried under a stream of nitrogen and immediately after were resuspended in 50μl methanol/water (50:50 vol/vol) (MeOH/Water Optima LC/MS Grade, Fisher Chemical, both) before injection into the LC-MS/MS system. For acquisition parameters see below.
To determine the pharmacokinetic parameters and the effect of the concentrated emulsion of ω-3 PUFAs and their monohydroxylated metabolites on the production of pro-inflammatory and pro-resolving lipid mediators (LMs), plasma concentrations of 24 variables were quantified by LC-MS/MS. Each metabolome was analyzed in plasma and serum. The EPA metabolome included the monohydroxylated intermediate18-HEPE and the resolvin RvE1, whereas the DHA metabolome included their monohydroxylated LMs (17-HDHA and 14-HDHA), D-series Rv (RvD1, RvD2, RvD3, RvD4 y RvD5), protectins (PD1 and PDX) and maresins (MaR1, MaR2). For the AA metabolome, the bioactive lipids included both, proresolving lipoxins (LXA4 y LXB4) and pro-inflammatory derived eicosanoids including prostaglandins (PGE2, PGD2, PGF2α), leukotriene B4 (LTB4) and thromboxane B2 (TXB2).
Targeted LC-MS/MS Acquisition Parameters
LC-MS/MS system consisted of a Qtrap 5500 (Sciex) equipped with a Shimadzu LC-20AD HPLC. A Kinetex Core-Shell LC-18 column (100 mm × 4.6 mm × 2.6 μm, Phenomenex) was housed in a column oven maintained at 50 °C. A binary eluent system of LC-MS/MS grade water (A) (Fisher Chemical) and LC-MS/MS grade methanol (Fisher Chemical) (B), both with 0.01 % (v/v) of acetic acid, were used as mobile phase. LMs were eluted in a gradient program with respect to the composition of B as follows: 0-2 min, 50 %; 2-14.5 min, 80 %; 14.6-25.0 min; 98 %. The flow rate was 0.5 ml/min.
The QTRAP 5500 was operated in negative ionization mode, using scheduled Multiple Reaction Monitoring (MRM) coupled with the information-dependent acquisition (IDA) and an Enhanced Product Ion scan (EPI). Each LM parameter (collision energy, target retention time, and specific first and third quadrupole mass transitions) were optimized according to reported methods [28]. For monitoring and quantification purposes, the amounts of LMs of interest were estimated as area under the peak, specifically using MRM with MS/MS matching signature retention time for each molecule with standards (<0.1 picograms was considered below the limit of detection). The lower limits of quantification (LLOQ) were determined by analyzing serial dilutions of the lower calibrator as the concentrations of each SPM with a signal/noise ≥ 5 fold the signal/noise ratio of a blank solution according to the guidelines of the US Food and Drug administration [62] and are listed in Table 7. Each molecule was validated using MRM with MS/MS matching signature ion fragments for each molecule (at least six diagnostic ions). The laboratory analyses were performed by Solutex GC SL in the CEMINEM, Universidad de Zaragoza, Zaragoza, Spain.
Pharmacokinetic and statistical analyses
An initial exploratory analysis of all clinical variables was carried out. Continuous variables were expressed as means with standard deviation whereas qualitative variables were expressed as frequencies. Time and intervention evaluations on lipid mediators were performed. For the time effect, the significance of the change in values at hours 3, 6, 9, 12, 24 from baseline (t=0) within each situation was determined by Wilcoxon Signed Rank test. Time and intervention evaluations of lipid mediators were performed. Partial Least Squares Discriminant Analysis (PLS-DA) was also performed by the PKNA R package. The mixOmics R package was used for graphical functions. Pharmacokinetic parameters including maximum concentration (Cmax), time to maximum concentration (Tmax) and area under the curve from time zero to 24 hours (AUC0-24h) for the 24 variables previously mentioned were analyzed after baseline-adjusting the concentration of each analyte for each participant as the concentration in per time minus that at time (t=0). Statistically significance was considered as p value < 0.05. All statistical analyses were conducted with the R programming code (The R Foundation for statistical computing, Vienna, Austria)
Author Contributions
Conceptualization, A.L, M.H., and P.I.; methodology, U.B.; software, U.B, and P.C.; validation, P.I., and X.d.l.R.; formal analysis, U.B., and P.C.; investigation, A.L., M.J.D-A., M.S-L., P.I., and U.B.; resources, U.B., A.L., M.S-L., M.J.D-A and P.I.; data curation, P.C., P.I. and U.B.; writing—original draft preparation, P.I., and X.d.l.R.; writing—review and editing, A.L., M.H., P.C., P.I, and X.d.l.R.; visualization, A.L., P.C., P.I, and X.d.l.R.; supervision, A.L.; project administration, G.A.H., A.L.; funding acquisition, A.L. All authors have read and agreed to the published version of the manuscript.
Funding
This research received no external funding.
Institutional Review Board Statement
This study was conducted according to the guidelines of the Declaration of Helsinki and approved by the Ethical Committee of Clinical Research of Aragon (CEICA), project number: PI20/520 at its meeting held on 02 December 2020.
Informed Consent Statement
Informed consent was obtained from all subjects involved in the study.
Data Availability Statement
LC-MS/MS data are not publicly available but can be provided upon request. http://databank.azur-gn.com/.
Acknowledgments
We acknowledged Solutex, for kindly providing emulsion of SPM-enriched oil (LIPINOVA®) for this study and the Biocomputing Service of the Aragon Health Institute for helping us with statistical analyses.
Conflicts of Interest
U.B, G.A.H, M.H, and X.d.l.R. are full-time employed by Solutex. The other authors declare no conflict of interest.
References
- Bang, H.O.; Dyerberg, J.; Nielsen, A.B. o. ndu. PLASMA LIPID AND LIPOPROTEIN PATTERN IN GREENLANDIC WEST-COAST ESKIMOS. Lancet 1971, 1, 1143–1145. [Google Scholar] [CrossRef]
- Oppedisano, F.; Mollace, R.; Tavernese, A.; Gliozzi, M.; Musolino, V.; Macrì, R.; Carresi, C.; Maiuolo, J.; Serra, M.; Cardamone, A.; et al. PUFA Supplementation and Heart Failure: Effects on Fibrosis and Cardiac Remodeling. Nutrients 2021, 13, 2965. [Google Scholar] [CrossRef]
- Miller, M.; Tokgozoglu, L.; Parhofer, K.G.; Handelsman, Y.; Leiter, L.A.; Landmesser, U.; Brinton, E.A.; Catapano, A.L. Icosapent Ethyl for Reduction of Persistent Cardiovascular Risk: A Critical Review of Major Medical Society Guidelines and Statements. Expert Rev. Cardiovasc. Ther. 2022, 20, 609–625. [Google Scholar] [CrossRef]
- Serhan, C.N. Pro-Resolving Lipid Mediators Are Leads for Resolution Physiology. Nature 2014, 510, 92–101. [Google Scholar] [CrossRef]
- Serhan, C.N.; Clish, C.B.; Brannon, J.; Colgan, S.P.; Chiang, N.; Gronert, K. Novel Functional Sets of Lipid-Derived Mediators with Antiinflammatory Actions Generated from Omega-3 Fatty Acids via Cyclooxygenase 2–Nonsteroidal Antiinflammatory Drugs and Transcellular Processing. J. Exp. Med. 2000, 192, 1197–1204. [Google Scholar] [CrossRef]
- Serhan, C.N.; Hong, S.; Gronert, K.; Colgan, S.P.; Devchand, P.R.; Mirick, G.; Moussignac, R.-L. Resolvins: A Family of Bioactive Products of Omega-3 Fatty Acid Transformation Circuits Initiated by Aspirin Treatment That Counter Proinflammation Signals. J. Exp. Med. 2002, 196, 1025–1037. [Google Scholar] [CrossRef] [PubMed]
- Hong, S.; Gronert, K.; Devchand, P.R.; Moussignac, R.L.; Serhan, C.N. Novel Docosatrienes and 17S-Resolvins Generated from Docosahexaenoic Acid in Murine Brain, Human Blood, and Glial Cells: Autacoids in Anti-Inflammation. J. Biol. Chem. 2003, 278, 14677–14687. [Google Scholar] [CrossRef] [PubMed]
- Bannenberg GL, Chiang N, Ariel A, Arita M, Tjonahen E, Gotlinger KH, Hong S, S. C. Molecular Circuits of Resolution: Formation and Actions of Resolvins and Protectins. J Immunol 2005, 174, 4345–4355. [Google Scholar] [CrossRef] [PubMed]
- Chiang, N.; Serhan, C.N. Specialized Pro-Resolving Mediator Network: An Update on Production and Actions. Essays Biochem. 2020, 64, 443–462. [Google Scholar] [CrossRef] [PubMed]
- Arita, M.; Bianchini, F.; Aliberti, J.; Sher, A.; Chiang, N.; Hong, S.; Yang, R.; Petasis, N.A.; Serhan, C.N. Stereochemical Assignment, Antiinflammatory Properties, and Receptor for the Omega-3 Lipid Mediator Resolvin E1. J. Exp. Med. 2005, 201, 713–722. [Google Scholar] [CrossRef] [PubMed]
- Serhan, C.N.; Gotlinger, K.; Hong, S.; Lu, Y.; Siegelman, J.; Baer, T.; Yang, R.; Colgan, S.P.; Petasis, N.A. Anti-Inflammatory Actions of Neuroprotectin D1/Protectin D1 and Its Natural Stereoisomers: Assignments of Dihydroxy-Containing Docosatrienes 1. J. Immunol. 2006, 176, 1848–1859. [Google Scholar] [CrossRef] [PubMed]
- Sun, Y.-P.; Oh, S.F.; Uddin, J.; Yang, R.; Gotlinger, K.; Campbell, E.; Colgan, S.P.; Petasis, N.A.; Serhan, C.N. Resolvin D1 and Its Aspirin-Triggered 17R Epimer. Stereochemical Assignments, Anti-Inflammatory Properties, and Enzymatic Inactivation. J. Biol. Chem. 2007, 282, 9323–9334. [Google Scholar] [CrossRef] [PubMed]
- Chiang, N.; Dalli, J.; Colas, R.A.; Serhan, C.N. Identification of Resolvin D2 Receptor Mediating Resolution of Infections and Organ Protection. J. Exp. Med. 2015, 212, 1203–1217. [Google Scholar] [CrossRef] [PubMed]
- Chiang, N.; de la Rosa, X.; Libreros, S.; Serhan, C.N. Novel Resolvin D2 Receptor Axis in Infectious Inflammation. J. Immunol. 2017, 198, 842–851. [Google Scholar] [CrossRef] [PubMed]
- Chiang, N.; Libreros, S.; Norris, P.C.; De La Rosa, X.; Serhan, C.N. Maresin 1 Activates LGR6 Receptor Promoting Phagocyte Immunoresolvent Functions. J. Clin. Invest. 2019, 129, 5294–5311. [Google Scholar] [CrossRef]
- Norling, L. V.; Headland, S.E.; Dalli, J.; Arnardottir, H.H.; Haworth, O.; Jones, H.R.; Irimia, D.; Serhan, C.N.; Perretti, M. Proresolving and Cartilage-Protective Actions of Resolvin D1 in Inflammatory Arthritis. JCI insight 2016, 1, e85922. [Google Scholar] [CrossRef] [PubMed]
- Fredman, G.; Spite, M. Specialized Pro-Resolving Mediators in Cardiovascular Diseases. Mol. Aspects Med. 2017, 58, 65–71. [Google Scholar] [CrossRef]
- Fredman, G. Resolving Atherosclerosis and Alzheimer Disease. Nat. Rev. Cardiol. 2019 165 2019, 16, 259–260. [Google Scholar] [CrossRef]
- Serhan, C.N.; Chiang, N.; Dalli, J. New Pro-Resolving n-3 Mediators Bridge Resolution of Infectious Inflammation to Tissue Regeneration. Mol. Aspects Med. 2018, 64, 1–17. [Google Scholar] [CrossRef]
- de la Rosa, X.; Norris, P.C.; Chiang, N.; Rodriguez, A.R.; Spur, B.W.; Serhan, C.N. Identification and Complete Stereochemical Assignments of the New Resolvin Conjugates in Tissue Regeneration in Human Tissues That Stimulate Proresolving Phagocyte Functions and Tissue Regeneration. Am. J. Pathol. 2018, 188, 950–966. [Google Scholar] [CrossRef]
- Wang, X.; Zhu, M.; Hjorth, E.; Cortés-Toro, V.; Eyjolfsdottir, H.; Graff, C.; Nennesmo, I.; Palmblad, J.; Eriksdotter, M.; Sambamurti, K.; et al. Resolution of Inflammation Is Altered in Alzheimer’s Disease. Alzheimer’s Dement. 2015, 11, e1–e2. [Google Scholar] [CrossRef] [PubMed]
- Zhu, M.; Wang, X.; Hjorth, E.; Colas, R.A.; Schroeder, L.; Granholm, A.C.; Serhan, C.N.; Schultzberg, M. Pro-Resolving Lipid Mediators Improve Neuronal Survival and Increase Aβ42 Phagocytosis. Mol. Neurobiol. 2016, 53, 2733–2749. [Google Scholar] [CrossRef] [PubMed]
- Serhan, C.N.; de la Rosa, X.; Jouvene, C.C. Cutting Edge: Human Vagus Produces Specialized Proresolving Mediators of Inflammation with Electrical Stimulation Reducing Proinflammatory Eicosanoids. J. Immunol. 2018, 201, 3161–3165. [Google Scholar] [CrossRef] [PubMed]
- Colas, R.A.; Shinohara, M.; Dalli, J.; Chiang, N.; Serhan, C.N. Identification and Signature Profiles for Pro-Resolving and Inflammatory Lipid Mediators in Human Tissue. Am. J. Physiol. Cell Physiol. 2014, 307, C39–C54. [Google Scholar] [CrossRef] [PubMed]
- Kang, B.; Xu, Q.; Chen, Z.; Wu, Y.; Yang, S.; Yang, X.; Zhang, Z.; Jiang, D. Characterization of Goose SPMS: Molecular Characterization and Expression Profiling of SPMS in the Goose Ovary. Reprod. Biol. 2018, 18, 60–65. [Google Scholar] [CrossRef] [PubMed]
- Clària, J.; Dalli, J.; Yacoubian, S.; Gao, F.; Serhan, C.N. Resolvin D1 and Resolvin D2 Govern Local Inflammatory Tone in Obese Fat. J. Immunol. 2012, 189, 2597–2605. [Google Scholar] [CrossRef]
- Keelan, J.A.; Mas, E.; D’Vaz, N.; Dunstan, J.A.; Li, S.; Barden, A.E.; Mark, P.J.; Waddell, B.J.; Prescott, S.L.; Mori, T.A. Effects of Maternal N-3 Fatty Acid Supplementation on Placental Cytokines, pro-Resolving Lipid Mediators and Their Precursors. Reproduction 2015, 149, 171–178. [Google Scholar] [CrossRef]
- Norris, P.C.; Libreros, S.; Serhan, C.N. Resolution Metabolomes Activated by Hypoxic Environment. Sci. Adv. 2019, 5, eaax4895. [Google Scholar] [CrossRef]
- Prüss, H.; Rosche, B.; Sullivan, A.B.; Brommer, B.; Wengert, O.; Gronert, K.; Schwab, J.M. Proresolution Lipid Mediators in Multiple Sclerosis — Differential, Disease Severity-Dependent Synthesis — A Clinical Pilot Trial. PLoS One 2013, 8, e55859. [Google Scholar] [CrossRef] [PubMed]
- Giera, M.; Ioan-Facsinay, A.; Toes, R.; Gao, F.; Dalli, J.; Deelder, A.M.; Serhan, C.N.; Mayboroda, O.A. Lipid and Lipid Mediator Profiling of Human Synovial Fluid in Rheumatoid Arthritis Patients by Means of LC-MS/MS. Biochim. Biophys. Acta 2012, 1821, 1415–1424. [Google Scholar] [CrossRef] [PubMed]
- Arnardottir, H.; Orr, S.K.; Dalli, J.; Serhan, C.N. Human Milk Proresolving Mediators Stimulate Resolution of Acute Inflammation. Mucosal Immunol. 2016, 9, 757–766. [Google Scholar] [CrossRef] [PubMed]
- Sasaki, A.; Fukuda, H.; Shiida, N.; Tanaka, N.; Furugen, A.; Ogura, J.; Shuto, S.; Mano, N.; Yamaguchi, H. Determination of ω-6 and ω-3 PUFA Metabolites in Human Urine Samples Using UPLC/MS/MS. Anal. Bioanal. Chem. 2015, 407, 1625–1639. [Google Scholar] [CrossRef] [PubMed]
- Mas, E.; Croft, K.D.; Zahra, P.; Barden, A.; Mori, T.A. Resolvins D1, D2, and Other Mediators of Self-Limited Resolution of Inflammation in Human Blood Following n-3 Fatty Acid Supplementation. Clin. Chem. 2012, 58, 1476–1484. [Google Scholar] [CrossRef] [PubMed]
- Souza, P.R.; Marques, R.M.; Gomez, E.A.; Colas, R.A.; De Matteis, R.; Zak, A.; Patel, M.; Collier, D.J.; Dalli, J. Enriched Marine Oil Supplements Increase Peripheral Blood Specialized Pro-Resolving Mediators Concentrations and Reprogram Host Immune Responses: A Randomized Double-Blind Placebo-Controlled Study. Circ. Res. 2020, 126, 75–90. [Google Scholar] [CrossRef] [PubMed]
- Winkler, J.W.; Libreros, S.; De La Rosa, X.; Sansbury, B.E.; Norris, P.C.; Chiang, N.; Fichtner, D.; Keyes, G.S.; Wourms, N.; Spite, M.; et al. Structural Insights into Resolvin D4 Actions and Further Metabolites via a New Total Organic Synthesis and Validation. J. Leukoc. Biol. 2018, 103, 995–1010. [Google Scholar] [CrossRef] [PubMed]
- López-Vicario, C.; Titos, E.; Walker, M.E.; Alcaraz-Quiles, J.; Casulleras, M.; Durán-Güell, M.; Flores-Costa, R.; Pérez-Romero, N.; Forné, M.; Dalli, J.; et al. Leukocytes from Obese Individuals Exhibit an Impaired SPM Signature. FASEB J. 2019, 33, 7072–7083. [Google Scholar] [CrossRef] [PubMed]
- Halade, G. V.; Norris, P.C.; Kain, V.; Serhan, C.N.; Ingle, K.A. Splenic Leukocytes Define the Resolution of Inflammation in Heart Failure. Sci. Signal. 2018, 11, eaao1818. [Google Scholar] [CrossRef]
- Winkler, J.W.; Orr, S.K.; Dalli, J.; Cheng, C.Y.C.; Sanger, J.M.; Chiang, N.; Petasis, N.A.; Serhan, C.N. Resolvin D4 Stereoassignment and Its Novel Actions in Host Protection and Bacterial Clearance. Sci. Rep. 2016, 6, 18972. [Google Scholar] [CrossRef]
- Norris, P.C.; Libreros, S.; Chiang, N.; Serhan, C.N. A Cluster of Immunoresolvents Links Coagulation to Innate Host Defense in Human Blood. Sci. Signal. 2017, 10, eaan1471. [Google Scholar] [CrossRef]
- Hudert, C.A.; Weylandt, K.H.; Lu, Y.; Wang, J.; Hong, S.; Dignass, A.; Serhan, C.N.; Kang, J.X. Transgenic Mice Rich in Endogenous Omega-3 Fatty Acids Are Protected from Colitis. Proc. Natl. Acad. Sci. U. S. A. 2006, 103, 11276–11281. [Google Scholar] [CrossRef]
- Chiang, N.; Shinohara, M.; Dalli, J.; Mirakaj, V.; Kibi, M.; Choi, A.M.K.; Serhan, C.N. Inhaled Carbon Monoxide Accelerates Resolution of Inflammation via Unique Proresolving Mediator-Heme Oxygenase-1 Circuits. J. Immunol. 2013, 190, 6378–6388. [Google Scholar] [CrossRef] [PubMed]
- Paul-Clark, M.J.; Van Cao, T.; Moradi-Bidhendi, N.; Cooper, D.; Gilroy, D.W. 15-Epi-Lipoxin A4-Mediated Induction of Nitric Oxide Explains How Aspirin Inhibits Acute Inflammation. J. Exp. Med. 2004, 200, 69–78. [Google Scholar] [CrossRef] [PubMed]
- Claria, J.; Serhan, C.N. Aspirin Triggers Previously Undescribed Bioactive Eicosanoids by Human Endothelial Cell-Leukocyte Interactions. Proc. Natl. Acad. Sci. 1995, 92, 9475–9479. [Google Scholar] [CrossRef]
- Spite, M.; Norling, L. V.; Summers, L.; Yang, R.; Cooper, D.; Petasis, N.A.; Flower, R.J.; Perretti, M.; Serhan, C.N. Resolvin D2 Is a Potent Regulator of Leukocytes and Controls Microbial Sepsis. Nature 2009, 461, 1287–1291. [Google Scholar] [CrossRef]
- Lee, J.Y.; Han, S.H.; Park, M.H.; Baek, B.; Song, I.S.; Choi, M.K.; Takuwa, Y.; Ryu, H.; Kim, S.H.; He, X.; et al. Neuronal SphK1 Acetylates COX2 and Contributes to Pathogenesis in a Model of Alzheimer’s Disease. Nat. Commun. 2018, 9, 1479. [Google Scholar] [CrossRef] [PubMed]
- Birnbaum, Y.; Ye, Y.; Lin, Y.; Freeberg, S.Y.; Huang, M.H.; Perez-Polo, J.R.; Uretsky, B.F. Aspirin Augments 15-Epi-Lipoxin A4 Production by Lipopolysaccharide, but Blocks the Pioglitazone and Atorvastatin Induction of 15-Epi-Lipoxin A4 in the Rat Heart. Prostaglandins Other Lipid Mediat. 2007, 83, 89–98. [Google Scholar] [CrossRef]
- Dalli, J.; Chiang, N.; Serhan, C.N. Elucidation of Novel 13-Series Resolvins That Increase with Atorvastatin and Clear Infections. Nat. Med. 2015, 21, 1071–1075. [Google Scholar] [CrossRef]
- Barden, A.; Phillips, M.; Mas, E.; Hill, L.M.; Mowat, I.; Loh, P.S.; Corcoran, T.; Mori, T.A. Effects of Antiemetic Doses of Dexamethasone on Plasma Mediators of Inflammation Resolution and Pain after Surgery in Women. Prostaglandins Other Lipid Mediat. 2020, 149, 106427. [Google Scholar] [CrossRef]
- Mozurkewich, E.L.; Greenwood, M.; Clinton, C.; Berman, D.; Romero, V.; Djuric, Z.; Qualls, C.; Gronert, K. Pathway Markers for Pro-Resolving Lipid Mediators in Maternal and Umbilical Cord Blood: A Secondary Analysis of the Mothers, Omega-3, and Mental Health Study. Front. Pharmacol. 2016, 7, 274. [Google Scholar] [CrossRef]
- Markworth, J.F.; Vella, L.; Lingard, B.S.; Tull, D.L.; Rupasinghe, T.W.; Sinclair, A.J.; Maddipati, K.R.; Cameron-Smith, D. Human Inflammatory and Resolving Lipid Mediator Responses to Resistance Exercise and Ibuprofen Treatment. Am. J. Physiol. Regul. Integr. Comp. Physiol. 2013, 305, R1281–R1296. [Google Scholar] [CrossRef]
- Ramsden, C.E.; Faurot, K.R.; Zamora, D.; Suchindran, C.M.; Macintosh, B.A.; Gaylord, S.; Ringel, A.; Hibbeln, J.R.; Feldstein, A.E.; Mori, T.A.; et al. Targeted Alteration of Dietary N-3 and n-6 Fatty Acids for the Treatment of Chronic Headaches: A Randomized Trial. Pain 2013, 154, 2441–2451. [Google Scholar] [CrossRef] [PubMed]
- Dalli, J.; Colas, R.A.; Quintana, C.; Barragan-Bradford, D.; Hurwitz, S.; Levy, B.D.; Choi, A.M.; Serhan, C.N.; Baron, R.M. Human Sepsis Eicosanoid and Proresolving Lipid Mediator Temporal Profiles: Correlations With Survival and Clinical Outcomes. Crit. Care Med. 2017, 45, 58–68. [Google Scholar] [CrossRef] [PubMed]
- Arnardottir, H.H.; Dalli, J.; Norling, L. V.; Colas, R.A.; Perretti, M.; Serhan, C.N. Resolvin D3 Is Dysregulated in Arthritis and Reduces Arthritic Inflammation. J. Immunol. 2016, 197, 2362–2368. [Google Scholar] [CrossRef] [PubMed]
- Fredman, G.; Hellmann, J.; Proto, J.D.; Kuriakose, G.; Colas, R.A.; Dorweiler, B.; Connolly, E.S.; Solomon, R.; Jones, D.M.; Heyer, E.J.; et al. An Imbalance between Specialized Pro-Resolving Lipid Mediators and pro-Inflammatory Leukotrienes Promotes Instability of Atherosclerotic Plaques. Nat. Commun. 2016, 7, 12859. [Google Scholar] [CrossRef]
- Titos, E.; Rius, B.; López-Vicario, C.; Alcaraz-Quiles, J.; García-Alonso, V.; Lopategi, A.; Dalli, J.; Lozano, J.J.; Arroyo, V.; Delgado, S.; et al. Signaling and Immunoresolving Actions of Resolvin D1 in Inflamed Human Visceral Adipose Tissue. J. Immunol. 2016, 197, 3360–3370. [Google Scholar] [CrossRef]
- Ontoria-Oviedo, I.; Amaro-Prellezo, E.; Castellano, D.; Venegas-Venegas, E.; González-Santos, F.; Ruiz-Saurí, A.; Pelacho, B.; Prósper, F.; Pérez del Caz, M.D.; Sepúlveda, P. Topical Administration of a Marine Oil Rich in Pro-Resolving Lipid Mediators Accelerates Wound Healing in Diabetic Db/Db Mice through Angiogenesis and Macrophage Polarization. Int. J. Mol. Sci. 2022, 23, 9918. [Google Scholar] [CrossRef]
- Callan, N.; Hanes, D.; Bradley, R. Early Evidence of Efficacy for Orally Administered SPM-Enriched Marine Lipid Fraction on Quality of Life and Pain in a Sample of Adults with Chronic Pain. J. Transl. Med. 2020, 18, 401. [Google Scholar] [CrossRef]
- Schaller, M.S.; Chen, M.; Colas, R.A.; Sorrentino, T.A.; Lazar, A.A.; Grenon, S.M.; Dalli, J.; Conte, M.S. Treatment With a Marine Oil Supplement Alters Lipid Mediators and Leukocyte Phenotype in Healthy Patients and Those With Peripheral Artery Disease. J. Am. Heart Assoc. 2020, 9, e016113. [Google Scholar] [CrossRef] [PubMed]
- Al-Shaer, A.E.; Regan, J.; Buddenbaum, N.; Tharwani, S.; Drawdy, C.; Behee, M.; Sergin, S.; Fenton, J.I.; Maddipati, K.R.; Kane, S.; et al. Enriched Marine Oil Supplement Increases Specific Plasma Specialized Pro-Resolving Mediators in Adults with Obesity. J. Nutr. 2022, 152, 1783–1791. [Google Scholar] [CrossRef] [PubMed]
- Regidor, P.A.; de la Rosa, X.; Müller, A.; Mayr, M.; Santos, F.G.; Banzo, R.G.; Rizo, J.M. PCOS: A Chronic Disease That Fails to Produce Adequately Specialized Pro-Resolving Lipid Mediators (SPMs). Biomedicines 2022, 10, 456. [Google Scholar] [CrossRef]
- Irún, P.; Gracia, R.; Piazuelo, E.; Pardo, J.; Morte, E.; Paño, J.R.; Boza, J.; Carrera-Lasfuentes, P.; Higuera, G.A.; Lanas, A. Serum Lipid Mediator Profiles in COVID-19 Patients and Lung Disease Severity: A Pilot Study. Sci. Rep. 2023, 13, 6497. [Google Scholar] [CrossRef] [PubMed]
- FDA; CDER Bioanalytical Method Validation. Guidance for Industry. U.S. Department of Health and Human Services. 2018.

Table 1.
Demographic and baseline information of study participants.
| Parameter | Values | Normal values | ||
|---|---|---|---|---|
| Participants | 10 | |||
| Gender (male/female) | 5/5 | |||
| Age (years) | 31.81 ± 5.95 | |||
| IMC (kg/m2) | 23.94 ± 3.41 | |||
| Glucose (mg/dl) | 89.60 ± 5.42 | 74-106 | ||
| BUN (g/l) | 0.33 ± 0.04 | Male: 0.19-0.44 Female: 0.15-0.40 |
||
| Creatinine (mg/dl) | 0.83 ± 0.11 | Male: 0.7-1.2 Female: 0.5-0.9 |
||
| Albumin (g/dl) | 4.19 ± 0.30 | 3.5-5.2 | ||
| Total Cholesterol (mg/dl) | 188.50 ± 23.70 | National Education Cholesterol Program Adult treatment Panel III No risk < 200 Moderate risk 200-239 High risk > 240 |
||
| c-HDL (mg/dl) | 60.4 ± 17.00 | National Education Cholesterol Program Adult treatment Panel III At risk < 40 Negative risk > 60 |
||
| Non-HDL(mg/dl) | 128.1 ± 26.8 | |||
| c-LDL (mg/dl) | 109.78 ± 22.99 | 2019 ESC/EAS Guidelines for the management of dyslipidaemias (cardiovaslular risk) | ||
| Risk level | c-LDL | Non c-HDL | ||
| Very high | < 55 | < 85 | ||
| High | < 70 | < 100 | ||
| Low | < 116 | not apply | ||
| Triglycerides (mg/dl) | 91.60 ± 46.56 | National Education Cholesterol Program Adult treatment Panel III Normal < 150 Borderline 150-199 High 200-499 Very high > 500 |
||
| AST (U/l) | 21.50 ± 4.09 | Male: 0-37 Female: 0-31 |
||
| ALT (U/l) | 16.20 ± 4.69 | Male: 0-41 Female: 0-33 |
||
| GammaGT (U/l) | 16.20 ± 5.41 | Male: 0-60 Female: 0-40 |
||
| Alkaline phosphatase (U/l) | 57.20 ± 11.33 | Male: 40-130 Female: 35-104 |
||
| Leukocyte count (mil/mm3) | 6.56 ± 1.84 | 4-11 | ||
| Neutrophil count (mil/mm3) | 3.22 ± 0.72 | 1.6-7.0 | ||
| Lymphocyte count (mil/mm3) | 2.54 ± 1.37 | 1.2-1.4 | ||
| Monocyte count (mil/mm3) | 0.47 ± 0.14 | 0.1-0.8 | ||
| Eosinophils count (mil/mm3) | 0.21 ± 0.07 | 0.0-0.4 | ||
| Basophils count (mil/mm3) | 0.04 ± 0.05 | 0.0-0.2 | ||
| Erythrocytes count (mill/mm3) | 4.98 ± 0.32 | Male: 4.5-5.9 Female: 3.5-5.1 |
||
| Haemoglobin (g/dl) | 17.77 ± 1.18 | Male: 13.0-17.4 Female: 12.0-15.3 |
||
| Hematocrit (%) | 43.33 ±3.37 | Male: 41.5-50.4 Female: 36.0-45.0 |
||
| MCV (fl) | 86.91 ± 3.88 | 82-98 | ||
| MCH (pg) | 29.63 ± 1.43 | Male: 27-32 Female: 27-31 |
||
| Sedimentation rate-1 hour (mm) | 7.10 ± 5.13 | 0-15 | ||
| Platelets count (mil/mm3) | 244.30 ± 49.18 | 150-400 | ||
| Prothrombin time (sec) | 12.79 ± 0.60 | 9.8-14.6 | ||
| Prothrombin activity (%) | 93.00 ± 7.18 | 80-120 | ||
| INR | 1.05 ± 0.05 | 0.8-1.2 | ||
| Fibrinogen (mg/dl) | 337.20 ± 47.82 | 200-400 | ||
Values are expressed as mean ± standard deviation. c-HDL, high-density lipoproteins cholesterol; c-LDL, low-density lipoproteins cholesterol; AST, aspartate aminotransferase; ALT, alanine aminotransferase; GammaGT, Gamma-Glutamyl Transferase; MCV, mean corpuscular volume; MCH, mean corpuscular haemoglobin; INR, International Normalized Ratio.
Table 2.
Plasma concentrations of free fatty acids and lipid mediators’ metabolomes.
| Control (water dosing) | Enriched-SPM marine oil supplementation | |||||||||||||||||||||||
|---|---|---|---|---|---|---|---|---|---|---|---|---|---|---|---|---|---|---|---|---|---|---|---|---|
| 0 hours | 3 hours | 6 hours | 9 hours | 12 hours | 24 hours | 0 hours | 3 hours | 6 hours | 9 hours | 12 hours | 24 hours | |||||||||||||
| DHA metabolome | ||||||||||||||||||||||||
| DHA | 51.7(45.6-67.0) | 62.4(50.0-68.8) | 60.0(53.0-68.7) | 57.8(44.0-65.8) | 55.2(47.5-61.7) | 57.7(43.6-65.1) | 67.7(56.2-83.0) | 51.7(37.6-69.7) | 54.4(39.8-62.9) | 65.8(55.7-74.5) | 57.5(55.7-64.4) | 65.9(61.1-71.1) | ||||||||||||
| 14-HDHA | 1.4(1.1-3.0) | 1.2(0.7-2.6) | 1.4(1.1-2.0) | 0.9(0.6-1.8) | 0.8(0.5-1.8) | 1.1(0.6-3.3) | 0.7(0.6-4.2) | 17.4(13.9-32.3)** | 32.1(13.9-39.8)** | 3.9(2.2-6.2) | 2.1(1.7-6.1) | 2.7(1.6-4.8) | ||||||||||||
| 17-HDHA | 0.4(0.3-0.6) | 0.4(0.3-0.5) | 0.5(0.5-0.6) | 0.4(0.3-0.6) | 0.3(0.2-0.4) | 0.4(0.3-0.6) | 0.4(0.4-0.5) | 16.5(8.0-29.9)** | 16.2(11.1-36.0)** | 1.9(1.1-2.6)** | 0.7(0.6-1.0)* | 0.6(0.5-0.7) | ||||||||||||
| RvD1 | 2.6(0.0-4.0) | 4.0(0.0-5.1) | 3.1(0.6-3.9) | 3.3(0.6-5.0) | 1.8(0.0-4.1) | 3.2(0.7-3.9) | 1.3(0.0-4.1) | 4.5(1.0-7.4) | 4.9(4.1-7.7)* | 1.5(0.3-4.6) | 2.0(0.3-2.6) | 2.7(0.4-5.1) | ||||||||||||
| RvD2 | 0.0(0.0-3.6) | 1.4(0.0-5.9) | 0.0(0.0-0.0) | 0.9(0.0-2.5) | 2.5(0.5-3.0) | 0.0(0.0-2.9) | 2.5(0.0-4.3) | 4.2(0.8-5.3) | 5.7(2.7-6.9) | 2.1(0.0-3.4) | 3.3(0.4-4.3) | 2.7(0.2-4.5) | ||||||||||||
| RvD3 | 1.0(0.0-1.8) | 0.7(0.0-1.7) | 0.0(0.0-1.2) | 0.4(0.0-1.3) | 0.8(0.0-1.0) | 0.0(0.0-0.8) | 0.7(0.0-0.9) | 0.6(0.0-2.0) | 1.6(0.3-2.1) | 1.5(0.8-2.3)* | 1.1(0.3-1.3) | 0.6(0.1-1.0) | ||||||||||||
| RvD4 | 0.0(0.0-0.0) | 0.0(0.0-0.0) | 0.0(0.0-0.0) | 0.0(0.0-0.0) | 0.0(0.0-0.0) | 0.0(0.0-0.0) | 0.0(0.0-0.0) | 0.7(0.0-4.5) | 0.0(0.0-2.6) | 0.0(0.0-0.0) | 0.0(0.0-0.0) | 0.0(0.0-0.0) | ||||||||||||
| RvD5 | 3.1(2.2-4.6) | 4.8(3.3-17.0) | 3.3(0.3-4.2) | 3.6(0.6-5.8) | 2.6(1.8-4.8) | 3.9(2.7-4.7) | 4.9(1.1-6.2) | 58.3(16.6-121.1)** | 23.6(15.6-43.3)** | 7.9(4.7-11.6) | 5.3(3.0-7.4) | 5.2(2.8-7.7) | ||||||||||||
| PDX | 1.8(1.5-2.0) | 4.6(2.2-6.6)* | 2.9(0.8-3.8) | 2.5(0.5-3.5) | 2.2(1.7-3.7) | 1.9(0.0-2.9) | 1.9(1.5-3.0) | 31.2(6.3-49.2)* | 12.6(7.0-21.2)** | 3.9(0.5-6.5) | 2.9(2.2-3.7) | 2.0(1.1-3.8) | ||||||||||||
| PD1 | 1.6(0.2-3.2) | 0.0(0.0-3.3) | 2.3(0.0-3.6) | 2.3(0.4-3.0) | 3.3(0.4-4.0) | 1.6(0.0-3.3) | 2.3(1.7-4.1) | 8.5(5.8-10.3)* | 5.9(3.7-10.0)* | 3.5(2.1-5.5) | 1.4(0.3-3.0) | 0.0(0.0-2.1) | ||||||||||||
| MaR1 | 7.6(0.0-16.5) | 9.0(7.4-24.1) | 0.0(0.0-10.1) | 8.8(0.0-13.1) | 11.4(0.0-14.6) | 2.4(0.0-19.1) | 8.4(0.0-10.2) | 17.1(16.0-24.2)** | 3.5(0.0-19.8) | 7.2(0.0-26.7) | 11.8(10.1-13.4) | 8.8(0.0-10.5) | ||||||||||||
| MaR2 | 0.0(0.0-0.0) | 0.4(0.0-1.6) | 0.0(0.0-0.0) | 0.0(0.0-1.1) | 0.0(0.0-1.1) | 1.1(0.0-1.9) | 0.0(0.0-2.0) | 39.3(23.0-62.9)** | 23.1(14.7-33.1)** | 3.2(1.5-6.7)* | 1.8(0.4-3.4)* | 1.7(0.4-3.3)* | ||||||||||||
| EPA metabolome | ||||||||||||||||||||||||
| EPA | 47.0(33.8-53.4) | 42.9(25.2-62.9) | 53.9(37.7-66.3) | 44.5(27.1-51.0) | 28.5(19.5-45.3)* | 45.6(22.1-57.1) | 37.1(25.8-55.2) | 88.0(74.0-120.3)** | 120.7(106.3-126.0)** | 94.9(87.2-111.7)** | 87.9(84.7-99.4)** | 88.9(80.4-100.1)** | ||||||||||||
| 18-HEPE | 0.2(0.2-0.3) | 0.2(0.2-0.3) | 0.2(0.2-0.3) | 0.2(0.1-0.3) | 0.2(0.2-0.3) | 0.2(0.2-0.3) | 0.2(0.2-0.3) | 29.6(14.9-50.2)** | 16.4(12.6-30.9)** | 2.6(1.5-3.4)** | 0.9(0.7-1.1)** | 0.7(0.5-0.7)** | ||||||||||||
| RvE1 | 0.0(0.0-0.0) | 0.0(0.0-0.0) | 0.0(0.0-0.0) | 0.0(0.0-0.0) | 0.0(0.0-0.0) | 0.0(0.0-0.0) | 0.0(0.0-0.0) | 0.0(0.0-0.0) | 0.0(0.0-0.0) | 0.0(0.0-0.0) | 0.0(0.0-0.0) | 0.0(0.0-0.0) | ||||||||||||
| AA metabolome | ||||||||||||||||||||||||
| AA | 66.9(57.2-78.1) | 67.8(61.4-84.1) | 72.0(63.3-79.1) | 68.9(62.9-76.6) | 60.3(55.5-70.9) | 70.7(59.0-81.9) | 76.2(69.3-89.2) | 73.2(65.1-75.2) | 76.4(68.9-89.0) | 70.3(66.9-78.0) | 67.2(62.1-80.1) | 76.7(70.8-84.7) | ||||||||||||
| LXA4 | 0.6(0.0-1.3) | 1.7(0.0-2.3) | 0.8(0.2-1.3) | 0.8(0.1-1.3) | 0.4(0.0-0.9) | 0.3(0.0-1.2) | 0.6(0.0-1.7) | 1.7(0.2-2.8) | 1.7(0.3-2.1) | 1.8(0.2-2.5) | 0.8(0.1-1.6) | 0.8(0.0-1.4) | ||||||||||||
| LXB4 | 0.0(0.0-0.0) | 0.0(0.0-0.0) | 0.0(0.0-0.0) | 0.0(0.0-0.0) | 0.0(0.0-0.0) | 0.0(0.0-0.0) | 0.0(0.0-0.0) | 0.0(0.0-0.0) | 0.0(0.0-0.0) | 0.0(0.0-4.7) | 0.0(0.0-0.0) | 0.0(0.0-0.0) | ||||||||||||
| LTB4 | 77.0(45.6-109.6) | 98.5(72.0-141.3) | 90.9(38.1-141.5) | 120.7(66.4-156.1)* | 94.9(47.8-120.0) | 142.3(75.5-185.1)* | 84.9(30.8-97.0) | 111.7(49.4-123.4) | 88.9(43.4-125.6) | 69.7(52.1-118.6) | 106.7(89.4-155.1) | 75.8(65.2-151.3)* | ||||||||||||
| PGD2 | 4.2(3.0-8.1) | 6.3(2.8-9.6) | 4.6(3.3-4.9) | 3.9(3.2-11.1) | 4.5(3.1-5.2) | 4.8(3.2-6.5) | 3.5(3.3-6.0) | 3.7(2.3-6.2) | 4.2(2.8-6.7) | 3.1(2.4-4.4) | 3.8(2.7-5.3) | 3.3(2.6-4.9) | ||||||||||||
| PGE2 | 29.9(22.8-36.9) | 34.1(20.2-56.1) | 27.2(21.0-33.3) | 28.8(22.2-39.9) | 20.7(16.7-23.3)* | 25.1(22.1-35.7) | 14.6(11.9-15.3) | 27.9(20.3-36.8)** | 30.0(24.9-44.0)* | 24.2(17.0-25.2) | 18.6(12.5-38.6) | 19.7(15.7-24.2) | ||||||||||||
| PGF2α | 15.3(13.9-17.9) | 22.0(17.7-35.9) | 18.4(14.3-20.1) | 20.1(13.4-23.9) | 16.7(14.9-22.1) | 14.9(13.5-17.0) | 16.5(13.7-22.2) | 19.9(14.0-22.9) | 16.8(12.3-18.0) | 15.3(14.3-17.5) | 17.4(15.0-25.0) | 15.4(11.2-18.6) | ||||||||||||
| TxB2 | 362.0(212.6-482.6) | 422.8(190.0-831.3) | 299.8(220.8-417.5) | 349.0(166.0-664.6) | 272.3(164.5-387.8) | 234.7(139.5-270.9) | 158.1(74.3-247.6) | 297.2(207.6-388.4)* | 177.6(100.6-232.3) | 125.4(63.6-228.3) | 163.0(122.9-288.8) | 154.3(78.2-177.4) | ||||||||||||
| DPA metabolome | ||||||||||||||||||||||||
| DPA | 50.1(42.5-62.8) | 39.4(25.5-48.8) | 64.0(42.4-95.7) | 34.4(26.1-45.3)* | 22.5(16.7-30.2)* | 59.7(34.5-65.8) | 42.9(36.1-51.7) | 98.2(68.5-167.3)** | 180.2(124.7-205.4)** | 59.7(41.1-82.9)* | 41.1(27.1-68.0) | 58.3(45.0-82.4)* | ||||||||||||
Values are expressed as median (interquartile range) Concentrations are expressed in pg/ml, except for free fatty acids (DHA, EPA, AA, DPA) and their monohydroxylated metabolites (18-HEPE, 14-HDHA and 17-HDHA) that are expressed in ng/ml. Statistical significance, relative to time 0, within each situation as determined by by Wilcoxon Signed Rank test (*p<0.05;**p<0.01).
Table 3.
Serum concentrations of free fatty acids and lipid mediators’ metabolomes.
| Control (water dosing) | Enriched-SPM marine oil supplementation | |||||||||||
|---|---|---|---|---|---|---|---|---|---|---|---|---|
| 0 hours | 3 hours | 6 hours | 9 hours | 12 hours | 24 hours | 0 hours | 3 hours | 6 hours | 9 hours | 12 hours | 24 hours | |
| DHA metabolome | ||||||||||||
| DHA | 76.0(58.3-87.7) | 59.7(55.6-64.4) | 82.0(71.8-104.9) | 70.2(61.3-93.9) | 56.7(43.5-63.1) | 69.0(43.9-83.2) | 68.5(55.9-72.7) | 55.0(52.0-61.5) | 65.0(40.3-86.8) | 59.7(47.5-77.2) | 64.3(55.4-72.2) | 64.6(57.7-82.1) |
| 14-HDHA | 109.3(76.4-134.1) | 82.4(69.5-102.2) | 118.9(80.3-156.0) | 72.8(68.0-99.2) | 56.2(51.3-82.5)* | 109.4(81.4-126.6) | 102.1(72.8-137.1) | 175.2(123.2-209.1) | 219.7(180.7-268.7)** | 103.1(83.5-120.0) | 102.6(81.2-126.1) | 126.0(90.3-150.9) |
| 17-HDHA | 16.4(9.9-21.2) | 10.4(9.2-16.6) | 17.9(10.1-22.0) | 11.9(8.0-14.8) | 8.3(7.2-11.0)** | 16.4(13.5-18.9) | 13.3(10.4-27.0) | 44.7(26.3-58.3) | 60.5(46.4-112.6)** | 16.5(11.9-20.0) | 17.0(9.7-23.9) | 20.2(13.7-24.0) |
| RvD1 | 0.0(0.0-0.0) | 0.0(0.0-0.0) | 0.0(0.0-0.0) | 0.0(0.0-0.0) | 0.0(0.0-0.0) | 0.0(0.0-0.0) | 0.0(0.0-0.0) | 0.0(0.0-0.0) | 0.0(0.0-3.6) | 0.0(0.0-0.0) | 0.0(0.0-0.0) | 0.0(0.0-2.5) |
| RvD2 | 3.4(0.5-4.4) | 2.9(1.8-3.9) | 2.0(0.0-4.2) | 0.0(0.0-2.2) | 0.8(0.0-2.6) | 0.0(0.0-0.9) | 0.0(0.0-2.9) | 0.0(0.0-1.0) | 3.2(0.0-4.3) | 3.5(1.9-4.6) | 1.8(0.0-3.1) | 2.6(0.5-3.7) |
| RvD3 | 0.0(0.0-0.0) | 0.0(0.0-2.3) | 0.0(0.0-1.6) | 0.0(0.0-0.0) | 0.0(0.0-0.0) | 0.0(0.0-1.5) | 0.0(0.0-0.0) | 0.0(0.0-3.7) | 0.0(0.0-0.0) | 0.0(0.0-0.0) | 0.0(0.0-1.4) | 0.0(0.0-1.4) |
| RvD4 | 0.0(0.0-0.0) | 0.0(0.0-0.0) | 0.0(0.0-0.0) | 0.0(0.0-0.0) | 0.0(0.0-0.0) | 0.0(0.0-0.0) | 0.0(0.0-0.0) | 0.0(0.0-1.9) | 0.0(0.0-0.0) | 0.0(0.0-0.0) | 0.0(0.0-0.0) | 0.0(0.0-0.0) |
| RvD5 | 48.2(27.3-77.0) | 39.4(30.5-50.3) | 48.2(33.0-71.9) | 38.8(35.4-43.0) | 33.3(26.9-61.5) | 53.8(35.6-72.5) | 64.5(32.3-90.7) | 234.3(130.7-312.4)* | 240.0(130.0-488.5)** | 72.3(48.8-112.6) | 60.9(47.2-111.9) | 79.5(70.6-88.2) |
| PDX | 56.9(49.1-87.1) | 52.7(48.3-82.4) | 58.3(47.0-122.5) | 52.9(37.3-94.1) | 41.9(31.9-75.0)* | 79.9(39.4-104.5) | 65.4(43.2-92.7) | 122.2(81.4-155.3) | 188.9(96.3-210.9)* | 63.3(49.6-106.4) | 61.7(49.2-131.6) | 79.2(62.3-130.7) |
| PD1 | 7.5(5.9-11.2) | 7.8(5.1-11.8) | 5.1(2.4-9.8) | 5.8(2.5-8.9) | 3.7(2.2-6.3)* | 5.6(0.7-7.9) | 8.3(6.2-10.3) | 13.3(9.3-19.7)** | 12.8(5.9-24.3) | 9.0(7.3-11.6) | 6.1(4.9-12.5) | 6.4(5.6-10.7) |
| MaR1 | 7.9(0.0-12.5) | 18.4(11.9-20.7)* | 11.7(0.0-38.1) | 18.9(8.4-31.1)* | 12.9(3.1-17.4) | 2.9(0.0-13.7) | 13.8(3.1-16.3) | 22.7(9.2-65.1) | 12.5(0.0-53.4) | 17.8(0.0-21.8) | 19.4(10.6-33.3) | 10.9(0.0-20.6) |
| MaR2 | 52.1(33.9-71.8) | 36.1(34.3-70.2) | 55.2(33.9-87.9) | 37.1(29.3-48.5) | 30.2(16.4-58.4) | 55.4(33.3-79.8) | 47.8(23.6-125.5) | 166.9(137.8-235.1) | 226.3(137.9-390.5)* | 47.7(40.2-76.3) | 54.9(38.0-127.2) | 68.3(49.2-84.0) |
| EPA metabolome | ||||||||||||
| EPA | 78.6 (62.7-87.9) | 82.0(67.1-87.0) | 80.6(71.4-99.4) | 84.0(55.5-95.1) | 64.3(54.8-79.1) | 61.6(45.8-84.1) | 69.3(61.0-78.1) | 99.1(86.1-115.9)* | 134.7(99.4-155.7)** | 109.2(97.0-139.2)* | 116.0(103.0-123.7)* | 116.2(112.0-121.2)** |
| 18-HEPE | 3.4(2.6-6.3) | 2.6(2.1-5.9) | 3.8(2.6-5.3) | 3.2(1.7-5.4) | 2.2(1.9-4.1)* | 3.4(2.6-5.0) | 3.4(2.3-6.4) | 37.7(20.7-58.3)* | 31.6(24.9-60.5)** | 9.6(8.2-13.8) | 10.4(6.5-14.3) | 10.1(5.7-17.5) |
| RvE1 | 0.0(0.0-0.0) | 0.0(0.0-0.0) | 0.0(0.0-0.0) | 0.0(0.0-0.0) | 0.0(0.0-9.3) | 0.0(0.0-0.0) | 0.0(0.0-0.0) | 0.0(0.0-37.3) | 0.0(0.0-0.0) | 0.0(0.0-0.0) | 0.0(0.0-0.0) | 0.0(0.0-27.9) |
| AA metabolome | ||||||||||||
| AA | 101.8(88.6-125.4) | 89.2(83.9-115.7) | 126.6(81.4-140.6) | 102.4(83.3-134.4) | 87.7(81.0-105.9) | 101.0(70.9-130.4) | 105.1(96.5-116.2) | 100.7(83.5-118.3) | 105.4(85.0-128.9) | 109.1(79.7-127.7) | 94.9(87.1-103.4) | 99.2(88.2-108.2) |
| LXA4 | 1.3(1.0-3.3) | 0.8(0.0-2.1) | 1.3(0.0-1.7) | 0.4(0.0-1.4) | 1.7(0.9-2.2) | 1.3(0.2-2.6) | 1.8(1.1-3.1) | 2.2(0.4-2.7) | 1.9(0.4-3.1) | 0.0(0.0-1.6)* | 0.5(0.0-1.2)* | 2.0(0.0-2.8) |
| LXB4 | 4.3(0.0-15.3) | 0.0(0.08.2) | 0.0(0.0-0.0) | 0.0(0.0-0.0) | 0.0(0.0-0.0) | 0.0(0.0-3.3) | 0.0(0.0-3.9) | 0.0(0.0-0.0) | 0.0(0.0-0.0) | 0.0(0.0-26.2) | 0.0(0.0-6.0) | 2.0(0.0-7.5) |
| LTB4 | 526.7(211.3-680.6) | 379.8(326.3-575.2) | 391.5(268.6-598.6) | 267.1(217.6-360.6) | 311.2(190.2-572.1) | 330.0(239.0-493.7) | 406.0(245.8-471.8) | 428.9(267.3-574.5) | 507.8(297.9-719.2) | 285.6(177.9-414.9) | 401.3(226.9-541.1) | 474.1(289.1-591.9) |
| PGD2 | 101.4(67.8-160.3) | 109.4(67.9-172.1) | 137.4(101.4-183.8) | 125.0(85.8-205.5) | 120.7(88.8-159.4) | 118.9(79.6-413.2) | 146.2(82.5-178.1) | 122.5(86.5-183.5) | 90.5(62.7-139.8)* | 70.5(44.8-184.4) | 124.9(66.1-231.2) | 86.6(71.1-145.2) |
| PGE2 | 17108.2 (14972.2-33569.9) |
23277.6 (4963.2-34259.5) |
23348.0 (20979.7-31014.1) |
20607.8 (6011.2-43767.4) |
19912.2 (14690.2-31520.3) |
16471.9 (7613.6-51855.3) |
27618.9 (8779.9-37633.9) |
24636.2 (8194.4-40735.9) |
18231.1 (5721.1-25935.5) |
15037.9 (2624.0-37589.6) |
19513.7 (3637.4-35650.0) |
19594.4 (2631.4-26698.8) |
| PGF2α | 3827.7 (2754.4-4001.4) |
3249.5 (1963.8-4360.4) |
4545.5 (3588.5-4806.8) |
4199.8 (2933.9-6610.5) |
4000.6 (2765.7-5034.1) |
3740.5 (2234.1-8736.8) |
4377.2 (3210.0-5496.6) |
3732.9 (2716.5-4897.4) |
3274.1 (2613.5-4359.4) |
2979.8 (2162.5-5065.5) |
4011.4 (2316.6-4445.1) |
3315.2 (2874.6-3957.2) |
| TxB2 | 19806.9 (14400.2-27760.3) |
27790.8 (15922.1-31180.3) |
38756.6 (27045.2-47334.9) |
24570.9 (19173.9-32018.1) |
29234.7 (19041.8-42877.4) |
32345.3 (20572.8-46941.2) |
27305.0 (22935.3-40094.5) |
29370.3 (21000.7-32753.6) |
28810.5 (22468.0-43069.4) |
26064.5 (20533.9-36773.9) |
24540.2 (12355.5-30008.4) |
29810.3 (19209.5-36860.6) |
| DPA metabolome | ||||||||||||
| DPA | 59.0(38.4-70.1) | 40.0(35.3-49.6) | 72.5(55.5-78.2) | 38.6(34.3-49.5) | 49.4(39.7-62.8) | 51.8(42.9-71.3) | 51.9(47.9-61.5) | 125.8(82.0-147.5)* | 132.2(124.7-199.3)** | 64.4(57.4-80.6) | 61.3(55.7-68.3) | 65.9(55.7-81.8) |
Values are expressed as median (interquartile range). Concentrations are expressed in pg/ml, except for free fatty acids (DHA, EPA, AA, DPA and their monohydroxylated metabolites (18-HEPE, 14-HDHA and 17-HDHA) that are expressed in ng/ml. Statistical significance, relative to time 0, within each situation as determined by by Wilcoxon Signed Rank test (*p<0.05;**p<0.01).
Table 4.
Pharmacokinetic parameters in plasma.
| Cmax | Tmax | AUC | |||||||||||||||||||
|---|---|---|---|---|---|---|---|---|---|---|---|---|---|---|---|---|---|---|---|---|---|
| Control | Enriched-SPM marine oil | Control | Enriched-SPM marine oil | Control | Enriched-SPM marine oil | ||||||||||||||||
| AM | GM | SE | AM | GM | SE | p value | AM | GM | SE | AM | GM | SE | p value | AM | GM | SE | AM | GM | SE | p value | |
| DHA metabolome | |||||||||||||||||||||
| DHA | 17.29 | 0.00 | 5.07 | 17.21 | 0.00 | 5.53 | 1.000 | 9.43 | 7.75 | 2.65 | 9.75 | 8.31 | 2.25 | 0.766 | 227.08 | 0.00 | 79.71 | 158.70 | 0.00 | 57.58 | 0.571 |
| 14-HDHA | 1.25 | 0.00 | 0.87 | 31.51 | 27.53 | 5.02 | 0.000 | 13.00 | 10.69 | 3.61 | 5.40 | 5.22 | 0.40 | 0.021 | 10.67 | 0.00 | 6.47 | 181.70 | 153.53 | 33.73 | 0.000 |
| 17-HDHA | 0.24 | 0.00 | 0.05 | 31.59 | 26.01 | 5.82 | 0.000 | 6.00 | 5.31 | 1.13 | 5.10 | 4.87 | 0.46 | 0.727 | 1.56 | 0.00 | 0.49 | 125.38 | 106.76 | 21.44 | 0.000 |
| RvD1 | 6.75 | 0.00 | 4.54 | 5.08 | 4.61 | 0.75 | 0.038 | 7.50 | 5.58 | 2.54 | 7.20 | 5.83 | 1.96 | 0.888 | 37.61 | 0.000 | 14.53 | 62.89 | 44.94 | 16.43 | 0.602 |
| RvD2 | 5.38 | 0.00 | 2.97 | 5.42 | 0.00 | 1.47 | 0.307 | 9.38 | 7.14 | 2.57 | 6.67 | 6.08 | 0.97 | 0.619 | 40.72 | 0.00 | 13.35 | 48.521 | 0.00 | 14.25 | 0.347 |
| RvD3 | 5.69 | 0.00 | 4.94 | 1.83 | 1.69 | 0.24 | 0.064 | 10.71 | 7.44 | 3.58 | 9.00 | 7.56 | 1.90 | 0.960 | 20.68 | 0.00 | 14.60 | 15.47 | 12.80 | 2.763 | 0.667 |
| RvD4 | 2.51 | 0.00 | 2.51 | 2.44 | 0.00 | 0.88 | 0.113 | 3.00 | 3.00 | NA | 3.60 | 3.45 | 0.60 | 1.000 | 7.52 | 0.00 | 7.52 | 9.80 | 0.00 | 3.73 | 0.779 |
| RvD5 | 13.45 | 0.00 | 8.04 | 95.24 | 0.00 | 35.81 | 0.013 | 6.00 | 5.28 | 1.00 | 4.33 | 4.08 | 0.53 | 0.249 | 65.16 | 0.00 | 21.97 | 407.95 | 0.00 | 129.36 | 0.007 |
| PDX | 11.58 | 4.44 | 7.87 | 36.68 | 0.00 | 11.36 | 0.052 | 11.10 | 7.69 | 2.97 | 4.67 | 4.41 | 0.53 | 0.226 | 56.60 | 32.22 | 23.82 | 172.44 | 0.00 | 46.80 | 0.011 |
| PD1 | 8.23 | 0.00 | 5.51 | 7.09 | 0.00 | 1.35 | 0.112 | 12.33 | 8.82 | 3.14 | 3.67 | 3.50 | 0.44 | 0.028 | 50.63 | 0.00 | 22.45 | 52.04 | 0.00 | 12.71 | 0.832 |
| Mar-1 | 18.23 | 0.00 | 6.46 | 41.78 | 0.00 | 16.37 | 0.121 | 8.25 | 6.31 | 2.52 | 7.67 | 6.08 | 2.19 | 0.960 | 142.42 | 0.00 | 44.72 | 403.09 | 0.00 | 195.59 | 0.102 |
| Mar-2 | 7.50 | 0.00 | 5.49 | 62.05 | 47.34 | 14.77 | 0.001 | 10.88 | 7.90 | 3.10 | 4.20 | 3.96 | 0.49 | 0.077 | 59.60 | 0.00 | 40.16 | 261.43 | 211.55 | 56.24 | 0.000 |
| EPA metabolome | |||||||||||||||||||||
| EPA | 12.24 | 0.00 | 4.30 | 81.21 | 76.96 | 8.34 | 0.000 | 5.57 | 5.22 | 0.78 | 6.30 | 5.83 | 0.83 | 0.659 | 106.07 | 0.00 | 42.34 | 1182.33 | 1098.88 | 142.98 | 0.000 |
| 18-HEPE | 0.18 | 0.00 | 0.06 | 41.33 | 33.53 | 8.66 | 0.000 | 8.67 | 6.78 | 2.26 | 4.20 | 3.96 | 0.49 | 0.087 | 0.93 | 0.00 | 0.24 | 178.36 | 151.26 | 34.06 | 0.000 |
| RvE1 | 31.66 | 0.00 | 22.02 | 39.44 | 0.00 | 25.17 | 0.485 | 6.00 | 5.20 | 3.00 | 12.75 | 11.17 | 3.95 | 0.348 | 187.84 | 0.00 | 153.12 | 350.11 | 0.00 | 295.95 | 0.409 |
| AA metabolome | |||||||||||||||||||||
| AA | 20.15 | 0.00 | 5.62 | 10.38 | 0.00 | 3.84 | 0.197 | 6.67 | 5.89 | 1.09 | 13.71 | 10.87 | 3.64 | 0.228 | 214.24 | 0.00 | 74.16 | 115.69 | 0.00 | 50.26 | 0.109 |
| LXA4 | 6.48 | 0.00 | 5.41 | 2.03 | 1.71 | 0.40 | 0.241 | 9.38 | 6.00 | 3.38 | 6.00 | 5.08 | 1.18 | 0.922 | 25.12 | 0.00 | 15.76 | 18.42 | 14.24 | 3.76 | 0.619 |
| LXB4 | 8.00 | 0.00 | 5.91 | 3.53 | 0.00 | 1.52 | 1.000 | 10.50 | 7.90 | 4.66 | 6.75 | 6.18 | 1.44 | 0.881 | 34.32 | 0.00 | 19.98 | 25.06 | 0.00 | 12.92 | 0.531 |
| LTB4 | 109.08 | 97.76 | 17.84 | 95.62 | 78.64 | 19.65 | 0.631 | 14.10 | 11.01 | 2.83 | 13.20 | 10.88 | 2.54 | 0.969 | 1083.07 | 986.61 | 155.18 | 1147.52 | 812.18 | 271.20 | 0.511 |
| PGD2 | 11.53 | 0.00 | 7.12 | 10.32 | 0.00 | 7.03 | 0.622 | 7.88 | 6.09 | 2.47 | 9.00 | 6.00 | 3.31 | 0.781 | 45.29 | 0.00 | 19.23 | 56.17 | 0.00 | 28.24 | 0.590 |
| PGE2 | 31.52 | 15.69 | 8.97 | 32.03 | 21.30 | 11.91 | 0.912 | 9.60 | 7.26 | 2.52 | 6.00 | 5.29 | 1.00 | 0.410 | 135.04 | 77.29 | 30.82 | 302.23 | 183.77 | 93.72 | 0.101 |
| PGF2α | 17.35 | 0.00 | 7.86 | 12.43 | 0.00 | 5.94 | 0.791 | 5.63 | 4.70 | 1.32 | 8.25 | 6.00 | 2.65 | 0.523 | 108.11 | 0.00 | 41.47 | 114.30 | 0.00 | 57.91 | 0.980 |
| TXB2 | 384.95 | 280.81 | 107.40 | 166.63 | 132.30 | 27.13 | 0.315 | 6.90 | 5.90 | 1.19 | 8.70 | 6.43 | 2.21 | 0.658 | 2913.55 | 1824.43 | 1031.20 | 1628.87 | 1209.08 | 323.46 | 0.196 |
| DPA metabolome | |||||||||||||||||||||
| DPA | 27.96 | 0.00 | 7.99 | 131.44 | 124.19 | 12.46 | 0.000 | 6.86 | 6.63 | 0.86 | 5.40 | 5.22 | 0.40 | 0.123 | 283.94 | 0.00 | 85.06 | 885.68 | 834.56 | 109.40 | 0.000 |
AUC, area under the curve; AM, arithmetic mean; GM, geometric mean; SE, standard error. Statistically significant differences (p <0.05) are marked in bold.
Table 5.
Pharmacokinetic parameters in serum.
| Cmax | Tmax | AUC | |||||||||||||||||||||||||||||||||||||||
|---|---|---|---|---|---|---|---|---|---|---|---|---|---|---|---|---|---|---|---|---|---|---|---|---|---|---|---|---|---|---|---|---|---|---|---|---|---|---|---|---|---|
| Control | Enriched-SPM marine oil | Control | Enriched-SPM marine oil | Control | Enriched-SPM marine oil | ||||||||||||||||||||||||||||||||||||
| AM | GM | SE | AM | GM | SE | p value | AM | GM | SE | AM | GM | SE | p value | AM | GM | SE | AM | GM | SE | p value | |||||||||||||||||||||
| DHA metabolome | |||||||||||||||||||||||||||||||||||||||||
| DHA | 26.41 | 11.39 | 9.83 | 25.29 | 0.00 | 6.23 | 0.631 | 10.20 | 8.34 | 2.38 | 11.00 | 8.94 | 2.60 | 0.799 | 192.35 | 64.20 | 77.99 | 181.63 | 0.00 | 43.62 | 0.742 | ||||||||||||||||||||
| 14-HDHA | 27.33 | 0.00 | 10.01 | 142.20 | 123.93 | 24.68 | 0.000 | 9.67 | 7.56 | 2.73 | 6.90 | 5.60 | 1.95 | 0.295 | 229.37 | 0.00 | 100.79 | 1019.52 | 800.94 | 196.99 | 0.000 | ||||||||||||||||||||
| 17-HDHA | 4.31 | 0.00 | 1.73 | 63.80 | 0.00 | 13.35 | 0.002 | 10.50 | 8.19 | 3.00 | 5.33 | 5.14 | 0.44 | 0.127 | 36.33 | 0.00 | 17.10 | 328.22 | 0.00 | 65.23 | 0.000 | ||||||||||||||||||||
| RvD1 | 1.72 | 0.00 | 0.79 | 2.11 | 0.00 | 0.91 | 0.765 | 9.00 | 6.00 | 5.05 | 6.75 | 6.00 | 1.89 | 0.879 | 6.15 | 0.00 | 2.78 | 27.96 | 0.00 | 13.54 | 0.147 | ||||||||||||||||||||
| RvD2 | 3.82 | 0.00 | 2.02 | 4.76 | 0.00 | 1.12 | 0.184 | 9.00 | 7.51 | 2.34 | 9.38 | 7.62 | 2.37 | 0.829 | 27.30 | 0.00 | 10.63 | 48.91 | 0.00 | 12.94 | 0.049 | ||||||||||||||||||||
| RvD3 | 1.38 | 0.00 | 0.56 | 1.45 | 0.00 | 0.57 | 0.781 | 12.00 | 8.49 | 4.03 | 5.40 | 4.55 | 1.75 | 0.289 | 15.67 | 0.00 | 8.58 | 17.28 | 0.00 | 9.49 | 0.572 | ||||||||||||||||||||
| RvD4 | 0.29 | 0.00 | 0.21 | 4.96 | 0.00 | 2.76 | 0.121 | 6.00 | 5.20 | 3.00 | 4.80 | 3.96 | 1.80 | 0.809 | 0.88 | 0.00 | 0.64 | 17.95 | 0.00 | 9.79 | 0.131 | ||||||||||||||||||||
| RvD5 | 24.33 | 0.00 | 7.32 | 273.67 | 132.61 | 58.45 | 0.001 | 11.67 | 8.54 | 3.14 | 5.10 | 4.87 | 0.46 | 0.129 | 197.61 | 0.00 | 72.63 | 1524.07 | 665.60 | 332.83 | 0.000 | ||||||||||||||||||||
| PDX | 37.18 | 0.00 | 15.43 | 98.85 | 85.28 | 16.49 | 0.009 | 15.38 | 12.62 | 3.28 | 7.20 | 6.00 | 1.91 | 0.023 | 519.84 | 0.00 | 327.01 | 797.49 | 610.21 | 169.81 | 0.007 | ||||||||||||||||||||
| PD1 | 4.64 | 0.00 | 2.16 | 11.68 | 8.64 | 2.74 | 0.031 | 7.50 | 5.31 | 2.66 | 6.60 | 5.22 | 1.99 | 0.848 | 27.62 | 0.00 | 12.42 | 78.03 | 53.33 | 19.43 | 0.015 | ||||||||||||||||||||
| Mar-1 | 59.75 | 28.18 | 32.54 | 66.62 | 0.00 | 35.58 | 0.579 | 7.20 | 6.51 | 1.02 | 6.00 | 5.38 | 1.00 | 0.414 | 501.50 | 203.70 | 320.76 | 754.21 | 0.00 | 506.62 | 0.546 | ||||||||||||||||||||
| Mar-2 | 38.14 | 0.00 | 13.20 | 249.45 | 0.00 | 77.37 | 0.016 | 10.00 | 7.56 | 2.78 | 5.67 | 5.56 | 0.33 | 0.460 | 380.39 | 0.00 | 155.03 | 1187.84 | 0.00 | 343.44 | 0.001 | ||||||||||||||||||||
| EPA metabolome | |||||||||||||||||||||||||||||||||||||||||
| EPA | 17.88 | 0.00 | 4.64 | 93.60 | 59.28 | 23.43 | 0.002 | 9.86 | 8.21 | 2.60 | 8.40 | 7.26 | 1.83 | 0.572 | 143.12 | 0.00 | 40.38 | 1078.94 | 635.09 | 248.02 | 0.000 | ||||||||||||||||||||
| 18-HEPE | 1.41 | 0.00 | 0.45 | 48.23 | 0.00 | 10.85 | 0.002 | 13.71 | 10.43 | 3.70 | 4.33 | 4.08 | 0.53 | 0.022 | 15.92 | 0.00 | 5.47 | 326.87 | 0.00 | 56.79 | 0.000 | ||||||||||||||||||||
| RvE1 | 103.61 | 0.00 | 66.11 | 40.76 | 0.00 | 14.82 | 0.532 | 12.60 | 10.45 | 3.34 | 9.43 | 6.00 | 3.79 | 0.393 | 708.14 | 0.00 | 422.16 | 365.62 | 0.00 | 170.34 | 0.296 | ||||||||||||||||||||
| AA metabolome | |||||||||||||||||||||||||||||||||||||||||
| AA | 34.00 | 0.00 | 10.87 | 26.18 | 0.00 | 9.51 | 0.545 | 13.67 | 11.78 | 2.65 | 10.00 | 8.94 | 1.94 | 0.336 | 284.67 | 0.00 | 95.71 | 172.00 | 0.00 | 39.99 | 0.306 | ||||||||||||||||||||
| LXA4 | 2.55 | 0.00 | 1.08 | 1.48 | 0.00 | 0.38 | 0.702 | 12.00 | 9.07 | 3.34 | 12.86 | 8.92 | 3.97 | 1.000 | 18.48 | 0.00 | 7.07 | 15.12 | 0.00 | 5.31 | 0.157 | ||||||||||||||||||||
| LXB4 | 6.39 | 0.00 | 4.11 | 10.88 | 0.00 | 5.43 | 0.482 | 11.25 | 8.49 | 4.64 | 13.80 | 10.70 | 4.31 | 0.802 | 41.09 | 0.00 | 27.45 | 70.86 | 0.00 | 30.28 | 0.509 | ||||||||||||||||||||
| LTB4 | 219.86 | 0.00 | 91.14 | 224.27 | 0.00 | 66.01 | 0.448 | 9.00 | 7.02 | 2.78 | 11.33 | 8.17 | 3.19 | 0.868 | 2271.84 | 0.00 | 1062.66 | 1962.96 | 0.00 | 643.55 | 0.676 | ||||||||||||||||||||
| PGD2 | 166.23 | 102.59 | 50.86 | 50.67 | 0.00 | 34.54 | 0.014 | 14.70 | 12.65 | 2.59 | 8.57 | 6.36 | 2.89 | 0.099 | 1449.61 | 772.28 | 478.45 | 523.32 | 0.00 | 336.81 | 0.018 | ||||||||||||||||||||
| PGE2 | 21848.97 | 0.00 | 6352.51 | 9748.40 | 0.00 | 6561.40 | 0.072 | 13.88 | 11.17 | 3.10 | 7.00 | 4.76 | 3.44 | 0.071 | 237403.15 | 0.00 | 85313.21 | 78700.96 | 0.00 | 63805.26 | 0.072 | ||||||||||||||||||||
| PGF2α | 3559.09 | 0.00 | 1187.05 | 965.85 | 0.00 | 555.45 | 0.052 | 15.33 | 13.13 | 2.80 | 6.50 | 5.72 | 1.43 | 0.040 | 36333.89 | 0.00 | 13191.80 | 10065.52 | 0.00 | 7378.03 | 0.021 | ||||||||||||||||||||
| TXB2 | 24746.36 | 0.00 | 5917.52 | 29064.68 | 0.00 | 16808.12 | 0.307 | 12.67 | 9.96 | 2.95 | 13.50 | 10.24 | 3.26 | 0.882 | 321567.88 | 0.00 | 97455.88 | 250355.73 | 0.00 | 133126.57 | 0.577 | ||||||||||||||||||||
| DPA metabolome | |||||||||||||||||||||||||||||||||||||||||
| DPA | 28.80 | 0.00 | 7.54 | 111.40 | 0.00 | 22.95 | 0.003 | 9.00 | 7.31 | 2.70 | 5.00 | 4.76 | 0.50 | 0.158 | 233.06 | 0.00 | 78.44 | 724.19 | 0.00 | 165.43 | 0.000 | ||||||||||||||||||||
AUC, area under the curve; AM, arithmetic mean; GM, geometric mean; SE, standard error. Statistically significant differences (p <0.05) are marked in bold.
Table 6.
Nutritional composition of the food provided during the study.
| kcal | Fat (g) | Protein (g) | Carbohydrates (g) | |
|---|---|---|---|---|
| Breakfast | ||||
| Skim milk, 1 cup | 70.0 | 0.6 | 6.4 | 9.6 |
| Bread, 2 slices with tomatoe | 158.0 | 0.8 | 3.9 | 13.3 |
| Apple, 1 medium | 108.2 | 0.7 | 0.6 | 22.8 |
| Lunch | ||||
| Lentils with vegetables | 365.0 | 8.3 | 21.0 | 43.8 |
| Grilled chicken | 217.5 | 9.3 | 33.3 | 0.0 |
| Pear, 1 medium | 84.0 | 0.2 | 0.73 | 3.7 |
| Snack | ||||
| Skim milk, 1 cup | 70.0 | 0.6 | 6.4 | 9.6 |
| Biscuits, 8 units | 248.0 | 10.4 | 3.2 | 35.2 |
| Apple, 1 medium | 108.2 | 0.7 | 0.6 | 22.8 |
| Dinner | ||||
| Salad | 131.7 | 10.8 | 2.3 | 4.9 |
| Grilled pork loin | 466.5 | 39.9 | 24.4 | 1.5 |
| Roasted green pepper | 35.4 | 1.4 | 1.1 | 2.9 |
| Low-fat yoghurt | 50.0 | 0.5 | 4.8 | 5.6 |
Table 7.
Specialized pro-resolving lipid mediators lower limit of quantification.
| Analyte | LLOQ (pg/ml) |
|---|---|
| Docosahexaenoic acid, DHA | 0.02 |
| Docosapentaenoic acid, DPA | 0.15 |
| Eicosapentaenoic acid, EPA | 0.01 |
| Arachidonic acid, AA | 0.02 |
| 14-hydroxydocosahexaenoic acid, 14-HDHA | 0.08 |
| 17-hydroxydocosahexaenoic acid, 17-HDHA | 0.33 |
| 18-hydroxyeicosapentaenoic acid, 18-HEPE | 0.24 |
| Leucotriene B4, LTB4 | 0.25 |
| Lipoxin A4, LXA4 | 0.28 |
| Lipoxin B4, LXB4 | 0.25 |
| Maresin 1, MaR-1 | 0.74 |
| Maresin 2, MaR-2 | 0.18 |
| Prostaglandin D2, PGD2 | 0.17 |
| Prostaglandin E2, PGE2 | 0.30 |
| Prostaglandin F2α, PGF2α | 0.43 |
| Protectin D1, PD1 | 0.15 |
| Protectin DX, PDX | 0.30 |
| Resolvin E1, RvE1 | 0.21 |
| Resolvin D1, RvD1 | 0.64 |
| Resolvin D2, RvD2 | 0.97 |
| Resolvin D3, RvD3 | 0.30 |
| Resolvin D4, RvD4 | 0.42 |
| Resolvin D5, RvD5 | 0.25 |
| Tromboxane B2, TXB2 | 0.29 |
LLOQ was determined by a signal-to-noise ratio of 5:1.
Disclaimer/Publisher’s Note: The statements, opinions and data contained in all publications are solely those of the individual author(s) and contributor(s) and not of MDPI and/or the editor(s). MDPI and/or the editor(s) disclaim responsibility for any injury to people or property resulting from any ideas, methods, instructions or products referred to in the content. |
© 2023 by the authors. Licensee MDPI, Basel, Switzerland. This article is an open access article distributed under the terms and conditions of the Creative Commons Attribution (CC BY) license (http://creativecommons.org/licenses/by/4.0/).
Copyright: This open access article is published under a Creative Commons CC BY 4.0 license, which permit the free download, distribution, and reuse, provided that the author and preprint are cited in any reuse.