Submitted:
11 October 2023
Posted:
13 October 2023
You are already at the latest version
Abstract
Keywords:
1. Introduction
2. Materials and Methods
2.1. Materials
2.1.1. Microparticle preparation
2.1.2. Test organism
2.2. Methods
2.2.1. Chemical fingerprinting by Fourier transform infrared spectroscopy coupled with Attenuated Total Reflectance (ATR)
2.2.2. Microscopic observations
- (a)
- Microscopic analysis of microparticle size, surface morphology, and topography
- (b)
- Microscopic analysis of the potential antifungal effect on the microstructures of B. cinerea
2.2.3. Encapsulation efficiency and loading capacity
- (a)
- Encapsulation efficiency (EE)
- (b)
- Loading capacity (LC)
2.2.4. Swelling degree (Sw)
2.2.5. In vitro active agents release
2.2.6. Testing the antifungal effect of microparticles on the growth of B. Cinerea
2.2.7. Statistical analysis
3. Results and Discussion
3.1. Evaluation of microparticle physicochemical properties
3.1.1. Identification of interactions between microparticle constituents
3.1.2. Size, surface morphology, and topography of microparticles
3.1.3. Encapsulation efficiency, loading capacity, swelling degree, and cation releasing from microparticles
3.2. Antifungal effect of microparticles on the B. cinerea growth
4. Conclusions
Author Contributions
Funding
Institutional Review Board Statement
Data Availability Statement
Conflicts of Interest
References
- Özkara, A.; Akyil, D.; Konuk, M. Pesticides, Environmental Pollution, and Health. In Environmental Health Risk - Hazardous Factors to Living Species; In Tech, 2016; Ch. 1, pp.1-27. [CrossRef]
- Kumari, D.; John, S. Safety and Occupational Health Hazards of Agricultural Workers Handling Pesticides: A Case Study. In Advances in Health and Environment Safety. Springer Transactions in Civil and Environmental Engineering; Springer, Singapore. 2018; pp. 75-82. [CrossRef]
- Mahesha, H.S.; Vinay, J.U.; Ravikumar, M.R.; Visweswarashastry, S.; Keerthi, M.C.; Halli, H.M.; Shokralla, S.; El-Abedin, T.K.Z.; Mahmoud, E.A.; Elansary, H.O. Colloidal Silver Hydrogen Peroxide: New Generation Molecule for Management of Phytopathogens. Horticulturae, 2021, 7, 573. [CrossRef]
- Prasad, R. Synthesis of silver nanoparticles in photosynthetic plants. J. Nanopart., 2014, 963961, 1-8. [CrossRef]
- Anand, R; Bhagat, M. Silver nanoparticles (AgNPs): as nanopesticides and nanofertilizers. MOJ Biol. Med. 2019, 4, 18-20. [CrossRef]
- Gupta, N.; Upadhyaya, C.P.; Singh, A.; Abd-Elsalam, K.A.: Prasad, R. Applications of Silver Nanoparticles in Plant Protection. In Nanobiotechnology Applications in Plant Protection. Nanotechnology in the Life Sciences. Springer, Cham. 2018; pp. 247-265. [CrossRef]
- Cabot, C.; Martos, S.; Llugany, M.; Gallego, B.; Tolrà, R.; Poschenrieder, C. A Role for Zinc in Plant Defense Against Pathogens and Herbivores. Front. Plant Sci. 2010, 10, 1171. [CrossRef]
- Montalvo, D.; Degryse, F.; da Silva, R. C.; Baird, R.; McLaughlin, M. J. Agronomic Effectiveness of Zinc Sources as Micronutrient Fertilizer. Adv. Agr. 2016, 139, 215–267. [CrossRef]
- Kaur, H.; Garg, N. Zinc toxicity in plants: a review. Planta. 2021, 253, 129. [CrossRef]
- Yan, A.; Chen, Z. Impacts of Silver Nanoparticles on Plants: A Focus on the Phytotoxicity and Underlying Mechanism. Int. J. Mol. Sci. 2019, 20, 1003. [CrossRef]
- Vinceković, M.; Jalšenjak, N.; Topolovec-Pintarić, S.; Đermić, E.; Bujan, M.; Jurić, S. Encapsulation of Biological and Chemical Agents for Plant Nutrition and Protection: Chitosan/Alginate Microcapsules Loaded with Copper Cations and Trichoderma viride. J. Agri. Food Chem. 2016, 64, 8073–8083. [CrossRef]
- Grant, G.T.; Morris, E.R.; Rees, D.A.; Smith, P.J.C.; Thom, D. Biological interactions between polysaccharides and divalent cations: the egg-box model, FEBS Lett. 1973, 32, 195–198. [CrossRef]
- Krasaekoopt, W.; Bhandari, B.; Deeth, H. Evaluation of encapsulation techniques of probiotics for yoghurt. Int. Dairy J. 2003, 13, 3–13. [CrossRef]
- Lucinda-Silva, R.M.; Salgado, H.R.N.; Evangelista, R.C. Alginate–chitosan systems: In vitro controlled release of triamcinolone and in vivo gastrointestinal transit. Carbohydr. Polym. 2010, 81, 260-268. [CrossRef]
- Li, L.; Wang, L.; Li, J.; Jiang, S.; Wang, Y.; Zhang, X.; Ding, J.; Yu, T.; Mao, S; Insights into the mechanisms of chitosan–anionic polymers-based matrix tablets for extended drug release. Int. J. Pharm. 2014, 476, 253-265. [CrossRef]
- Cheung, N.; Tian, L.; Liu, X.; Li, X. The Destructive Fungal Pathogen Botrytis cinerea-Insights from Genes Studied with Mutant Analysis. Pathogens. 2020, 9, 923. [CrossRef]
- Guzmán C.; Bagga M.; Kaur A.; Westermarck J.; Abankwa D. ColonyArea: An ImageJ Plugin to Automatically Quantify Colony Formation in Clonogenic Assays. PLoS ONE, 2014, 9(3), e92444. [CrossRef]
- Xue, W. M.; Yu, W. T.; Liu, X. D.; He, X.; Wang, W. X.; Ma, J. Chemical method of breaking the cell-loaded sodium alginate/chitosan microcapsules. Chem. J. Chin. Univ. 2004, 25, 1342–1346. http://www.cjcu.jlu.edu.cn/EN/Y2004/V25/I7/1342.
- Li, X.Y.; Jin, L.J.; McAllister, T.A.; Stanford, K.; Xu, J.Y.; Lu, Y.N.; Zhen, Y.H.; Sun, Y.X; Xu, Y.P. Chitosan-alginate microcapsules for oral delivery of egg yolk immunoglobulin (IgY). J Agric Food Chem. 2007, 55, 2911-2918. [CrossRef]
- Mokale, V.; Jitendra, N.; Yogesh, S.; Gokul, K. Chitosan reinforced alginate controlled release beads of losartan potassium: design, formulation and in vitro evaluation. J. Pharm. Investig. 2014, 44, 243–252. [CrossRef]
- Fraternale, D.; Giamperi, L.; Ricci, D. Chemical Composition and Antifungal Activity of Essential Oil Obtained from In Vitro Plants of Thymus mastichinaL. J. Essent. Oil Res. 2003, 15, 278-281. [CrossRef]
- Sartori, C.; Finch, D.S.; Ralph, B. Determination of the cation content of alginate thin films by FT IR Spectroscopy. Polymer. 1997, 38, 43-51. [CrossRef]
- Sankalia, M.G.; Mashru, R.C.; Sankalia, J.M.; Sutariya, V.B. Reversed chitosan-alginate polyelectrolyte complex for stability improvement of alpha-amylase: optimization and physicochemical characterization. Eur. J. Pharm. Biopharm. 2007, 65, 215-232. [CrossRef]
- Lawrie, G.; Keen, I.; Drew, B.; Chandler-Temple, A.; Rintoul, L.; Fredericks, P.; Grøndahl, L. Interactions between alginate and chitosan biopolymers characterized using FTIR and XPS. Biomacromolecules. 2007, 6, 2533-2541. [CrossRef]
- Upadhyay, P.; Mishra, S. K.; Purohit, S.; Dubey, G. P.; Singh Chauhan, B.; Srikrishna, S. Antioxidant, antimicrobial and cytotoxic potential of silver nanoparticles synthesized using flavonoid rich alcoholic leaves extract of Reinwardtia indica. Drug Chem. Toxicol. 2018, 42, 1-11. [CrossRef]
- Saha, J.; Podder, J. Crystallization Of Zinc Sulphate Single Crystals And Its Structural, Thermal And Optical Characterization. J. Bangladesh Acad. Sci.. 2012, 35, 203-210. [CrossRef]
- Straccia, M.C.; d'Ayala, G.G.; Romano, I.; Laurienzo, P.; Novel zinc alginate hydrogels prepared by internal setting method with intrinsic antibacterial activity. Carbohydr. Polym. 2015, 125, 103-112. [CrossRef]
- Agulhon, P.,; Markova, V.; Robitzer, M.; Quignard, F.; Mineva, T. Structure of Alginate Gels: Interaction of Diuronate Units with Divalent Cations from Density Functional Calculations. Biomacromolecules, 2012, 13, 1899-1907. [CrossRef]
- Taha, O. M.; Nasser, W.; Ardakani, A; Alkhatib, H. S. Sodium lauryl sulfate impedes drug release from zinc-crosslinked alginate beads: Switching from enteric coating release into biphasic profiles. Int. J. Pharm. 2008, 350, 291-300. [CrossRef]
- Campañone, L.; Bruno, E.; Martino, M. Effect of microwave treatment on metal-alginate beads. J. Food Eng. 2014, 135, 26-30. [CrossRef]
- Gan, Y.; Bai, S.; Hu, S.; Zhao, X.; Li, Y. Reaction mechanism of thermally-induced electric conduction of poly(vinyl alcohol)–silver nitrate hybrid films. RSC Adv. 2016, 6, 56728-56737. [CrossRef]
- Lin, S.; Huang, R; Cheng, Y; Liu, J; Lau, B.L.; Wiesner, M.R. Silver nanoparticle-alginate composite beads for point-of-use drinking water disinfection. Water Res. 2013, 47, 3959-396. [CrossRef]
- Y. Zhang, Y.; Yang, Y.; Zhao, X.; Gao, J. Investigation on ionic crosslinking of alginate by monovalent cations to fabricate alginate gel for biomedical application. React. Funct. Polym. 2023, 183, 105484. [CrossRef]
- Li, L.H.; Deng, J.C.; Deng, H.R.; Liu, Z.L.; Xin, L. Synthesis and characterization of chitosan/ZnO nanoparticles composite membranes. Carbohydr. Res. 2010, 345, 994-998. [CrossRef]
- Anandhavelu, S.; Thambidurai, S. Preparation of chitosan–zinc oxide complex during chitin deacetylation. Carbohydr. Polym. 2011, 83, 1565-1569. [CrossRef]
- Trzaskowski, B.; Adamowicz, L.; Deymier, P.A. A theoretical study of zinc(II) interactions with amino acid models and peptide fragments. JBIC J. Biolog. Inorg. Chem., 2007, 13, 133-137. [CrossRef]
- AbdElhady, M.M. Preparation and Characterization of Chitosan/Zinc Oxide Nanoparticles for Imparting Antimicrobial and UV Protection to Cotton Fabric. Int. J. Carbohydr. Chem. 2012, 2912, ID 840591. [CrossRef]
- Wei. D.; Sun, W.; Qian, W.; Ye, Y.; Ma, X. The synthesis of chitosan-based silver nanoparticles and their antibacterial activity. Carbohydr Res. 2009, 34, 2375-82. [CrossRef]
- Blandino, A.; Macías, M.; Cantero, D. Formation of calcium alginate gel capsules: influence of sodium alginate and CaCl2 concentration on gelation kinetics. J Biosci. Bioeng. 1999, 88, 686-689. [CrossRef]
- Jurić, S.; Šegota, S.; Vinceković, M. Influence of surface morphology and structure of alginate microparticles on the bioactive agents release behavior. Carbohydr. Polym, 2019, 218, 234-242. [CrossRef]
- Klein, J.; Stock, J.; Vorlop, K.D. Pore size and properties of spherical Ca-alginate biocatalysts. European J. Appl. Microbiol. Biotechnol. 1983, 18, 86-91. [CrossRef]
- Simpliciano, C.; Clark, L.; Asi, B.; Chu, N.; Mercado, M.; Diaz, S.; Goedert, M.; Mobed-Miremadi, M. Cross-Linked Alginate Film Pore Size Determination Using Atomic Force Microscopy and Validation Using Diffusivity Determinations. J. Surf. Eng. Mater. Adv.Technol. 2013, 3, 1-12. [CrossRef]
- Siepmann, J.; Siepmann, F. Modeling of diffusion controlled drug delivery. J. Control Release. 2012; 161, 351-62. [CrossRef]
- Roger, S.; Talbot, D.; Bee, A. Preparation and effect of Ca2+ on water solubility, particle release and swelling properties of magnetic alginate films. J. . Magn. Magn. Mater. 2006, 305, 221-227. [CrossRef]
- Silva, R.M.; Silva, G.A.; Coutinho, O.P.; Mano, J.F.; Reis, J.L. Preparation and characterisation in simulated body conditions of glutaraldehyde crosslinked chitosan membranes. J. Mater. Sci. Mater. Med. 2004, 15, 1105-1112. [CrossRef]
- Bhattarai, N.; Gunn, J.; Zhang. M. Chitosan-based hydrogels for controlled, localized drug delivery. Adv. Drug Deliv. Rev. 2010, 31, 83-99. [CrossRef]
- Korsmeyer, R. W.; Gurny, R.; Doelker, E.; Buri, P.; Peppas, N .A. Mechanisms of solute release from porous hydrophilic polymers. Int. J. Pharm. 1983, 15, 25–35. [CrossRef]
- Guibal, E. Interactions of metal ions with chitosan-based sorbents: a review. Sep. Purif. Technol. 2004; 38, 43-74. [CrossRef]
- Yan, A.; Chen, Z. Impacts of Silver Nanoparticles on Plants: A Focus on the Phytotoxicity and Underlying Mechanism. Int. J. Mol. Sci. 2019, 20, 1003. [CrossRef]
- Sharma, N.; Sharma, S. Control of foliar diseases of mustard by Bacillus from reclaimed soil. Microbiol Res. 2008, 163, 408-413. [CrossRef]
- Yen, T.B.; Chang, H.T.; Hsieh, C.C.; Chang, S.T. Antifungal properties of ethanolic extract and its active compounds from Calocedrus macrolepis var. formosana (Florin) heartwood. Bioresour Technol. 2008, 99, 4871-4877. [CrossRef]
- He, L.; Liu, Y.; Mustapha, A.; Lin, M. Antifungal activity of zinc oxide nanoparticles against Botrytis cinerea and Penicillium expansum. Microbiol. Res. 2011, 166, 207-215. [CrossRef]
- Sawai, J.; Yoshikawa, T. Quantitative evaluation of antifungal activity of metallic oxide powders (MgO, CaO and ZnO) by an indirect conductimetric assay. J. Appl. Microbiol. 2004, 96, 803-809. [CrossRef]
- Brayner, R.; Ferrari-Iliou, R.; Brivois, N.; Djediat, S.; Benedetti, M.F.; Fiévet, F. Toxicological impact studies based on Escherichia coli bacteria in ultrafine ZnO nanoparticles colloidal medium. Nano Lett. 2006, 6, 866-870. [CrossRef]
- Amro, N.A.; Kotra, L.P.; Wadu-Mesthrige, K.; Bulychev, A.; Mobashery, S.; Liu, G. High-resolution atomic force microscopy studies of the Escherichia coli outer membrane: structural basis for permeability. Langmuir. 2000, 16, 2789-2796. [CrossRef]
- Alvarez-Peral, F.J.; Zaragoza, O.; Pedreno, Y.; Arguelles, J.C. Protective role of trehalose during severe oxidative stress caused by hydrogen peroxide and the adaptive oxidative stress response in Candida albicans. Microbiology. 2002, 148, 2599-2606. [CrossRef]
- Kim, K.J; Sung, W.S.; Moon, S.K; Choi, J.S.; Kim, J.G.; Lee, D.G. Antifungal effect of silver nanoparticles on dermatophytes. J. Microbiol. Biotechnol. 2008, 18, 1482-1484. PMID: 18756112.
- Kim, K.J.; Sung, W.S:, Suh, B,K.; Moon, S.K.; Choi J.S.; Kim, J.G.; Lee, D.G. Antifungal activity and mode of action of silver nano-particles on Candida albicans. Biometals. 2009, 22, 235-242. [CrossRef]
- Liu, Y.; He, L.; Mustapha, A.; Li, H.; Hu, Z.Q.; Lin, M. Antibacterial activities of zinc oxide nanoparticles against Escherichia coli O157:H7. J Appl Microbiol. 2009, 104, 1193-201. [CrossRef]
- Jo, Y.K.; Kim, B.H.; Jung, G. Antifungal Activity of Silver Ions and Nanoparticles on Phytopathogenic Fungi. Plant Dis. 2009, 93, 1037-1043. [CrossRef]
- Malandraki,s A.A.; Kavroulakis, N.; Chrysikopoulos. C.V. Zinc nanoparticles: Mode of action and efficacy against boscalid-resistant Alternaria alternata isolates. Sci. Total Environ. 2022, 829, 154638. [CrossRef]
- Bartnicki-Garcia, S. Cell wall chemistry, morphogenesis, and taxonomy of fungi. Annu. Rev. Microbiol. 1968, 22, 87-108. [CrossRef]
- Pal, S.; Tak, Y.K.; Song, J.M. Does the antibacterial activity of silver nanoparticles depend on the shape of the nanoparticle? A study of the Gram-negative bacterium Escherichia coli. Appl. Environ. Microbiol. 2007, 73, 1712-1720. [CrossRef]
- Yamanaka, M.; Hara, K.; Kudo, J. Bactericidal actions of a silver ion solution on Escherichia coli, studied by energy-filtering transmission electron microscopy and proteomic analysis. Appl. Environ. Microbiol. 2005, 71, 7589-7593. [CrossRef]
- Galeano, B.; Korff, E.; Nicholson, W.L. Inactivation of vegetative cells, but not spores, of Bacillus anthracis, B. cereus, and B. subtilis on stainless steel surfaces coated with an antimicrobial silver- and zinc-containing zeolite formulation. Appl. Environ. Microbiol. 2003, 69, 4329-4331. [CrossRef]
- Aguilar-Méndez, M..A.; San Martín-Martínez, E.; Ortega-Arroyo, L.;, Cobian-Portillo, G.; Sanchez-Espindola, E. Synthesis and characterization of silver nanoparticles: Effect on phytopathogen Colletotrichum gloesporioides. J. Nanoparticle Res. 2011, 13, 2525-2532. [CrossRef]
- Hwang, E.T.; Lee, J.H.; Chae, Y.J.; Kim, Y.S.; Kim, B.C.; Sang, B.I.; Gu, M.B. Analysis of the toxic mode of action of silver nanoparticles using stress-specific bioluminescent bacteria. Small. 2008, 4, 746-750. [CrossRef]
- Sahar, M. O. Antifungal Activity of Silver and Copper Nanoparticles on Two Plant Pathogens, Alternaria alternata and Botrytis cinerea. Res. J. Microbiol. 2014, 9, 34-42. [CrossRef]

| MICROPARTICLES | dwet | ddry |
| ALG/Zn | 681.06±92.52c | 381.54±41.27c |
| CS/(ALG/Zn) | 852.17±47.35b | 515.50±1.93b |
| ALG/(Zn+Ag) | 915.46±23.88b | 598.24±6.85a |
| CS/(ALG/(Zn+Ag)) | 1112.48±33.81a | 557.52±2.03ab |
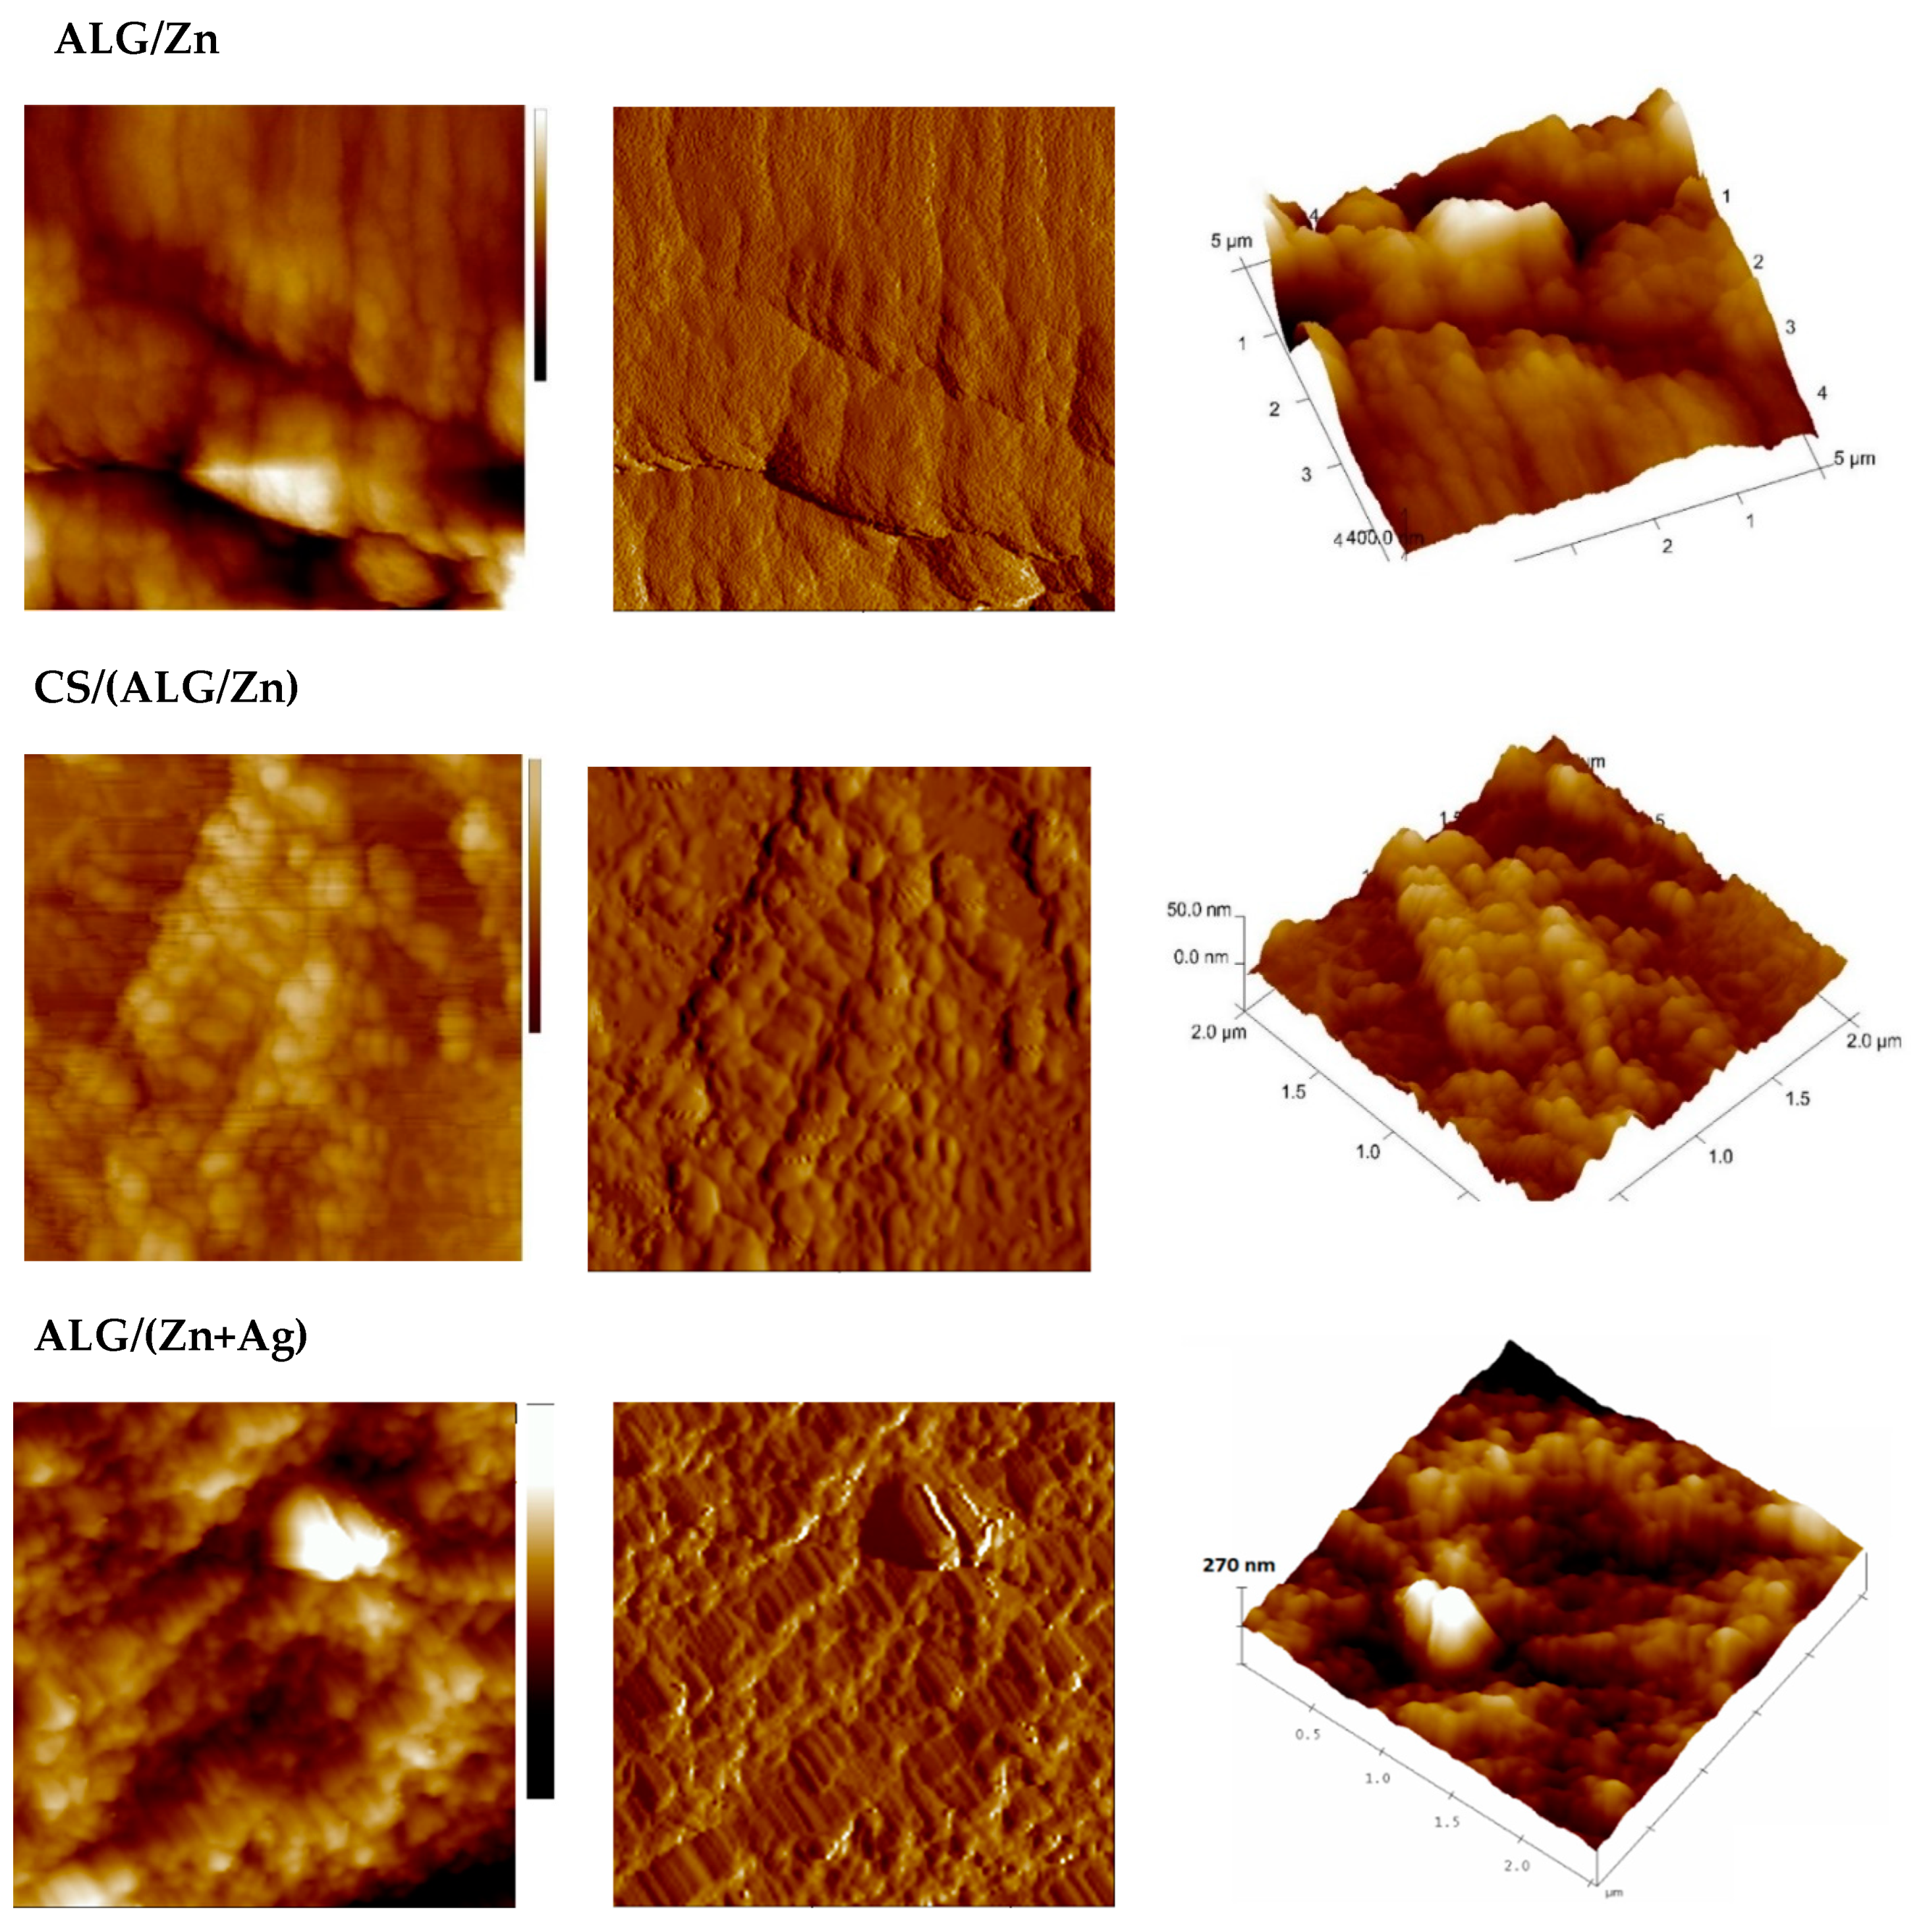
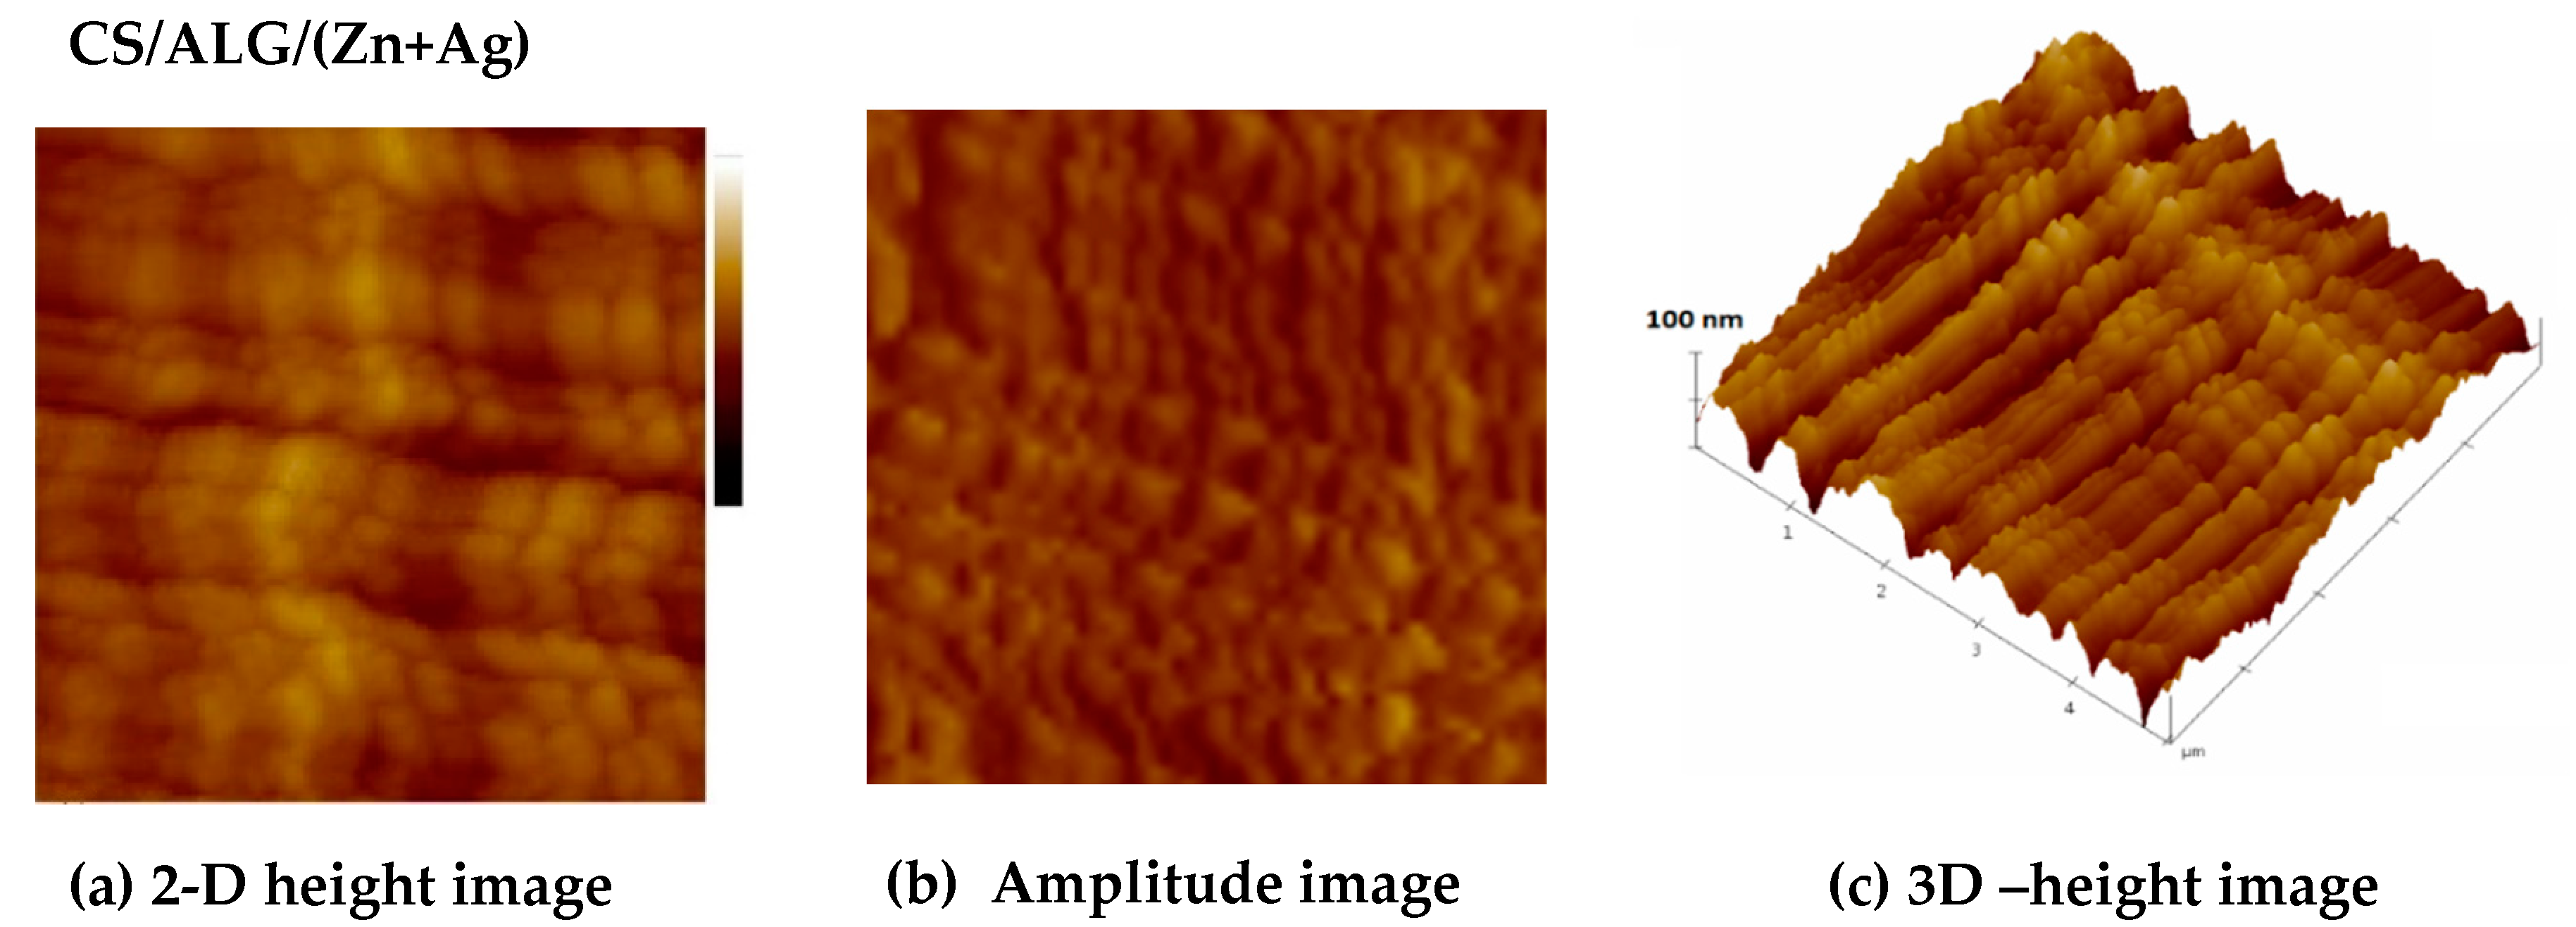
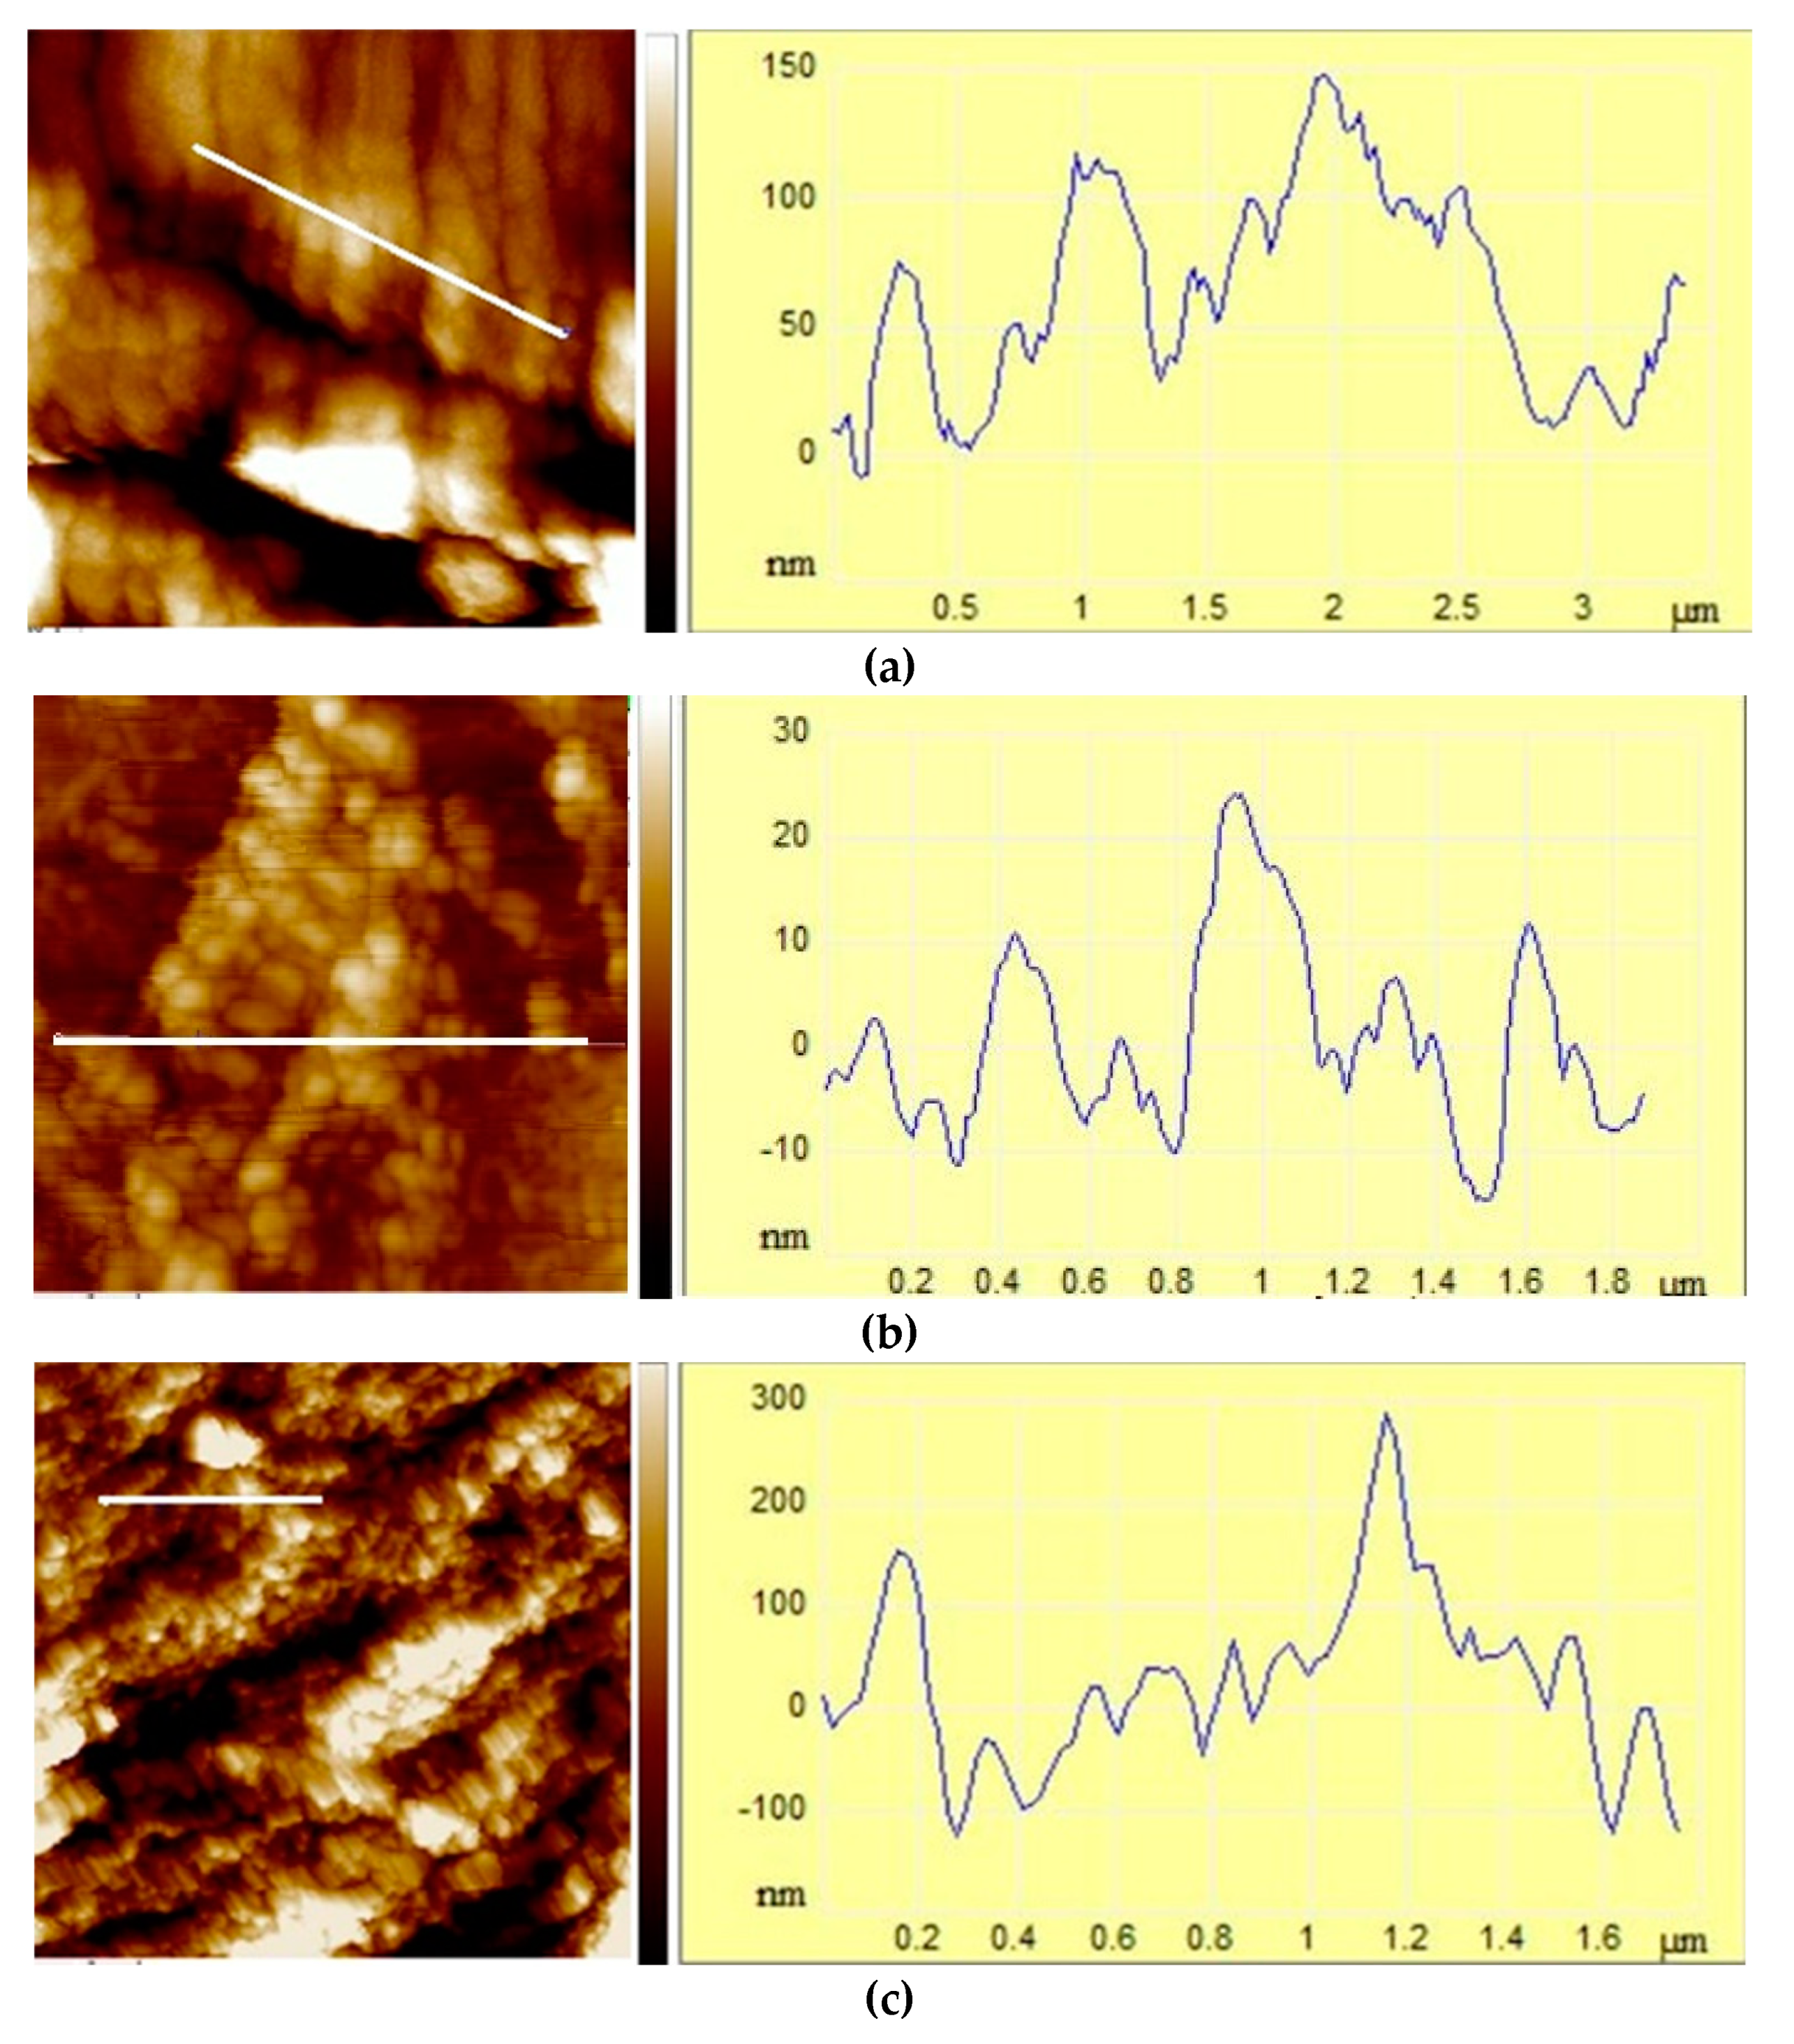
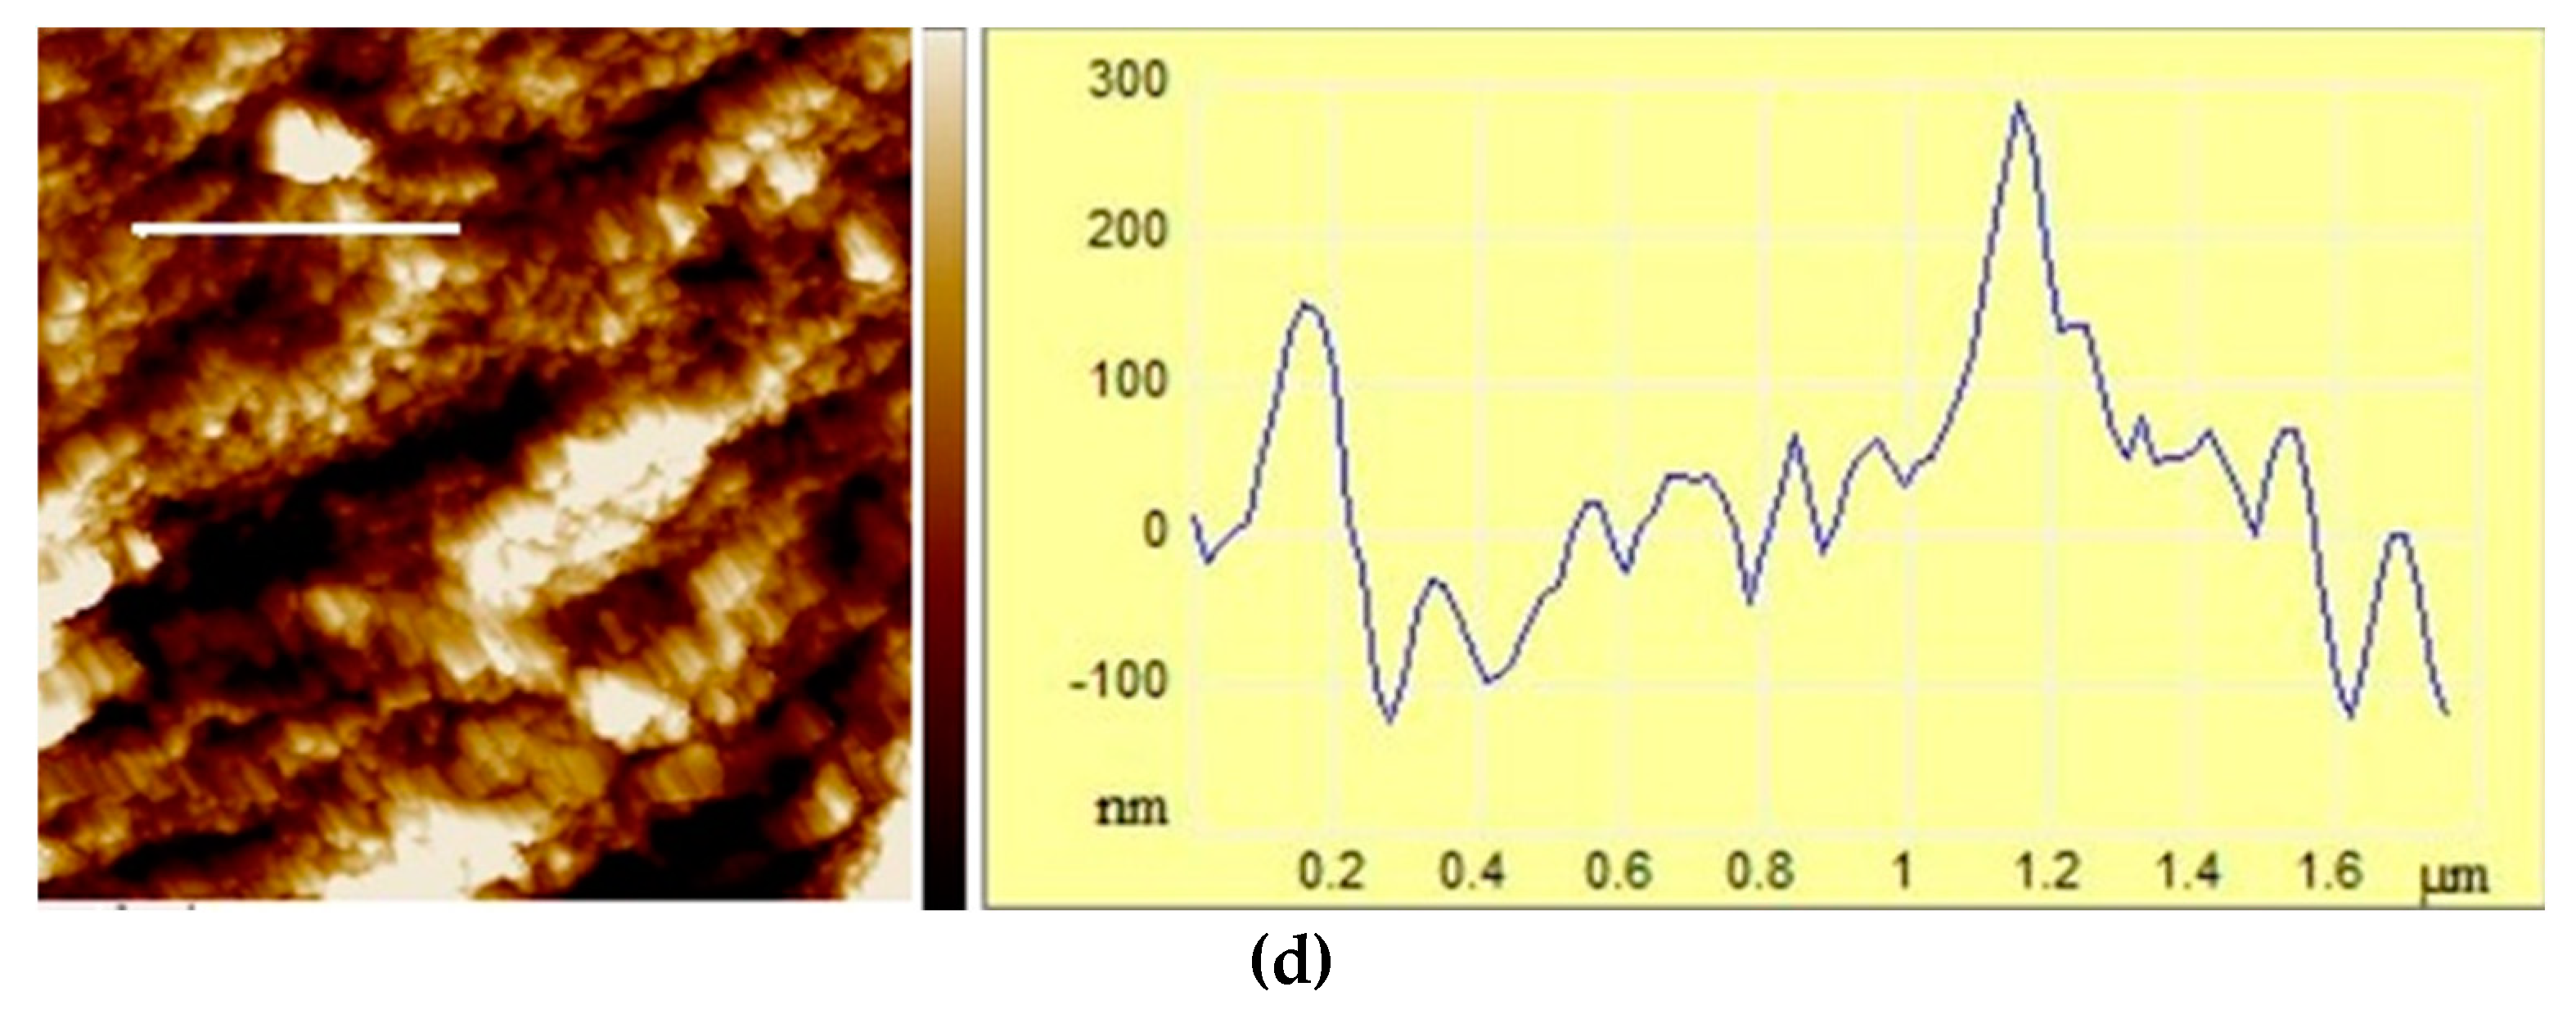
| Microparticles | Ra /nm | Rq/nm | Z range/nm |
| ALG/Zn | 76±1a | 106±2a | 1127±21a |
| CS/(ALG/Zn) | 7.47±0.02d | 9.20±0.08d | 53.09±0.67d |
| ALG/(Zn+Ag) | 21.97±0.52b | 28.88±0.74b | 248.33±0.96b |
| CS/(ALG/(Zn+Ag) | 18.62±0.45c | 23.19±0.68c | 181±2c |
| MICROPARTICLES | EEZn | EEAg | LCZn | LCAg | Sw |
| ALG/Zn | 87.21±0.49a | - | 14.19±0.83a | - | 15.43±3.82d |
| CS/(ALG/Zn) | 87.21±0.49a | - | 8.91±0.11b | - | 43.8±1.65b |
| ALG/(Zn+Ag) | 87.32±0.40a | 99.99±0.001a | 15.27±0.83a | 19.48±0.50a | 25.12±0.11c |
| CS/(ALG/(Zn+Ag)) | 87.32±0.40a | 99.99±0.001a | 7.71±0.52b | 4.22±0.47b | 66.33±0.45a |
| Microparticles | kZn | nZn | kAg | nAg |
| ALG/Zn | 0.51 | 0.02 | - | - |
| CS/(ALG/Zn) | 0.26 | 0.03 | - | - |
| ALG/(Zn+Ag) | 0.50 | 0.07 | 0.07 | 0.06 |
| CS/(ALG/(Zn+Ag)) | 0.31 | 0.06 | 0.02 | 0.07 |
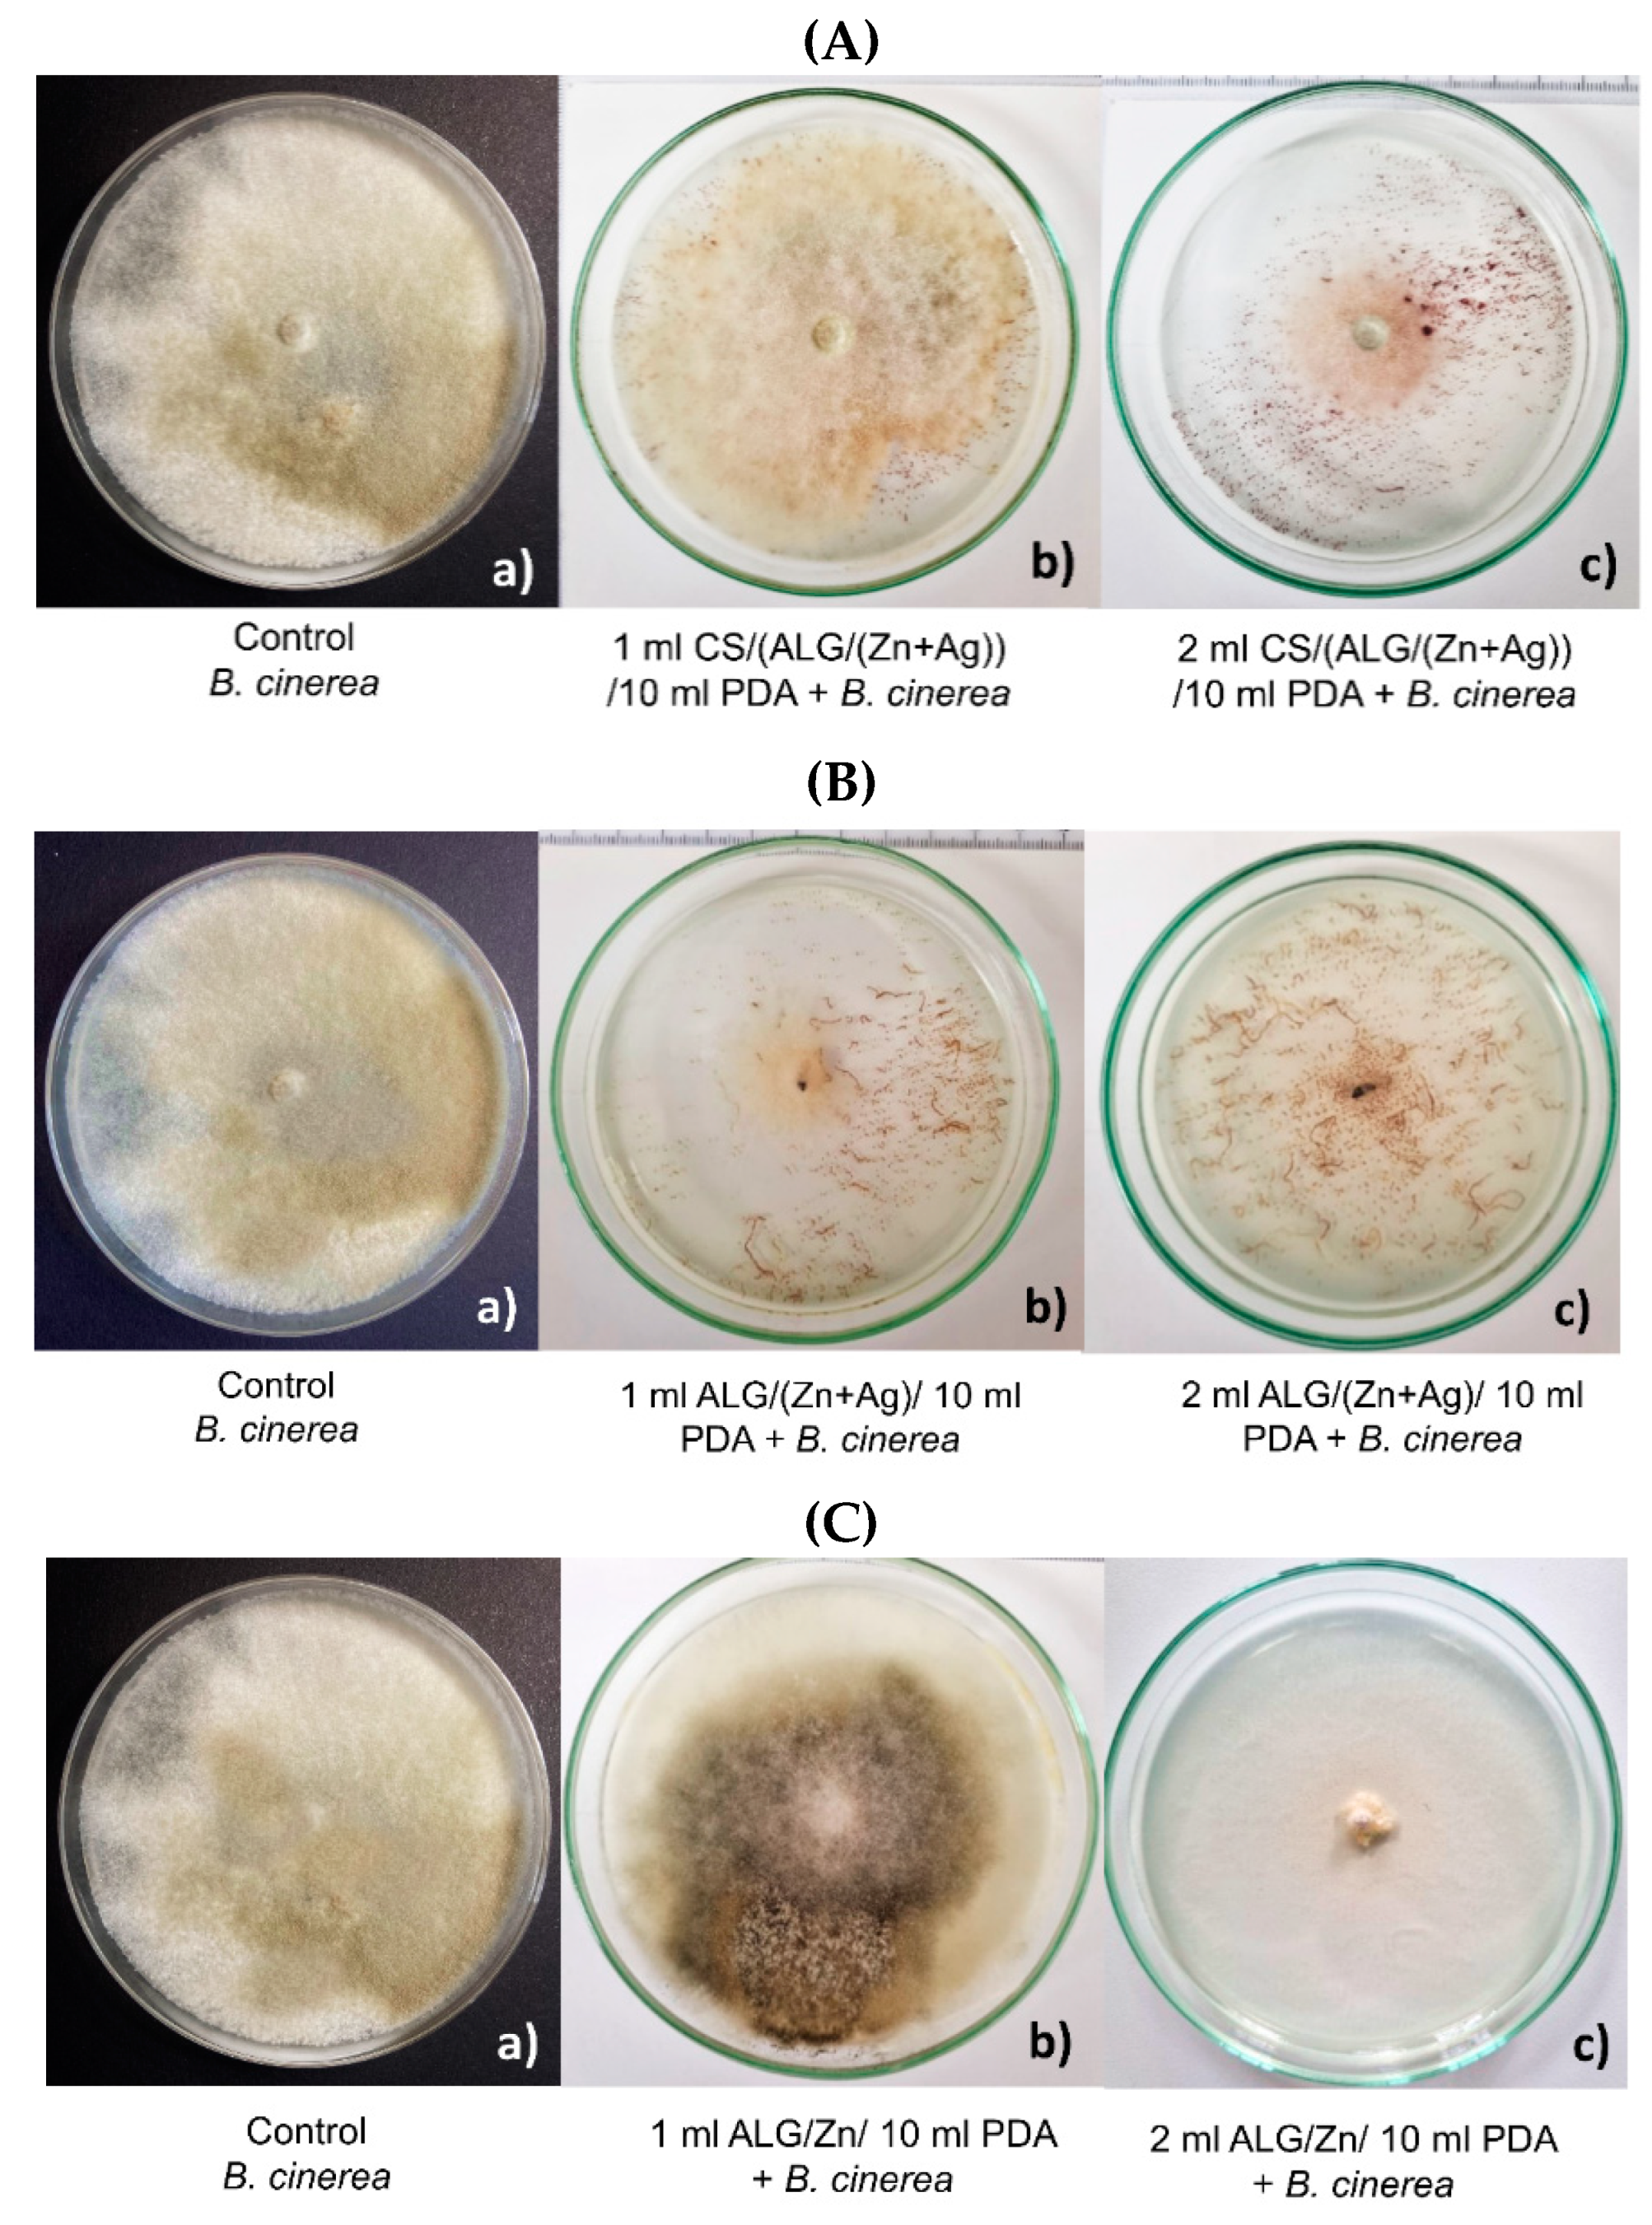
| Control | Antifungal test | |||
| 1 mL dH2O/10 mL PDA + B. cinerea | 1 mL CS/(ALG/(Zn+Ag)) /10 mL PDA + B. cinerea |
1 mL ALG/(Zn+Ag) /10 mL PDA + B. cinerea |
1 mL ALG/Zn /10 mL PDA + B. cinerea |
|
| x̄ (cm2) ± SD | 57.5±0.2a | 41.7±1.9b | 10.1±1.3c | 37.2±2.0d |
| I (%) | 0 % | 27.5 % | 82.5 % | 35.4 % |
| Control | Antifungal test | |||
| 2 mL dH2O/10 mL PDA B. cinerea |
2 mL CS/(ALG/(Zn+Ag)) /10 mL PDA + B. cinerea |
2 mL ALG/(Zn+Ag) /10 mL PDA + B. cinerea |
2 mL ALG/Zn /10 mL PDA + B. cinerea |
|
| x̄ (cm2) ± SD | 56.2±0.4a | 13.6±0.8b | 0.6±1.3c | 4.3±1.9c |
| I (%) | 0 % | 75.8 % | 98.9 % | 92.3 % |
Disclaimer/Publisher’s Note: The statements, opinions and data contained in all publications are solely those of the individual author(s) and contributor(s) and not of MDPI and/or the editor(s). MDPI and/or the editor(s) disclaim responsibility for any injury to people or property resulting from any ideas, methods, instructions or products referred to in the content. |
© 2023 by the authors. Licensee MDPI, Basel, Switzerland. This article is an open access article distributed under the terms and conditions of the Creative Commons Attribution (CC BY) license (http://creativecommons.org/licenses/by/4.0/).


