
Submitted:
11 October 2023
Posted:
13 October 2023
You are already at the latest version
Abstract
Zambia recently experienced extended hours of load shedding due to reduced hydroelectricity generation attributed to poor rainfall patterns. The inability to meet energy demand has influenced the government to consider alternative energy sources. This study aims to assess the economic feasibility of the eight sites using a 25-turbine layout for a 4 MW generic wind turbine at 130m hub height. An economic evaluation mathematical model was developed to analyze the economic feasibility using net present value, simple payback period, internal rate of return, and levelized cost of electricity (LCOE). The study shows that the Lusaka wind farm was the most economical with 386 GWh energy yield analysis (EYA), wind speed of 8 m/s, NPV of 316 million dollars, SPP of 2.9 years, IRR of 82%, and LCOE of $0.182/ kWh. The results also show that the other seven sites are economically feasible, with Petauke being the lowest. The study's economic sensitivity analysis conducted by varying the average electricity tariff shows that Lusaka was the most financially viable site. Therefore, policymakers should develop cost-reflective feed-in tariff (FiT) schemes and power purchase agreements for the country to have cost-reflective electricity tariffs that will motivate independent power producers to invest in Zambia.
Keywords:
economic feasibility
; load shedding
; electricity generation
; energy demand
; wind regime
; sensitivity analysis
1. Introduction
Wind energy has become very popular in the last few years due to environmental concerns associated with the use of fossil fuels, the increase in the price of fossil fuels, and the desire of developed and developing countries to decrease their dependence on foreign fossil fuels. [1]. Renewable energies are gaining more attraction in the global energy market and society [2]. The U.S. government has invested $3 billion in wind research since 1976. The findings of this research demonstrate sizable and positive returns associated with wind power development [3]. Deploying turbines will achieve technical feasibility, high economic competitiveness, and high emission reduction. Therefore, clarity on suitable sites and investment costs is required. [4]. Tremendous greenhouse gas (GHG) emissions from the combustion of fossil fuels and unsatisfied energy requirements have forced the country to seek and adapt to environmentally friendly and renewable alternatives for sustaining an increasing energy demand. To this end, the government must emphasize renewable energy in future energy structures [5]. African countries, including Zambia, should take a leaf from such initiatives and fund wind research by empowering research and development(R&D) institutions to advance the wind energy sector.
Energy is one of the most critical factors for the socioeconomic development of any nation. It is undeniable that having access to power enhances productivity and creates opportunities for economic growth. Expanding alternate energy sources, such as solar and wind power, is a potential remedy for the problem posed by non-renewable resources [6]. Deploying onshore wind power is essential to mitigate climate change, despite producing disamenities for nearby residents, mainly due to noise pollution and visual effects [7].
Operators see the potential to increase investment returns in existing wind parks [8]. There are notable economic benefits of wind energy to communities, notably increased gross domestic product and local incomes [9]. Developing a renewable energy project such as wind and photovoltaic (PV) power plants requires a deep understanding of primary energy resources such as wind speed and solar irradiation [10]. Renewable energy projects help mitigate the release of GHG in the atmosphere. Global investments in offshore wind energy are expected to escalate over the coming decades, fueled by technological improvements, declining costs, and increasing political support. These developments’ complexity, scale, and location make international ownership and export of electricity more feasible [11].
Achieving environmental decarbonization policies (low-carbon and net-zero carbon emissions) requires a reasonable offer from governmental officials [12]. The wind is an environmentally friendly energy source that can be harnessed as an onshore and offshore resource. In a hybrid of renewable energy systems, wind energy has resulted in a more reliable, feasible, and efficient stand-alone system [13,14]. Zambia aspires to be a prosperous middle-income country by 2030, and this will require an adequate supply of energy services to Zambians as an input to their productive activities. A market for renewable energy is gradually emerging, but many challenges limit growth. The government knows these market challenges and has worked closely with stakeholders to create a conducive market environment [15]. With this background, Zambia needs to conduct economic feasibility studies of renewable energy sources to provide the sector with information that policymakers and independent power producers can use. Among other potential energy sources, this study considers wind energy as that energy source [16]. Having the capability to plan more strategically will ultimately lower the LCOE of projects, enhance the certainty around long-term target-setting, and accelerate the deployment [17]. Many scholars have adopted scientific and advanced intelligent algorithms from the relevant research literature at home and abroad based on cost prediction of power engineering projects [18].
Access to modern energy in the rural areas of Zambia needs to be improved [19]. Wind energy currently does not contribute to the installed generation capacity in Zambia, while solar PV contributes about 3% [20]. The adoption rates of modern bioenergy systems in the rural areas of Zambia are low, indicating shortcomings within the existing institutional arrangements for a conducive enabling environment for their deployment [21]. This status quo of access to modern energy in these areas shows the unlikelihood of attaining the 2030 rural electrification target of 51% [22]. Comprehensive studies of onshore wind technical and economic potential should be a priority by the country for energy transition strategies.
2. Economic feasibility of wind energy
This literature review focuses on various methods used to analyze the economic feasibility of wind energy. Several authors have applied net present value (NPV), simple payback period (SPP), annual life cycle saving, internal rate of return, benefit-cost ratio, year-to-positive cash flow, and cost of electricity production (COE). Mohammadi et al. [23] applied present value cost (PVC) and unit cost of electricity (UCE) to conduct an economic analysis of wind farms. The study results showed that investment in wind farms in eastern Iran could be associated with high profitability. The same methods were applied by Alham et al. [24], Mostafaeipou et al. [25], and Feng et al. [17]. The studies show that the PVC and UCE will differ for each site or wind farm. Abdelhady et al. [26] only applied NPV; the results of the annual electricity generation from selected wind turbines at the chosen sites were used to investigate the feed-in tariffs (FiT) rates. The FiT must consider the contract’s length, interest rate, and number of operation hours at the rated capacity of the wind turbine. Ohunakin et al. [27] used a similar method, and results show that the unit energy cost of about $0.30/kWh was more profitable for non-connected electrical and mechanical applications (water pumping, battery charging) than a diesel generator. With the NPV method, an annual income or expense that will occur for a specific number of years is given a value at a particular time, usually the day when the turbine starts to operate [28].
According to Satymov et al. [29], the results of this study show that there exists a certain hub height that enables wind turbines to deliver the lowest cost of electricity generated, and exceeding that height does not pay off the rise in capital expenditures needed for stronger foundations and taller and sturdier towers. This is reaffirmed by Ohunakin et al. [30], Barter et al. [31], Mardones [32], Quinn et al. [33], and Langer et al. [34]. SPP method is used to evaluate the economic preconditions for an investment in a wind power project. It calculates the time it will take to recover the invested money [27]. Zoładek et al. [35] defined a simple payback period as a period when the value of the energy produced by the system exceeds the initial costs of the system. The achieved results allow one to evaluate the feasibility of the proposed system from both an energy and economic point of view. The proposed system achieves a simple payback period of 13.3 years, which puts it on the verge of profitability.
A project is financially feasible if the IRR exceeds the financial discount rate. Also, the IRR is the maximum discount rate up to which the project can be economically viable. The levelized cost of electricity (LCOE, €/kWh) is the present value of the cost to produce one unit of electrical energy, considering the project’s lifetime [36]. Just like Ali et al. [35], Himri et al. [37] applied RETScreen software to estimate the energy output and to conduct the economic feasibility of a wind farm in terms of Simple Payback Period (SPP), Internal Rate of Return, Annual Life Cycle Saving, Net Present Value, Year to Positive Cash Flow, Benefit-Cost ratio and cost of electricity production (COE). Odoi-Yorke et al. [38] applied the same method; findings reveal that a feed-in tariff (FiT) lower than US$0.15/kWh is not lucrative for wind power development in Adafoah. Furthermore, without financial incentives, the levelized cost of energy (LCOE) from the wind power plant is about US$0.143/kWh.
Sensitivity analysis is applied to a realistic scenario for the worst things; this could be that the total power price will drop by 15 percent, and the power production will be 10 percent less than calculated due to errors in calculations, climate change, grid failure, and different hub heights. Ali et al. [35] explain that wind turbine hub height affects the economics of the wind turbine, so the optimal hub height was estimated for each wind turbine model; this is also reaffirmed by Zhang et al. [39] and Satymov et al. [28] in the sensitivity analysis conducted.
This study analyses the economic feasibility of eight sites in Zambia to understand the cost structure of setting up wind power plants. The eight sites are located in the country’s provincial headquarters; therefore, connecting the power plant to the grid is easier. The model created in this study identified equipment transportation to these sites as a differentiating factor in terms of cost structure due to differences in distance. This study was motivated by the need for more comprehensive research on the economic analysis of wind energy specific to Zambia. This work is the first economic feasibility study in the Zambian context. It seeks to identify the optimal cost structures for installing wind turbines in the selected eight sites shown in Table 1. The eight sites presented in this paper have good wind potential for electricity generation. Based on two years of data collection, DNV GL has evaluated the wind resource at each location, the long-term wind regime, and the estimated energy production based on a generic 4 MW wind turbine with a rotor of 140 m and a hub height of 130 m [40]. This paper shows a comparative study of economic feasibility using net present value (NPV), simple payback period (SPP), internal rate of return (IRR), and levelized cost of electricity (COE). The results will also enhance the knowledge of wind power in Zambia, promoting the country’s transition towards clean and sustainable energy. Further, the findings will guide the development of wind power projects in Zambia and other places where the wind speed is low to moderate for the particular wind turbine [15].
3. Materials and methods
3.1. Site description and energy data
The masts that form part of the ESMAP program are located across Zambia to inform the wind mapping studies. Measurements of the wind regime have been made at eight meteorological (met) masts locations across Zambia, as shown in Figure 1. DNV GL has analyzed a preliminary 25-turbine layout for a generic 4 MW wind turbine at a hub height of 130m close to each mast location to assess the potential energy production at each location [40].
Table 1 below summarizes each site’s terrain and ground cover and the range of turbine base elevations.
Table 2 shows the turbine model considered for this economic feasibility study.
Turbine manufacturers should be approached early to gain acceptance of proposed turbine layouts and turbine suitability for each site and evaluate the need to mitigate fatigue loads through wind sector management. Some turbine models may provide better energy capture and improve the overall performance at the sites. Table 3 summarizes eight sites’ average turbine wind speed at 130m [40].
The projected net energy production of each wind farm is shown in Table 4 [40] . Energy production is essential for economic feasibility calculations as it helps to analyze the project’s viability. Lusaka, which had the highest wind speed, has the highest energy output of 386 GWh/annum with a capacity factor of 44%, with Petauke having the lowest at 291.5 GWh/annum and a capacity factor of 33.2%.To be able to make an informed decision about a wind power project, a thorough economic analysis is necessary. The wind turbines must generate income to guarantee that the investors, or the banks that give loans, will get their money back and a decent return on their investment. Therefore, economic analysis should be followed up with a sensitivity analysis that will show the risks and opportunities of the investment [41].
3.2. Methodological approach
An economic evaluation mathematical model was developed to conduct the economic feasibility using net present value (NPV), simple payback period (SPP), internal rate of return (IRR), and levelized cost of electricity production (LCOE). Figure 2 presents the methodological flow chart used in this study.
3.3. Economic Feasibility Analysis
Several methods have been applied to conduct the economic feasibility of wind energy potential for electricity generation. In this study, the following methods have been employed for computations.
3.3.1. The cost of the wind turbine
The cost of the wind turbine; can be estimated using Equation [35]:
Where; is the rated power of the wind machine in MW.
3.3.2. The present value of costs (PVC)
The PVC method is adopted in this work because (i) it considers the dynamic development of the relevant economic factors and (ii) different occurrences of costs and income are taken into account regardless of whether the money has been or will be paid or received in the past or the future through deduction of accrued interest (discounting) of all payment flows to a standard reference time [42], this is calculated using the equation below is given [22,23,24,25,26,35,42]:
The other important factors taken into consideration when PVC is used to evaluate the costs of energy produced by turbines in kWh at the eight sites include:
- US dollar($) was used for calculations due to the Zambian Kwacha(ZMW) fluctuations.
- The study used the values of inflation rates for Zambia from May 2022 to June 2023. The inflation rate (i) value is 9.9 [43]. Zambia banks charge interest rates (r) of 20 to 30%, which makes it difficult for developers to achieve a good return on investment [44]. A minimum of 20% has been used in this study.
- Machine life (n) for turbines is 20 years.
- Operation and maintenance (O&M) costs constitute a sizeable share of the total annual costs of a wind turbine. Operational costs are annually recurring and involved in the routine operation of wind farms; these costs are fixed and can be estimated in a straightforward deterministic manner [22,23,24,25,26]. However, maintenance cost is not fixed, cannot be calculated straightforwardly, and is only activated by stochastic variables as it does not have a specific value but is often obtained from a range of values. It was also reported that operation and maintenance cost (Com) varies from 15 to 30% of the total initial cost (annual wind turbine cost + other initial costs) [35]. Zambia is a new market for wind power technology, and operation and maintenance cost (Com) is assumed to be 15% of the initial capital cost of the wind turbine installation system (system price/lifetime).
- Most of the selected sites are in rural areas. There is a challenge in terms of transportation. Therefore, the costs will mainly be incurred on the transportation of turbines, civil work, and road construction to the site. This cost may be higher than anticipated compared to sites in cities such as Lusaka, the capital city. These were considered 10% of the turbine price and civil works; therefore, for remote places, they will vary based on distance.
- Bt is all the benefits during a particular year, such as income from selling electricity, depreciation, production tax credits (PTC), and investment tax credits (ITC) [35].
- Ct is the summation of turbine price and other initial costs, including provisions for civil work, land, infrastructure, installation, and grid integration. Since most of the projects will be executed in the rural area/suburbs of the country, the cost of land is assumed to be provided by the local chiefdom since Zambia has vast land which can be used for wind farms and labor for civil work may be very cheap as local people will provide it with support from government and R&D Institution; hence another initial cost can be taken as 5% of actual turbine price.
3.3.3. Internal rate of return (IRR)
A project is considered financially feasible if the IRR is greater than the financial discount rate and also is the maximum discount rate up to which the project can be economically feasible [35].
3.3.4. Levelized cost of electricity (LCOE)
3.3.5. Simple payback period (SPP)
A simple payback period (SPP) is the time in which the initial cash outflows of an investment are expected to be recovered from the cash inflows in the following years; this is the most straightforward investment appraisal technique and is calculated using the equation below:
4. Results and discussions
4.1. Analysis of Wind Turbines for Choma site
Considering financial and time constraints, it is essential to determine the most suitable locations to enable renewable energy farms to achieve the proposed targets for renewable energy production [45]. The turbine hub height is one of the most critical parameters affecting wind farms’ economics. Along with hub height, other factors which highly affect the economics of wind farms are (but are not limited to) electric tariff ($/KWh), discount rate (%), and corporate tax rate (%). However, accurate prediction of these three parameters is complex [35]. Table 7 shows techno-economic parameters at 130 hub height for the Choma site using Zambia’s average electric tariff of $0.07/ KWh. This section is not mandatory but may be added if there are patents resulting from the work reported in this manuscript.
The results of the model show negative values NPV for the twenty years. Towards the end of the turbine lifetime, the values approach the positive NPV; this can be explained by the negative payback period; this means that it will take more than 20 years for the wind turbine to break even for the Choma site and start making a profit if the electricity tariff is maintained at $0.07/ kWh. The LCOE is at a minimum toward the end of the turbine lifetime. Figure 3 presents the results of NPV and LCOE. According to Ali et al. [35], the optimum hub height is defined as the hub height at which both LCOE is at a minimum, and NPV is at a maximum, or just LCOE is at the minimum.
Figure 4 shows sensitivity analysis results for the Choma plant. The highest value of LCOE is $0.617/ kWh, and the lowest is 0.232 $/kWh. By using LCOE for Lusaka, which is the lowest (0.182 $/kWh) as the average electricity tariff for the country, we have positive values of NPV for the 20 years at 130 m hub height with SPP of 5.1 years. The wind farm at a hub height of 130 m will generate net profits having an NPV of 182 million dollars. The LCOE will be as low as 0.232 $/kWh (the minimum) during the 20 years. Independent power producers in the wind sector can considering investing in Choma if the electricity tariff is between 0.232 $/kWh and $0.617/ kWh. However, other factors may affect the price, such as the company’s preferred profit margin, interest rates, taxes, government subsidies, and social and environmental factors.
4.2. Analysis of Wind Turbines for Mwinilunga site
Table 8 shows techno-economic parameters at 130 hub height for the Mwinilunga site using Zambia’s average electricity tariff of $0.07/ kWh. The results of the model show negative values NPV for the twenty years. Towards the end of the turbine lifetime, the values approach the positive NPV; this can be explained by the negative payback period; this means that it will take more than 20 years for the wind turbines in Mwinilunga to break even and start making a profit if the electricity tariff is maintained at $0.07/ kWh. The LCOE is at a minimum toward the end of the turbine lifetime. Figure 5 presents the results of NPV and LCOE.
Figure 6 shows sensitivity analysis results for the Mwinilunga plant. The highest value of LCOE is $0.624/ kWh and 0.235 $/kWh. By using the electricity tariff of 0.182 $/kWh which is the lowest LCOE for Lusaka, we have positive values of NPV for the 20 years at 130 m hub height; this can be explained by the payback period of 4.6 years. The wind farm, with a hub height of 130 m, will generate net profits having an NPV of 200 million dollars. The LCOE will be as low as 0.235 $/kWh (the minimum) during the 20 years. Independent power producers in the wind sector can consider investing in Mwinilunga if the electricity tariff between is 0.235 $/kWh and $0.624/ kWh. However, other factors may affect the price, such as the company’s preferred profit margin, interest rates, taxes, government subsidies, and social and environmental factors.
4.3. Analysis of Wind Turbines for Lusaka site
Table 9 shows techno-economic parameters at 130 hub height for the Lusaka site using Zambia’s average electric tariff of $0.07/ kWh; the model results show that Lusaka had the lowest negative values NPV for the twenty years. Towards the end of the turbine lifetime, the values approach the positive NPV; this can be explained by the negative payback period; this means that it will take more than 20 years for the wind turbines in Lusaka to break even and start making a profit if the electricity tariff is maintained at $0.07/ kWh. The LCOE is at a minimum toward the end of the turbine lifetime. Figure 7 presents the results of NPV and LCOE.
Figure 8 shows the sensitivity analysis results for the Lusaka plant. The highest value of LCOE of $0.482/ kWh, and $0.182/ kWh is the lowest. Using the average electricity tariff of $0.182/ kWh, we have positive values of NPV for the 20-year at 130 m hub height; this can be explained by the payback period of negative 2.9 years. The wind farm, with a hub height of 130 m, will generate net profits having an NPV of 316 million dollars. The LCOE will be as low as 0.182 $/kWh (the minimum) during the 20 years. Independent power producers in the wind sector can consider investing in Lusaka if the electricity tariff is between $0.182/ kWh and $0.482/ kWh. However, other factors may affect the price, such as the company’s preferred profit margin, interest rates, taxes, government subsidies, and social and environmental factors.
4.4. Analysis of Wind Turbines for Mpika site
Table 10 shows techno-economic parameters at 130 hub height for the Mpika site using Zambia’s average electric tariff of $0.07/ kWh. The model results show negative NPV values for the twenty years. Towards the end of the turbine lifetime, the values approach the positive NPV; this can be explained by the negative payback period; this means it will take more than 20 years for the wind turbines in Mpika to break even and profit if the electricity tariff is maintained at $0.07/ kWh. The LCOE is at a minimum toward the end of the turbine lifetime. Figure 9 presents the results of NPV and LCOE.
Figure 10 shows sensitivity analysis results for the Mpika plant. The highest value of LCOE of $0.487/ kWh, and the lowest is $0.487/ kWh. By using LCOE for Lusaka, which is the lowest at $0.182/ kWh as the average electricity tariff, we have positive values of NPV for the 20-year at 130 m hub height; this can be explained by the payback period of 4.6 years. The wind farm at a hub height of 130 m will generate net profits having an NPV of 201 million dollars. The LCOE will be as low as 0.182 $/kWh (the minimum) during the 20 years. Independent power producers in the wind sector can consider investing in Mpika if the electricity tariff between 0.182 $/kWh and $0.487/ kWh. However, other factors may affect the price, such as the company’s preferred profit margin, interest rates, taxes, government subsidies, and social and environmental factors.
4.5. Analysis of Wind Turbines for Chanka site
Table 11 shows techno-economic parameters at 130 hub height for the Chanka site using Zambia’s average electric tariff of $0.07/ kWh. The results of the model show negative values NPV for the twenty years. Towards the end of the turbine lifetime, the values approach the positive NPV; this can be explained by the negative payback period; this means that it will take more than 20 years for the wind turbines in Chanka to break even and start making a profit if the electricity tariff is maintained at $0.07/ kWh. The LCOE is at a minimum toward the end of the turbine lifetime. Figure 11 presents the results of NPV and LCOE.
Figure 12 shows sensitivity analysis results for the Chanka plant. The highest value of LCOE is $0.547/ kWh, and the lowest is $0.206/ kWh. Using the average electricity tariff of $0.182/ kWh as the average electricity tariff, we have positive values of NPV for the 20-year at 130 m hub height; this can be explained by the payback period of 3.9 years. The wind farm at a hub height of 130 m will generate net profits having an NPV of 235 million dollars. The LCOE will be as low as 0.206 $/kWh (the minimum) during the 20 years. Independent power producers in the wind sector can consider investing in Chanka if the electricity tariff is between $0.206/ kWh and $0.547/ kWh. However, other factors may affect the price, such as the company’s preferred profit margin, interest rates, taxes, government subsidies, and social and environmental factors.
4.6. Analysis of Wind Turbines for Petauke site
Table 12 shows techno-economic parameters at 130 hub height for the Petauke site using Zambia’s average electric tariff of $0.07/ kWh. The results of the model show negative values NPV for the twenty years. Towards the end of the turbine lifetime, the values approach the positive NPV; this can be explained by the negative payback period; this means that it will take more than 20 years for the wind turbines in Petauke to break even and start making a profit if the electricity tariff is maintained at $0.07/ kWh. The LCOE is at a minimum toward the end of the turbine lifetime. Figure 13 presents the results of NPV and LCOE.
Figure 14 shows sensitivity analysis results for the Petauke plant. The highest value of LCOE is $0.542/ kWh and $0.204/ kWh. Using the average electricity tariff, the lowest LCOE of $0.182/ kWh for Lusaka, we have positive values of NPV for the 20 years at 130 m hub height; this can be explained by the payback period of 5.7 years. The wind farm at a hub height of 130 m will generate net profits having an NPV of 163 million dollars. The LCOE will be as low as 0.204 $/kWh (the minimum) during the 20 years. Independent power producers in the wind sector can consider investing in Petauke if electricity tariff is between $0.204 kWh and $0.542/ kWh. However, other factors may affect the price, such as the company’s preferred profit margin, interest rates, taxes, government subsidies, and social and environmental factors.
Figure 14.
4.7. Analysis of Wind Turbines for Mansa site
Table 13 shows techno-economic parameters at 130 hub height for the Mansa site using Zambia’s average electric tariff of $0.07/ kWh. The results of the model show negative values NPV for the twenty years. Towards the end of the turbine lifetime, the values approach the positive NPV; this can be explained by the negative payback period; this means that it will take more than for the wind turbines in Mansa to break even and start making a profit if the electricity tariff is maintained at $0.07/ kWh. The LCOE is at a minimum toward the end of the turbine lifetime. Figure 15 presents the results of NPV and LCOE.
Figure 16 shows sensitivity analysis results for the Mansa plant. The highest value of LCOE is $0.599/ kWh and $0.226/ kWh. Using the average electricity tariff, which is the LCOE of $0.182/ kWh for Lusaka, we have positive values of NPV for the 20-year at 130 m hub height; this can be explained by the payback period of 4.9 years. The wind farm at a hub height of 130 m will generate net profits having an NPV of 191 million dollars. The LCOE will be as low as 0.226 $/kWh (the minimum) during the 20 years. Independent power producers in the wind sector can consider investing in Mansa if electricity tariff is between 0.226 $/kWh and $0.599/ kWh. However, other factors may affect the price, such as the company’s preferred profit margin, interest rates, taxes, government subsidies, and social and environmental factors.
4.8. Analysis of Wind Turbines for Malawi site
Table 14 shows techno-economic parameters at 130 hub height for the Malawi site using Zambia’s average electric tariff of $0.07/ kWh. The results of the model show negative values NPV for the twenty years. Towards the end of the turbine lifetime, the values approach the positive NPV; this can be explained by the negative payback period; this means it will take more than 20 years for the wind turbines in Malawi to break even and profit if the electricity tariff is maintained at $0.07/ kWh. The LCOE is at a minimum toward the end of the turbine lifetime. Figure 16 presents the results of NPV and LCOE.
Figure 17 shows sensitivity analysis results for the Malawi plant. The highest value of LCOE is $0.617/ kWh and $0.617/ kWh. Using the average electricity tariff of $0.182/ kWh, the lowest LCOE for Lusaka, we have positive values of NPV for the 20-year at 130 m hub height; this can be explained by the payback period of 5.1 years. The wind farm, with a hub height of 130 m, will generate net profits having an NPV of 180 million dollars. The LCOE will be as low as 0.233 $/kWh (the minimum) during the 20 years. Independent power producers in the wind sector can consider setting up wind farms near the Malawi site if electricity tariffs is between $0.233/ kWh and $0.617/ kWh. However, other factors may affect the price, such as the company’s preferred profit margin, interest rates, taxes, government subsidies, and social and environmental factors.
Table 15 summarizes results for the economic feasibility of onshore wind energy potential.
Wind energy technologies have seen a rapid decline in costs in the last two decades, but the drivers for these cost reductions are poorly understood [46]. Figure 18 shows Parameter estimations of the sites. The economic assessment is essential while investing considerably in installing utility-scale wind turbines for wind power production. Initially, the first site-specific wind characteristic analysis is carried out. Then the selection of wind turbines is examined while considering the mechanical configuration of the turbine suited to the site [47,48]. In recent years, the utilization of renewable energy resources using WECSs for electricity generation has become more prevalent around the globe. However, in the literature, very few studies have concentrated on these systems’ economic and energetic investigation [49]. Economic evaluation is based on various assumptions, such as EYA and total power price. Scenarios of the worst case are considered, such as the power will sink or EYA will drop, resulting in a loss for the company. A risk assessment through a sensitivity analysis will give a clear position. The cash flow analysis calculates annual cash flow, annual revenues, maintenance costs, capital costs, and surplus.
Figure 18 (a) shows the relationship between EYA and wind speed. It can be observed from the graph that Lusaka, with the highest EYA of 386 GWh, has the highest wind speed of 8m/s. Similarly, Petauke, with an EYA of 291.5 GWh, has the lowest wind speed of 6.9m/s. Figure 18(b) Shows the relationship between EYA and capacity factor. The results show that Lusaka, with the highest EYA, has the highest capacity factor of 44%, while Petauke has the lowest capacity factor of 33.2%. The relationship in Figure 18 (C) shows that Lusaka has the lowest SPP of 2.9 years and an IRR of 82%, while Petauke has the highest SPP of 5.7 years and an IRR of (6)%. With the negative IRR, Petauke is the least profitable site, which can be attributed to less EYA and low wind speeds. This shows that the project with a short period SPP likely has the highest IRR. Figure 18 (d) shows the relationship between NPV and LCOE. It can be seen from the graph that the highest NPV is about 200 million dollars for Lusaka, with the lowest LCOE of $0.182/ kWh, Petauke with the lowest NPV of 163 million dollars and Mwinilnga with the highest LCOE of $0.235/kWh; this means that Lusaka has the lowest production cost a kWh while Mwinilunga has the highest. Mwinilunga has the longest distance from Lusaka, about 913.1 km. Therefore, transportation and other contingency costs may contribute to the increased production cost of a kWh.
5. Conclusions
This paper analyses the economic feasibility of onshore wind energy potential for electricity generation for eight sites in Zambia. A detailed economic analysis was conducted to determine the economic viability for eight sites. The economic feasibility was based on eight sites considering a 25-turbine layout wind farm for a 4 MW generic wind turbine at 130m hub height. The economic evaluation was conducted by employing a MATLAB mathematical model to analyze the economic feasibility using net present value (NPV), simple payback period (SPP), internal rate of return (IRR), and levelized cost of electricity production (LCOE). The study shows that the Lusaka wind farm was the most economical with 386 GWh EYA, wind speed of 8 m/s, NPV of 316 million dollars, SPP of 2.9 years, IRR of 82%, and LCOE of $0.182/ kWh. The study results also show that the other seven sites are economically feasible, Petauke being the lowest with 291.5 GWh EYA, wind speed of 6.9 m/s, NPV of 163 million dollars, SPP of 5.7 years and negative IRR - 6%. Transportation contributed to increased costs, especially for plants located in far areas.
The study shows that the current average electricity tariff needs to be higher, and if applied to wind farms, the projects will not be profitable. It recommended using the LCOE as a benchmark for setting the electricity tariff price for each location. Policymakers should consider reducing subsidies on electricity tariffs, developing feed-in tariff (FiT) schemes, and developing viable power purchase agreements to move to cost-reflective electricity tariffs that will motivate independent power producers to invest in Zambia. With the highlighted massive potential of wind power for electricity generation, This study recommends that the Government, Rural Electrification Authority(REA), and independent power producers use this data for energy policy formulation and implementation of wind projects. For further wind assessments and related studies in Zambia, DNV GL would recommend using CFD wind flow modeling to decrease horizontal extrapolation uncertainties.
Author Contributions
Sydney Mutale: draft and writing, reviewing and editing. Amos Banda: draft and writing, reviewing and editing. Jan Yasir: review and editing. Yong Wang: Supervision, review and editing.
Data Availability Statement
To be made available when requested.
Acknowledgments
This work was also supported by the School of New Energy, North China Electric Power University (Chinese Scholarship Council - 2020) and the University of Zambia (Staff Development Programme ,Technology Development and Advisory Unit (TDAU) and School of Engineering).
Conflicts of Interest
None.
References
- Ertürk, M. The evaluation of feed-in tariff regulation of Turkey for onshore wind energy based on the economic analysis. Energy Policy 2012, 45. [Google Scholar] [CrossRef]
- Savino, M.M. , Manzini, R., Selva, V.D., Accorsi, R. A new model for environmental and economic evaluation of renewable energy systems: The case of wind turbines. Applied Energy 2017, 189, 739–752. [Google Scholar] [CrossRef]
- Wiser, R. , Millstein, D. Evaluating the economic return to public wind energy research and development in the United States. Applied Energy 2020, 261, 114449. [Google Scholar] [CrossRef]
- Wang, Y. , Qin Y., Wang, K., Liu, J., Fu, S., Zou, J., Ding, L. Where is the most feasible, economical, and green wind energy? Evidence from high-resolution potential mapping in China. Journal of Cleaner Production 2022, 376, 134287. [Google Scholar] [CrossRef]
- Yang, J., Chen. Integrated evaluation of embodied energy, greenhouse gas emission and economic performance of a typical wind farm in China. Renewable and Sustainable Energy Reviews 2013, 27, 559–568. [Google Scholar] [CrossRef]
- Manoo, M. U. , a, Shaikh, F., Kumar, L., Arıcı, M. Comparative techno-economic analysis of various stand-alone and grid connected (solar/wind/fuel cell) renewable energy systems. International Journal of Hydrogen Energy. [CrossRef]
- Lehmann, P. , Reutter, F., Tafarte, P. Optimal siting of onshore wind turbines: Local disamenities matter. Resource and Energy Economics 2023, 74, 101386. [Google Scholar] [CrossRef]
- Zieglera, L. ,Gonzalezc, E., Rubertd, T., Smolkaa, U., Meleroc, J.J. Lifetime extension of onshore wind turbines: A review covering Germany, Spain, Denmark, and the UK. Renewable and Sustainable Energy Reviews 2018, 82, 1261–1271. [Google Scholar] [CrossRef]
- Almutairi, K. , Dehshiri, S. S.H., Dehshiri, S.J.H., Mostafaeipour, A., Techato, K. An economic investigation of the wind-hydrogen projects: A case study, International Journal of Hydrogen Energy 2022, 47, 25880–25898. [Google Scholar] [CrossRef]
- Harrucksteiner, A. , Thakur, J., Franke, K., Sensfuß, F. A geospatial assessment of the techno-economic wind and solar potential of Mongolia. Sustainable Energy Technologies and Assessments 2023, 55, 102889. [Google Scholar] [CrossRef]
- Linnerud, K. , Dugstad, A., Rygg, B.J. Do people prefer offshore to onshore wind energy? The role of ownership and intended use. Renewable and Sustainable Energy Reviews 2022, 168, 112732. [Google Scholar] [CrossRef]
- Namahoro, J.P. , Wu, Q. , Su, H. Wind energy, industrial-economic development and CO2 emissions nexus: Do droughts matter? Energy 2023, 278, 127869. [Google Scholar] [CrossRef]
- Wimalaratna, Y.P. , Afrouzi, H.N., Mehranzamir, K., Siddique, M.B.M., Liew, S.C., Ahmed, J. Analysing wind power penetration in hybrid energy systems based on techno-economic assessments. Sustainable Energy Technologies and Assessments 2022, 53, 102538. [Google Scholar] [CrossRef]
- Mwanza, M. , Kaoma, M., Bowa, C.K., Sumbwanyambe, M., Pretorius, J., Ulgen, K., Techno-economic Analysis of Wind/PV Hybrid System for Sustainable and Clean Energy Production for Shang’ombo District of Zambia. Proceedings of the, 1007. [Google Scholar]
- National Energy Policy, Ministry of Energy, Department of Energy, Lusaka, Zambia, 2023. Available online: https://www.moe.gov.zm/?page_id=1606.
- Mutale, S. , Banda, A., Wang, Y., Yasir, J. Capability of Zambian Industries to Manufacture Grid-Scale Wind Turbine Blades and Towers. Preprints, 2023, 2023091621. [CrossRef]
- Krauland, A.V. , Long, Q., Enevoldsen, P., Jacobson, M.Z. United States offshore wind energy atlas: availability, potential, and economic insights based on wind speeds at different altitudes and thresholds and policy-informed exclusions. Energy Conversion and Management: X 2023, 20, 100410. [Google Scholar] [CrossRef]
- Feng, R. , Wencheng, L. LSSA-BP-based cost forecasting for onshore wind power. Energy Reports 2023, 9, 362–370. [Google Scholar] [CrossRef]
- Kaoma, M. , Gheewala, S.H. Sustainability performance of lignocellulosic biomass-to-bioenergy supply chains for Rural Growth Centres in Zambia. Sustainable Production and Consumption 2021, 28. [Google Scholar] [CrossRef]
- Ministry of Energy, Department of Energy, Lusaka, Zambia, 2023. Available online: https://www.moe.gov.zm/?page_id=2198.
- Kaoma, M. , Gheewala, S.H. Evaluation of the enabling environment for the sustainable development of rural-based bioenergy systems in Zambia. Energy Policy 2021, 154. [Google Scholar] [CrossRef]
- Kaoma, M. , Gheewala, S.H. Techno-economic assessment of bioenergy options using crop and forest residues for non-electrified rural growth centres in Zambia. Biomass and Bioenergy 2021, 145. [Google Scholar] [CrossRef]
- Mohamadi, H. , Saeedi, A., Firoozi, Z., Zangabadi, S.S., Veisi, S. Assessment of wind energy potential and economic evaluation of four wind turbine models for the east of Iran. Heliyon 2021, 7. [Google Scholar] [CrossRef] [PubMed]
- Alham, M.H. , Gad, M.F., Ibrahim, D.K. Potential of wind energy and economic assessment in Egypt considering optimal hub height by equilibrium optimizer. Ain Shams Engineering Journal 2023, 14. [Google Scholar] [CrossRef]
- Mostafaeipour, A. , Jadidi, M., Mohammadi, K., Sedaghat, A. An analysis of wind energy potential and economic evaluation in Zahedan, Iran. Renewable and Sustainable Energy Reviews 2014, 30, 641–650. [Google Scholar] [CrossRef]
- Abdelhadya, S. , Borelloc, D., Santoric, S. Economic feasibility of small wind turbines for domestic consumers in Egypt based on the new Feed-in Tariff. Energy Procedia 2015, 75, 664–670. [Google Scholar] [CrossRef]
- Ohunakin, S.O. , Joshua, S.O., Ogunsina,S.B., Dinrifo, R.R. Analysis of cost estimation and wind energy evaluation using wind energy conversion systems (WECS) for electricity generation in six selected high altitude locations in Nigeria. Energy Policy 2012, 48, 594–600. [Google Scholar] [CrossRef]
- Wizelius, T. , Developing wind power project, theory and practice.2009, ISBN: 978-1-84407-262-0, London, UK.
- Satymov, R. , Bogdanov, D., Breyer, C. Global-local analysis of cost-optimal onshore wind turbine configurations considering wind classes and hub heights. Energy 2022, 256, 124629. [Google Scholar] [CrossRef]
- Ohunakin, O.S. , Matthew, O.J., Adaramola, M.S., Atiba, O.E., Adelekan, D.S., Aluko, O.O., Henry, E.U., Ezekiel, V.U. Techno-economic assessment of offshore wind energy potential at selected sites in the Gulf of Guinea. Energy Conversion and Management 2023, 288, 117110. [Google Scholar] [CrossRef]
- Barter, G.E. , Sethuraman, L., Bortolotti, P., Keller, J., Torrey, D.A. Beyond 15 MW: A cost of energy perspective on the next generation of drivetrain technologies for offshore wind turbines. Applied Energy 2023, 344, 121272. [Google Scholar] [CrossRef]
- Mardones, C. Economic, environmental, and social assessment of the replacement of coal-fired thermoelectric plants for solar and wind energy in Chile. Journal of Cleaner Production 2023, 411, 137343. [Google Scholar] [CrossRef]
- Quinna, R. , Schepersb, G., Bulder. A parametric investigation into the effect of low induction rotor (LIR) wind turbines on the levelised cost of electricity for a 1 GW offshore wind farm in a North Sea wind climate. Energy Procedia 2016, 94, 164–172. [Google Scholar] [CrossRef]
- Langer, J. , Simanjuntak, S., Pfenninger, S., Quist, J., Rahayu, H.P., Blok, K. How offshore wind could become economically attractive in low-resource regions like Indonesia. iScience 2022, 25, 945. [Google Scholar] [CrossRef]
- Zoładek, M. , Figaj, R., Kafetzis, A., Panopoulos, K. Energy-economic assessment of self-sufficient microgrid based on wind turbine, photovoltaic field, wood gasifier, battery, and hydrogen energy storage, International Journal of Hydrogen Energy. [CrossRef]
- Ali, S. , Lee, S., Jang, C. Techno-Economic Assessment of Wind Energy Potential at Three Locations in South Korea Using Long-Term Measured Wind Data. Energies 2017, 10, 1442. [Google Scholar] [CrossRef]
- Himria, Y. , Merzouk, M., Merzouk, N.K., Himrid, S. Potential and economic feasibility of wind energy in south West region of Algeria. Sustainable Energy Technologies and Assessments 2020, 38, 100643. [Google Scholar] [CrossRef]
- Odoi-Yorke, F. , Adu, T.F., Ampimah, B.C., Atepor, L. Techno-economic assessment of a utility-scale wind power plant in Ghana. Energy Conversion and Management: X 2022, 18, 1424–1443. [Google Scholar] [CrossRef]
- Zhang, Y. , Ma, C., Yang, Y., Pang, X., Lian, J., Wang, X., Capacity configuration and economic evaluation of a power system integrating hydropower, solar, and wind. Energy 2022, 259, 125012. [Google Scholar] [CrossRef]
- Department of Energy. Renewable Energy Wind Mapping for Zambia, 24-month Site Resource Report. 2019. Available online: https://www.moe.gov.zm/?page_id=2397.
- Earnest, J. , Wizelius, T., Wind power plants and project development. 2011, ISBN:978-81-203-3986-6, New Delhi, India.
- Kaoga, D.K. , Bogno, B., Aillerie, M., Raidandi, D., Yamigno, S.D., Hamandjoda, O., Tibi B. Assessment of Wind Energy Potential and Cost Estimation of Wind-generated Electricity at Hilltops Surrounding the City of Maroua in Cameroon. AIP Conference Proceedings, 1758, 020012, (2016). [CrossRef]
- Bank of Zambia. Available online: https://www.boz.zm/statistics.htm.
- Renewable Energy Strategy and Action Plan, Energy Regulation Board. Available online: https://www.erb.org.zm/renewable.
- Sim, J. An economic evaluation of potential offshore wind farm sites in South Korea using a real options approach. Energy Reports 2023, 10. [Google Scholar] [CrossRef]
- Elia, A. , Taylor, M., Gallachoir, B.O., Rogan, F. Wind turbine cost reduction: A detailed bottom-up analysis of innovation drivers. Energy Policy 2020, 147, 111912. [Google Scholar] [CrossRef]
- Hulio, Z.H. , Jiang, W., Rehman, S. Technical and economic assessment of wind power potential of Nooriabad, Pakistan. Energy, Sustainability and Society 2017, 7, 35. [Google Scholar] [CrossRef]
- Mutale, S. , Wang, X. Levels of Automation in Quality Sampling and Analysis of Copper. Industrial Engineering Letters, ISSN 2224-6096 (paper), ISSN 2225-0581 (online), Vol.4, No.4, 2014. Available online: https://www.researchgate.net/publication/371789394.
- Gaddada, S. , Kodicherla, S.P.K. Wind energy potential and cost estimation of wind energy conversion systems (WECSs) for electricity generation in the eight selected locations of Tigray region (Ethiopia). Renewables 2016, 3, 10–10. [Google Scholar] [CrossRef]
- Mutale, S., Banda, A. (2023), “Numerical Assessment and Validation of Wind Energy Potential for Electricity Generation in Zambia”, Mendeley Data, V1. Available online: https://data.mendeley.com/datasets/sjp48mv8fn/1.
Figure 1.
Mast locations [40].
Figure 1.
Mast locations [40].
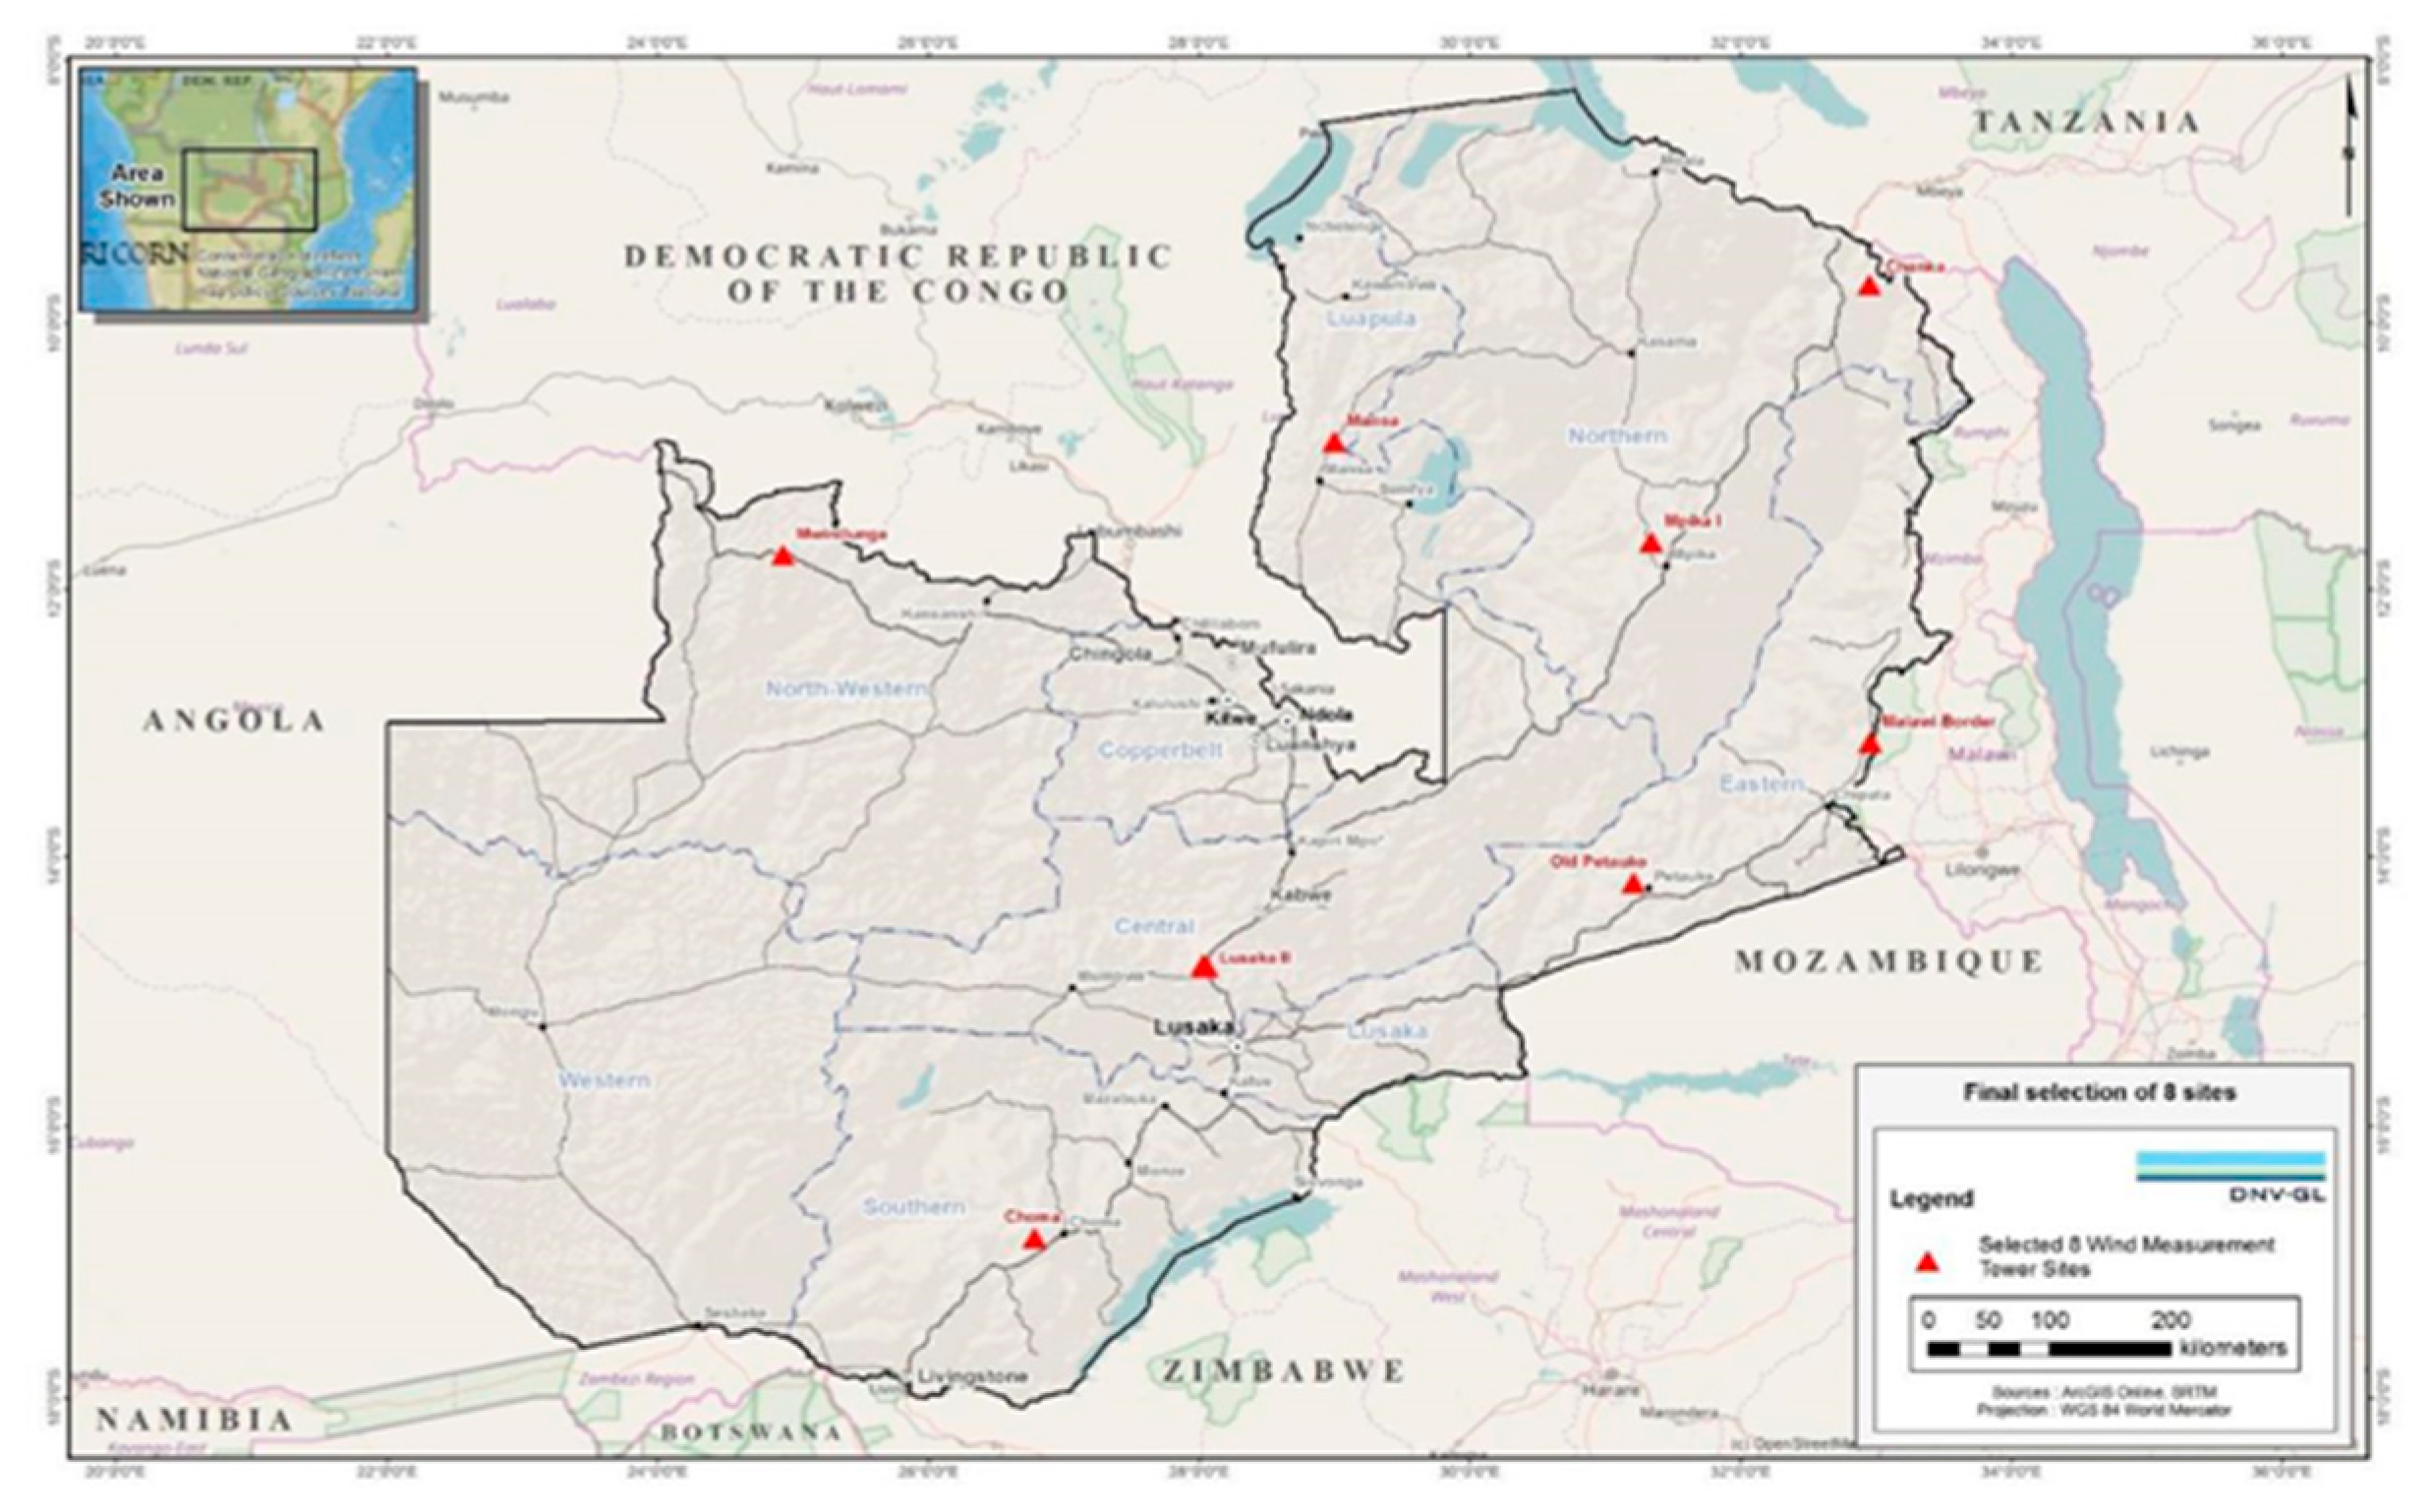
Figure 2.
Methodology flow chart.
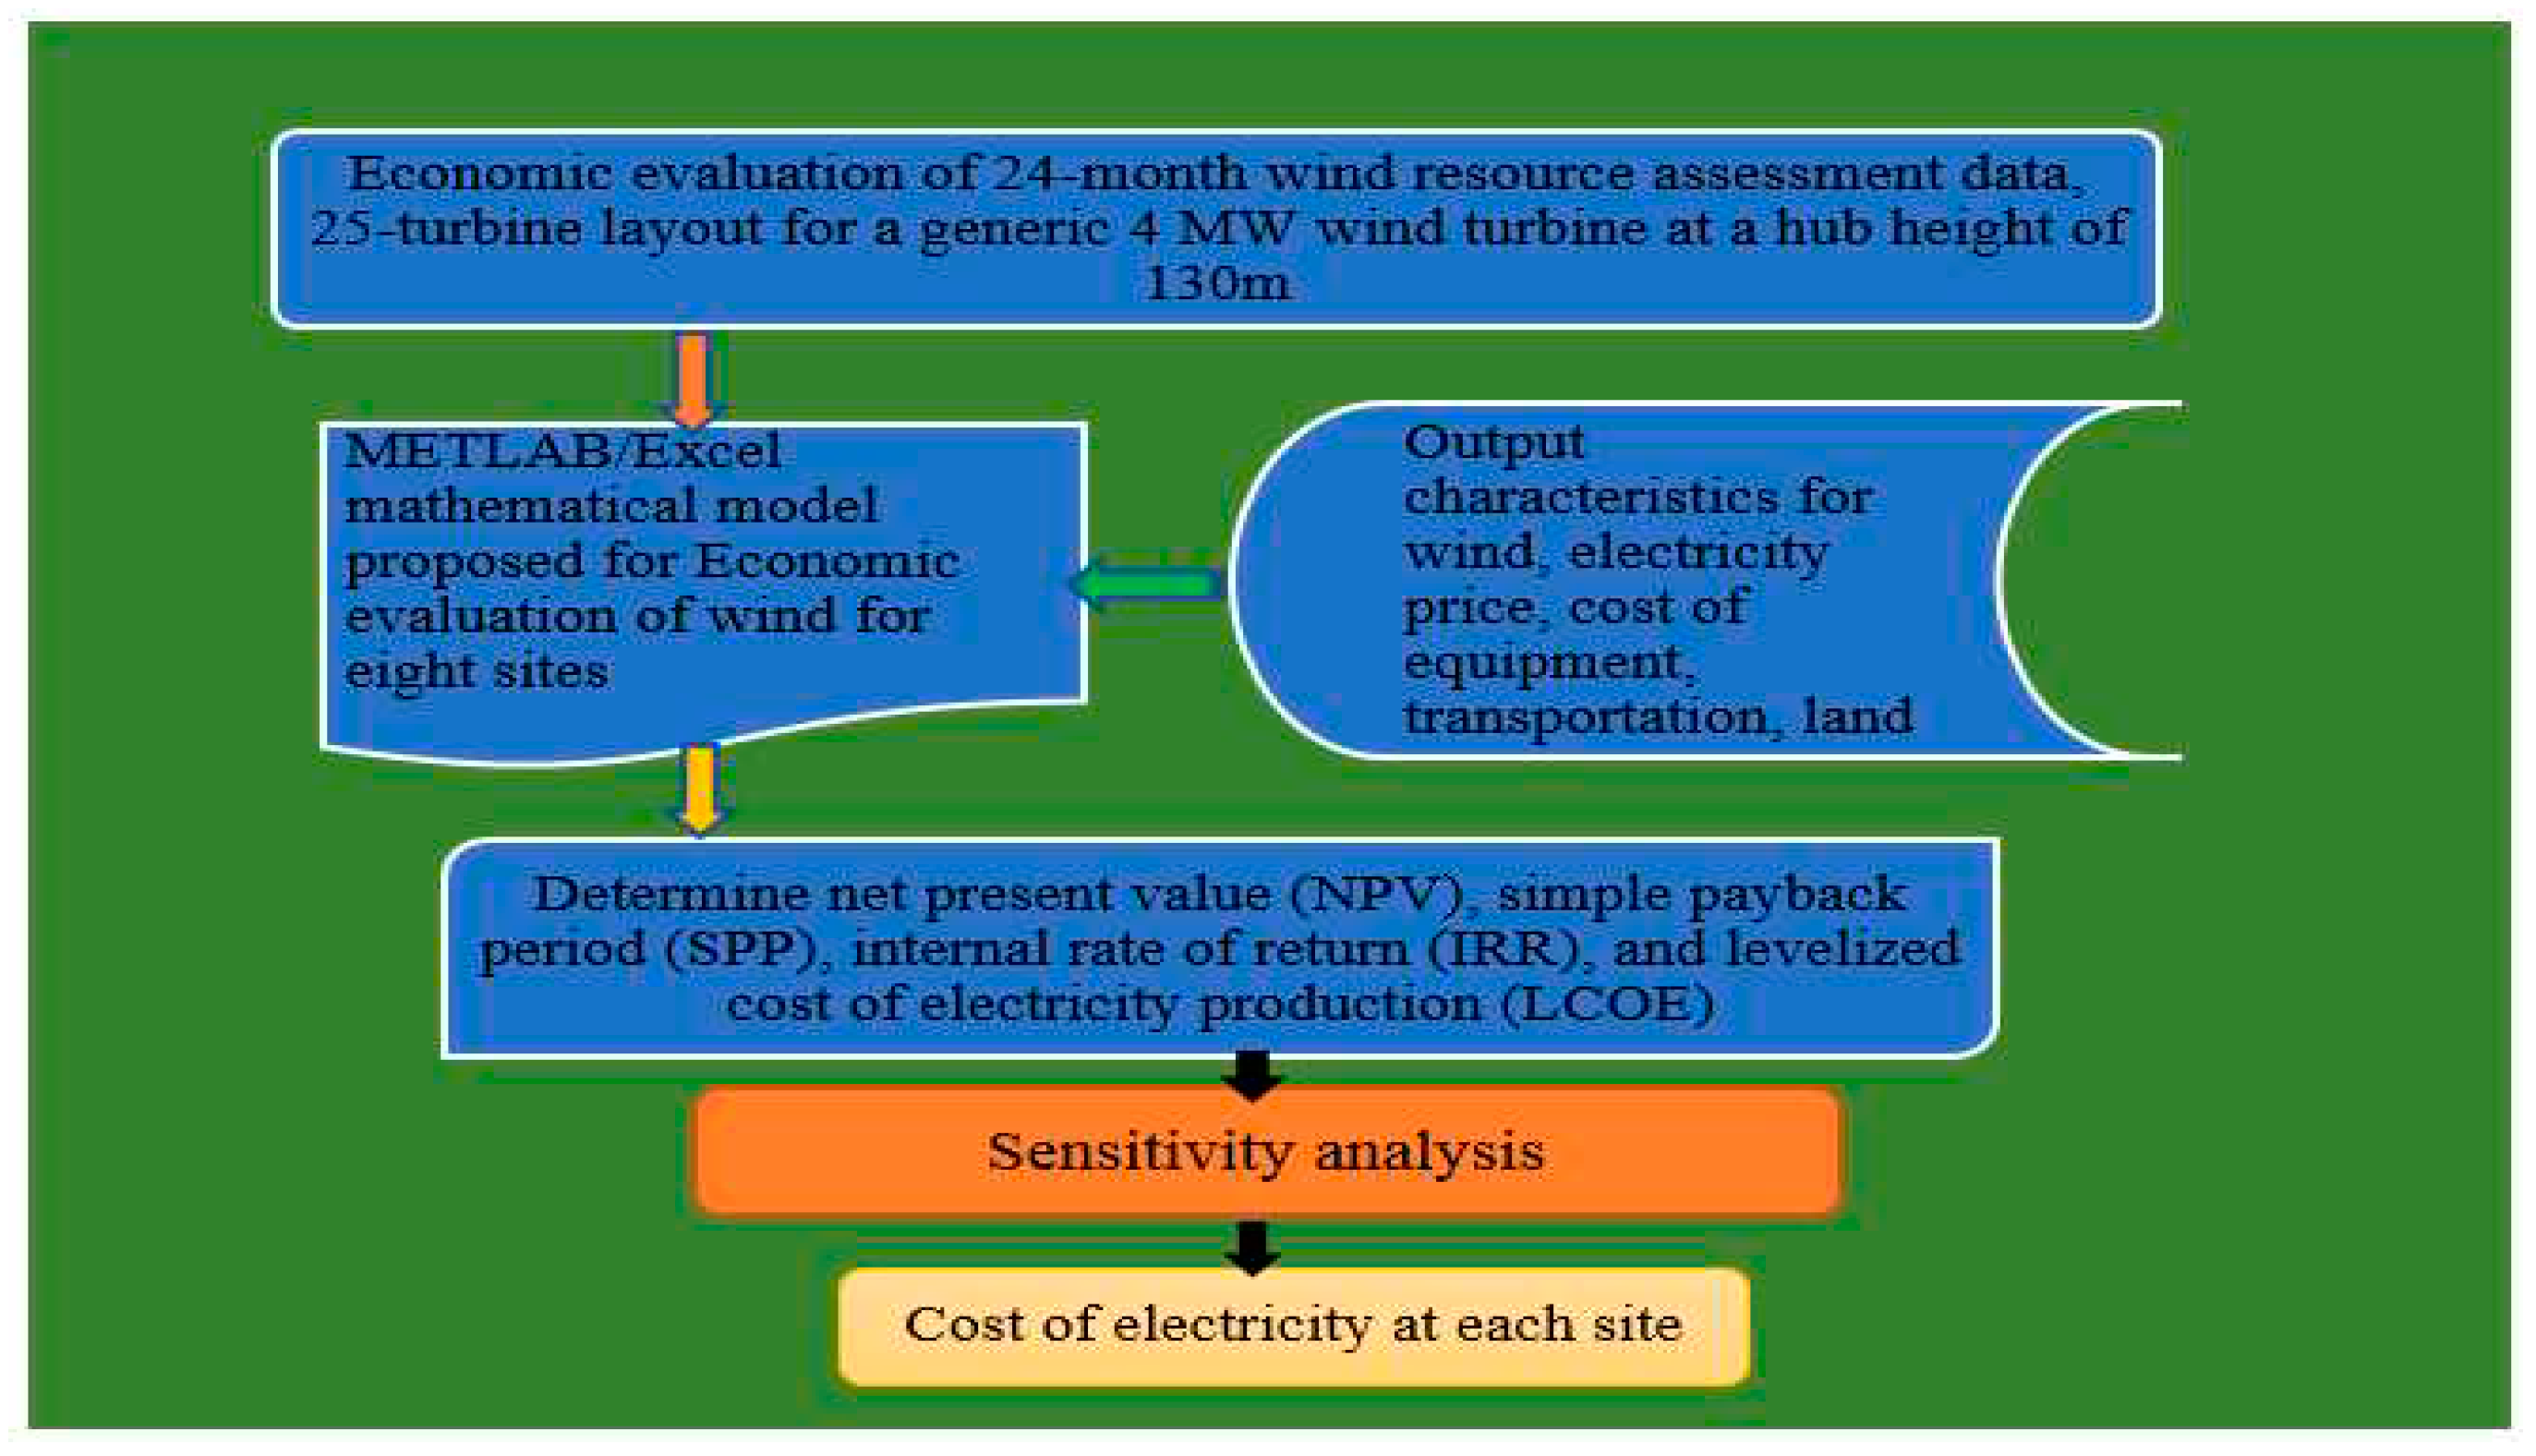
Figure 3.
Wind turbine economics at $0.07/ kWh electricity tariff for Choma site.
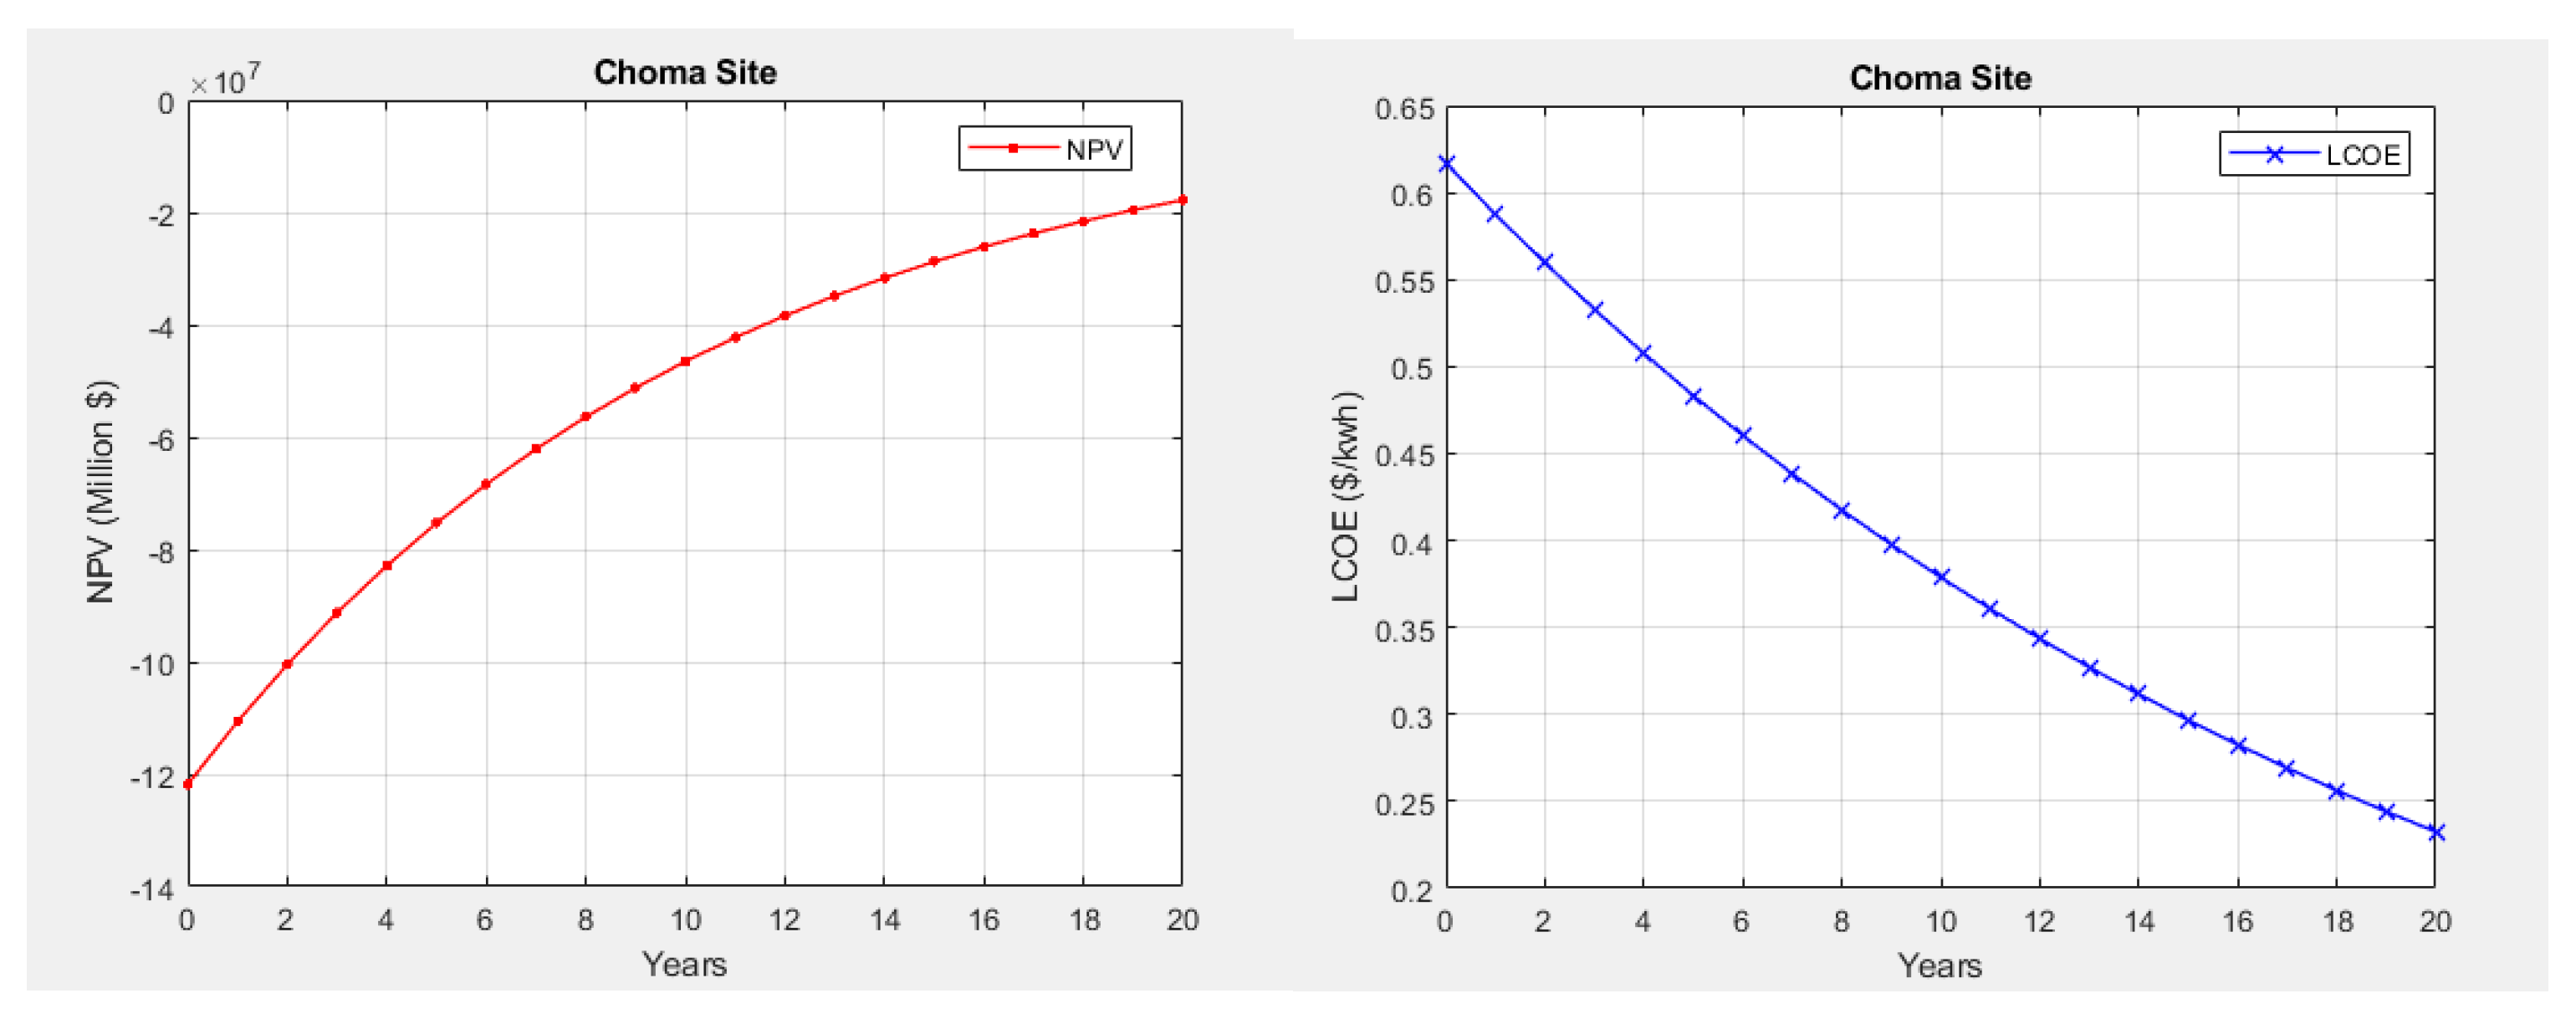
Figure 4.
Average electricity tariff ($0.07/ kWh) and ($0.617/ kWh) sensitivity analysis for the Choma site.
Figure 4.
Average electricity tariff ($0.07/ kWh) and ($0.617/ kWh) sensitivity analysis for the Choma site.
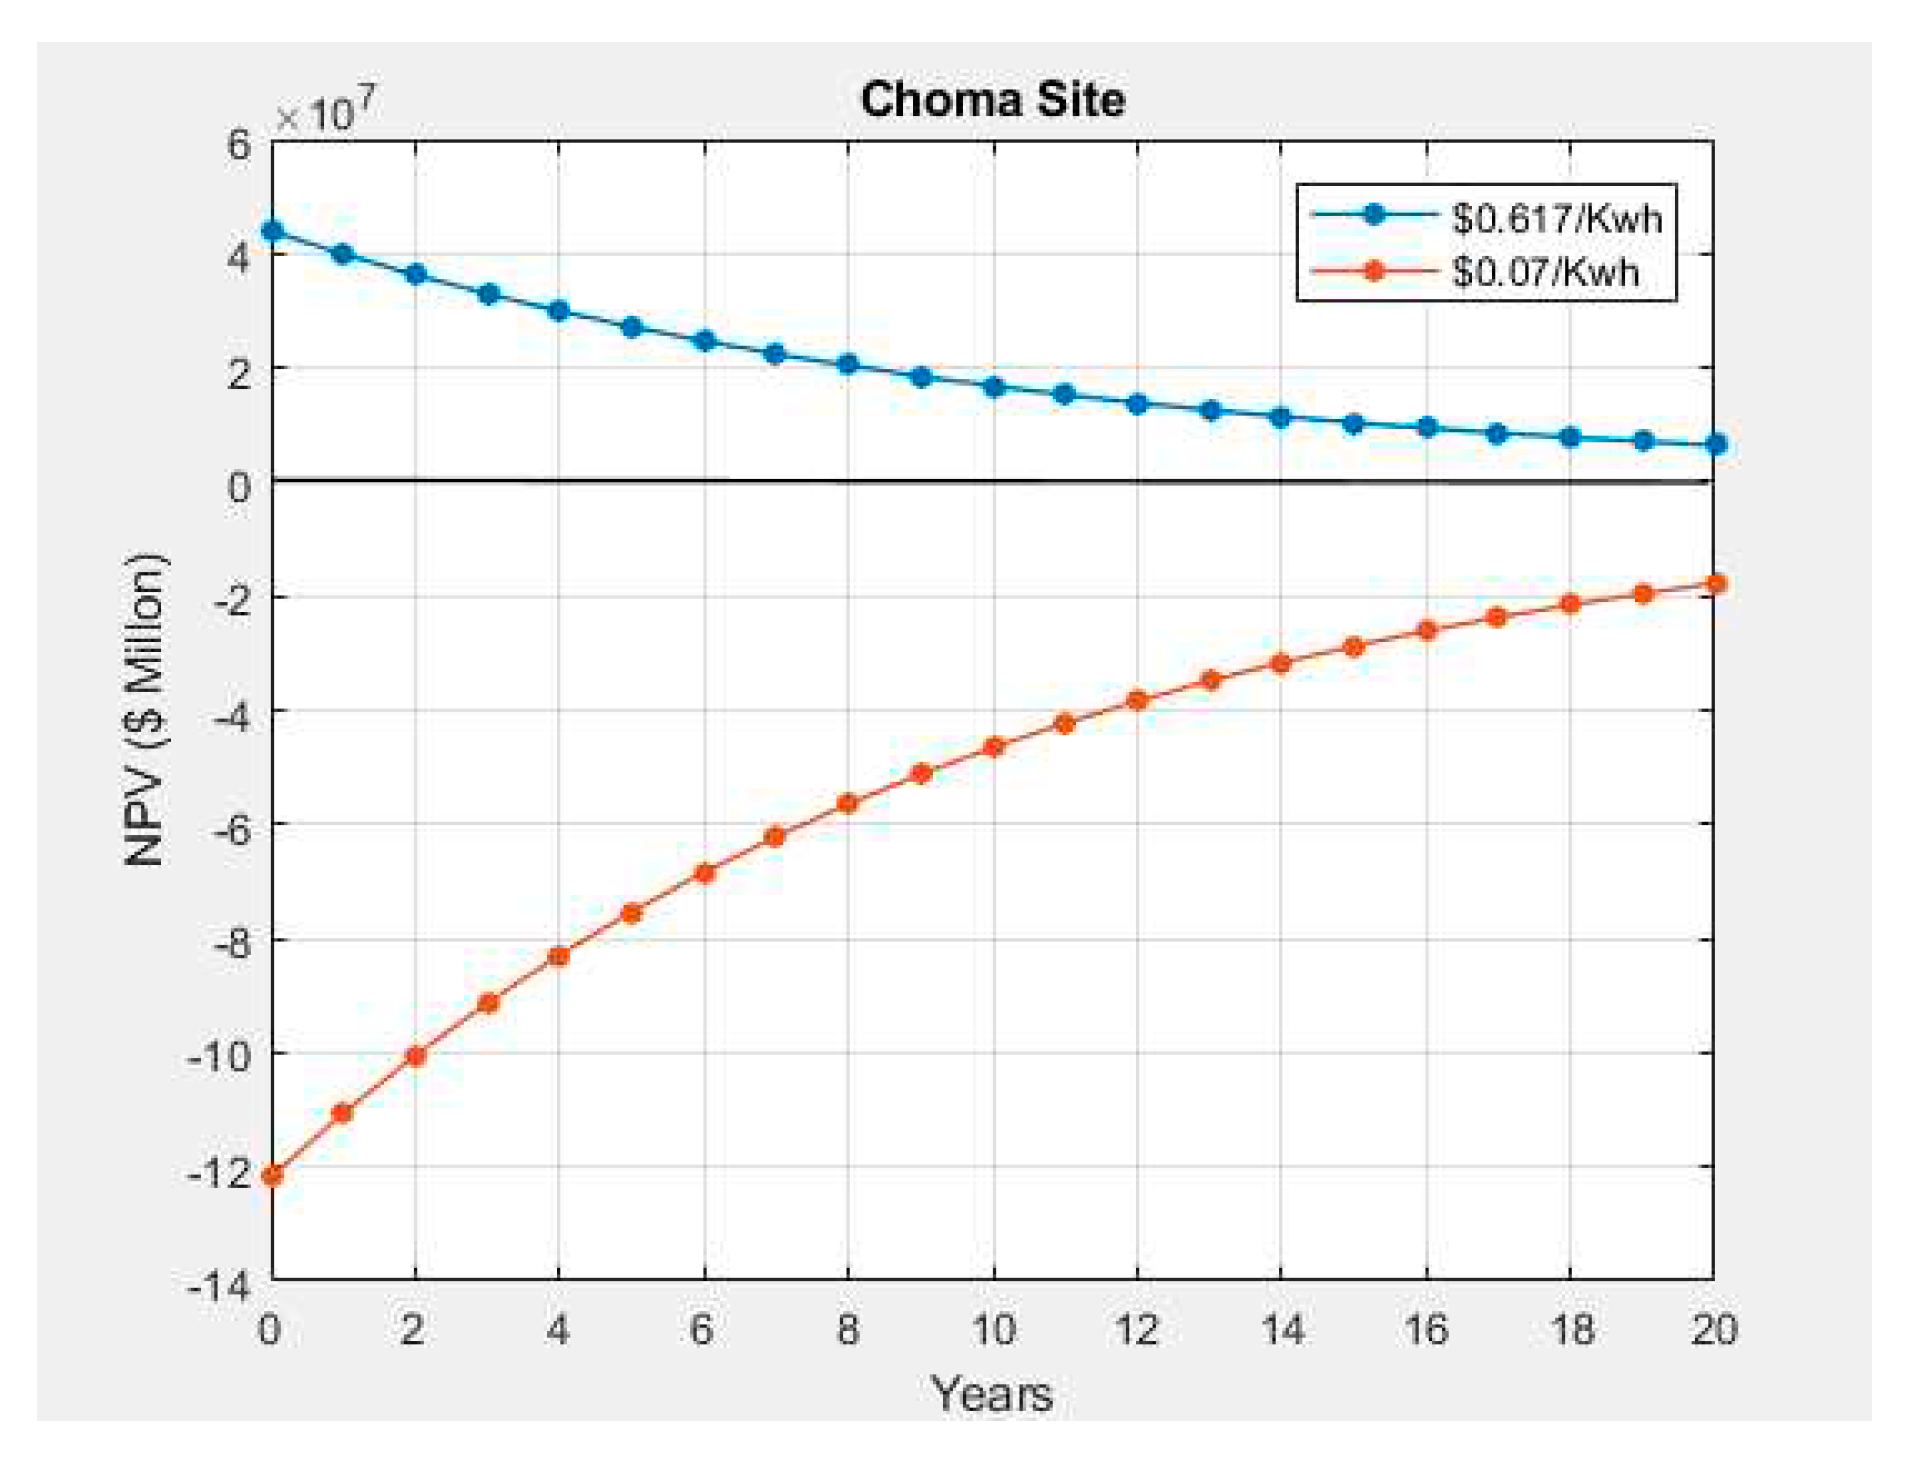
Figure 5.
Wind turbine economics at $0.07/ kWh electricity tariff for Mwinilunga site.
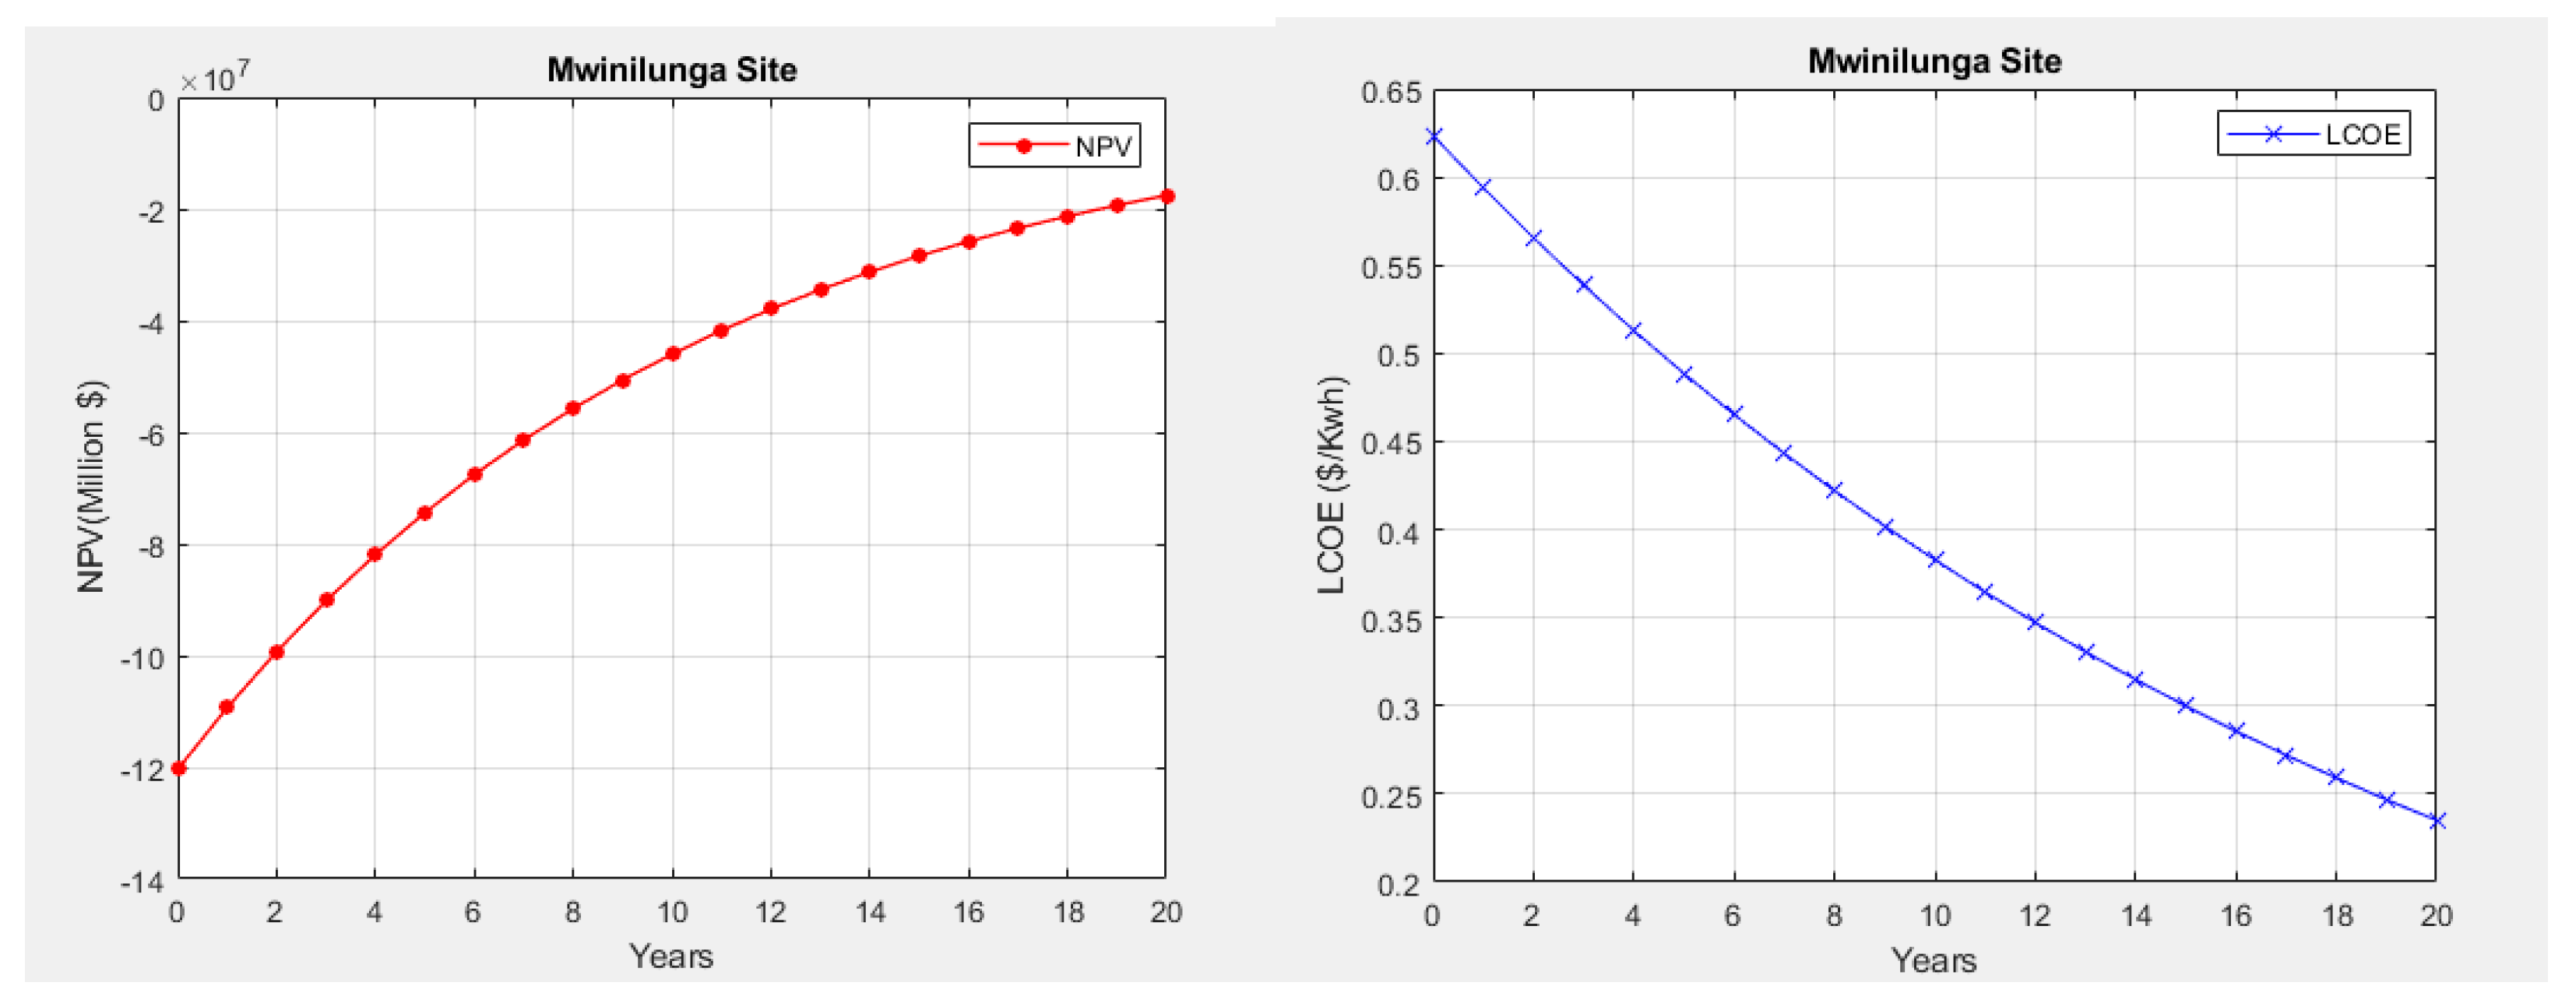
Figure 6.
Average electricity tariff ($0.07/ kWh) and ($0.624/ kWh) sensitivity analysis for Mwinilunga.
Figure 6.
Average electricity tariff ($0.07/ kWh) and ($0.624/ kWh) sensitivity analysis for Mwinilunga.
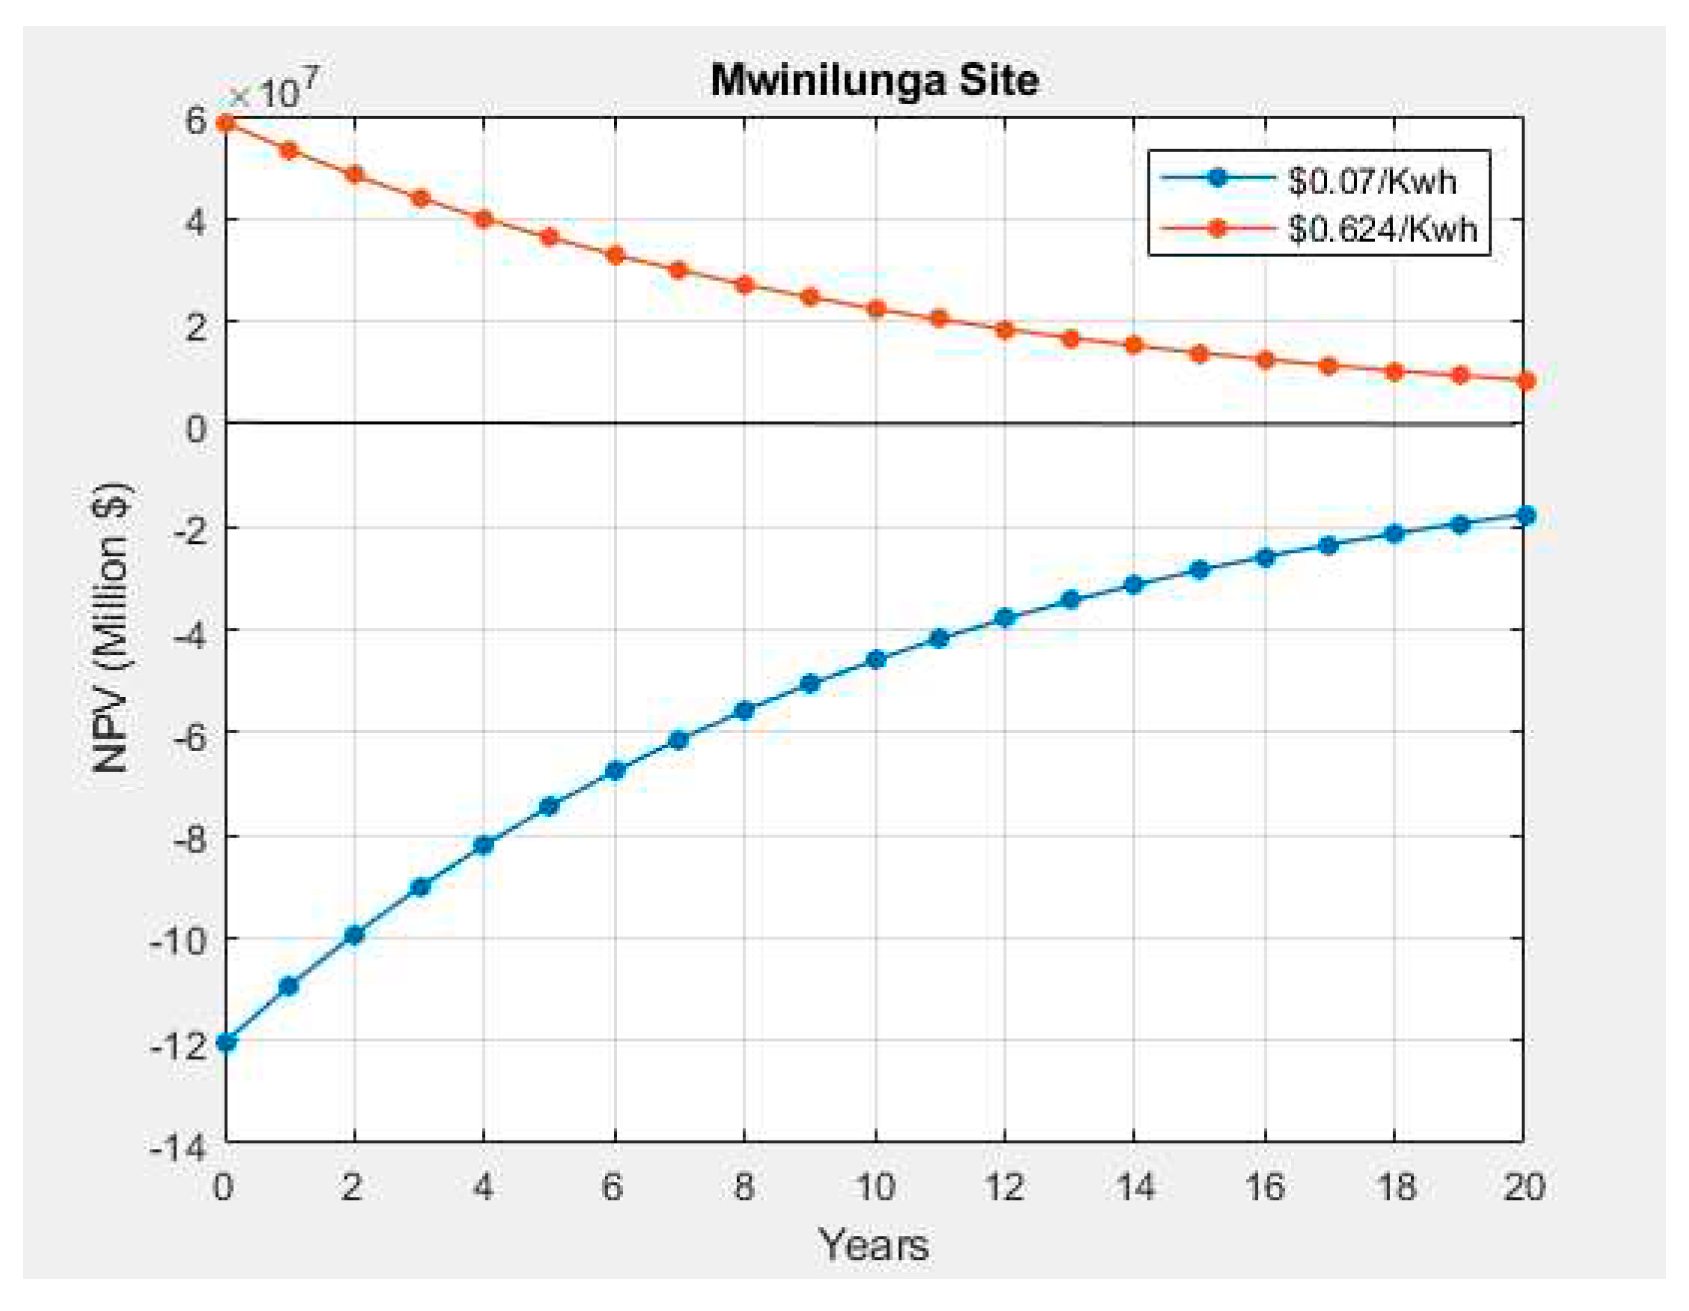
Figure 7.
Wind turbine economics at $0.07/ kWh electricity tariff for Lusaka site.
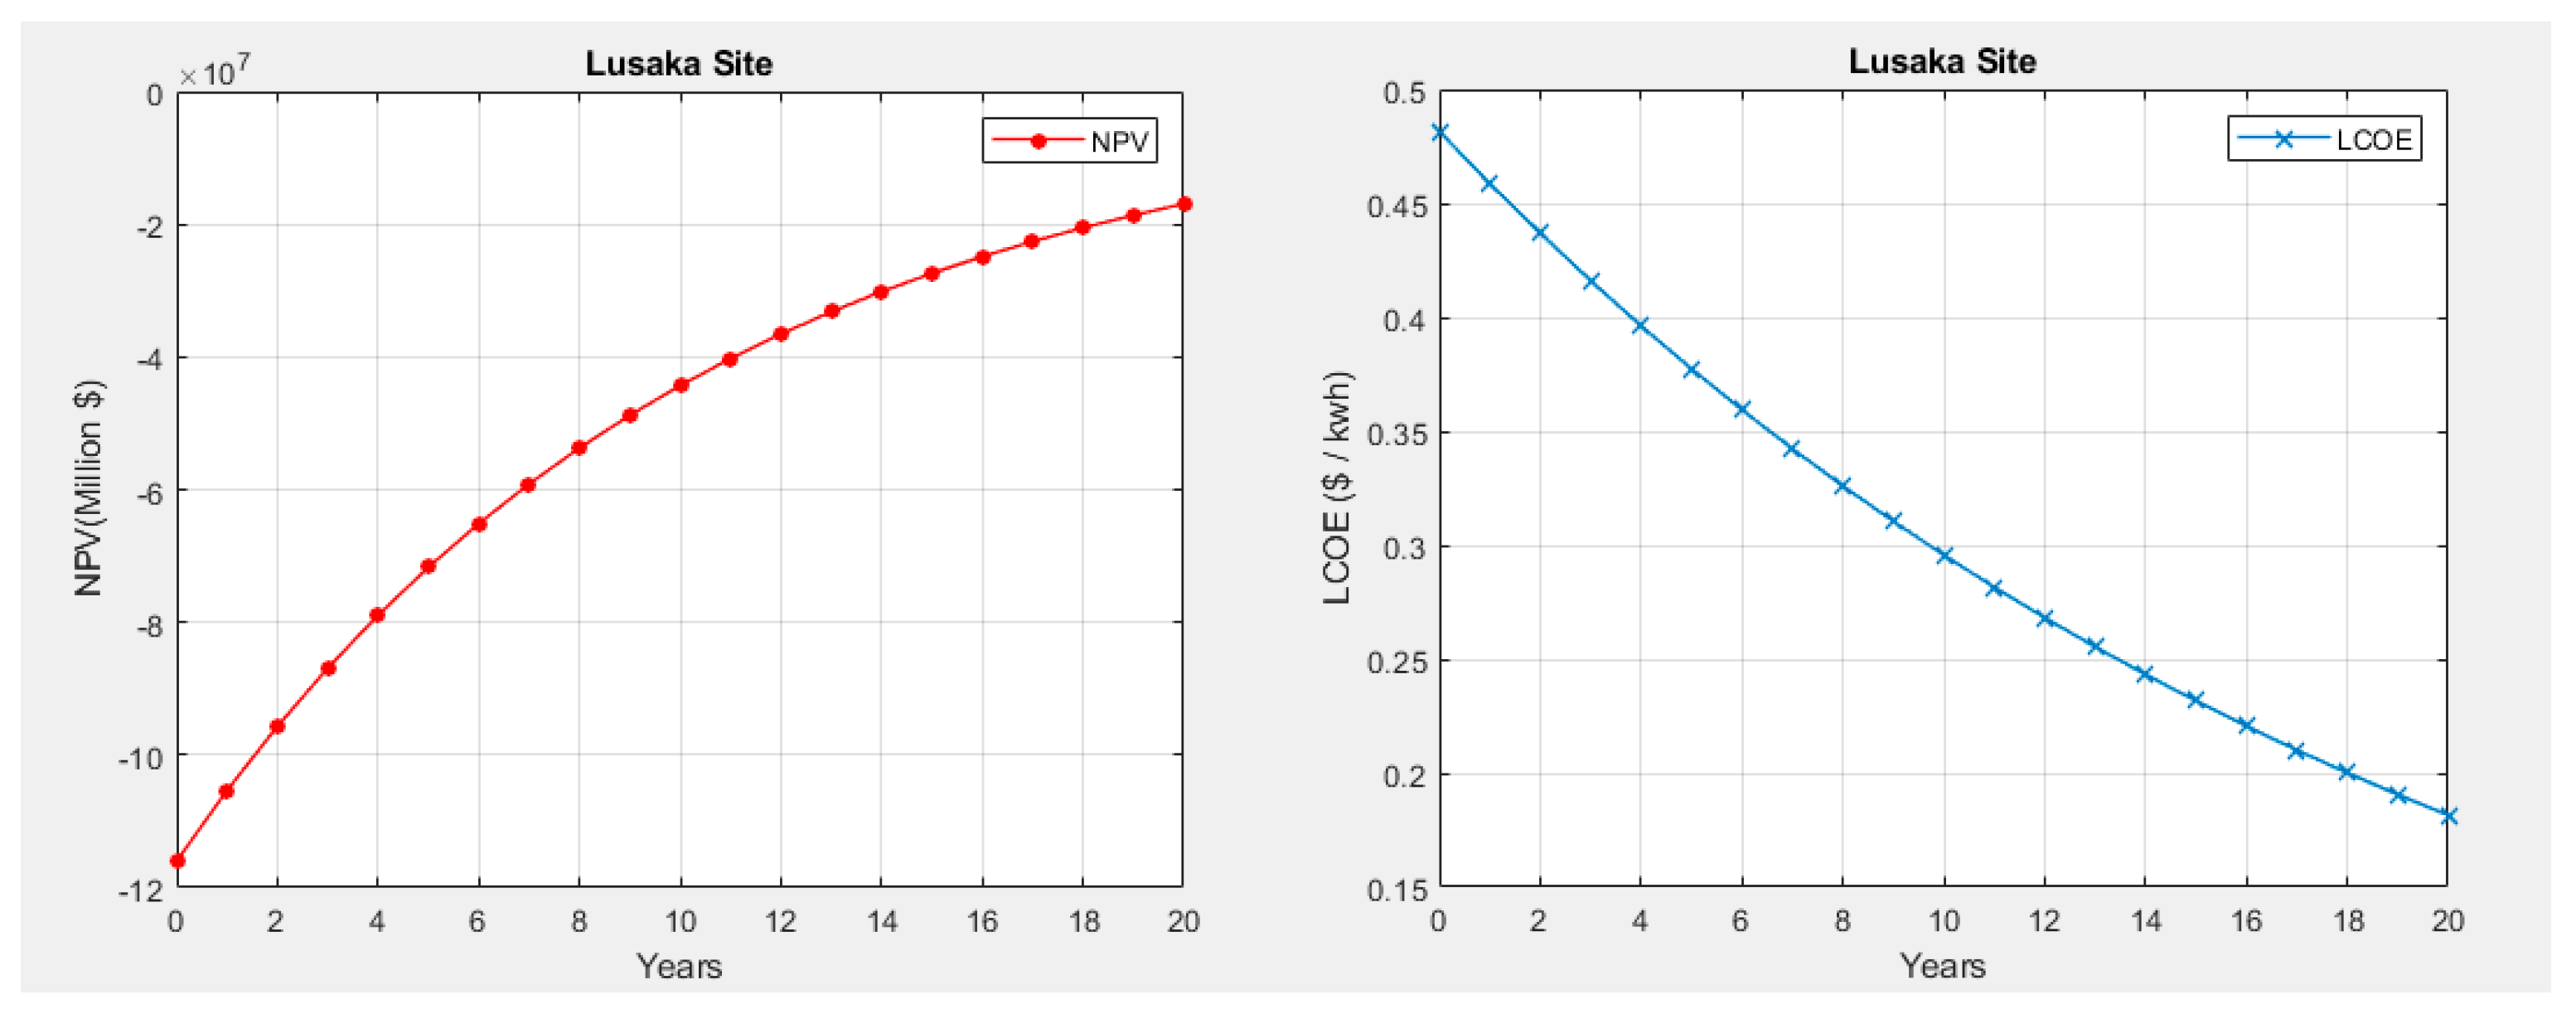
Figure 8.
Average electricity tariff ($0.07/ kWh) and ($0.482/ kWh) sensitivity analysis for Lusaka.
Figure 8.
Average electricity tariff ($0.07/ kWh) and ($0.482/ kWh) sensitivity analysis for Lusaka.
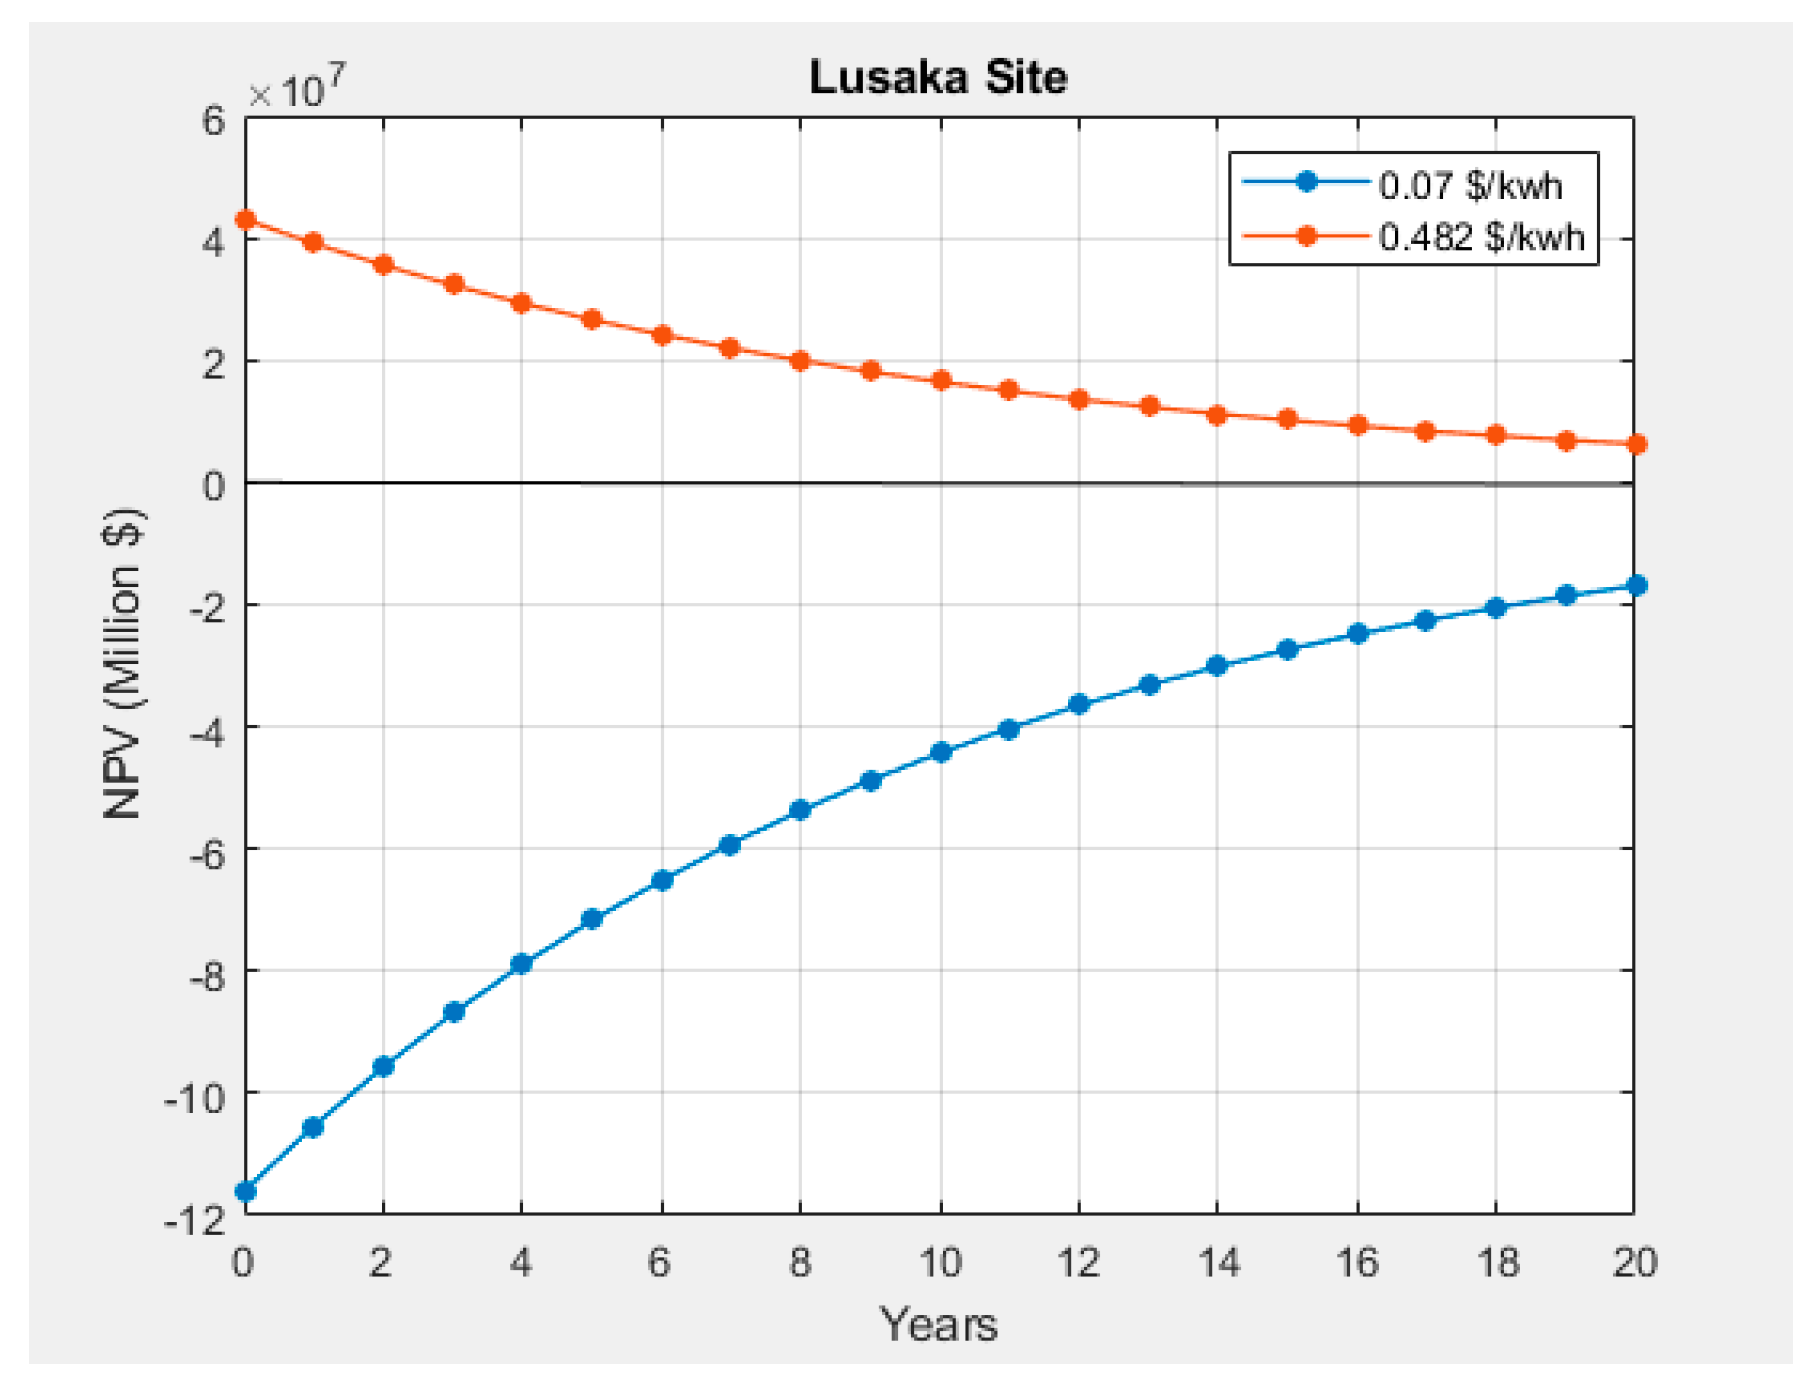
Figure 9.
Wind turbine economics at $0.07/ kWh electricity tariff for Mpika site.
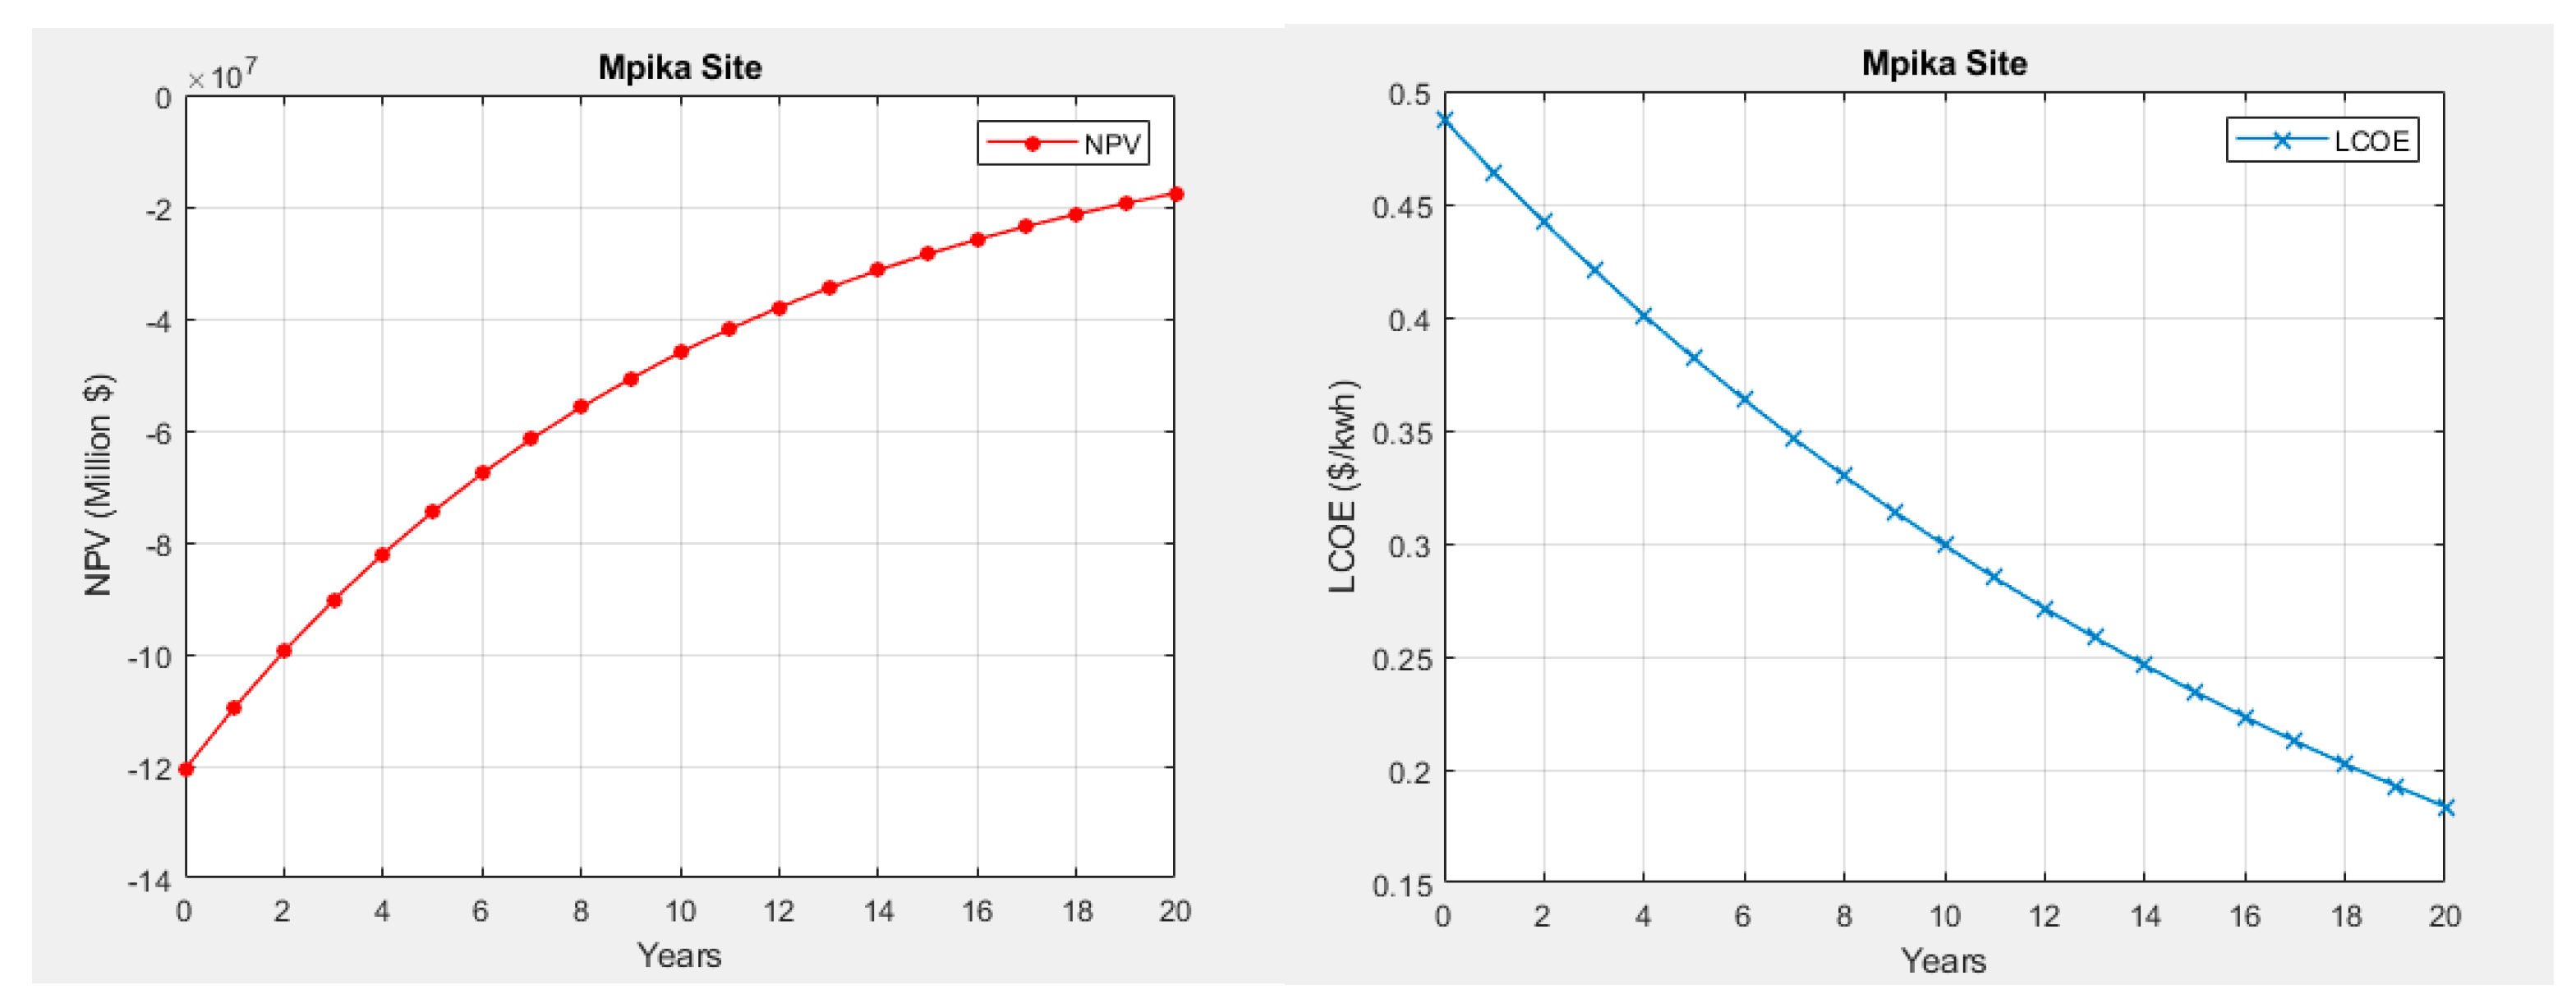
Figure 10.
Average electricity tariff ($0.07/ kWh) and ($0.487/ kWh) sensitivity analysis for Mpika.
Figure 10.
Average electricity tariff ($0.07/ kWh) and ($0.487/ kWh) sensitivity analysis for Mpika.
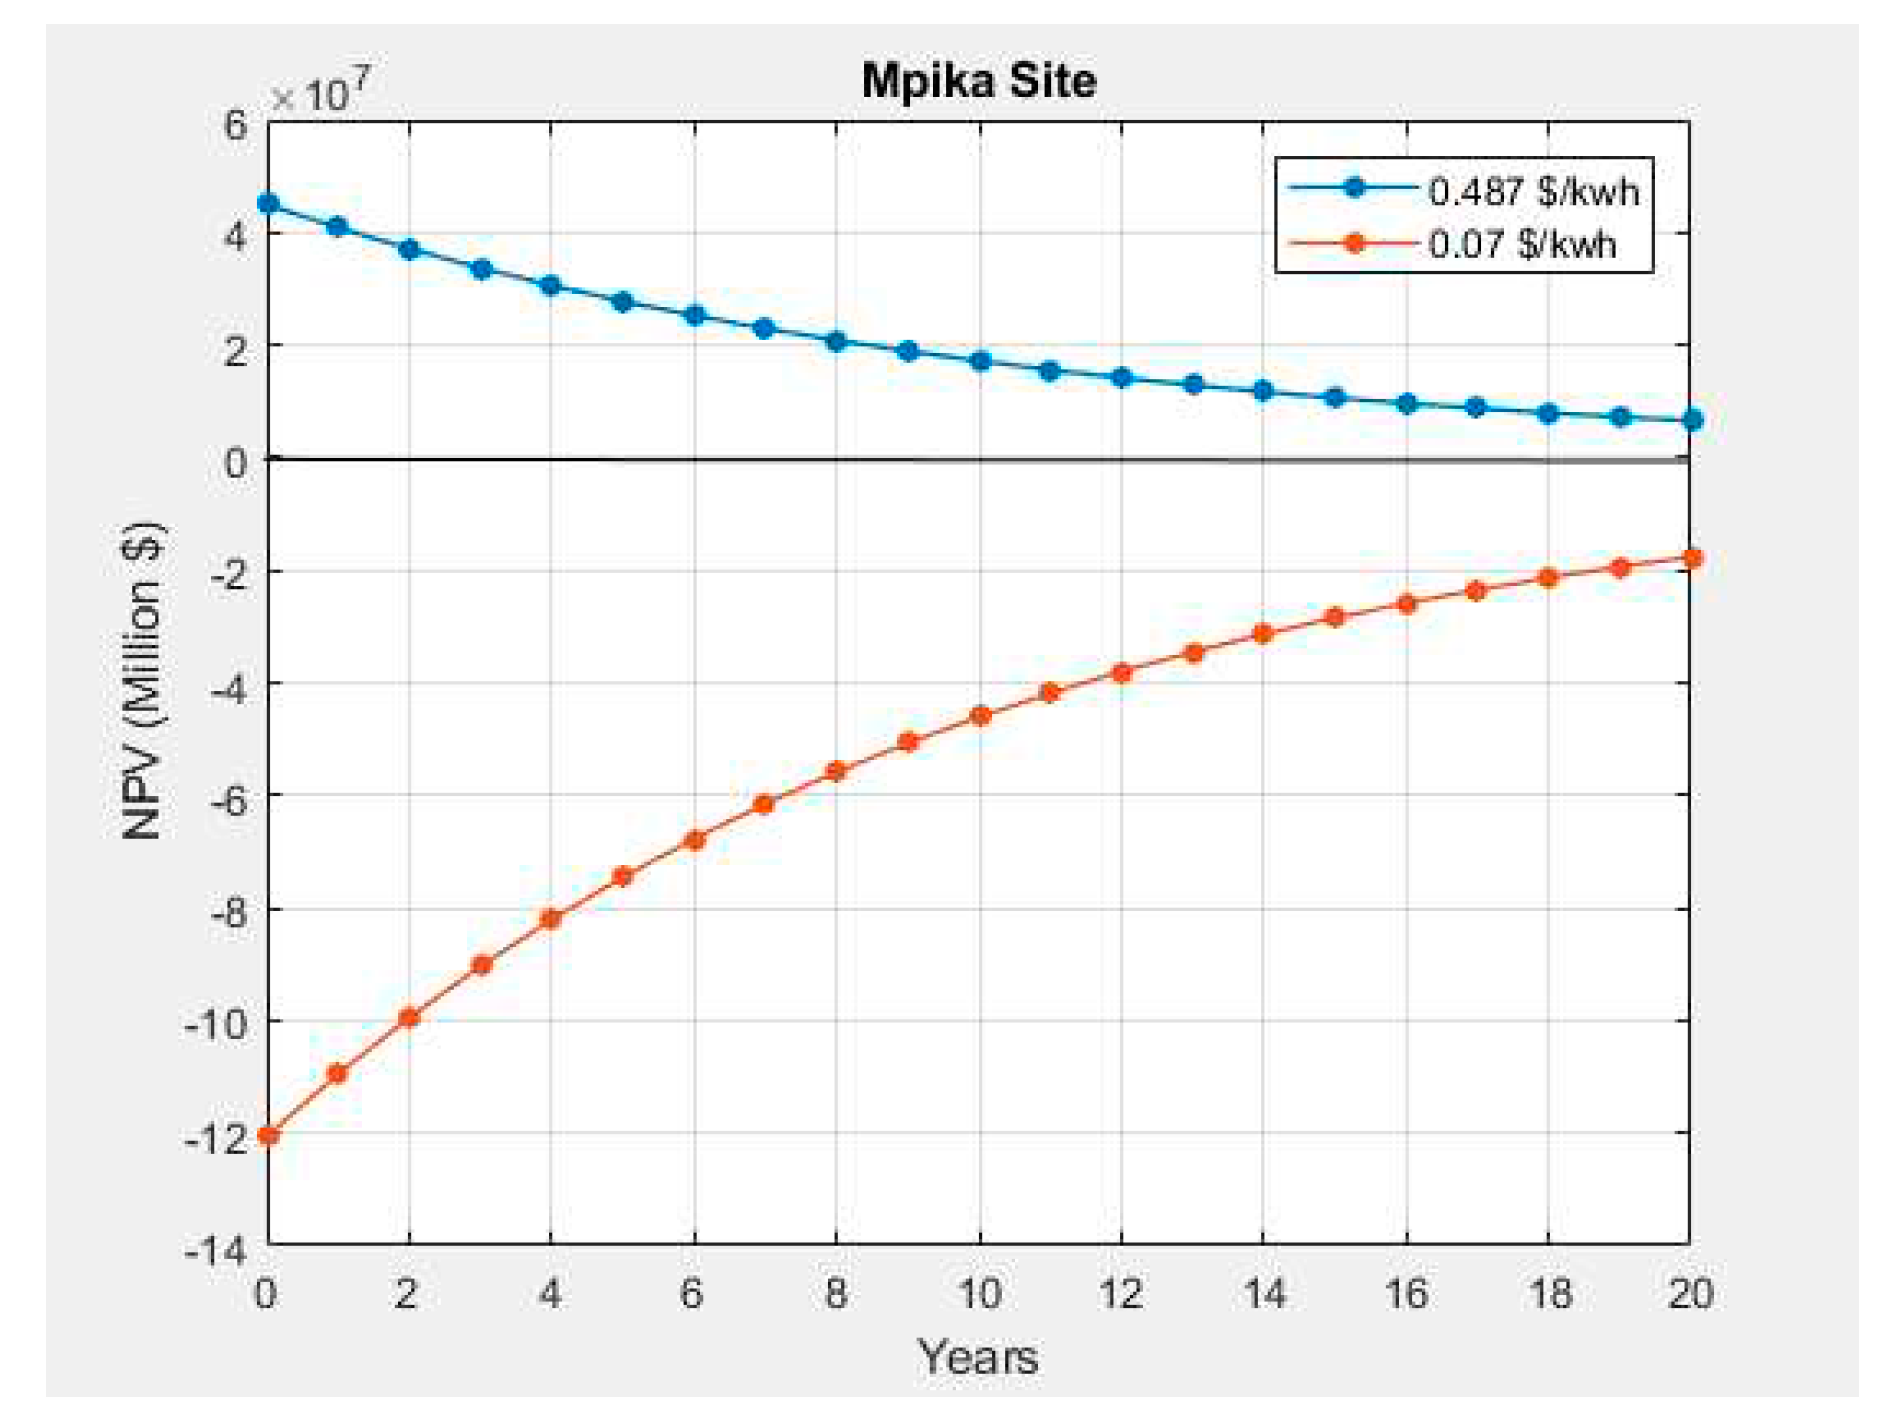
Figure 11.
Wind turbine economics at $0.07/ kWh electricity tariff for Chanka site.
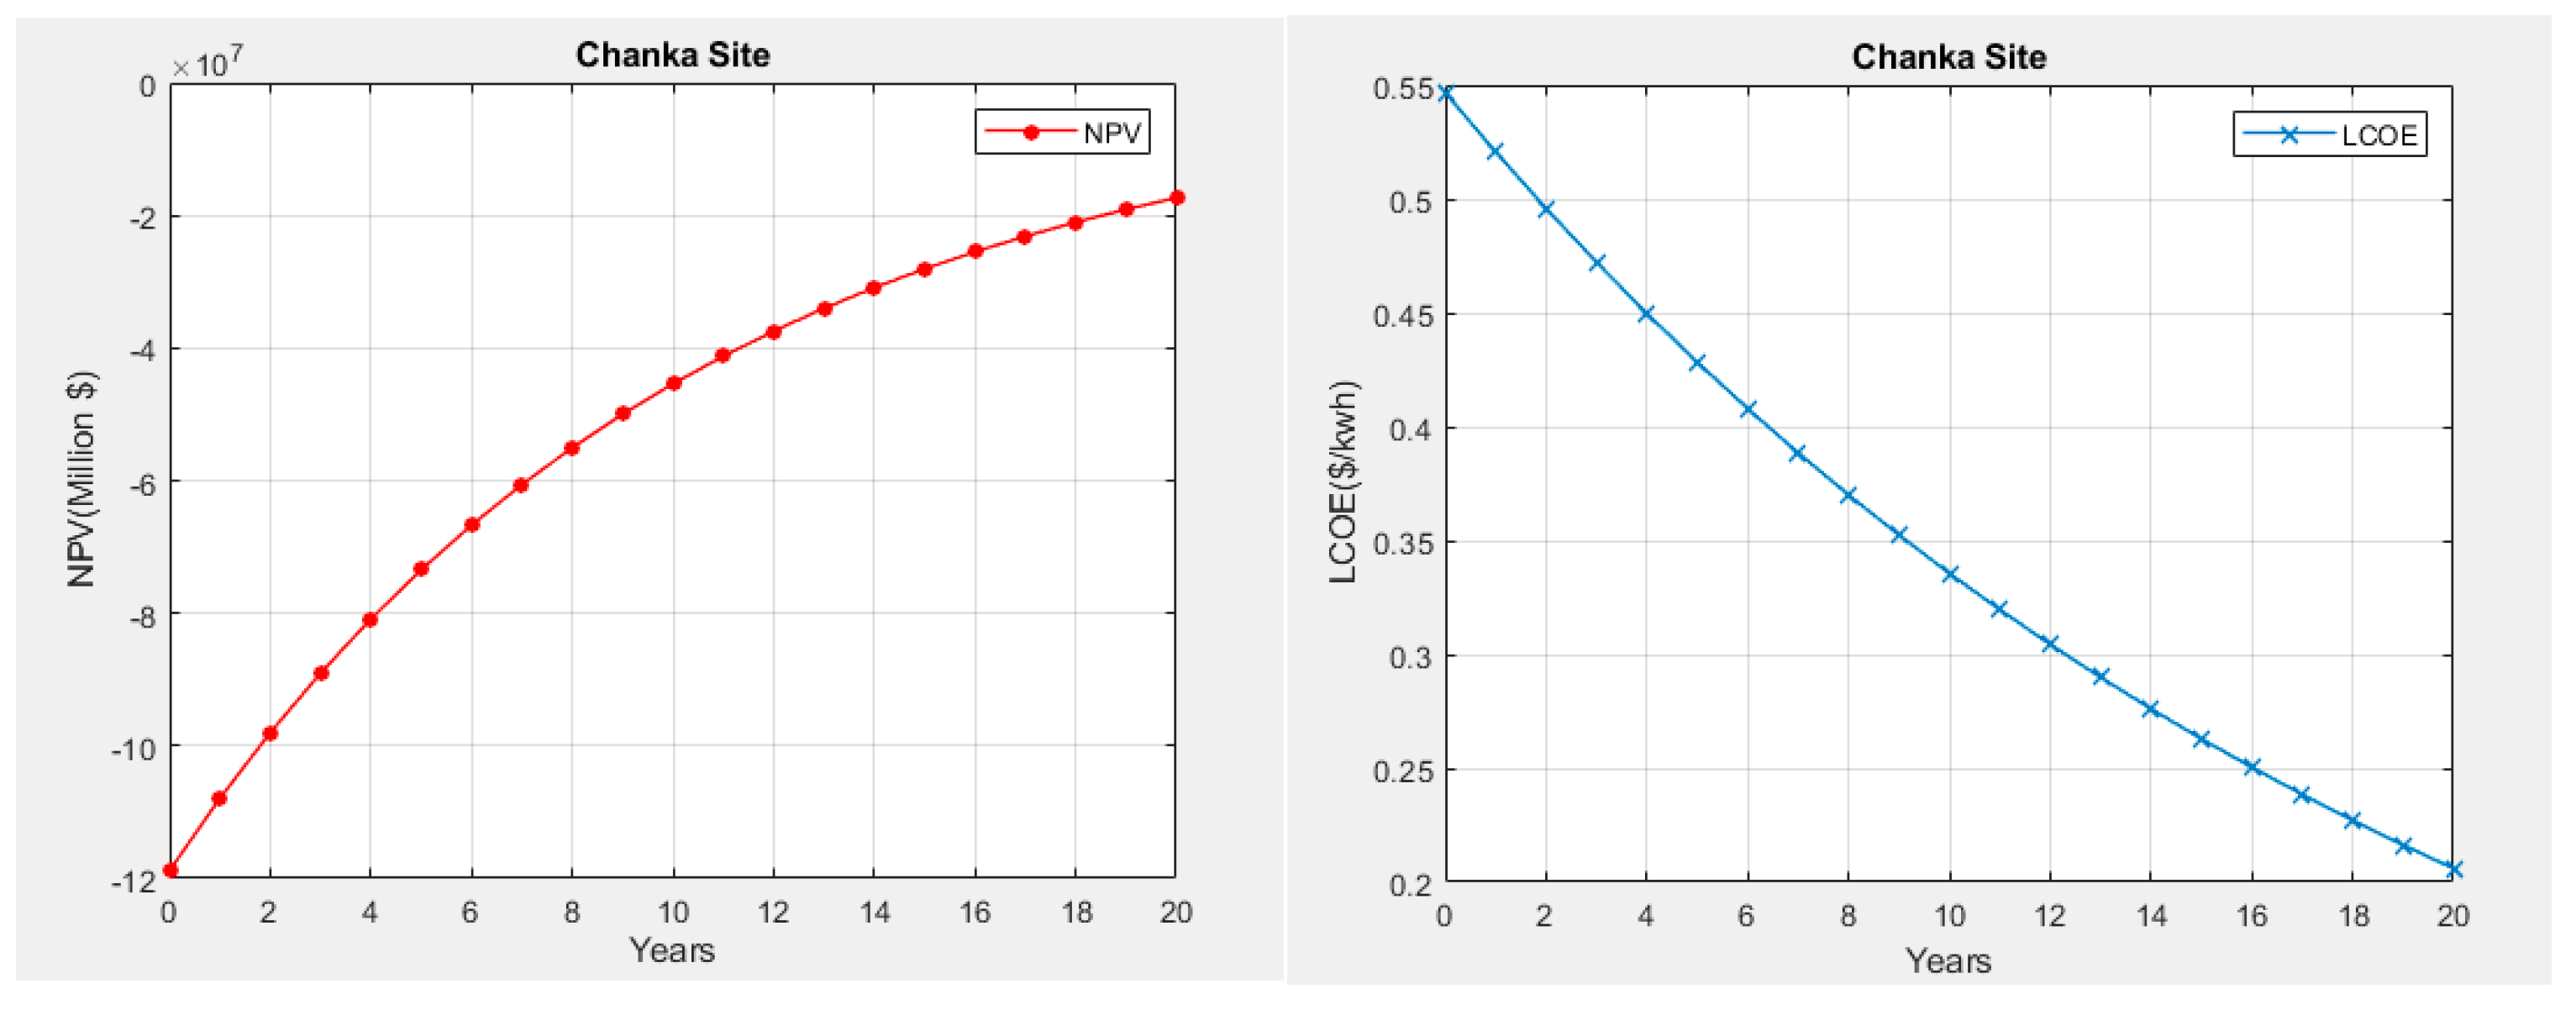
Figure 12.
Average electricity tariff ($0.07/ kWh) and ($0.547/ kWh) sensitivity analysis for Chanka.
Figure 12.
Average electricity tariff ($0.07/ kWh) and ($0.547/ kWh) sensitivity analysis for Chanka.
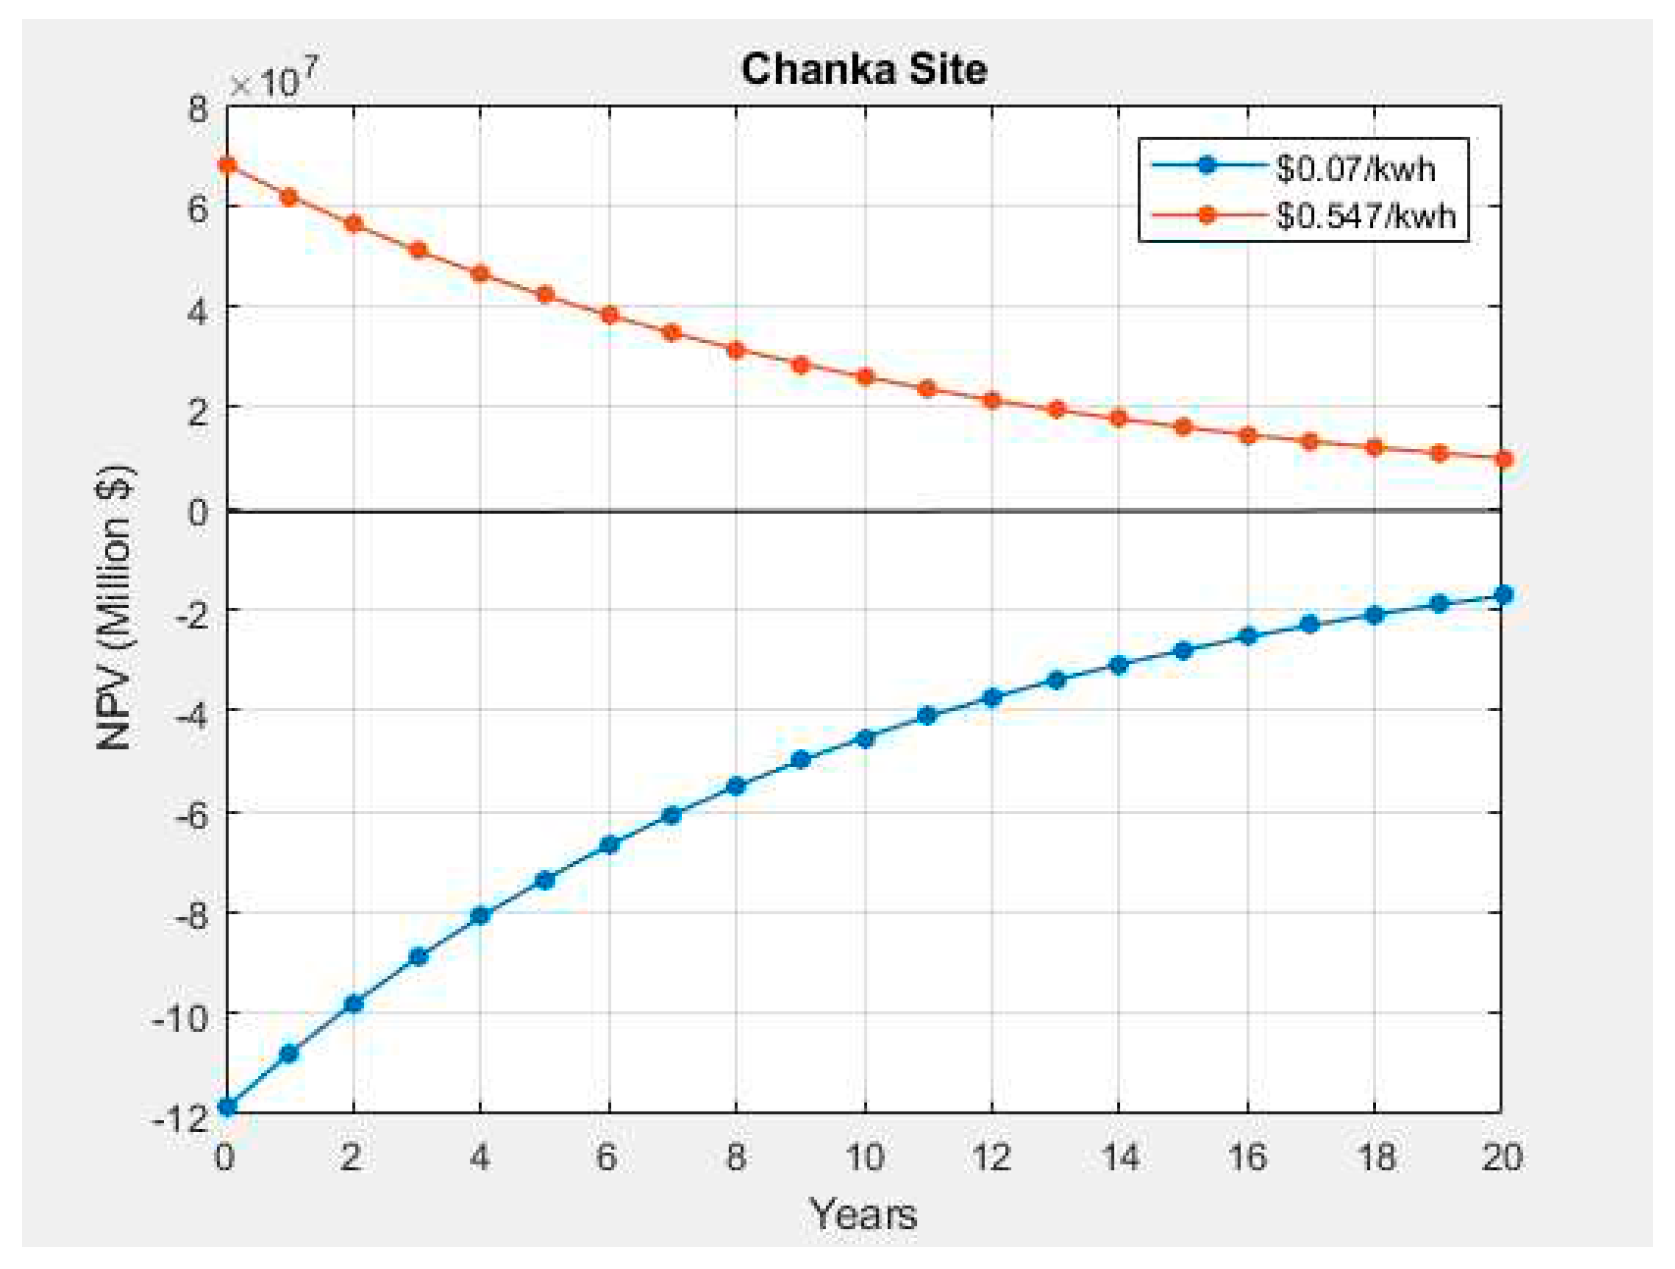
Figure 13.
Wind turbine economics at $0.07/ kWh electricity tariff for Petauke site.
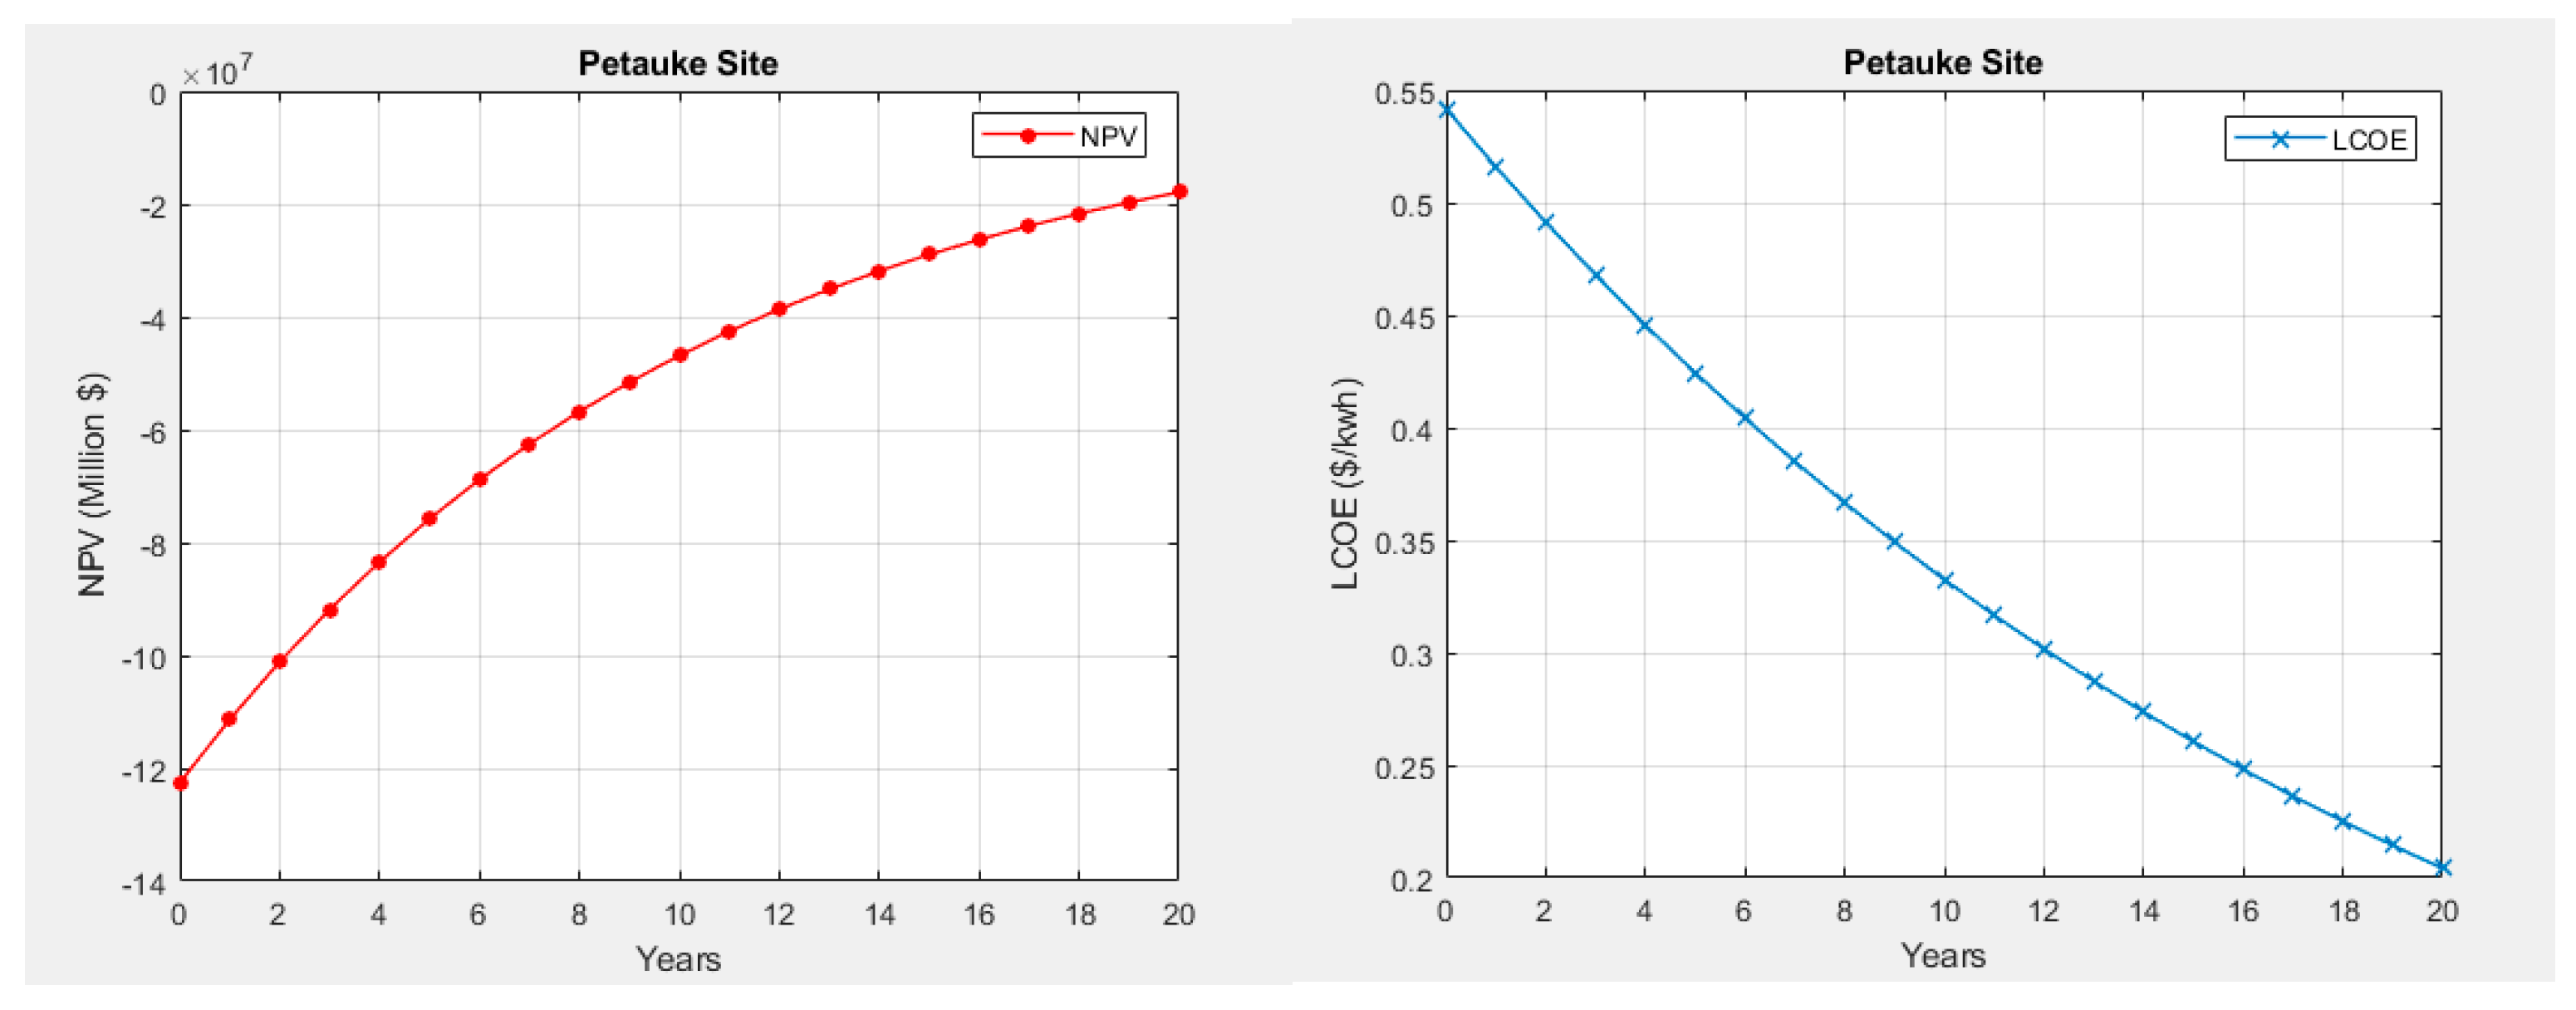
Figure 14.
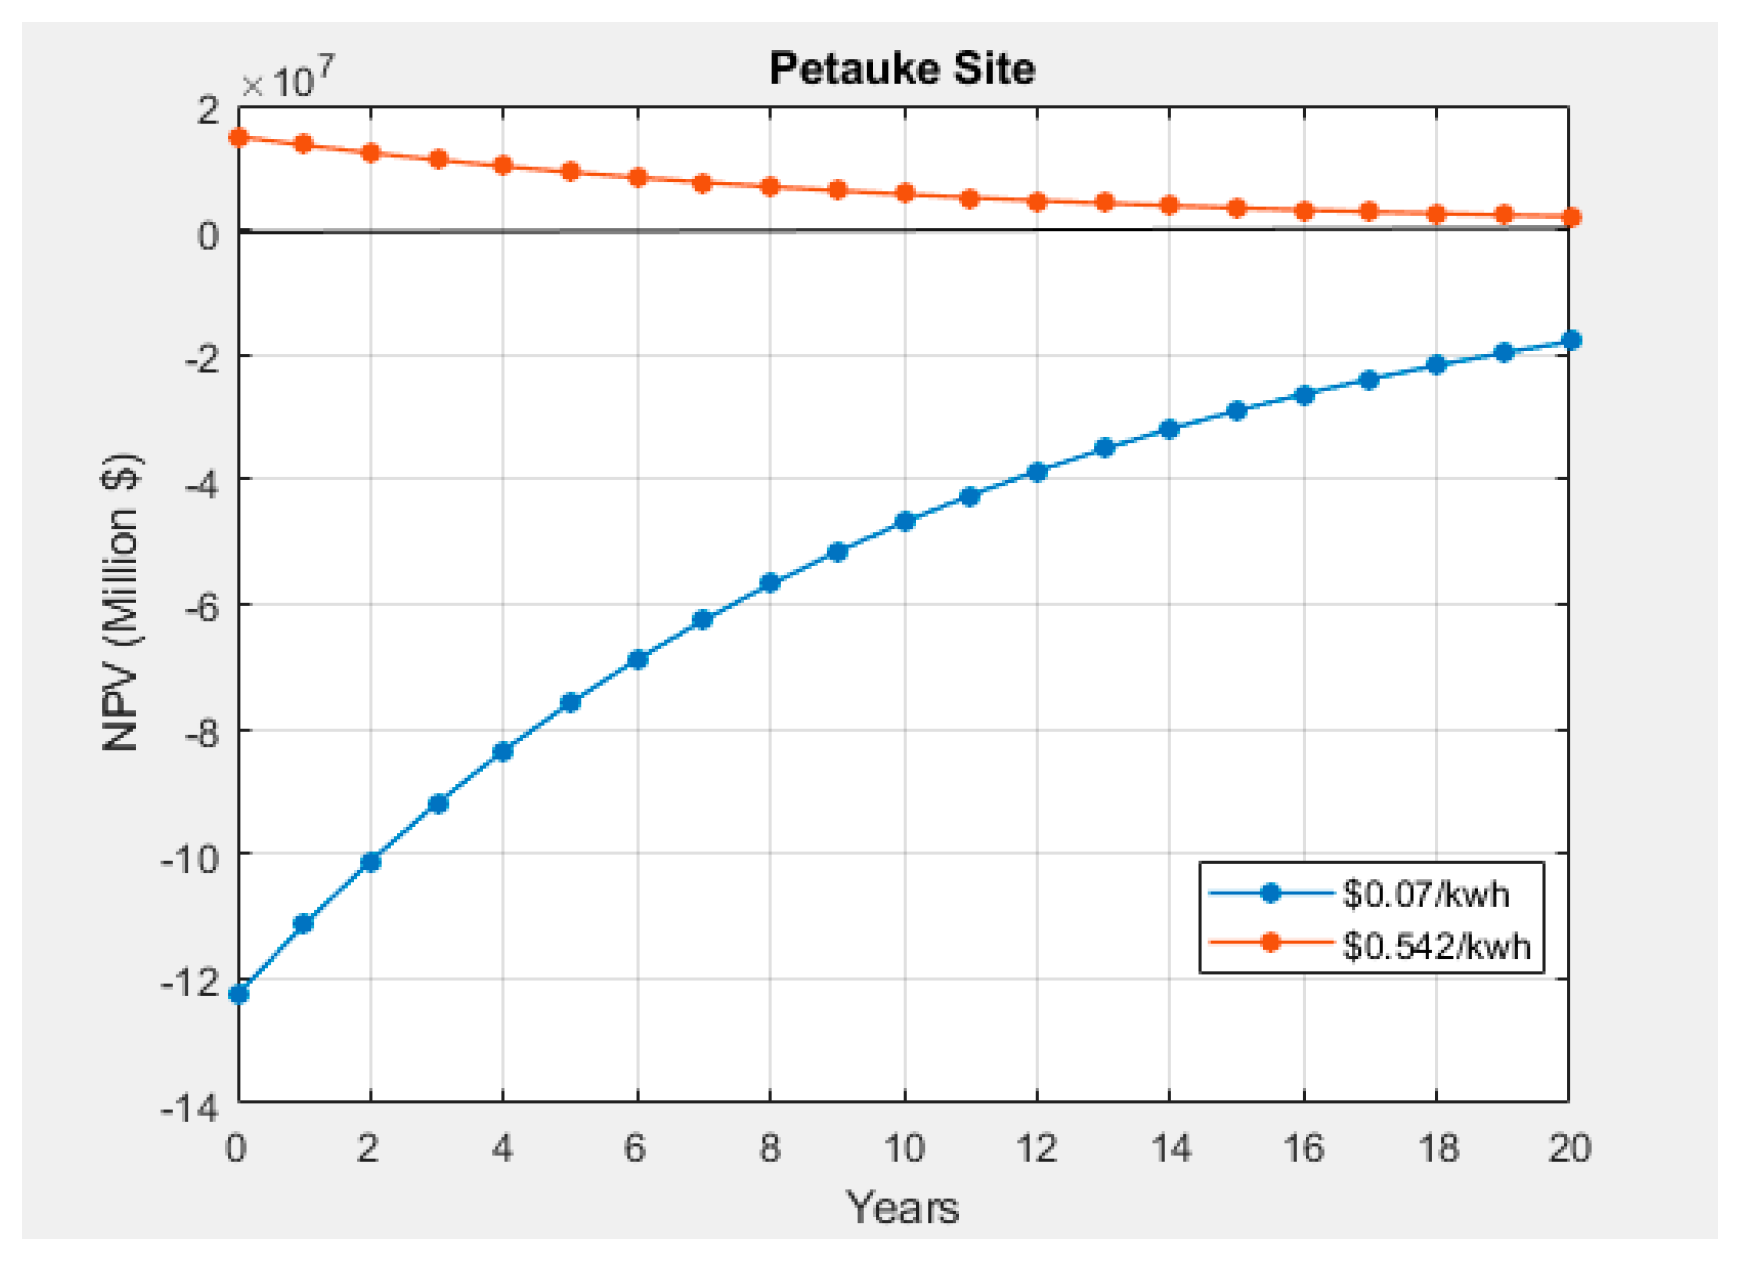
Figure 15.
Wind turbine economics at $0.07/ kWh electricity tariff for Mansa site.
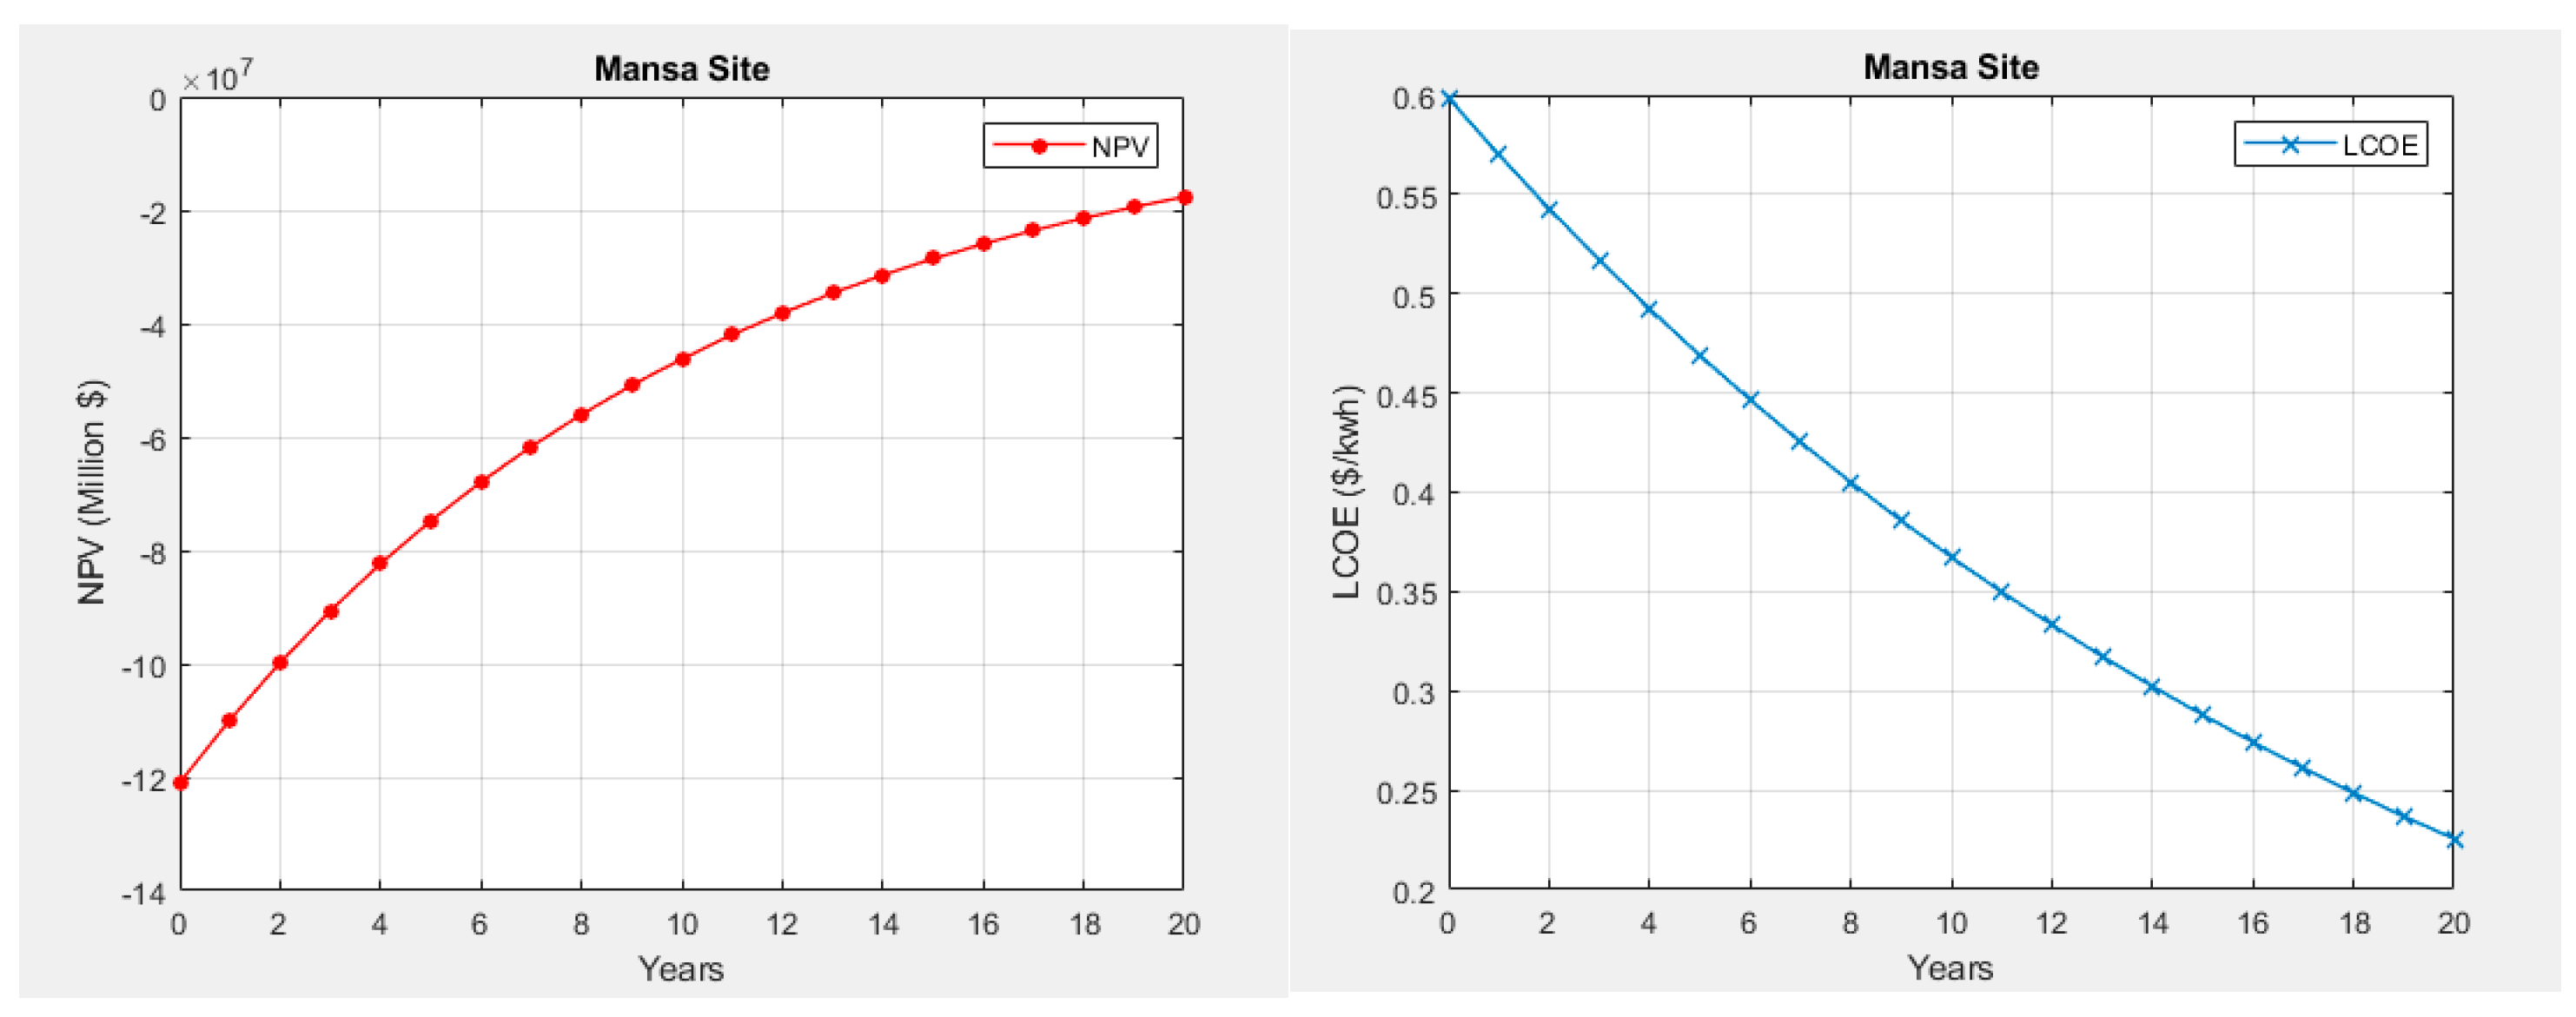
Figure 16.
Average electricity tariff ($0.07/ kWh) and ($0.599/ kWh) sensitivity analysis for Mansa.
Figure 16.
Average electricity tariff ($0.07/ kWh) and ($0.599/ kWh) sensitivity analysis for Mansa.
Figure 16.
Wind turbine economics at $0.07/ kWh electricity tariff for Malawi site.
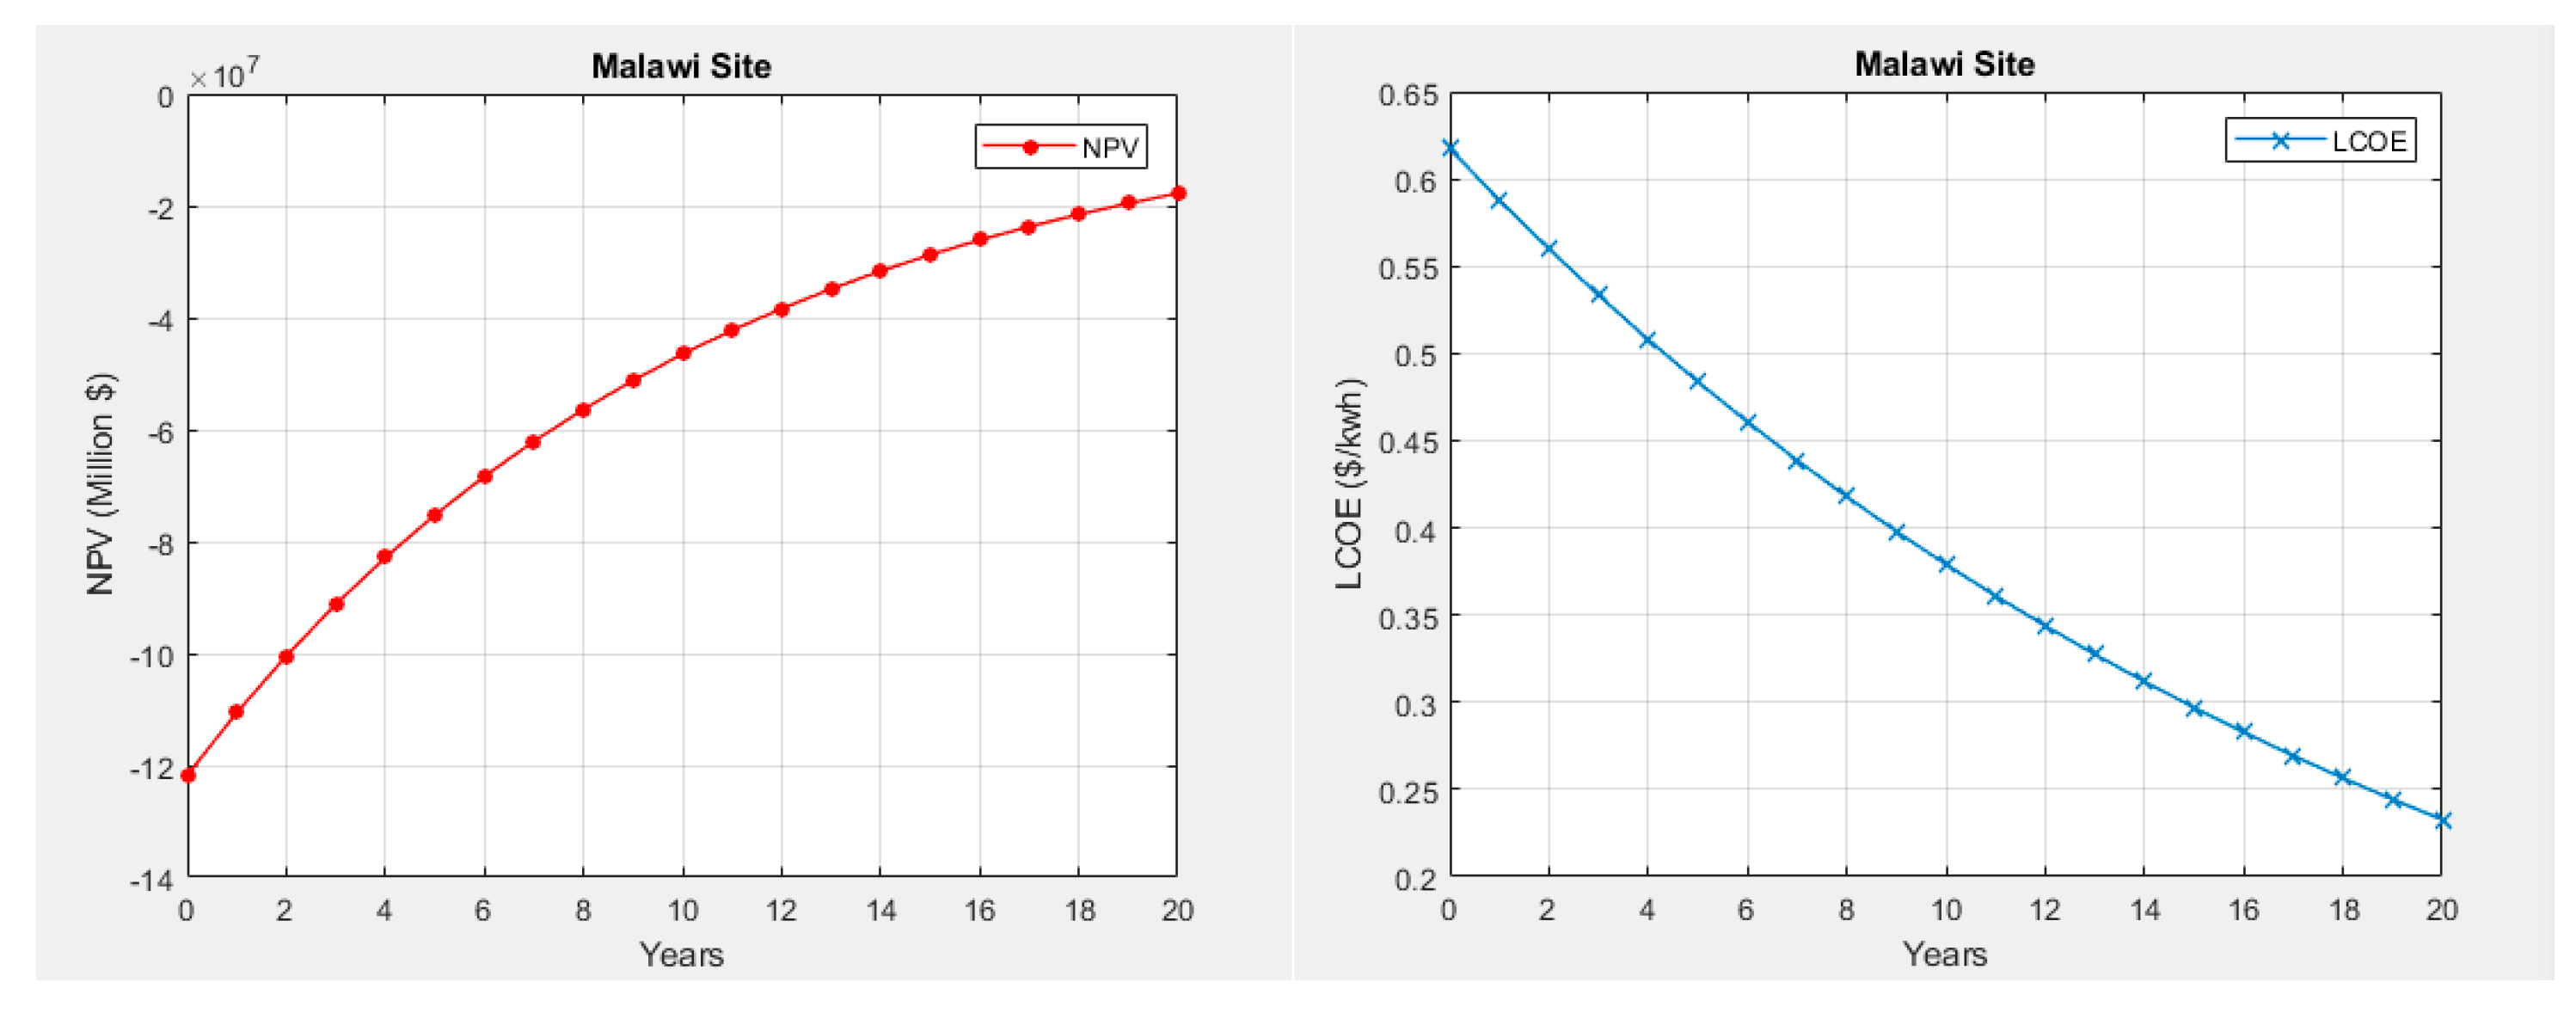
Figure 17.
Average electricity tariff ($0.07/ kWh) and ($0.617/ kWh) sensitivity analysis for Malawi.
Figure 17.
Average electricity tariff ($0.07/ kWh) and ($0.617/ kWh) sensitivity analysis for Malawi.
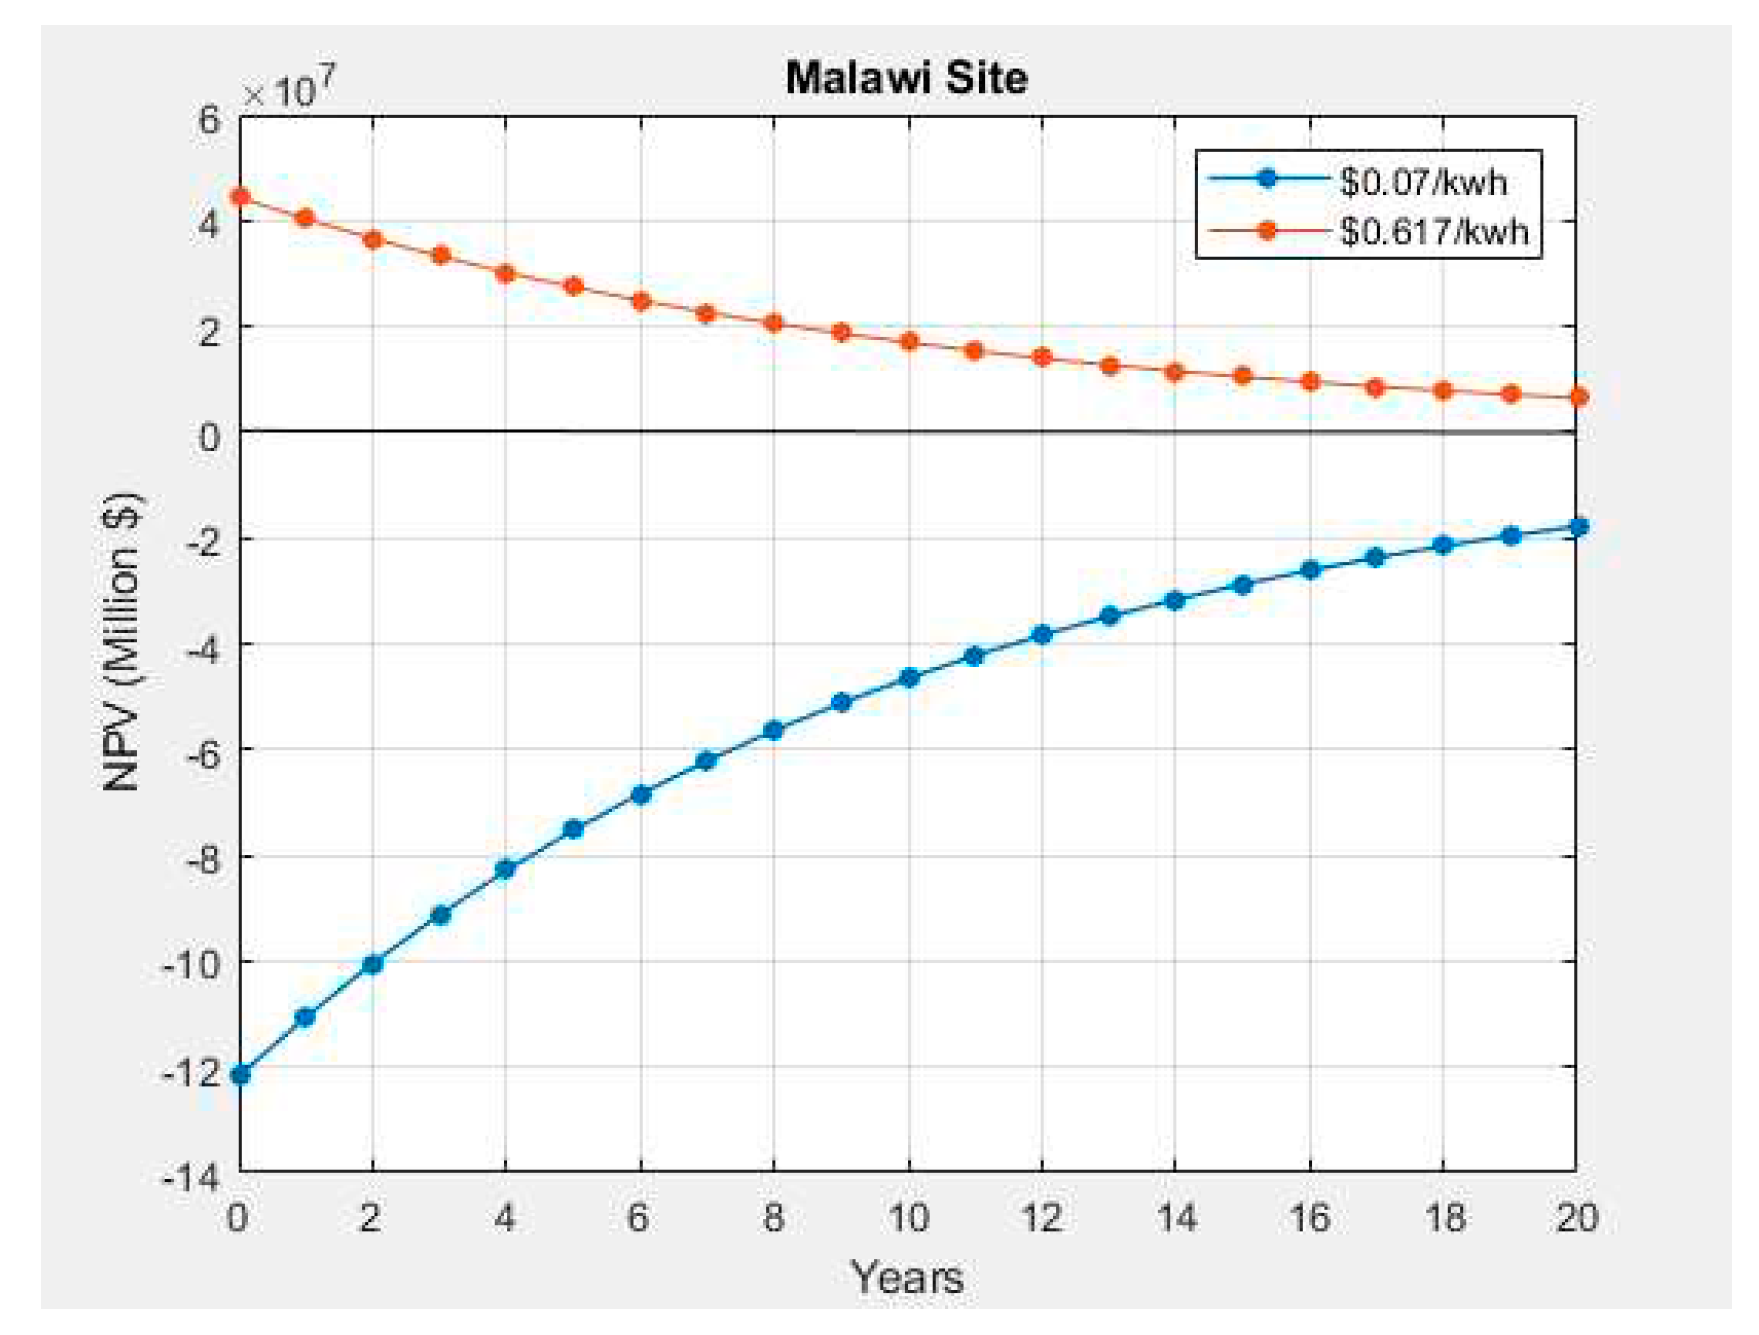
Figure 18.
Parameter estimations of the sites; (a) EYA & Wind Speed; (a) EYA & CF; (b) SPP & IRR; (d) IRR & PBP.
Figure 18.
Parameter estimations of the sites; (a) EYA & Wind Speed; (a) EYA & CF; (b) SPP & IRR; (d) IRR & PBP.
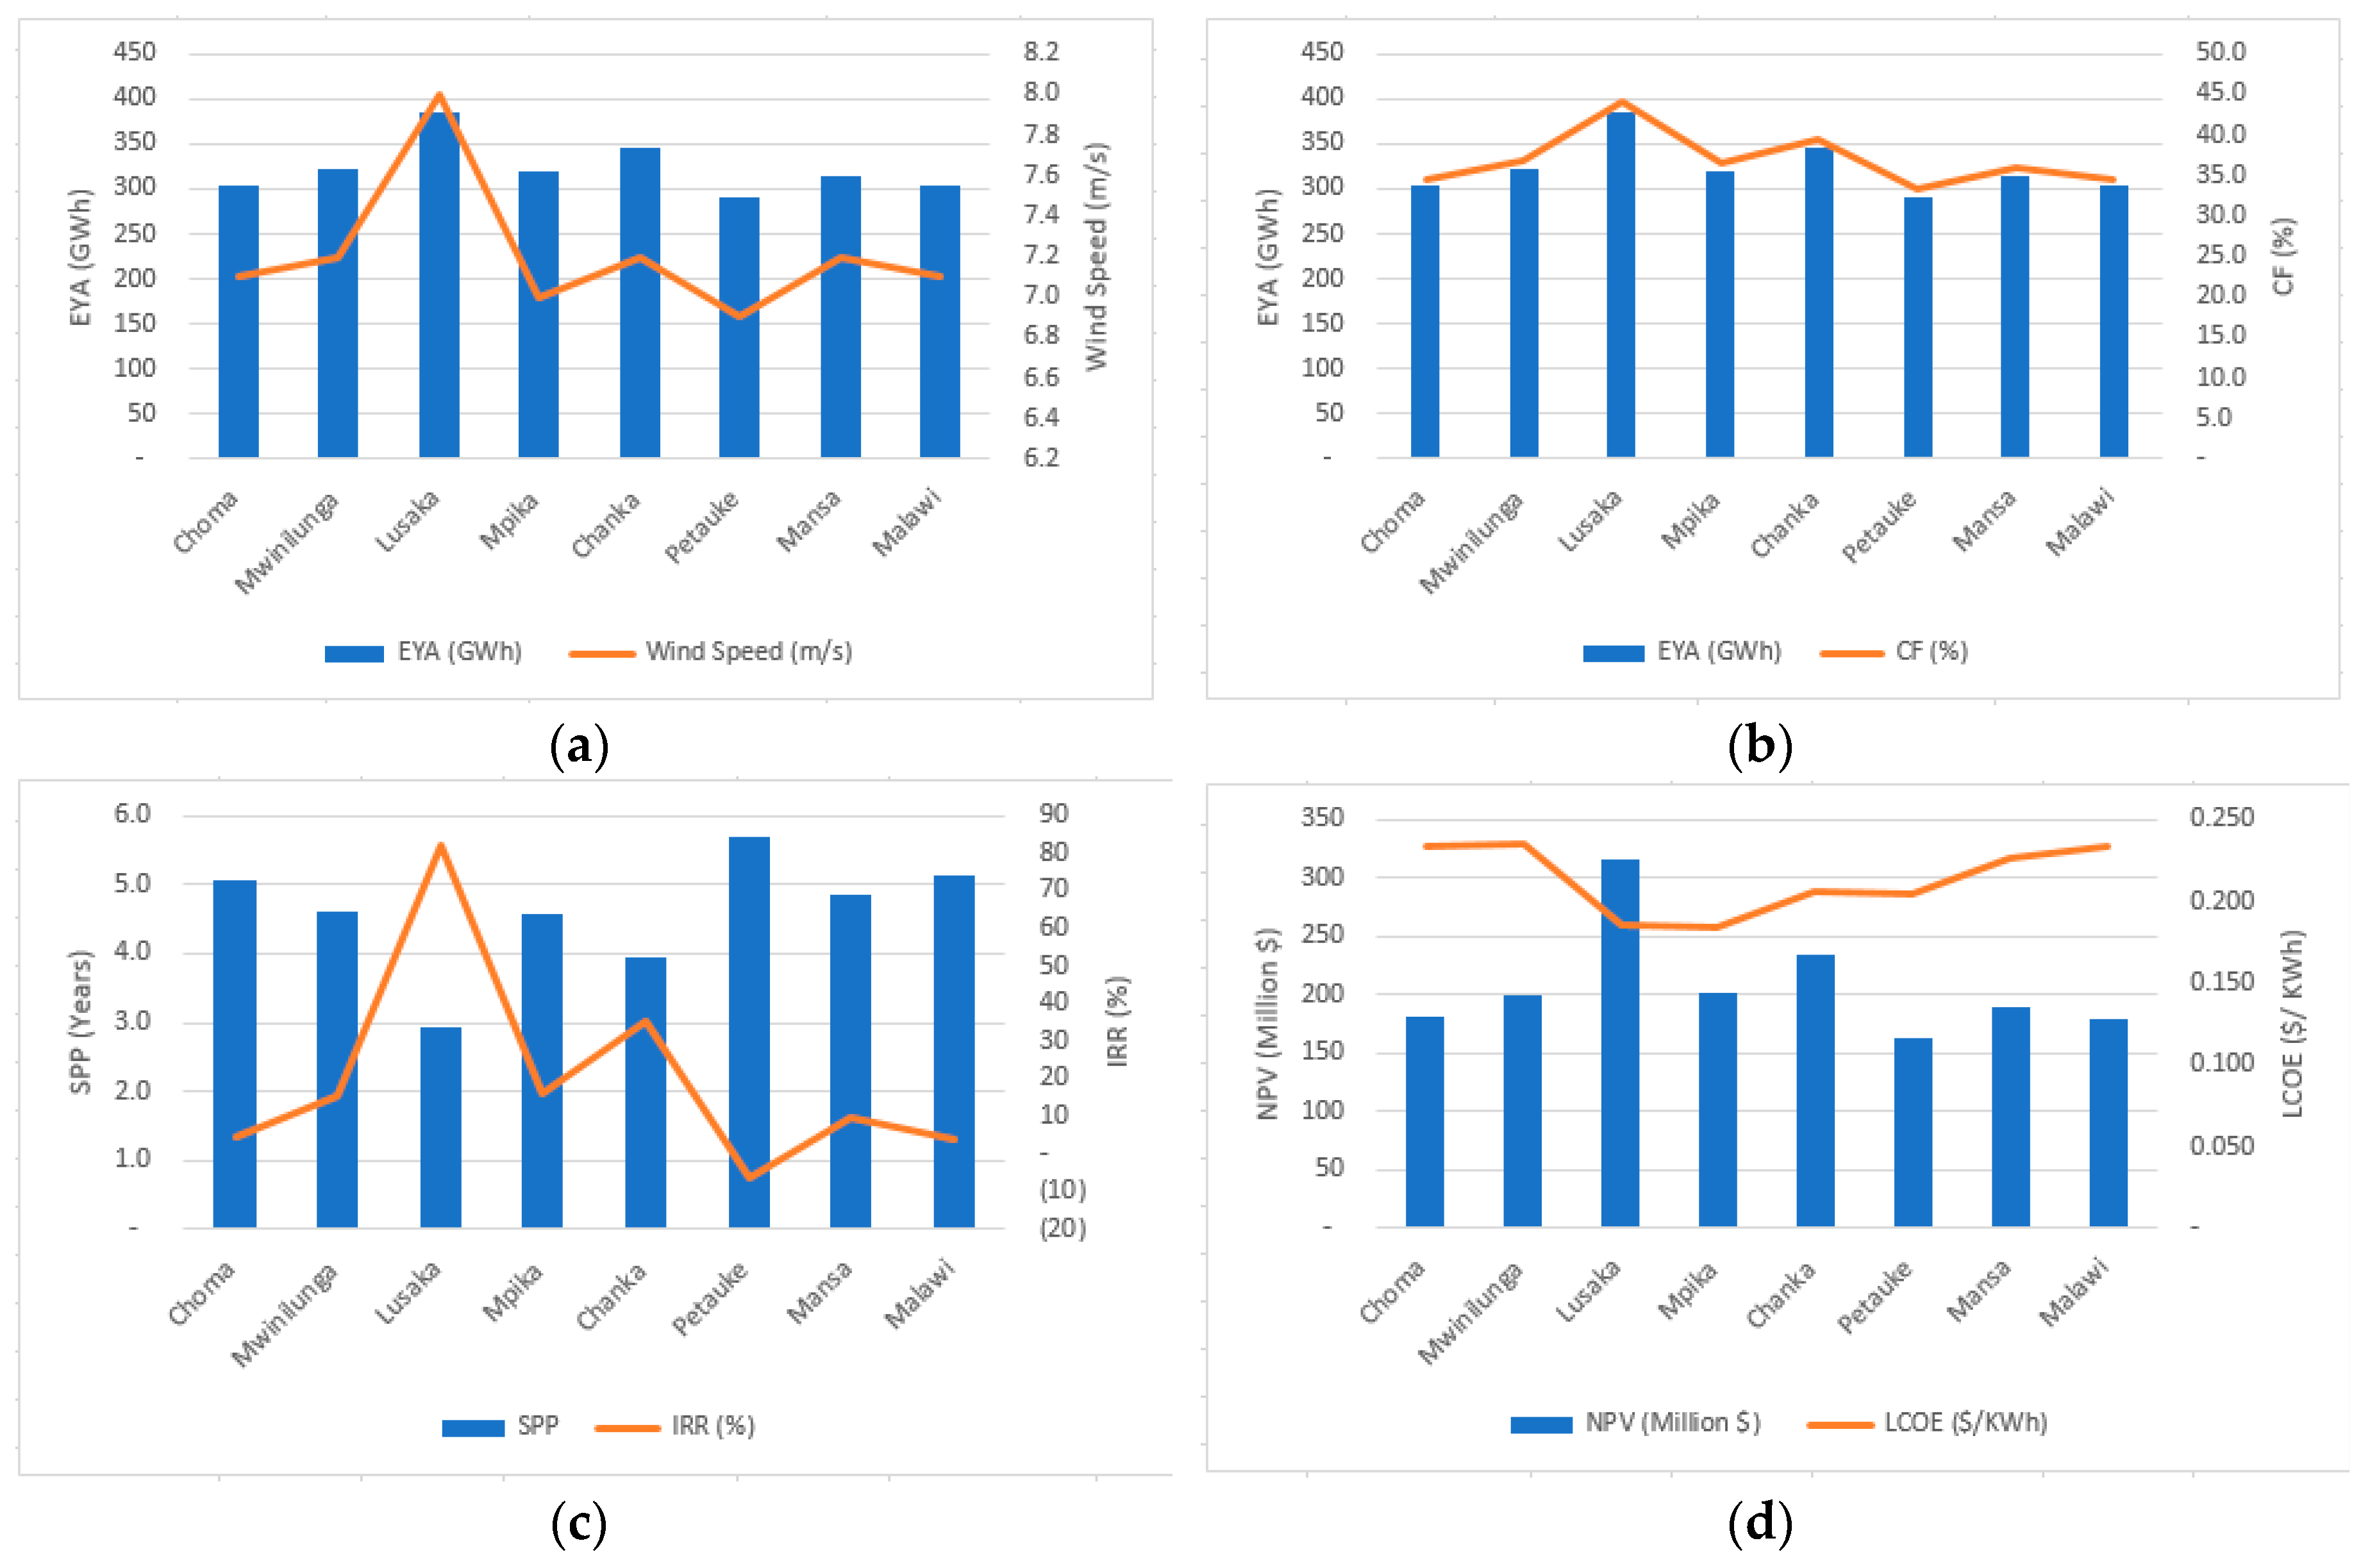

Table 1.
Site descriptions [40].
Table 1.
Site descriptions [40].
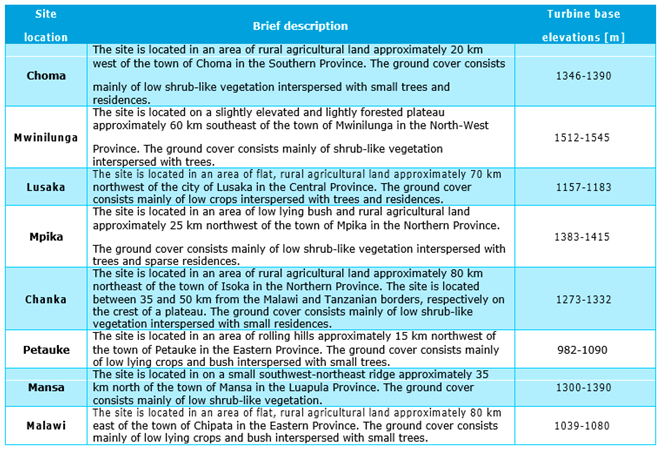 |
Table 2.
Proposed turbine model parameters [40].
Table 2.
Proposed turbine model parameters [40].
| Valid PC | |||||||||||||||||
| Turbine | Rated power | Hub height [m] | Peak power | Valid PC density | turbulence | ||||||||||||
| [MW] | coefficient [Cp] | [kg/m3] | intensity range | ||||||||||||||
| [%] | |||||||||||||||||
| Generic 4 MW | 4.0 | 130 | 0.44 | 1.225 | 6-12 | ||||||||||||
Table 3.
Average long-term hub height wind speed estimates at the turbine locations.
| Site | Average turbine wind speed at 130m (m/s) |
| Choma | 7.1 |
| Mwinilunga | 7.2 |
| Lusaka | 8.0 |
| Mpika | 7.0 |
| Chanka | 7.2 |
| Petauke | 6.9 |
| Mansa | 7.2 |
| Malawi | 7.1 |
Table 4.
Energy production summary [40].
Table 4.
Energy production summary [40].
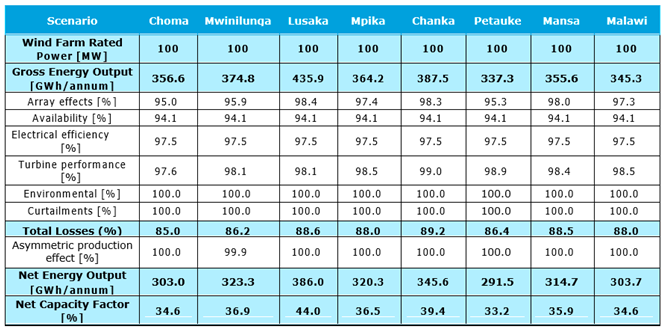 |
Table 5.
Summary of financial assumptions.
| Parameter | Value |
| Corporate tax (%) | 5 |
| Depreciation period (Years) | 20 |
| Depreciation method | linear approximation |
| Depreciation period (%) | 5 |
| Operations period (Years) | 20 |
| Real interest rate (%) | 10.1 |
| Electric tariff ($/ KWh) | 0.07 [44] |
Table 6.
Wind turbine tower’s cost estimation parameters [35].
Table 6.
Wind turbine tower’s cost estimation parameters [35].
| Monopole-Type Foundation | |
| Parameter | Value |
| Height(m) | 130[39] |
| Steel cost | 0.64 |
| Steel density (kg/m3 ) | 7870 |
| Monopole diameter | 5.5695 |
| Monopole thickness | 0.075 |
Table 7.
Techno-economic parameters.
| Wind turbine model | Optimum Hub Height (m) | AEP (GWh) | CF (%) | NPV (Million $) | IRR(%) | LCOE ($/kWh) |
SPP (Years) |
|
| 4 MW generic wind turbine | 130 | 303.0 | 34.6 | - 104,619,341 | 4.87 | 0.233 | - 9 | |
Table 8.
Techno-economic parameters.
| Wind turbine model | Optimum Hub Height (m) | AEP (GWh) | CF (%) | NPV (Million $) | IRR(%) | LCOE ($/kWh) | SPP (Years) |
| 4 MW generic wind turbine | 130 | 323.3 | 36.9 | - 105,555,910 | 15.4 | 0.235 | - 9 |
Table 9.
Techno-economic parameters.
| Wind turbine model | Optimum Hub Height (m) | AEP (GWh) | CF (%) | NPV (Million $) | IRR(%) | LCOE ($/kWh) | SPP (Years) |
| 4 MW generic wind turbine | 130 | 386.0 | 44.0 | - 49,052,832 | 82.1 | 0.185 | - 19 |
Table 10.
Techno-economic parameters.
| Wind turbine model | Optimum Hub Height (m) | AEP (GWh) | CF (%) | NPV (Million $) | IRR(%) | LCOE ($/kWh) | SPP (Years) |
| 4 MW generic wind turbine | 130 | 320.3 | 36.5 | - 101,505,602 | 16.1 | 0.184 | - 9 |
Table 11.
Techno-economic parameters.
| Wind turbine model | Optimum Hub Height (m) | AEP (GWh) | CF (%) | NPV (Million $) | IRR(%) | LCOE ($/kWh) |
SPP (Years) |
| 4 MW generic wind turbine | 130 | 345.6 | 39.4 | - 92,088,088 | 35.3 | 0.206 | - 10 |
Table 12.
Techno-economic parameters.
| Wind turbine model | Optimum Hub Height (m) | AEP (GWh) | CF (%) | NPV (Million $) | IRR(%) | LCOE ($/kWh) |
SPP (Years) |
| 4 MW generic wind turbine | 130 | 291.5 | 33.2 | - 113,363,194 | - 6.4 | 0.204 | - 8 |
Table 13.
Techno-economic parameters.
| Wind turbine model | Optimum Hub Height (m) | AEP (GWh) | CF (%) | NPV (Million $) | IRR(%) | LCOE ($/kWh) |
SPP (Years) |
| 4 MW generic wind turbine | 130 | 314.7 | 35.9 | - 107,314,348 | 9.7 | 0.226 | - 9 |
Table 14.
Techno-economic parameters.
| Wind turbine model | Optimum Hub Height (m) | AEP (GWh) | CF (%) | NPV (Million $) | IRR(%) | LCOE ($/kWh) |
SPP (Years) |
| 4 MW generic wind turbine | 130 | 303.7 | 34.6 | - 107,718,668 | 3.7 | 0.233 | - 9 |
Table 15.
Techno-economic parameters.
| Site | Wind Speed (m/s) | AEP (GWh) | CF (%) | NPV ($) | IRR(%) | LCOE ($/kWh) |
SPP (Years |
| Choma | 7.1 | 303.0 | 34.6 | 182,139,859 | 4.87 | 0.233 | 5.1 |
| Mwinilunga | 7.2 | 323.3 | 36.9 | 200,415,210 | 15.4 | 0.235 | 4.6 |
| Lusaka | 8.0 | 386.0 | 44.0 | 316,257,568 | 82.1 | 0.185 | 2.9 |
| Mpika | 7.0 | 320.3 | 36.5 | 201,626,318 | 16.1 | 0.184 | 4.6 |
| Chanka | 7.2 | 345.6 | 39.4 | 234,987,752 | 35.3 | 0.206 | 3.9 |
| Petauke | 6.9 | 291.5 | 33.2 | 162,512,406 | (6.40) | 0.204 | 5.7 |
| Mansa | 7.2 | 314.7 | 35.9 | 190,517,732 | 9.7 | 0.226 | 4.9 |
| Malawi | 7.1 | 303.7 | 34.6 | 179,703,012 | 3.7 | 0.233 | 5.1 |
Disclaimer/Publisher’s Note: The statements, opinions and data contained in all publications are solely those of the individual author(s) and contributor(s) and not of MDPI and/or the editor(s). MDPI and/or the editor(s) disclaim responsibility for any injury to people or property resulting from any ideas, methods, instructions or products referred to in the content. |
© 2023 by the authors. Licensee MDPI, Basel, Switzerland. This article is an open access article distributed under the terms and conditions of the Creative Commons Attribution (CC BY) license (http://creativecommons.org/licenses/by/4.0/).
Copyright: This open access article is published under a Creative Commons CC BY 4.0 license, which permit the free download, distribution, and reuse, provided that the author and preprint are cited in any reuse.


