
Submitted:
10 October 2023
Posted:
11 October 2023
You are already at the latest version
Abstract
This study examined the effect of the media usage environment, particularly TV and mobile devices, on advertisement acceptance, lifestyle, and psychological satisfaction. Hypothesis pathways and comparative structural mediating effects were analyzed. Media and Consumer Research public data were used for empirical analysis. A total of 6,640 people who participated in sports activities were included in the study. The results demonstrated that TV and mobile device usage environments had similar effects on advertisement acceptance. While TV did not influence the pursuit of personal life, mobile device use environments affected the pursuit of personal life. Mobile device use environments had a greater effect on individual psychological satisfaction than TV. Adoption had a mediating effect on the influence of media usage environments on the pursuit of personal life. The pursuit of a personal life had a significant mediating effect on the influence of media use environments on psychological stability. This study revealed no differences in the effects of new and traditional media on advertisement acceptance, while new media had a greater influence on lifestyle and psychological satisfaction.
Keywords:
media use
; uses and gratification
; advertisement acceptance
; life value
; mental health
; psychological satisfaction
; public data policy
; media strategy
; media politics
1. Introduction
In modern society, media consumption is an important factor in increasing mental health and satisfaction [1]. In the context of the COVID-19 pandemic, media use became an important factor affecting mental health [2,3]. People consciously or unconsciously use media for their mental health. The purpose and motive of media use reflect psychological satisfaction, where psychological expectations are satisfied through media consumption, such as information reception, entertainment component, intellectual acceptance, and social capital formation. Therefore, media consumption includes psychological activities [4].
Most people selectively use media to achieve a purpose, as explained by the theory of uses and gratifications, which addresses the audience’s involvement in the communication process [5]. This study avoided one-dimensional purposes of media use, such as entertainment and information acquisition, and focused on higher-dimensional purposes, such as mental health and psychological satisfaction.
Research on the influence of media on psychological experiences and mental health has progressed considerably, including media [6], sociology [7], education [8], psychological and psychiatric [9], and convergence research. This was a cross-sectional study on the relationship between media and mental health with a theoretical model based on media theories.
The use and gratification theory assumes that media users pursue specific goals. This study considered psychological satisfaction as the purpose of media use. Therefore, this study selected active people striving to achieve psychological goals and pursuing life and psychological satisfaction. However, activities were limited to watching sports media content and participating in sports, as these activities improve the quality of life.
Sports participants pursue physical and mental pleasure and fulfillment through sports [10]. Therefore, people who participate in sports can be seen as actively practicing their quality of life. Therefore, people who consumed sports content were considered active media audiences. This study used the use and gratification theory to examine the effects of media environments on mental health and explore advertisement acceptance and individual life pursuit as moderating variables.
The expectancy-value theory in media divides the concept of gratification into sought and acquired gratification and applies the rational behavior model [11], which explains the correlation between attitude and behavior. According to the expectation-value theory, factors determining media use are based on judgments of expected value [12]. Choosing traditional or mobile media is based on expected values.
Dependence on media increased in modern life [13], with media being essential in people’s lives [14]. In addition, consumption of mobile media using smartphones is increasing, and media dependence increased due to the COVID-19 pandemic, requiring an investigation of empirical life changes based on the media consumption environment.
The traditional media environments—where groups of people watch TV—have a different influence on people’s lives than the personalized mobile media environment. This study examined psychological attitude changes based on media environments. The media use environment was the independent variable, while psychological life satisfaction, which can be considered a measure of mental health, was the dependent variable. Advertisement acceptance and individual life pursuit were considered mediators.
This study used public data managed at the national level, which has recently been encouraged in academic research [15] and applied in various fields [16,17,18]. However, the public empirical scale area remains under-investigated.
Korea Broadcast Advertising Corp. (KOVACO) oversees all broadcasting, communication, and advertising in South Korea. Open public data are integrated and managed through the national public data portal (https://www.data.go.kr). This media and consumer research (MCR) is the largest and most credible media behavior survey in Korea. Nationally, public data are recommended for policy establishment and practical use by companies and academic applications. Raw data, processing information, periodic reports, and manuals are provided. This study conducted an empirical analysis using public datasets, which contributes to the generalization of results.
This study examined the effect of TV and mobile device media use environments on psychological life satisfaction, advertisement acceptance, lifestyle, and mental health.
2. Background, Research Hypotheses, and Model
2.1. Public Data for MCR
Recently, there was a shift from an information to a hyper-connected society. While data used to be regarded as a basic element of information, with the rapid development of artificial intelligence technology, data after the 4th industrial revolution are becoming an economic asset and source of value creation [19]. Traditionally, behavioral analysis through mass data contributed to creating new value through business insight. Furthermore, state and public institutions attempt to provide new services to the public and make policy decisions using big data [20]. As there are no restrictions on usage rights, such data have been used as a public resource, defined as public data in this study. Therefore, public data include all shared data produced, held, and managed by central governments, local governments, and public institutions, including not only information directly produced by public institutions but also collected through outsourced production and donation [21].
Korea pursues public values, such as fulfilling rights to information and transparency in administration, using the Act on the Disclosure of Information by Public Institutions. Private use is encouraged by providing raw data in public datasets to improve convenience, expand businesses and jobs, and increase academic research. The governments of major countries actively implement open data policies. Korea enacted the Act on the Promotion of Provision and Use of Public Data in October 2013 and provides national data through a public data portal (https://www.data.go.kr).
The MCR dataset was used for analysis in this study. MCR was established in 1999 and has provided basic marketing data to help advertisers establish media strategies. It was converted into a public data source and used for policymaking, advertising strategy establishment, and academic research.
The database included men and women aged 13 to 64 in urban areas nationwide. The survey was conducted once per year between July and September. Each survey sample size was 4,000 to 5,000 people. Individual face-to-face interviews were conducted. The allocation sampling method based on population composition was used. The error range was ±1.5%p at a 95% significant level. Answers were provided on a Likert scale.

Table 1.
This is a table. Tables should be placed in the main text near to the first time they are cited.
Table 1.
This is a table. Tables should be placed in the main text near to the first time they are cited.
| Demographics | Media usage behavior |
Advertisement | Product use / purchase | Lifestyle |
|---|---|---|---|---|
| Characteristics* | Media contact rate Media evaluation* Information acquisition media by information type Hours of use by media Evaluation by a detailed channel Usage behavior for each media* Evaluation of media use Trust and influence medium |
Concentrate on advertising by media* Media selection by purchase stage Evaluation by advertising attribute medium Preferred advertising and advertising model Preferred advertising type Advertising interest by product |
Consumer purchasing behavior first upper airway Whether to use / purchase Brand used Favorite / mainly used brand Considerations when purchasing Advertising influence at the time of purchase Information channel for purchase / selection 1-month contact channel Intention to use continuously |
Overall life values* Psychological satisfaction* food finance Home appliances automobile Shopping behavior communication clothing |
* The survey factor of the adopted item.
2.2. Theoretical Background and Hypotheses
This study adopting the research factor from the classification range in the MCR manual. Five experts tested the extracted items for content, construct, and discriminant validity. This study utilized the use and gratification theory (Re) of media use and the rational behavior model (Re) of behavioral science. Based on the theory of media effects, media significantly influences users (Media Effect; Strong Theory; Medium Theory). In addition, media influences individual psychology and mental health [22].
People perceive and understand society through media, and media use is expressed through individual actions and changes in society [23]. Media research can be divided into attribution studies on content and creative and media channel studies [24]. This study examined the influence of medium characteristics; therefore, the independent variable was set to distinguish media channel properties. A company induces responses to advertisements and media content presented through the media [25]. Broadcasting and advertising constitute a positive mutually dependent relationship, and the acceptability of advertisements increases without viewer awareness [26]. Therefore, this study examined the influence of media environments, particularly traditional TV media and new mobile media, on advertisement acceptance. The following hypotheses were proposed:
Hypothesis H1.
Media use environment positively influences advertisement acceptance
H1-a.
TV use positively influences advertisement acceptance.
H1-b.
Mobile use positively influences advertisement acceptance.
The hierarchical effect model explains the effect of media communication, which includes delivering information or content, changing perceptions and attitudes, and triggering behavior. Communication effectiveness is explained by various communication components, such as sender effect, receiver theory, content theory, and media type. As this study used public data, effects based on media type were analyzed without limiting specific programs or content. The media path effect was used to determine the effect on life’s Lyle. The activities, interests, and opinions (AIO), value and lifestyle survey (VALS), and list of value (LOV) were used as representative lifestyle measurements [27,28]. This study examined individual life pursuit values, including opinions on individual life values, which encompass single-families, the pursuit of individual life, and the importance of married people’s personal life. Media and lifestyle integration studies include content production feedback, product production, advertisement production, and social policy decisions. Research on personal life and pursuit value based on media used has been conducted in various fields [29]. The following hypothesis was proposed:
Hypothesis H2.
Media use environment positively influences individual life pursue.
H2-a.
TV use positively influences individual life pursue.
H2-b.
Mobile use positively influences individual life pursue.
Psychological satisfaction is a subjective feeling of happiness and satisfaction, which is influenced by psychological and environmental factors and is an essential factor in determining mental health [30]. Research has demonstrated the direct relationship between media use and mental health. Convergence research on psychiatric treatments using gamification had been conducted [28]. The following hypothesis was proposed:
Hypothesis H3.
Media use environment positively influences mental health.
H3-a.
TV use positively influences psychological satisfaction.
H3-b.
Mobile use positively influences psychological satisfaction.
There is a growing body of evidence that the influence of advertisement acceptance on [29,31]. Advertising acceptance affects lifestyles. The use and gratification theory defines ‘seeking gratification’ as ‘gratification obtained through use’ [32] According to the expectation-value theory, lifestyle and advertisement acceptance can be interpreted as expectation-fulfillment, with media and advertisement acceptance having mutual influence [33]. The following hypothesis was proposed:
Hypothesis H4.
Advertisement acceptance positively influences individual life pursuit.
Lifestyle influences on mental health have been studied extensively [34,35]. An individual life is not a life satisfaction factor; however, actively and selectively pursuing an individualized life can improve the quality of life. The relationship between lifestyle and health has been investigated in behavioral science. Furthermore, lifestyle affects cognitive function [36]. Research on how lifestyle affects mental health has practical implications [37]. Lifestyle is a complex of human life consciousness, values, and personality and affects overall behavior [38] and mental health. Therefore, the following hypothesis was proposed:
Hypothesis H5.
Individual life pursuit positively influences psychological satisfaction.
3. Conceptual Model
A conceptual model was proposed (Figure 1).
Figure 1.
Conceptual model.
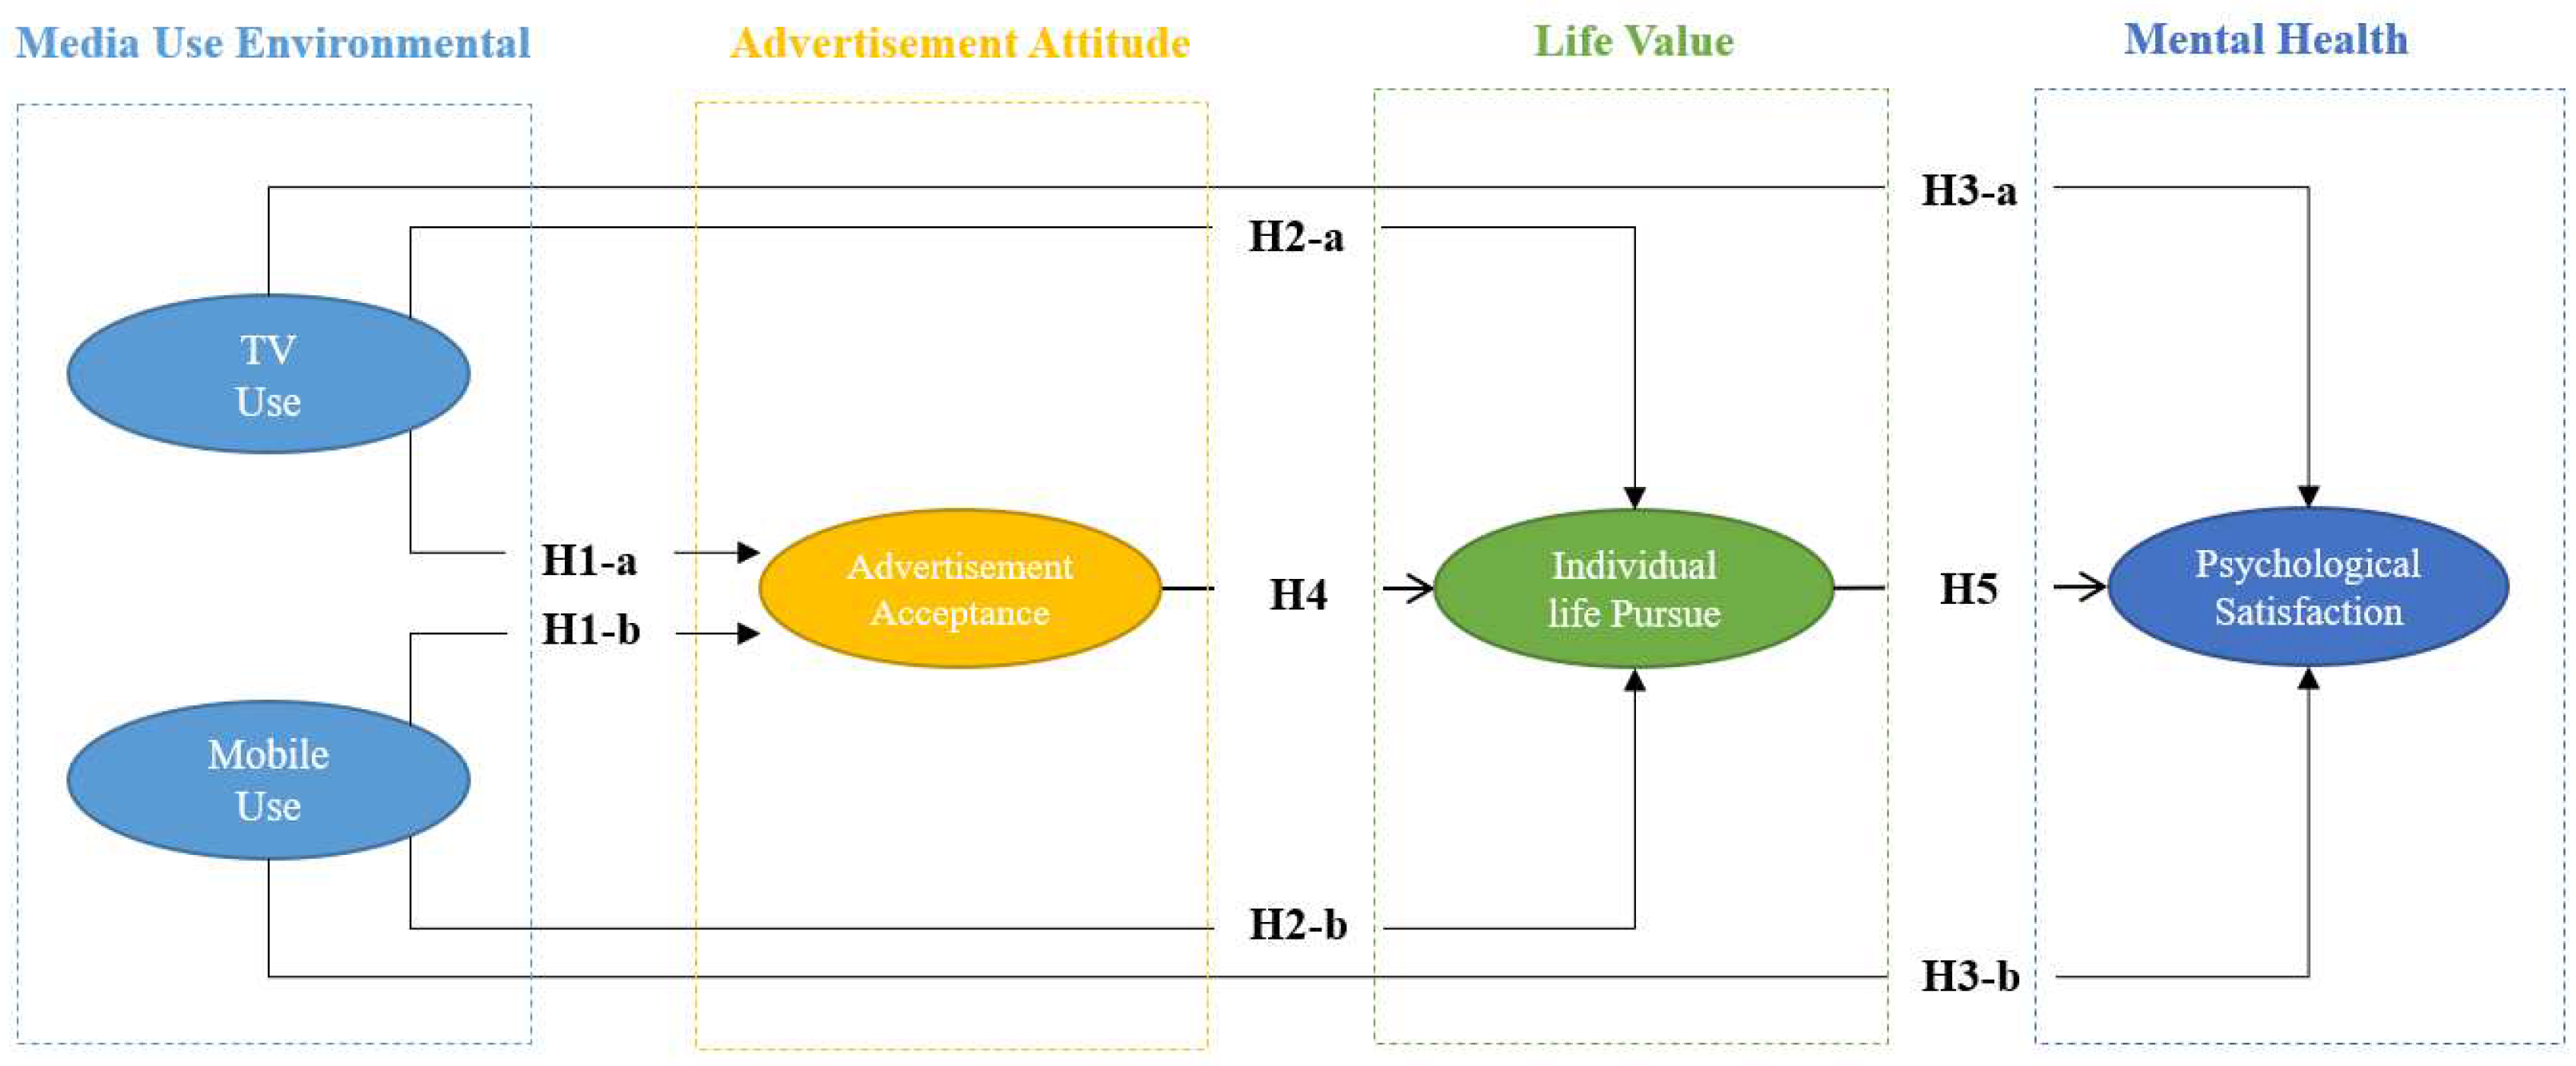
The model was tested using SEM. The independent variable was the media use environment, including TV and mobile media, and the dependent variable was mental health. The mediating variables were advertisement attitude and life value. Model characteristics were comparative analyses possible based on the media use environment, including media characteristics and dual mediating effects.
The preferred media use environment was measured. Attitudes and behaviors demonstrated consistent tendencies, indicating the actual media use environment. The advent of new media, such as the Internet and mobile devices, caused changes in the functions of existing media and individual life and society [39]. The media acts as an important environment that has a significant influence on daily lives [40]. This study investigated differences in the influence of traditional and new media.
Advertisement acceptance is the acceptance of media content, which is affected by the media preferences and information flow, and indicates how favorable the media environment is or how much focus is on media content [41]. Therefore, this study examined advertisement acceptance.
Lifestyle refers to individual behavioral aspects revealed externally. External behavior is a complex reflection of internal characteristics, such as motivation, learning, individual personality, and value system. Therefore, lifestyle synthesizes social and cultural factors and psychological characteristics that affect individual behavior [42]. Lifestyle includes individual values and beliefs; however, there are external influences [43]. The media usage environment is gradually becoming more personal, and the pursuit of individual life with privacy has expanded worldwide. Changes in social culture have been influenced by the media [44,45]. Therefore, this study examined the effect of media on lifestyle changes and life satisfaction.
In addition, psychological life satisfaction influences mental health [46]. Measurement items consisted of satisfaction with the environment. Social members define the basis of internal standards for evaluating happiness through external interactions [30]. Theory of use and gratification was adopted to evaluate motives for seeking psychological satisfaction.
Psychological life satisfaction is often used to measure mental health, such as depression, anxiety, suicidality, and alcohol and substance dependence [47]. Lehman et al. (1982) [48], defined the quality of life that individuals perceive and subjectively evaluate. Shunaker et al. (1990) [49], regarded quality of life as an individual’s overall satisfaction and well-being with life. This study investigated the effect of media environments on individual socio-psychological characteristics and mental health using the theory of use and gratification.
4. Materials and Method
4.1. Participants
MCR public data (https://www.data.go.kr) were used for this study. This study used 13,000 data items from 2019 to 2021. Participants that fit the purpose and theory of the study were selected. The inclusion criteria were leading a universally positive life and being an active media user. People who directly watch or participate in sports were selected. A total of 6,640 participants were included (Table 2).
Table 2.
Participant characteristics.
| Characteristics | N | (%) | |
|---|---|---|---|
| Gender | Male | 3,739 | 56.3 |
| Female | 2,901 | 43.7 | |
| Ages | 10’s | 411 | 6.2 |
| 20’s | 1,099 | 16.6 | |
| 30’s | 1,202 | 18.1 | |
| 40’s | 1,579 | 23.8 | |
| 50-69 years | 2,349 | 35.4 | |
| Work | Management/professionals | 587 | 8.8 |
| Office worker | 1,174 | 17.7 | |
| Sales / service | 1,256 | 18.9 | |
| Function / labor position | 1,190 | 17.9 | |
| Housewife | 1,103 | 16.6 | |
| Students | 980 | 14.8 | |
| Unemployed / other | 350 | 5.3 | |
| Type of residence | Self-owned | 5,206 | 78.4 |
| Charter | 1,193 | 17.9 | |
| Monthly rent | 212 | 3.2 | |
| Others | 29 | 0.5 | |
| Marital status | Married | 4,479 | 67.5 |
| Single | 1,982 | 29.8 | |
| Others (Divorced / Widowed / Separated) | 179 | 2.7 | |
| Children | Present | 2,213 | 33.3 |
| None | 4,427 | 66.7 |
4.2. Measures in MCR
A content validity analysis was conducted. Five experts conducted multi-dimensional verification. Agreement of at least four experts was required. Next, the construction validity and reliability of the factors were verified using confirmatory factor analysis (CFA) and reliability analysis, with maximum likelihood estimation utilizing SPSS and AMOS version 26.0. Following this, discriminant validity was verified by comparing the average variance extracted (AVE) and squared correlation value. Structural equation modeling (SEM) was performed. The results are shown in Table 3.
Table 3.
Summarized results for the validity and reliability assessments.
| Construct (Latent Variables) | Standardized R.W. | AVE* | CR** | |
|---|---|---|---|---|
| Items | ||||
| TV use | ||||
| 1. Watching on TV is more fun than watching on mobile. | .809 | .495 | .742 | .727 |
| 2. Even in the age of smart media, the TV should be at home. | .712 | |||
| 3. I watch my favorite TV shows on live TV, not on VOD or replays. | .568 | |||
| Mobile use | ||||
| 1. Even when I am at home, I watch TV programs on my mobile or PC. | .782 | .522 | .813 | .776 |
| 2. I watch more VODs and replays than I watch TV live. | .683 | |||
| 3. I watch TV programs on my mobile phone while on the go or outside. | .660 | |||
| 4. I can find programs more easily on my phone / PC than on TV. | .760 | |||
| Advertisement acceptance | ||||
| 1. I am more interested when the main character or performer of the program appears in the advertisement before and after the program. | .722 | .454 | .768 | .779 |
| 2. A product or brand featured in a TV show is more memorable when it appears in an advertisement. | .643 | |||
| 3. When I watch a TV show I particularly like, I tend to focus on TV commercials as well. | .711 | |||
| 4. Product presented in interim advertisements are more memorable. | .613 | |||
| Individual life pursuit | ||||
| 1. I prefer to spend my free time alone. | .687 | .411 | .633 | .729 |
| 2. Eating out or watching a movie alone is more comfortable than with others. | .576 | |||
| 3. Eating out or watching a movie alone is more comfortable than doing it with other people. | .546 | |||
| Psychological satisfaction | ||||
| 1. My life is close to my ideal life. | .791 | .506 | .802 | .802 |
| 2. Even if I am reborn, I want to live my present life again. | .770 | |||
| 3. I am satisfied with my life. | .637 | |||
| 4. Various conditions of my life are satisfactory. | .634 | |||
| Notes. / df = 9.631; P=.000 ; CFI = 0.967; RFI = 0.955; TLI = 0.960; RMR = 0.025; RMSEA = 0.036. | ||||
* Average Variance Extracted = ; ** Composite Reliability = / (
The five factors had a good structure. The goodness-of-fit indices of CFA displayed generally satisfied model fit (x2 / df= 9.631, P=.000, CFI = 0.967, RFI = 0.955, TLI = 0.960, RMR=.025 and RMSEA = 0.044). Due to the large number of cases, the x^2 / df value was out of the acceptable range; however, the rest indexes were within the recommended thresholds [50]. To evaluate convergent validity, factor loadings, construct reliability (CR), and AVE was calculated based on the measurement model. All Standardized factor loading values were statistically significant (p<0.001). AVE values were greater than the cutoff value of 0.4 [51]. All CR values (0.727–0.802) exceeded the minimum requirement of 0.7 (Table 1). Therefore, convergent validity was satisfactory. Reliability estimates (Cronbach’s alpha) for TV use (TU), mobile use (MU), advertisement acceptance (AA), psychological satisfaction (PS), and life satisfaction (LS) were above the recommended threshold of 0.7 (0.729–0.802), suggesting that the measures were reliable [52].
To verify the SEM analysis, a discriminant validity analysis between the factors was conducted. To derive the meaning of correlations between variables, the difference between measured values must be clear. A discriminant validity analysis was conducted based on the correlation coefficient. Following Fornell and Larcker (1981) [52], discriminant validity was obtained when AVE was greater than the squared correlation value (Table 4).
Table 4.
Summarized results for the validity and reliability assessments.
| TU | MU | AA | IL | PS | |
|---|---|---|---|---|---|
| TU | .495 | ||||
| MU | -.190** | .522 | |||
| AA | .263** | .240** | .454 | ||
| ILP | -.016 | .304** | .166** | .411 | |
| PS | .030* | .359** | .258** | .319** | .506 |
Although the overall AVE value and correlation coefficient tended to be low, after calculating squared correlation values for constructs, all AVE values were larger than the squared correlation between all constructs. Therefore, the discriminant validity was confirmed.
4.3. Data Process
SEM was performed to check individual hypotheses and confirm model fit. The SEM analysis was verified using the maximum likelihood method. Path comparisons were performed due to the design characteristics of the structural model. Four mediation paths were established and direct, indirect, and total effects were analyzed. To verify the mediating effect, the bootstrapping method was used. The number of bootstrap samples was set to 5000, and the bias-corrected confidence level was adjusted based on the 95% level. All statistical significance levels were set to p<.05.
5. Results
5.1. Hypothesis Test and Model Fit
All goodness-of-fit indices of the structural model exceed an acceptable fit standard, except CMIN/DF (x2 /df= 10.128, P=.000, CFI = 0.965, RFI = 0.953, TLI = 0.957, RMR=.027, RMSEA = 0.037). Considering the large sample size, this was a reasonable result [53].
H1 was confirmed, with TV (γ=.423, p < 0.001) and mobile (γ=.429, p < 0.001) similarly influencing advertisement acceptance. H2 was partially adopted, with TV use affecting the pursuit of individual life rejected (γ=.036, p > 0.05) and mobile use affecting the pursuit of individual life adopted (γ=.418, p < 0.001). H3 was confirmed, with mobile having a greater influence than TV (γ=.374, p < 0.001 versus γ=.132, p < 0.001). Advertisement acceptability slightly affected individual life pursuit (H4; γ=.100, p < 0.001). Individual life pursuit affected life satisfaction (H5; γ=.291, p < 0.001).
Table 5.
Hypothesis test by structural parameter estimates.
| Hypothesis | Path | Standardized Coefficient |
t-value | Remark |
|---|---|---|---|---|
| H1 | 1: TV use → Advertisement acceptance | .423 | 22.003*** | Accepted |
| 2: Mobile use → Advertisement acceptance | .429 | 22.824*** | Accepted | |
| H2 | 1: TV use → Individual life pursuit | .036 | .084 | Reject |
| 2: Mobile use → Individual life pursuit | .418 | 17.561*** | Accepted | |
| H3 | 1: TV use → Psychological satisfaction | .132 | 8.676*** | Accepted |
| 2: Mobile use → Psychological satisfaction | .374 | 19.019*** | Accepted | |
| H4 | Advertisement acceptance → Individual life pursuit | .100 | 4.726*** | Accepted |
| H5 | Individual life pursuit → Psychological satisfaction | .291 | 14.495*** | Accepted |
| Notes. / df = 10.128; P=.000; CFI = 0.965; RFI = 0.953; TLI = 0.957; RMR = 0.027; RMSEA = 0.037. | ||||
5.2. Mediating Effect
Testing the mediating effect of the structural model after testing individual hypotheses enables a more sophisticated interpretation of results. Thus, this mediation path analysis was developed based on two interpretations: the basic mediating effect analysis approach, which identifies the function of mediating variables, and the prominent design of this study. Inter-comparisons were conducted based on the independent variables of TV and mobile use preference. Mediator paths (I) and (II) were compared through advertisement acceptance, and mediator paths (III) and (IV) were compared through individual life as a medium.
Figure 2.
Results of hypotheses testing and moderate paths.
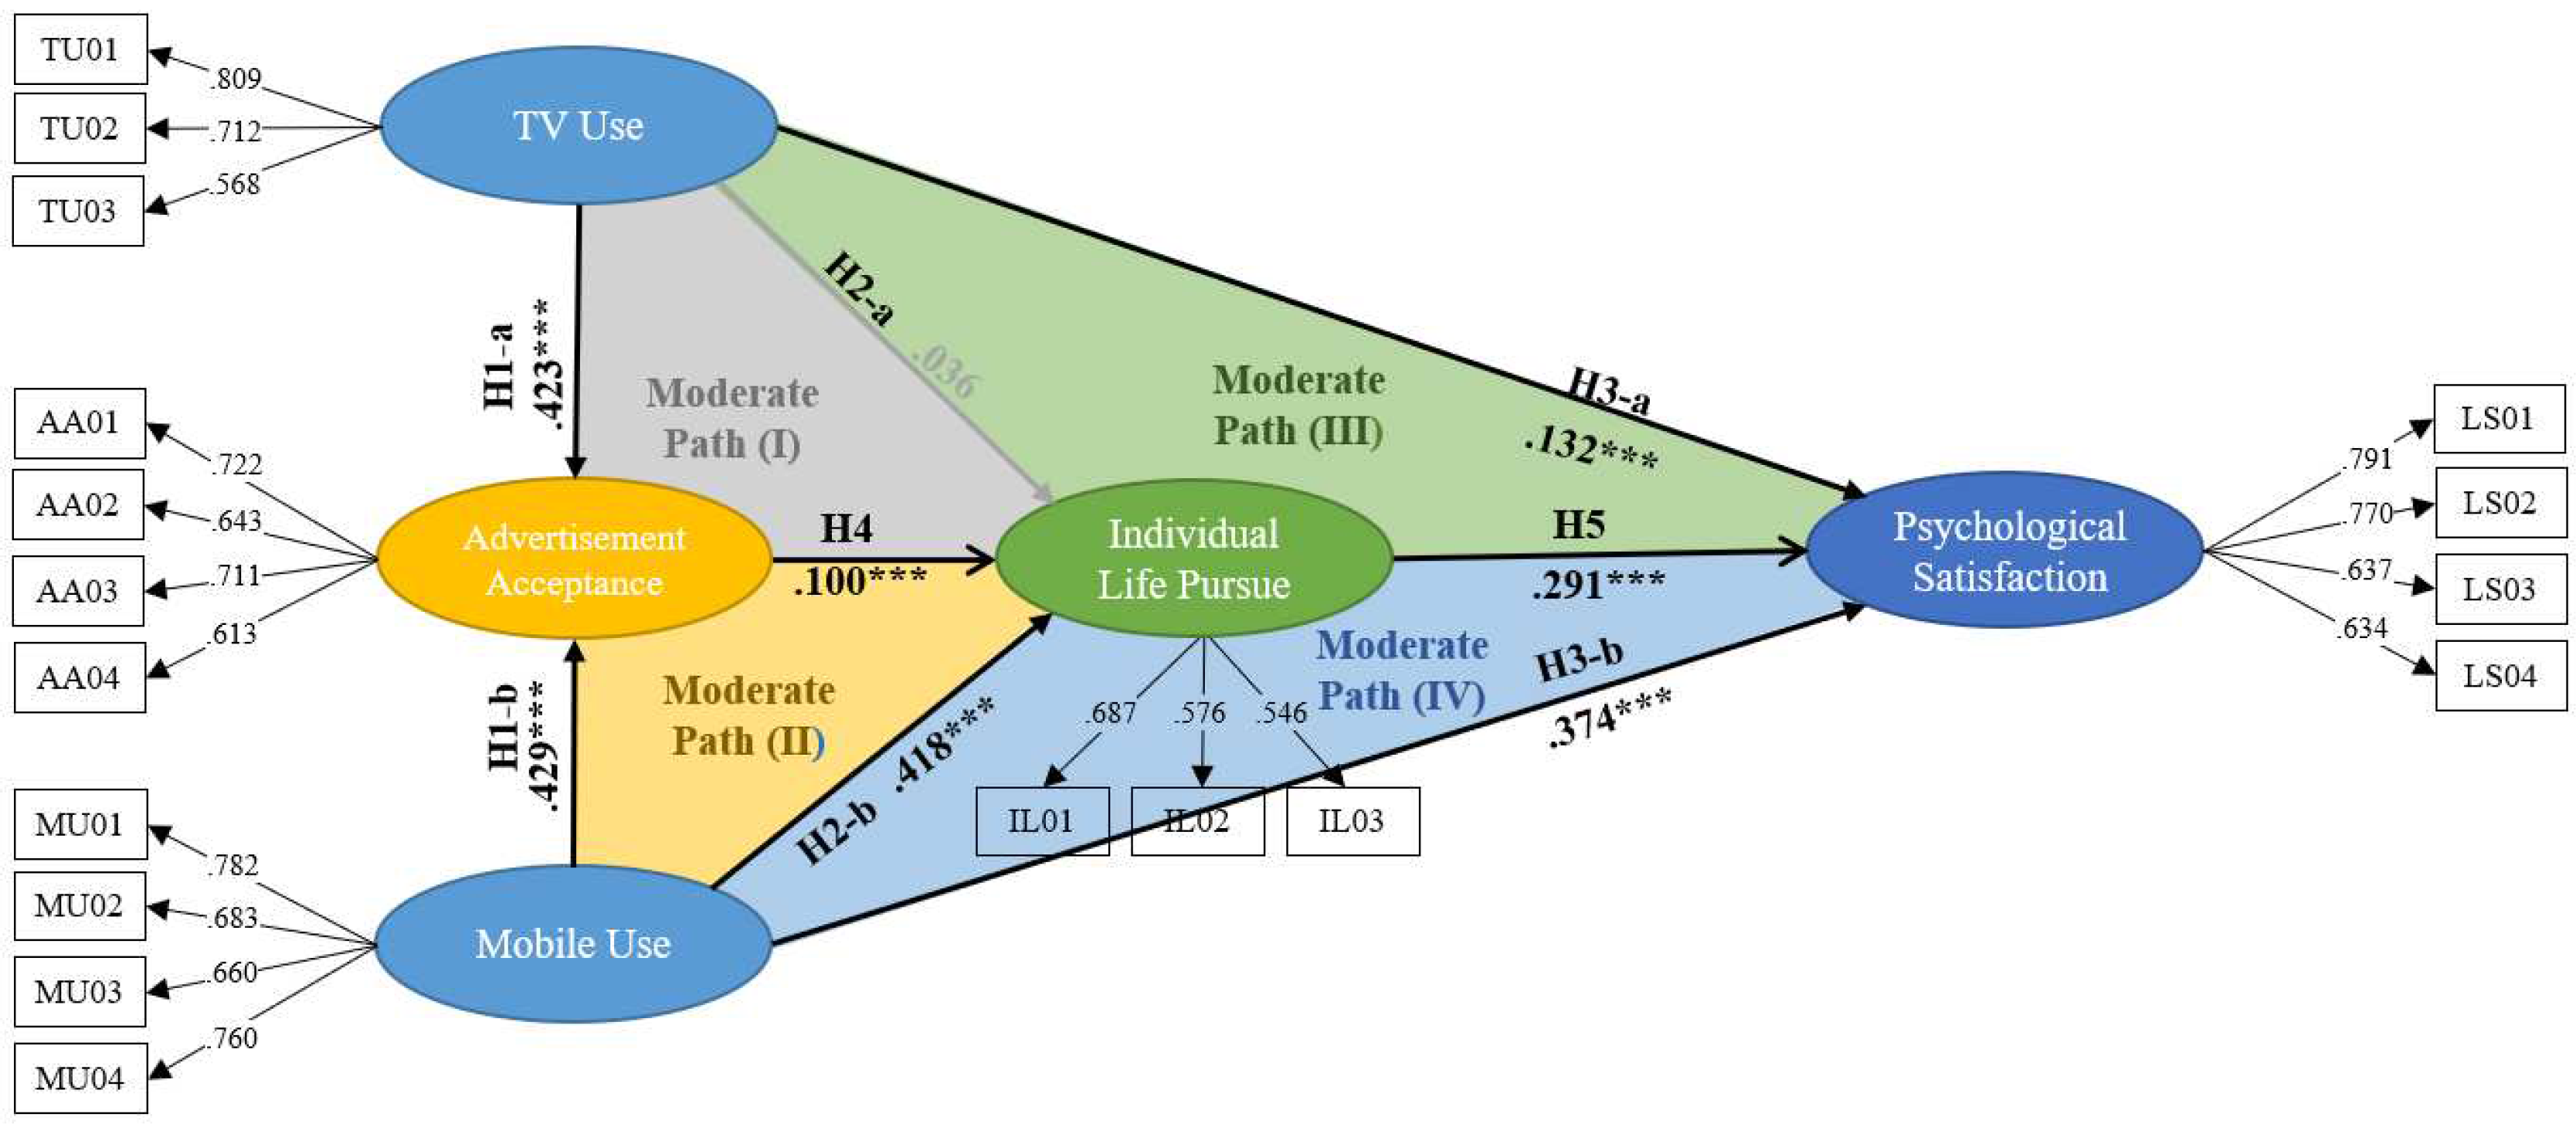
Table 6.
Modeiating effects.
| Path | Standardized Coefficient |
95% CI (Bias-corrected) |
P | |
|---|---|---|---|---|
| Path (I) TV Use → (Advertisement acceptance) → Individual life pursuit |
Direct effect | .036 | -.009–.081 | .137 |
| Indirect effect | .042 | .021–.064 | .000*** | |
| Total effect | .078 | .040–.118 | .000*** | |
| Path (II) Mobile use → (Advertisement acceptance) → Individual life pursuit |
Direct effect | .418 | .375–.461 | .000*** |
| Indirect effect | .043 | .021–.064 | .000*** | |
| Total effect | .461 | .426–.188 | .000*** | |
| Path (III) TV use → (Individual life pursuit) → Psychological-satisfaction |
Direct effect | .132 | .097–.166 | .000*** |
| Indirect effect | .023 | .012–.035 | .000*** | |
| Total effect | .154 | .119–.496 | .000*** | |
| Path (IV) Mobile use → (Individual life pursuit) → Psychological satisfaction |
Direct effect | .374 | .333–.413 | .001** |
| Indirect effect | .134 | .114–.159 | .000*** | |
| Total effect | .508 | .477–.537 | .001** | |
First, the results of mediator paths (I) and (II) were compared with AA as a parameter. In path (I), the independent variable TU had no direct effect (γ=.036, p > 0.05) on the dependent variable individual life pursuit (ILP), as confirmed in H2-1. Nonetheless, a weak total effect (γ=.078, p < 0.001) was established by adding the indirect effect (γ=.042, p < 0.001). The TV use environment did not influence the mediator of advertisement acceptance. In path (II), there was a direct effect (γ=.418, p < 0.001) of TU on ILP, as confirmed in H2-2. In addition, the total effect (γ=.461, p < 0.001) was increased by adding the indirect effect (γ=.043, p < 0.001) of AA. Therefore, AA had a positive mediating effect. There was virtually no mediating effect of ILP on TU, while it had a mediating effect on MU.
ILP was compared and confirmed with paths (III) and (IV) as a mediator. In path (III), the independent variable TU had a direct effect (γ=.132, p > 0.05) on the dependent variable PS, as confirmed in H3-1. In addition, the indirect effect (γ = .023, p < 0.001) slightly increased to the total effect (γ = .154, p < 0.001). Path (IIV) results demonstrated a large direct effect (γ=.374, p < 0.001), as in H3-2. An indirect effect on ILP (γ=.134, p < 0.001) was added, and the total effect (γ=.508, p < 0.001) greatly increased. Therefore, ILP positively affected PS, with a larger mediating effect for MU.
6. Discussion
6.1. Comparative Discussion
This study examined and compared the effects of TV and mobile use on AA, ILP, and PS.
The effects of TU and MU on advertisement acceptance had no significant difference. As media users use their preferred media relatively consistently [54], media acceptance based on media use is likely to be maintained at a certain level [55]. Traditional and new media had an advertising acceptance effect [56], with similar effects regardless of usage environment.
TU did not influence ILP, while MU influenced ILP. Lifestyle was measured using LOV [57], which can be used to predict future consumption patterns through relatively consistent lifestyles. In this aspect, this study can be interpreted on the premise that values and behaviors are consistent. The use of TV, a traditional media type, can be seen as pursuing a traditional lifestyle, such as a family unit or a shared life of two or more people. As people who pursue traditional family life do not pursue individual life, TU did not influence ILP. By contrast, it could be seen that the influence of MU, a media type centered on one person, on ILP was consistent from a lifestyle point of view. Previous studies have also emphasized that the media environment affects lifestyle [58]. Blumler (1979) [59], highlighted that media is used to pursue a current lifestyle and identified three media use motives: cognitive, entertainment, and identity. The media usage environment affects lifestyle and the use of mobile media can be seen to impact the pursuit of personal life.
The effect of TU on PS was small compared with MU. Therefore, both media environments influenced PS. Moreover, the technology acceptance model (TAM) argues that the increase in technological innovation factors expands acceptability [60]. Katz et al. (1973) [5], classified media use motives into five categories: cognitive, emotional, personal integration needs, social integration needs, and escapism needs. In other words, the motivation for media use was explained through a psychological aspect. TV and mobile use influence psychological stability, and innovative technology has a greater influence on the psychological stability and satisfaction of users. Brod (1983) [60], used the phrases techno stress and technophobia to describe a phenomenon that caused the body and mind to reject a new technological fad. Adapting to technological development sometimes acts as a stress factor [61]. New media appears to have a greater influence than TV on the quality of life.
Overall, it was confirmed that media use had a positive effect on individual lifestyles and life satisfaction. Some studies have pointed out that excessive online activity inhibits individual social interaction and induces negative effects that increase depression and loneliness [62,63]. Monica and McLauglin (2007) [64], stated that the higher the tendency to loneliness, the stronger the will to relieve stress through online activities rather than offline activities. In the interaction between lifestyle and behavior, it is difficult to establish priorities. However, this study used public data from Korea and limited the participants to a group that exercised. Therefore, under these conditions, media use positively affected the quality of life.
6.2. Mediating Effects Discussion
The mediating effect included four pathways.
The mediating effect of AA on the influence of media use environment on ILP was examined. There was no effect of TU on IL; however, a total effect was achieved through an indirect effect, forming an effect. However, the effect of MU on IL had a direct effect, and an indirect effect was added, increasing the total effect In the relationship between TV and mobile influence on lifestyle, AA had almost the same positive mediating effect on ILP.
Therefore, AA, directly and indirectly, influenced the pursuit of personal life. Adoption of advertising means that there is a high tendency to accept the latest consumption trends and culture [65]. Previous studies revealed that a mutual relationship between advertisement acceptance and lifestyle [66]. Therefore, media consumer lifestyles appear to be affected by accepting advertisements.
There was a total and a slightly increased indirect effect of TU on PS. Conversely, there was a total increased effect of MU on psychological satisfaction. The mediating effect of lifestyle on psychological satisfaction was greater for TV environments than mobile environments.
Therefore, ILP has mediating effects of varying sizes for TV and mobile, which may be because TU did not influence ILP. The effect of ILP on PS was independently vital. The future media use environment will gradually change to one-user-centered [67,68]. Therefore, this personalized lifestyle is expected to act as a more important factor for psychological satisfaction, which aligns with previous studies[69] that demonstrate that a stable individualized life provides mental stability and psychological satisfaction in complex social relationships.
6.3. Conclusions
This study examined the effects of TV and mobile media usage environment on AA, lifestyle, and PS. Hypothesis pathways were tested, and comparative structural mediating effects were analyzed. This study touches upon the important issue of media consumption and lifestyle changes.
TV and mobile usage environments had similar effects on AA. TV did not influence ILP, while the mobile use environment affected ILP. The mobile use environment had a greater effect on individual PS than TV. Differences in media technology had the same level of influence on advertisement acceptance but different influences on lifestyle, such as ILP, with only mobile influencing ILP. In addition, the media use environment can be recognized as a leading factor affecting individual PS, whether small or large. In addition, the mobile use environment has a greater influence on PS.
AA had a mediating effect on the influence on ILP based on media use environments. For both media, regardless of media attributes, AA had a mediating effect on ILP. ILP had a significant mediating effect on the influence on PS based on the media use environment. The media use environment affects PS, and ILP acts as a strong mediator. Media use affects ILP through a chain reaction through AA and lifestyle change.
The media usage environment is changing worldwide, and depending on usage characteristics, exerts significant influence on lifestyles and mental health. In particular, online media usage is increasing due to the COVID-19 pandemic and the technological development of the 4th industrial revolution. This study demonstrated that, compared to traditional media, new media had the same influence on advertisement acceptance but a greater influence on lifestyle and psychological satisfaction.
6.4. Future Directions
Most public data analyses tend to simply check and compare perceptions. Current research has progressively accepted the theoretical background and structurally demonstrated the causal relationship between variables. Little has been done in this direction to date. The derivation of academic information through public data is recommended worldwide. This study presented significant results. As this study focused on Korean adults aged 13 and over who exercised, the results cannot be generalized. Future research with public data should target more diverse media types and various countries.
Author Contributions
Conceptualization: S. Kim; methodology: J. Yu; software: J. Yu; validation: J. Yu and S. Kim; formal analysis: S. Kim; investigation: S. Kim; resources: J. Yu; data curation: S. Kim; writing—original draft preparation: J. Yu; writing—review and editing: S. Kim; visualization: J. Yu; supervision: J. Yu; project administration: S. Kim; funding acquisition: J. Yu.
Funding
This research received no external funding.
Institutional Review Board Statement
The study was conducted in accordance with the set of ethical principles the Declaration of Helsinki.
Informed Consent Statement
Informed consent was obtained from all subjects involved in the study.
Data Availability Statement
Data can be made available from corresponding author upon reasonable request.
Conflicts of Interest
The authors declare no conflict of interest.
References
- Rai, T. S. Social Media Use and Mental Health. Science 2019, 364(6446), 1147–1148. [Crossfef].
- Potter, R. F.; Bolls, P. D. Psychophysiological Measures and Meaning: Cognitive and Emotional Processing of Media; Routledge: New York, 2012. [Crossref], [Google Scholar].
- Neill, R. D.; Blair, C.; Best, P.; McGlinchey, E.; Armour, C. Media Consumption and Mental Health during COVID-19 Lockdown: A UK Cross-Sectional Study across England, Wales, Scotland, and Northern Ireland. J. Public Health 2021, 31, 435-443. [Crossfef].
- Rubin, A. M. 2002. “The uses-and-gratifications perspective of media effects.”. In Media effects: Advances in theory and research Edited by: Bryant, J. and Zillmann, D. 525–548. Mahwah, NJ: Lawrence Erlbaum Associates. [Google Scholar].
- Katz, E. Television as a Horseless Carriage. In Communications Technology and Social Policy, Eds. Gerbner, G.; Gross, L. P.; William, M. H.; Wiley, 1973; pp 381–392. [Google Scholar].
- Morgan, E.; Snelson, C.; Elison-Bowers, P. Image and Video Disclosure of Substance Use on Social Media Websites. Computers in Human Behavior 2010, 26, 1405–1411. [Crossref], [Web of Science ®], [Google Scholar].
- Hesmondhalgh, D.; Baker, S. Creative Labour: Media Work in Three Cultural Industries. Routledge: London, 2011. [Google Scholar].
- Doel, M. A.; Clarke, D. B. Virtual Worlds: Simulation, Suppletion, Seduction, and Simulacra. In Virtual Geographies: Bodies, Space and Relations; May, J., Crang, M., Crang, P., Eds.; Routledge: London, 1999; 296–318. [Google Scholar].
- Folkes, S. V.; Kamins, M. A. Effects of Information about Firms’ Ethical and Unethical Actions on Consumers’ Attitudes. J. Consumer Psychol. 1999, 8, 243–259. [Crossref], [Google Scholar].
- Melnick, S. A. The effects of item grouping on the reliability and scale scores of an affective measure. Educ. Psychol. Meas. 1993, 53, 211–216. [Crossref].
- Fishbein, M.; Ajzen, I. Belief, Attitude, Intention, and Behavior: An Introduction to Theory and Research. Addison-Wesley: Reading, MA, 1975.
- Palmgreen, P.; Rayburn, J. D. A Comparison of Gratification Models of Media Satisfaction. Commun. Monogr. 1985, 52 (4), 334–346. [Crossref].
- Papacharissi, Z. The Virtual Geographies of Social Networks: A comparative analysis of Facebook, LinkedIn and ASmallWorld. New Media and Society 2009, 11, 199–220. [Crossref], [Web of Science ®], [Google Scholar].
- McKinsey & Company. COVID-19 and the Great Reset: Briefing Note, July 9, 2020. https://www.mckinsey.com/~/media/mckinsey/business%20functions/risk/our%20insights/covid%2019%20implications%20for%20bu-ness/covid%2019%20july%209/covid-19-and-the-great-reset-briefing-note-july-9-2020-vf.pdf. [Google Scholar].
- Banda, J. M.; Tekumalla, R.; Wang, G.; Yu, J.; Liu, T.; Ding, Y.; Artemova, E.; Tutubalina, E.; Chowell, G. "A large-scale COVID-19 Twitter chatter dataset for open scientific research—An international collaboration." Epidemiologia 2021, 2, 315–324. https://doi.org/10.3390/epidemiologia2030024. [CrossRef]
- Ahmed, S.; Wang, D.; Park, J.; Cho, S. H. UWB-gestures, a public dataset of dynamic hand gestures acquired using impulse radar sensors. Scientific Data 2021, 8, 102.https://doi.org/10.1038/s41597-021-00876-0. [CrossRef]
- Park, J.-W.; Hwang, J.; Lee, C. G.; Ahn, H.; Kim, H. "The impact of parental incarceration on sport participation trajectories from adolescence to young adulthood." International Journal of Environmental Research and Public Health 2020, 17, 5229. https://doi.org/10.3390/ijerph17145229. [CrossRef]
- Rossi, A.; Da Pozzo, E.; Menicagli, D.; Tremolanti, C.; Priami, C.; Sîrbu, A.; Clifton, D. A.; Martini, C.; Morelli, D. A public dataset of 24-h multi-level psycho-physiological responses in young healthy adults. Data 2020, 5, 91-101. https://doi.org/10.3390/data5040091. [CrossRef]
- Schüll, N. D. Data for life: Wearable technology and the design of self-care. BioSocieties 2016, 11(3), 317–333. [Crossref], [Web of Science ®], [Google Scholar].
- Deighton, J. Big Data. Consumption Markets & Culture 2019, 22, 68-73. doi:10.1080/10253866.2017.1422902. [Taylor & Francis Online], [Web of Science ®], [Google Scholar]. [CrossRef]
- Nafus, D.; Sherman, J. This one does not go up to 11: The quantified self movement as an alternative big data practice. Int. J. Commun. 2014, 8, 1784–1794. [Web of Science ®], [Google Scholar].
- Mossing Caputo, N.; Rouner, D. "Narrative Processing of Entertainment Media and Mental Illness Stigma." Health Commun. 2011, 26(7), 595-604. DOI: 10.1080/10410236.2011.560787. [CrossRef]
- Van den Bulck, J.; Custers, K.; Nelissen, S. The Child-Effect in the New Media Environment: Challenges and Opportunities for Communication Research. J. Child. Media 2016, 10, 30-38. DOI: 10.1080/17482798.2015.1121897. [CrossRef]
- Kelly, A.; Lawlor, K.; O’Donohoe, S. Encoding Advertisements: The Creative Perspective. J. Market. Manag. 2005, 21(5), 505–528. doi: 10.1362/0267257054307390 [Taylor & Francis Online], [Google Scholar]. [CrossRef]
- Soar, M. Encoding Advertisements: Ideology and Meaning in Advertising Production. Mass Commun. Soc. 2000, 3(4), 415–437. doi: 10.1207/S15327825MCS0304_05 [Taylor & Francis Online], [Google Scholar]. [CrossRef]
- Kahle, L. R.; Beatty, S. E.; Homer, P. Alternative Measurement Approaches to Consumer Values-The List of Values (LOV) and Values and Life Style (VALS). J. Consum. Res. 1986, 13, 405–409. https://doi.org/10.1086/209079. [CrossRef]
- Novak, T. P.; Bruce, M. On comparing alternative segmentation schemes: The list of values (LOV) and values and life styles (VALS). J. Consum. Res. 1990, 17. https://doi.org/10.1086/208541. [CrossRef]
- Vyncke, P. Lifestyle Segmentation: From Attitudes, Interests and Opinions, to Values, Aesthetic Styles, Life Visions and Media Preferences. Eur. J. Commun. 2002, 17, 445-463. doi:10.1177/02673231020170040301. [CrossRef]
- Medley, M. L. Life Satisfaction Across Four Stages of Adult Life."Journal of Aging Human Development 1980, 11(3), 114-134. https://doi.org/10.2190/D4LG-ALJQ-8850-GYDV. [CrossRef]
- Zichermann, G.; Cunningham, C. Gamification by Design: Implementing Game Mechanics in Web and Mobile Apps. O’Reilly Media: San Francisco, 2011. [Google Scholar].
- Palmgreen, P.; Wenner, L.; Rayburn, J. D. Relations Between Gratifications Sought and Obtained: A Study of Television News. Communication Research 1989, 7, 161-192. https://doi.org/10.1177/009365028000700202. [CrossRef]
- Byun, K.-W. Structural Relationship Between the Expectation Value of YouTube Sports Content Viewers, Brand Image, Brand Attitude, and Continuance Viewing Intention. Int. J. Adv. Smart Converg. 2020, 9, 215-220. doi:10.7236/IJASC.2020.9.3.215. [CrossRef]
- Chaney, E. H.; Chaney, J. D.; Wang, M. Q.; Eddy, J. M. Lifestyle Behaviors and Mental Health of American Adults. Psychol. Rep. 2007, 100, 294-302.
- Velten, J.; Lavallee, K. L.; Scholten, S.; Meyer, A. H.; Zhang, X. C.; Schneider, S.; Margraf, J. Lifestyle Choices and Mental Health: A Representative Population Survey. BMC Psychol. 2014, 2, 58. https://doi.org/10.1186/s40359-014-0055-y. [CrossRef]
- Di Marco, L. Y.; Marzo, A.; Muñoz-Ruiz, M.; Ikram, M. A.; Kivipelto, M.; Ruefenacht, D.; Ventikos, Y. A. Modifiable Lifestyle Factors in Dementia: A Systematic Review of Longitudinal Observational Cohort Studies. J. Alzheimers Dis. 2014, 42, 119–135. doi:10.3233/JAD-132225. [CrossRef]
- Harrington, J.; Perry, I. J.; Lutomski, J.; Fitzgerald, A. P.; Shiely, F.; McGee, H.; Barry, M. M.; van Lente, E.; Morgan, K.; Shelley, E. Living Longer and Feeling Better: Healthy Lifestyle, Self-rated Health, Obesity and Depression in Ireland. Eur. J. Public Health 2010, 20, 91–95. https://doi.org/10.1093/eurpub/ckp102. [CrossRef]
- Kapoor, K. K.; Tamilmani, K.; Rana, N. P.; et al. Advances in Social Media Research: Past, Present and Future. Inf Syst Front 2018, 20, 531–558. https://doi.org/10.1007/s10796-017-9810-y. [CrossRef]
- Manovich, L. The Language of New Media. MIT Press, 2002. [Google Scholar].
- Beer, D. Power Through the Algorithm? Participatory Web Cultures and the Technological Unconscious." New Media & Society 2009, 11, 985–1002. [Crossref], [Web of Science ®], [Google Scholar].
- Johnston-Robledo, I. Education and Advertising: A Content Analysis of Commercially Produced Booklets about Menstruation. The Journal of Early Adolescence 2002, 22, 455–474. [Crossref], [Web of Science ®], [Google Scholar].
- Byrne, S.; Niederdeppe, J.; Avery, R. J.; Cantor, J. "When diet and exercise are not enough": An examination of lifestyle change inefficacy claims in direct-to-consumer advertising. Health Communication 2013, 28, 800–813. [Taylor & Francis Online], [Web of Science ®], [Google Scholar].
- Bunton, R.; Burrows, R. Consumption and health in the ’epidemiological’ clinic of late modern medicine. In The Sociology of Health Promotion: Critical Analyses of Consumption, Lifestyle, and Risk, Edited by Bunton, R.; Nettleton, S.; Burrows, R. London: Routledge, 1995. [Google Scholar].
- Fowler, B. Pierre Bourdieu, Social Transformation and 1960s British Drama. Theory, Culture & Society 2012, 29, 3–24. doi: 10.1177/0263276412441034 [Crossref], [Web of Science ®], [Google Scholar]. [CrossRef]
- Hesmondhalgh, D. Bourdieu, the Media and Cultural Production. Media, Culture & Society 2006, 28, 211–231. doi: 10.1177/0163443706061682 [Crossref], [Web of Science ®], [Google Scholar]. [CrossRef]
- King, M.; McKeown, E. Mental Health and Social Wellbeing of Gay Men, Lesbians and Bisexuals in England and Wales; Mind: London, 2003. [Google Scholar].
- Fergusson, D.; McLeod, G.; Horwood, L.; Swain, N.; Chapple, S.; Poulton, R. Life Satisfaction and Mental Health Problems (18 to 35 Years). Psychol. Med. 2015, 45, 2427–2436. doi:10.1017/S0033291715000422. [CrossRef]
- Lehman, A. F.; Ward, N. C.; Linn, L. S. Chronic Mental Patients: The Quality of Life Issue. Am. J. Psychiatry 1982, 139 (10), 1271–1276. https://doi.org/10.1176/ajp.139.10.1271. [CrossRef]
- Schunaker, S. A.; Anderson, R. T.; Czajkowski, S. M. Psychological Tests and Scales. In Clinical Trials; Spilker, B., Ed.; Raven Press, 1990; 95–113.
- Kavaratzis, M. From City Marketing to City Branding: Towards a Theoretical Framework for Developing City Brands. Place Branding 2004, 1, 58-73. https://doi.org/10.1057/palgrave.pb.5990005. [CrossRef]
- Thompson, B. Exploratory and Confirmatory Factor Analysis: Understanding Concepts and Applications; American Psychological Association. 2004.
- Fornell, C.; Larcker, D. F. Evaluating Structural Equation Models with Unobservable Variables and Measurement Error. J. Marketing Res. 1981, 18, 39–50. https://doi.org/10.2307/3151312. [CrossRef]
- Tabachnick, B. G.; Fidell, L. S. Experimental Designs Using ANOVA. Duxbury Press.
- Blumler, J.; Katz, E. The Uses of Mass Communications; Sage Publications: Beverly Hills, CA, 1974. [Google Scholar].
- van Reijmersdal, E.; Smit, E.; Neijens, P. How Media Factors Affect Audience Responses to Brand Placement. Int. J. Advert. 2010, 29, 279–302. [Taylor & Francis Online], [Web of Science ®], [Google Scholar].
- Campbell, M. C.; Keller, K. L. Brand Familiarity and Advertising Repetition Effects. J. Consumer Res. 2003, 30, 292–304. [Crossref], [Web of Science ®], [Google Scholar].
- Kahle, L. R.; Gurel-Atay, E.; Yu, J. G.; Ring, K. Aviary Segmentation: Theory and Method. In The Customer is NOT Always Right? Marketing Orientations in a Dynamic Business World; Campbell, C. L., Ed.; Developments in Marketing Science: Proceedings of the Academy of Marketing Science; Springer, Cham, 2017. https://doi.org/10.1007/978-3-319-50008-9_179. [CrossRef]
- Boomgaarden, H. G.; Song, H. Media Use and Its Effects in a Cross-National Perspective. KZfSS Kölner Zeitschrift für Soziologie und Sozialpsychologie 2019, 71, S1, 545-571. [Crossref].
- Blumer, J. G. The Role of Theory in Uses and Gratifications Studies. Communication Research 1979, 6, 9–36. https://doi.org/10.1177/009365027900600102. [CrossRef]
- Rauniar, R.; Rawski, G.; Yang, J.; Johnson, B. Technology Acceptance Model (TAM) and Social Media Usage: An Empirical Study on Facebook. J. Enterprise Inf. Manage. 2014, 27 (1), 6-30. https://doi.org/10.1108/JEIM-04-2012-0011. [CrossRef]
- Brod, C. Technostress: The Human Cost of Computer Revolution; Addison-Wesley, 1984.
- Wang, K.; Shu, Q. The Moderating Impact of Perceived Organizational Support on the Relationship between Technostress and Role Stress. In Proceedings of the 2008 19th International Workshop on Database and Expert Systems Applications (DEXA ’08), Turin, Italy, 2008; 420-424. https://doi.org/10.1109/DEXA.2008.67. [CrossRef]
- Kraut, R.; Lundmark, V.; Patterson, M.; Kiesler, S.; Mukopadhyaya, T.; Scherlis, W. Internet Paradox: A Social Technology That Reduces Social Involvement and Psychological Well-Being. Am. Psychol. 1998, 53, 1017-1031. https://doi.org/10.1037/0003-066X.53.9.1017. [CrossRef]
- Larsen, J. T.; McGraw, A. P.; Cacioppo, J. T. Can people feel happy and sad at the same time? J. Pers. Soc. Psychol. 2001, 81, 684–696. [Crossref], [PubMed], [Web of Science ®], [Google Scholar].
- Whitty, M. T.; McLaughlin, D. Online Recreation: The Relationship Between Loneliness, Internet Self-Efficacy, and the Use of the Internet for Entertainment Purposes. Comput. Human Behav. 2007, 23, 1435-1446. https://doi.org/10.1016/j.chb.2005.05.003. [CrossRef]
- Coulter, K. S. The Effects of Affective Responses to Media Context on Advertising Evaluations. J. Advertising 1998, 27, 41-51. [Taylor & Francis Online], [Web of Science ®], [Google Scholar].
- Srivastava, R.K. Effectiveness of Global Advertisement on Culture of India: An Emerging Market. Int. J. Emerg. Mark. 2010, 5, 102–113. https://doi.org/10.1108/17468801011018284. [CrossRef]
- Lopes, A.; Valentim, N.; Moraes, B. Applying User-Centered Techniques to Analyze and Design a Mobile Application. J. Softw. Eng. Res. Dev. 2018, 6, 5. https://doi.org/10.1186/s40411-018-0049-1. [CrossRef]
- Hennig-Thurau, T.; Malthouse, E.C.; Friege, C.; Gensler, S.; Lobschat, L.; Rangaswamy, A.; Skiera, B. The Impact of New Media on Customer Relationships. J. Serv. Res. 2010, 13, 311–330. [Crossref], [Web of Science ®], [Google Scholar].
- Krause, M. Transformations of Social Bonds and Mental Health: How Can Mindfulness Counter Individualization and the Influence of Communication Technologies? In Enhancing Resilience in Youth; Steinebach, C., Langer, Á., Eds.; Springer: Cham, 2019. https://doi.org/10.1007/978-3-030-25513-8_16. [CrossRef]
Disclaimer/Publisher’s Note: The statements, opinions and data contained in all publications are solely those of the individual author(s) and contributor(s) and not of MDPI and/or the editor(s). MDPI and/or the editor(s) disclaim responsibility for any injury to people or property resulting from any ideas, methods, instructions or products referred to in the content. |
© 2023 by the authors. Licensee MDPI, Basel, Switzerland. This article is an open access article distributed under the terms and conditions of the Creative Commons Attribution (CC BY) license (http://creativecommons.org/licenses/by/4.0/).
Copyright: This open access article is published under a Creative Commons CC BY 4.0 license, which permit the free download, distribution, and reuse, provided that the author and preprint are cited in any reuse.


