
Submitted:
09 October 2023
Posted:
11 October 2023
You are already at the latest version
Abstract
Scoring targets in shooting sports is a crucial and time-consuming task that relies on manually counting bullet holes. This paper introduced an automatic score detection model using object detection techniques. The performance of seven models belonging to two different architectural setups was compared. Models like YOLOv8n, YOLOv8s, YOLOv8m, RetinaNet-50, and RetinaNet-101 are single-shot detectors, while Faster RCNN-50 and Faster RCNN-101 belong to the two-shot detectors category. The dataset was manually captured from the shooting range and expanded by generating more versatile data using Python code. Before the dataset was trained to develop models, it was resized (640x640) and augmented using Roboflow API. The trained models were then assessed on the test dataset, and their performance was compared using matrices like mAP50, mAP50-90, precision, and recall. The results showed that YOLOv8 models can detect multiple objects with good confidence scores. Among all, YOLOv8m performed the best with the highest mAP50 value of 96.7%, followed by the performance of YOLOv8s with the mAP50 value of 96.5%. It is suggested that if the system is to be implemented in a real-time environment, YOLOv8s is a better choice since it took significantly less inference time (2.3ms) than YOLOv8m (5.7ms) and yet generated the competitive mAP50.
Keywords:
bullet holes
; object detection
; machine learning
; convolutional neural networks
; deep learning
; YOLO
; YOLOv8
; Detectron2
; Faster R-CNN
; RetinaNet
; FPN
1. Introduction
Automating the calculation of the total points from a shooting card is tedious yet an essential task of the shooting sport. At a professional level, electronic targets or target-reading machines are validated and certified by the International Shooting Sport Federation (ISSF). At an amateur level, this is often done by manually counting the score of each bullet hole. This process can be time-consuming and subject to miscounting by human error. The paper, therefore, proposes a Neural Network (NN) based approach for calculating the total score of a target after training, validating, and testing the dataset on seven pre-trained object detection models. The chosen pre-trained models were fine-tuned on a shooting card dataset. The proposed solution classified each bullet hole according to the score. This means that the models carried out the classification task based on the relative position of bullets on the shooting card and not the way a bullet hole appears.
The NN models for object detection problems can be classified on a higher level as a single-shot or two-shot detection model. For any object detection problem, choosing any one of them is a crucial decision. Two-shot object detection models are accurate, whereas single-shot detectors are computationally faster, compromising accuracy. So, models from both categories were chosen. Three models (variants) of YOLOv8 (You Only Look Once) from the single-shot detection category, whereas four models were selected from detectron2. The two models from detectron2, namely Faster RCNN-50 and Faster RCNN-101, belong to two-shot detectors, while the other two (RetinaNet-50 and RetinaNet-101) are considered single-shot detectors. The study results, therefore, give an insight into the difference in performance between single-shot and two-shot detectors.
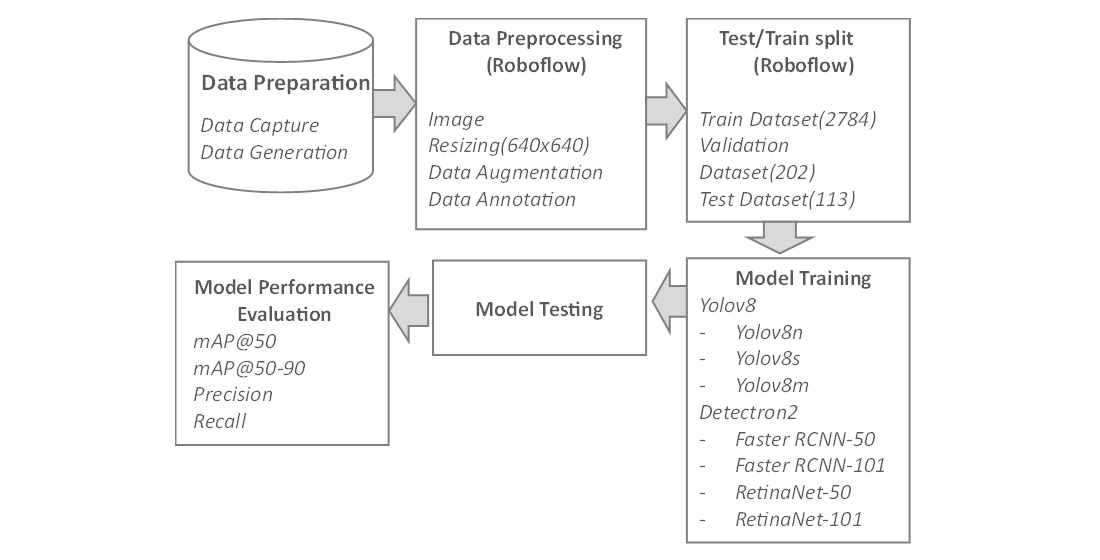
The study primarily focuses on using seven different pre-trained models on a carefully curated dataset of target images with 13 annotated objects, including bullet holes and their corresponding scores. The purpose is to leverage the powerful features of the single-shot and two-shot detectors to achieve the highest average precision and recall values. The solution provides a dynamic approach, and the entire methodology is presented in Figure 1.
The paper is organized as follows. Section 2 presents the related work, and section 3 outlines the dataset, methods, and materials used in the study. The results of the experiment are presented in Section 4. Section 5 provides a discussion, followed by the conclusion in Section 6.
The main contributions of this paper can be summarized below.
- Seven models from two architecturally different object-detection domains are used for performance comparison.
- The dataset was manually collected by capturing images from the shooting range.
- The dataset was improved and made publicly available to be used by other researchers for the detection and classification of points from shooting cards.
- Multiple performance evaluation metrics are used to get a better insight into the performances of different models.
2. Related Work
Target or aim detection is a significant part of Image processing and recognition [1]. Manual and automatic target scoring are the two main methods used for score calculation. Manual observation is still used for target scoring calculation in major shooting competitions. Whereas automatic score calculation is time efficient and less erroneous, it depends on how accurately bullet holes and the center of the target are detected [2]. The small objects have mostly low-resolution and noisy representations, making their detection (multiple occurrences) challenging [3]. Vision-based automatic scoring is one of the developing technologies in automated shoot scoring systems, which uses a camera to capture the shooting results of athletes [4].
Traditional methods for target detection include the background subtraction method[5] and the inter-difference method [6]. Implementing the subtraction algorithm needs high imaging conditions of bullet holes. It is vulnerable to irregular and fuzzy edge detection of bullet holes, eventually affecting the precision and accuracy of score calculation. Jie et al. [7] proposed a wavelets transform-based methodology using fusion rules for bullet hole detection to overcome the limitation of image difference technology. They first decomposed the image into different frequencies. Then, multiple fusion rules and processing methods in different frequencies were implemented to increase the wavelet transform coefficient of the target image. Compared with the subtraction detection algorithm and Gaussian model, their approach worked better by suppressing the noise and getting solid and unbroken edges of bullet holes.
Liu and Chen [8] proposed an automatic target-scoring method based on video image analysis. They used different image processing techniques like image binarization, segmentation, morphological processing, Hough transforms, and the bullet difference method to calculate the position of the bull's eye and bullet holes. They managed to achieve a precision of 98.5% for the calculation of the firing score. Similarly, in another study for the recognition of bullet holes based on video image analysis, Roulin et al. [9] designed two approaches to compare the performances; the first approach is based on rough positioning, Support Vector Machine (SVM), Histograms of Oriented Gradient (HOG)algorithm and Convolutional Neural Network (CNN) for extraction and recognition of bullet holes. The second approach constitutes rough positioning followed by a deep CNN. The rough positioning in both approaches is carried out by frame extraction, the Otsu method, morphological filtering, and the region labeling process. Their experiments show that the SVM-based approach performed better, with a precision value of 98.57%.
In a study by Ali and Mansoor [10], a computer vision-based approach was designed for the automatic scoring of shooting targets, which started with the morphological processing to thicken the boundaries of bullet holes, followed by the segmentation of the target area by hysteresis thresholding. Likewise, a computer vision-based solution was also proposed by Rudzinki and Luckner [11]. Their proposed approach relied on image handling methods like Prewitt edge detection and Hough Transformations. The approach detected holes with an accuracy of 92% after eliminating false positives. Zin et al.[12] worked on automating the scoring system of archery targets. They began with dilating the edges of arrow hits using morphological processing. Afterward, the target area was segmented using color and shape features. To handle illumination variations, they used dynamic thresholding. Su and Chen [13] presented an approach for extracting targets to automate the scoring system. They applied a perspective transformation to convert input into a standard rectangle. Then, the flood-filled algorithm was used to eliminate the interference information.
For real-time detection, integrated CNNs are used by the researchers to enhance the detection performance of the algorithm. Continuous advancements in YOLO and SSD regression-based algorithms [14] exist. The accuracy of these algorithms for multiscale targets and small objects is not high. Using a lightweight model is another hot issue in the target detection domain [15]. So, to reduce the number of network computations, Ren and Bao [16] used MobileNet as a primary network, and standard convolution was replaced with the inverse residual convolution in the SSD detection layer. Du et al. [17] trained two neural networks for bullet hole detection, i.e., one is the original Faster-RCNN, and the second is the improved model based on Faster-RCNN. The experiment showed that their improved model (based on Faster-RCNN) performed better than the original Faster-RCNN by enhancing the average precision by 20.3%. Based on the MobileNet-SSD network, the time characteristic of the video is used by Li et al.[18], to improve the confidence level and stability of the detection. The algorithms/frameworks that are computationally less extensive (lightweight) and have fast detection speeds are generally low in accuracy, making it hard to trade between accuracy and computational load[19,20]. The choice of lightweight models is interconnected with real-time detection capabilities since they infer fast while consuming the least computational resources [21].
Therefore, in the current study, seven different models (including lightweight) are trained, and their performances are compared for the bullet hole detection and the score calculation.
3. Materials and Methods
3.1. Dataset
The collection and processing of data are crucial steps in any research. The section explains how the dataset was gathered, followed by some processing techniques to prepare it. The dataset used in this study is made public. The study used 2784 images for training, 202 images for validation, and 113 images were kept aside for final testing.
3.1.1. Initial Data Collection
The initial data for the paper was collected from shooters at a shooting range in Haarlem, the Netherlands. The dataset comprises ten unique cards, each of which is 26 by 26 centimeters in size and has ten different rings. These rings are assigned a score value ranging from 1 to 10, with a value of 0 assigned for a missed shot. If a shooter shoots inside the 7-ring but breaks the 8-ring’s line, a score of 8 is given for that shot. Similarly, if a shooter shoots the same bullet hole, the same score is assigned for that shot. Figure 2 shows an example of the shooting card obtained from the shooting range with annotations to provide a clear understanding of the various elements of the card.
The following is a numbered list of the different components and their respective meanings:
- The main target consists of 10 concentric rings, with the outer ring worth 1 point and the bull’s eye worth 10 points.
- A bullet hole represents a shot fired by a shooter with a score value of 2.
- A bullet hole that crosses the next ring refers to a bullet hole where the major part was shot in the 6-point area, but the mark touches the 7-point boundary. In such cases, a score of 7 is awarded to the shooter.
- A bullet hole that crosses the next ring denotes a shot fired on the bullseye line, where the highest score ring is considered for scoring purposes. In this instance, the shooter hits the bullseye, and a score of 10 is assigned for this shot.
- Shot score: The shooter records the score for each of the five shots fired during the session. These scores are added to get the total score.
- Club and shooter name: The shooter writes their name and the club's name where they shoot.
- Place and date: The shooter indicates the shooting range's location and the session's date.
- Logo: This is the logo of the shooting club.
3.1.2. Data Generation
To include samples in the dataset with shots from different locations on the shooting card, the Python script was written to generate more data. To create data, a series of images of a blank target was generated, and then, five times randomly, a spot within the target was chosen for a bullet hole to be placed. The generator has around sixty different bullet holes in total. These bullet holes are cut out from actual images of shooting cards and have had their background removed. The bullet holes were randomly rotated and distorted based on the width and height of the detected target. This distortion can be seen in Figure 3. If the randomly generated proposed bullet location is in the black circle, the bullet hole PNG kept it as realistic as possible.
In total, around forty percent of the dataset consists of generated data. An argument against using this type of generation could be that this could make the model too focused to detect the specific type of bullet hole. Still, the model predicts the bullet holes directly as classes. The model learns the class of the annotated bullet hole mainly on the context of where it is located and not by the way it looks.
3.1.3. Data Annotation
A total of 1243 original images were annotated using Roboflow API. Table 1 shows all of the different classes annotated in the dataset. Technically, only the bullet hole classes are necessary to calculate the score, but the target and the black inner circle were also annotated. The reason for this is to be able to generate data with this information as well as be able to predict more accurately by zooming in on the detected target. This can be a helpful feature when the photo taken has a shooting card at varied distances. The last column of the table represents how many times each class has been annotated in the dataset. Classes like the ”Target” and the ”Black contour” were most annotated because they appear on every image. The lowest annotated class is ten since this is the smallest area and the least likely to be hit by either the random generation or actual humans.
An example of annotations is shown in Figure 4a. Every bullet has a different class concerning the score. Figure 4b shows an edge case when a bullet hole touches the boundary. The hole appears to be more in the eight than in the nine. In the dataset, this is annotated as a nine. This is because two corners of the bullet hole cross into the nine, which means the advantage could be given to the shooter.
3.1.4. Data Augmentation
Before the annotated dataset was used for model training, images were resized to 640x640, which is the requirement of the used models. Secondly, the dataset was expanded to increase its size and avoid overfitting. This dataset expansion was carried out by performing different operations (e.g., rotation, blur, flip, etc.) on the images; the technique is known as data augmentation [22]. Table 2 shows all the implemented augmentations using Roboflow API.
3.2. Models
3.2.1. YOLO
YOLO belongs to the single-shot detection category, and its first version was published in 2015 [23]. It carries out object detection by splitting the image into a k x k grid of equal dimensions. Each grid is responsible for detecting the object if its center falls inside the grid. A grid can predict a few bounding boxes with a specific confidence value. Each predicted bounding box comprises five values, i.e., x and y values for the center of the bounding box, width, height, and confidence value. To choose the most representative bounding box in the grid and to remove the excess boundary boxes, YOLO uses the Intersection over Union (IoU) and Non-Suppression Method (NSM), respectively [24]. YOLOv8 is the latest version of the YOLO algorithm and is released by Ultralytics in July 2023. The entire architecture of YOLOv8 can be split into two main parts: the backbone and the head, as shown in Figure 5.
YOLOv8 uses a modified CSPDarknet53 as a backbone [25]. The backbone starts with two convolutional layers. Each convolutional layer consists of a convolutional layer and a batch normalization with the activation function SiLI (Sigmoid Linear Unit). YOLOv8 uses a Spatial Pyramid Pooling Fast (SPPF) module at the end of the backbone. The SPPF layer intends to speed up the computation by pooling features of different scales into a fixed-size feature map. An SPPF layer consists of one convolutional layer and three max pooling layers. The output of each pooling layer is then concatenated into a single output. Then, one more layer of convolution is applied.
YOLOv8 makes use of a decoupled head. This means that the classification and the object detection are treated separately. The activation function for object detection is sigmoid, representing the probability of a bounding box containing an object. The softmax function is used for the classification probability of each class. In Figure 4, the three outputs in the head region are for objectness, classification, and regression. The head of YOLOv8 is anchor-free, eliminating the need for anchor boxes and thus making the model easy to train on different datasets. YOLOv8 is also the first version that introduces soft NMS instead of NMS. This means overlapping bounding boxes are not entirely removed; the target information is preserved, eventually reducing cases like FP and FN [26].
YOLOv8 further has five variants ranging from nano to extra-large models. The choice of the models is to be made by a tradeoff between the required accuracy and the inference time[27]. In the case of finding the points scored on a shooting card, speed is of significant importance. For this reason, nano, small, and medium versions of YOLOv8 are used in the study.
3.2.2. Detectron2
Detectron was released by Facebook AI Research on October 9, 2019, as an upgrade to the original detectron2 framework. This framework is primarily designed for object detection and instance segmentation tasks. The framework is built on the PyTorch deep learning library, enabling integration with other neural network architectures and facilitating experimentation. Detectron2 consists of four main components: the backbone, the neck, the Region Proposal Network (RPN), and the head.
Figure 6 shows the architecture of detectron2. The backbone is responsible for feature extraction from the input image, using various architectures such as ResNet, ResNeXt, and MobileNet. These architectures are often pre-trained on large-scale image datasets like ImageNet. The pretraining process involves training a network on many labeled images from ImageNet to learn general visual representations. ImageNet is an extensive dataset that leverages the hierarchical organization provided by WordNet, a lexical database. The backbone network consists of several convolutional layers organized hierarchically. These layers gradually down-sample the spatial dimensions of the feature maps while increasing the number of channels [28].
The neck component, implemented as the Feature Pyramid Network (FPN), refines the feature maps obtained from the backbone. FPN combines features from different scales to create a multiscale feature pyramid, enabling the detection of objects at various sizes and scales within the image. Feature pyramids are a fundamental element in recognition systems that enable the detection of objects at multiple scales [29]. However, specific modern deep learning-based object detectors, like YOLO, do not contain this part and are called single-shot detectors.
After analyzing multi-scale features, the Region Proposal Network (RPN) generates approximately 1,000 box proposals, each with a confidence score. These proposals represent potential bounding boxes encompassing objects of interest within the image.
Detectron2 utilizes a box head to crop and wrap feature maps into multiple fixed-sized features. A maximum of 100 boxes are filtered out using NMS.
In the study, from the detectron2 framework, four models were chosen. These models are Faster RCNN-50, Faster RCNN-101, RetinaNet-50, and RetinaNet-101, characterizing FPN and backbone with either Resnet 50 or 101. Faster RCNN is a two-shot detector recognized as the first model that combines the features of region proposals with object classification [30]. It comprises two parts, e.g., the first is CNN-based, which proposes regions, and the second is the detector [31]. On the other hand, RetinaNet is a single-shot detector that uses an FPN backbone on the top of the feedforward Resnet to produce a multiscale feature pyramid [29]. RetinaNet is available in 2 sizes, a 50-layer and 101-layer network known as RetinaNet-50 and RetinaNet-101, respectively. RetinaNet uses a focal loss function, enabling it to achieve an accuracy comparable to the two-shot detector (e.g., Faster RCNN)while having a faster speed [32].
3.3. Evaluation Metrics
After training and validating the models, the performance of the trained models is measured by running the model on the test dataset. Choosing the right metrics for assessing the performance of object detection models can be challenging. Mostly, the models use precision, recall, and mean Average Precision (mAP) as metrics. These metrics are defined as follows:
Precision (P)= TP/TP+FP
Recall (R) =TP/TP+FN
Where TP refers to true positives (when the algorithm correctly detects a bullet hole with the bounding box), FP represents false positives (when the bounding box is generated on a location without having any bullet hole). FN corresponds to false negatives (when a bullet hole is undetected). The IoU between the ground truth and the generated bounding box is calculated using Equation (4). In each image, for every object, if the value of IoU is above the predetermined threshold( mostly 0.5), then that is regarded as TP; otherwise, the result is FP.
A trained model generates a TP by using the coordinates of the bounding box and the confidence score (the confidence for each detection made by the model). Average Precision (AP) is the area under the precision-recall curve and is calculated as shown in Equation (3).
IoU= (Object ∩ Detected box) / (Object ∪ Detected box)
The value of AP is between 0 and 1 to summarize the different precision values into a single value representing the average of all precisions. Moreover, mAP is calculated by taking the average of AP values for all classes and is shown in Equation (5).
Primarily, two different threshold values are used by object detection models, i.e., mAP50 (mean of AP with confidence values between 0 and 0.50) and mAP50-90 ( the mean of AP with confidence scores between 0.50 and 0.95). For object detection models, precision, recall, mAP50, and mAP50-95 are considered the most common metrics [33]. The detectron2 framework generates some other metrics, as listed below.
- AP75: This metric calculates the average precision at 75% overlap. It measures the precision at different recall values, considering a detection as TP if the IoU overlap is at least 75%.
- APl: The ”average precision (large)” calculates the precision at different recall values for objects with large sizes (area>962 ). It focuses on evaluating the performance of detecting larger objects accurately.
- APm: This metric is the average precision (medium) and measures the precision at different recall values for objects with medium sizes (322 >area>962). It is used to assess the performance of detecting objects of moderate dimensions.
- APs: The ”average precision (small)” calculates the precision at different recall values for objects with small sizes (area<322 ). It evaluates the model’s ability to detect smaller objects accurately
4. Results
The seven models used in this study include RetinaNet-50, RetinaNet-101, Faster RCNN-50, Faster RCNN-101, and three variants of YOLOv8. Four models( RetinaNet-50, RetinaNet-101, Faster RCNN-50, and Faster RCNN-101) are trained using the detectron2 framework and based on the Feature Pyramid Networks (FPN) architecture. A test dataset comprising 113 images was used to assess the performance of the trained models. The AP scores of testing RetinaNet-50, RetinaNet-101, Faster RCNN-50, and Faster RCNN-101 across thirteen classes are shown in Table 3. The variations of AP capture the models’ precision and recall capabilities at different IoU thresholds, providing insights into their ability to accurately localize the target and bullet holes.
Table 4 shows the different variations of precision and recall scores of RetinaNet-50, RetinaNet-101, Faster RCNN-50, and Faster RCNN-101. The metrics in Table 4 include variations of Average Recall (AR). The variations of AR capture the models’ recall capabilities at various IoU thresholds, reflecting their abilities to localize the target and bullet holes accurately.
Table 5 shows the performance of three variant models of YOLOv8 across the detection of all thirteen classes. Three variant models of YOLOv8 are nano (YOLOv8n), small (YOLOv8s), and medium (YOLOv8m). The table includes mAP scores of all three models at two different threshold values, i.e., 50 and 50-90. The three variants indicate the architectural size of the model, so their comparison facilitates finding a model that is good in accuracy and speed.
Table 6 shows the precision and recall metrics of YOLOv8 models. The speed metric is included because it is significant for the real-time application of bullet hole detection.
5. Discussion
The results shared in the previous section show the significant difference between the performance of detectron2 and YOLO models. The mAP50 scores of these models range from 71.8% to 97%. The RetinaNet-101 got the lowest precision value of 66.41%, while the YOLOv8m achieved the highest mAP value of 96.7%. All three YOLOv8 models outperformed the detectron2 models. The best-performing detectron2 model is the Faster RCNN-101, with an AP50 score of 89.8%. YOLO v8 models also generated the speed metrics, which indicates that though YOLOv8 performs the best (with the highest mAP value of 96.7%), the time taken by the model is 5.7ms which is more than double the time taken by the model YOLOv8s (which also performed well with the mAP value of 96.5%). So, if the inference time is the critical requirement in a real-time environment, then YOLOv8s is a better choice. To get more insight into the performance of these models on the test dataset, two images from the test dataset are randomly chosen and are shown in Figure 7.
The results of bullet hole detection from the two chosen test images by the detectron2 models are shown in Figure 8. The colored highlighted boxes show the detection outcome of the model. Two number values are located atop; the first integer indicates the shooter's score, and the second decimal value is the confidence score. It can be seen that the localization of bullet holes is sound, with clear bounding boxes around the holes. RetinaNet models have lower confidence values of bullet hole scores than their Faster R-CNN counterparts. Another thing that should not be overlooked is that these models exhibit some errors in their classification capabilities regarding classes ranging from 2 to 10. The models classify one point/class higher than the actual value. This is something that all models trained via detectron2 share, and it is worth noting that this could be because all detectron2 models used in this experiment share the FPN architecture.
Figure 9 shows the bullet hole detection results of the YOLOv8n, YOLOv8s, and YOLOv8m models, respectively. Notably, all three models exhibit good results, accurately identifying and localizing objects within the images.
However, it is interesting to discuss one particular observation in the testing results (in test image-2), where the bullet is mainly in the 1-score region, while a slight corner is touching the 2-score region boundary. YOLOv8 nano and small models classified it as a 2 with confidence scores of 0.79 and 0.81, respectively. This particular bullet hole could be more accurately classified as a 1, highlighting the potential limitation of YOLOv8n and YOLOv8s. YOLOv8m rightly detected and labeled it 1 with a 0.69 confidence score. Nevertheless, it is worth noting that, in most cases, the advantage is given to the competitor, meaning that a human eye might also make this error.
Table 7 shows the summarized performance of all seven models used in the study. The best performance on the test dataset is demonstrated by YOLOv8m, with the highest mAP50 value of 96.7% and recall value of 94%. The study's results are very similar to those achieved by Kubera et al.[34], in which the researchers also compared the performance of Faster RCNN, RetinaNet, and YOLO. Though they used the older version 5 (YOLOv5) to detect three classes of pollen grains, YOLOv5l (Large) performed the best with a mAP50-95 value of 91.5%. Similarly, in another study to detect three different types of tomatoes, i.e., ripe, unripe, and diseased tomatoes, the performance of different models was compared by Yang et al.[35]. The comparison showed that YOLOv8 performed significantly better than Faster RCNN with high precision, recall, and framerate speed values.
6. Conclusions
The study investigated if automating the detection of bullet holes with a target from the shooting cards can be made possible by using object detection models. The study results demonstrated that it is possible to detect these scores correctly if the training and validation dataset annotations are done carefully. In the study, thirteen classes/ objects were annotated from the shooting cards to train the model, and YOLOv8m performed the best with the highest mAP value of 96.7%, which is a single-shot detector. The poorest performance is given by RetinaNet-101, with an mAP value of 66.4%, which is also a single-shot detector. In the study, lightweight models of YOLO were used, and it is seen that besides having fast inference speed, they can detect multiple objects. It is suggested that if the setup is implemented in a real-time situation, then YOLOv8s can generate competitive accuracy (mAP value 96.5%) at a higher speed (more than double) of YOLOv8m. To further improve the accuracy of YOLOv8s and YOLOv8m models, it is suggested to expand the dataset by having more images to ensure that all classes have equally annotated instances for training. Moreover, during the annotations of exceptional cases(e.g., when the bullet holes reside on boundaries between two numbers), help from some game experts may further improve the performance.
Author Contributions
Conceptualization, G. N., M. J. and S. R.; methodology, G. N., M. J. and S. R.; validation, G. N., M. J., and S. R.; formal analysis, G. N., M. J., and S. R.; investigation, G. N., M. J., and S. R.; data curation, G. N., M. J. and S. R.; writing—original draft preparation, B. M., G. N., M. J. and S. R.; resources, B, M.; writing—review and editing, B. M. and K. A.; visualization, G. N., M. J. and S. R.; supervision, B. M. and K. A. All authors have read and agreed to the published version of the manuscript.
Funding
No external funding or grant was received.
Institutional Review Board Statement
Not applicable.
Informed Consent Statement
Not applicable.
Data Availability Statement
The data used in this study is made available at [36]
Acknowledgments
The authors thank Katrin Tazelaar and Thijs Otter for providing support and help.
Conflicts of Interest
The authors declare no conflict of interest.
References
- Jiang, H.; Wang, J.; Gong, Y.; Rong, N.; Chai, Z.; Zheng, N. Online Multi-Target Tracking With Unified Handling of Complex Scenarios. IEEE Trans. Image Process. 2015, 24, 3464–3477. [Google Scholar] [CrossRef] [PubMed]
- Issa, A. H.; Hasan, S. D.; Ali, W. H. Automation of real-time target scoring system based on image processing technique. Journal of Mechanical Engineering Research and Developments 2021, 44, 316–323. [Google Scholar]
- Du, F.; Zhou, Y.; Chen, W.; Yang, L. Bullet hole detection using series Faster-RCNN and video analysis. Proc. SPIE 11041, Eleventh International Conference on Machine Vision (ICMV 2018), 15 March 2019; p. 110410Q. [Google Scholar] [CrossRef]
- Widayaka, P.D.; Kusuma, H.; Attamimi, M. Automatic Shooting Scoring System Based on Image Processing. Journal of Physics: Conference Series. [CrossRef]
- Yu, Y.; Cao, M.W.; Yu, F. Evibe: An improved Vibe algorithm for detecting moving objects. Chinese Journal of Scientific Instrument 2014, 35, 925–932. [Google Scholar]
- Gao, Y.; Wang, A. M.; Wang, F. H.; et al. Application of improved wavelet transform algorithm in image fusion. Laser Technology 2013, 37, 690–695. [Google Scholar]
- Jie, L.; Zhiming, Z.; Guangdong, Z. A Bullet holes detection algorithm based on wavelet transform and image fusion. The 2nd Information Technology and Mechatronics Engineering Conference (ITOEC 2016). [CrossRef]
- Liu, Q.; Chen, Y. Research on Automatic Target-scoring Method Based on Video Image Analysis Computer Engineering. 41, 212–215.
- Ruolin, Z.; Jianbo, L.; Yuan, Z.; Xiaoyu, W. Recognition of Bullet Holes Based on Video Image Analysis. IOP Conf. Ser.: Mater. Sci. Eng. 261, 012020. [CrossRef]
- Ali, F.; Bin Mansoor, A. Computer Vision based Automatic Scoring of shooting targets. 2008 IEEE International Multitopic Conference, Karachi, Pakistan, 2008; pp. 515–519. [Google Scholar] [CrossRef]
- Rudzinski, J.; Luckner, M. Low–Cost Computer Vision Based Automatic Scoring of Shooting Targets. In Knowledge Engineering, Machine Learning and Lattice Computing with Applications. KES 2012. Lecture Notes in Computer Science; Graña, M., Toro, C., Howlett, R.J., Jain, L.C., Eds.; Springer: Berlin, Heidelberg, 2013; vol 7828. [Google Scholar]
- Zin, T.T.; Oka, I.; Sasayama, T.; Ata, S.; Watanabe, H.; Sasano, H. Image Processing Approach to Automatic Scoring System for Archery Targets. 2013 Ninth International Conference on Intelligent Information Hiding and Multimedia Signal Processing, Beijing, China, 2013; pp. 259–262. [Google Scholar] [CrossRef]
- Su, Z.; Chen, W. Effective Target Extraction of Automatic Target-Scoring System. 2019 IEEE 4th Advanced Information Technology, Electronic and Automation Control Conference (IAEAC), Chengdu, China, 2019; pp. 1402–1406. [Google Scholar] [CrossRef]
- Yun, J.; Jiang, D.; Liu, Y.; Sun, Y.; Tao, B.; Kong, J.; Tian, J.; Tong, X.; Xu, M.; Fang, Z. Real-Time Target Detection Method Based on Lightweight Convolutional Neural Network. Front. Bioeng. Biotechnol. 2022, 10, 861286. [Google Scholar] [CrossRef]
- Liu, Y.; Xiao, F.; Tong, X.; Tao, B.; Xu, M.; Jiang, G.; Chen, B.; Cao, Y.; Sun, N. Manipulator trajectory planning based on work subspace division. Concurr. Comput. Pr. Exp. 2021, 34, e6710. [Google Scholar] [CrossRef]
- Ren, F.; Bao, Y. A Review on Human-Computer Interaction and Intelligent Robots. Int. J. Inf. Technol. Decis. Mak. 2020, 19, 5–47. [Google Scholar] [CrossRef]
- Du, F.; Zhou, Y.; Chen, W.; Yang, L. Bullet hole detection using series Faster-RCNN and video analysis. Proceedings Volume 11041, Eleventh International Conference on Machine Vision (ICMV 2018); p. 110410Q. [CrossRef]
- Li, G.; Jiang, D.; Zhou, Y.; Jiang, G.; Kong, J.; Manogaran, G. Human Lesion Detection Method Based on Image Information and Brain Signal. IEEE Access 2019, 7, 11533–11542. [Google Scholar] [CrossRef]
- Jiang, D.; Li, G.; Sun, Y.; Kong, J.; Tao, B.; Chen, D. Grip strength forecast and rehabilitative guidance based on adaptive neural fuzzy inference system using sEMG. Pers. Ubiquitous Comput. 2019, 26, 1215–1224. [Google Scholar] [CrossRef]
- Liu, G.; Hu, Y.; Chen, Z.; Guo, J.; Ni, P. Lightweight object detection algorithm for robots with improved YOLOv5. Eng. Appl. Artif. Intell. 2023, 123, 106217. [Google Scholar] [CrossRef]
- Chen, S.; Liao, Y.; Lin, F.; Huang, B. An Improved Lightweight YOLOv5 Algorithm for Detecting Strawberry Diseases. IEEE Access 2023, 11, 54080–54092. [Google Scholar] [CrossRef]
- Butt, M.; de Keijzer, A. Using Transfer Learning to Train a Binary Classifier for Lorrca Ektacytometery Microscopic Images of Sickle Cells and Healthy Red Blood Cells. Data 2022, 7, 126. [Google Scholar] [CrossRef]
- Redmon, J.; Divvala, S.; Girshick, R.; Farhadi, A. You Only Look Once: Unified, Real-Time Object Detection. In Proceedings of the 2016 IEEE Conference on Computer Vision and Pattern Recognition (CVPR), Las Vegas, NV, USA, 27–30 June 2016; pp. 779–788. [Google Scholar]
- Sportelli, M.; Apolo-Apolo, O.E.; Fontanelli, M.; Frasconi, C.; Raffaelli, M.; Peruzzi, A.; Perez-Ruiz, M. Evaluation of YOLO Object Detectors for Weed Detection in Different Turfgrass Scenarios. Appl. Sci. 2023, 13, 8502. [Google Scholar] [CrossRef]
- Reis, D.; Kupec, J.; Hong, J.; Daoudi, A. Real-Time Flying Object Detection with YOLOv8. arXiv 2023, arXiv:2305.09972. [Google Scholar]
- Meng, X.; Liu, Y.; Fan, L.; Fan, J. YOLOv5s-Fog: An Improved Model Based on YOLOv5s for Object Detection in Foggy Weather Scenarios. Sensors 2023, 23, 5321. [Google Scholar] [CrossRef]
- Kulkarni, U.; Naregal, K.; Farande, V.; Guttigoli, S.; Angadi, A.; Ujwane, R. An Object Detection Approach for Automated Detection of Groove Line in Tube Yoke. ITM Web Conf. 2023, 53, 01007. [Google Scholar] [CrossRef]
- Ju, R.-Y.; Cai, W. Fracture Detection in Pediatric Wrist Trauma X-ray Images Using YOLOv8 Algorithm. arXiv 2023, arXiv:2304.05071. [Google Scholar] [CrossRef]
- Lin, T.-Y.; Dollar, P.; Girshick, R.; He, K.; Hariharan, B.; Belongie, S. Feature pyramid networks for object detection. In Proceedings of the IEEE Conference on Computer Vision and Pattern Recognition (CVPR), July 2017. [Google Scholar]
- Ren, S.; He, K.; Girshick, R.; Sun, J. Faster R-CNN: Towards Real-Time Object Detection with Region Proposal Networks. In Proceedings of the Advances in Neural Information Processing Systems; Cortes, C., Lawrence, N., Lee, D., Sugiyama, M., Garnett, R., Eds.; Curran Associates, Inc.: Red Hook, NY, USA, 2015; Volume 28. [Google Scholar]
- Girshick, R. Fast R-CNN. In Proceedings of the IEEE International Conference on Computer Vision 2015, Santiago, Chile, 7–13 December 2015; pp. 1440–1448. [Google Scholar]
- Lin, T.-Y.; Goyal, P.; Girshick, R.; He, K.; Dollar, P. Focal Loss for Dense Object Detection. In Proceedings of the IEEE International Conference on Computer Vision 2017, Venice, Italy, 22–29 October 2017; pp. 2980–2988. [Google Scholar]
- Dang, F.; Chen, D.; Lu, Y.; Li, Z. YOLOWeeds: A novel benchmark of YOLO object detectors for multi-class weed detection in cotton production systems. Comput. Electron. Agric. 2023, 205. [Google Scholar] [CrossRef]
- Kubera, E.; Kubik-Komar, A.; Kurasiński, P.; Piotrowska-Weryszko, K.; Skrzypiec, M. Detection and Recognition of Pollen Grains in Multilabel Microscopic Images. Sensors 2022, 22, 2690. [Google Scholar] [CrossRef] [PubMed]
- Yang, G.; Wang, J.; Nie, Z.; Yang, H.; Yu, S. A Lightweight YOLOv8 Tomato Detection Algorithm Combining Feature Enhancement and Attention. Agronomy 2023, 13, 1824. [Google Scholar] [CrossRef]
- https://universe.roboflow.com/project-bat-bullet-hole-detection/bullet-hole-object-detection.
Figure 1.
Workflow of proposed methodology.
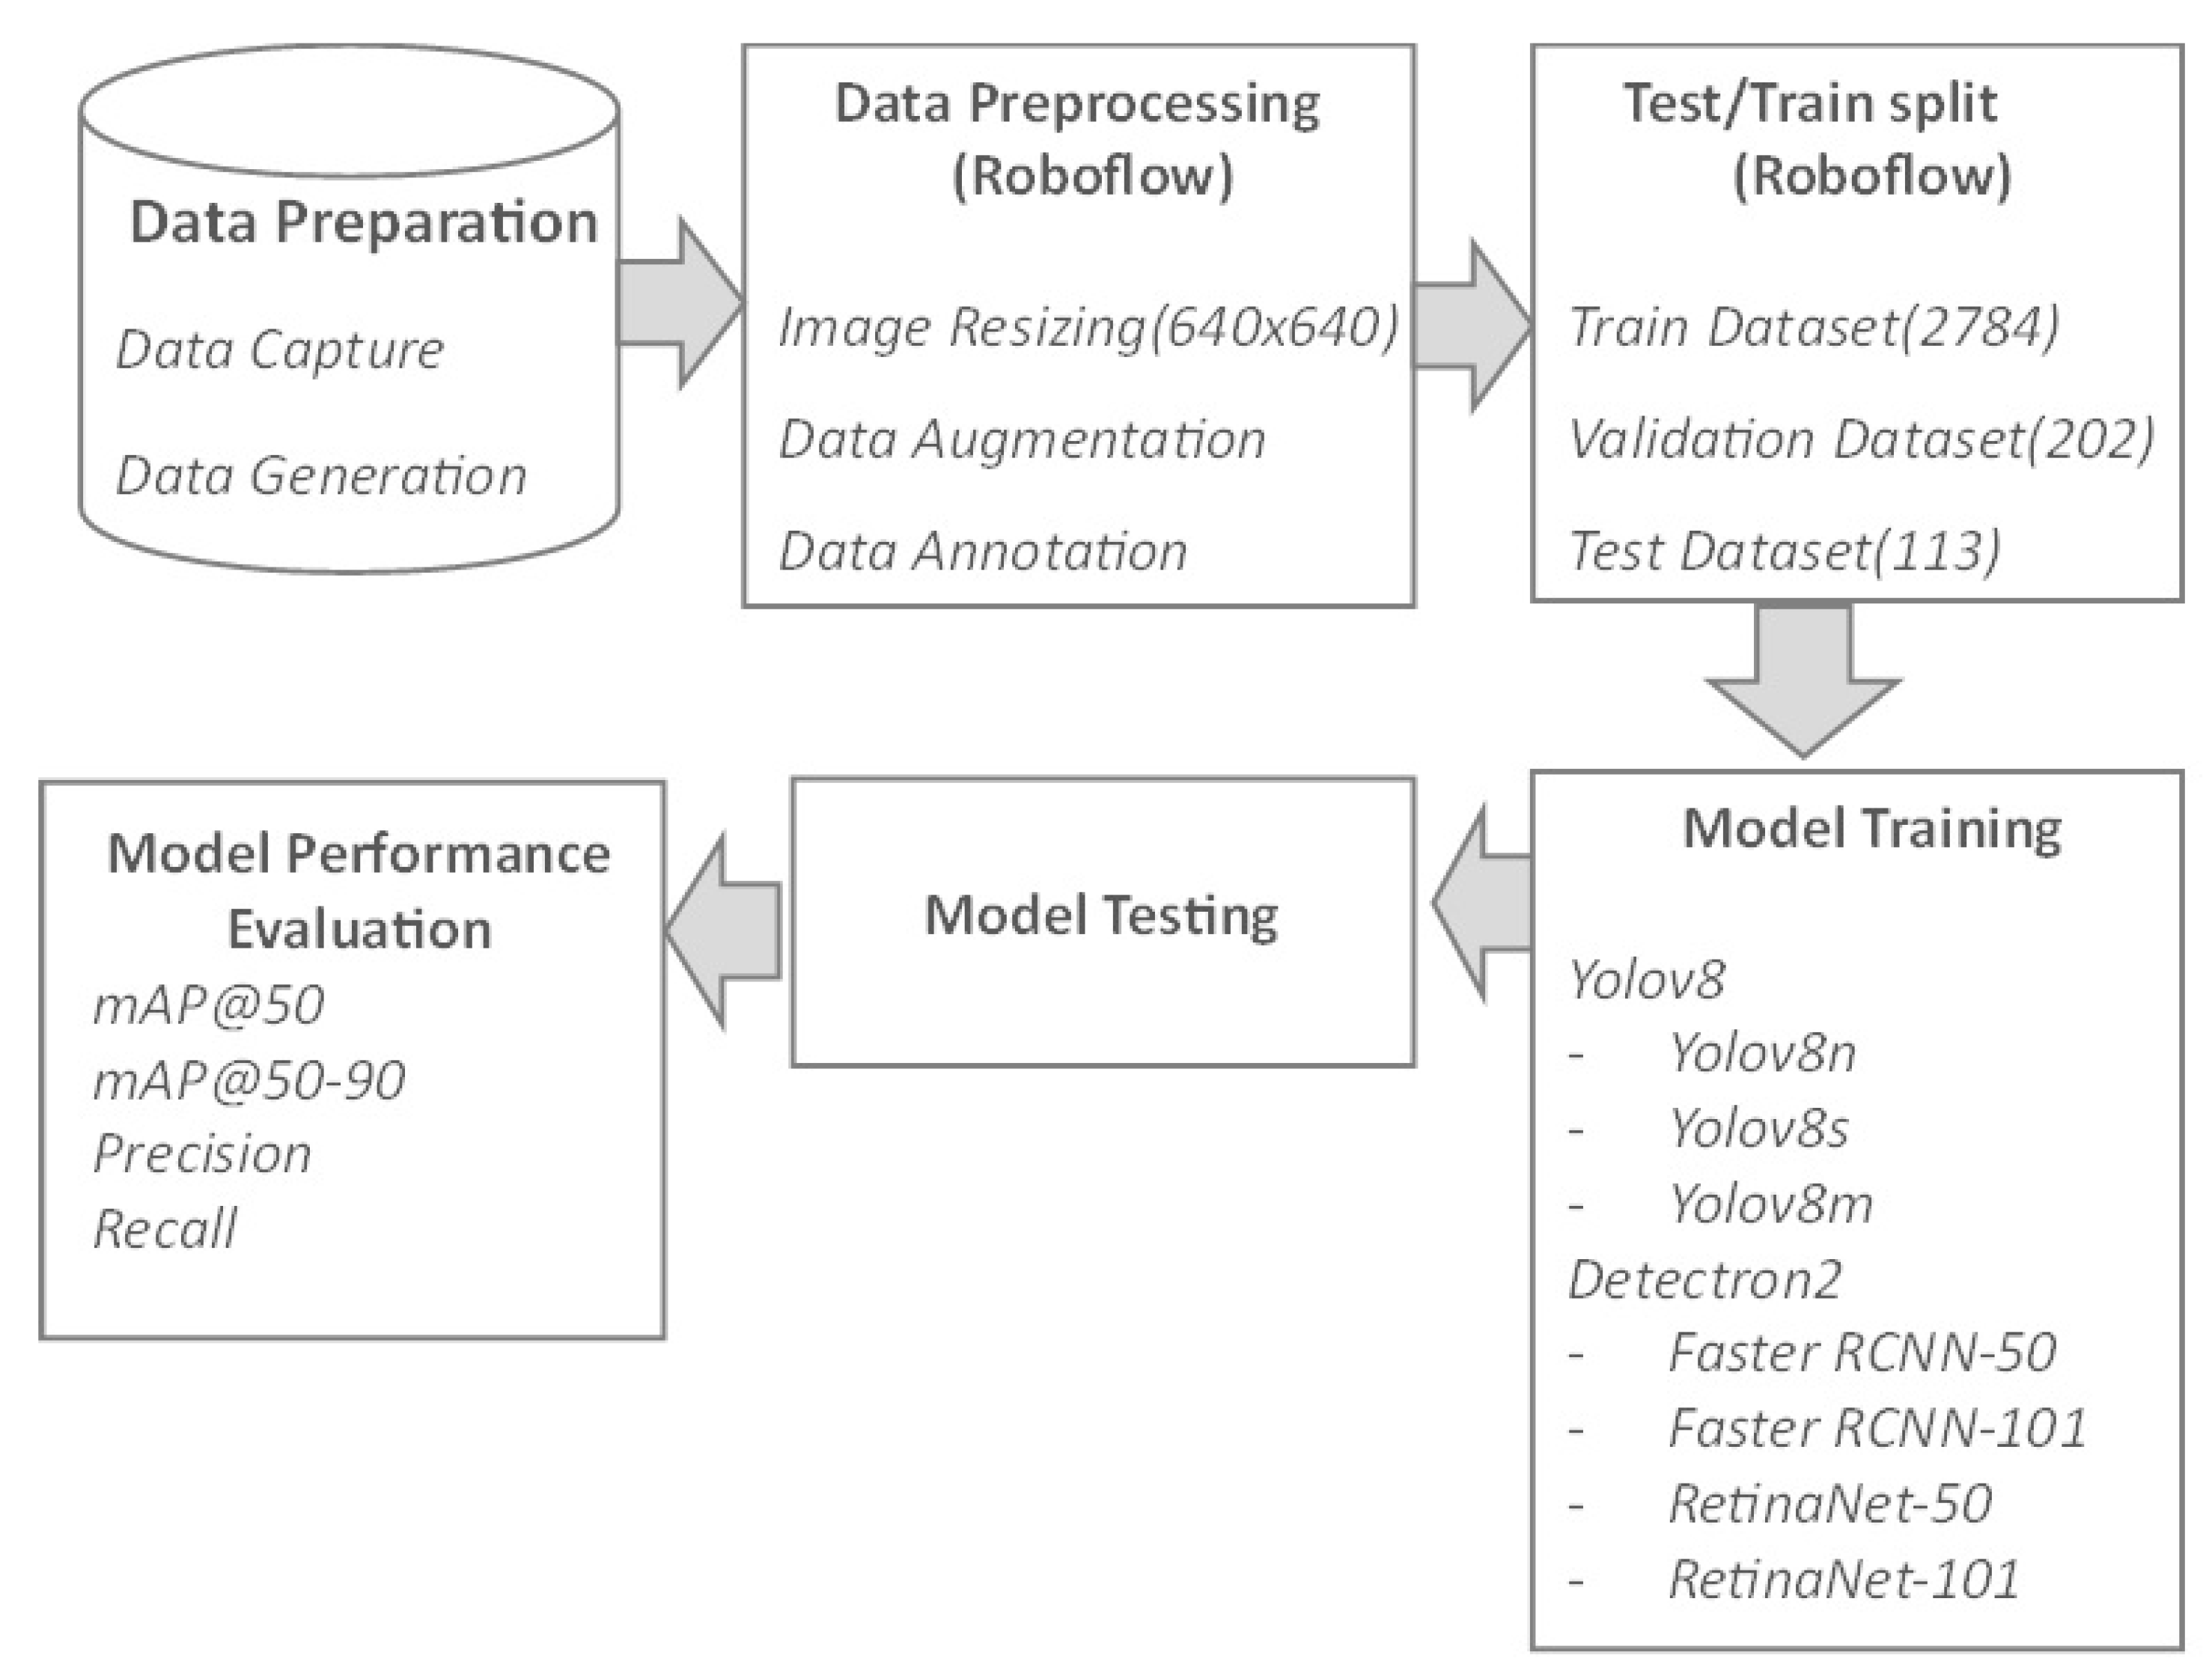
Figure 2.
Target sample with regions of interest.
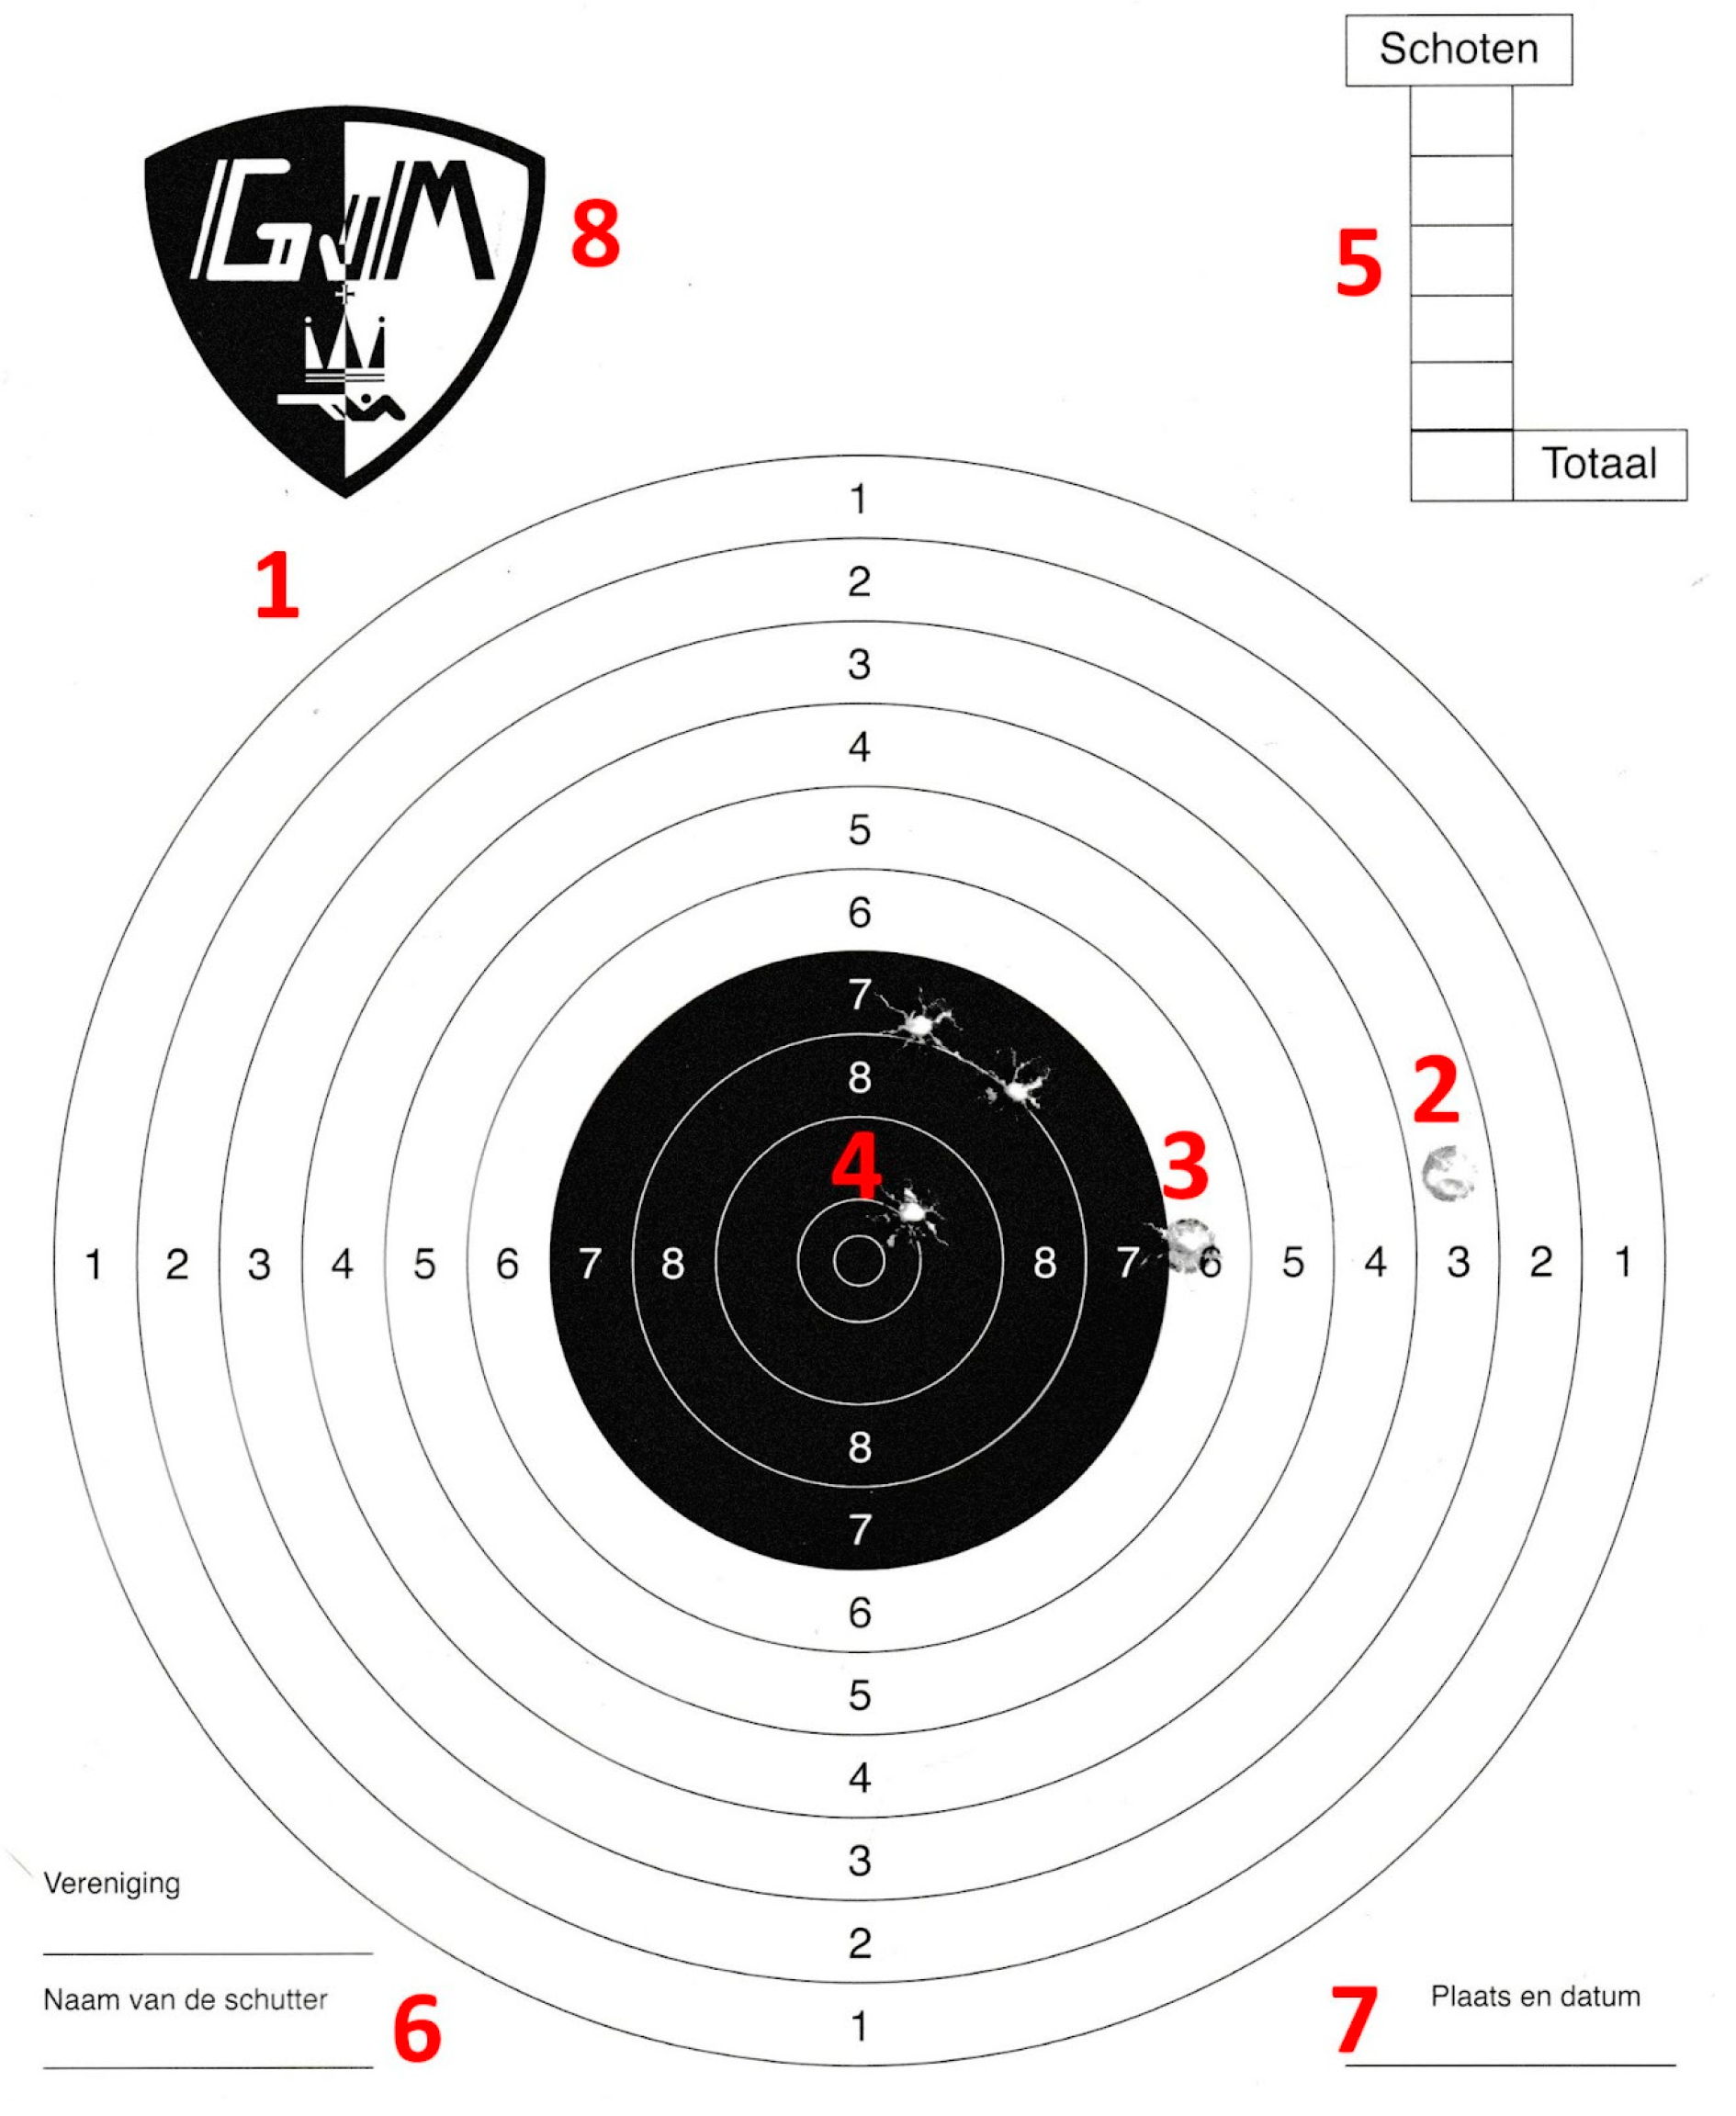
Figure 3.
Clean target with generated bullet holes.
Figure 4.
Bullet annotations: (a) example of annotations in an image (b) bullet hole touching the other boundary.
Figure 4.
Bullet annotations: (a) example of annotations in an image (b) bullet hole touching the other boundary.
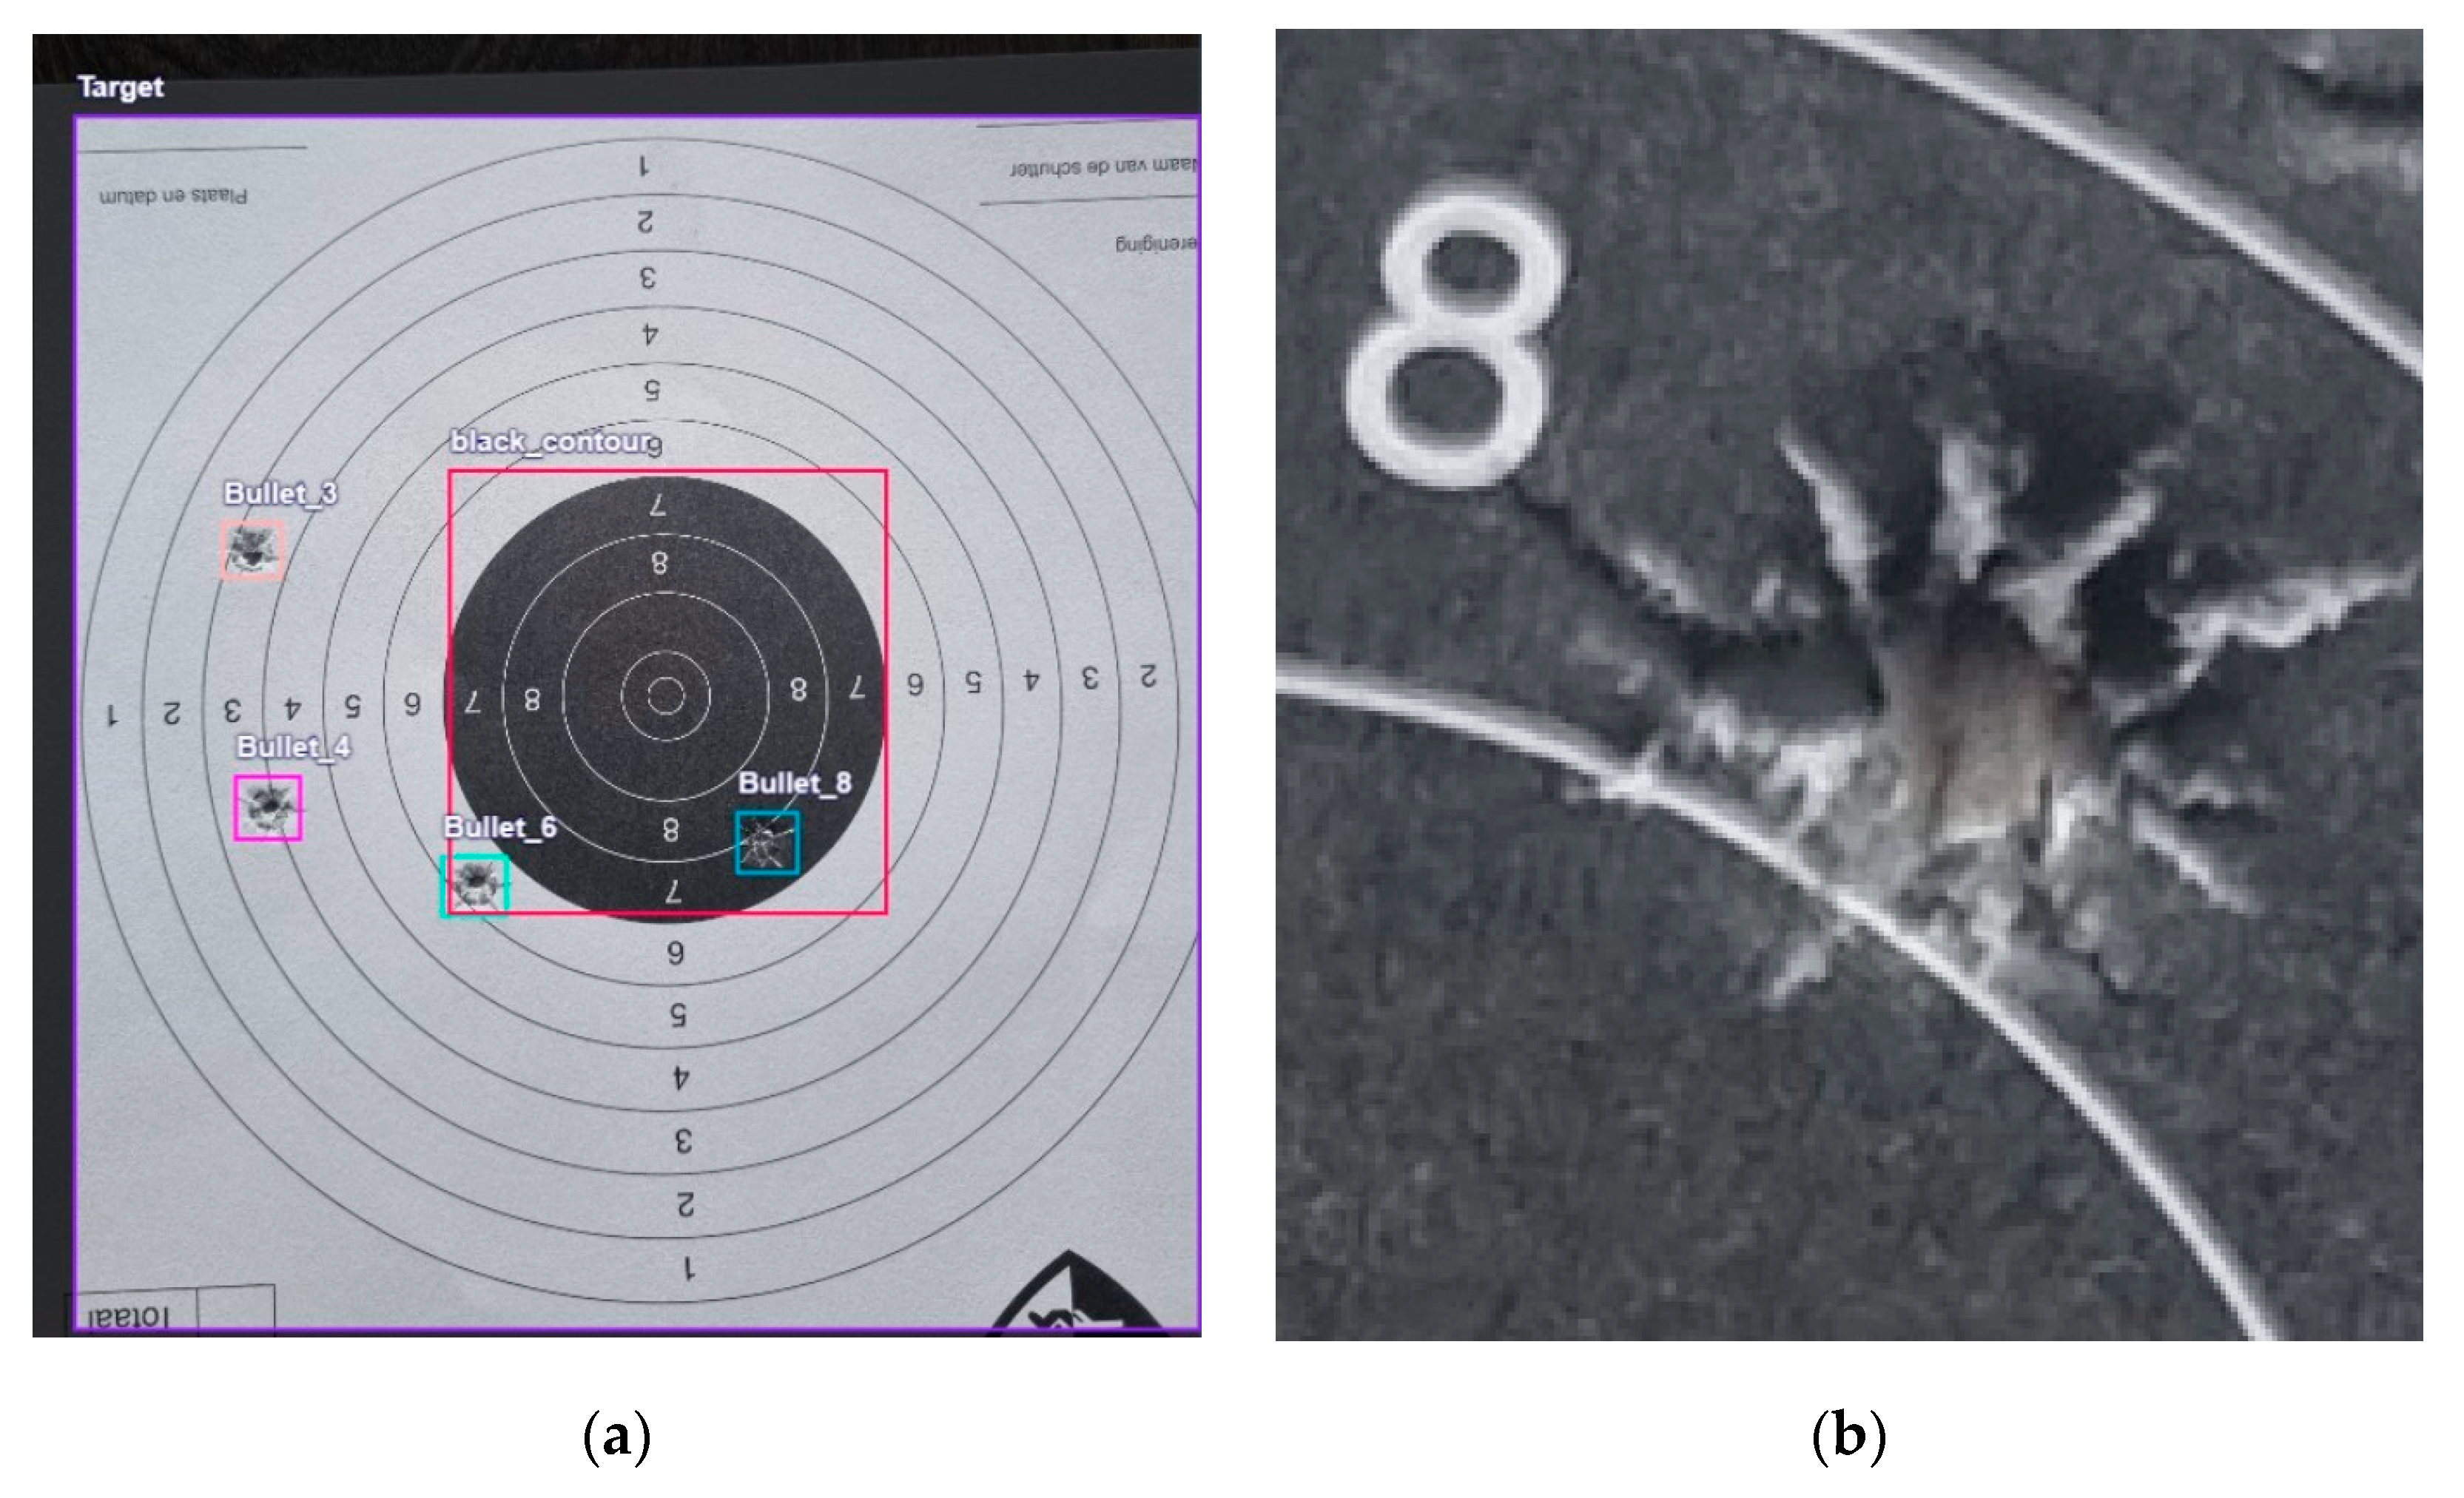
Figure 5.
YOLOv8 Architecture.
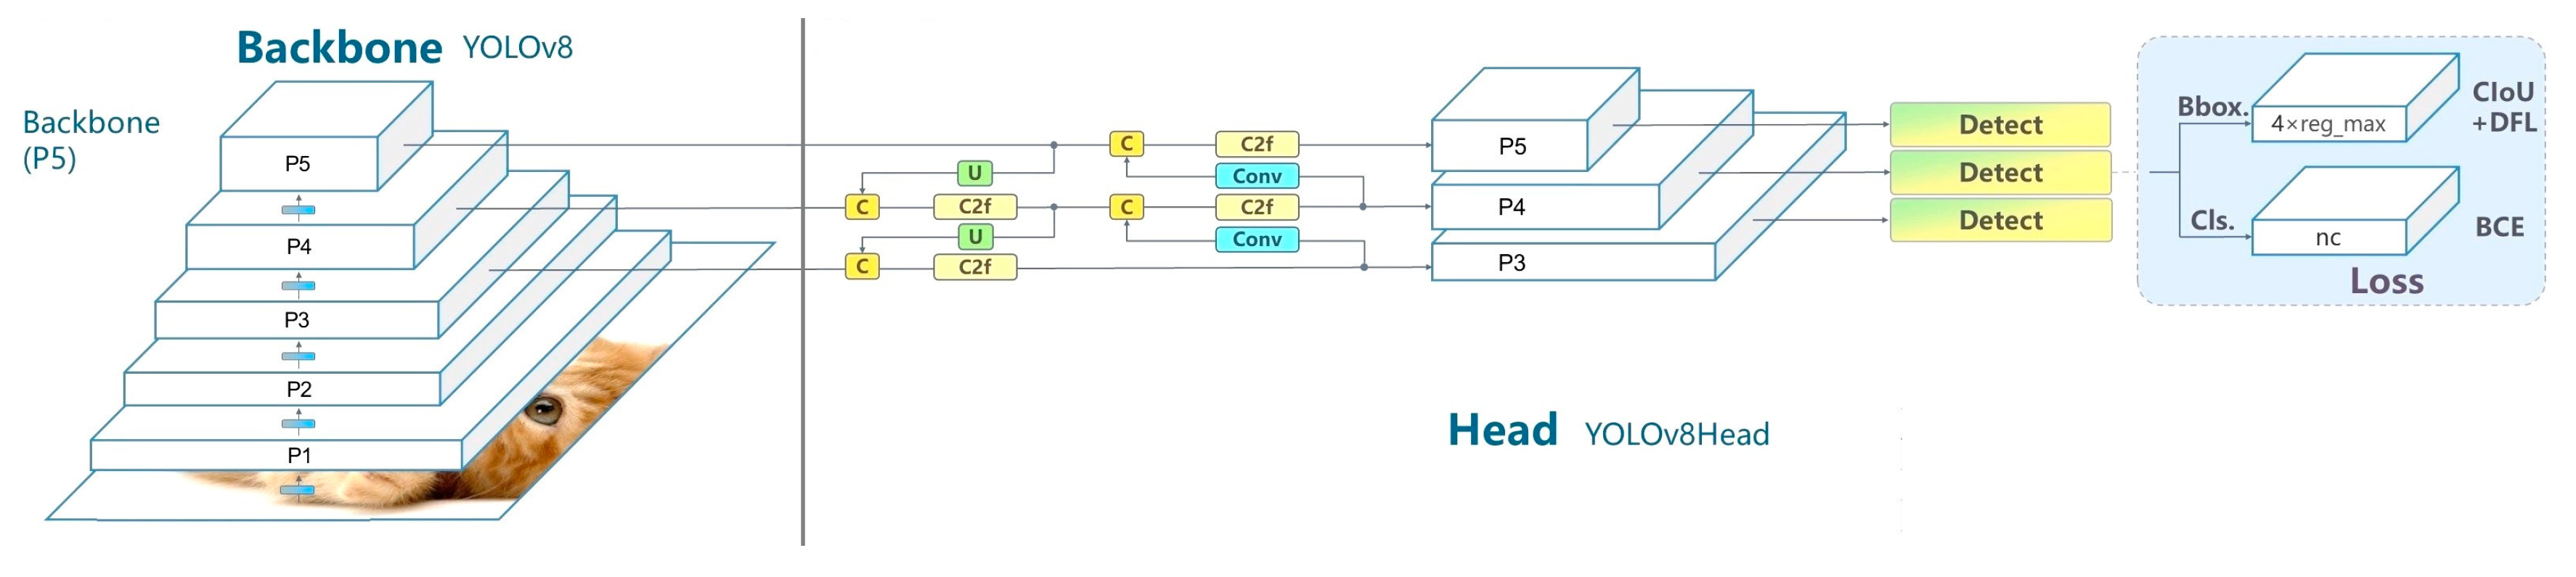
Figure 6.
The architecture of Detectron2.
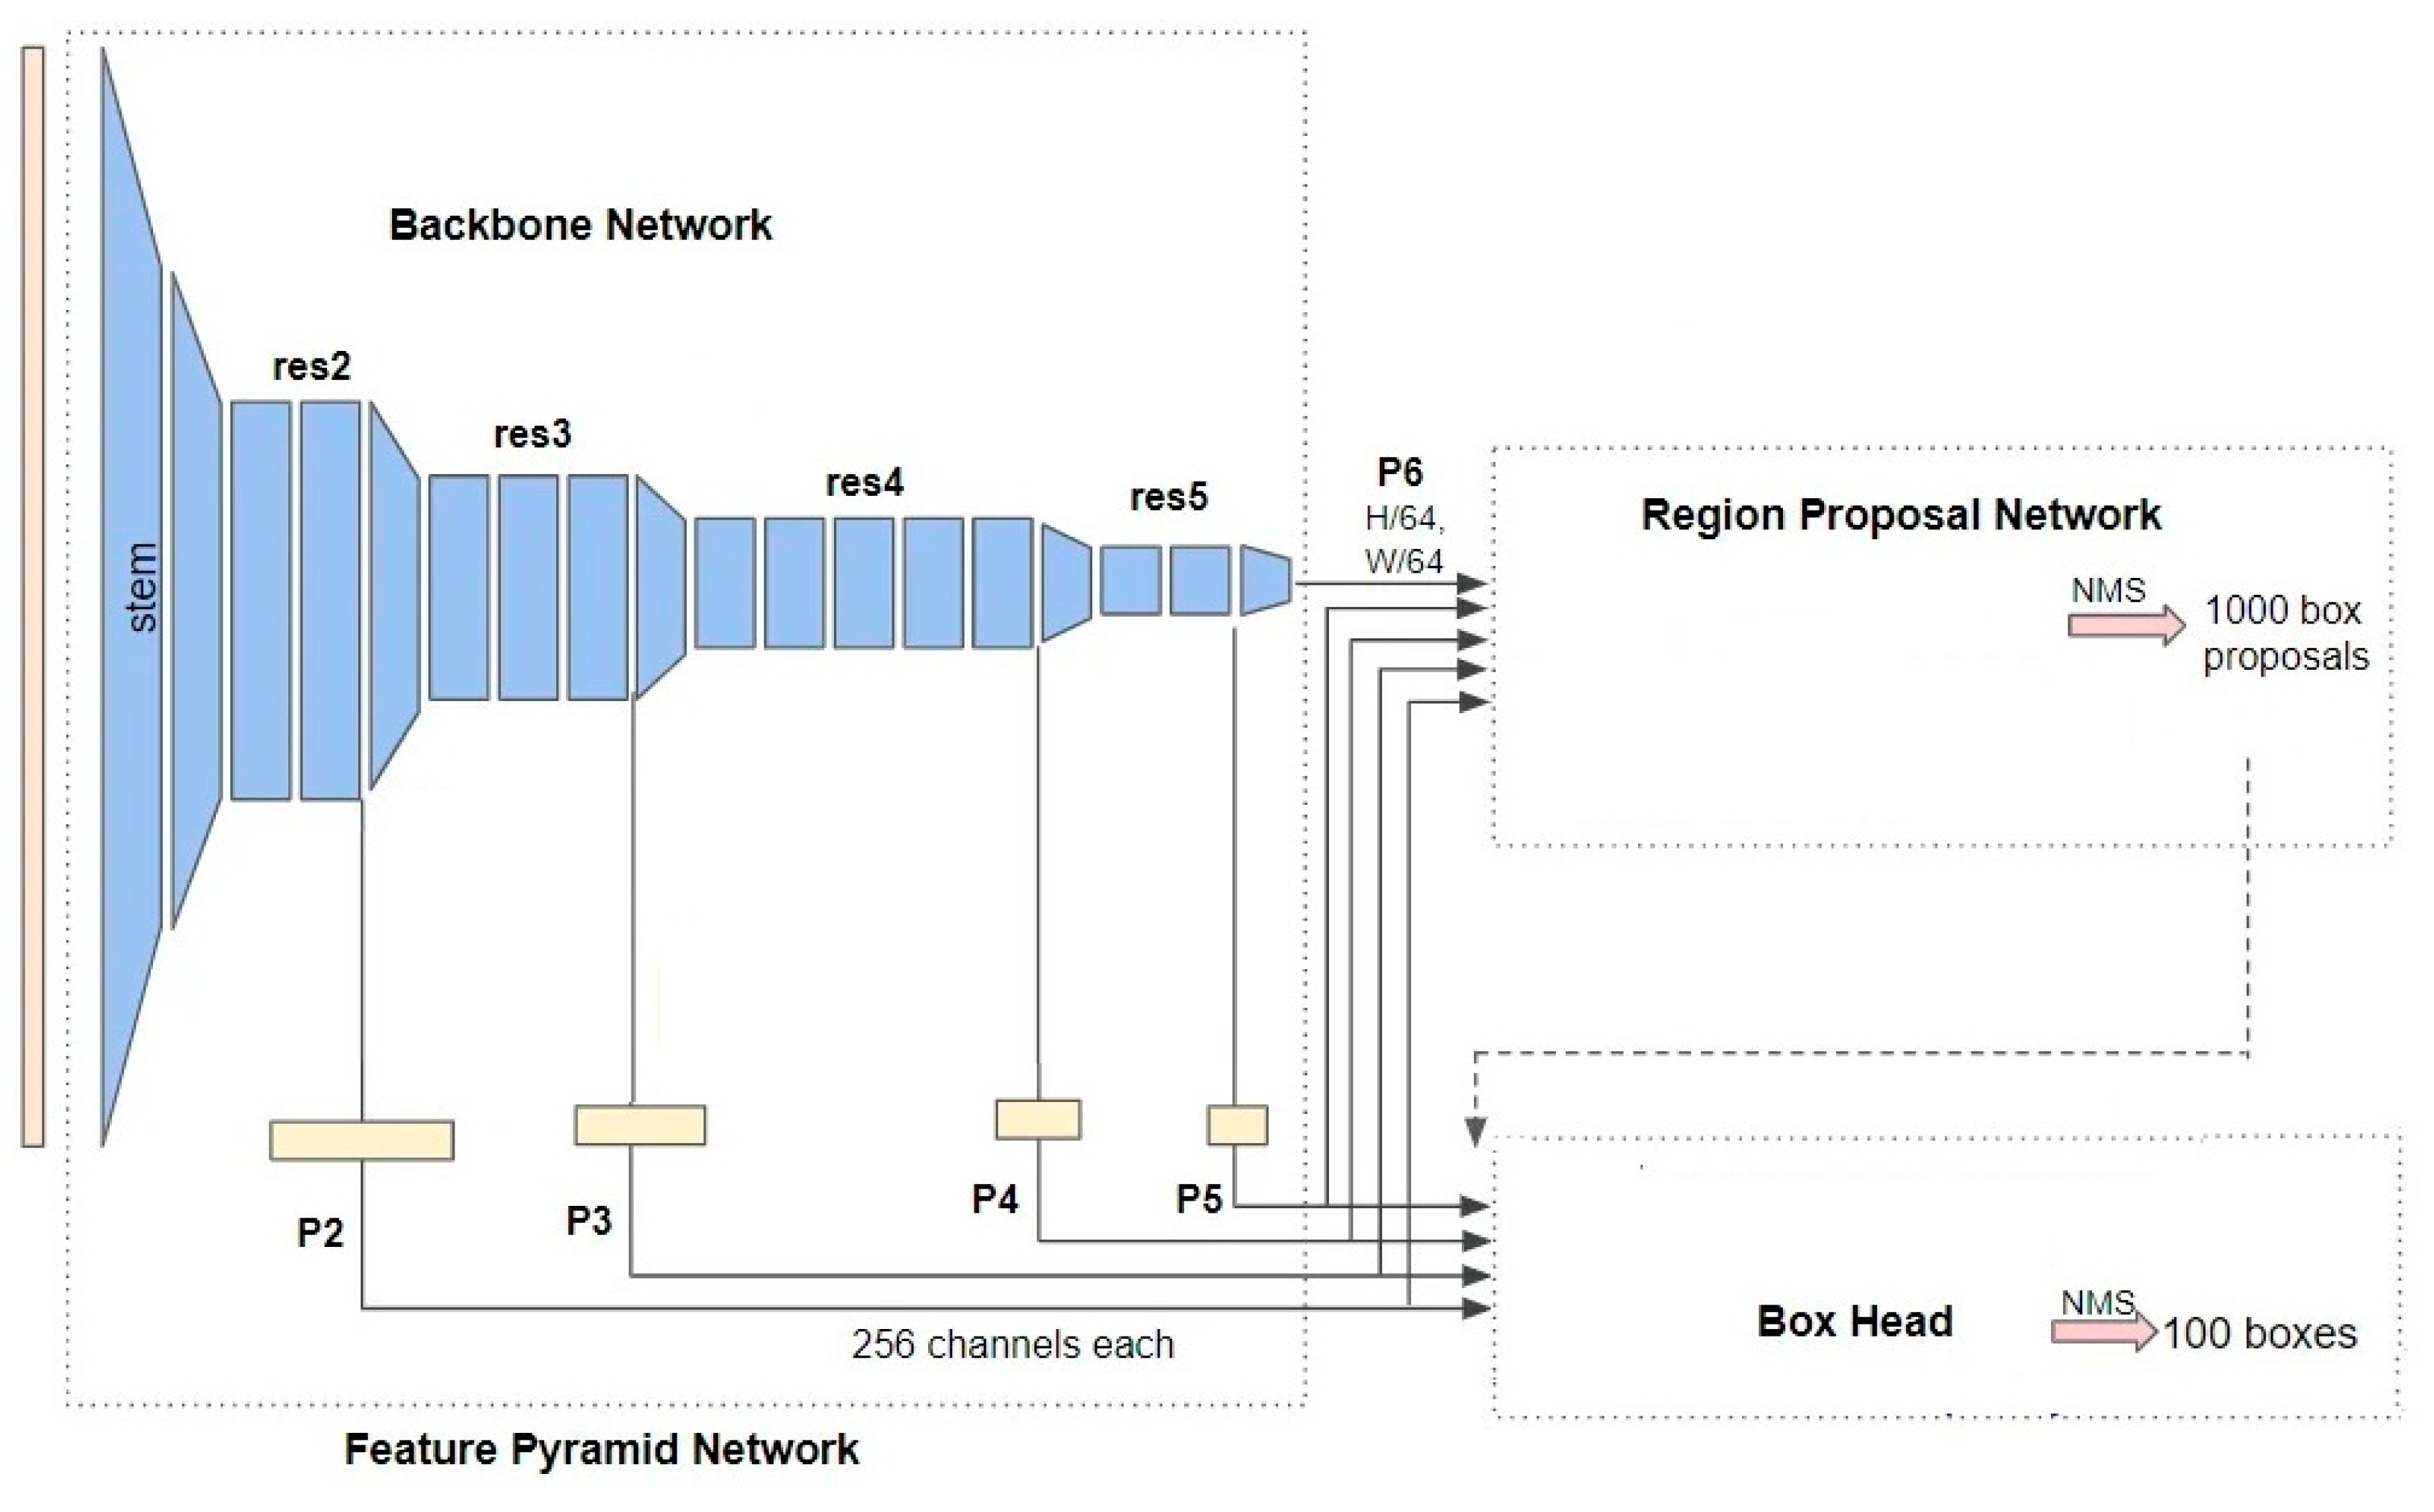
Figure 7.
Two random images from the testing set: (a) test image-1 with a white target. (b) test image-2 with a yellow target.
Figure 7.
Two random images from the testing set: (a) test image-1 with a white target. (b) test image-2 with a yellow target.
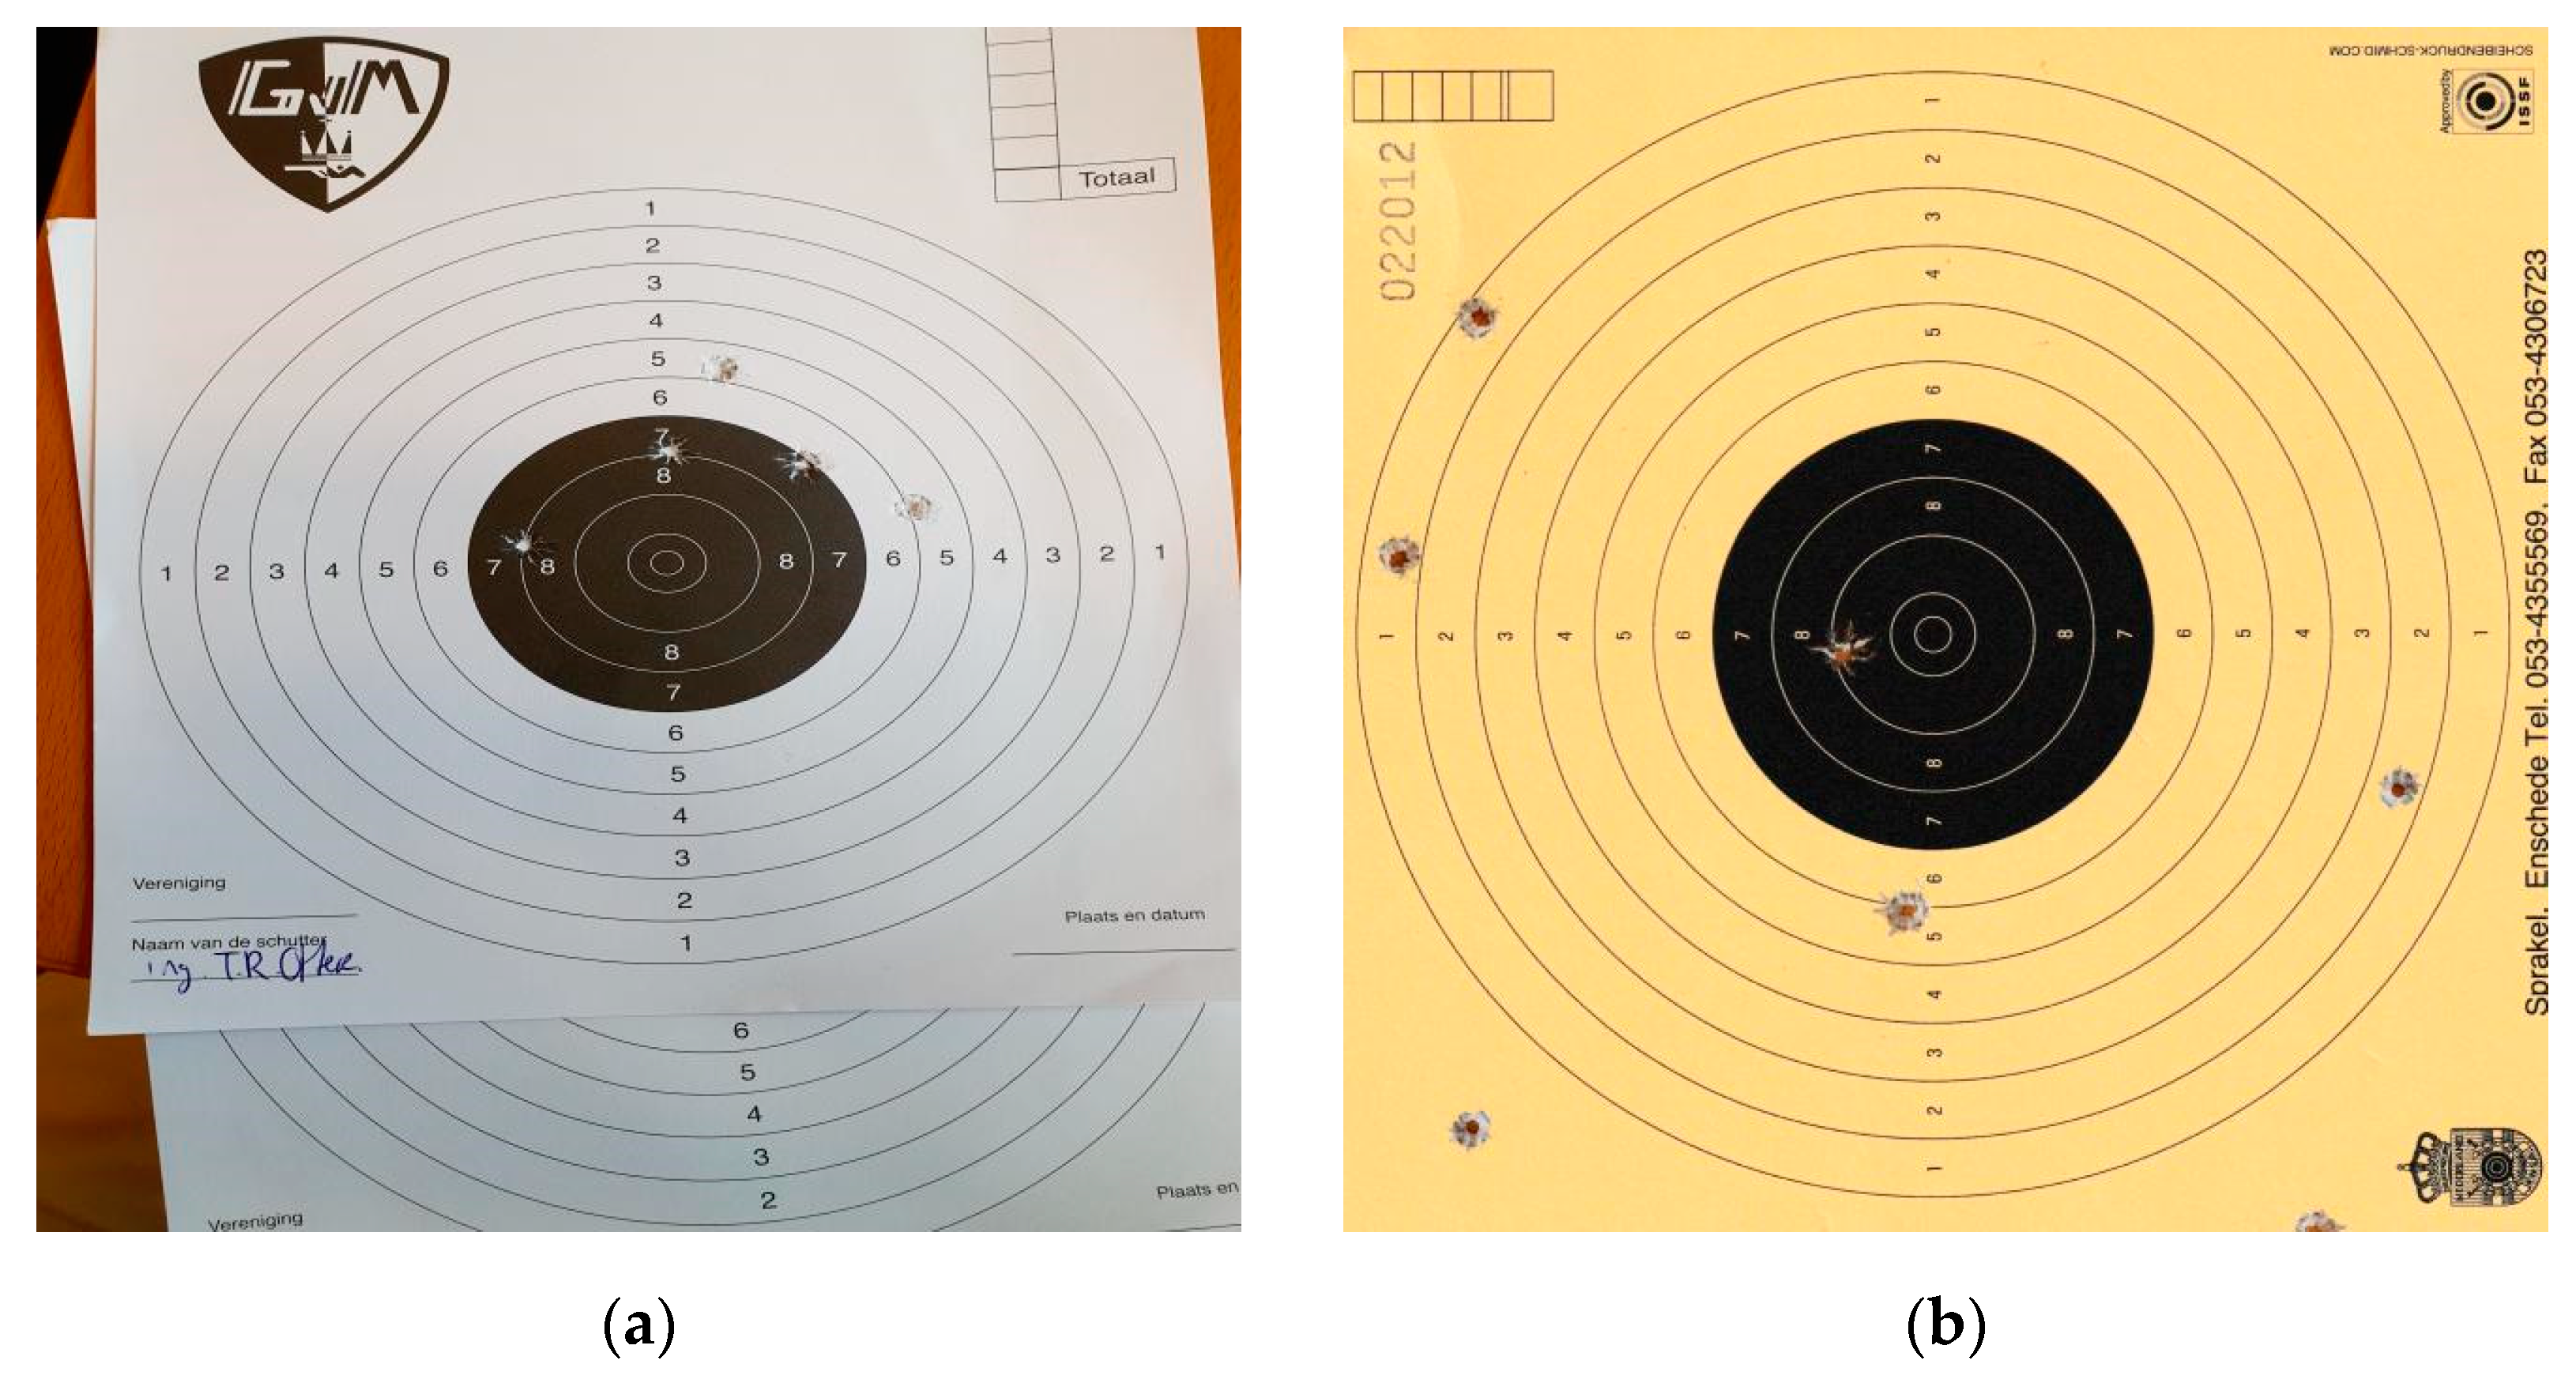
Figure 8.
Results of bullet hole detection by Detectron2 models: (a) performance of faster RCNN-101 on test image-1. b) performance of faster RCNN-101 on test image-2. (c) performance of faster RCNN-50 on test image-1. (d) performance of faster RCNN-50 on test image-2. (e) performance of RetinaNet-50 on test image-1. (f) performance of RetinaNet-50 on test image-2. (g) performance of RetinaNet-101 on test image-1. (h) performance of RetinaNet-101 on test image-2.
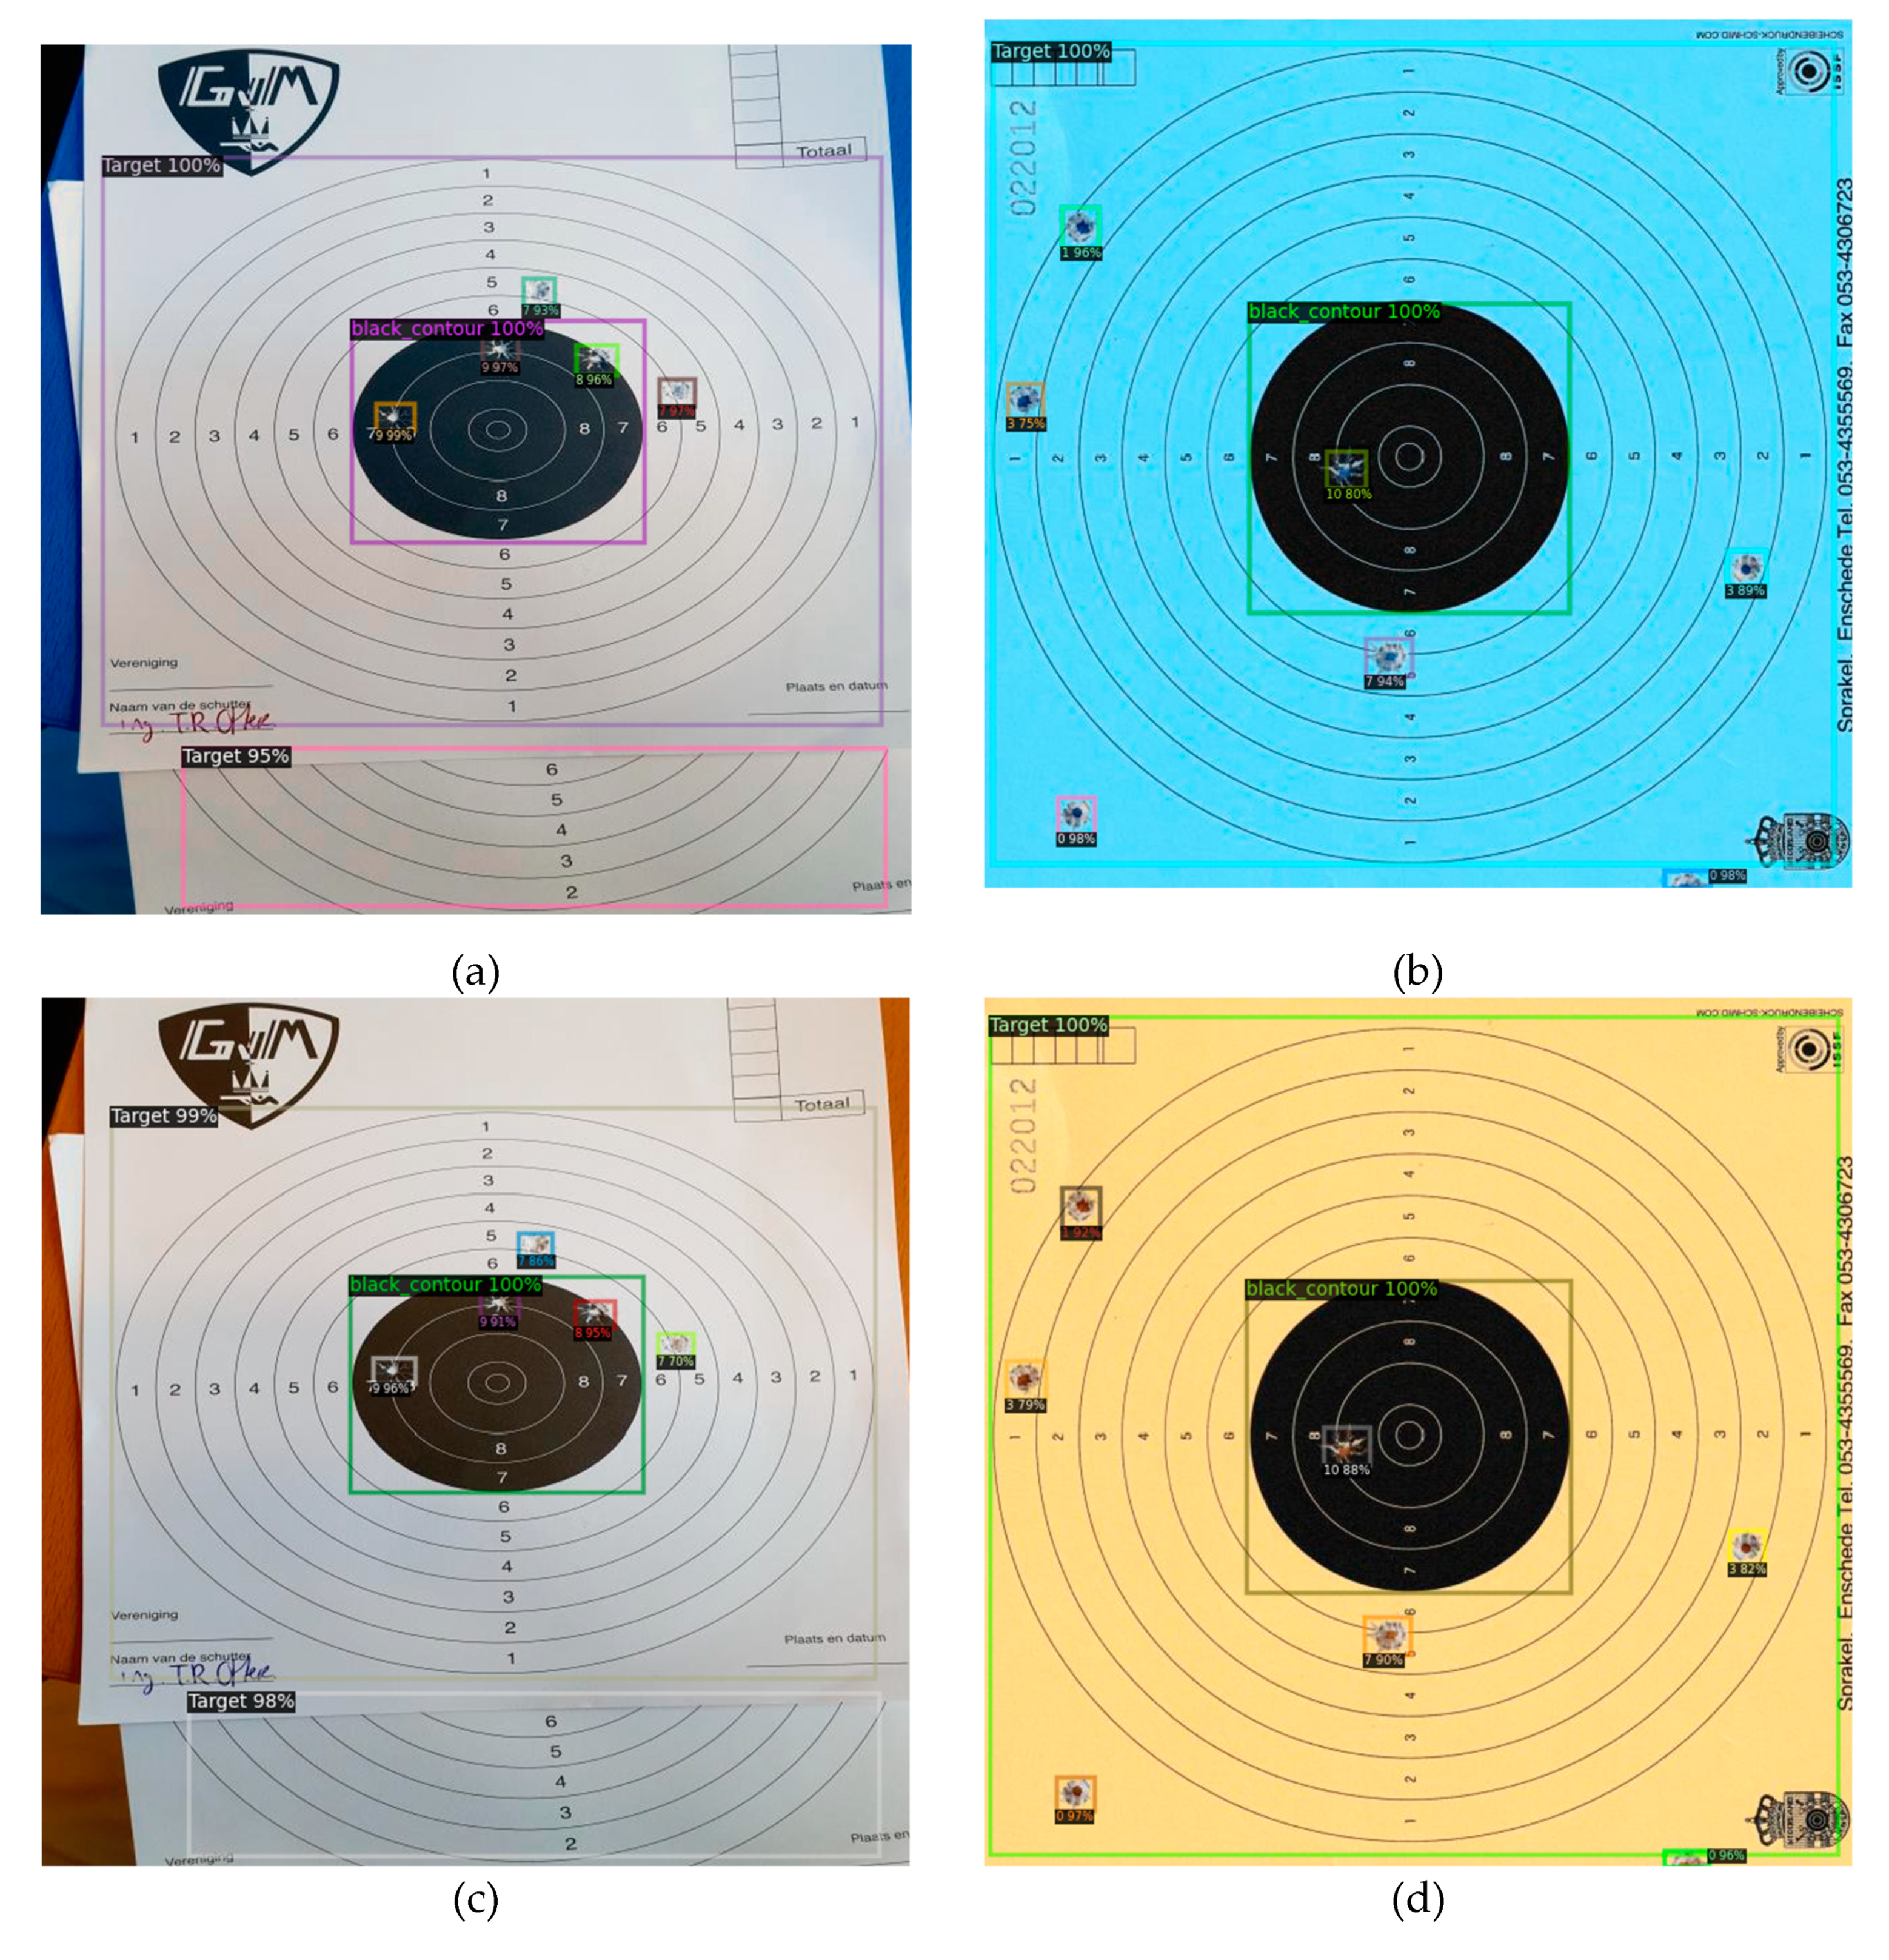
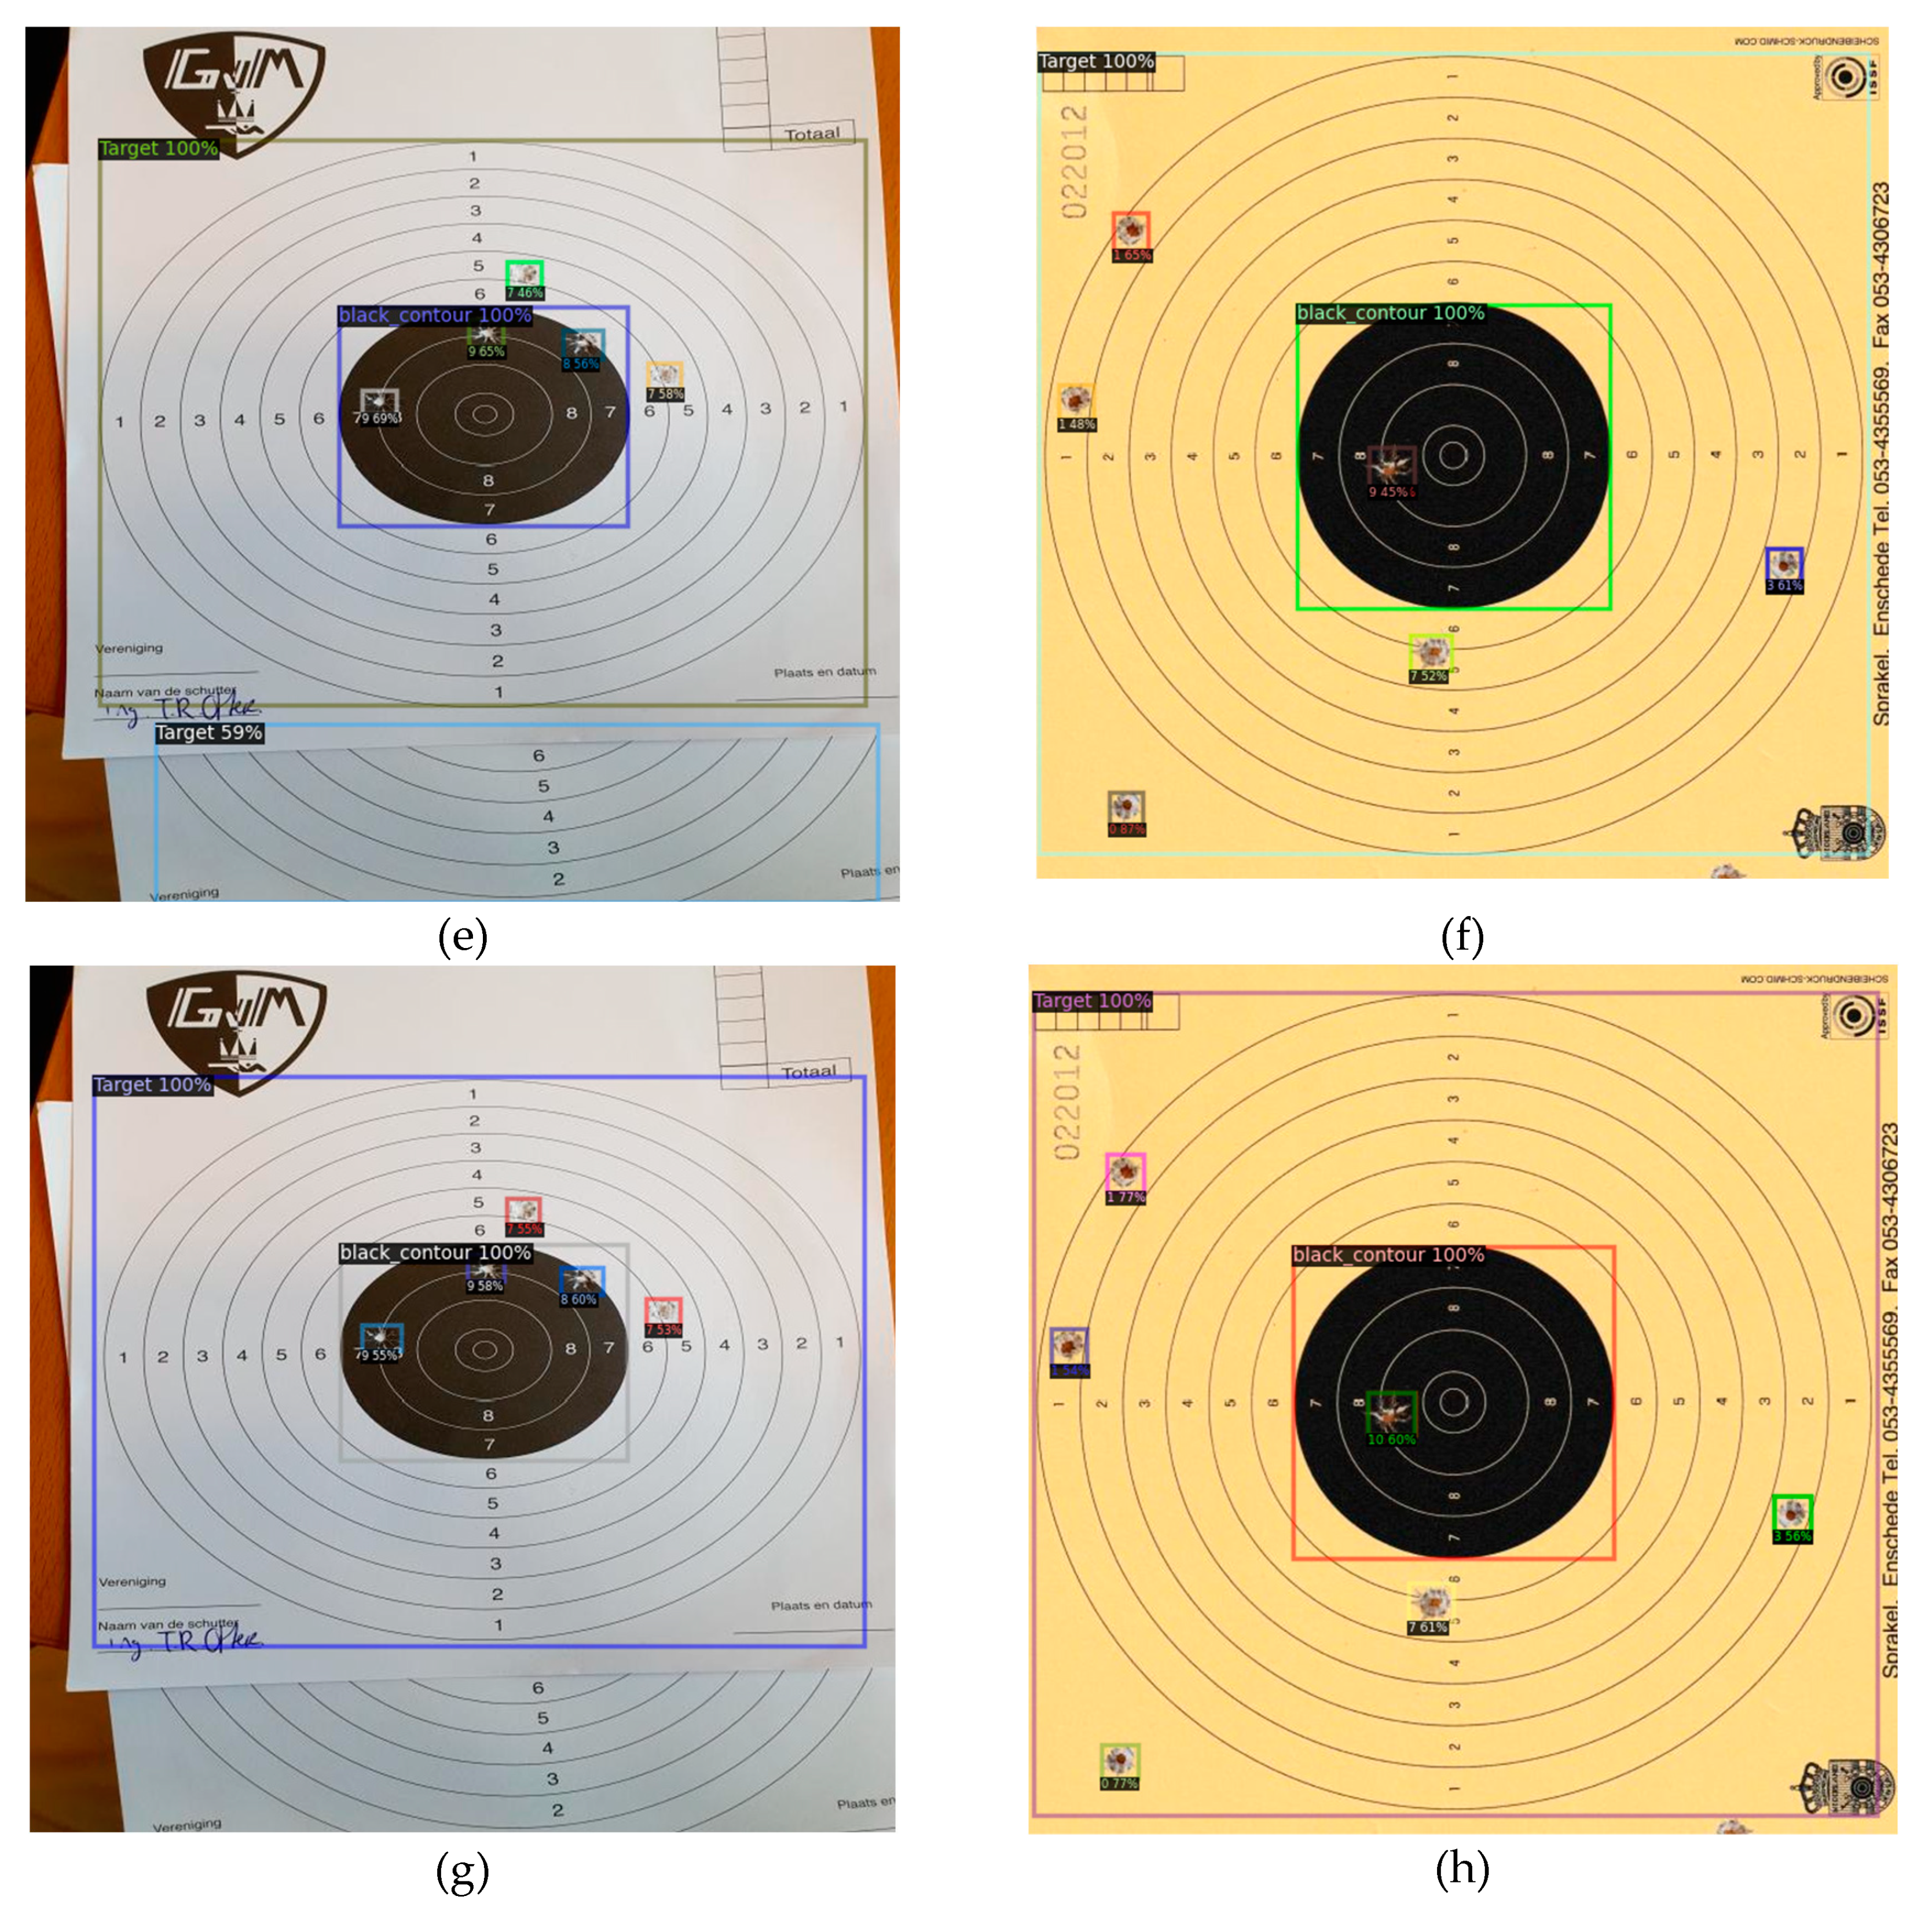
Figure 9.
Results of bullet hole detection by YOLOv8 models: (a) Performance of YOLOv8n on test image-1. b) Performance of YOLOv8n on test image-2. (c) Performance of YOLOv8s on test image-1. (d) Performance of YOLOv8s on test image-2. (e) Performance of YOLOv8m on test image-1. (f) Performance of YOLOv8m on test image-2.

Table 1.
Classes annotated in the dataset.
| Class | Description | Numbers of annotations |
|---|---|---|
| Target | Bounding box around the biggest circle | 1257 |
| Black_contour | Bounding box around the blackcircle, which contains the 7, 8, 9, and 10 | 1250 |
| Bullet_0 | A bullet hole on paper but not in any rings | 839 |
| Bullet_1 | Bullet hole in the first ring | 376 |
| Bullet_2 | Bullet hole in the second ring | 440 |
| Bullet_3 | Bullet hole in the third ring | 506 |
| Bullet_4 | Bullet hole in the fourth ring | 480 |
| Bullet_5 | Bullet hole in the fifth ring | 555 |
| Bullet_6 | Bullet hole in the sixth ring | 595 |
| Bullet_7 | Bullet hole in the seventh ring | 712 |
| Bullet_8 | Bullet hole in the eighth ring | 588 |
| Bullet_9 | Bullet hole in the ninth ring | 541 |
| Bullet_10 | Bullet hole in the tenth ring | 257 |
Table 2.
Different annotations implemented on the dataset.
| Techniques used | Value |
|---|---|
| Flipping | Horizontal, Vertical |
| Grayscale | 25% of all images |
| Saturation | Between -72% and +72% |
| Brightness | Between -30% and +0% |
Table 3.
AP values of Detectron2 Models (at IoU0.50-0.95).
| Category(Classes) | Faster RCNN-50 | RetinaNet-50 | Faster RCNN-101 | RetinaNet-101 |
|---|---|---|---|---|
| 2 | 23.666 | 24.454 | 18.122 | 18.720 |
| 5 | 50.966 | 31.049 | 53.827 | 30.420 |
| 8 | 40.085 | 41.225 | 41.675 | 35.022 |
| Target | 97.385 | 96.411 | 96.247 | 96.810 |
| 0 | 50.096 | 46.978 | 39.134 | 45.852 |
| 3 | 44.570 | 34.778 | 57.490 | 35.819 |
| 6 | 44.623 | 28.234 | 40.767 | 28.667 |
| 9 | 33.359 | 25.177 | 40.149 | 22.677 |
| Black contour | 95.930 | 97.095 | 97.740 | 97.630 |
| 1 | 51.011 | 52.828 | 50.459 | 39.879 |
| 4 | 48.688 | 40.167 | 60.042 | 38.381 |
| 7 | 37.617 | 34.934 | 38.748 | 26.850 |
| 10 | 24.600 | 20.027 | 16.765 | 22.617 |
Table 4.
AP and AR scores of Detectron2 models.
| Model | AP IoU=0.50-0.95 | AP50 | AP75 | APs | APm | APl | AR | ARs | ARm | ARl |
|---|---|---|---|---|---|---|---|---|---|---|
| Faster RCNN- 50 | 49.431 | 83.531 | 45.332 | 40.981 | 55.116 | 96.616 | 0.615 | 0.546 | 0.637 | 0.982 |
| RetinaNet-50 | 44.104 | 71.332 | 40.071 | 34.697 | 43.582 | 97.184 | 0.610 | 0.540 | 0.542 | 0.986 |
| Faster RCNN- 101 | 50.090 | 83.554 | 47.379 | 41.546 | 51.866 | 97.074 | 0.596 | 0.520 | 0.612 | 0.981 |
| RetinaNet-101 | 41.488 | 66.416 | 38.722 | 31.775 | 41.374 | 97.636 | 0.610 | 0.541 | 0.495 | 0.989 |
Table 5.
AP scores of YOLOv8 models.
| Category(Classes) | YOLOv8n mAP50 | YOLOv8n mAP50-95 | YOLOv8s mAP50 | YOLOv8s mAP50-95 | YOLOv8m mAP50 | YOLOv8m mAP50-95 |
|---|---|---|---|---|---|---|
| 0 | 0.946 | 0.524 | 0.981 | 0.535 | 0.963 | 0.529 |
| 1 | 0.934 | 0.501 | 0.958 | 0.532 | 0.964 | 0.555 |
| 10 | 0.964 | 0.554 | 0.995 | 0.593 | 0.995 | 0.526 |
| 2 | 0.926 | 0.557 | 0.929 | 0.565 | 0.918 | 0.586 |
| 3 | 0.967 | 0.61 | 0.982 | 0.623 | 0.985 | 0.634 |
| 4 | 0.942 | 0.606 | 0.959 | 0.621 | 0.949 | 0.616 |
| 5 | 0.932 | 0.569 | 0.943 | 0.57 | 0.939 | 0.579 |
| 6 | 0.941 | 0.564 | 0.94 | 0.593 | 0.968 | 0.607 |
| 7 | 0.962 | 0.575 | 0.952 | 0.592 | 0.972 | 0.601 |
| 8 | 0.84 | 0.464 | 0.939 | 0.558 | 0.938 | 0.555 |
| 9 | 0.946 | 0.569 | 0.98 | 0.634 | 0.987 | 0.615 |
| Target | 0.995 | 0.99 | 0.995 | 0.993 | 0.995 | 0.993 |
| Black contour | 0.991 | 0.987 | 0.993 | 0.989 | 0.994 | 0.991 |
Table 6.
Precision and Recall metrics of YOLOv8 models.
| Model | Precision | Recall | mAP50 | mAP50-95 | Speed(ms) |
|---|---|---|---|---|---|
| YOLOv8n | 0.921 | 0.912 | 0.945 | 0.621 | 2.69 |
| YOLOv8s | 0.947 | 0.936 | 0.965 | 0.646 | 2.312 |
| YOLOv8m | 0.937 | 0.94 | 0.967 | 0.645 | 5.718 |
Table 7.
Performance comparison of the models.
| Model | AP50-95/mAP50-95(%) | AP50/mAP50(%) | AR/Recall(%) |
|---|---|---|---|
| Faster RCNN-50 | 49.431 | 83.531 | 61.5 |
| Retinanet-50 | 44.104 | 71.332 | 61.0 |
| Faster RCNN-101 | 50.090 | 83.554 | 59.6 |
| Retinanet-101 | 41.488 | 66.416 | 61.0 |
| YOLOv8n | 62.1 | 94.5 | 91.2 |
| YOLOv8s | 64.6 | 96.5 | 93.6 |
| YOLOv8m | 64.5 | 96.7 | 94.0 |
Disclaimer/Publisher’s Note: The statements, opinions and data contained in all publications are solely those of the individual author(s) and contributor(s) and not of MDPI and/or the editor(s). MDPI and/or the editor(s) disclaim responsibility for any injury to people or property resulting from any ideas, methods, instructions or products referred to in the content. |
© 2023 by the authors. Licensee MDPI, Basel, Switzerland. This article is an open access article distributed under the terms and conditions of the Creative Commons Attribution (CC BY) license (http://creativecommons.org/licenses/by/4.0/).
Copyright: This open access article is published under a Creative Commons CC BY 4.0 license, which permit the free download, distribution, and reuse, provided that the author and preprint are cited in any reuse.


