Submitted:
07 October 2023
Posted:
08 October 2023
You are already at the latest version
Abstract
Background: Very low-calorie ketogenic diet (VLCKD) is associated with improvement of metabolic and cardiovascular disorders. We aimed to evaluate the effects of VLCKD in patients with Cushing’s disease (CD) as adjunctive therapy to treatment for primary disease. Methods: We evaluated clinical, hormonal and metabolic parameters in 15 patients with CD and 15 controls at baseline and after 1 week and 3 weeks of VLCKD and further 2 weeks of low-carbohydrate ketogenic diet (LCKD). Results: After 5 weeks of diet a significant decrease in BMI (p=0.002), waist circumference (WC) (p=0.024), systolic (p=0.015) and diastolic blood pressure (p=0.005), ACTH (p=0.026), cortisone (p=0.025), total (p=0.006) and LDL cholesterol (p=0.017), triglycerides (p=0.016), alkaline phosphatase (p=0.008) and a significant increase in HDL cholesterol (p=0.017), vitamin D (p=0.015) and oral disposition index (Dio)(p=0.004) was observed in CD. A significant decrease in BMI (p=0.003), WC (p=0.002), systolic (p=0.025) and diastolic (p=0.007) blood pressure and total cholesterol (p=0.026) and increase in HDL cholesterol (p=0.001) and DIo (p<0.001) was observed in controls. Conclusions: The current study confirms that ketogenic diet is effective in improving metabolic disorders and shows that a nutritional approach may be combined with conventional CD therapy in order to improve metabolic and cardiovascular comorbidities.
Keywords:
very low calorie ketogenic diet
; cortisone
; diabetes mellitus
; obesity
1. Introduction
Cushing’s syndrome (CS) is a clinical condition characterized by excess of glucocorticoids. It can be exogenous, resulting from a chronic intake of synthetic corticosteroids, or endogenous, resulting from hyperproduction of cortisol or ACTH. The endogenous form can be due to adrenal cortisol hypersecretion or to pituitary ACTH hypersecretion, defined Cushing’s disease (CD). Rarely, endogenous hypercortisolism can result from extra-pituitary hyperproduction of ACTH, defined ectopic CS.
CS is associated with increased mortality compared to the general population, due to the presence of several comorbidities, including visceral obesity, diabetes mellitus, arterial hypertension and cardiovascular disease, osteoporosis, muscle-skeletal disorders including myopathy, dyslipidaemia, infections, neuropsychiatric and reproductive disorders [1,2].
With regard to CD the first therapeutic approach consists of pituitary surgery. In cases of contraindications for surgery or patients’ refusal or disease recurrence, medical therapy including inhibiting pituitary or adrenal directed drugs, radiotherapy or bilateral adrenalectomy should be recommended [3].
Generally, the treatment of CD is associated with improvement of comorbidities, even though some of them can also persist in the remission phase [4].
Low-carbohydrate diet approach and notably the very low-calorie ketogenic diet (VLCKD) has several therapeutic applications, improving many metabolic disorders, including diabetes mellitus, obesity, arterial hypertension, insulin resistance, dyslipidaemia, as strongly supported by evidence [5,6,7,8]. All of these metabolic disorders are present in patients with CD.
The effects of VLCKD on cortisol levels have not been yet clearly elucidated [9]. Indeed, it is widely known that meal macronutrients have a strong influence on cortisol concentrations, inducing an increase or decrease of them, as reported in many studies [10,11,12,13,14,15,16,17].
VLCKD is a subtype of low-carbohydrate diet, which provides a low daily caloric intake (less than 800 kcal/day), low carbohydrate intake (<50 g/day) and normoproteic (1−1.5 g of protein/kg of ideal body weight) contents [4,7,18].
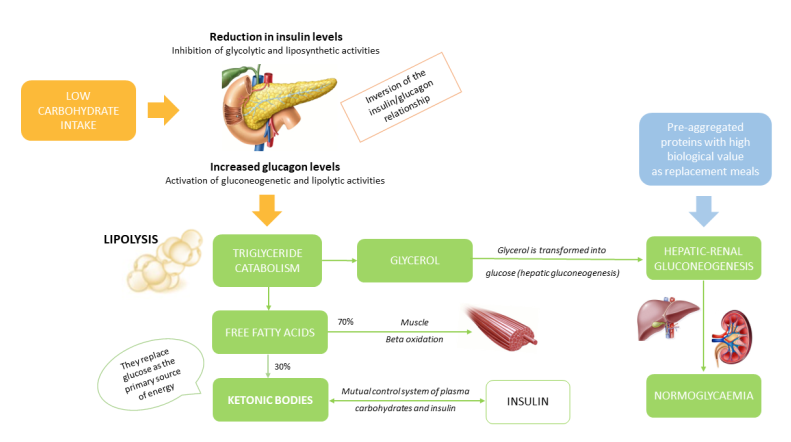
VLCKD induces ketogenesis which takes advantage of ketone bodies as an energy source derived from fatty acids (Figure 1).
Ketone bodies are used by many tissues including those of the heart, kidney, skeletal muscle and central nervous system. Physiologically, Acetyl-CoA fuses with oxaloacetate derived from glycolytic processes. Under conditions of slowed glycolysis, such as during VLCKD, the oxaloacetate produced is preferentially used for neoglucogenetic processes, while the Acetyl-CoA molecules derived from the beta-oxidation of fatty acids are used for the production of ketone bodies. The VLCKD diet is the model with the greatest availability of Acetyl-CoA (19,20). A VLCKD plan is normally divided into 6 phases. In phase 1, patients are educated to eat high-biological-value protein preparations five times a day, containing 18 g of proteins, 4 g of carbohydrates and 3 g of fats, and vegetables with a low glycaemic index. In phase 2, natural proteins including meat/egg/fish are introduced in place of one of the protein preparations at lunch or dinner. In phase 3, natural proteins are introduced in place of the second protein preparation. At the end of the VLCKD, carbohydrates are gradually reintroduced, starting with foods with a lower glycaemic index including fruit and milk products (Phase 4), followed by foods with moderate glycaemic index such as legumes (Phase 5) and ones with a high glycaemic index (bread, pasta and cereals—Phase 6). This dietetic plan corresponds to a low-carbohydrate diet with a daily calorie intake ranging from 1200 to 1500 Kcal/day. At the end of phases 4-6, the patient must be re-educated in order to be able to have a maintenance diet of approximately 1500-2000 Kcal/day [6,19].
The primary objective of the current study was to assess the effects of a 3-week VLCKD and a 2-week LCKD, as adjunctive treatment to medical therapy for CD, on salivary and serum cortisol, adrenal steroids, ACTH and serum cortisol after 1 mg dexamethasone suppression test (DST) and urinary free cortisol, in 15 patients with CD and 15 controls.
The secondary objective of the study was to evaluate anthropometric, clinical and metabolic parameters before and after a 3-week VLCK and a 2-week LCKD in both patients with CD and controls.
2. Materials and Methods
2.1. Study population
We prospectively enrolled 15 patients with active CD, 11 women (75%) and 4 men (25%) (mean age 47.2 ± 10.6 years; mean BMI 35.7 ± 4.5 kg/m2) and 15 controls age, BMI and sex matched, consecutively referred to the Division of Endocrinology of Palermo University from January 2022 to June 2023.
The diagnosis of CD was made as recommended by international clinical practice guidelines and consensus statement [20]. The control group was recruited in parallel to the CD group.
Patients with CD were all pharmacologically treated for the primary disease. Ten were treated with a pituitary-directed drug, pasireotide, and 5 with an adrenal-directed drug, metyrapone. Medical treatment for CD was maintained for all the duration of the study.
After enrolment, patients with CD and controls were instructed to follow a nutrition plan of VLCKD for 3 weeks followed by 2 weeks of LCKD. Inclusion criteria were age 18 years or older and active CD on medical treatment for the group of patients with CD; age 18 years or older and absence of any known disease for the control group.
Exclusion criteria were the following: previous pituitary surgery or radiotherapy within 6 months prior to study entry for patients with CD; history or presence of epilepsy; mental disease rendering patients unable to understand the nature, scope and possible consequences of the study, and/or evidence of an uncooperative attitude; pregnancy, breastfeeding; underweight (BMI <18.5 kg/m2); adrenal CS and ectopic CS.
Among patients with CD, 9 out of 15 had diabetes mellitus, 6 were on metformin treatment and 3 on GLP-1 receptor agonists which were suspended 1 week before VLCKD protocol starting. Seven out of 15 had arterial hypertension and were pharmacologically treated with ACE-inhibitors. Ten out of 15 had dyslipidaemia and were treated with statins.
Patients with CD and controls were instructed to follow a 3-week VLCKD according to a specific plan consisting in 4 replacement meals (by New Penta, Cuneo, Italia) subdivided into breakfast, lunch, snack and dinner and two portions of low glycaemic index vegetables at lunch and dinner, for a total amount of 670 Kcal/day.
After, a 2-week LCKD plan was prescribed consisting in three replacement meals, one conventional protein meal and two portions of low glycaemic index vegetables for lunch and dinner, for a total of about 820 Kcal/day. During the entire study period, the patients took Pentacal plus, a multi-vitamin and multi-mineral supplement containing Magnesium 187 mg, Potassium 1000 mg, Vitamin C 60 mg, Vitamin E 9 mg, Selenium 41 mcg, Vitamin A 0.6 mg, Vitamin B6 1.5 mg, Vitamin B1 1.05 mg, Vitamin B2 1.2 mg, Folic acid 200 mcg and Vitamin B12 1.87 mcg.
Before starting the ketogenic protocol, the study participants were educated about the transient disturbances that could occur in the initial phase of VLCKD: acetonemic breath, headache, hunger, constipation/diarrhoea, cramps, nausea, fatigue, dizziness, menstrual cycle changes.
The study protocol was approved by the ethics committee of the Policlinico Paolo Giaccone under number 03/2022.
At the time of enrolment, each patient gave their written consent to freely participate in the experimental study.
2.2. Study design
Both in patients with CD and in controls, at baseline (time 0) and after 1 week and 3 weeks of VLCKD and a further 2 weeks of LCKD (time 5wk) we evaluated clinical parameters (BMI, waist circumference, systolic and diastolic blood pressure), hormonal parameters (urinary free cortisol (UFC) on 24-hour urine collection, late night salivary cortisol at 11pm, serum cortisol at 8am, serum ACTH at 8am, serum cortisone, serum 17hydroxyprogesterone (17OHP), androstenedione and DHEAS) and metabolic parameters (fasting glucose and insulin, total, HDL and LDL cholesterol, triglycerides, glutamic oxaloacetate transaminase (GOT); glutamic piruvate transaminase (GPT), alkaline phosphatase, gammaGT, blood count, creatinine, sodium, potassium, calcium, phosphorus, parathyroid hormone, vitamin D and C-reactive protein were also evaluated. Only in patients with CD did we evaluate serum cortisol the next day after 1 mg DST at baseline and after 1, 3 and 5 weeks.
In addition, we measured glycated haemoglobin (HbA1c) only at baseline and we performed an oral glucose tolerance test (OGTT) with evaluation of serum glucose and insulin at baseline and after (30-60-90-120 minutes) administration of 75 g of glucose. We further calculated Matsuda insulin sensitivity index (ISI-Matsuda) [10,000/glucose (mg/dl) x insulin (mU/ml) x mean blood glucose x mean insulin], the Dio (oral Disposition Index) [(ΔInsulin0- 30 / ΔGlucose0-30) x (1 / fasting insulin)] and the area under the curves of insulin (AUC2-h insulinemia) and glucose (AUC2-h glycaemia) at baseline and after 5 weeks, both in patients with CD and controls.
2.3. Assays
Height and body weight were obtained at the outpatient’s clinic; patients were weighed clothed without shoes. The waist circumference was defined as the minimal abdominal circumference located midway between the lower rib margin and the iliac crest, using a flexible tape measure and maintaining close contact with the skin without compression of underlying tissues.
Blood chemistry parameters were collected after overnight fasting. Blood glucose, insulin, HbA1c, total cholesterol, HDL cholesterol, LDL cholesterol, triglycerides, GOT, GPT, alkaline phosphatase, gamma GT, blood count, creatinine, sodium, potassium, calcium, phosphorus, parathyroid hormone, vitamin D, ACTH and c-reactive protein were calculated by standard methods (Modular P800, Roche, Milan).
UFC, serum cortisol and adrenal steroids (cortisone, 17OHP, androstenedione and DHEAS) and salivary cortisol were determined by high performance liquid chromatography-mass spectrometry (Agilent HPLC series 1200, an Agilent 6430 triple quadrupole mass spectrometer equipped with an Electrospray Ionization source, operating in positive ion mode (Agilent Technologies, Palo Alto, USA) as previously reported [21].
2.4. Statistical analysis
The Statistical Packages for Social Science SPSS version 19 (SPSS, Inc.) was used for data analysis. The normality of quantitative variables was tested with the Shapiro-Wilk test. Data were presented as mean ± SD for continuous variables. Rates and proportions were calculated for categorical variables. The differences between paired continuous variables (CD vs. controls) were analysed using one-way ANOVA. A p value of 0.05 was considered statistically significant.
3. Results
Patients with CD at baseline had significantly higher WC (p=0.035), ACTH (p=0.043), UFC (p<0.001), salivary cortisol (p<0.001), cortisol after 1 mg of DST (p=0.002), androstenedione (p<0.001), DHEAS (p=0.008), HbA1c (p=0.045), AUC2h glycaemia (p=0.022) and AUC2h insulinemia (p=0.040) and lower vitamin D levels (p=0.033), DIo (p<0.001) and ISI-Matsuda (p=0.049) compared to controls (Table 1).
In patients with CD, we observed a significant decrease in BMI (p=0.002), WC (p=0.024), systolic (p=0.015) and diastolic blood pressure (p=0.005), ACTH (p=0.026), cortisone (p=0.025), total (p=0.006) and LDL cholesterol (p=0.017), triglycerides (p=0.016), alkaline phosphatase (p=0.008) and a significant increase in HDL cholesterol (p= 0.017), vitamin D (p=0.015) and Dio (p=0.004) during the 5 weeks of observation (Table 2 and Figure 1).

Table 2.
Clinical, hormonal and metabolic parameters in patients with Cushing’s disease at baseline and after 1,3 and 5 weeks of ketogenic diet.
Table 2.
Clinical, hormonal and metabolic parameters in patients with Cushing’s disease at baseline and after 1,3 and 5 weeks of ketogenic diet.
| Patients with Cushing’s disease (N=15) |
|||||
|---|---|---|---|---|---|
| Baseline Mean (± SD) |
Week 1 Mean (± SD) |
Week 3 Mean (± SD) |
Week 5 Mean (± SD) |
p |
|
| Clinical parameters | |||||
| BMI (Kg/m2) | 35.7 ± 6.54 | 34.4 ± 6.15 | 33.2 ± 5.91 | 32.3 ± 5.53 | 0.002 |
| Waist circumference (cm) | 114.4 ± 12.7 | 111.6 ± 11.1 | 109 ± 10.7 | 107.8 ± 8.16 | 0.024 |
| Systolic blood pressure (mmHg) | 125.8 ± 15.6 | 120.4 ± 11.8 | 118.4 ± 10.3 | 113.8 ± 9.6 | 0.015 |
| Diastolic blood pressure (mmHg) | 88.2 ± 7.8 | 85.4 ± 5.8 | 84.2 ± 6.1 | 82.1 ± 5.1 | 0.005 |
| Hormonal parameters | |||||
| Fasting serum cortisol (mcg/dL) | 11.4 ± 2.22 | 12.7 ± 3.33 | 14.2 ± 3.08 | 14.7 ± 2.53 | 0.122 |
| Fasting serum ACTH (ng/L) | 77.8 ± 40.4 | 60.3 ± 29.5 | 58.2 ± 27.3 | 41.8 ± 26.9 | 0.026 |
| Urinary free cortisol (mcg/24h) | 56.8 ± 30.9 | 67.9 ± 43.3 | 55.6 ± 43.7 | 52.3 ± 37.6 | 0.472 |
| Late-night salivary cortisol | 6.67 ± 4.76 | 7.38 ± 3.32 | 4.76 ± 3.73 | 2.67 ± 2.33 | 0.160 |
| Cortisol after low dose suppression test (mcg/dL) | 4.14 ± 3.55 | 3.89 ± 3.03 | 3.88 ± 3.01 | 3.06 ± 2.85 | 0.139 |
| 17OHP (mcg/L) | 0.53 ± 0.22 | 0.63 ± 0.21 | 0.85 ± 0.18 | 0.76 ± 0.14 | 0.897 |
| Androstenedione (mcg/L) | 2.86 ± 2.31 | 2.5 ± 2.11 | 2.36 ± 1.47 | 3.05 ± 1.98 | 0.558 |
| DHEAS (mcg/L) | 1743 ± 1110 | 1892.5 ± 165.6 | 1871.7 ± 333.5 | 1656.7 ± 323.5 | 0.125 |
| Cortisone (mcgd/L) | 15.1 ± 3.9 | 16.6 ± 4.01 | 17.8 ± 3.85 | 19.8 ± 4.51 | 0.025 |
| Metabolic parameters | |||||
| Glycaemia (mmol/L) | 4.91 ± 0.83 | 4.88 ± 1.11 | 4.94 ± 0.55 | 4.46 ± 0.7 | 0.356 |
| Insulinemia (microU/mL) | 6.7 ± 4.02 | 5.8 ± 3.11 | 4.15 ± 3.33 | 5.63 ± 5.02 | 0.241 |
| Total cholesterol (mmol/L) | 4.96 ± 0.6 | 4.92 ± 0.83 | 4.16 ± 0.75 | 4.06 ± 0.81 | 0.006 |
| HDL cholesterol (mmol/L) | 1.36 ± 0.28 | 1.43 ± 0.28 | 1.46 ± 0.35 | 1.63 ± 0.3 | 0.017 |
| Triglycerides (mmol/L) | 1.2 ± 0.5 | 0.9 ± 0.23 | 0.89 ± 0.2 | 0.75 ± 0.15 | 0.040 |
| LDL cholesterol (mmol/L) | 2.63 ± 0.58 | 2.78 ± 0.74 | 2.22 ± 0.75 | 2.25 ± 0.78 | 0.017 |
| GOT (U/L) | 17.5 ± 5.06 | 20.1 ± 11.3 | 16.7 ± 8.99 | 15.2 ± 8.77 | 0.075 |
| GPT (U/L) | 22.2 ± 10.8 | 24.6 ± 15.7 | 24.6 ± 12.3 | 27 ± 11.5 | 0.166 |
| Alkaline phosphatase (U/L) | 71.7 ± 21 | 68 ± 19 | 64.2 ± 21.2 | 57.2 ± 20.2 | 0.008 |
| GammaGT (U/L) | 15.2 ± 8.01 | 16.5 ± 6.24 | 14.2 ± 3.86 | 14.5 ± 5.01 | 0.431 |
| Creatinine (mg/dL) | 0.72 ± 0.08 | 0.82 ± 0.13 | 0.78 ± 0.13 | 0.78 ± 0.12 | 0.055 |
| Na (mmol/L) | 140.2 ± 2.16 | 139.6 ± 1.67 | 139.6 ± 1.14 | 139.8 ± 1.30 | 0.824 |
| K (mmol/L) | 4.44 ± 0.42 | 4.32 ± 0.31 | 4.12 ± 0.27 | 4.08 ± 0.35 | 0.063 |
| Calcium (mg/dL) | 9.36 ± 0.25 | 9.68 ± 0.23 | 9.58 ± 0.24 | 9.34 ± 0.36 | 0.246 |
| Phosphorus (mg/dL) | 3.28 ± 0.29 | 3.36 ± 0.34 | 3.32 ± 0.24 | 3.14 ± 0.27 | 0.952 |
| Vitamin D (mcg/L) | 21.4 ± 5.223. | 27.2 ± 6.53 | 30.2 ± 7.69 | 32 ± 14.03 | 0.015 |
| PTH (ng/L) | 52.7 ± 17.5 | 44.7 ± 14.7 | 50.5 ± 21.8 | 38.5 ± 27.7 | 0.188 |
| C-reactive protein (mg/L) | 2.44 ± 1.92 | 2.34 ± 2.28 | 1.13 ± 1.02 | 1.39 ± 1.35 | 0.682 |
Figure 2.
Comparison in insulin sensitivity parameters in patients with Cushing’s disease and controls at baseline and after 5 weeks of ketogenic diet (data are expressed in mean ± SD). *** p<0.001; *p<0.005.
Figure 2.
Comparison in insulin sensitivity parameters in patients with Cushing’s disease and controls at baseline and after 5 weeks of ketogenic diet (data are expressed in mean ± SD). *** p<0.001; *p<0.005.

A significant decrease in BMI (p=0.003), WC (p=0.002), systolic (p=0.025) and diastolic (p=0.007) blood pressure and total cholesterol (p= 0.026) and increase in HDL cholesterol (p= 0.001) and DIo (p<0.001) was observed in controls (Table 3 and Figure 3).
Analysing in detail patients with CD, after 5 weeks of ketogenic diet we observed a decrease in ACTH in 12 out of 15 patients, UFC in 10 out of 15 patients, salivary cortisol in 6 out of 15 and cortisol after 1 mg of DST in 4 out of 15 patients (Figure 3). By contrast, in controls we observed a decrease in ACTH in 12 out of 15 patients, UFC in 6 out of 15, cortisol after 1 mg of DST in 4 out of 15, serum cortisol in 5 out of 15 after 5 weeks of diet (results not shown).
4. Discussion
The current study shows that a 3-week VLCKD followed by a 2-week LCKD is associated with an improvement in clinical, lipid and insulin sensitivity parameters in patients with CD and controls.
We did not observe any changes in serum and urinary cortisol levels and ACTH levels, while a significant increase in cortisone serum levels was observed in patients with CD. We also observed an increase in vitamin D levels in patients with CD after 5 weeks of ketogenic diet.
We also showed that patients with CS had lower vitamin D levels compared to healthy controls, as recently reported [9], with significant improvement after VLCKD. Recently, Perticone et al. reported an improvement of vitamin D values in patients who followed a ketogenic diet protocol, due to the significant weight loss [22].
The relationship between fasting and caloric restriction and cortisol is complex and interesting.
Although some studies reported that caloric diet restriction is associated with an increase in serum and salivary cortisol and UFC levels and inadequate suppression of cortisol after low dose of DST [12,13,17,23], this aspect is not clearly ascertained (24,25).
An interesting role in obesity is played by the enzyme 11-β-hydroxysteroid dehydrogenase type 1 (11β-HSD1), which is involved in conversion of inactive cortisone into active cortisol; it was observed that this activity could change after weight loss [24]. A study conducted on 24 obese men showed increased cortisol production rate and free cortisol levels combined with decreased 11β-HSD1 after weight loss [25].
Stimson et al. showed that a lower carb diet was able to regenerate cortisol by increasing the enzyme 11β-HSD1, which activates cortisol, and reducing the enzymes (5-alpha and 5-beta reductase), which inactivate cortisol, and to induce weight loss, improving glucose and insulin levels, in a group of obese men [26]. The regeneration of cortisol in the low-carb group was independent of the number of calories; rather, it was correlated with the carb ratio in the diet.
Another study evaluated the effects of carbohydrate, high-protein and fat meals on cortisol levels in 8 lean men, showing that carbohydrates stimulate both the adrenal cortisol secretion and the extra-adrenal cortisol regeneration mediated by 11β-HSD1, while high-protein and fat meals stimulate adrenal cortisol secretion to a greater degree than extra-adrenal regeneration [27].
Other studies reported unchanged serum cortisol, cortisone and urinary steroids levels and decreased 11β-HSD1 after weight loss [28]. In agreement with all the above-mentioned findings, it may be hypothesized that the more significant the weight loss is, the more 11β-HSD1 activity is decreased, as also suggested by studies conducted on patients undergoing bariatric surgery [29,30].
Interestingly, a meta-analysis conducted on 13 studies analysed the effects of fasting, very low-calorie diet (VLCD) and low-calorie diet (LCD) on serum cortisol levels [31]. This meta-analysis only included studies that evaluated serum cortisol levels, excluding those which included salivary or urinary cortisol levels, in order to avoid heterogeneity of the studies. The results of the meta-analysis showed that short-term calorie restriction was associated more with an increase in cortisol values, compared to VLCD and LCD, which, in turn, had no long-term effects on serum cortisol values and was less stressful than fasting. In addition, carbohydrate restriction was associated with a decrease in insulin concentration, leading to extra-adrenal cortisol synthesis [31].
Further, some nutrients such as tryptophan, phospholipids and other compounds including vitamin B6 and B12, folic acid, lithium, taurine, fermented milk products and sprouts of brown rice, barley and beans, stimulate the GABAergic system, reducing CRH secretion and leading to a decrease in cortisol levels [32,33,34,35].
A very few findings are currently available on the usefulness of a nutritional approach for the management of patients with CS. Recently, Dugandzic et al. described the case of a patient with CD who had beneficial effects on metabolic complications, correlated with CD, by following a low carb diet [36].
Nutritional intervention may be a mainstay for the treatment of CD, able to improve metabolic complications of CD, combined with the treatment of the primary disease, independently of the biochemical hypercortisolism control.
Indeed, VLCKD induces weight loss reducing visceral fat, by lowering appetite [37] and lipogenesis and increasing lipolysis [37,38]. It also reduces glucose and insulin levels, improving insulin sensitivity, leading to an improvement of glycaemic control for patients with type 2 diabetes mellitus and improvement of gonadal function in women (PCOS) [5,39,40,41]. In addition, ketogenesis is associated with a reduction in blood pressure values, which can be attributed in part to the natriuretic effect of ketone bodies [42]. Controlled ketogenesis is one of the mechanisms of action of inhibitors of renal sodium-glucose co-transporter type 2 (SGLT2-inhibitors), which, in addition to causing natriuresis and glycosuria, promote a shift towards ketogenesis; this mechanism is involved in a 38% decrease in cardiovascular mortality [43]. The cardiovascular beneficial effects induced by SGLT2-inhibitors may be related to the inhibitory action of ketone bodies on the sympathetic nervous system [44].
Further, VLCKD improves inflammation, reducing TNF-alpha, PAI-1, IL-6, IL-8 and MCP-1, which are strongly involved in the pathophysiology of cardiovascular diseases and obesity [45].
The current study shows some limitations. First, the number of patients with CD included in the study is quite low, even though CD is rare. Second, the duration of the study is brief. Third, the pharmacological treatment of CD was different among the patients. However, the study, to our knowledge, is the first one which evaluates the usefulness of nutritional intervention in patients with CD, analysing the effects on serum and urinary cortisol levels, beyond anthropometric, metabolic and insulin sensitivity parameters not only in patients with CD, but also in a control group.
5. Conclusions
The current study confirms that VLCKD and LCKD are effective in improving metabolic disorders and shows that a nutritional approach may be combined with conventional CD therapy in order to improve metabolic and cardiovascular comorbidities. Indeed, independently of the biochemical control of hypercortisolism, metabolic comorbidities can persist. For this reason, in patients with CD, a low-carb diet, including ketogenic one, could be started before and/or after pituitary surgery or in patients pharmacologically treated with pituitary or adrenal directed drugs.
Author Contributions
Conceptualization, V.G., R.A. and C.G.; methodology, V.G.; formal analysis, V.G., R.A. and F.D.G.; investigation, R.A.; resources, F.D.G.; data curation, V.G. and R.A.; writing—original draft preparation, V.G.; writing—review and editing, V.G., R.A., F.D.G. and C.G.; supervision, C.G. All authors have read and agreed to the published version of the manuscript.
Funding
This research was funded by PENTA, which provided the replacement meals for patients and the APC was funded by Penta.
Institutional Review Board Statement
The study was conducted in accordance with the Declaration of Helsinki, and approved by the Institutional Review Board (or Ethics Committee) of Policlinico Paolo Giaccone (03/2022).
Informed Consent Statement
Informed consent was obtained from all subjects involved in the study. Written informed consent has been obtained from the patients to publish this paper.
Data Availability Statement
Restrictions apply to the availability of some or all data generated or analyzed during this study to preserve patient confidentiality or because they were used under license. The corresponding author will on request detail the restrictions and any conditions under which access to some data may be provided.
Acknowledgments
We acknowledge prof. Denis Gailor for the English language revision.
Conflicts of Interest
The authors declare no conflict of interest. The funders had no role in the design of the study; in the collection, analyses, or interpretation of data; in the writing of the manuscript; or in the decision to publish the results.
References
- Barbot, M.; Zilio, M.; Scaroni, C. Cushing’s Syndrome: Overview of Clinical Presentation, Diagnostic Tools and Complications. Best Pract. Res. Clin. Endocrinol. Metab. 2020, 34, 101380. [CrossRef]
- Guarnotta, V.; Prinzi, A.; Pitrone, M.; Pizzolanti, G.; Giordano, C. Circulating Irisin Levels as a Marker of Osteosarcopenic-Obesity in Cushing’s Disease. DMSO 2020, 13, 1565–1574. [CrossRef]
- Nieman, L.K. Hypertension and Cardiovascular Mortality in Patients with Cushing Syndrome. Endocrinol. Metab. Clin. North Am. 2019, 48, 717–725. [CrossRef]
- Kirkpatrick, C.F.; Bolick, J.P.; Kris-Etherton, P.M.; Sikand, G.; Aspry, K.E.; Soffer, D.E.; Willard, K.-E.; Maki, K.C. Review of Current Evidence and Clinical Recommendations on the Effects of Low-Carbohydrate and Very-Low-Carbohydrate (Including Ketogenic) Diets for the Management of Body Weight and Other Cardiometabolic Risk Factors: A Scientific Statement from the National Lipid Association Nutrition and Lifestyle Task Force. J. Clin. Lipidol. 2019, 13, 689-711.e1. [CrossRef]
- Paoli, A.; Rubini, A.; Volek, J.S.; Grimaldi, K.A. Beyond Weight Loss: A Review of the Therapeutic Uses of Very-Low-Carbohydrate (Ketogenic) Diets. Eur J Clin Nutr 2013, 67, 789–796. [CrossRef]
- Cicero, A.F.G.; Benelli, M.; Brancaleoni, M.; Dainelli, G.; Merlini, D.; Negri, R. Middle and Long-Term Impact of a Very Low-Carbohydrate Ketogenic Diet on Cardiometabolic Factors: A Multi-Center, Cross-Sectional, Clinical Study. High Blood Press Cardiovasc Prev 2015, 22, 389–394. [CrossRef]
- Merra, G.; Miranda, R.; Barrucco, S.; Gualtieri, P.; Mazza, M.; Moriconi, E.; Marchetti, M.; Chang, T.F.M.; De Lorenzo, A.; Di Renzo, L. Very-Low-Calorie Ketogenic Diet with Aminoacid Supplement versus Very Low Restricted-Calorie Diet for Preserving Muscle Mass during Weight Loss: A Pilot Double-Blind Study. Eur Rev Med Pharmacol Sci 2016, 20, 2613–2621.
- Antonio, J.; Ellerbroek, A.; Silver, T.; Vargas, L.; Tamayo, A.; Buehn, R.; Peacock, C.A. A High Protein Diet Has No Harmful Effects: A One-Year Crossover Study in Resistance-Trained Males. J. Nutr. Metab. 2016, 2016, 1–5. [CrossRef]
- Guarnotta, V.; Emanuele, F.; Amodei, R.; Giordano, C. Very Low-Calorie Ketogenic Diet: A Potential Application in the Treatment of Hypercortisolism Comorbidities. Nutrients 2022, 14, 2388. [CrossRef]
- Lemmens, S.G.; Born, J.M.; Martens, E.A.; Martens, M.J.; Westerterp-Plantenga, M.S. Influence of Consumption of a High-Protein vs. High-Carbohydrate Meal on the Physiological Cortisol and Psychological Mood Response in Men and Women. PLoS ONE 2011, 6, e16826. [CrossRef]
- Galvão-Teles, A.; Graves, L.; Burke, C.W.; Fotherby, K.; Fraser, R. FREE CORTISOL IN OBESITY; EFFECT OF FASTING. Acta Endocrinol. 1976, 81, 321–329. [CrossRef]
- Effects of Weight Loss on the Dexamethasone Suppression Test. AJP 1983, 140, 338–341. [CrossRef]
- Tomiyama, A.J.; Mann, T.; Vinas, D.; Hunger, J.M.; DeJager, J.; Taylor, S.E. Low Calorie Dieting Increases Cortisol. Psychosom. Med. 2010, 72, 357–364. [CrossRef]
- Peeters, F.; Nicholson, N.A.; Berkhof, J. Cortisol Responses to Daily Events in Major Depressive Disorder. Psychosom. Med. 2003, 65, 836–841. [CrossRef]
- Martens, M.J.I.; Rutters, F.; Lemmens, S.G.T.; Born, J.M.; Westerterp-Plantenga, M.S. Effects of Single Macronutrients on Serum Cortisol Concentrations in Normal Weight Men. Physiol. Behav. 2010, 101, 563–567. [CrossRef]
- Bray, G.A.; Most, M.; Rood, J.; Redmann, S.; Smith, S.R. Hormonal Responses to a Fast-Food Meal Compared with Nutritionally Comparable Meals of Different Composition. Ann Nutr Metab 2007, 51, 163–171. [CrossRef]
- Berger, M. Influence of Weight Loss on the Dexamethasone Suppression Test. Arch Gen Psychiatry 1983, 40, 585. [CrossRef]
- Abbasi, J. Interest in the Ketogenic Diet Grows for Weight Loss and Type 2 Diabetes. JAMA 2018, 319, 215. [CrossRef]
- Dehghan, M.; Mente, A.; Zhang, X.; Swaminathan, S.; Li, W.; Mohan, V.; Iqbal, R.; Kumar, R.; Wentzel-Viljoen, E.; Rosengren, A.; et al. Associations of Fats and Carbohydrate Intake with Cardiovascular Disease and Mortality in 18 Countries from Five Continents (PURE): A Prospective Cohort Study. Lancet 2017, 390, 2050–2062. [CrossRef]
- Fleseriu, M.; Auchus, R.; Bancos, I.; Ben-Shlomo, A.; Bertherat, J.; Biermasz, N.R.; Boguszewski, C.L.; Bronstein, M.D.; Buchfelder, M.; Carmichael, J.D.; et al. Consensus on Diagnosis and Management of Cushing’s Disease: A Guideline Update. Lancet Diabetes Endocrinol. 2021, 9, 847–875. [CrossRef]
- Barbot, M.; Guarnotta, V.; Zilio, M.; Ceccato, F.; Ciresi, A.; Daniele, A.; Pizzolanti, G.; Campello, E.; Frigo, A.C.; Giordano, C.; et al. Effects of Pasireotide Treatment on Coagulative Profile: A Prospective Study in Patients with Cushing’s Disease. Endocrine 2018, 62, 207–214. [CrossRef]
- Perticone, M.; Maio, R.; Sciacqua, A.; Suraci, E.; Pinto, A.; Pujia, R.; Zito, R.; Gigliotti, S.; Sesti, G.; Perticone, F. Ketogenic Diet-Induced Weight Loss Is Associated with an Increase in Vitamin D Levels in Obese Adults. Molecules 2019, 24, 2499. [CrossRef]
- Dubuc, G.R.; Phinney, S.D.; Stern, J.S.; Havel, P.J. Changes of Serum Leptin and Endocrine and Metabolic Parameters after 7 Days of Energy Restriction in Men and Women. Metabolism 1998, 47, 429–434. [CrossRef]
- Tomlinson, J.W.; Walker, E.A.; Bujalska, I.J.; Draper, N.; Lavery, G.G.; Cooper, M.S.; Hewison, M.; Stewart, P.M. 11beta-Hydroxysteroid Dehydrogenase Type 1: A Tissue-Specific Regulator of Glucocorticoid Response. Endocr Rev 2004, 25, 831–866. [CrossRef]
- Purnell, J.Q.; Kahn, S.E.; Samuels, M.H.; Brandon, D.; Loriaux, D.L.; Brunzell, J.D. Enhanced Cortisol Production Rates, Free Cortisol, and 11beta-HSD-1 Expression Correlate with Visceral Fat and Insulin Resistance in Men: Effect of Weight Loss. Am J Physiol Endocrinol Metab 2009, 296, E351-357. [CrossRef]
- Stimson, R.H.; Johnstone, A.M.; Homer, N.Z.M.; Wake, D.J.; Morton, N.M.; Andrew, R.; Lobley, G.E.; Walker, B.R. Dietary Macronutrient Content Alters Cortisol Metabolism Independently of Body Weight Changes in Obese Men. J Clin Endocrinol Metab 2007, 92, 4480–4484. [CrossRef]
- Stimson, R.H.; Mohd-Shukri, N.A.; Bolton, J.L.; Andrew, R.; Reynolds, R.M.; Walker, B.R. The Postprandial Rise in Plasma Cortisol in Men Is Mediated by Macronutrient-Specific Stimulation of Adrenal and Extra-Adrenal Cortisol Production. J. Clin. Endocrinol. Metab. 2014, 99, 160–168. [CrossRef]
- Stomby, A.; Simonyte, K.; Mellberg, C.; Ryberg, M.; Stimson, R.H.; Larsson, C.; Lindahl, B.; Andrew, R.; Walker, B.R.; Olsson, T. Diet-Induced Weight Loss Has Chronic Tissue-Specific Effects on Glucocorticoid Metabolism in Overweight Postmenopausal Women. Int J Obes (Lond) 2015, 39, 814–819. [CrossRef]
- Engeli, S.; Böhnke, J.; Feldpausch, M.; Gorzelniak, K.; Heintze, U.; Janke, J.; Luft, F.C.; Sharma, A.M. Regulation of 11beta-HSD Genes in Human Adipose Tissue: Influence of Central Obesity and Weight Loss. Obes Res 2004, 12, 9–17. [CrossRef]
- Woods, C.P.; Corrigan, M.; Gathercole, L.; Taylor, A.; Hughes, B.; Gaoatswe, G.; Manolopoulos, K.; Hogan, A.E.; O’Connell, J.; Stewart, P.M.; et al. Tissue Specific Regulation of Glucocorticoids in Severe Obesity and the Response to Significant Weight Loss Following Bariatric Surgery (BARICORT). J Clin Endocrinol Metab 2015, 100, 1434–1444. [CrossRef]
- Nakamura, Y.; Walker, B.R.; Ikuta, T. Systematic Review and Meta-Analysis Reveals Acutely Elevated Plasma Cortisol Following Fasting but Not Less Severe Calorie Restriction. Stress 2016, 19, 151–157. [CrossRef]
- Capello, A.E.M.; Markus, C.R. Effect of Sub Chronic Tryptophan Supplementation on Stress-Induced Cortisol and Appetite in Subjects Differing in 5-HTTLPR Genotype and Trait Neuroticism. Psychoneuroendocrinology 2014, 45, 96–107. [CrossRef]
- Starks, M.A.; Starks, S.L.; Kingsley, M.; Purpura, M.; Jäger, R. The Effects of Phosphatidylserine on Endocrine Response to Moderate Intensity Exercise. J. Int. Soc. Sports Nutr. 2008, 5, 11. [CrossRef]
- Miklós, I.H.; Kovács, K.J. GABAergic Innervation of Corticotropin-Releasing Hormone (CRH)-Secreting Parvocellular Neurons and Its Plasticity as Demonstrated by Quantitative Immunoelectron Microscopy. Neuroscience 2002, 113, 581–592. [CrossRef]
- Song, Z. Taurine and the Control of Basal Hormone Release from Rat Neurohypophysis. Exp. Neurol. 2003, 183, 330–337. [CrossRef]
- Dugandzic, M.K.; Pierre-Michel, E.-C.; Kalayjian, T. Ketogenic Diet Initially Masks Symptoms of Hypercortisolism in Cushing’s Disease. Metabolites 2022, 12, 1033. [CrossRef]
- Yang, Z.; Mi, J.; Wang, Y.; Xue, L.; Liu, J.; Fan, M.; Zhang, D.; Wang, L.; Qian, H.; Li, Y. Effects of Low-Carbohydrate Diet and Ketogenic Diet on Glucose and Lipid Metabolism in Type 2 Diabetic Mice. Nutrition 2021, 89, 111230. [CrossRef]
- Ma, S.; Huang, Q.; Tominaga, T.; Liu, C.; Suzuki, K. An 8-Week Ketogenic Diet Alternated Interleukin-6, Ketolytic and Lipolytic Gene Expression, and Enhanced Exercise Capacity in Mice. Nutrients 2018, 10, 1696. [CrossRef]
- Xu, Y.; Qiao, J. Association of Insulin Resistance and Elevated Androgen Levels with Polycystic Ovarian Syndrome (PCOS): A Review of Literature. J. Healthc. Eng. 2022, 2022, 1–13. [CrossRef]
- Mavropoulos, J.C.; Yancy, W.S.; Hepburn, J.; Westman, E.C. The Effects of a Low-Carbohydrate, Ketogenic Diet on the Polycystic Ovary Syndrome: A Pilot Study. Nutr Metab (Lond) 2005, 2, 35. [CrossRef]
- Gower, B.A.; Chandler-Laney, P.C.; Ovalle, F.; Goree, L.L.; Azziz, R.; Desmond, R.A.; Granger, W.M.; Goss, A.M.; Bates, G.W. Favourable Metabolic Effects of a Eucaloric Lower-Carbohydrate Diet in Women with PCOS. Clin Endocrinol 2013, 79, 550–557. [CrossRef]
- Khan, S.S.; Ning, H.; Wilkins, J.T.; Allen, N.; Carnethon, M.; Berry, J.D.; Sweis, R.N.; Lloyd-Jones, D.M. Association of Body Mass Index With Lifetime Risk of Cardiovascular Disease and Compression of Morbidity. JAMA Cardiol 2018, 3, 280. [CrossRef]
- Palgi, A.; Read, J.L.; Greenberg, I.; Hoefer, M.A.; Bistrian, B.R.; Blackburn, G.L. Multidisciplinary Treatment of Obesity with a Protein-Sparing Modified Fast: Results in 668 Outpatients. Am J Public Health 1985, 75, 1190–1194. [CrossRef]
- Ferrannini, E.; Baldi, S.; Frascerra, S.; Astiarraga, B.; Heise, T.; Bizzotto, R.; Mari, A.; Pieber, T.R.; Muscelli, E. Shift to Fatty Substrate Utilization in Response to Sodium–Glucose Cotransporter 2 Inhibition in Subjects Without Diabetes and Patients With Type 2 Diabetes. Diabetes 2016, 65, 1190–1195. [CrossRef]
- Monda, V.; Polito, R.; Lovino, A.; Finaldi, A.; Valenzano, A.; Nigro, E.; Corso, G.; Sessa, F.; Asmundo, A.; Di Nunno, N.; et al. Short-Term Physiological Effects of a Very Low-Calorie Ketogenic Diet: Effects on Adiponectin Levels and Inflammatory States. IJMS 2020, 21, 3228. [CrossRef]
Figure 1.
Mechanisms of ketogenesis. Reduction in exogenous glucose intake and reduction in the insulin/glucagon ratio result in reduced inhibition of lipolysis in adipose tissue. This leads to increased levels of free fatty acids circulating and to greater beta-oxidation of fatty acids, with the formation of ketone bodies at the liver level and to a lesser extent at the renal level. Blood sugar levels are maintained in a physiological range thanks to liver function, both through mobilization from the hepatic glycogen reserve and through the process of gluconeogenesis.
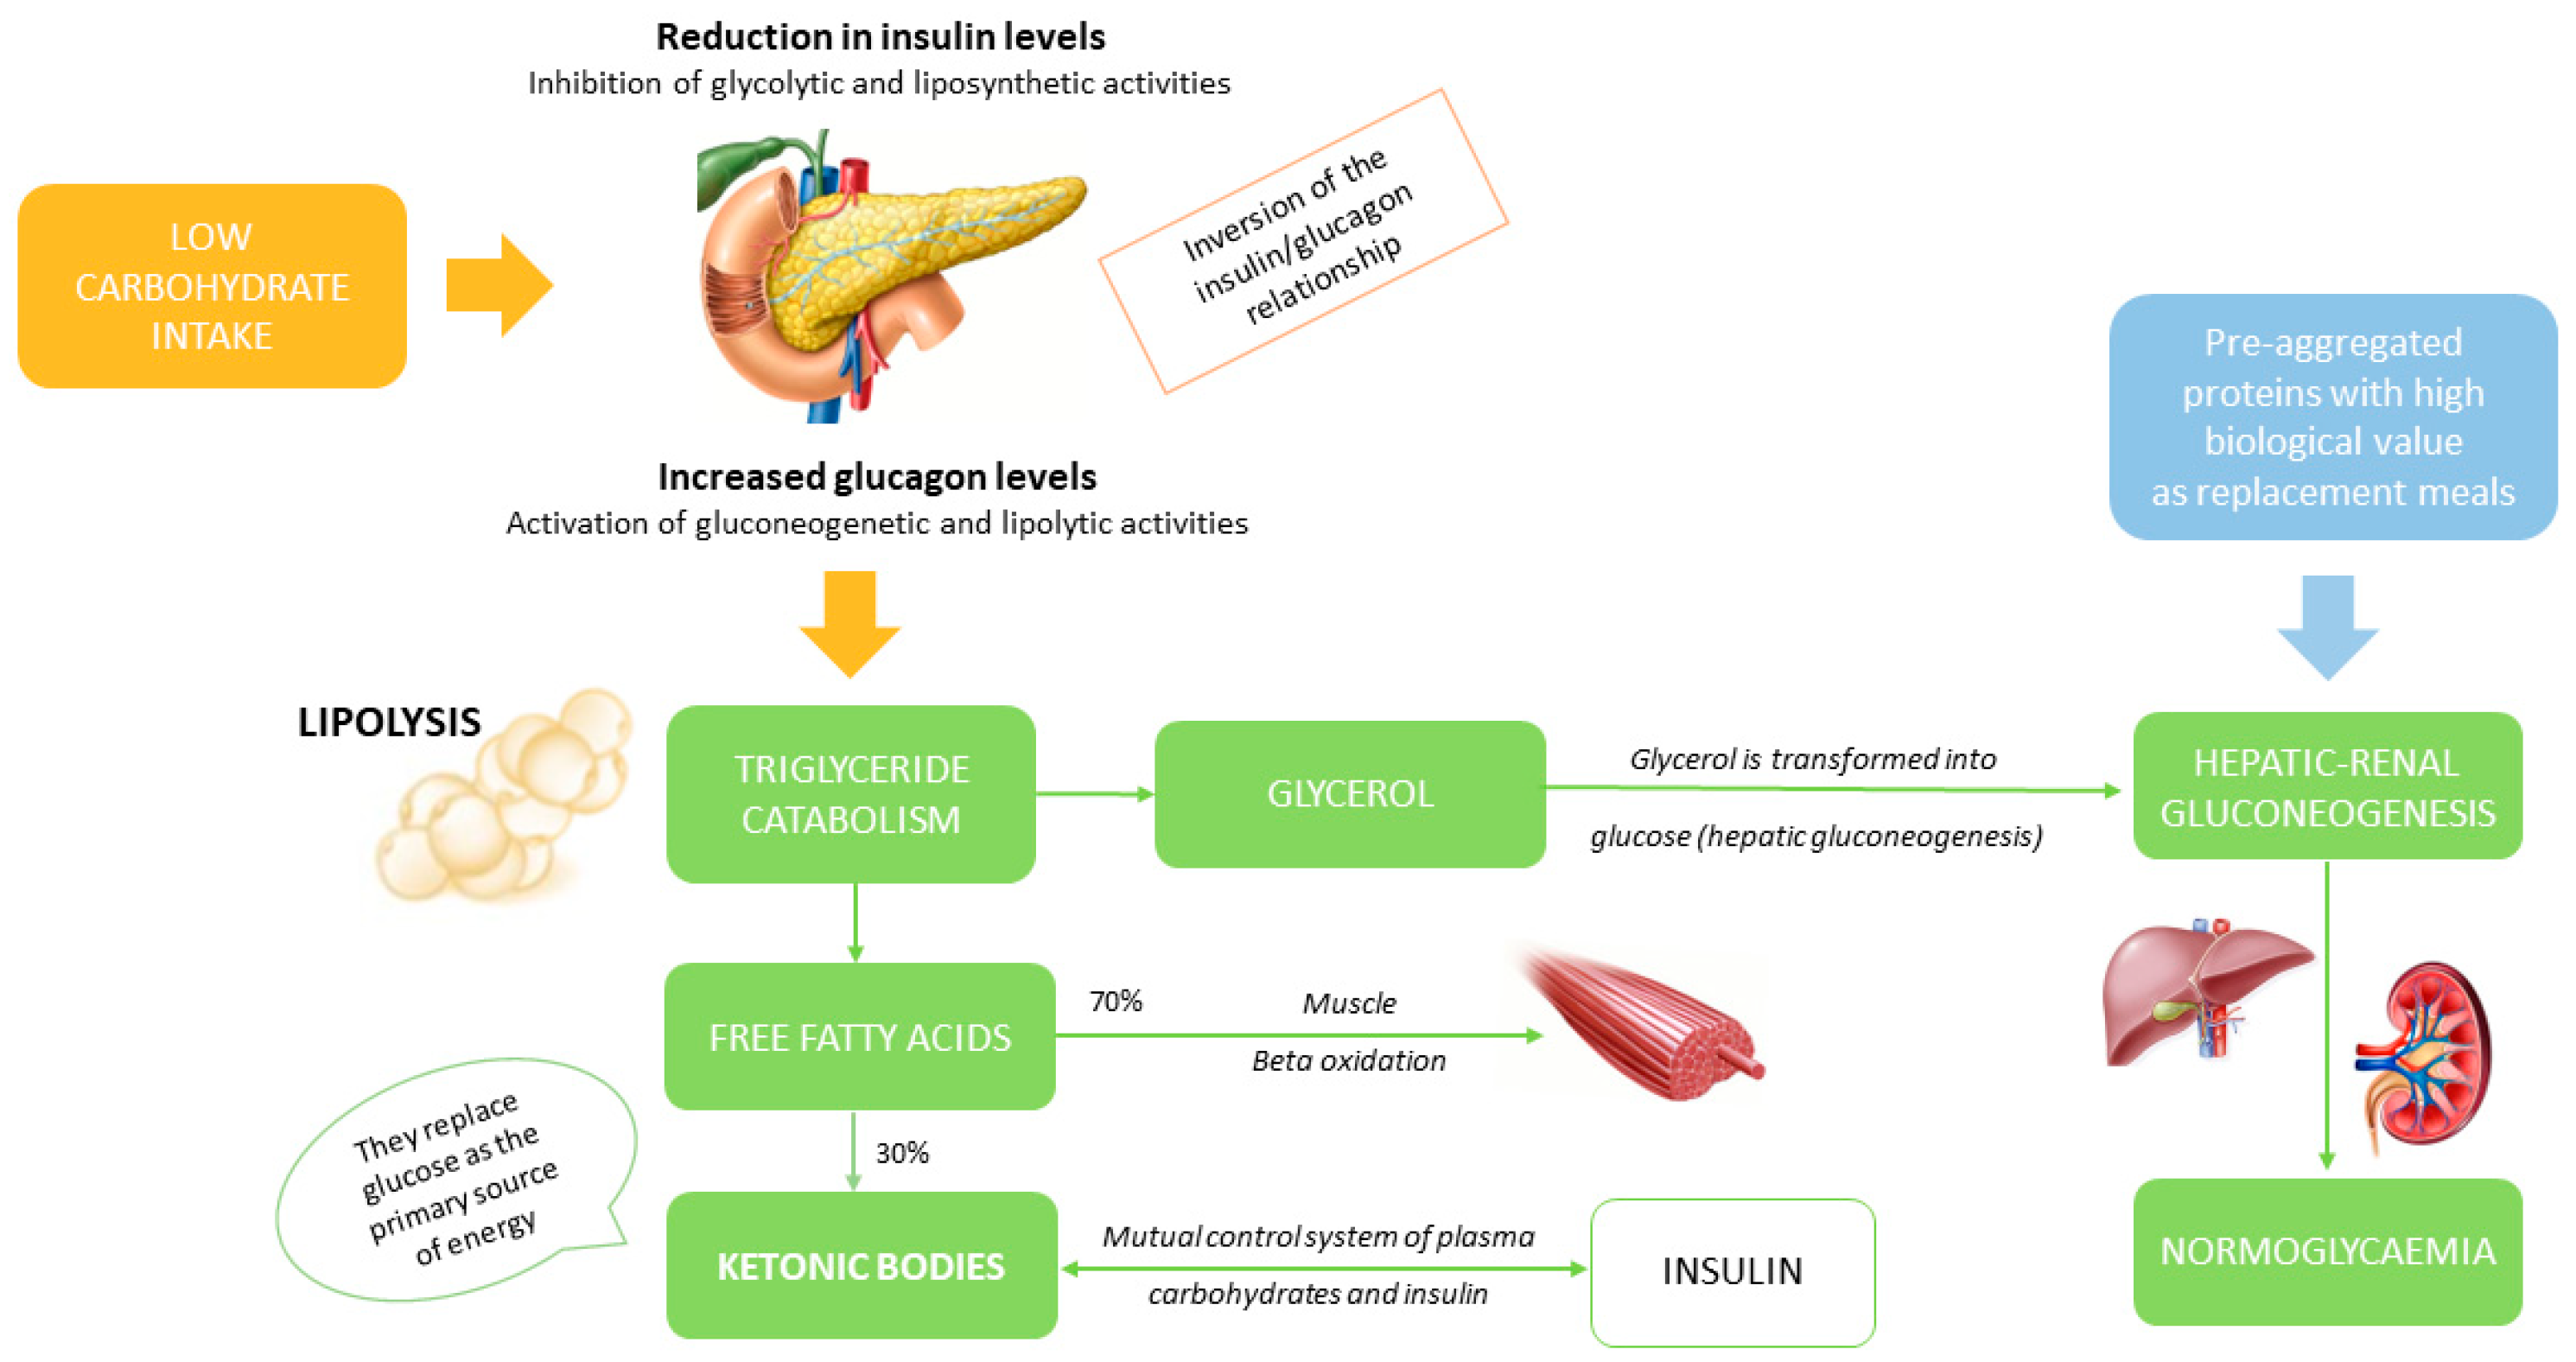
Figure 3.
Changes in urinary free cortisol, salivary cortisol, cortisol after dexamethasone suppression test (DST) and ACTH in each patient with Cushing’s disease at baseline and after 1,3 and 5 weeks of ketogenic diet.
Figure 3.
Changes in urinary free cortisol, salivary cortisol, cortisol after dexamethasone suppression test (DST) and ACTH in each patient with Cushing’s disease at baseline and after 1,3 and 5 weeks of ketogenic diet.

Table 1.
General characteristics of all patients enrolled in the study.
| Patients with Cushing’s disease (N=15) |
Controls (N=15) |
p |
|
| Mean ± SD | Mean ± SD | ||
| Clinical parameters | |||
| Age (years) | 47.2 ± 10.6 | 50.8 ± 11.7 | 0.535 |
| BMI (Kg/m2) | 35.7 ± 4.5 | 32.8 ± 2.14 | 0.175 |
| Waist circumference (cm) | 114.4 ± 12.7 | 96.6 ± 14.2 | 0.035 |
| Systolic blood pressure (mmHg) | 125.8 ± 15.6 | 122.3 ± 8.6 | 0.453 |
| Diastolic blood pressure (mmHg) | 88.2 ± 7.8 | 83.2 ± 4.8 | 0.057 |
| Hormonal parameters | |||
| Fasting serum cortisol (mcg/dL) | 13.2 ± 4.11 | 11.2 ± 3.44 | 0.443 |
| Fasting serum ACTH (ng/L) | 77.8 ± 40.8 | 27.1 ± 19.5 | 0.043 |
| Urinary free cortisol (mcg/24h) | 56.8 ± 30.9 | 33.4 ± 10.7 | <0.001 |
| Salivary cortisol | 6.6 ± 2.76 | 0.76 ± 0.49 | <0.001 |
| Cortisol after low dose suppression test (mcg/dL) | 4.14 ± 3.55 | 0.99 ± 0.66 | 0.002 |
| Androstenedione (mcg/L) | 2.86 ± 2.31 | 0.71 ± 0.34 | <0.001 |
| DHEAS (mcg/dL) | 1743 ± 1110 | 624.5 ± 324.5 | 0.008 |
| Cortisone (mcg/L) | 15.1 ± 3.9 | 18.6 ± 6.5 | 0.624 |
| 17OHP (mcg/L) | 0.53 ± 0.22 | 0.32 ± 0.21 | 0.339 |
| Metabolic parameters | |||
| Glycaemia (mmol/L) | 4.91 ± 0.83 | 4.44 ± 0.34 | 0.239 |
| Insulinemia (microU/mL) | 9.48 ± 8.44 | 7.46 ± 3.83 | 0.639 |
| HbA1c (%) | 5.96 ± 0.96 | 5.14 ± 0.32 | 0.045 |
| Total cholesterol (mmol/L) | 4.96 ± 0.6 | 4.97 ± 0.6 | 0.637 |
| HDL cholesterol (mmol/L) | 1.36 ± 0.28 | 1.38 ± 0.53 | 0.958 |
| Triglycerides (mmol/L) | 1.2 ± 0.5 | 0.82 ± 0.37 | 0.116 |
| LDL cholesterol (mmol/L) | 2.63 ± 0.58 | 2.8 ± 0.44 | 0.931 |
| GOT (U/L) | 17.5 ± 5.06 | 22.2 ± 10.8 | 0.131 |
| GPT (U/L) | 22.2 ± 10.8 | 22.8 ± 6.96 | 0.919 |
| Alkaline phosphatase (U/L) | 71.7 ± 21.6 | 72.2 ± 19.6 | 0.975 |
| GammaGT (U/L) | 15.1 ± 8.01 | 15 ± 12.1 | 0.445 |
| Creatinine (mg/dL) | 0.72 ± 0.08 | 0.71 ± 0.13 | 0.854 |
| Na (mmol/L) | 140.2 ± 2.16 | 139.8 ± 1.78 | 0.758 |
| K (mmol/L) | 4.4 ± 0.42 | 4.2 ± 0.44 | 0.408 |
| Calcium (mg/dL) | 9.36 ± 0.25 | 9.31 ± 0.26 | 0.717 |
| Phosphorus (mg/dL) | 3.28 ± 0.29 | 3.56 ± 0.23 | 0.395 |
| Vitamin D (mcg/L) | 21.4 ± 5.22 | 25.6 ± 5.09 | 0.033 |
| PTH (ng/L) | 52.7 ± 17.5 | 43 ± 11.8 | 0.351 |
| C-reactive protein (mg/L) | 2.44 ± 1.95 | 0.79 ± 0.75 | 0.145 |
| Dio | 0.97 ± 0.66 | 2.91 ± 2.77 | <0.001 |
| AUC 2h insulinemia (uU/ml 120 min) | 11370 ± 5592 | 4977 ± 1636.5 | 0.040 |
| AUC 2h glycaemia (mmol/l 120 min) | 1004.1 ± 330.3 | 700.6 ± 111.9 | 0.022 |
| HOMA-IR | 2.06 ± 1.95 | 1.44 ± 0.71 | 0.521 |
| ISI-Matsuda | 5.08 ± 3.66 | 7.85 ± 3.73 | 0.049 |
Abbreviations: DIo oral disposition index, AUC 2h insulinemia (area under the curve of insulin) and AUC 2h glycaemia (area under the curve of glucose), PTH, parathyroid hormone.
Table 3.
Clinical, hormonal and metabolic parameters in controls at baseline and after 1,3 and 5 weeks of ketogenic diet.
Table 3.
Clinical, hormonal and metabolic parameters in controls at baseline and after 1,3 and 5 weeks of ketogenic diet.
| Controls (N=15) |
|||||
|---|---|---|---|---|---|
| Baseline Mean (± SD) |
Week 1 Mean (± SD) |
Week 3 Mean (± SD) |
Week 5 Mean (± SD) |
p |
|
| Clinical parameters | |||||
| BMI (Kg/m2) | 32.8 ± 2.14 | 27.4 ± 3.14 | 26.3 ± 2.91 | 25.5 ± 2.33 | 0.003 |
| Waist circumference (cm) | 96.6 ± 14.2 | 95.1 ± 14.8 | 93.2 ± 13.5 | 92 ± 13.3 | 0.002 |
| Systolic blood pressure (mmHg) | 122.3 ± 8.6 | 119.4 ± 6.7 | 115.3 ± 5.6 | 114.7 ± 6.3 | 0.025 |
| Diastolic blood pressure (mmHg) | 83.2 ± 4.8 | 81.5 ± 3.6 | 80.7 ± 4.2 | 78.2 ± 4.6 | 0.007 |
| Hormonal parameters | |||||
| Fasting serum cortisol (mcg/dL) | 11.2 ± 3.44 | 18.8 ± 1.83 | 17.9 ± 2.11 | 15.7 ± 2.05 | 0.180 |
| Urinary free cortisol (mcg/24h) | 33.4 ± 10.7 | 29.5 ± 15.7 | 32.6 ± 17.8 | 27.9 ± 14.3 | 0.552 |
| Salivary cortisol | 0.76 ± 0.49 | 0.85 ± 0.59 | 0.48 ± 0.15 | 0.52 ± 0.27 | 0.818 |
| 17OHP (mcg/L) | 0.32 ± 0.21 | 0.34 ± 0.28 | 0.45 ± 0.27 | 0.41 ± 0.22 | 0.768 |
| Androstenedione (mcg/dL) | 0.71 ± 0.34 | 1.21 ± 0.75 | 1.35 ± 1.05 | 1.15 ± 0.95 | 0.567 |
| DHEAS (mcg/L) | 624.5 ± 324.5 | 557.1 ± 194.5 | 587.9 ± 234.5 | 598.4 ± 205.5 | 0.768 |
| Cortisone (mcg/L) | 18.6 ± 6.5 | 20.1 ± 5.6 | 19.5 ± 4.9 | 18.6 ± 7.3 | 0.645 |
|
Metabolic parameters |
|||||
| Glycaemia (mmol/L) | 4.44 ± 0.34 | 4.03 ± 0.98 | 4.22 ± 0.71 | 3.83 ± 0.16 | 0.074 |
| Insulinemia (microU/mL) | 7.46 ± 3.83 | 10.1 ± 9.51 | 4.15 ± 3.32 | 5.65 ± 5.05 | 0.241 |
| HbA1c (%) | 5.14 ± 0.32 | 5.25 ± 0.63 | 5.25 ± 0.49 | 5.11 ± 0.71 | 0.290 |
| Total cholesterol (mmol/L) | 4.97 ± 0.6 | 4.48 ± 0.2 | 4.07 ± 0.67 | 4.07 ± 0.75 | 0.026 |
| HDL cholesterol (mmol/L) | 1.38 ± 0.53 | 1.47 ± 0.62 | 1.5 ± 0.69 | 1.6 ± 0.32 | 0.001 |
| Triglycerides (mmol/L) | 0.82 ± 0.37 | 0.89 ± 0.27 | 0.69 ± 0.1 | 0.71 ± 0.22 | 0.145 |
| LDL cholesterol (mmol/L) | 2.8 ± 0.44 | 2.69 ± 0.2 | 2.28 ± 0.1 | 2.25 ± 0.14 | 0.132 |
| GOT (U/L) | 22.2 ± 10.8 | 22.5 ± 3.53 | 22.5 ± 0.71 | 21.5 ± 2.12 | 0.212 |
| GPT (U/L) | 22.8 ± 6.96 | 16 ± 2.82 | 18.5 ± 2.12 | 18 ± 1.97 | 0.267 |
| Alkaline phosphatase (U/L) | 72.2 ± 19.6 | 78.5 ± 27.5 | 69.5 ± 26.1 | 69 ± 25.4 | 0.120 |
| GammaGT (U/L) | 15 ± 12.1 | 12.5 ± 7.07 | 9.5 ± 4.94 | 9.5 ± 3.53 | 0.290 |
| Creatinine (mg/dL) | 0.71 ± 0.13 | 0.74 ± 0.11 | 0.77 ± 0.13 | 0.76 ± 0.15 | 0.501 |
| Na (mmol/L) | 139.8 ± 1.78 | 139.5 ± 2.12 | 138.5 ± 2.09 | 139 ± 2.02 | 0.572 |
| K (mmol/L) | 4.2 ± 0.44 | 4.05 ± 0.21 | 4.15 ± 0.35 | 3.91 ± 0.28 | 0.129 |
| Calcium (mg/dL) | 9.31 ± 0.26 | 9.29 ± 0.12 | 9.45 ± 0.21 | 9.3 ± 0.27 | 0.244 |
| Phosphorus (mg/dL) | 3.56 ± 0.23 | 3.55 ± 0.21 | 3.35 ± 0.51 | 3.81 ± 0.14 | 0.753 |
| Vitamin D (mcg/L) | 24.6 ± 9.09 | 34 ± 8.09 | 37.5 ± 7.78 | 42.5 ± 17.6 | 0.514 |
| PTH (ng/L) | 43 ± 11.8 | 32 ± 2.82 | 37.5 ± 2.12 | 37 ± 1.41 | 0.267 |
| C-reactive protein (mg/L) | 0.79 ± 0.75 | 1.42 ± 1.1 | 1.07 ± 0.65 | 0.76 ± 0.14 | 0.443 |
Disclaimer/Publisher’s Note: The statements, opinions and data contained in all publications are solely those of the individual author(s) and contributor(s) and not of MDPI and/or the editor(s). MDPI and/or the editor(s) disclaim responsibility for any injury to people or property resulting from any ideas, methods, instructions or products referred to in the content. |
© 2023 by the authors. Licensee MDPI, Basel, Switzerland. This article is an open access article distributed under the terms and conditions of the Creative Commons Attribution (CC BY) license (http://creativecommons.org/licenses/by/4.0/).
Copyright: This open access article is published under a Creative Commons CC BY 4.0 license, which permit the free download, distribution, and reuse, provided that the author and preprint are cited in any reuse.


