Submitted:
27 September 2023
Posted:
28 September 2023
You are already at the latest version
Abstract
Human Action Recognition is widely used in multiple
fields to recognize activities and extract spatial and temporal
information. This paper focuses on analyzing various methods as
well as provides extensive knowledge of the foundational concepts
of the HAR. A dataset is also very crucial for any research study
so we discussed the popular dataset and its features in this paper.
Keywords:
HAR
; Human Activity Recognition
; Feature extraction
; Machine Learning
; Computer Vision
I. Introduction
The Human Activity Recognition or HAR problem needs time series data to classify the images. Videos are nothing but the combination of multiple frames of images that we need to feed into the classification models. The HAR can be classified into three categories of recognition, Simple Activity Recognition, Temporal Activity Recognition (Localization), and Spatio-Temporal Activity Recognition.
- Simple Activity Recognition This [1] refers to the videos where a single human performs a task like walking or running, etc.
- Temporal Activity Recognition (Localization) This [1] refers to the videos where a single human is performing multiple activities at a different time span that we need to recognize. Here we need to localize each individual activity within a different time span and note this.
- Spatio-Temporal Activity Recognition This [1] refers to the videos where multiple numbers of persons are engaged in performing multiple actions within a time span. Here we need to localize each person separately performing multiple actions and also we need to monitor the time span.
There are some different categories [4] of video classification methods such as Single-Frame CNN, Late Fusion, Early Fusion, CNN with LSTM, and 3D CNN / Slow Fusion.
- Single-Frame CNN. This process [4] uses the image classification model or CNN for each frame of the videos and then averages the individual probabilities to calculate the final probability.
- Late Fusion. In this process [4] after getting the individual probabilities the average is done in the network itself in the Fusion Layer and then produce the output or the final probability.
- Early Fusion. This process operates [4] before passing the images to the CNN models. Here the temporal and RGB dimensions of the image get fused and converted to Tensors first and then those Tensors pass into the CNN model.
- CNN with LSTM. This process uses [4] CNN and with that LSTM, First, it uses CNN to identify the image and then gets fed into the LSTM (Many to ONE network) to predict the output. For the Long term dependencies means if we want to take the past information of previous frames into consideration for better prediction then RNN is not useful due to the Vanishing Gradient Problem so LSTM or GRU is the rescue here.
- 3D CNN / Slow Fusion. This process uses [4] 3-Dimensional CNN as it preserves the temporal information of the input signal by producing the output volume whereas 2D Conv loses the temporal information and produces a single output image. 3D CNN process the spatial and temporal information slowly to the individual CNN layer and produce the output. To learn the temporal information in the adjacent layers it uses four-dimensional tensors of two spatial dimensions, one channel dimension, and one temporal dimension (shape H W C T) are passed to the CNN model.
HAR is used in lots of fields and it has many applications according to papers [1], [2], [3] in many sectors from Healthcare to Self-Driving Automobiles. It can be used in analyzing the performance of various sports. It is also very helpful in smart Surveillance to minimize accident and crime rates. Human Activity Recognition or HAR is the way to recognize human activities or actions based on various types of data. This is a process of analyzing or localizing human activities from various video-based or image-based datasets. The previous works are based on the various types of datasets which are mainly related to the following categories, Radio Frequency Based, Sensor Based, Wearable devices Based, and Vision Based. Data can be collected in two types With Devices or Without Devices.
HAR With Device
Surveillance Cameras, Depth Cameras, WiFi, Sensors, RFID including Readers and Tags are considered as the with device HAR.
Surveillance Cameras. Images and videos can be captured by the surveillance cameras. People can be used for manual detection or computer vision techniques or technology can be used for automatic detection.
Depth Cameras. Depth cameras are useful in working in complete darkness whereas traditional cameras can’t.
WiFi. WiFi cameras are useful for HAR as it doesn’t require carrying and doesn’t attract any attention. So, it is able to capture and identify any criminal or accidental activities.
RFID. The RFID sensors can be used as wearable sen- sors or can be used with different objects. Radio Frequency Identification technology or RFID was developed for military aircraft sensing. Previously its range was very small but now it is increased to a few meters. It has two main parts Readers and Tags.
- Tags. Tags are chips small in size attached to an object for collecting information and it is of two types active and passive, active tags are with a battery, and passive tags are without a battery. Active tags use the battery for the power whereas passive tags take power from the reader’s radio waves.
- Readers. Readers take the information from the tags by using an antenna.
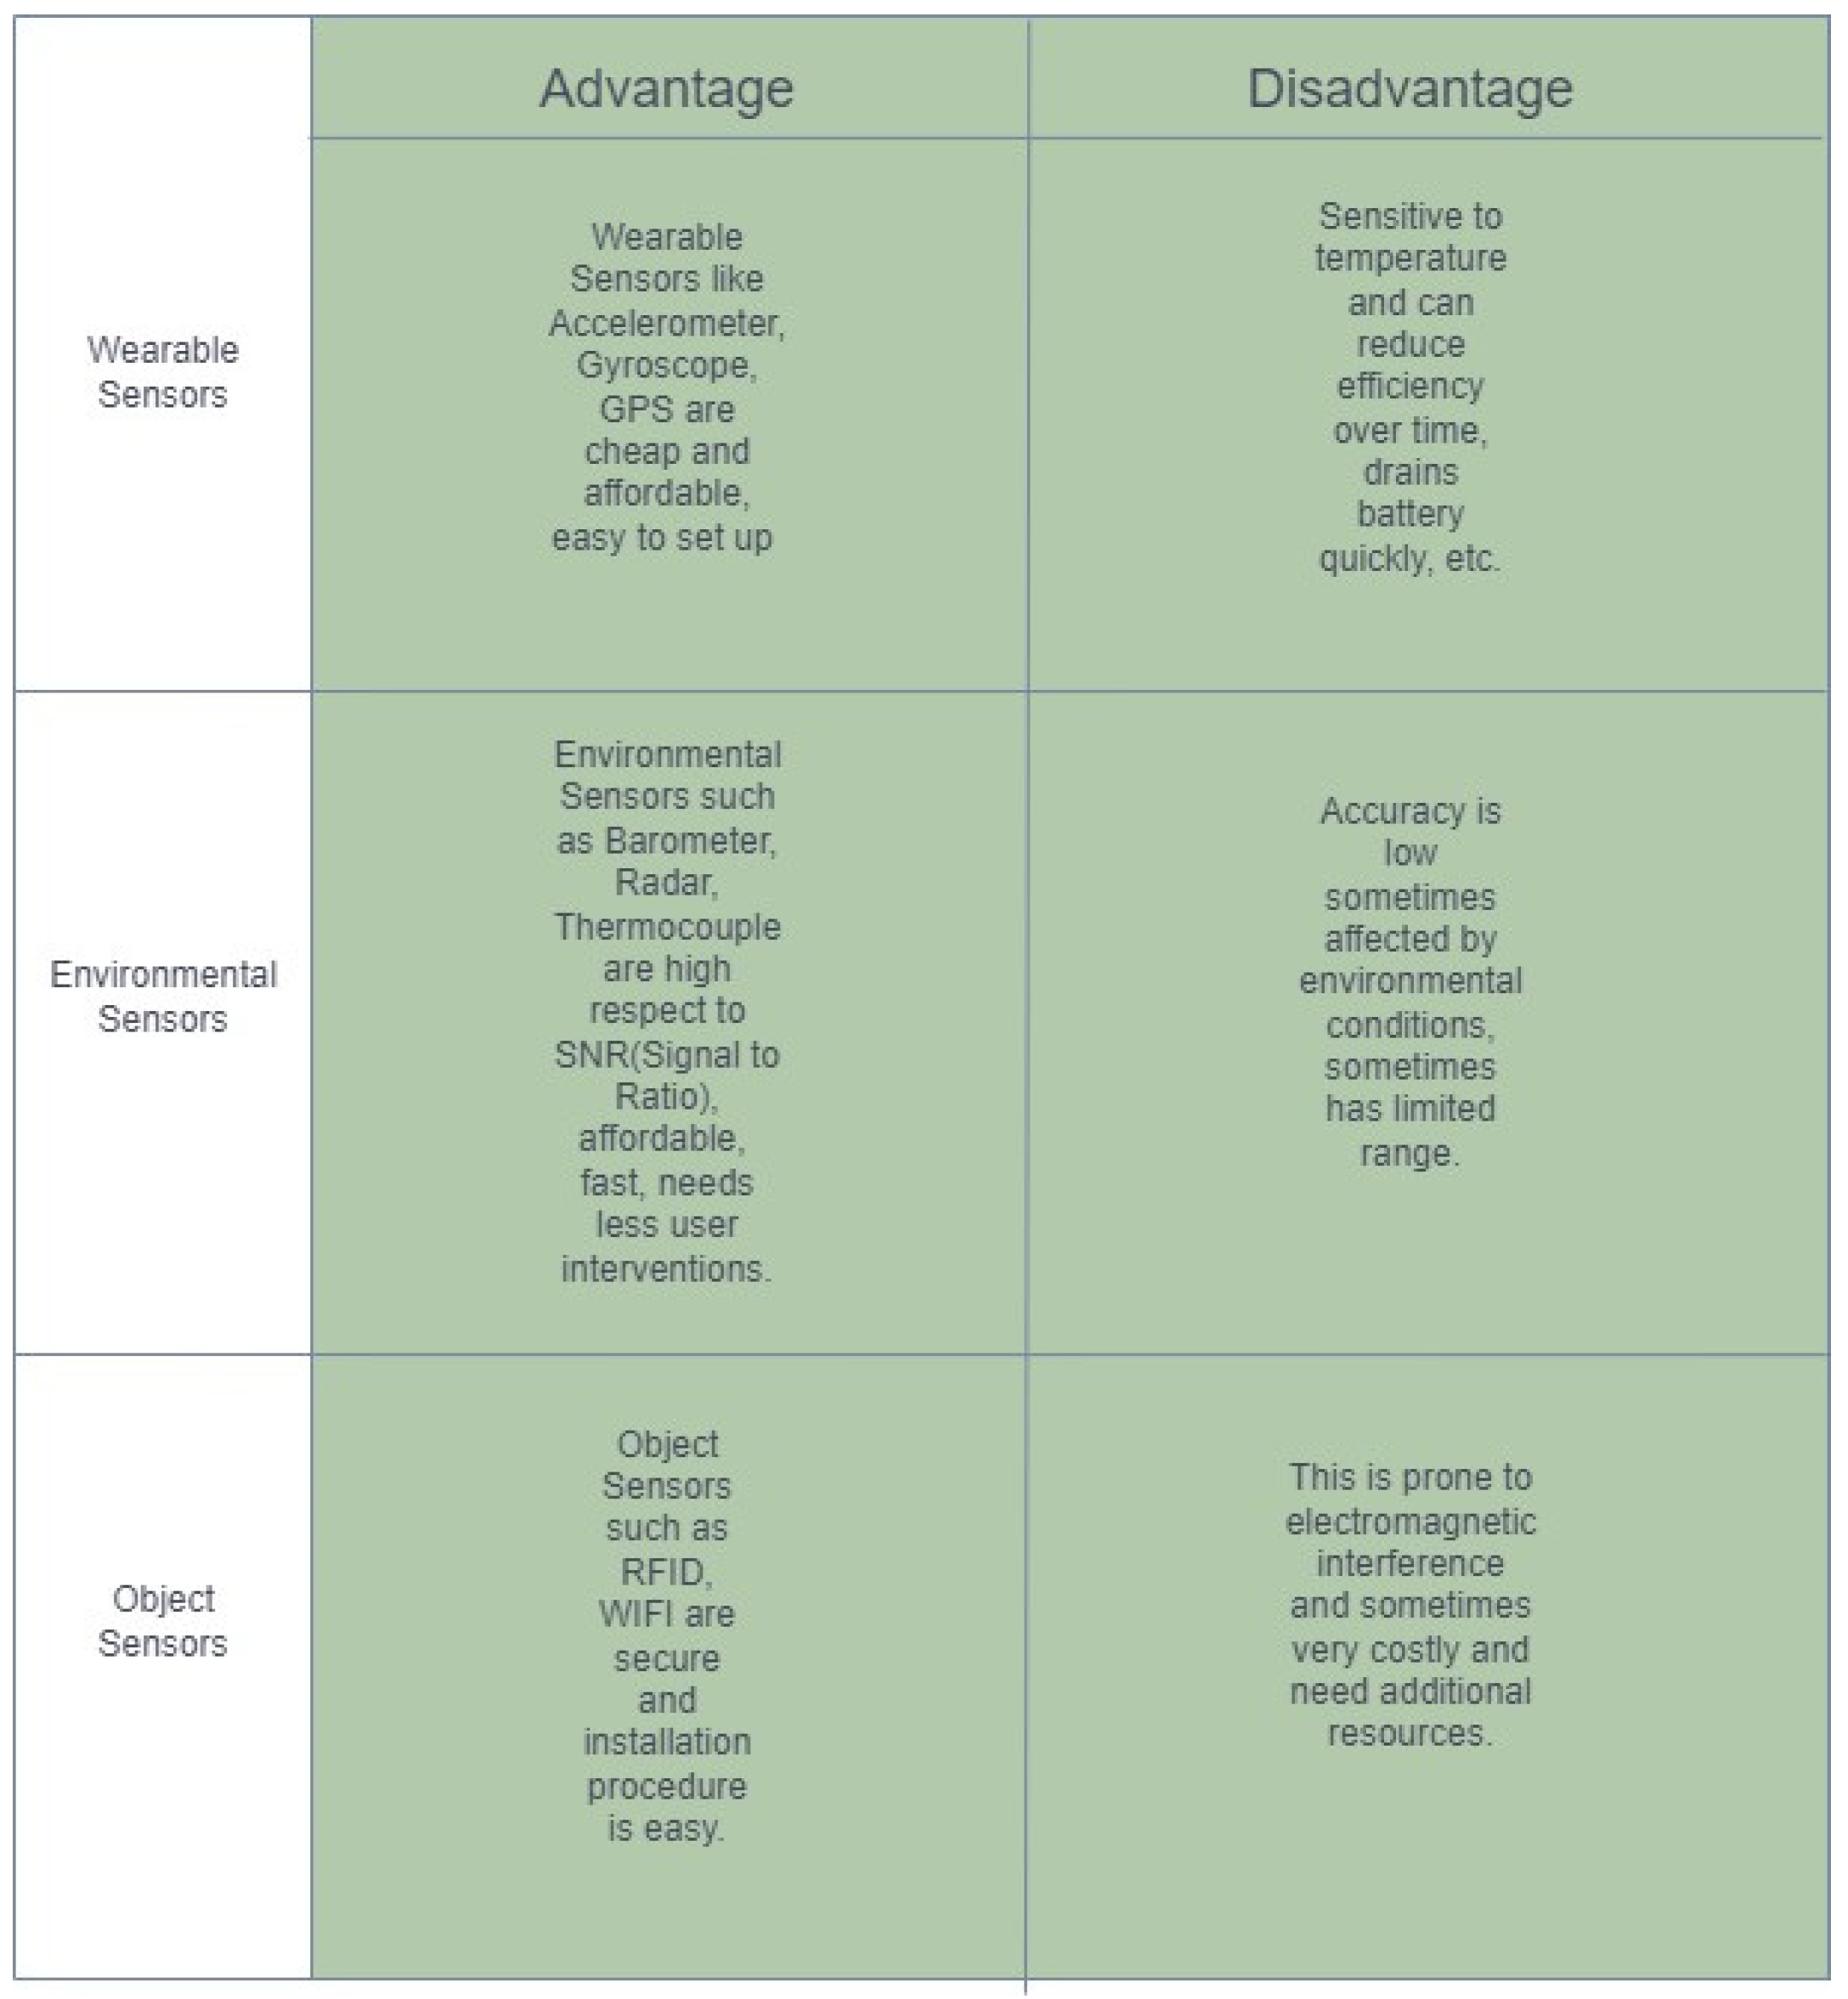
Sensors. Nowadays there are many cheap types of sensors available too for use. The most commonly used types of sensors are the Accelerometer, Magnetometer, Gyroscope, Proximity sensor, Pressure Sensor, Bio Sensor, Motion Based Sensor, and RFID sensor.
- Accelerometer. Accelerometer is a device used to measure acceleration in multi-direction, x,y,z. It can be useful for action recognition, fall recognition, etc.
- Magnetometer. Magnetometer is a device to measure the magnetic field. It is useful for the recognition of gestures.
- Motion Based Sensors. Motion Sensors are useful in sensing the motions happening in an area.
- Proximity sensors. Proximity Sensors are useful in recognizing activities happening in near proximity without physical contact.
HAR Without Device
Human Activity Recognition without devices can be categorized into three sub-categories Action Based, Interaction Based, Motion Based
Action Based. Action-based activities mainly involve several gestures and posture-related activities like walking, Dancing, Running, Swimming, etc. It can be categorized into the following subcategories Posture Recognition, Gesture Recognition, Behavior Recognition, Fall Detection, Daily Ac- tivities, and Assisted Activities.
- Posture Recognition. Examples can be walking, standing, etc.
- Gesture Recognition. This is a simple activity [2] that happens in a short period of time. Examples can be showing hand signals, waving hands, or doing facial expressions.
- Behavior Recognition. Examples can be smiling or being angry recognition.
- Fall Detection. This is very useful for elderly people monitoring in hospitals.
- Daily Activities. This involves Doing Household chores, eating, drinking, etc.
- Assisted Activities. This involves walking with someone or something. This is again very helpful for monitoring people in the hospital.
- Group Activities This is a more complex type of activity [2] that needs more than 2 people and some objects and this can be a combination of gestures, interaction, and actions. Example A football match.
Interaction Based. Interaction-based activities can happen during interactions with objects or humans. So it is categorized into the following two categories as Human-Human Activities, and Human-Object Activities.
- Human-Human Activities. Examples can be Wrestling or Fighting
- Human-Object Activities. Examples can be talking on the phone, working on a computer, etc,
Motion Based. Motion-based recognition can be classi- fied into three subcategories Tracking, Motion Detection, and People Counting.
- Tracking. Tracking is a very crucial part of HAR. It can be done by Global Positioning System or GPS. It is useful in Augmented reality, supply chain management, and many more.
- Motion Detection. Motion Detection is the process of recognizing or capturing the movement of any object or person. It is useful in security surveillance.
- People Counting. People counting is the process of counting people in a closed or open environment to estimate the total number. It is useful in crowd management.
II. Background
HAR can be done with the combination of four processes such as Data Collection, Data Pre-Processing and Feature Engineering, Model Selection, Model Deployment.
Problem Definition: According to papers [2],[7],[30], suppose that a person is doing a set of n activities A, which is predefined, we can say that A = A0, , An−1.
To recognize each activity from the set of sensors data of k time series S = S0, ...., SK−1 of the time interval
I = [tα, tω] . The goal is to find the temporal partition
I0, ...., Ir−1 of I based on the data mentioned in S and
the classes represented in the Ij time partition as consecutive, non-empty, non-overlapping, i.e

This definition is valid if the activities are not occurring simultaneously [7] like the person is not walking and jogging at the same time frame. The collected raw data from sensors or visions are time series data.
- A.
- Data Collection
Data Collection is a crucial part of the HAR, Some data are collected through sensors or vision, In this section we will discuss this.
- 1)
-
Sensor-Based HAR : Sensor-based HAR [2] is widely used in various real-world applications and the huge data gathers from Wireless Sensor Networks can be classified as Wearable Sensors, Object Sensors, Environmental Sensors, and Hybrid Sensors, which we have discussed broadly in the previous section. According to Lara and Miguel [31], there are several issues in HAR such as the Selection of Attributes and Sensors, Data Collection Protocols, Obtrusiveness, Flexibility, Recognition Performance, Energy Consumption, Processing, etc.
- (i)
- Selection of Attributes and Sensors: The sensors can be selected depending on some of the attributes such as Location, Environment, Acceleration, and Physiological Signals. Environmental attributes such as temperature [31], and humidity can interfere with the measurements, although only environmental attribute is not enough to select a sensor other conditions need to consider. Acceleration is a major sensor used such as the Triaxial Accelerometer, which is inbuilt in most mobile phones and smart watches nowadays, useful to recognize walking, running, and other activities. Due to its inexpensive and low battery consumption, the accelerometer is the best choice to carry. The subject can wear it on the wrist, or use it under the trouser or chest. Several papers have studied the Triaxial Accelerometer and found the detection accuracy very high almost 98% [32]. The major drawback of this is that it has to be placed properly to get higher detection if you want to recognize activities in a computer the device should be placed accordingly. So, the position of the device matters the most for better accuracy. For the ambulation activities, the amplitude varies from 2g to 6g [32]. The location can be tracked by the Global Positioning System or GPS which can track human activities from anywhere if location sharing is enabled, To maintain privacy encryption, obfuscation [31] and other modes of security should be enabled. GPS can be tracked outside on a real-time basis, it is not useful in indoor monitoring so, it is often used with accelerometers for better prediction. Physiological Signals such as vital signs like ECG, BP rate, Hear rate, etc require more sensors and higher energy for wireless communication to predict better.
- (ii)
- (iii)
- Obtrusiveness: It is necessary to use small devices for HAR as more devices are hard to carry and manage. There are some devices that require more accelerometers [34] to carry whereas there are other HAR systems that require only a strap or a small device. According to a paper [34] by Bao et al two accelerometers are enough to get a good prediction of daily activities (ADL) and ambulation, it is to mention that they used the accelerometers in the chest, arm, leg, and other parts of the body too.
- (iv)
- Flexibility: In any model if there is no flexibility the model will not do the job properly as it can be time- consuming. To refer to this statement the classification model should be independent of gender, age, and other factors. In the paper [35] it is mentioned to use a specific recognition model for each individual whereas in the paper [34] it is mentioned to be one monolithic recognition model [31]. In the first experiment. In the first experiment, many models were developed according to the subject, and in the 2nd experiment, only one model was developed and used cross-validation to use for all the subjects. So in certain conditions, it is difficult to add new users, and in different cases, the model can act differently that is another situation. So, the monolithic recognition model is the better approach by sorting the same characteristics of the users.
- (v)
- Recognition Performance: The performance of the recognition can be measured by some metrics such as Precision, ROC curve, Recall, F-measures, etc. By changing the attributes the prediction can be changed, the more complex the situation is the hard to recognize the activity [31].
- (vi)
- Energy Consumption: For delivering critical information energy consumption is very required. Battery life can be extended as well as short-range wireless networks can be used over long-range wireless networks. Moreover, data aggregation and compression are the popular energy-saving mechanisms discussed by Oscar D. Lara and Miguel A. Labrador in the paper [31].
- (vii)
-
Processing: The main concern of processing according to Oscar D. Lara and Miguel A. Labrador in the paper [31] is whether the processing of the recognition task should happen in the integration device or in the server. Sometimes it is beneficial to use it in the mobile device to ease the implementation but for the complex processing and storage perspective it is required to keep it in the server.
- 2)
-
Vision-Based HAR : Vision-Based HAR can be divided into two types depending on the data types, such as RGB data and RGB-D data. According to a paper [31], RGB-D data achieves higher accuracy because multi-modal data provides more information but RGB data is widely used due to its less configuration and computation complexity.
- a)
- RGB Data: According to papers [31], [37], RGB data is the combination of RED-GREEN-BLUE colors from warm orange to cool blue 0-255 ranges of 8 bits each data in the visible spectrum combined in various proportions to get color on the digital screen. This data is highly produced and widely available so very affordable.
- b)
- RGB-D Data: According to paper [26], RGB-D data is the combination of the RED-GREEN-BLUE with Depth data captured by the RGB-D sensors and cameras provides the per-pixel depth information [36] helps to recognize hu- man activities more accurately. It has several advantages such as working very well in pitch-dark environments [31].
- B.
- Pre-processing
Data Pre-processing and Feature Engineering [31] is a very important part of HAR as it cleans and processes the data for future use. The most common Pre-processing and Feature Engineering steps are Denoising, Feature Extraction and Selection, Segmentation, Normalisation, Dimensionality Reduction, and Missing Value Imputation.
- ∙
- Denoising. Denoising is the technique of reducing noise from the input signal. Signals can be noisy due to several reasons like malfunction or mishandling. The denoising can be done with Singular Value Decomposition or SVD or by using filters such as low pass filter, high pass filter, etc.
- ∙
- Feature Selection. Feature extraction process extracts the core information from the raw data for processing with some process like Principal Component Analysis or PCA and Independent Component Analysis or ICA. The feature selection process selects the feature which is of utmost importance and essential for the prediction by getting rid of other redundant information.
- ∙
-
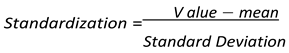
Normalisation. This process normalizes or scales the feature to get a neutral mean and 1 variance. There are several techniques of Normalization such as Scaling to a Range, Clipping Log scaling, and z-score. The most popular is the z-score.The z-score of a point x is x’ =
 where X’ is the z-score of xµ is meanσ is Standard Deviation
- ∙
- Dimensionality Reduction. For getting rid of redundant features dimensional reduction is very useful and this can be achieved by using Principal Component Analysis or PCA technique, where the principal components [40] are perpendicular to each other. To calculate PCA we need to choose the top pairs of eigenvalues and eigenvectors of highest values. According to [39], to get the maximum variance spread the eigenvectors are needed, most precisely eigenvectors spread the direction the maximum value indicates. eigenvalues are the coefficients and proportions of the eigenvectors that produce the magnitude of the vectors. Principal Components display the direction of the maximum amount of the variance of the data. According to article [41], we need to know Standardization and Cov matrix to calculate the eigenvalues and eigenvectors.
- 1)
- Standardization:
- 2)
-
Covariance Matrix Computation:If COV(X, Y) is positive, then x, and y increase or decrease together.If COV(X, Y) is negative, one variable increases and the other variable decreases.
- ∙
- Missing Value Imputation. This process fills the missing values (happen due to mishandling or device malfunction) of features by using the median or mean.
- C.
- Feature Extraction and Segmentation
- 1)
- Segmentation. This process extracts more meaningful and essential information from the videos by creating individual segments and analyzing those. According to the article [42] on Image Segmentation, the different types of image segmentation are Instance Segmentation, Semantic Segmentation, and Panoptic Segmentation based on the information extracted from the image.
- ∙
- Instance Segmentation: This segments each object in an image. It is useful in segmenting individual objects in an image and it works similarly to object detection but in addition to the object boundaries [41], by separating the overlapping object in an image.
- ∙
- Semantic Segmentation: This identifies different objects in the image and creates segmentation by dense labeling [42] each pixel in the image with respect to the class by taking the image as an input and then creating the segmentation map with the pixel values from 0 to 255 and classifying the pixels 0 to n number of class labels.
- ∙
- Panoptic Segmentation: This is a combination of Instance Segmentation and Semantic Segmentation [42], and identifies each object in the image by labeling each pixel and classifying it.
There are two types of image segmentation techniques, one is Traditional and another is Deep Learning.
- a)
-
Traditional Techniques: There are some Traditional Techniques to extract the information from the input image.
- i)
- Thresholding: This process changes the input im- age into a binary image [42]. The two commonly used categories of Thresholding are Global Thresh- olding and Adaptive Thresholding.
- ∙
- Global Thresholding: For images without varying illumination and contrast [42], Global Thresholding is a good choice. This process changes the input image into foreground and background regions according to the threshold value, if the pixel intensity value is above the threshold then it will consider foreground, otherwise background.
- ∙
-
Adaptive Thresholding: This process is suitable for varying illumination and contrast, useful for digital scanning [42]. This process segments the pixel intensity values by taking small regions or blocks and classifying them as foreground and background with respect to the threshold value.
- ii)
- Region-based Segmentation: This process is done by segmenting each pixel by grouping it into re- gions or clusters according to the size, texture [42], and other attributes. This process can be done com- monly in two ways Split and merge segmentation and Graph-based segmentation.
- ∙
- Split and merge segmentation: For images without the complexity and irregular regions, this process is used where the grouping is done recursively with respect to the similarity in texture, size, etc to form a larger region.
- ∙
-
Graph-based segmentation: This process segments the input image as a graph where the nodes are the pixels and the edges are the similarity between the pixels.
- iii)
- Edge-based Segmentation: This process segments the edges from the images. The commonly used categories are Canny edge detection, Sobel edge detection, and Laplacian of Gaussian (LoG) edge detection.
- ∙
- Canny edge detection: This process involves a multi-stage algorithm [41]. First uses Gaussian filter for edge smoothing then uses non- maximum suppression to thin the edges and hysteresis thresholding to remove the weaker edges.
- ∙
- Sobel edge detection: This process extracts the horizontal and vertical edge information from the input image by using a Sobel operator to compute the gradient magnitude and direction of the image [42].
- ∙
-
Laplacian of Gaussian (LoG) edge detection: For images without complex edges this process works well. It first removes noise by applying the Gaussian filter and then highlights the edges by applying the Laplacian operator [42].
- iv)
- Clustering: This process involves grouping pixels into clusters or segments with respect to similar characteristics. There are several commonly used methods of Clustering such as K means clustering, mean shift clustering, hierarchical clustering, and fuzzy clustering [42].
- ∙
- K-mean clustering: This process is achieved by treating the input image as the data points and partitioning them into K clusters with respect to the similarity. By using the Euclidean distance matrix, this algorithm first selects the k-centroids [42] and then groups the nearest pixels to the nearest centroid, and then updates the centroids by the mean. Thus the process continues till it converges.
- b)
- Deep Learning Techniques: This process uses neural network approaches with the help of encoder-decoder, the encoder encodes the input image and uses Transfer Learning to extract the features for the segmentation and then the decoder uses the output of the encoder and uses this for computing the segmented mask which resembles the pixel resolution as the input image. The commonly used techniques are the U-net and Seg-net based on the Convolutional Neural network. U-net uses the encoder and decoder whereas Seg-net is designed for semantics pixel-wise segmentation [42].
The Evaluation Metrics. For measuring the segmen- tation we need some of the metrics. According to article [42], here are some of the measurements of segmentation.
- ∙
-
Pixel Accuracy: It determines the overall accuracy of the segment by calculating the ratio of the correctly classified pixels to the total number of pixels.

- ∙
-
Dice Coefficient: This predicts the similarities of the ground label segmentation to the predicted segmentation by calculating the intersection of these two.

- ∙
-
Jaccard Index (IOU): The intersection over union (IoU) score predicts the similarity of the ground truth and predicted segmentation.

- 2)
- Feature Extraction: Features are the parts or patterns [38] of the image that help in better identification. For example, the corners and the edges are the features of the rectangle and square. There are some traditional and Deep Learning techniques of feature detection. There are some traditional feature detection techniques such as Harris Corner Detection, Shi-Tomasi Corner Detector, Scale-Invariant Feature Transform (SIFT), Speeded-Up Robust Features (SURF), Features from Accelerated Segment Test (FAST), Binary Robust Independent Elementary Features (BRIEF), Oriented FAST and Rotated BRIEF (ORB). For detecting small corners Harris Corner is used and for detecting larger corners Scale-Invariant Feature Transform (SIFT) is used. Speeded-Up Robust Features (SURF) is the faster version of SIFT. The deep learning techniques include D2-Net, LF-net, and Superpoint based on the Convolutional Neural Network.
- a)
-
Harris Corner Detection: This process uses the Gaussian window function to detect the corners. The equation [38] that determines whether the image contains the corner or not is as follows.where, λ1 and λ2 = eigenvalues of M det(M ) = λ1 λ2
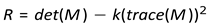 trace(M ) = λ1 + λ2
If the eigenvalues are small then the value of R will be small and it will indicate the Flat region.
If the eigenvalues are very very greater than each other then the value of R will be less than 0 and it will indicate the region as Edge.
If the eigenvalues are very large then the value of R will be large as well and it will indicate the region as the corner.
- b)
-
Shi-Tomasi Corner Detector: This is the upgradation of the previous procedure. This procedure detects corners by calculating the minimum of the eigenvalues.R = min(λ1, λ2)when the eigenvalues are greater than the threshold value λmin it is considered as the corner.
- D.
- Model Selection
Various ML models can be used to detect human activities. Generally ML algorithms [5], [6], [10] are categorized or grouped into three categories, Discriminative, Generative, and Hybrid. The most widely used common model algorithms are R-CNN, Fast R-CNN, Faster R-CNN, YOLO, etc. The Deep Learning models for Sensor-based activity detection can be classified into the following groups. In machine learning, labeling the training set [31] is an essential part. According to the labeling the dataset can be classified as Supervised or Unsupervised dataset, If in HAR the videos are labeled as walking, running, etc so it is supervised, and if not then unsupervised but in some datasets some data is are not labeled for some better training reasons those are called Semi-supervised. The popular Supervised learning classifiers are Decision Trees, Support Vector Machines, and the Bayesian method [31], [2], [3]. A Decision Tree is a hierarchical classifier that is mapped to nodes and edges of the attributes [31] and the ”Information Gain” will be selecting the top node. The run time is logarithmic and the big o notation is O(logn). The two major Deep learning methodologies of HAR are CNN and RNN which is the root of the different HAR models.
Convolutional Neural Network: CNN consists of three layers as a generalized version like any Deep Learning model, Input, Hidden, and Output layer where the hidden layer extracts the distinct features [45]. The main layers of CNN are the Pooling layer and Fully connected layer with the parameters Dropout Layer and Activation function.
- 1)
-
Convolutional Layer: This is the first layer of CNN it extracts the features from the images and by using a kernel size K X K, slides over the image and does the dot product, and sent the output to the next layer [45]
- 2)
- Pooling Layer: This 2nd layer is the layer between Convolution Layer and the Fully Connected Layer, it is very cost-effective [45] as it decreases the connection of the layers and reduces the size of the feature map. The different types of pooling are the max-pooling and the average-pooling, sum-pooling. As the name implies max-pooling computes the maximum feature value and uses it, whereas the average-pooling takes the average value of the feature map and sum-pooling takes the sum values of the feature map.
- 3)
- Fully Connected Layer: This layer fattens the input and classifies. The neuron in this layer consists of weight and bias [45]. Two or more Fully Connected Layers perform better than one.
- 4)
- Dropout Layer: The dropout layer is introduced in CNN to reduce the overfitting [45] issue. This layer cut some connections by dropping the weight values during training to improve performance.
- 5)
- Activation Function: This function forwards [45] the information by firing. The commonly used activation functions are sigmoid, tanh, softmax, and ReLu, where the tanh and sigmoid are widely used for binary classification and softmax is for multi-class classification.
The Most Commonly Used Learning Models on CNN and RNN are as follows.
- 1)
- R-CNN. We generally face two types of problems [5], [6] in videos, first, we need to the objects and then classify them. So for the detection, it’s very essential to draw the correct bounding box around the object we want to detect. But sometimes it’s not possible to determine how many bounding boxes you need to draw from the beginning so the best approach is to use a huge number of regions which is not an effective solution to persist, so R-CNN comes into effect. Here we use the Selective Search algorithm to generate the region proposals of only 2000 numbers.
The Selective Search algorithm
- a)
- We generate many sub-segmentation to get the candi- date regions.
- b)
- Next we combine all the candidate regions with respect to the color, size, texture, etc recursively to get a larger one.
- c)
- Then we use the larger regions for object detection.
After getting the 2000 region proposals then this gets fed into the Convolutional Neural Network or CNN and the output from the CNN or the feature vector is then fed into the Support Vector Machine or SVM to predict the object and also produces four offset values, to increase the precision of the detection.
- 2)
- Fast R-CNN. R-CNN [6] is very slow as it takes a good amount of time to predict the object separately from the 2000 region proposals. So it’s quite difficult to test this in real-time. And moreover, as the Selective Search algorithm is not a learning algorithm so it can produce unhealthy candidate proposals. The main difference between R-CNN and Fast R-CNN is that here in Fast R-CNN the input images are directly fed into the CNN, not like R-CNN where the region proposals are get fed into the CNN. After getting the Conv feature map we use Selective Search Algorithm to identify the region proposals and then these region proposals are warped into squares. Now these squares get fed into the ROI Pooling Layer to get a fixed shape and then into the Fully Connected Layer or FC Layer to get the ROI feature vector, which then gets fed into the softmax Layer to predict the object and also gets fed into the BBox Regressor to get the offset values for the bounding box. It is fast than the R-CNN because here the 2000 candidate region proposals are not get fed into the Conv layer every time, here the input images get fed into the Conv layer to produce a feature map per image.
- 3)
- Faster R-CNN. The R-CNN and Fast R-CNN [6] use the Selective Search Algorithm to generate the feature maps but here in Faster R-CNN it doesn’t use Selective search instead it feeds the original image into the Conv Layer like Fast R-CNN and produces the Conv Feature Map which then gets fed into a different network which is called Region Proposal Network and then the output proposals feeds into the ROI Pooling Layer to classify the image from the proposed region and also produces the offset values for the BBOX.
- 4)
- YOLO. YOLO [6] or You Only Look Once is different than the other Region Based algorithms we discussed before. This is an object detection algorithm. Here the input image is converted to an SxS grid and m bounding boxes within this grid. From each of the Bounding boxes we get the output class probability map and the offset values for the BBox, now if the class probability value of the BBox is above the threshold value then it gets selected and use for object detection. YOLO is not useful to detect small objects in the image.
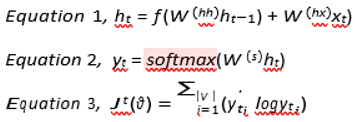
Recurrent Neural Network: This type of network uses sequential time series data of format text, audio, or videos [45] and takes the output of the previous network to produce the current network output. For a sequence of words, it takes the first word at time T0 and the next words accordingly in the next time steps. Music generation, sentiment classification, and machine translation are some of the applications of RNN. The different types of RNNs are One to One, One to Many, Many to One, and Many to Many. Where One to One RNN takes one input and produces one output (Vanilla RNN ), Many to One takes many inputs and produces one output, One to Many RNN takes one input and produces many outputs and Many to Many RNN takes many inputs and produces many outputs. Here are the equations of RNN as follows. Equation 1, is calculating the current output at timestep t by taking the previous output at timestep (t-1) as input. Activation functions like tanh or sigmoid are used in this process. Equation 2, is used to find out the final output of the timestep t and by using the softmax activation function and ht calculated from Equation 1. Equation 3 computes the Crossentropy loss function of timestep t. The loss function computes the actual output and predicted output difference.
The main problem of RNN is the Vanishing Gradient and Exploding Gradient due to short-term memory. For taking a long sequence as input the loss function produces the gradient at a certain time either very very small or very very high, In either case, it is an error. When the gradient becomes very very high it’s the Gradient Exploding problem, and when the gradient becomes very very small it’s the Vanishing Gradient problem. To overcome these issues Gated Recurrent Units and Long Short Term Memory are used.
Long Short Term Memory. LSTM consists of three parts such as Forget Gate, Input Gate, and Output Gate. The function of the Forget Gate is to remove unwanted information while the Input Gate takes new information and the Output Gate produces the final output by taking the output from the Input Gate and the Forget Gate and passing the information to the next network.
- 1)
-
FORGET GATE: This gate forgets or removes the information which is unwanted. The output of the forget gate = activation function ((Current timestep input X weight associated with the current input) + (hidden state output of the previous timestep X weight associated with previous hidden timestep))ft = σ(Xt ∗ Uf + Ht−1 ∗ Wf)
- 2)
-
INPUT GATE: This gate adds new information or modifies it. Here is the new information = activation function ((current input X weight associated with the current input) + ( The previous hidden state output X Weight associated with the hidden state input ))it = σ(Xt ∗ Ui + Ht−1 ∗ Wi)Ct = (ft ∗ Ct−1 + it ∗ Nt) [Updated Cell State]
- 3)
-
OUTPUT GATE: This gate produces the final output of the network which is between 0 and 1 as the sigmoid activation function is used. The output from the output gate = activation function ((Input at the current timestep X weight associated with the input) + ( The hidden state output of the previous timestep X Weight associated with the input to the hidden state))Ot = σ(Xt ∗ Uo + Ht−1 ∗ Wo)
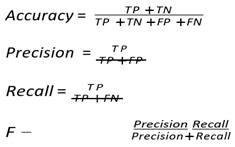
Evaluation Metrics. The confusion matrix determines how many instances are actually classified and how many are misclassified by using the metrics True Positives (TP), True Negatives (TN), False Positives (FP), and False Negatives (FN). Some commonly used evaluation metrics are Accuracy, Precision, Recall, and F-measure [31].
- ∙
- True Positives (TP): Number of positive instances classi- fied as positive.
- ∙
- True Negatives (TN): Number of negative instances clas- sified as negative.
- ∙
- False Positives (FP): Number of negative instances clas- sified as positive.
- ∙
-
False Negatives (FN): Number of positive instances classified as negative.
- E.
- Model Deployment
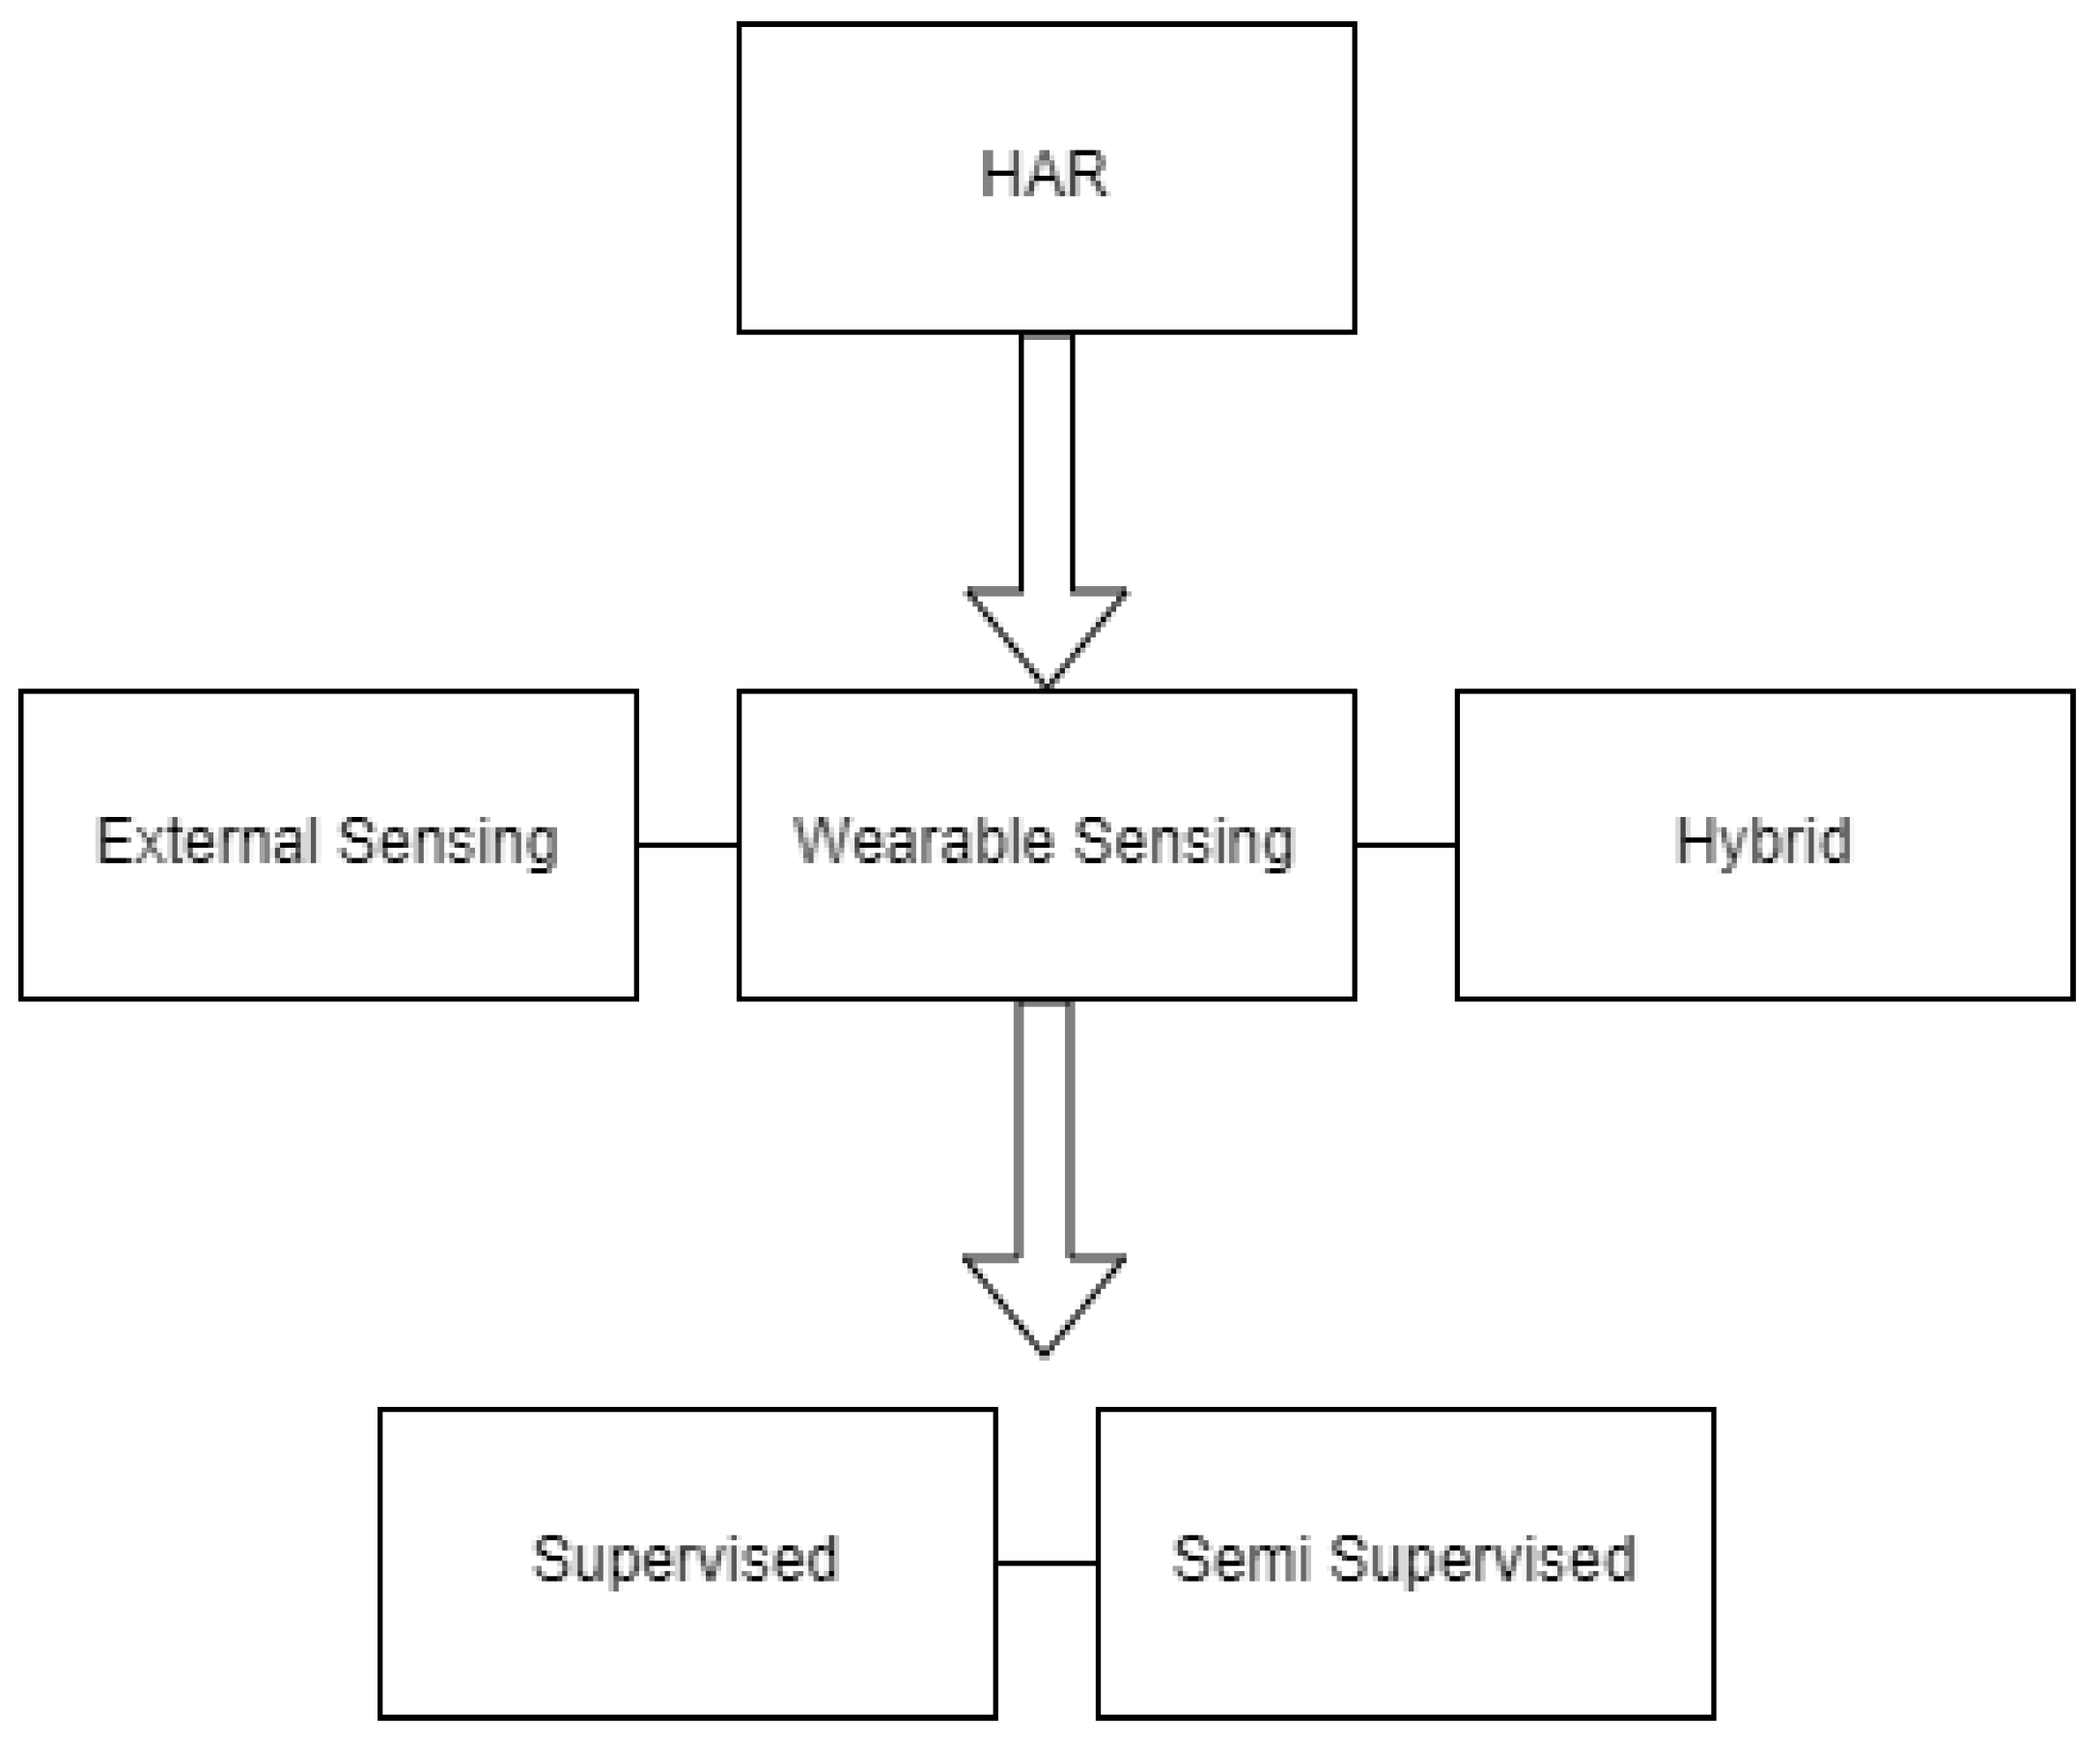
This process can be done using these ways. External Sensing Deployment or On-body Sensing Deployment.
- 1)
- External Sensing Deployment Here the cameras are placed outside to capture the activities.
- 2)
- On-body Sensing Deployment Here the cameras are worn by humans to capture their activities.
III. Datasets
A dataset [19], [20], [21], is very crucial for conducting any research. So, we have discussed the most popular dataset used for HAR. A dataset can be classified as a Sensor-Based dataset or a Vision-Based dataset.
- 1)
- Sensor-Based dataset Sensor-based data is collected by the sensors like an accelerometer, Gyroscope, Magne- tometer, GPS, etc. Here are some of the datasets men- tioned.
- a)
- WISDM Dataset This dataset is created by using an accelerometer sensor, which contains data on Downstairs, Jogging, Sitting, Standing, Upstairs, and Walking [43], has a total of a total of 1,098,207 instances, collected by 36 users.
- b)
- UCI HAR Dataset This dataset is created by using an accelerometer and gyroscope sensor and contains Standing, Sitting, Lying, Walking, Downstairs, and Walking Upstairs, a total of 10929 instances [43].
- 2)
- Vision-Based dataset .The vision-based dataset is col- lected without the sensors. Here are some of the datasets mentioned.
- a)
- b)
- c)
- MEVA Dataset MEVA [22] is a very popular dataset that contains 37 types of activity tracks of 176 actors for 144 hours. The total is 66172 annotated activities. MEVID is the subset of MEVA where the extended activities are gathered. MEVID contains activities monitored over 73 days. It contains hundreds of hired actors with their consent of taking videos for hundreds of hours engaged in indoor and outdoor staged activities taken with 30 ground-level cameras. 176 actors wore over 2237 unique outfits for three weeks over two months. The train set contains 104 identities with 485 outfits in the 6338 tracklets and the test set contains 54 identities with the 113 outfits in the 1754 tracklets with that 316 query tracklets. The tracks have an average of 592.6 frames over the span of 1 to 1000. The MEVID contains Re-identification data or ReID for 289 clips of MEVA data and 158 global identities staged in 17 locations from 33 viewpoints and collected more than 1.7 million BBOXes and 10.46 million frames.
- d)
- e)
- f)
- g)
Transfer Learning: When there is not enough data available to train the model there is a way to use the pre-trained models. Transfer Learning is the method that uses the pre-trained model [52] to reuse or for a new task. Suppose one person has a lot of expertise on a particular subject matter and another person is a beginner. So, the transfer learning will transfer some of the experience from the expert to the beginner to perform better. Transfer Learning can be classified into two categories Homogeneous Transfer Learning, Heterogeneous Transfer Learning. Homogeneous TL is used for the situation where the domains are in the same feature space, and for Heterogeneous TL domains are of different feature spaces. The Homo- geneous TL sometimes domains have a slight differ- ence in marginal distributions [52]. The categories of Homogeneous TL are as follows, Instance transfer, Parameter transfer, Feature-representation transfer, and Relational-knowledge transfer. The steps of Transfer Learning involve Obtaining the pre-trained model, cre-ating the base model, Freezing the layers, adding the new trainable layers, training the new layers, and fine- tuning the model. Domain Adaptation is the technique where the domain space is different for the source and target. Here the source domain transfer one or more pieces of information to the target domain. Transfer learning is useful in many fields such as Natural Language Processing, Computer Vision, Audio recognition, and Speech recognition. Transfer Learning can be used when there is not enough data available for training the model and we need the result quickly, instead of training the models from the very beginning many pre-trained [52] can be used as the beginning of this application. By fine-tuning the higher level of layers and freezing the lower levels this can be achieved.
IV. Related Study
Many kinds of research have been conducted in HAR. In this section, we have discussed some of them.
The paper ”CV-C3D: Action Recognition on Compressed Videos with Convolutional 3D Networks” [46] by Samuel et al, performed action recognition with CVC3D, C3D, and CoViAR. C3D (The Convolutional 3D) is useful in learning the spatiotemporal patterns of the videos from the pixel directly whereas the CoViAR( Compressed Video Action Recognition) is able to learn directly from the compressed videos. But the C3D is able to, learn the sopatiko temporal features better than the CoViAR while CoViAR is faster so Samuel et al proposed the architecture of CV-C3D which is compost of 3 independent CNN and also a multi-stream network [46]. They used two public datasets UCF-101 and HMDB-51. They performed the experiment with the ”processor Intel Core i7 6850K 3.6 GHz, 64 GBytes of DDR4-memory, and 4 NVIDIA Titan Xp GPUs. The machine runs Ubuntu 16.04 LTS (kernel 4.15.0) and the ext4 file system and PyTorch.” and concluded that on both the datasets the CV-C3D performed better than C3D but CoViAR achieved the highest accuracy, followed by CVC3D benefitted from data augmentation while testing. Their future work is to test with CVC3D and analyze the performance.
The paper ”RGB-D-based human motion recognition with deep learning: A Survey” [26] by Wang et al, 2018 discussed segmented and continuous motion recognition by experimenting with several datasets and found that CNN plus LSTM works better and they found that the combination of CNN+RNN like C3D and ConvLSTM provides a very good result for motion recognition datasets. They further stated that CNN can be used for temporal fusion 3D pooling filters for motion features. But the drawback is 3D pooling filters only take a certain predefined number of frames as input. The weight-sharing method of RNN or LSTM lacks accuracy. They concluded that it is very tough to encode temporal information as there is no such method existing till now and also if using small data it is tough to avoid overfitting.
The paper ”Activity recognition with evolving data streams: A review. ACM Computing Surveys (CSUR)” [24] by Abdallah et al survey and categorizes the areas of HAR according to feature types. They did a comparison of different HAR systems and stated that there are many research gaps in HAR. They stated that the main research problem is the models are developed offline and are not capable of detecting novel activities in real time. They concluded personalization is the solution to the problem and that too an incremental approach instead of retraining the whole model again. Their future work enables the personalization for better accuracy and capturing novel activities for the model to learn new knowledge and many more.
The paper ”Action Recognition in Video Sequences using Deep Bi-Directional LSTM With CNN Features” [8] by Ullah et al conducted research with three datasets UCF, YouTube, and HMDB 51, they split the data into 60:20:20 for training, validation, and testing. They used Caffe for feature extraction and for they used Tensorflow for deep bi-directional LSTM and GPU GeForce-Titan-X. They used the learning rate of 0.01 and batch size of 512 and 1000 iterations. They have researched different models and found that Deep Bi-Directional LSTM (Two RNNs are stacked here, one RNN goes forward and another goes to the backward direction, and the combined output is calculated based on the hidden states of those RNNs) is producing good accuracy for the three datasets of around 90 percent. It’s important to mention they have used multiple LSTM layers (two for forward and two for backward direction and combined the result in the output layer) for the DB-LSTM.
According to the paper [47] by Maurer et al, introduced eWatch [31], consists of four sensors, an accelerometer, a thermometer, a microphone, and a light sensor, and is an online Activity Recognition System, They use a C4.5 decision tree and passive embedded sensors achieved the accuracy of 92.5% for six ambulation activities and almost 70% for ascending and descending activities within the execution time of 0.3 ms. NO wireless communication is needed here.
According to the paper ”A mobile platform for real-time human activity recognition” [48] by Lara et al, proposed Vigilante, a real-time mobile HAR [31], capable to measure acceleration and physiological signals such as Heart rate, respiration rate, skin temperature, and other vitals. They used the C4.5 decision tree classifier and achieved an overall accuracy of 92.6% with a minimal response time and run up to 12.5 continuous hours. It gets connected via a permanent Bluetooth connection.
According to the paper ”COSAR: hybrid reasoning for context-aware activity Recognition” [49] by Riboni et al proposed COSAR, is capable of recognizing ambulation activities such as brushing teeth, strolling, and writing on a blackboard by taking input from two sensors, mobile and a sensor on the wrist with GPS achieved the overall accuracy of about 93% with some misclassification [31].
The paper ”Development of a portable activity detector for daily activity recognition” [50] by Kao et al, introduced a portable device for an online recognition system, with a triaxial accelerometer placed on the user’s wrist is capable of detecting seven activities such as brushing teeth, hitting, knocking, working at a PC, running, walking, and swinging [31], used time domain features and the Linear Discriminant Analysis (LDA) for dimensionality reduction of the feature space and then Fuzzy Basis Function learner to classify the activities, achieved the overall accuracy of almost 94.71%.
According to the paper ”Activity classification using realis- tic data from wearable sensors” [51], Parkka et al proposed an offline HAR that is capable of recognizing activities such as lying, rowing, riding a bike, standing still, running, walking, and Nordic walking [31], and placed the sensors on user’s chest, wrist, finger, forehead, shoulder, upper back, and armpit, used a custom decision tree for classification and speech recognizer for the audio signal achieved the overall accuracy of 86%.
V. Improvements and Conclusion
HAR is used in many sectors and many fields. So active monitoring is very much required nowadays. In this paper we have successfully demonstrated the fundamental concept of HAR and also the state-of-the-art approaches and various commonly used datasets. The main problem of Computer Vision is the difference between the working of the human brain with the human visuals. We found that though there are other methods for the HAR the Deep Learning Network archi- tecture and Neural Network architecture have always proved better due to the better accuracy. But the HAR is needed to monitor in real-time so there should be some changes in the model architecture as in real time the performance matters with respect to the camera angles, speed, and many more things, so there should be hybrid models instead of only Deep Learning Architecture. There is a strong need to fill the gap between offline and real-time detection. Apart from the modern state-of-the-art approaches, it is required to explore some other ideas like Transformers like Generative Pre-trained Transformer (GPT) and Bidirectional Encoder Representation From Transformer (BERT) for the HAR.
References
- Hussain, Z., Sheng, M., & Zhang, W. E. (2019). Different approaches for human activity recognition: A survey. arXiv preprint arXiv:1906.05074. [CrossRef]
- Dang, L. M., Min, K., Wang, H., Piran, M. J., Lee, C. H., & Moon, H. (2020). Sensor-based and vision-based human activity recognition: A comprehensive survey. Pattern Recognition, 108, 107561. [CrossRef]
- Beddiar, D. R., Nini, B., Sabokrou, M., & Hadid, A. (2020). Vision- based human activity recognition: A survey. Multimedia Tools and Applications, 79(41-42), 30509-30555. [CrossRef]
- V7labs official website. “Human Activity Recognition” https://www.v7labs.com/blog/human-activity- recognition.
- Medium official website “C3D” https://sh-tsang.medium.com/ paper-c3d-learning-spatiotemporal-features-with- 3d-convolutional-networks-video-classification- 72b49adb4081.
- Towards Data Science official website. “R-CNN, Fast R-CNN, Faster R-CNN, YOLO” https://towardsdatascience.com/r-cnn-fast-r-cnn-faster-r-cnn-yolo-object-detection-algorithms-36d53571365e.
- Gupta, S. (2021). Deep learning based human activity recognition (HAR) using wearable sensor data. International Journal of Information Management Data Insights, 1(2), 100046. [CrossRef]
- Ullah, A., Ahmad, J., Muhammad, K., Sajjad, M., & Baik, S. W. (2017). Action recognition in video sequences using deep bi-directional LSTM with CNN features. IEEE access, 6, 1155-1166. [CrossRef]
- Montes, A., Salvador, A., Pascual, S., & Giro-i-Nieto, X. (2016). Temporal activity detection in untrimmed videos with recurrent neural networks. arXiv preprint arXiv:1608.08128. [CrossRef]
- iMerit official website “Using Neural Networks for Video Classification”https://imerit.net/blog/using-neural-networks-for-video-classification-blog-all-pbm/.
- Orozco, C. I., Buemi, M. E., & Berlles, J. J. (2019). Cnn-lstm architecture for action recognition in videos. In I Simposio Argentino de Imagenes y Vision (SAIV 2019)-JAIIO 48 (Salta).
- LearnOpenCV official website “Introduction to Video Classification and Human Activity Recognition” https://learnopencv.com/introduction-to-video- classification-and-human-activity-recognition/.
- Tran, D., Bourdev, L., Fergus, R., Torresani, L., & Paluri, M. (2015). Learning spatiotemporal features with 3d convolutional networks. In Proceedings of the IEEE international conference on computer vision (pp. 4489-4497). [CrossRef]
- Girshick, R., Donahue, J., Darrell, T., & Malik, J. (2014). Rich feature hierarchies for accurate object detection and semantic segmentation. In Proceedings of the IEEE conference on computer vision and pattern recognition (pp. 580-587). [CrossRef]
- Ullah, A., Ahmad, J., Muhammad, K., Sajjad, M., & Baik, S. W. (2017). Action recognition in video sequences using deep bi-directional LSTM with CNN features. IEEE access, 6, 1155-1166. [CrossRef]
- Ji, S., Xu, W., Yang, M., & Yu, K. (2012). 3D convolutional neural networks for human action recognition. IEEE transactions on pattern analysis and machine intelligence, 35(1), 221-231. [CrossRef]
- Karpathy, A., Toderici, G., Shetty, S., Leung, T., Sukthankar, R., & Fei-Fei, L. (2014). Large-scale video classification with convolutional neural networks. In Proceedings of the IEEE conference on Computer Vision and Pattern Recognition (pp. 1725-1732). [CrossRef]
- Yao, R., Lin, G., Xia, S., Zhao, J., & Zhou, Y. (2020). Video object segmentation and tracking: A survey. ACM Transactions on Intelligent Systems and Technology (TIST), 11(4), 1-47. [CrossRef]
- O¨ zyer, T., Ak, D. S., & Alhajj, R. (2021). Human action recognition approaches with video datasets—A survey. Knowledge-Based Systems, 222, 106995. [CrossRef]
- twine official website “Best Human Action Video Datasets of 2022”https://www.twine.net/blog/top-human-action-video-datasets/.
- AVA official website “AVA Dataset”https://research.google.com/ava/.
- Davila, D., Du, D., Lewis, B., Funk, C., Van Pelt, J., Collins, R., ... & Clipp, B. (2023). MEVID: Multi-view Extended Videos with Identities for Video Person Re-Identification. In Proceedings of the IEEE/CVF Winter Conference on Applications of Computer Vision (pp. 1634-1643). [CrossRef]
- Li, A., Thotakuri, M., Ross, D. A., Carreira, J., Vostrikov, A., & Zisserman, A. (2020). The ava-kinetics localized human actions video dataset. arXiv preprint arXiv:2005.00214. [CrossRef]
- Abdallah, Z. S., Gaber, M. M., Srinivasan, B., & Krishnaswamy, S. (2018). Activity recognition with evolving data streams: A review. ACM Computing Surveys (CSUR), 51(4), 1-36. [CrossRef]
- Ramasamy Ramamurthy, S., & Roy, N. (2018). Recent trends in machine learning for human activity recognition—A survey. Wiley Interdisciplinary Reviews: Data Mining and Knowledge Discovery, 8(4), e1254. [CrossRef]
- Wang, P., Li, W., Ogunbona, P., Wan, J., & Escalera, S. (2018). RGB-D-based human motion recognition with deep learning: A survey. Computer vision and image understanding, 171, 118-139. [CrossRef]
- Yang, X., & Tian, Y. (2016). Super normal vector for human activity recognition with depth cameras. IEEE transactions on pattern analysis and machine intelligence, 39(5), 1028-1039. [CrossRef]
- Ke, S. R., Thuc, H. L. U., Lee, Y. J., Hwang, J. N., Yoo, J. H., & Choi,K. H. (2013). A review on video-based human activity recognition. Computers, 2(2), 88-131. [CrossRef]
- Aggarwal, J. K., & Xia, L. (2014). Human activity recognition from 3d data: A review. Pattern Recognition Letters, 48, 70-80. [CrossRef]
- Wang, J., Chen, Y., Hao, S., Peng, X., & Hu, L. (2019). Deep learning for sensor-based activity recognition: A survey. Pattern recognition letters, 119, 3-11. [CrossRef]
- Lara, O. D., & Labrador, M. A. (2012). A survey on human activity recognition using wearable sensors. IEEE communications surveys & tutorials, 15(3), 1192-1209. [CrossRef]
- Khan, A. M., Lee, Y. K., Lee, S. Y., & Kim, T. S. (2010). A triaxial accelerometer-based physical-activity recognition via augmented-signal features and a hierarchical recognizer. IEEE transactions on information technology in biomedicine, 14(5), 1166-1172. [CrossRef]
- Foerster, F., Smeja, M., & Fahrenberg, J. (1999). Detection of posture and motion by accelerometry: A validation study in ambulatory monitoring. Computers in human behavior, 15(5), 571-583. [CrossRef]
- Bao, L., & Intille, S. S. (2004, April). Activity recognition from user- annotated acceleration data. In International conference on pervasive computing (pp. 1-17). Berlin, Heidelberg: Springer Berlin Heidelberg. [CrossRef]
- Berchtold, M., Budde, M., Schmidtke, H. R., & Beigl, M. (2010). An extensible modular recognition concept that makes activity recognition practical. In KI 2010: Advances in Artificial Intelligence: 33rd Annual German Conference on AI, Karlsruhe, Germany, September 21-24, 2010. Proceedings 33 (pp. 400-409). Springer Berlin Heidelberg. [CrossRef]
- Shaikh, M. B., & Chai, D. (2021). Rgb-d data-based action recognition: A review. Sensors, 21(12), 4246. [CrossRef]
- TechTarget official website “RGB data”https://www.techtarget.com/whatis/definition/RGB-red-green-and-blue.
- TowardsDataScience official website “Feature Extraction”https://towardsdatascience.com/image-feature-extraction-traditional-and-deep-learning-techniques.
- Medium official website “PCA” https://medium.com/ analytics-vidhya/dimensionality-reduction-principal-component-analysis/.
- Pareek, P., & Thakkar, A. (2021). A survey on video-based human action recognition: Recent updates, datasets, challenges, and applications. Artificial Intelligence Review, 54, 2259-2322. [CrossRef]
- Builtin official website “PCA” https://builtin.com/data-science/step-step-explanation-principal-component-analysisencord official website “Segmentation”https://encord.com/blog/image-segmentation-for-computer-vision-best-practice-guide/.
- Khare, S., Sarkar, S., & Totaro, M. (2020, June). Comparison of sensor- based datasets for human activity recognition in wearable IoT. In 2020 IEEE 6th World Forum on Internet of Things (WF-IoT) (pp. 1-6). IEEE.
- Fan, L., Zhang, F., Fan, H., & Zhang, C. (2019). Brief review of image denoising techniques. Visual Computing for Industry, Biomedicine, and Art, 2, 1-12. [CrossRef]
- Chatterjee, S. (2023). Network Intrusion Detection and Deep Learning Mechanisms (Doctoral dissertation, Florida Atlantic University).
- dos Santos, S. F., Sebe, N., & Almeida, J. (2019, October). CV- C3D: Action recognition on compressed videos with convolutional 3d networks. In 2019 32nd SIBGRAPI Conference on Graphics, Patterns and Images (SIBGRAPI) (pp. 24-30). IEEE.
- Maurer, U., Smailagic, A., Siewiorek, D. P., & Deisher, M. (2006, April). Activity recognition and monitoring using multiple sensors on different body positions. In International Workshop on Wearable and Implantable Body Sensor Networks (BSN’06) (pp. 4-pp). IEEE. [CrossRef]
- Lara, O. D., & Labrador, M. A. (2012, January). A mobile platform for real-time human activity recognition. In 2012 IEEE consumer communications and networking conference (CCNC) (pp. 667-671). IEEE. [CrossRef]
- Riboni, D., & Bettini, C. (2011). COSAR: Hybrid reasoning for context-aware activity recognition. Personal and Ubiquitous Computing, 15, 271-289. [CrossRef]
- Kao, T. P., Lin, C. W., & Wang, J. S. (2009, July). Development of a portable activity detector for daily activity recognition. In 2009 ieee international symposium on industrial electronics (pp. 115-120). IEEE. [CrossRef]
- Parkka, J., Ermes, M., Korpipaa, P., Mantyjarvi, J., Peltola, J., & Korhonen, I. (2006). Activity classification using realistic data from wearable sensors. IEEE Transactions on information technology in biomedicine, 10(1), 119-128. [CrossRef]
- V7labs official website “Transfer Learning”https://www.v7labs.com/blog/transfer-learning-guide.
Disclaimer/Publisher’s Note: The statements, opinions and data contained in all publications are solely those of the individual author(s) and contributor(s) and not of MDPI and/or the editor(s). MDPI and/or the editor(s) disclaim responsibility for any injury to people or property resulting from any ideas, methods, instructions or products referred to in the content. |
© 2023 by the authors. Licensee MDPI, Basel, Switzerland. This article is an open access article distributed under the terms and conditions of the Creative Commons Attribution (CC BY) license (http://creativecommons.org/licenses/by/4.0/).
Copyright: This open access article is published under a Creative Commons CC BY 4.0 license, which permit the free download, distribution, and reuse, provided that the author and preprint are cited in any reuse.


