
Submitted:
15 September 2023
Posted:
19 September 2023
You are already at the latest version
Abstract
Growing population, industrialization, and power requirements are adversely affecting the environment by increased greenhouse gases, resulting from fossil fuel burning. Global greenhouse gas mitigation targets have led the nations to promote clean and self-renewable sources of energy to address the environmental issue. Offshore wind power resources are relatively more attractive due to high winds, less turbulence, minimal visualization effects, and no interaction of infrastructure. The present study aims at conducting offshore wind power resources assessment (OWPRA) at some locations in the Gulf of North Suez. For this purpose, the long-term hourly mean wind speed (WS) and wind direction above means sea level (AMSL) and temperature and pressure data near surface is used. The data is obtained from ERA5 (fifth generation reanalysis for the global climate weather) at chosen six (L1-L6) offshore locations. The data covers a period of 43 years, between 1979 and 2021. The WS and direction are provided at 100 m AMSL while temperature and pressure are available near water surface level. At L1 to L6 locations, the log-term mean WS and wind power density (WPD) values are found to be 7.55 m/s and 370 W/m2, 6.37 m/s and 225 W/m2, 6.91 m/s and 281 W/m2, 5.48 m/s and 142 W/m2, 4.30 m/s and 77 W/m2, and 5.03 and 115 W/m2 and at 100 m AMSL; respectively. The higher magnitudes of monthly and annual windy site identifier indices (MWSI and AWSI) of 18.68 and 57.41 and 12.70 and 42.94 at L1 and L3 sites and generally lower values of wind variability indices are indicative of favourable winds source, which is also supported by higher magnitudes of mean WS, WPD, annual energy yields, plant capacity factors, and wind duration at these sites. The cost of energy, for the worst and the best cases are estimated as 10.120 USD/kWh and 1.274 USD/kWh at L5 and L1 sites corresponding to wind turbines WT1 and WT4. Based on the analysis, sites L1, L3, and L2 are recommended for wind farm development in order of preference. The wind variability and windy site identifiers indices introduced, will help decision-makers in deciding the potential windy sites with more confidence.
Keywords:
Offshore
; windy site identifier
; annual wind variability index
; monthly wind variability index
; wind speed
; wind power density
1. Introduction
Growing global concern of adverse climatic changes due to increasing levels of greenhouse gases (GHG) emissions caused by fossil fuel burning for power generation are being addressed by enforcing the reduction of GHG emissions targets on national levels. It is evident that these issues can be tackled by reducing the burning of fossil fuels, which means utilizing clean and self-renewing sources of energy. Such sources include the wind, solar, geothermal, ocean, hydro, and biomass. Of these, wind, hydro, and solar are commercially acceptable and technologically matured. The present scope of the work is limited to offshore wind power resources in this part of the world which are yet to be explored.
For the successful deployment of wind power, onshore or offshore, comprehensive and accurate understanding of its potential is critical [1]. As the world is transiting towards cleaner and sustainable sources of electricity generation, offshore wind power has emerged as a potential solution [2,3]. Offshore wind farms have attracted the interest of legislators, energy companies, and environmentalists due to its vast untapped potential to generate substantial quantities of renewable energy [4]. Accordingly, in the recent times the offshore wind power installed capacities have expanded from 2010 to 2021. Global wind power capacity increased by more than 93 GW in 2020, a phenomenal 53% growth over 2019 [5]. With this new addition, the overall global cumulative capacity has reached to 743 GW[6].
Fast technological development in wind power sector such as the availability of efficient and larger capacity wind turbines, improved offshore construction facilities, and advanced foundation designs have contributed to offshore wind power expansion [7,8]. Compared to earlier years, offshore wind power generation has become economically more viable due to decreasing capital, engineering, installation, and maintenance costs [7,9]. The other drivers for investors and developers are the government incentives, subsidies and favorable policies towards the growth of offshore wind generation. Examples of these schemes include grid connectivity guarantees, power purchase agreement, tax incentives, renewable energy goals, and feed-in tariffs [9,10,11]. Growing concerns of adverse climate changes and the need to find sustainable energy sources have increased the demand for offshore wind power initiatives [12,13].
For Goto Islands, Japan, offshore wind and tidal energy resources were assessed based on annual energy shortage and surplus and the battery capacity. In the absence of storage, an energy mix of offshore wind of 47%, solar of 31%, and tidal of 22% was found to provide the minimum energy shortage of 29.26% and a surplus of 29.26%[14] . The same hybrid power system with the addition of battery storage (30MW), tidal energy system was the main contributor for the reduction of energy shortages and surplus values of up to 23.58% and 19.60%, respectively. A study on system strength evaluation based on the interaction of wind farms and inverter resources was conducted current fault detection at bus level [15].
Wind speed data analysis is the primary objective of wind power resources evaluation [16]. In order to understand the wind characteristics such as annual, monthly, and diurnal WS, WPD, wind turbulence, wind frequency distribution, prevailing wind direction, Weibull distribution, etc. at potential locations, measured meteorological data is required [17]. This is essential for assuring wind farm energy output and maintaining the economic viability [18] To comply with environmental regulatory issues for a future wind farm development, the developer has to comply with environmental concerns, such as the existence of endangered species, the bird’s migratory paths, strategic offshore installations, and any adverse impacts on marine ecosystems[19]. Last but not the least, the competitive cost of energy per kilowatt hour is the key for the success of a wind power project or any power generation project.
The present study aims to assess the availability of wind power resources at six offshore locations in the Gulf of North Suez. Data for WS, wind direction, temperature, and pressure over a 43-year period (1979-2021) is obtained from the long-term fifth generation ERA5 dataset.
2. Important Aspects of Offshore Wind Power Development
Specific to offshore deployments, the most important factors which govern the cost of wind energy are the distance from the coast, depth of water at each wind turbine location, marine life, offshore installation, shipping routes, and birds’ migratory paths. In Europe, the offshore wind farm sizes averaged 25 MW and are located in a water depth of 7 m and approximately 5 km away from the coast line [20]. However, by 2021 these figures have shown average wind farm sizes of 591 MW in Europe at weighted average water depths of 39 m and around 23 km away from the shore line. The technological advancement has resulted in an increased power output due to the availability of larger wind turbine swept areas and higher hub heights over the period of 2010-2021. During this period, the wind turbine rotor diameters have experienced an increase of around 43% (from a weighted average value of 112 m to 160 m). On the other hand, the hub heights increased by 27% during the same period from weighted average of 83 m to 105 m [20].
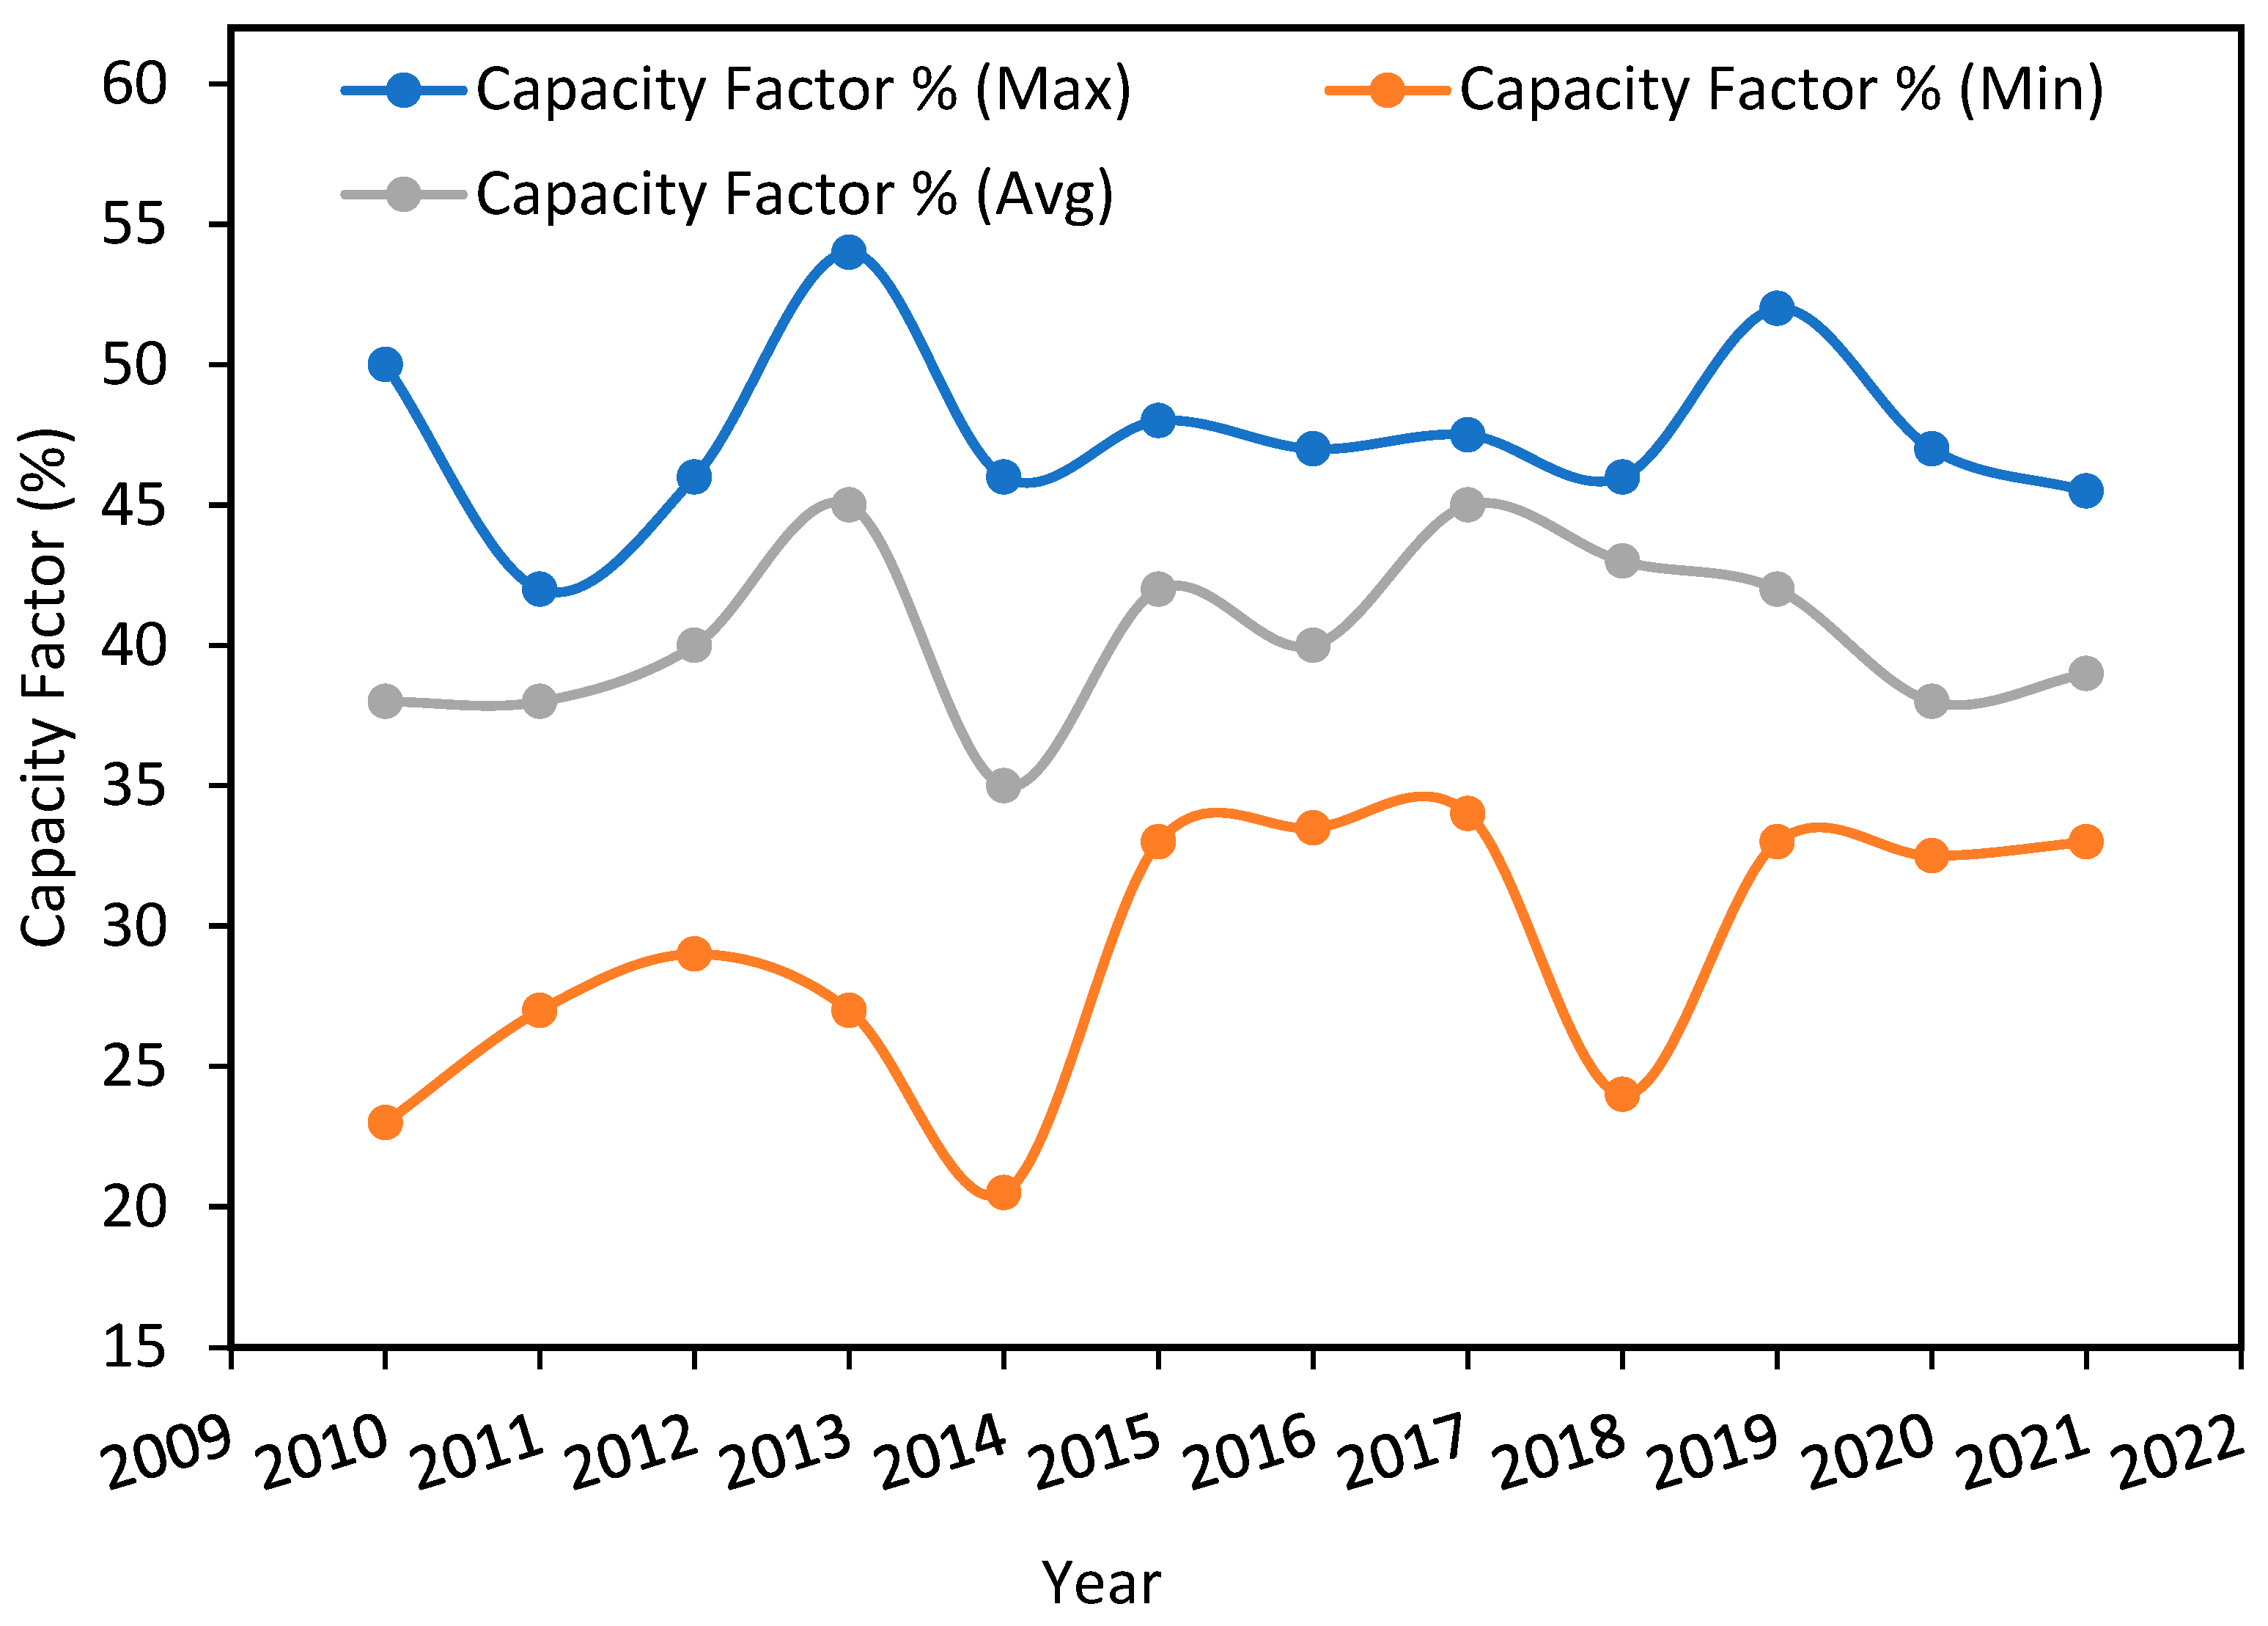
The weighted minimum, average, and maximum values of globally existing offshore wind energy costs USD/kWh and the PCFs are shown in Figure 1a,b; respectively. Globally, the weighted average offshore levelized cost of energy (LCOE) has decreased by almost 60% during 2010 and 2021 (Renewable Energy Agency, 2022). The LCOE was 0.188 USD/kWh in 2010 and declined to 0.075 USD/kWh in 2021, as shown in Figure 1(a). A continuous decrement in LCOE is observed since 2014 till 2021. Another attraction of OWP deployment is its increasing plant capacity factor (PCF) which increased from 38% in 2010 to 45% in 2013 and regained after touching a lowest value of 35% in 2014, Figure 1(b).
Figure 1a.
Offshore globally weighted average levelized cost of energy (LCOE) (Renewable Energy Agency, 2022).
Figure 1a.
Offshore globally weighted average levelized cost of energy (LCOE) (Renewable Energy Agency, 2022).
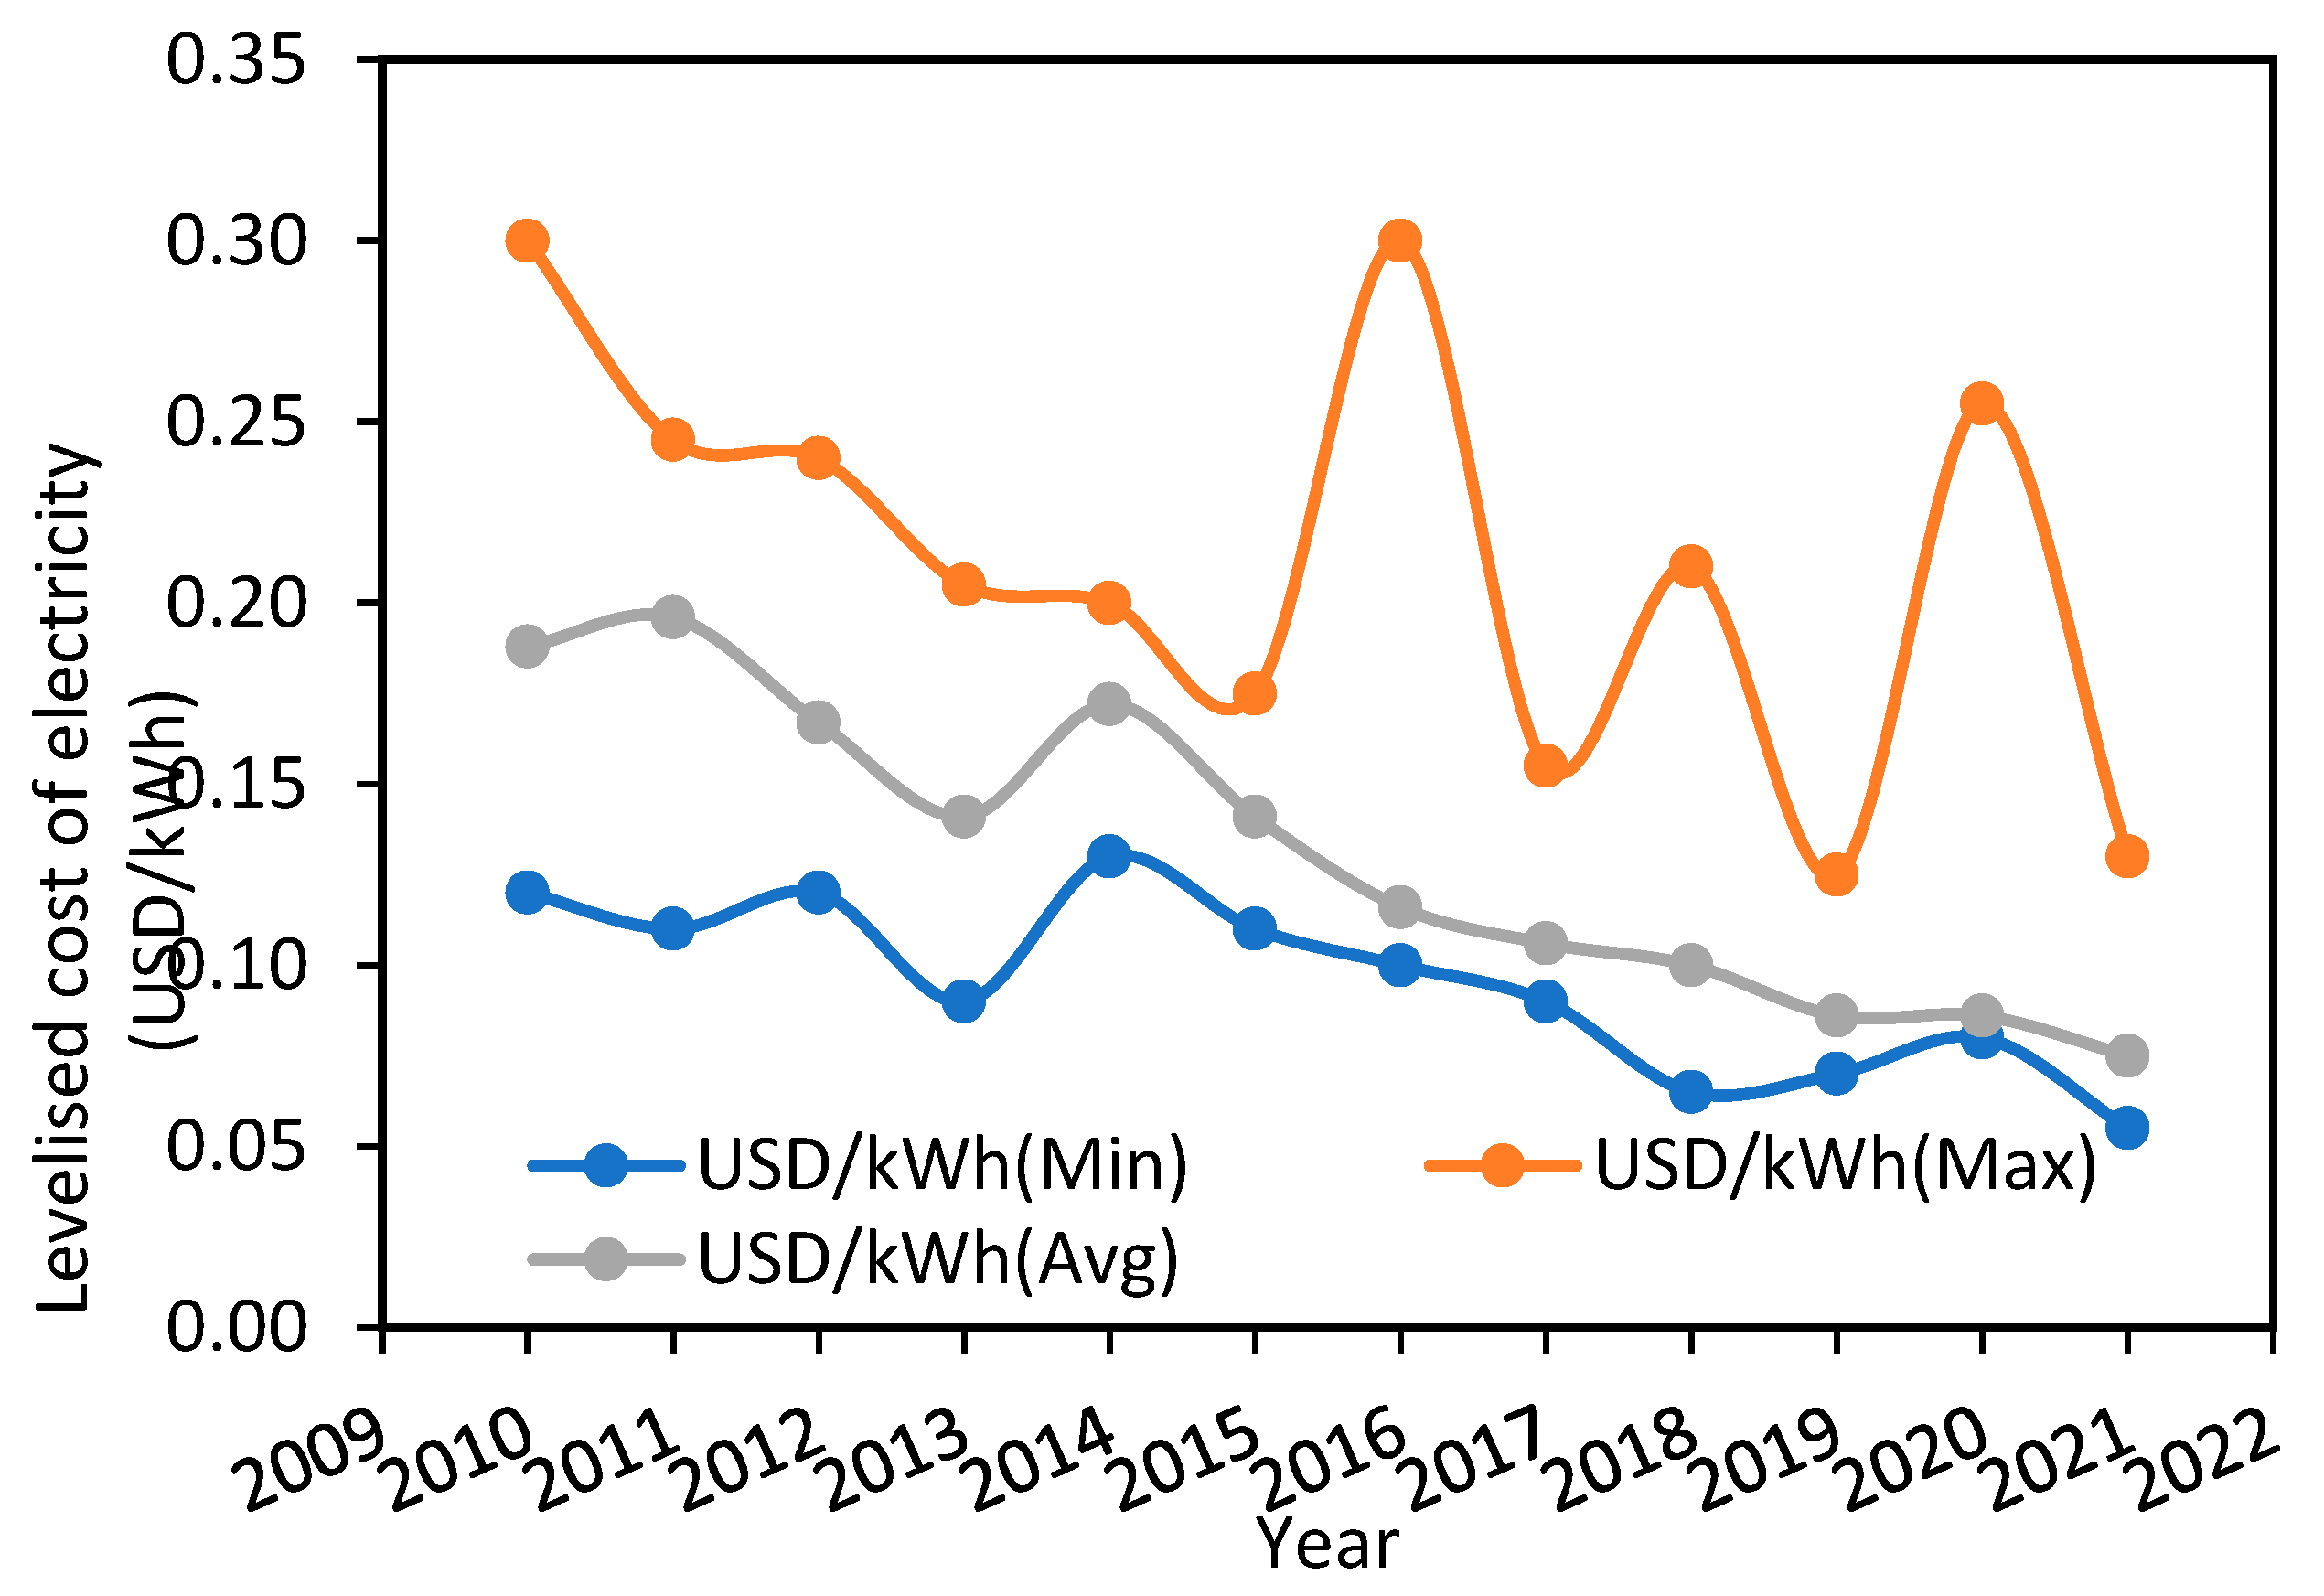
Figure 1b.
Offshore globally weighted average plant capacity factor, (Renewable Energy Agency, 2022).
Figure 1b.
Offshore globally weighted average plant capacity factor, (Renewable Energy Agency, 2022).
3. Literature Review
As said earlier, OWP deployment is increasing and for its profitable assessment, new and sophisticated tools are being developed and used. In Samothraki island, OWP resource assessment was conducted using Region of Interest (ROI) tool and Geographical Information System (GIS) software [21]. The results showed good wind power availability in the southwest area of the island for the development of bottom fixed and floating type of WT foundations. In 2008, the first offshore wind farm went into operation in China [22,23]. In Honk Kong, the southeastern offshore area is found to be suitable for wind farm deployment and can produce annually 112.81 x 10⁸ kWh of energy which accounts for 25.06% of the total annual consumption [24].
For Indian coastal regions, mean WS and WPD of 7.0 to 10.0 m/s and 500 to 600 W/m2 were reported, with Tamil Nadu coastal areas having exploitable wind frequency availability of >60% [25]. India has an estimated annual offshore net energy capacity of 365 GWh and 516 GWh based on two offshore wind turbines with rated capacities of 3.0 MW and 5.0 MW at a hub height of 80 m[26]. For Latin America, an annual technical offshore potential of 1759 W/m2 was reported at 80 m AGL [27]. The offshore wind power densities of 80 W/m2 and 160 W/m2 were reported 10 m and 100 m above the mean sea level [28]. MERRA-2 and ERA5 data were used and offshore plant capacity factors of 32%, 37%, and 46% were reported for Tabasco, Campeche, and Yucatán locations in Mexico [29]. Similar type of offshore wind power resources has been reported for Oman [30] and Portugal [31].
Based on WS data at 100 m AGL during 62 years period from 1959 to 2020 in the Mediterranean and Black Sea areas an average offshore WPD of 373 W/m2 was reported [32]. Another study [33], reported a LCOE of 123.4 USD/MWh by considering the contributions of distance from shoreline, seasonal operational framework, rated power, hub height, wind farm installed capacity, and the operational life of the wind farm. However, relatively moderate LCOEs of 130-180 €/MWh (139.34–192.94 USD/MWh) were reported for Sardinia, Sicily and Malta, Alboran Sea, and in the South Adriatic [34].
4. Materials and Methods
4.1. Site Desrciption
Accurate wind power resources assessment is the key for the success of any wind power project. A total of six sites (L1 to L6) are considered in the Gulf of North Suez to study the wind speed and wind power characteristics to prioritize the locations based on annual energy yield, plant capacity factor, cost of energy, annual and monthly wind variability and windy site indices. The locations, under consideration, are shown in Figure 2. The latitude, longitude, water depth, and the distance from the Sinai cost are given in Table 1. A maximum of 66 m water depth is found for location L1 while a minimum of 2 m at L6 which is quite close to the shoreline. Location L3 is the farthest site from the Sinai coast line (32.86 km) while L6 is the nearest (0.681 km). The other locations are between 2 and 19 km distant from the Sinai shoreline.
4.2. Data Description
The European Centre for Medium-Range Weather Forecasting (ECMWF) has developed reanalysis data and it is widely used by researchers, scientists, and agencies/organizations. Its widespread utilization is accounted for its free availability, proven accuracy, being open source, and having long-term availability with continuity (since 1979 to date). The data includes various meteorological parameters (WS, WD, ambient temperature, and surface pressure). Last but not the least, the data has been proven to be accurate globally after comparative studies [21,35,36]. ERA5 is the fifth-generation data set from ECMWF with significant improvement compared to the previously available ERA-Interim data set [37]. In ERA5 product, the hourly mean WS and WD is available at 100 m with geographical resolution of 31 km [38] which is relatively fine resolution compared to other globally available reanalysis data sets [39].
Some studies have reported bias in the performance of such data sets with WS intensity [40], seasons [41], and the regions [42]. Another study [42], compared the accuracy of third generation reanalysis data sets CFSR, ERA-Interim, MERRA, and MERRA-2 to determine the suitability of the data for the Southwest 2.5 GW capacity offshore wind farm in South Korea. In terms of coefficient of determination, authors reported that MERRA-2 was better than CFSR which performed almost the same as MERRA while MERRA was still better than ERA-Interim. The reanalysis data is employed as long-term reference along with the actual measurements on islands or onshore locations. At offshore locations, the terrain induced orographic forcing does not exist, hence, these reanalysis data sets result in higher correlation [43].
The ERA5 reanalysis data was reported to be best performer when compared with the measurements in comparison to Climate Forecast System Version 2 (CFSv2), Cross-Calibrated Multi-Platform (CCMP), and ECMWF, [44]. Over the period, there has been a noticeable improvement in the reanalysis data sets such as the spatial and temporal resolutions improved to 0.25⁰ and to 1 hour; respectively. The present study utilizes the reanalysis (ERA5) data set for the wind power resource assessment in the Gulf of North Suez. A total of 43-years hourly mean WS, WD, ambient temperature, and pressure data spanning between 1979 and 2022 is obtained for the six sites and analyzed. The WS and WD data is provided at 100 m above sea level while the temperature at 2 m, and the pressure at sea level.
The long-term site-specific means WS values at 100 m AGL vary between a minimum of 4.304 m/s and a maximum of 7.547 m/s corresponding to L5 and L1 sites with maximum all-time values of > 15.0 m/s at all the sites. The cube root mean cubed (CRMC) WS varies from 5.104 m/s at L5 to 8.616 m/s at L1. The minimum and maximum WPD values of 77 W/m2 and 370 W/m2 are estimated for L5 and L1 offshore sites; respectively. The wind power classes (WPC) for all the sites are also included in Table 2 (row 15) based on WPD at 50 m AGL. At L1 and L3 sites the WPC is observed as 2-Marginal while at the remaining sites as 1-Poor. In general, highest values of all parameters are observed at L1 site and the lowest at L5. The long term annual mean values of temperature vary between 20.97 and 22.14 ⁰C, that of mean pressure 99.8 kPa and 100.9, and the air density 1.160 and 1.17 kg/m3. The last row in Table provides the frequency (F) of occurrences of WPD greater than or equal to 250 W/m2. These values of F are used in the calculations of MWVI, AMWI, MWSI, and AWSI values.
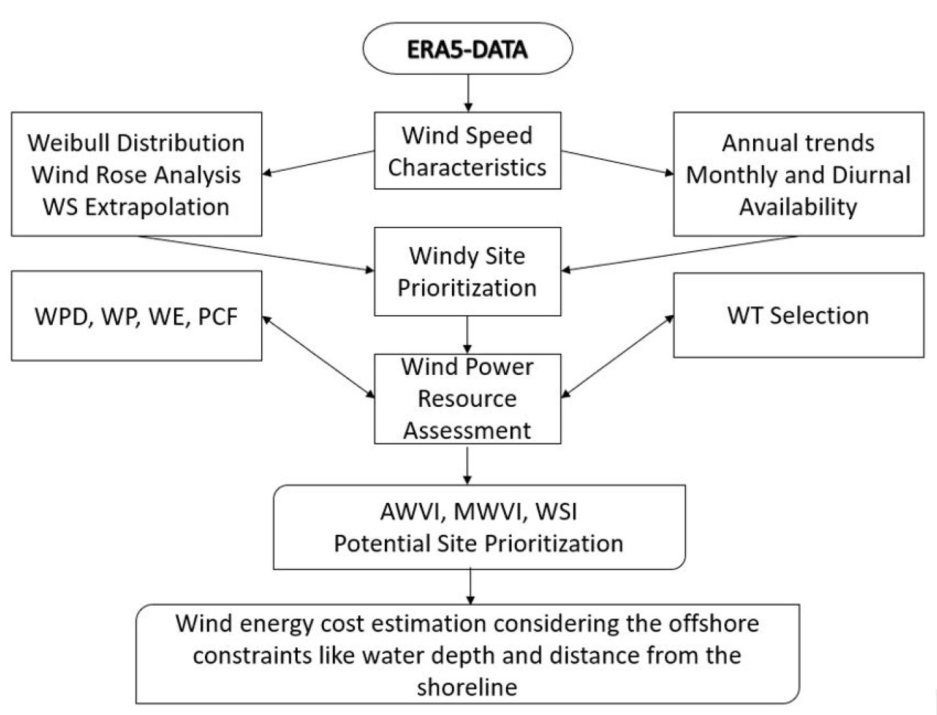
4.3. Methodology
The main objective of the present OWPA in the Gulf of North Suez is to identify the windy potential sites for offshore wind farm development in the near future. As a first step, as summarized in the work flowchart of Figure 3, the ERA5 data is downloaded for six locations in the Gulf of North Suez. Next, wind speed characteristics such as long-term, annual, monthly, and diurnal variations; prevailing WD, frequency analysis, annual and monthly wind variability indices, and windy site identifier are estimated. After this; wind power, wind energy, plant capacity factor, etc. are determined for selected offshore wind turbines. Based on variability indices, the energy output, and the plant capacity factors; the windy potential sites suitability for offshore wind farm development are identified. Finally, the cost of wind energy generation per kilowatt hour is determined for three most suitable sites considering the additional construction costs of water depth and the distance from the shoreline. The mathematical equations of wind power resources assessment parameters are provided in Section 4.3.1–4.3.3.
4.3.1. Wind Speed Characteristics
The annual, monthly, and diurnal trends of WS and WPD are critical for proper wind power resources assessment. The mean , the associated standard deviation, and the wind speed extrapolation are obtained from equations 1 - 3.
Where h1 and h2 are the heights corresponding to measured wind speeds and and α is the wind shear exponent. In the present case a value of α = 0.14 is used. The WPD, which is independent of the WT specifications, provides the power availability per unit of the rotor swept area and is given by the following equation 4:
where N is number of data points, WPD is the wind power density in W/m2, is the air density in kg/m3, is the standard deviation, and V is the hour mean wind speed in m/s. The annual (AWVI) and monthly (MWVI) wind variability indices are calculated following [45].
Where , and are the WPDs for most energetic year (2000 for L1, L3, and L4; 1989 for L2 and L5; and 1995 for L6), least energetic year (2018 for L1 to L5 and 2014 for L6), and mean over the entire period of data collection (1979 to 2021); respectively. Similarly, the monthly wind variability indices are calculated using the following equation:
Where , and are the wind power densities for the most energetic month (June for L1 to L4 and L6 and September for L5), least energetic month (Jan for L1 to L5 and November for L6), and mean over the entire period of data collection (1979 to 2021); respectively. Lower values of these indices are preferred to minimize the wind turbulence and hence prolong the life of wind turbines. An additional index, windy site identifier (WSI) is determined using the percent frequency occurrences of WPD above 250 W/m2. The WPD variability and consistency above a certain magnitude is important for continuous power production at a site. As mentioned in [46], exploitation of wind power is reliable above a WPD of 200 W/m2. However, in the present case this value is taken as 250 W/m2, considering the local meteorological conditions and is calculated using the following equation [47]:
Where F is the percent frequency of WPD occurrences above 250 W/m2 over the entire data collection period at each site (see Table 2 for details).
4.3.2. Wind Power and Energy Estimation
The wind power produced by a wind turbine and the annual energy yield are calculated by as follows:
WP = WPD * A
AEY = WP * 8760
Where A is the wind turbine rotor swept area in m2, 8,760 is the number of hours in a year, WP and AEY are the gross power and annual energy yield. The corresponding plant capacity factor can be calculated as follows:
4.3.3. Wind Energy Cost Estimation
Cost of energy (COE in USD/kWh) is calculated using the following simple formula:
The total investment cost includes the capital, installation, civil work, engineering, management, operation and maintenance; etc.
5. Results and Discussions
The WS data is analyzed and its characteristics, effect of hub height on power and energy yields, plant capacity factor, GHG emissions, and COE, at all the sites, are discussed in Sections 5.1 to 5.5.
5.1. Variability of Wind Speed and Wind Power Density
The long-term site dependent values of wind speed, CRMC wind speed, Weibull parameters, wind power density, mean energy content, energy pattern factors, annual and monthly wind variability indices, and windy site identifiers have been summarized in Table 1 and discussed earlier. The L1 site is situated at a water depth of 66 m and 18.51 km away from the Sinai coast line, observes the maximum annual mean WS, WPD, scale parameter, mean energy content, and MWSI and AWSI; and reasonably acceptable values of MWVI and AWVI, which means stable WS availability during the year. Highest of 8.18 m/s and the lowest of 3.98 m/s annual mean WSs are observed at L1 and L5 locations; respectively (Figure 4). Next, at L3 site, the annual mean WS values remained around 6.91 m/s throughout the data reporting period. Annual mean WSs values of 5.03 to 6.37 m/s are observed at L6 and L2 locations, which means that these two sites have almost the same wind resources but are far from each other. It is noticed that the annual WS trends, at all these sites show decreasing trends, (Table 3), of -0.0064, -0.0046, -0.0054, -0.0032, -0.0021, and -0.0019 m/s per year with low values of coefficient of determination (R2) of < 7%. The decreasing WS trends are insignificant and the wind farms outputs will not be affected over the working life of a wind farm of 20 years or even more. Moreover, the wind patterns, usually, repeat after each decay. The WPD always remained above 300 W/m2 at L1 (Figure 5). However, the annual trends of WPD are almost similar at all the sites, as can be seen from Figure 5. In general, minimum WS and WPD values occurred in 1997 and 2014 and maximum in 2010, 2000, 1995, and 1992 at all the sites.
The monthly mean values of WS (not shown here) and WPD (Figure 6), of (> 6.0 m/s and 300 W/m2) are observed during summer time (Mar-Oct) at L1; respectively. Increasing trends of WS and WPD are observed from January to June and then a decreasing towards the end of the year (Figure 6), at all the locations. The availability of higher winds in summer months is advantageous from higher power demand point of view in summer time. Diurnal WS and WPD trends provide an insight on the availability of power during the day-night cycle and is critical for load matching and grid stability, especially in case of large wind farms of tens of hundreds MW sizes. In the present scenario, sites L6 observes the largest diurnal difference in hourly mean WS values of 2.59 m/s while L2 the smallest of 1.38 m/s (Figure 7). Similarly, the highest diurnal cyclic changes of 186.0 W/m2 (471.0 W/m2 at hour 15:30 and 285.0 W/m2 at hour 06:30) are observed at L1 site while the lowest of 120.7 W/m2 (158.74 W/m2 at hour 18:30 and 37.9 W/m2 at hour 06:30) at L5; as shown in Figure 8.
Large diurnal cyclic difference between the highest and the lowest values of hourly mean WS and WPD values may be a matter of concern from load balancing and grid stability point of view which may be addressed by power system studies. However, at all the sites, higher values of hourly mean WS and WPD are observed starting from mid-night (00:00 hours) and then decreasing trends are observed as the time progressed till 06:00 hours and then continue to increase till 18:00 hours and finally decreased towards the end of the day (Figure 7 and Figure 8).
Windrose diagrams are used to identify the prevailing wind direction, directional dependence of the WS intensity and of the magnitude of the wind power availability. It is evident that at L1 to L3 sites, the wind flows in mostly (60%, 50%, and 45%) from the north west direction (Figure 9). However, the prevailing WD at L4 is seen from north. Overall, at all the sites, the wind blows prevalently from the north and the north west directions. This characteristic is advantageous whereas WT structural stability and the longer working life is concerned. Statistically, the WS data is well described by two parameter (scale and shape) Weibull distribution (Hulio et al., 2019; Baseer et al., 2017; Bagiorgas et al., 2016). The Weibull scale parameter (A) at 100 m AGL are found to vary between 4.849 m/s and 8.453 m/s corresponding to L5 and L1 locations while the shape parameter between 2.305 and 2.643 corresponding to L5 and L3 sites, refer to Table 2. Weibull fits, obtained using these parameters calculated by four methods (maximum likelihood, least square, WAsP, and openwind), are compared with the measured data and are depicted for the worst case (location L1) in Figure 10(a) with R2 values of < 80% and the best case (location L5) in Figure 10(b) with R2 values of > 97% for all the methods. At all other locations the R2 values are between 80% and 99%. This confirms the suitability of the Weibull distribution function for the description of wind speed values.
Wind frequency or wind duration distribution (Figure 11) in different WS bins provides a valuable information about the availability of useful wind above the cut-in-speed of the WT. This assures power production over certain percent of time during the year. In the present case, the WS above 3.25 m/s and 3.75 m/s is observed to be available for 86.8 and 84.4%, 83.3 and 79.7%, 85.5 and 82.9%, 80.5 and 75.4%, 64.9 and 55.4%, and 76.0 and 69.4% of times at L1, L2, L3, L4, L5, and L6 offshore sites under the focus of the present scope of work (Figure 11). From this analysis it can be understood that sites L1, L3, and L2 can produce power for more than 80% of the times during entire year from WTs having cut-in-speeds of 3.25 and 3.75 m/s. This observation further guarantees the suitability of these sites for wind power deployment.
5.2. Wind Variability Indices and Windy Site Identifier
The annual and monthly mean wind variability indices (AWVI, MWVI, AWSI, and MWSI), as explained in methodology section; are calculated using equations 5, 6, and 7; and the resulting values are shown in Figure 12 and Figure 13. In general, the lower values of AWVI and MWVI indicate that the wind is less turbulent at all the sites and can be preferred for the prolonged working life of the wind turbines. Although, the minimum values of AWVI and MWVI of 0.60 and 0.28 correspond to the sites L5 and L4 (Figure 12), but are not the preferred choices because the WS and WPD values are not suitable for wind power generation. On the other hand, locations L1, L2, and L3 with AWVI and MWVI indices of around 1.0 and 0.30 are preferred for wind power realization because of high annual, monthly, and diurnal mean WS, WPD, and wind duration values. Higher values of another useful index, annual and monthly windy site identifier (AWSI and MWSI), are preferred for potential wind farm development. The AWSI and MWSI values are compared for all the sites in Figure 13. High values of AWSI and MWSI of 57.41 and 18.68 correspond to site L1 and the next preferred values of these indices of 42.94 and 12.70 are found for site L3. Based on these indices, it can be said that L1, L3, and L2 are the preferred sites for the development of wind farms in the Gulf of North Suez. The other three sites, L4 to L6; having lower values of AWSI and MWSI and of WS, WPD, and wind duration; are not preferred.
5.3. Wind Power Generation and Plant Capacity Factor Analysis
After the detailed analysis of wind speed characteristics at 100 m and preliminary identification of the preferred windy sites in terms of WS, WPD, AWVI, MWVI, AWSI, MWSI, and wind duration values; more analysis is carried out with regards to wind power output, annual energy yield, and plant capacity factor to confirm the suitability of the potential wind sites. For the purpose, five offshore WTs of 3 to 6 MW rated capacities, 112 to 152 m rotor diameters, 3.0 to 4.0 m/s cut-in-speed, and 12 to 15 m/s rated speed, are chosen (Table 4). The power curves of the chosen WTs are provided in Figure 14 while the losses considered for net power and PCF calculations are summarized in Table 5. The long-term average net wind power, AEY, and PCF values obtained using the selected WTs and the losses are given in Table 6.
Wind turbine WT2, with rated capacity of 5.0 MW, produced the maximum power and energy at all the sites, as can be seen from Table 6 (rows 4 and 9) while WT3 and WT5 with rated capacities of 5.75 MW and 6.0 MW produced less power. This may be accounted for the largest rotor diameter of WT2 and higher range of near rated capacity realization at lower rated wind speeds compared to WT3 and WT5. Wind turbines WT2, WT3, and WT5 are able to produce 16.039, 15.413, and 15.396 GWh of energy annually at L1 site while at L3 and L2 sites these values are 13.037, 12.338, and 11.962 GWh and 10.677, 10.013, and 9.528 GWH; respectively (Table 6). However, the net PCF is the highest, ranged from 9.56% to 42.28% corresponding to WT4 (rated capacity 3.0 MW) for the sites L5 and L1. With regards to PCF, WT4 performed the best at all the sites, as can be observed from the data provided in Table 2 (row number 16). Hence, WT4 can be regarded as the most efficient turbine, WT2 is the next best option, and WT3 is the third possibility. In respect of potential wind sites, the wind power, AEY, and PCF values suggest L1, L3, and L2 as the best sites in order of preference while others can be regarded relatively unfavorable. In Egypt, the per capita electricity consumption is 1,343.17 kWh (Energy Consumption in Egypt, 2023). Accordingly, single wind turbine (WT2) if installed at site L1 can serve energy to approximately 11,941 households and can displace 3,132.5 tons of CO2 equivalent GHG, annually (Table 7). This simply means that around 574 cars and light trucks are not used. At L3 and L2 sites with the installation of single WT2 turbine, approximately 2,553.2 and 2,085.3 tons of GHG can be avoided entering in to the local atmosphere and 9,733 and 7,949 households can be served power annually. A comparative representation of households served with respect to type of wind turbines and locations is displayed in Figure 15.
5.4. Effect of Hub Height on Annual Power Yield and PCF
In general, WS increases with height and results in higher power yield. A numerical experiment is conducted to see the effect of hub height on annual power production and the PCF. The annual power production and the PCF are calculated at 100 m and at extrapolated WSs at 120 m and 140 m for all the chosen WTs. Obvious increased annual power yields and PCFs are observed at all the sites. Typical two such cases for L1 and L3 locations are depicted in Figure 16. It is observed that power production and PCFs increases visibly at a hub height of 120 m compared to that at 100 m. However, this increase is seen to be less significant at 140 m hub height compared to that at 120 m. On an average, 6.0 to 9.0% increase in wind power output is obtained with an increase of 20 m in hub height from 100 m to 120 m. For further addition of 20 m in hub height (from 120 m to 140 m), the power output enhancement of 1.0 to 2.5% is observed. Similarly, the PCF values increased between 0.5 to 2.0% for an increase of initial 20 m in hub height and 0.15 to 0.5% for another 20 m hub height increment. So, it can be said that for an initial increase of 20 m in hub height is better than opting for 40 m increment in hub height due to certain technical and economic reasons.
5.5. Cost of Energy (COE- USD/kWh)
The total cost of offshore wind farms includes wind turbines, installation, electrical infrastructure, distance from the coast, depth of water, and power evacuation system. The weighted average offshore wind power installation costs varied from 2,858 USD/kW to 5,584 USD/kW with an overall mean of 4,720.25 USD/kW during 2010 to 2021. This average installation cost is not limited to a specific location, rather it includes various geographical areas/regions. In the present case, the average installation cost of 4,720.25 USD/kW is used to calculate the COE at all the sites. In general, the lowest COE’s are observed at L1 and the highest at L5 sites for all the chosen wind turbines (Figure 17). In terms of COE, L3 sites is the next best site while L2 the third best option. With regards to wind turbine performance, WT4 consistently performed the best at all the sites while WT2 the next best and WT1 the third best.
The COE values at L1 site vary between 1.274 and 1.857 USD/kWh corresponding to wind turbines WT4 and WT1 of 3.0 and 5.0 MW rated capacities, see Figure 17. Although being the best option from wind resources point of view, the COE at L1 is 10 to 15 folds higher compared to the COE of 0.1234 USD/kWh reported for New York State [33]. In Balearic Islands and the North Adriatic, Tyrrhenian and Levantine Seas; a COE of 0.268 USD/kWh (1/5th of the COE in the present case) while for Sardinia, Sicily and Malta, Alboran Sea, and in the South Adriatic; a COE of 0.193 USD/kWh (around 1/7th of the COE in the present case) was reported by [34]. Compared to all the reported values, the COE in the present case is many folds higher, which may be attributed to the assumed average total installation cost of 4,720.25 USD/kW, the local wind resources and type of wind turbine/s.
6. Conclusions
The present study conducted offshore wind power resources assessment for offshore sites in the Gulf of North Suez. The long-term hourly average wind speed and direction data at 100 m AGL and temperature, pressure, and relative humidity near water surface is used for the assessment. The meteorological data for the six sites, covering a period of 43 years (1979 to 2021), is used. Specifically, the long-term diurnal, monthly, and annual trends of the wind speed, wind power density, wind frequency, wind duration, wind power, plant capacity factors, and COE are analyzed for all the sites for identifying the best possible offshore windy sites in the region for clean and renewable power production. To further support the decision, monthly and annual wind speed variability and windy site identifier indices are introduced. Based on the detailed analysis, the following conclusive remarks are made:
- The long-term mean wind speeds vary between 4.304 m/s and 7.547 m/s corresponding to L5 and L1 sites while the respective wind WPD values are estimated to be 77 W/m2 and 370 W/m2. The prevailing wind directions are found to be from the north and north west. This means that less wind turbulence and wind veering and backing effects, result in less stresses on the wind turbine structures. Finally, assuring a longer life of the wind turbines.
- The Weibull shape and scale parameters ranged between 2.305 (L5) and 2.643 (L3 and L4) and 4.849 m/s (L5) and 8.453 m/s (L1). Similarly, the mean energy content and energy pattern factors of 677 kWh/m2/yr at L5 and 3,240 kWh/m2/yr at L1 and 1.476 at L3 and 1.668 at L5; respectively.
- Lower values of annual and monthly wind variability indices (AWVI and MWVI) are preferred due to being representative of less turbulent nature of the winds, which assures a longer working life of the WTs. In the present case, AWVI vary from 0.28 to 0.35 at L4 and L1 while MWVI between 0.60 and 1.09 at L6 and L1 sites. At potential windy sites (L1, L3, and L2); AWVI and MWVI values are around 0.30 and 1.00 which simply means that winds at these sites are less turbulent and will be good for wind turbines longer working life. Finally, higher values of AWSI and MWSI are opted while selecting a potential windy site. In the present case, highest value of 57.41 is obtained corresponding to L1 site, while 42.94 and 24.41 to L3 and L2. Similarly, monthly windy site identifier (MWSI) values of 18.68, 12.7, and 8.08 are estimated for L1, L3, and L2 sites; respectively. These values assure the suitability of sites in order of preference as L1, L2, and L3. The remaining L4 to L6 sites are not suitable compared to L1 to L3 sites.
- Higher PCF’s of 42.8%, 36.62%, 34.67%, 29.29%, and 29.02% are found at L1 site corresponding to wind turbines WT4, WT2, WT3, WT5, and WT1 while the minimum of < 10% at L5. L3 and L2 sites are rated to be the next best in terms of PCFs of 35.12%, 29.85%, 27.75%, 22.76, 22.19% and 28.85%, 24.38%, 22.52%, 18.13, 17.58 with respect to the order of turbine mentioned above. Based on PCF values, WT4 is proved to be best performer at all the sites while WT2 and WT3 the second and the third best.
- Based on weighted average total installation cost of 4,720.25 USD/kW, during 2010 to 2021, the COE values for the worst and the best cases are found to be 1.274 USD/kWh and 10.120 USD/kWh corresponding to L1 site with WT4 wind turbine and L5 site with WT1 turbine. In general, lowest values of COE are registered at L1, next higher at L3, and then at L2. At L4 to L6, the COE values are very high and are not recommended.
Author Contributions
Conceptualization, S.R., Writing—original draft, S.R., K.I., N.I.I., M.A.M., and A.A. All authors have read and agreed on the manuscript submission.
Funding
Please add: “This research was funded by the IRC for Renewable Energy and Power Systems (IRC-REPS), King Fahd University of Petroleum and Minerals (KFUPM), Dhahran, Saudi Arabia under the grant number INRE 2224.
Institutional Review Board Statement
Not applicable.
Informed Consent Statement
Not applicable.
Data Availability Statement
Not applicable.
Acknowledgments
Authors would like to acknowledge the support provided by the IRC for Renewable Energy and Power Systems (IRC-REPS), King Fahd University of Petroleum and Minerals (KFUPM), Dhahran, Saudi Arabia under the grant number INRE 2224.
Conflicts of Interest
The authors declare no conflict of interest.
References
- Yildirim, A. The Technical and Economical Feasibility Study of Offshore Wind Farms in Turkey. Clean Technol Environ Policy 2023, 25, 125–142. [Google Scholar] [CrossRef]
- Govindan, K. Pathways to Low Carbon Energy Transition through Multi Criteria Assessment of Offshore Wind Energy Barriers. Technol Forecast Soc Change 2023, 187, 122131. [Google Scholar] [CrossRef]
- Liu, Z.; Wang, H.; Zhou, B.; Yang, D.; Li, G.; Yang, B.; Xi, C.; Hu, B. Optimal Operation Strategy for Wind–Hydrogen–Water Power Grids Facing Offshore Wind Power Accommodation. Sustainability (Switzerland) 2022, 14. [Google Scholar] [CrossRef]
- Yildirim, A. The Technical and Economical Feasibility Study of Offshore Wind Farms in Turkey. Clean Technol Environ Policy 2023, 25, 125–142. [Google Scholar] [CrossRef]
- Vasconcelos, R.M. de; Silva, L.L.C.; González, M.O.A.; Santiso, A.M.; de Melo, D.C. Environmental Licensing for Offshore Wind Farms: Guidelines and Policy Implications for New Markets. Energy Policy 2022, 171, 113248. [Google Scholar] [CrossRef]
- Nian, V.; Liu, Y.; Zhong, S. Life Cycle Cost-Benefit Analysis of Offshore Wind Energy under the Climatic Conditions in Southeast Asia – Setting the Bottom-Line for Deployment. Appl Energy 2019, 233–234, 1003–1014. [Google Scholar] [CrossRef]
- Yang, X.; Bai, K. Development and Prospects of Offshore Wind Power. In Proceedings of the 2010 World Non-Grid-Connected Wind Power and Energy Conference; November 2010; IEEE; pp. 1–4.
- Li, J.; Wang, G.; Li, Z.; Yang, S.; Chong, W.T.; Xiang, X. A Review on Development of Offshore Wind Energy Conversion System. Int J Energy Res 2020, 44, 9283–9297. [Google Scholar] [CrossRef]
- Perveen, R.; Kishor, N.; Mohanty, S.R. Off-Shore Wind Farm Development: Present Status and Challenges. Renewable and Sustainable Energy Reviews 2014, 29, 780–792. [Google Scholar] [CrossRef]
- Guo, Y.; Wang, H.; Lian, J. Review of Integrated Installation Technologies for Offshore Wind Turbines: Current Progress and Future Development Trends. Energy Convers Manag 2022, 255, 115319. [Google Scholar] [CrossRef]
- Yu, H.; Yang, X.; Chen, H.; Lou, S.; Lin, Y. Energy Storage Capacity Planning Method for Improving Offshore Wind Power Consumption. Sustainability 2022, 14, 14589. [Google Scholar] [CrossRef]
- El Mokhi, C.; Addaim, A. Optimization of Wind Turbine Interconnections in an Offshore Wind Farm Using Metaheuristic Algorithms. Sustainability 2020, 12, 5761. [Google Scholar] [CrossRef]
- Fernández-Guillamón, A.; Das, K.; Cutululis, N.A.; Molina-García, Á. Offshore Wind Power Integration into Future Power Systems: Overview and Trends. J Mar Sci Eng 2019, 7, 399. [Google Scholar] [CrossRef]
- Garcia-Novo, P.; Coles, D.; Kyozuka, Y.; Yamada, R.; Moriguchi, H.; Sakaguchi, D. Optimization of a Tidal–Wind–Solar System to Enhance Supply–Demand Balancing and Security: A Case Study of the Goto Islands, Japan. Sustainability 2023, 15, 9147. [Google Scholar] [CrossRef]
- Choi, N.; Kim, B.; Kim, D.; Park, B.; Kim, S.; Lee, B. Grid Connection Studies for Large-Scale Offshore Wind Farms Considering High Penetration of Regional Renewables. Sustainability (Switzerland) 2022, 14. [Google Scholar] [CrossRef]
- Xu, J.; Zhang, R.; Wang, Y.; Yan, H.; Liu, Q.; Guo, Y.; Ren, Y. A New Framework for Assessment of Offshore Wind Farm Location. Energies (Basel) 2022, 15, 6758. [Google Scholar] [CrossRef]
- Chancham, C.; Waewsak, J.; Gagnon, Y. Offshore Wind Resource Assessment and Wind Power Plant Optimization in the Gulf of Thailand. Energy 2017, 139, 706–731. [Google Scholar] [CrossRef]
- Kalogeri, C.; Galanis, G.; Spyrou, C.; Diamantis, D.; Baladima, F.; Koukoula, M.; Kallos, G. Assessing the European Offshore Wind and Wave Energy Resource for Combined Exploitation. Renew Energy 2017, 101, 244–264. [Google Scholar] [CrossRef]
- Robertson, B.; Dunkle, G.; Gadasi, J.; Garcia-Medina, G.; Yang, Z. Holistic Marine Energy Resource Assessments: A Wave and Offshore Wind Perspective of Metocean Conditions. Renew Energy 2021, 170, 286–301. [Google Scholar] [CrossRef]
- Renewable Energy Agency, I. Renewable Power Generation Costs in 2021; 2022; ISBN 978-92-9260-452-3. [Google Scholar]
- Nezhad, M.M.; Neshat, M.; Groppi, D.; Marzialetti, P.; Heydari, A.; Sylaios, G.; Garcia, D.A. A Primary Offshore Wind Farm Site Assessment Using Reanalysis Data: A Case Study for Samothraki Island. Renew Energy 2021, 172, 667–679. [Google Scholar] [CrossRef]
- Da, Z.; Xiliang, Z.; Jiankun, H.; Qimin, C. Offshore Wind Energy Development in China: Current Status and Future Perspective. Renewable and Sustainable Energy Reviews 2011, 15, 4673–4684. [Google Scholar] [CrossRef]
- Zhang, J.; Wang, H. Development of Offshore Wind Power and Foundation Technology for Offshore Wind Turbines in China. Ocean Engineering 2022, 266. [Google Scholar] [CrossRef]
- Gao, X.; Yang, H.; Lu, L. Study on Offshore Wind Power Potential and Wind Farm Optimization in Hong Kong. Appl Energy 2014, 130, 519–531. [Google Scholar] [CrossRef]
- Patel, R.P.; Nagababu, G.; Kachhwaha, S.S.; Surisetty, V.V.A.K. A Revised Offshore Wind Resource Assessment and Site Selection along the Indian Coast Using ERA5 Near-Hub-Height Wind Products. Ocean Engineering 2022, 254. [Google Scholar] [CrossRef]
- Arun Kumar, S.V.V.; Nagababu, G.; Sharma, R.; Kumar, R. Synergetic Use of Multiple Scatterometers for Offshore Wind Energy Potential Assessment. Ocean Engineering 2020, 196. [Google Scholar] [CrossRef]
- Rusu, E.; Onea, F. A Parallel Evaluation of the Wind and Wave Energy Resources along the Latin American and European Coastal Environments. Renew Energy 2019, 143, 1594–1607. [Google Scholar] [CrossRef]
- Contestabile, P.; Di Lauro, E.; Galli, P.; Corselli, C.; Vicinanza, D. OffshoreWind and Wave Energy Assessment around Malè and Magoodhoo Island (Maldives). Sustainability (Switzerland) 2017, 9. [Google Scholar] [CrossRef]
- Hernández Galvez, G.; Chuck Liévano, D.; Sarracino Martínez, O.; Lastres Danguillecourt, O.; Dorrego Portela, J.R.; Narcía, A.T.; Saldaña Flores, R.; Pampillón González, L.; Perea-Moreno, A.J.; Hernandez-Escobedo, Q. Harnessing Offshore Wind Energy along the Mexican Coastline in the Gulf of Mexico—An Exploratory Study Including Sustainability Criteria. Sustainability (Switzerland) 2022, 14. [Google Scholar] [CrossRef]
- Al-Hinai, A.; Charabi, Y.; Aghay Kaboli, S.H. Offshore Wind Energy Resource Assessment across the Territory of Oman: A Spatial-Temporal Data Analysis. Sustainability (Switzerland) 2021, 13, 1–18. [Google Scholar] [CrossRef]
- Baptista, J.; Jesus, B.; Cerveira, A.; Pires, E.J.S. Offshore Wind Farm Layout Optimisation Considering Wake Effect and Power Losses. Sustainability 2023, 15, 9893. [Google Scholar] [CrossRef]
- Görmüş, T.; Aydoğan, B.; Ayat, B. Offshore Wind Power Potential Analysis for Different Wind Turbines in the Mediterranean Region, 1959–2020. Energy Convers Manag 2022, 274. [Google Scholar] [CrossRef]
- Liang, Y.; Ma, Y.; Wang, H.; Mesbahi, A.; Jeong, B.; Zhou, P. Levelised Cost of Energy Analysis for Offshore Wind Farms – A Case Study of the New York State Development. Ocean Engineering 2021, 239. [Google Scholar] [CrossRef]
- Martinez, A.; Iglesias, G. Multi-Parameter Analysis and Mapping of the Levelised Cost of Energy from Floating Offshore Wind in the Mediterranean Sea. Energy Convers Manag 2021, 243. [Google Scholar] [CrossRef]
- Früh, W.G. Long-Term Wind Resource and Uncertainty Estimation Using Wind Records from Scotland as Example. Renew Energy 2013, 50, 1014–1026. [Google Scholar] [CrossRef]
- Cannon, D.J.; Brayshaw, D.J.; Methven, J.; Coker, P.J.; Lenaghan, D. Using Reanalysis Data to Quantify Extreme Wind Power Generation Statistics: A 33 Year Case Study in Great Britain. Renew Energy 2015, 75, 767–778. [Google Scholar] [CrossRef]
- Gualtieri, G. Reliability of Era5 Reanalysis Data for Wind Resource Assessment: A Comparison against Tall Towers. Energies (Basel) 2021, 14. [Google Scholar] [CrossRef]
- Hersbach, H.; Bell, B.; Berrisford, P.; Hirahara, S.; Horányi, A.; Muñoz-Sabater, J.; Nicolas, J.; Peubey, C.; Radu, R.; Schepers, D.; et al. The ERA5 Global Reanalysis. Quarterly Journal of the Royal Meteorological Society 2020, 146, 1999–2049. [Google Scholar] [CrossRef]
- Ramirez Camargo, L.; Gruber, K.; Nitsch, F. Assessing Variables of Regional Reanalysis Data Sets Relevant for Modelling Small-Scale Renewable Energy Systems. Renew Energy 2019, 133, 1468–1478. [Google Scholar] [CrossRef]
- Winterfeldt, J.; Andersson, A.; Klepp, C.; Bakan, S.; Weisse, R. Comparison of HOAPS, QuikSCAT, and Buoy Wind Speed in the Eastern North Atlantic and the North Sea. IEEE Transactions on Geoscience and Remote Sensing 2010, 48, 338–348. [Google Scholar] [CrossRef]
- Campos, R.M.; Guedes Soares, C. Assessment of Three Wind Reanalyses in the North Atlantic Ocean. Journal of Operational Oceanography 2017, 10, 30–44. [Google Scholar] [CrossRef]
- Kim, H.G.; Kim, J.Y.; Kang, Y.H. Comparative Evaluation of the Third-Generation Reanalysis Data for Wind Resource Assessment of the Southwestern Offshore in South Korea. Atmosphere (Basel) 2018, 9. [Google Scholar] [CrossRef]
- Sharp, E.; Dodds, P.; Barrett, M.; Spataru, C. Evaluating the Accuracy of CFSR Reanalysis Hourly Wind Speed Forecasts for the UK, Using in Situ Measurements and Geographical Information. Renew Energy 2015, 77, 527–538. [Google Scholar] [CrossRef]
- Wu, S.; Liu, J.; Zhang, G.; Han, B.; Wu, R.; Chen, D. Evaluation of NCEP-CFSv2, ERA5, and CCMP Wind Datasets against Buoy Observations over Zhejiang Nearshore Waters. Ocean Engineering 2022, 259. [Google Scholar] [CrossRef]
- Gonçalves, M.; Martinho, P.; Guedes Soares, C. A 33-Year Hindcast on Wave Energy Assessment in the Western French Coast. Energy 2018, 165, 790–801. [Google Scholar] [CrossRef]
- el Khchine, Y.; Sriti, M.; el Kadri Elyamani, N.E. Evaluation of Wind Energy Potential and Trends in Morocco. Heliyon 2019, 5. [Google Scholar] [CrossRef]
- Kamranzad, B.; Etemad-Shahidi, A.; Chegini, V. Developing an Optimum Hotspot Identifier for Wave Energy Extracting in the Northern Persian Gulf. Renew Energy 2017, 114, 59–71. [Google Scholar] [CrossRef]
- Hulio, Z.H.; Jiang, W.; Rehman, S. Techno - Economic Assessment of Wind Power Potential of Hawke’s Bay Using Weibull Parameter: A Review. Energy Strategy Reviews 2019, 26, 100375. [Google Scholar] [CrossRef]
- Baseer, M.A.; Meyer, J.P.; Rehman, S.; Alam, Md.M. Wind Power Characteristics of Seven Data Collection Sites in Jubail, Saudi Arabia Using Weibull Parameters. Renew Energy 2017, 102, 35–49. [Google Scholar] [CrossRef]
- Bagiorgas, H.S.; Mihalakakou, G.; Rehman, S.; Al-Hadhrami, L.M. Wind Power Potential Assessment for Three Buoys Data Collection Stations in the Ionian Sea Using Weibull Distribution Function. Int J Green Energy 2016, 13, 703–714. [Google Scholar] [CrossRef]
- Bassyouni, M.; Saud, A.G.; Javaid, U.; Awais, M.; Rehman, S.; Abdel-Hamid, S.M.S.; Abdel-Aziz, M.H.; Abouel-Kasem, A.; Shafeek, H. Assessment and Analysis of Wind Power Resource Using Weibull Parameters. Energy Exploration & Exploitation 2015, 33, 105–122. [Google Scholar]
- Rehman, S.; Alam, Md.M.; Meyer, J.P.; Al-Hadhrami, L.M. Wind Speed Characteristics and Resource Assessment Using Weibull Parameters. Int J Green Energy 2012, 9, 800–814. [Google Scholar] [CrossRef]
- Energy Consumption in Egypt. Available online: https://www.worlddata.info/africa/egypt/energy-consumption.php#:~:text=of%20electric%20energy%20per%20year,an%20average%20of%201%2C343%20kWh (accessed on 17 August 2023).
Figure 2.
Geographical locations of the selected offshore sites in the Gulf of Suez (North).
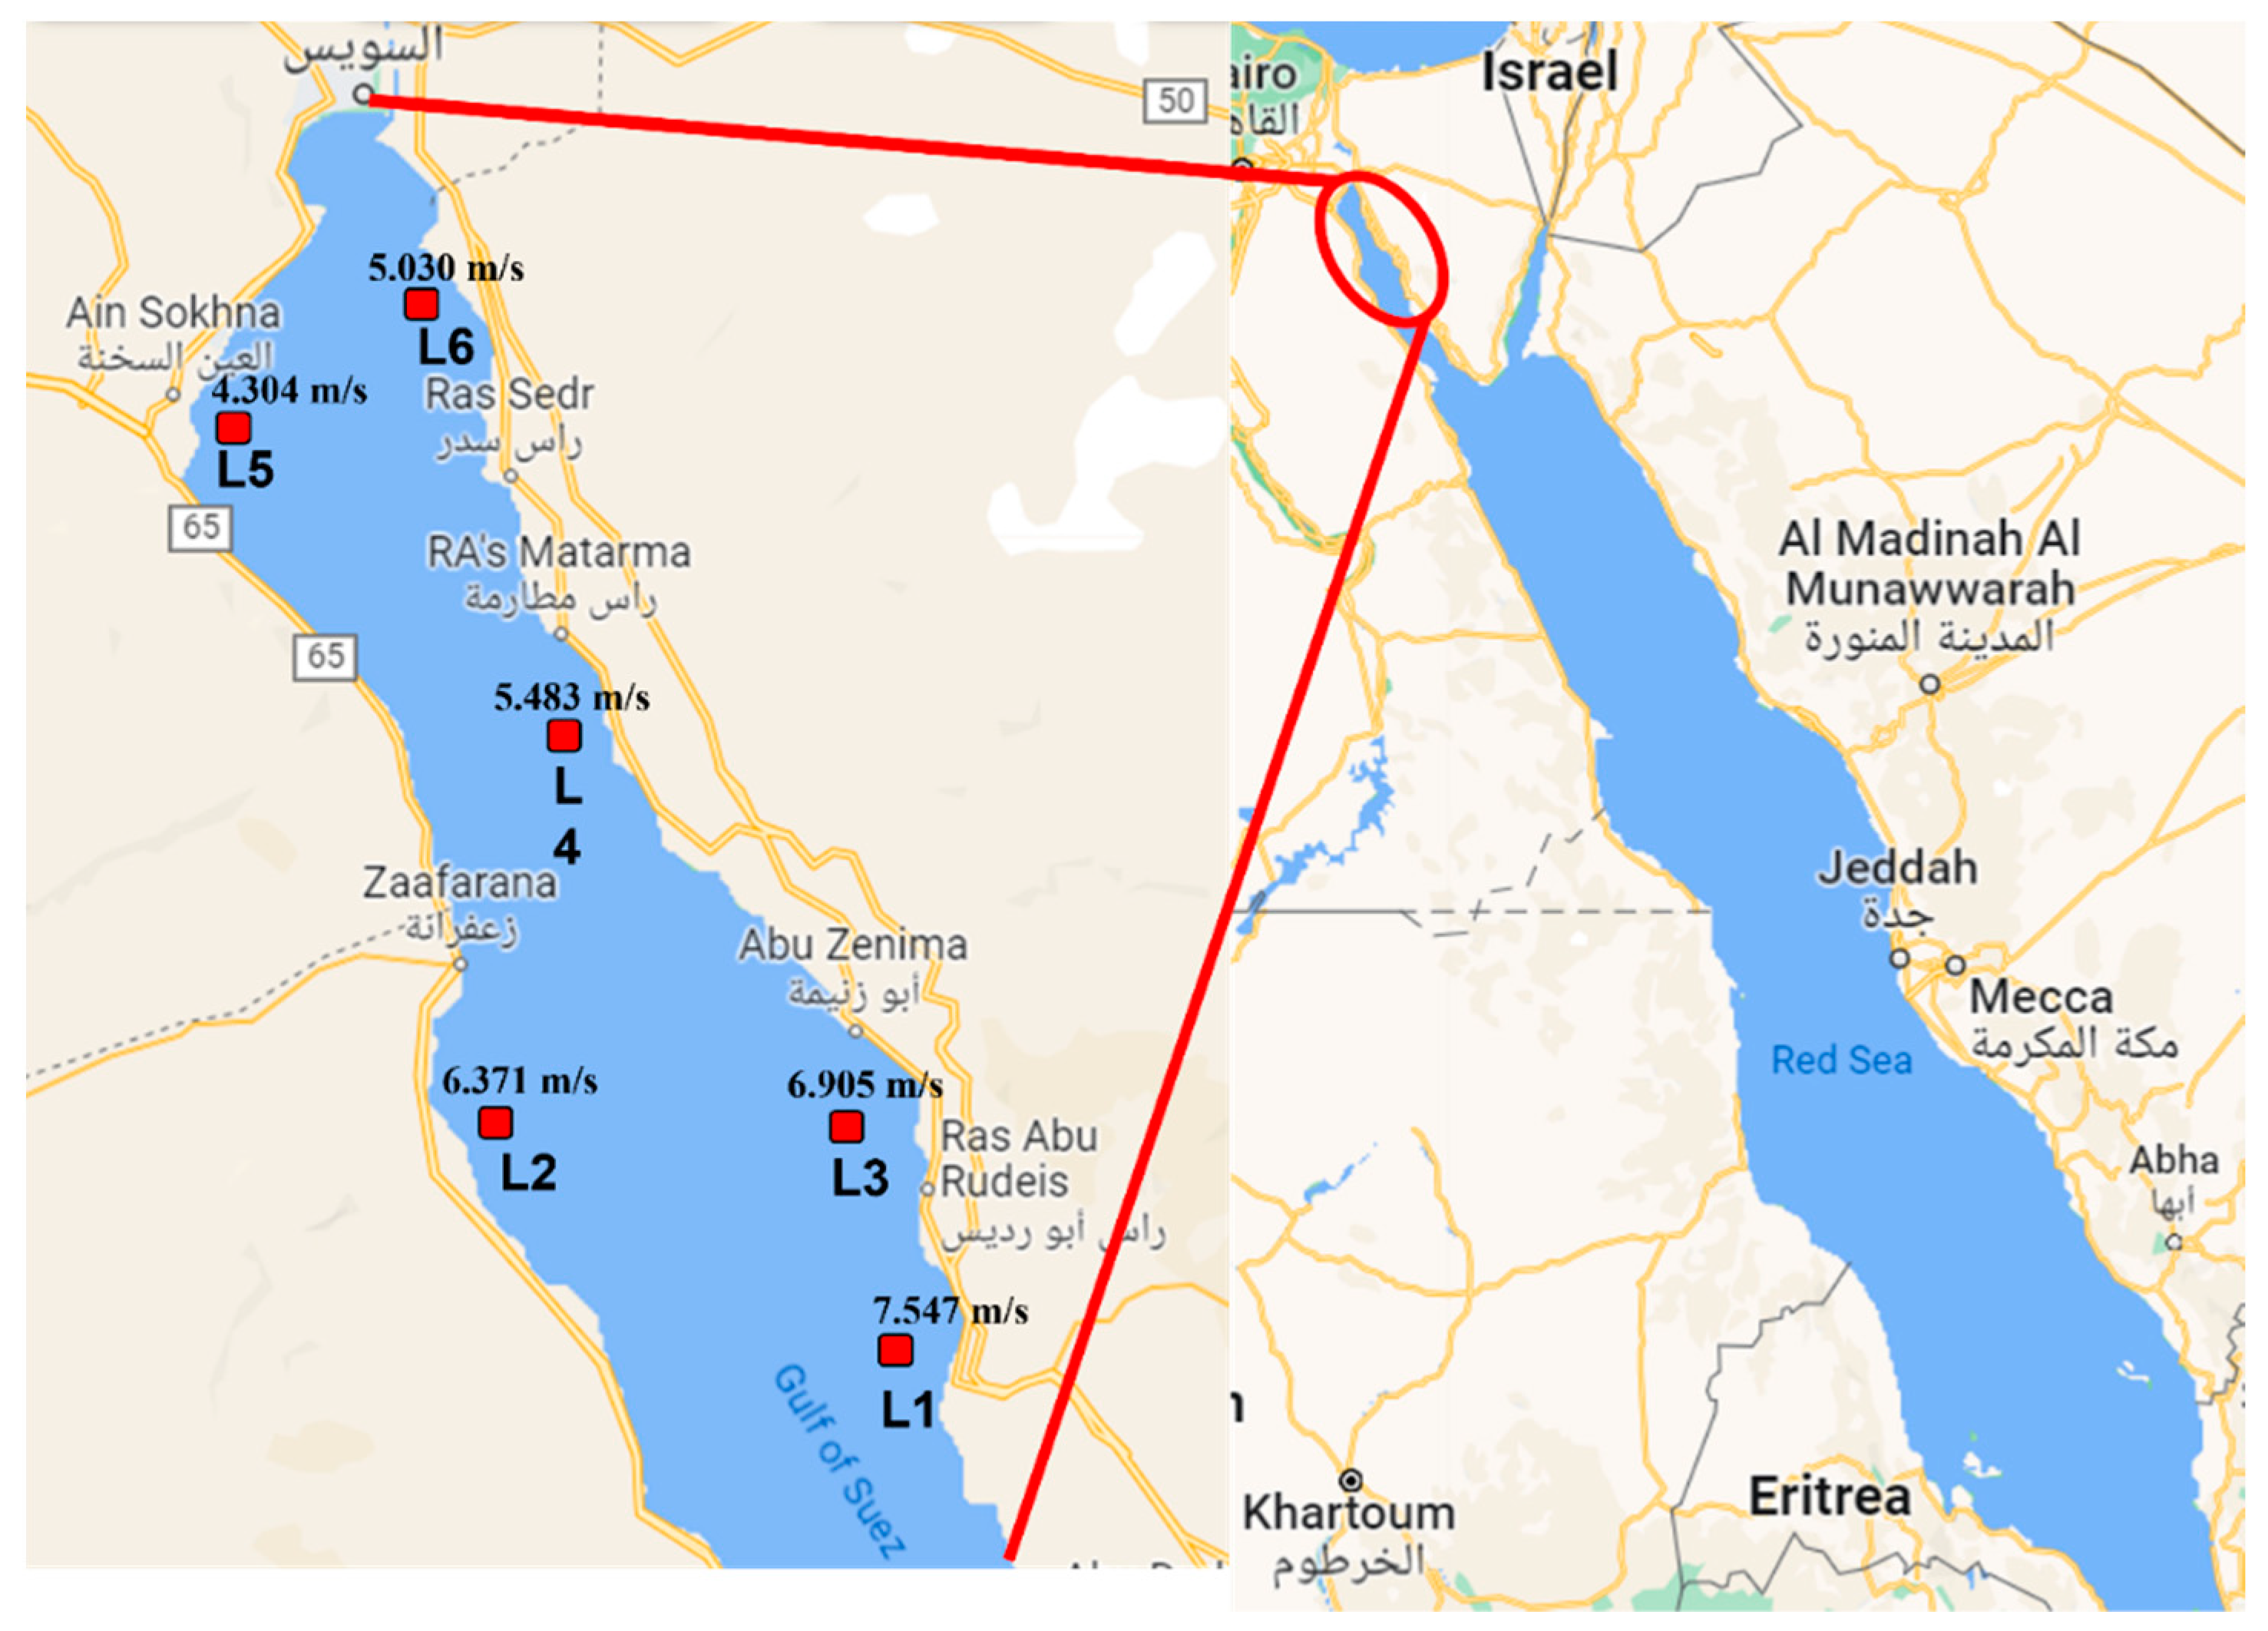
Figure 3.
Flow diagram of the methodology used in the present analysis.
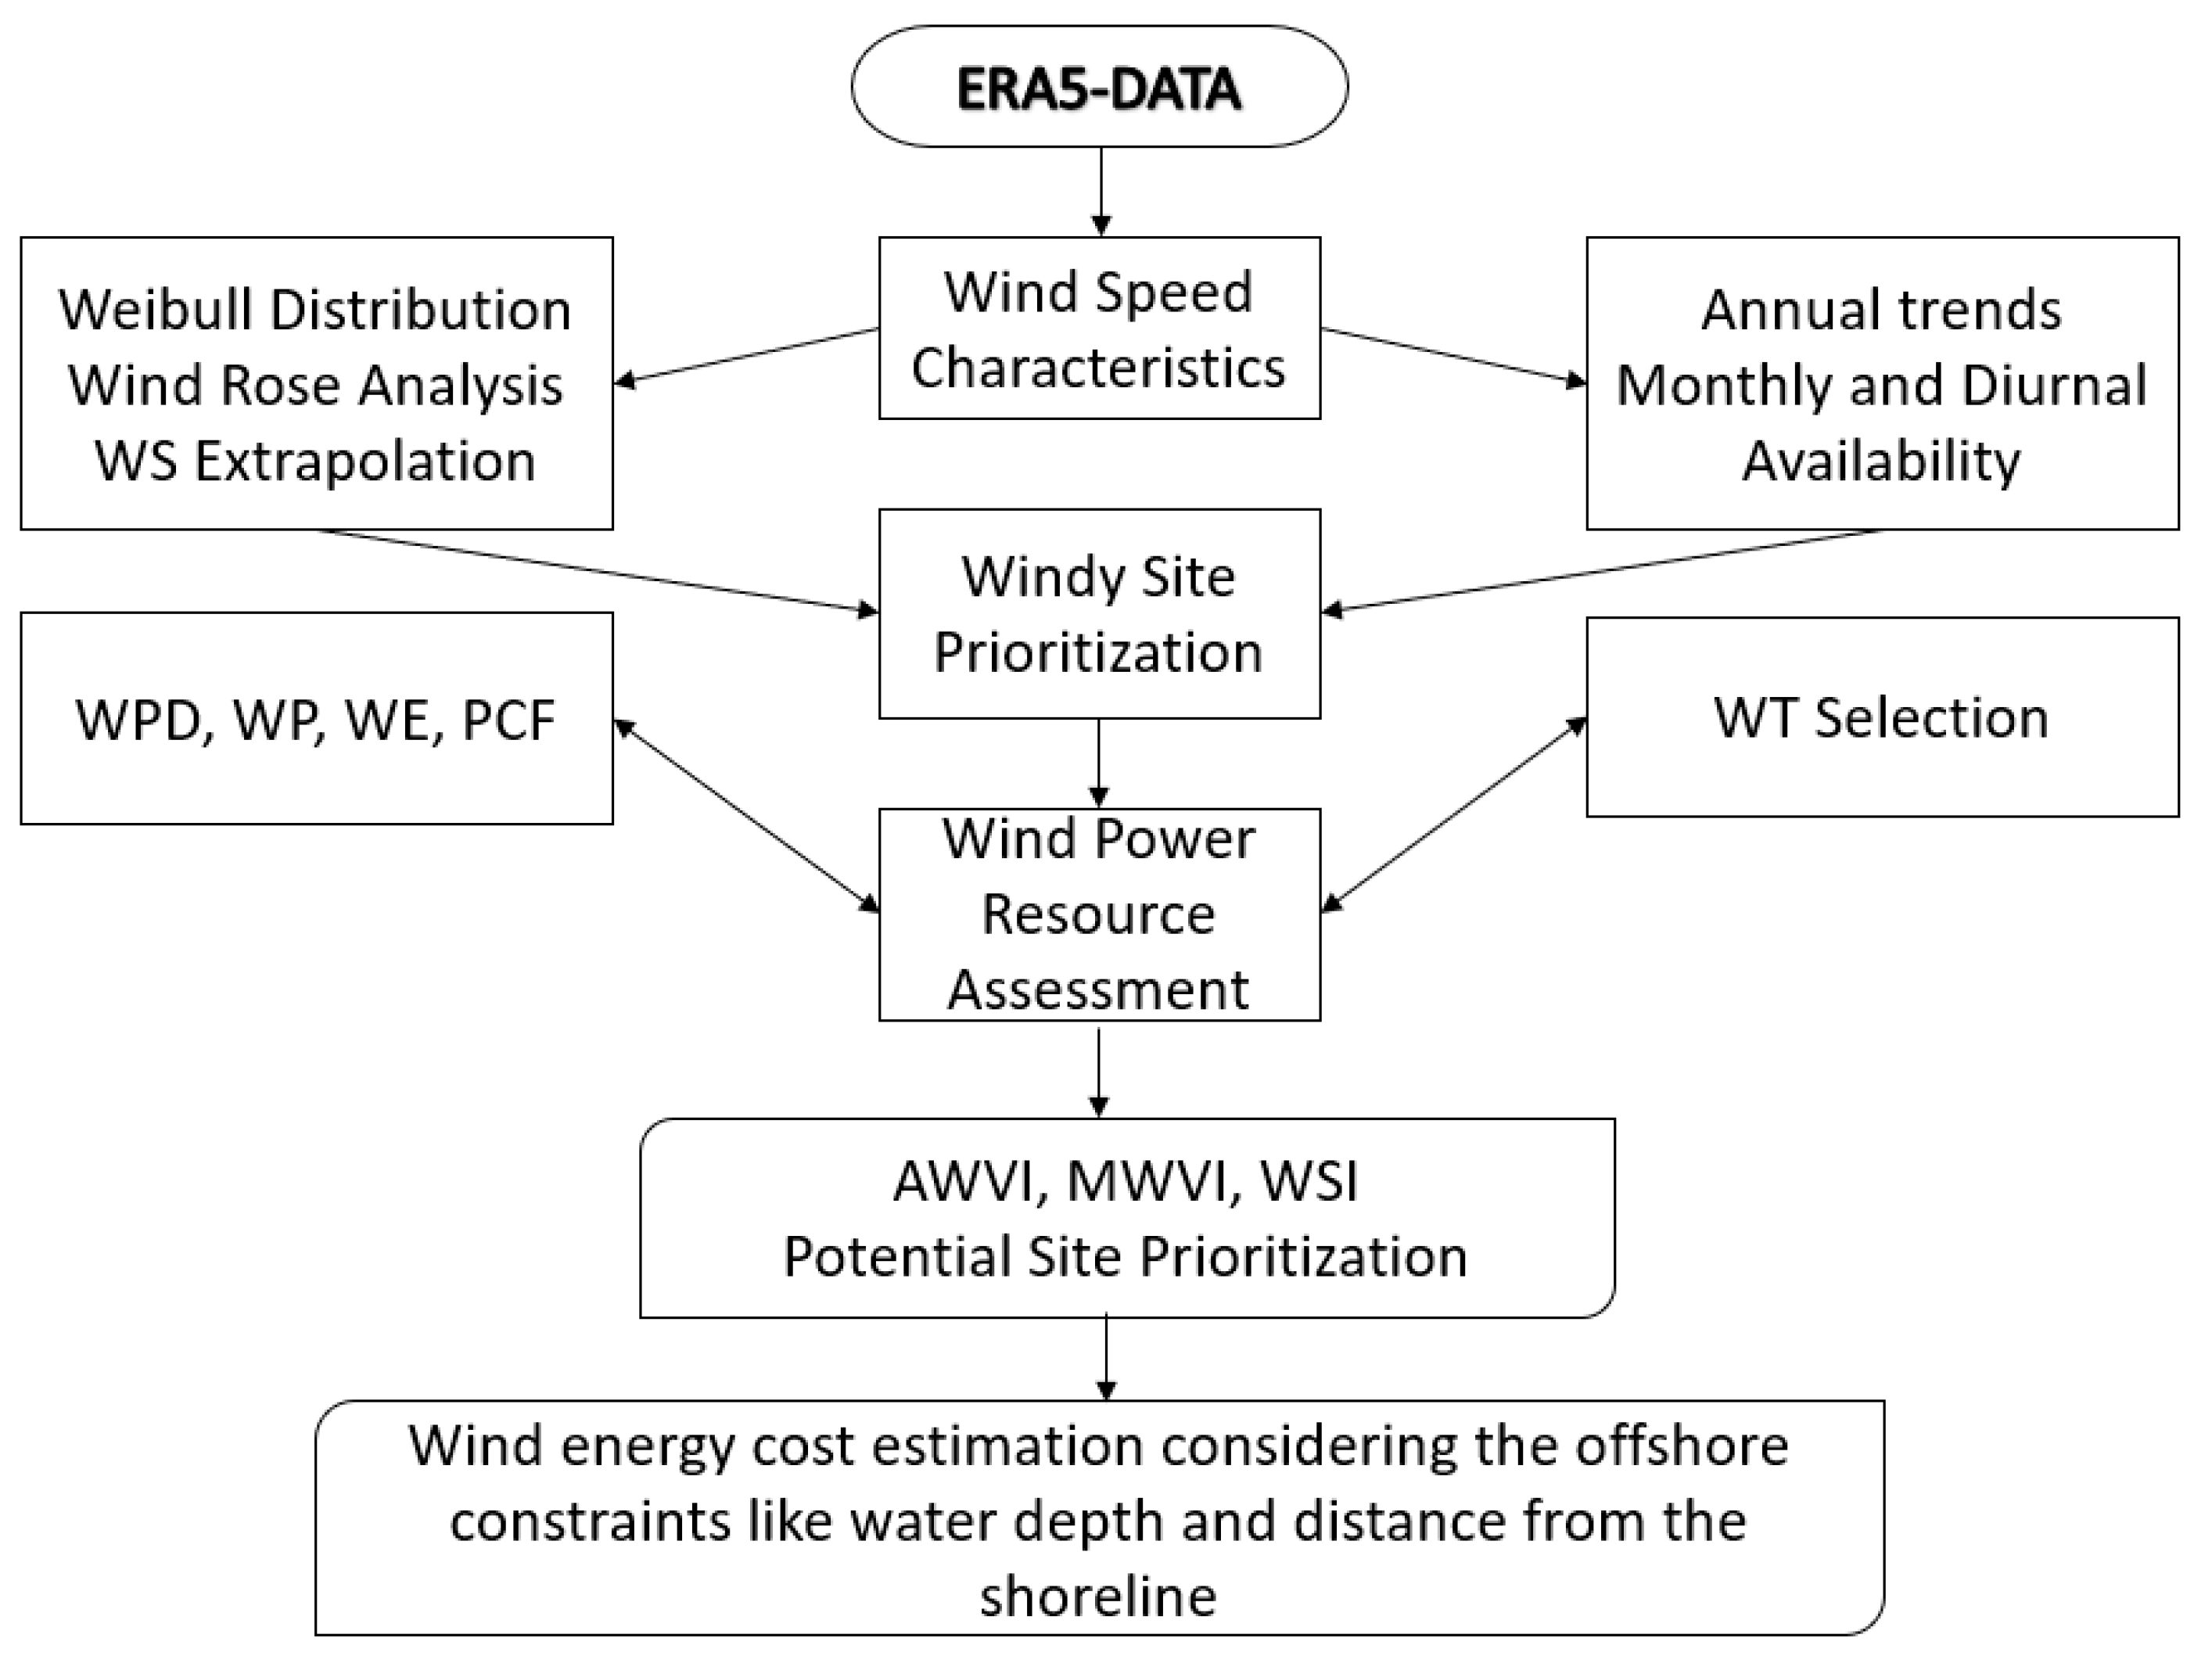
Figure 4.
Annual mean WS trends at selected sites (1979-2021).
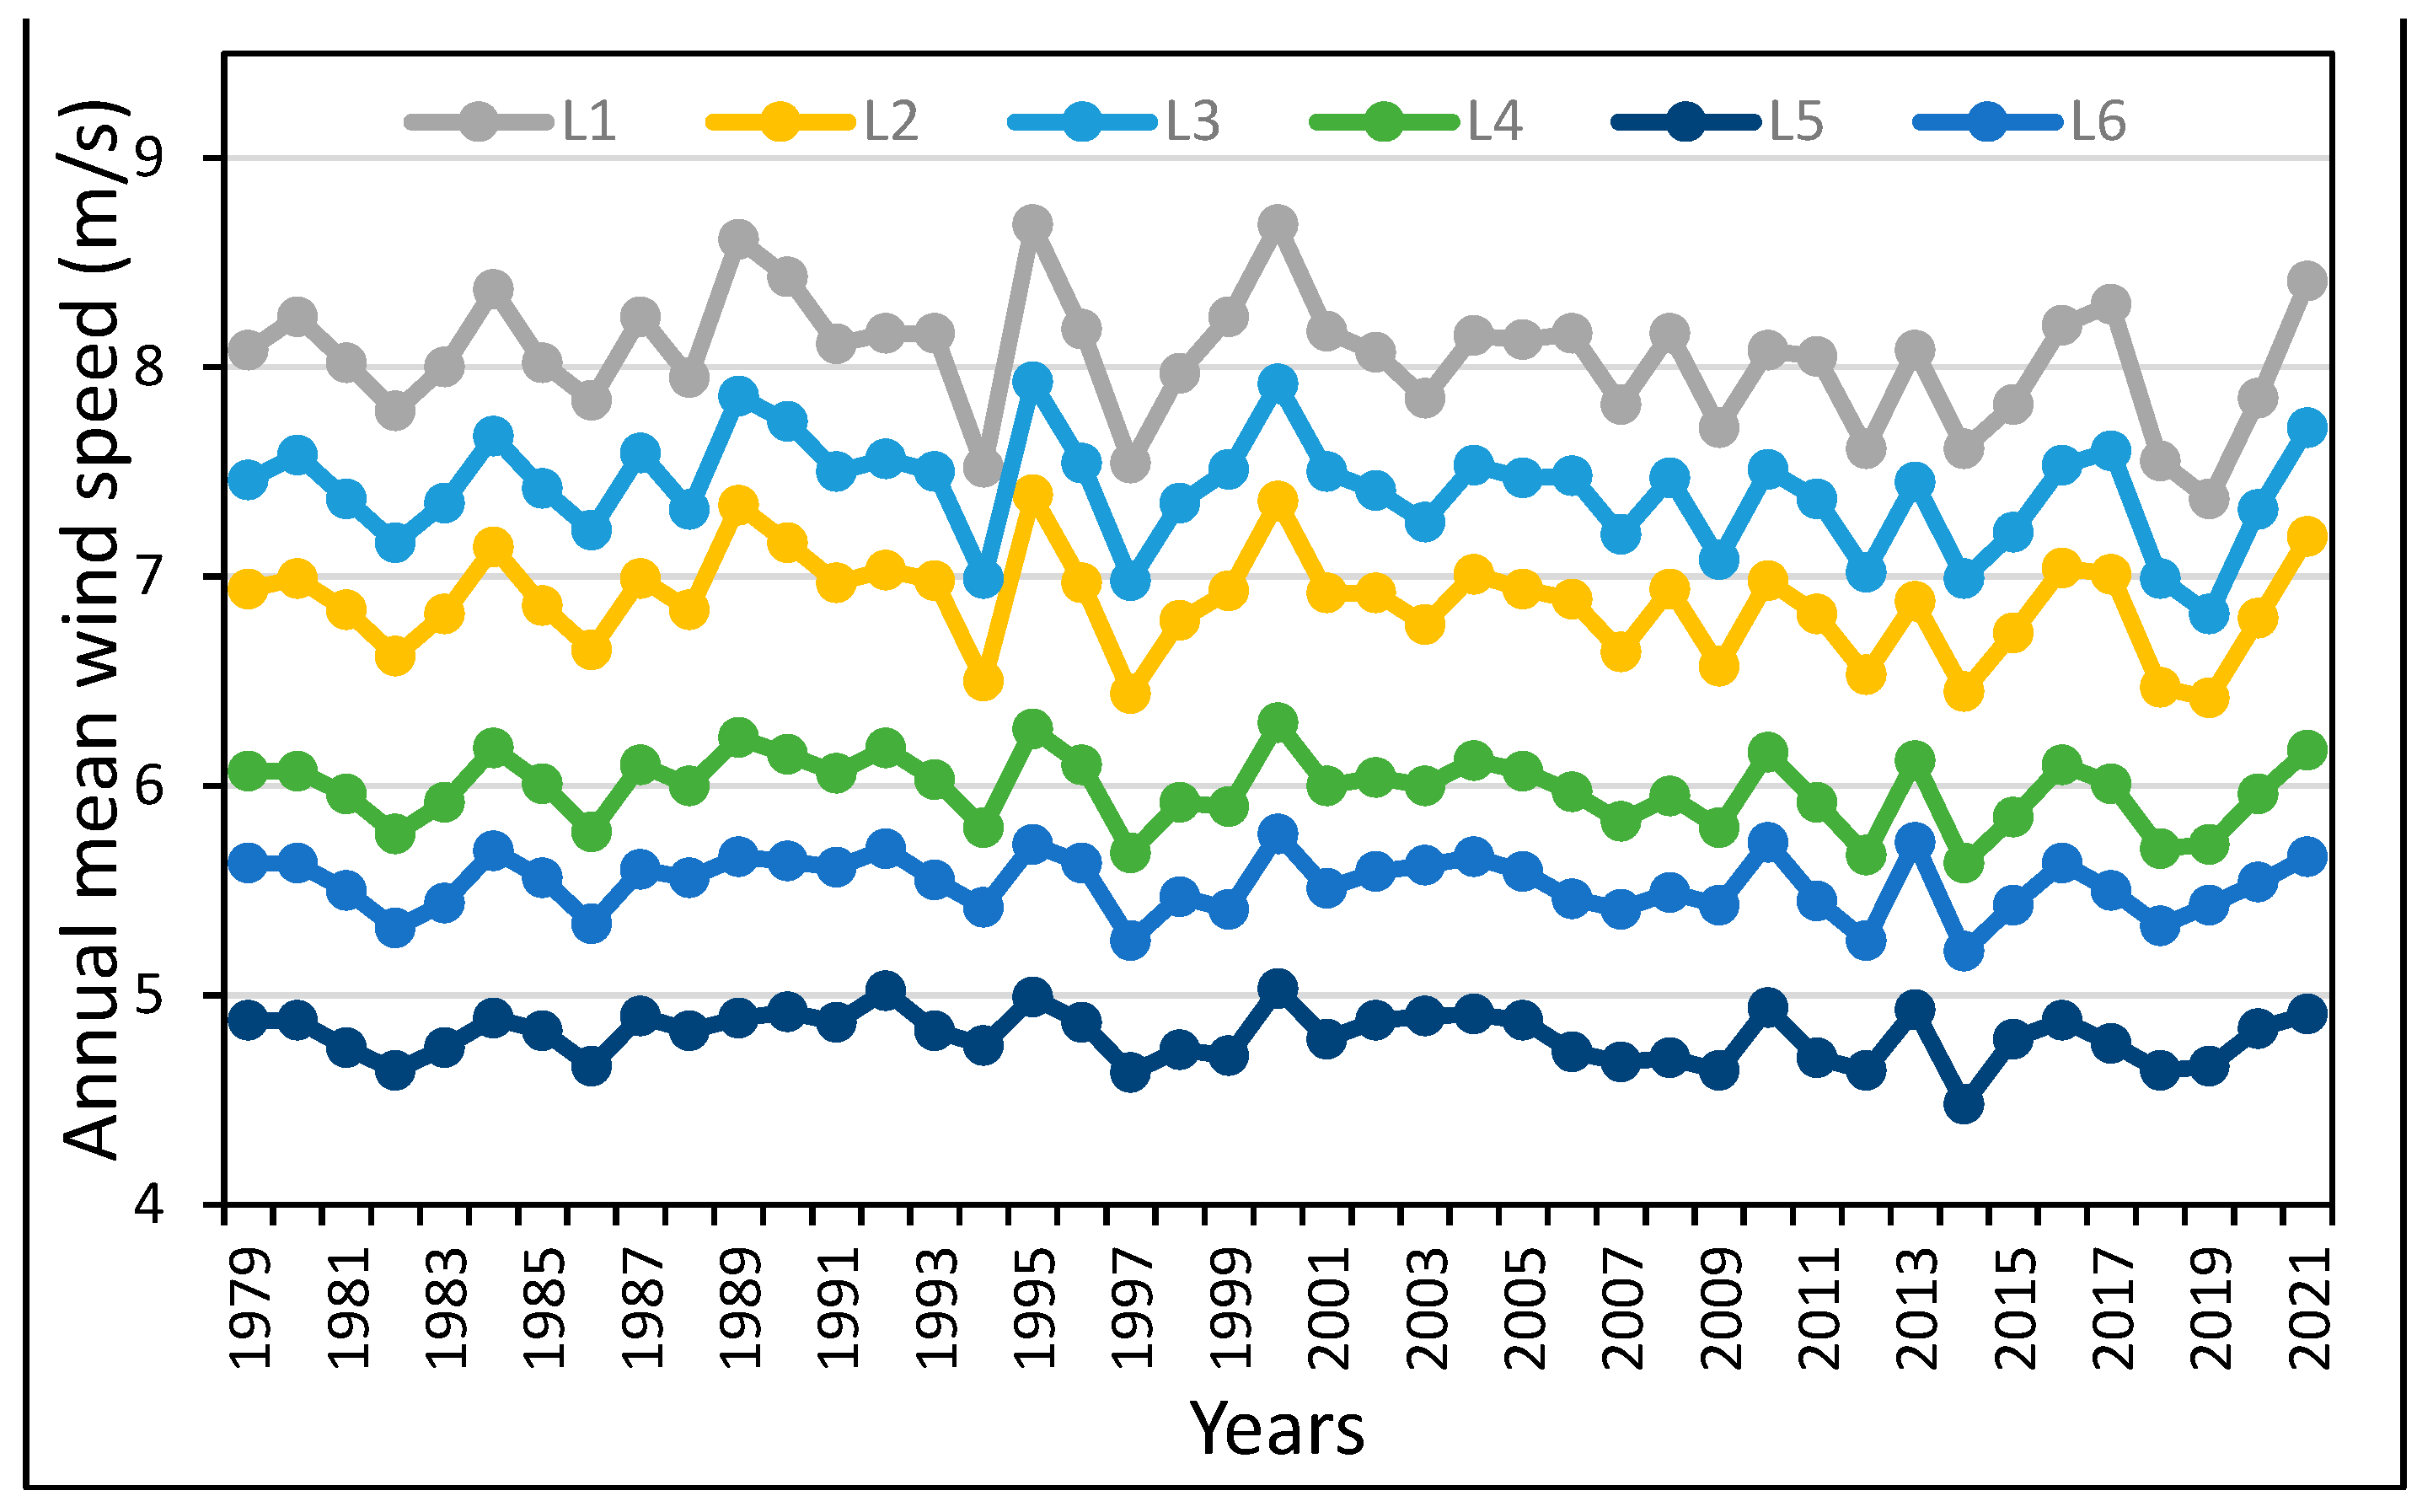
Figure 5.
Annual trends of WPD (1979-2021).
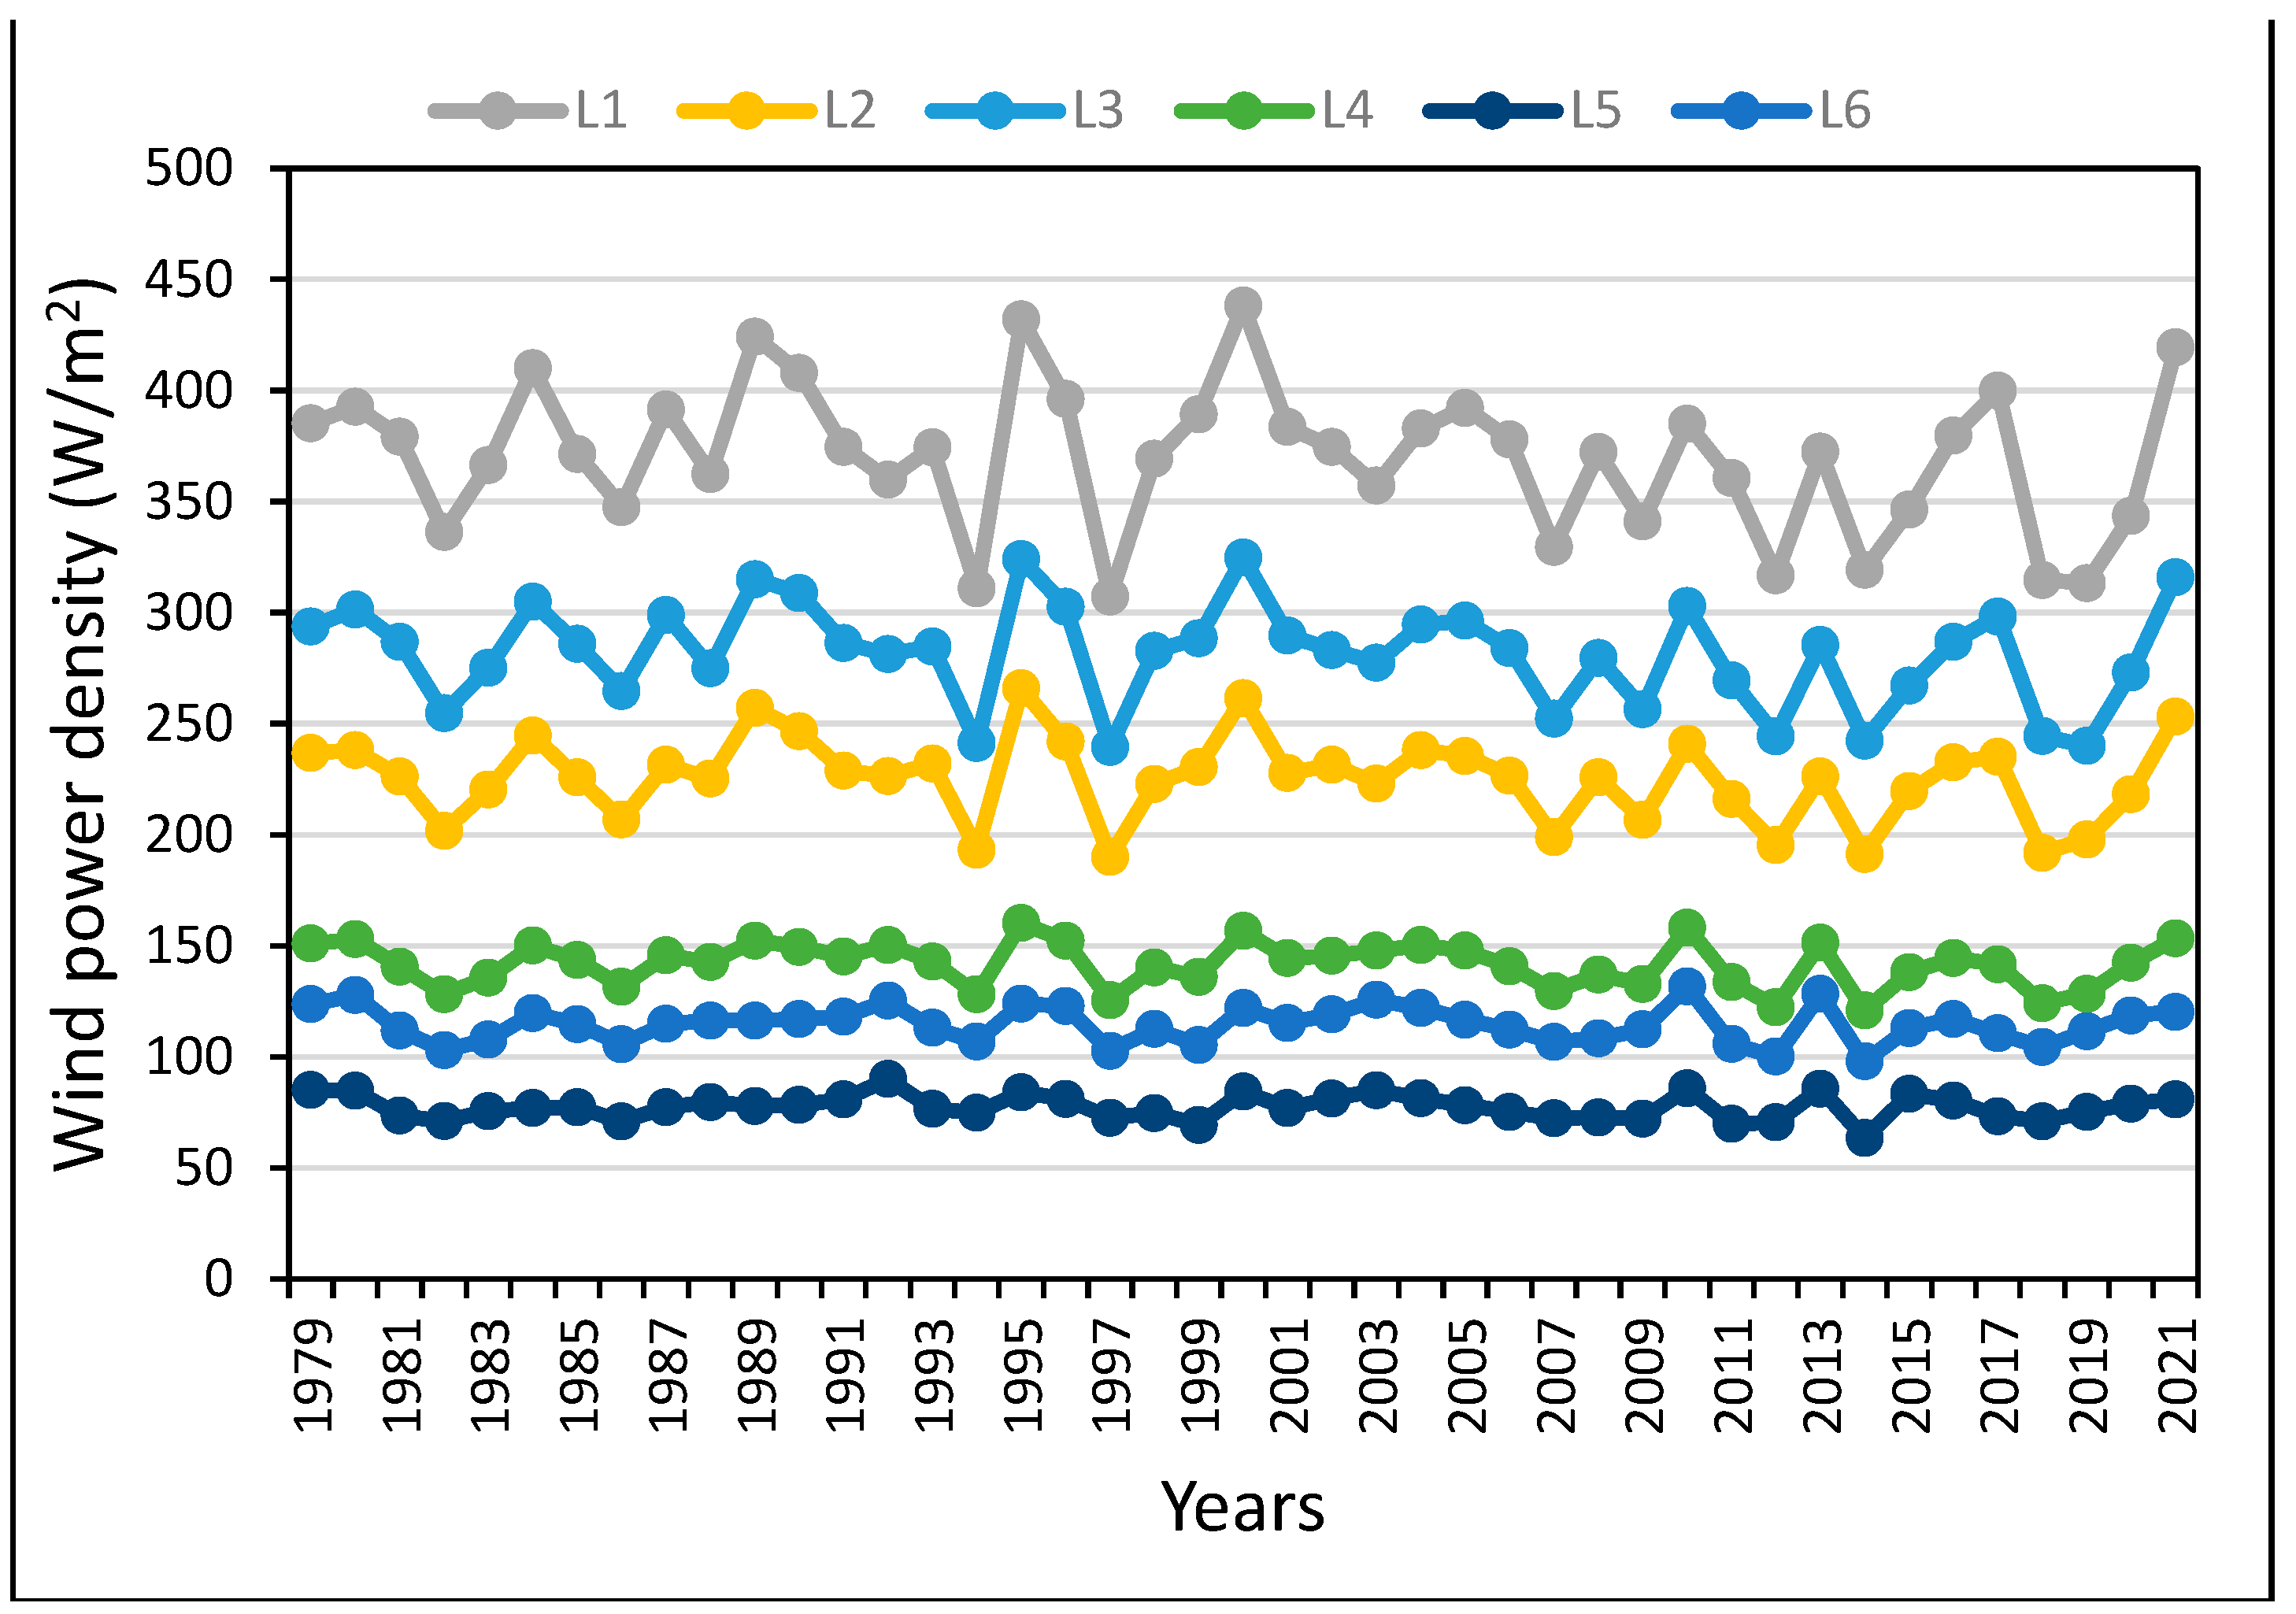
Figure 6.
Monthly mean variation of WPD (1979-2021).
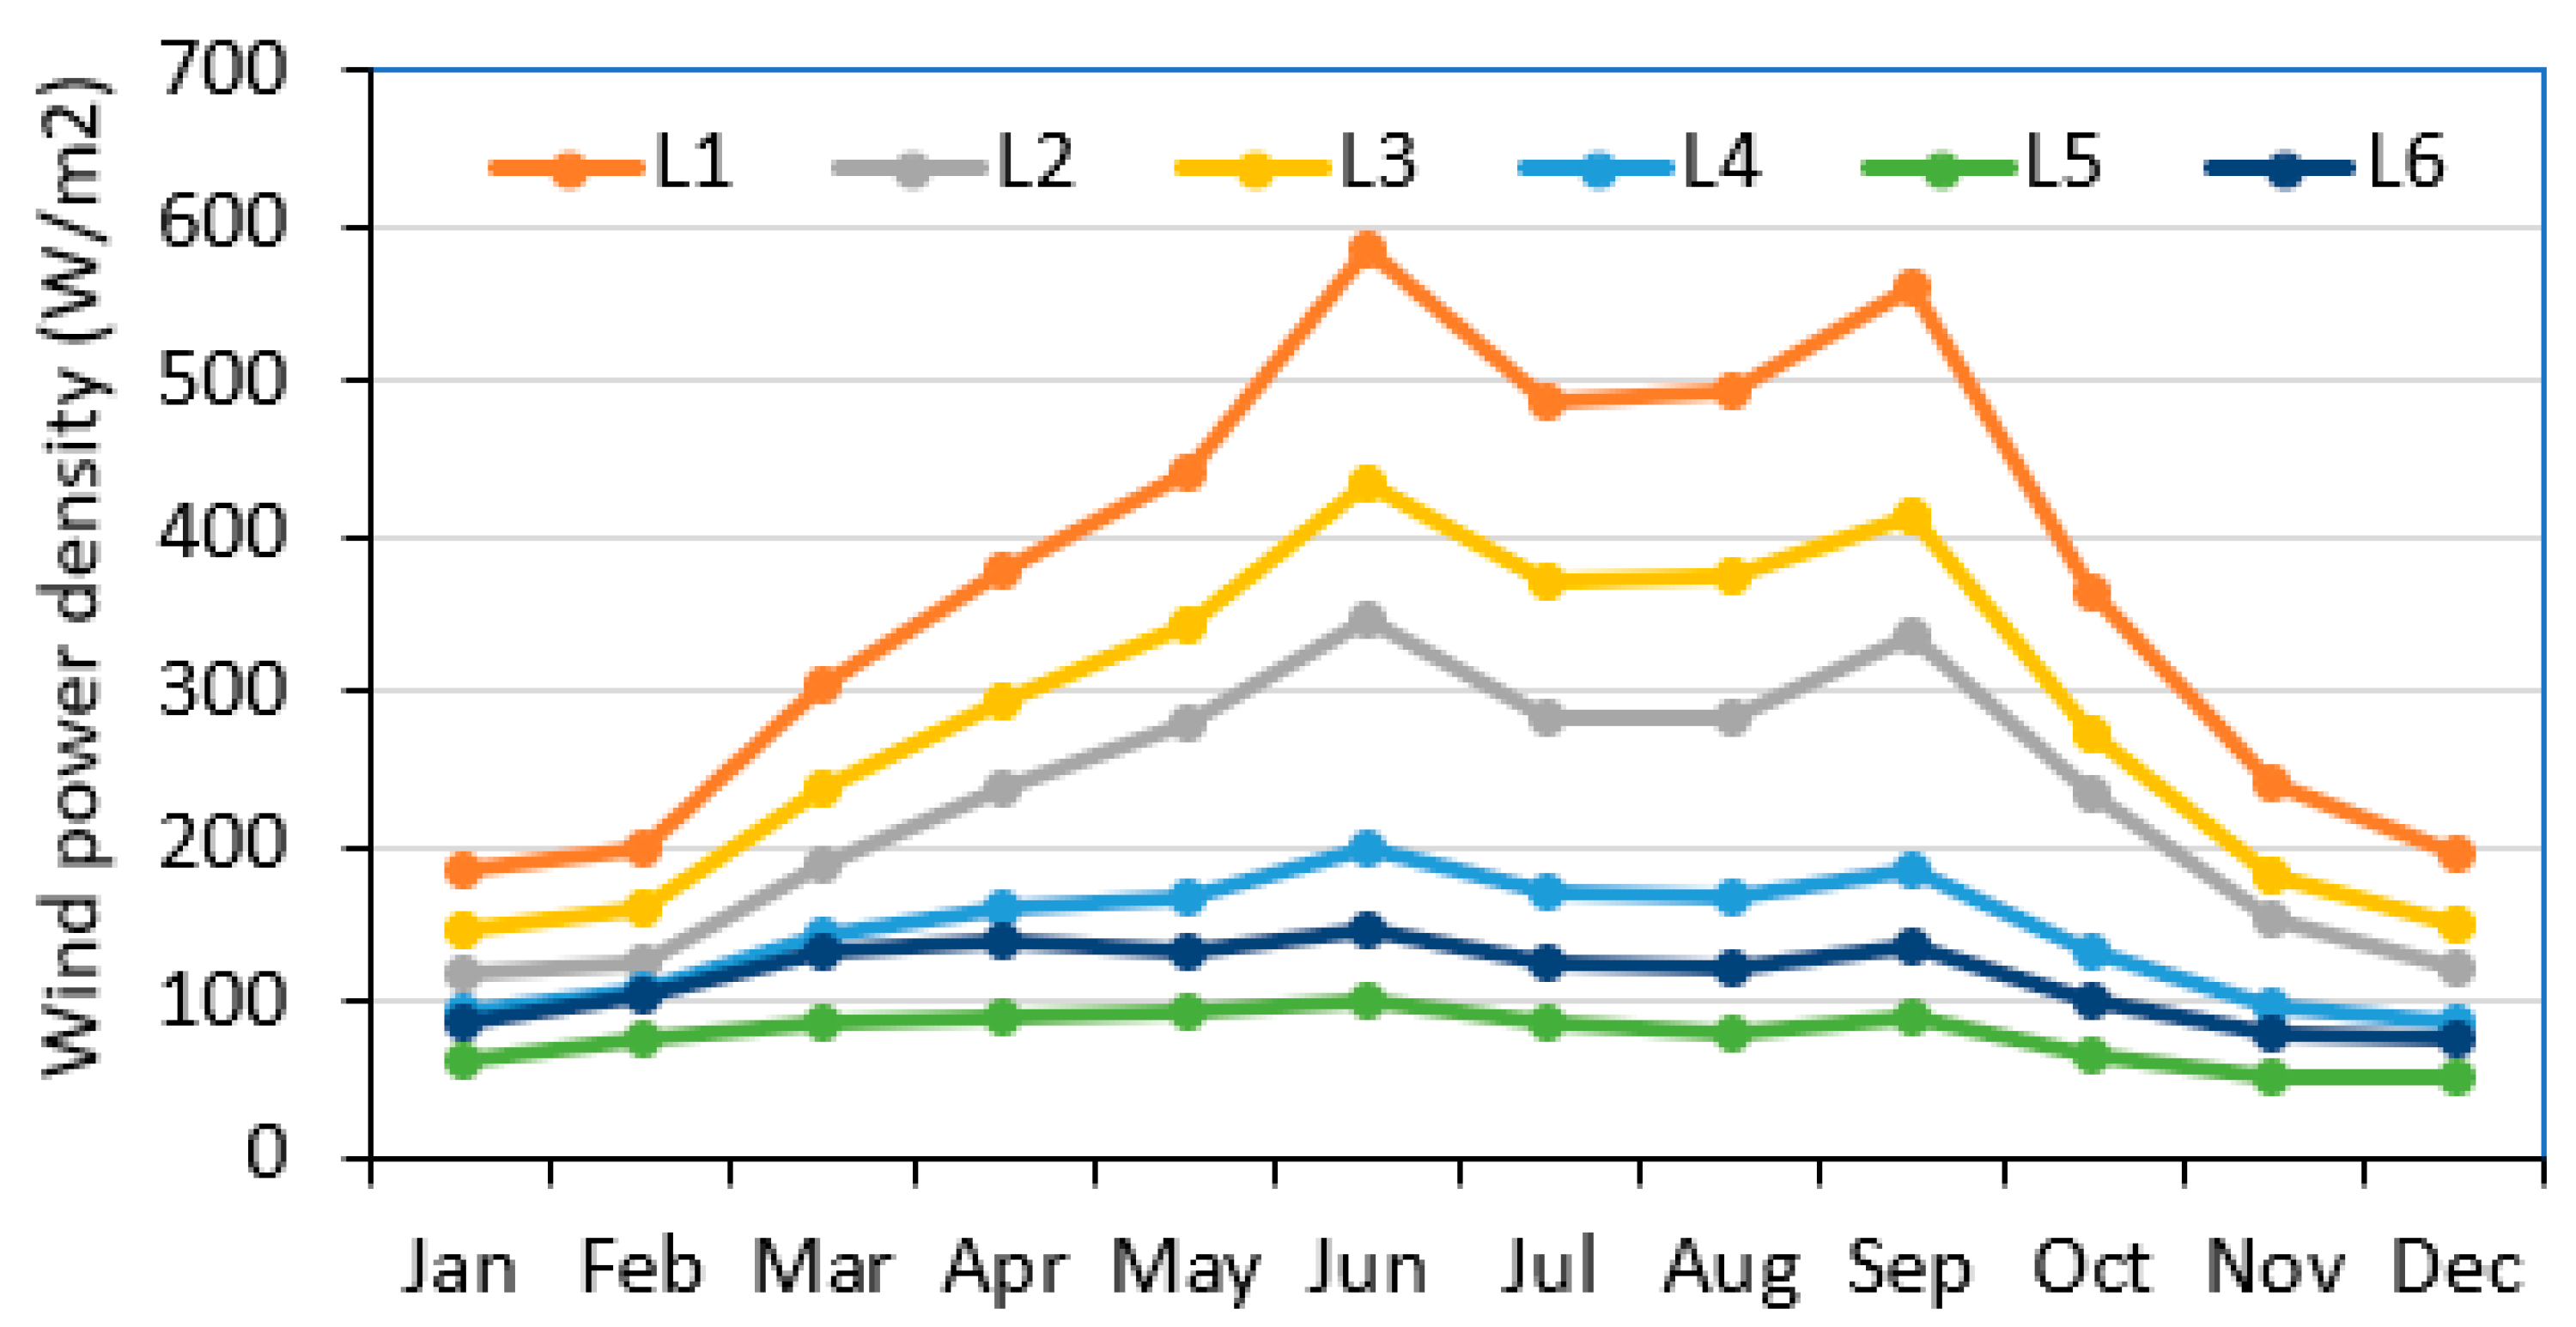
Figure 7.
Diurnal variation of mean WS (1979-2021).
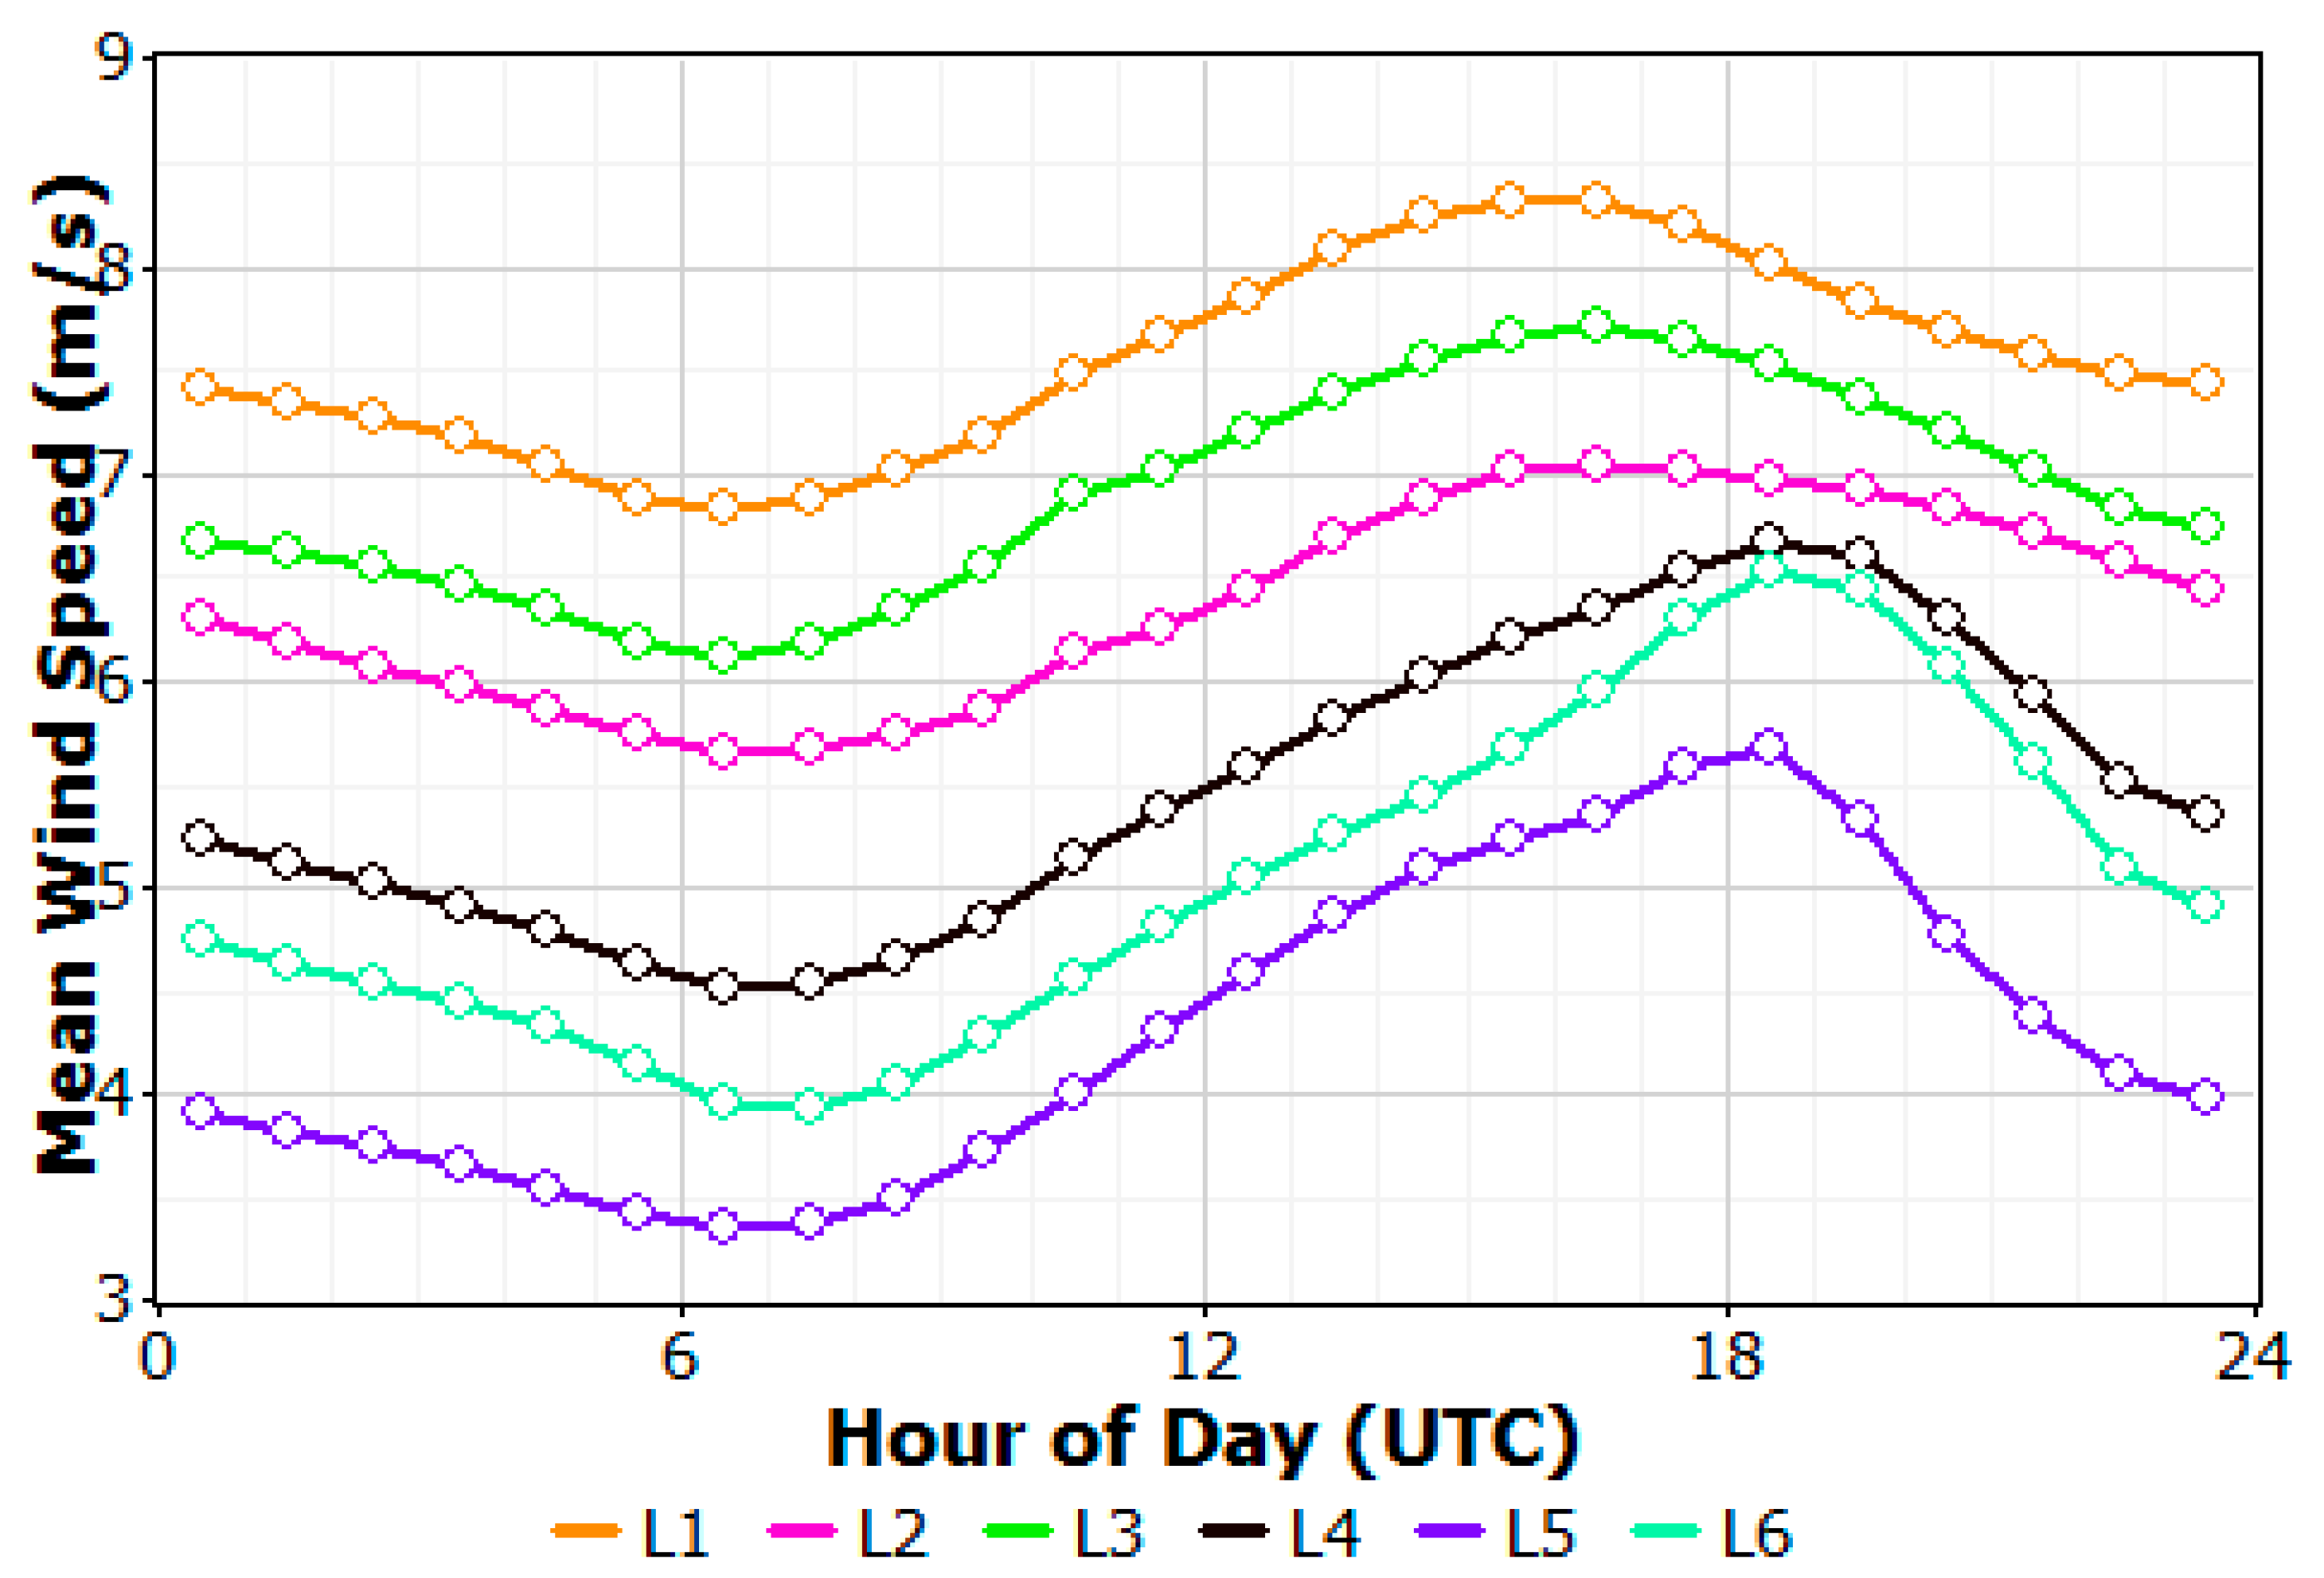
Figure 8.
Diurnal variation of WPD (1979-2021).
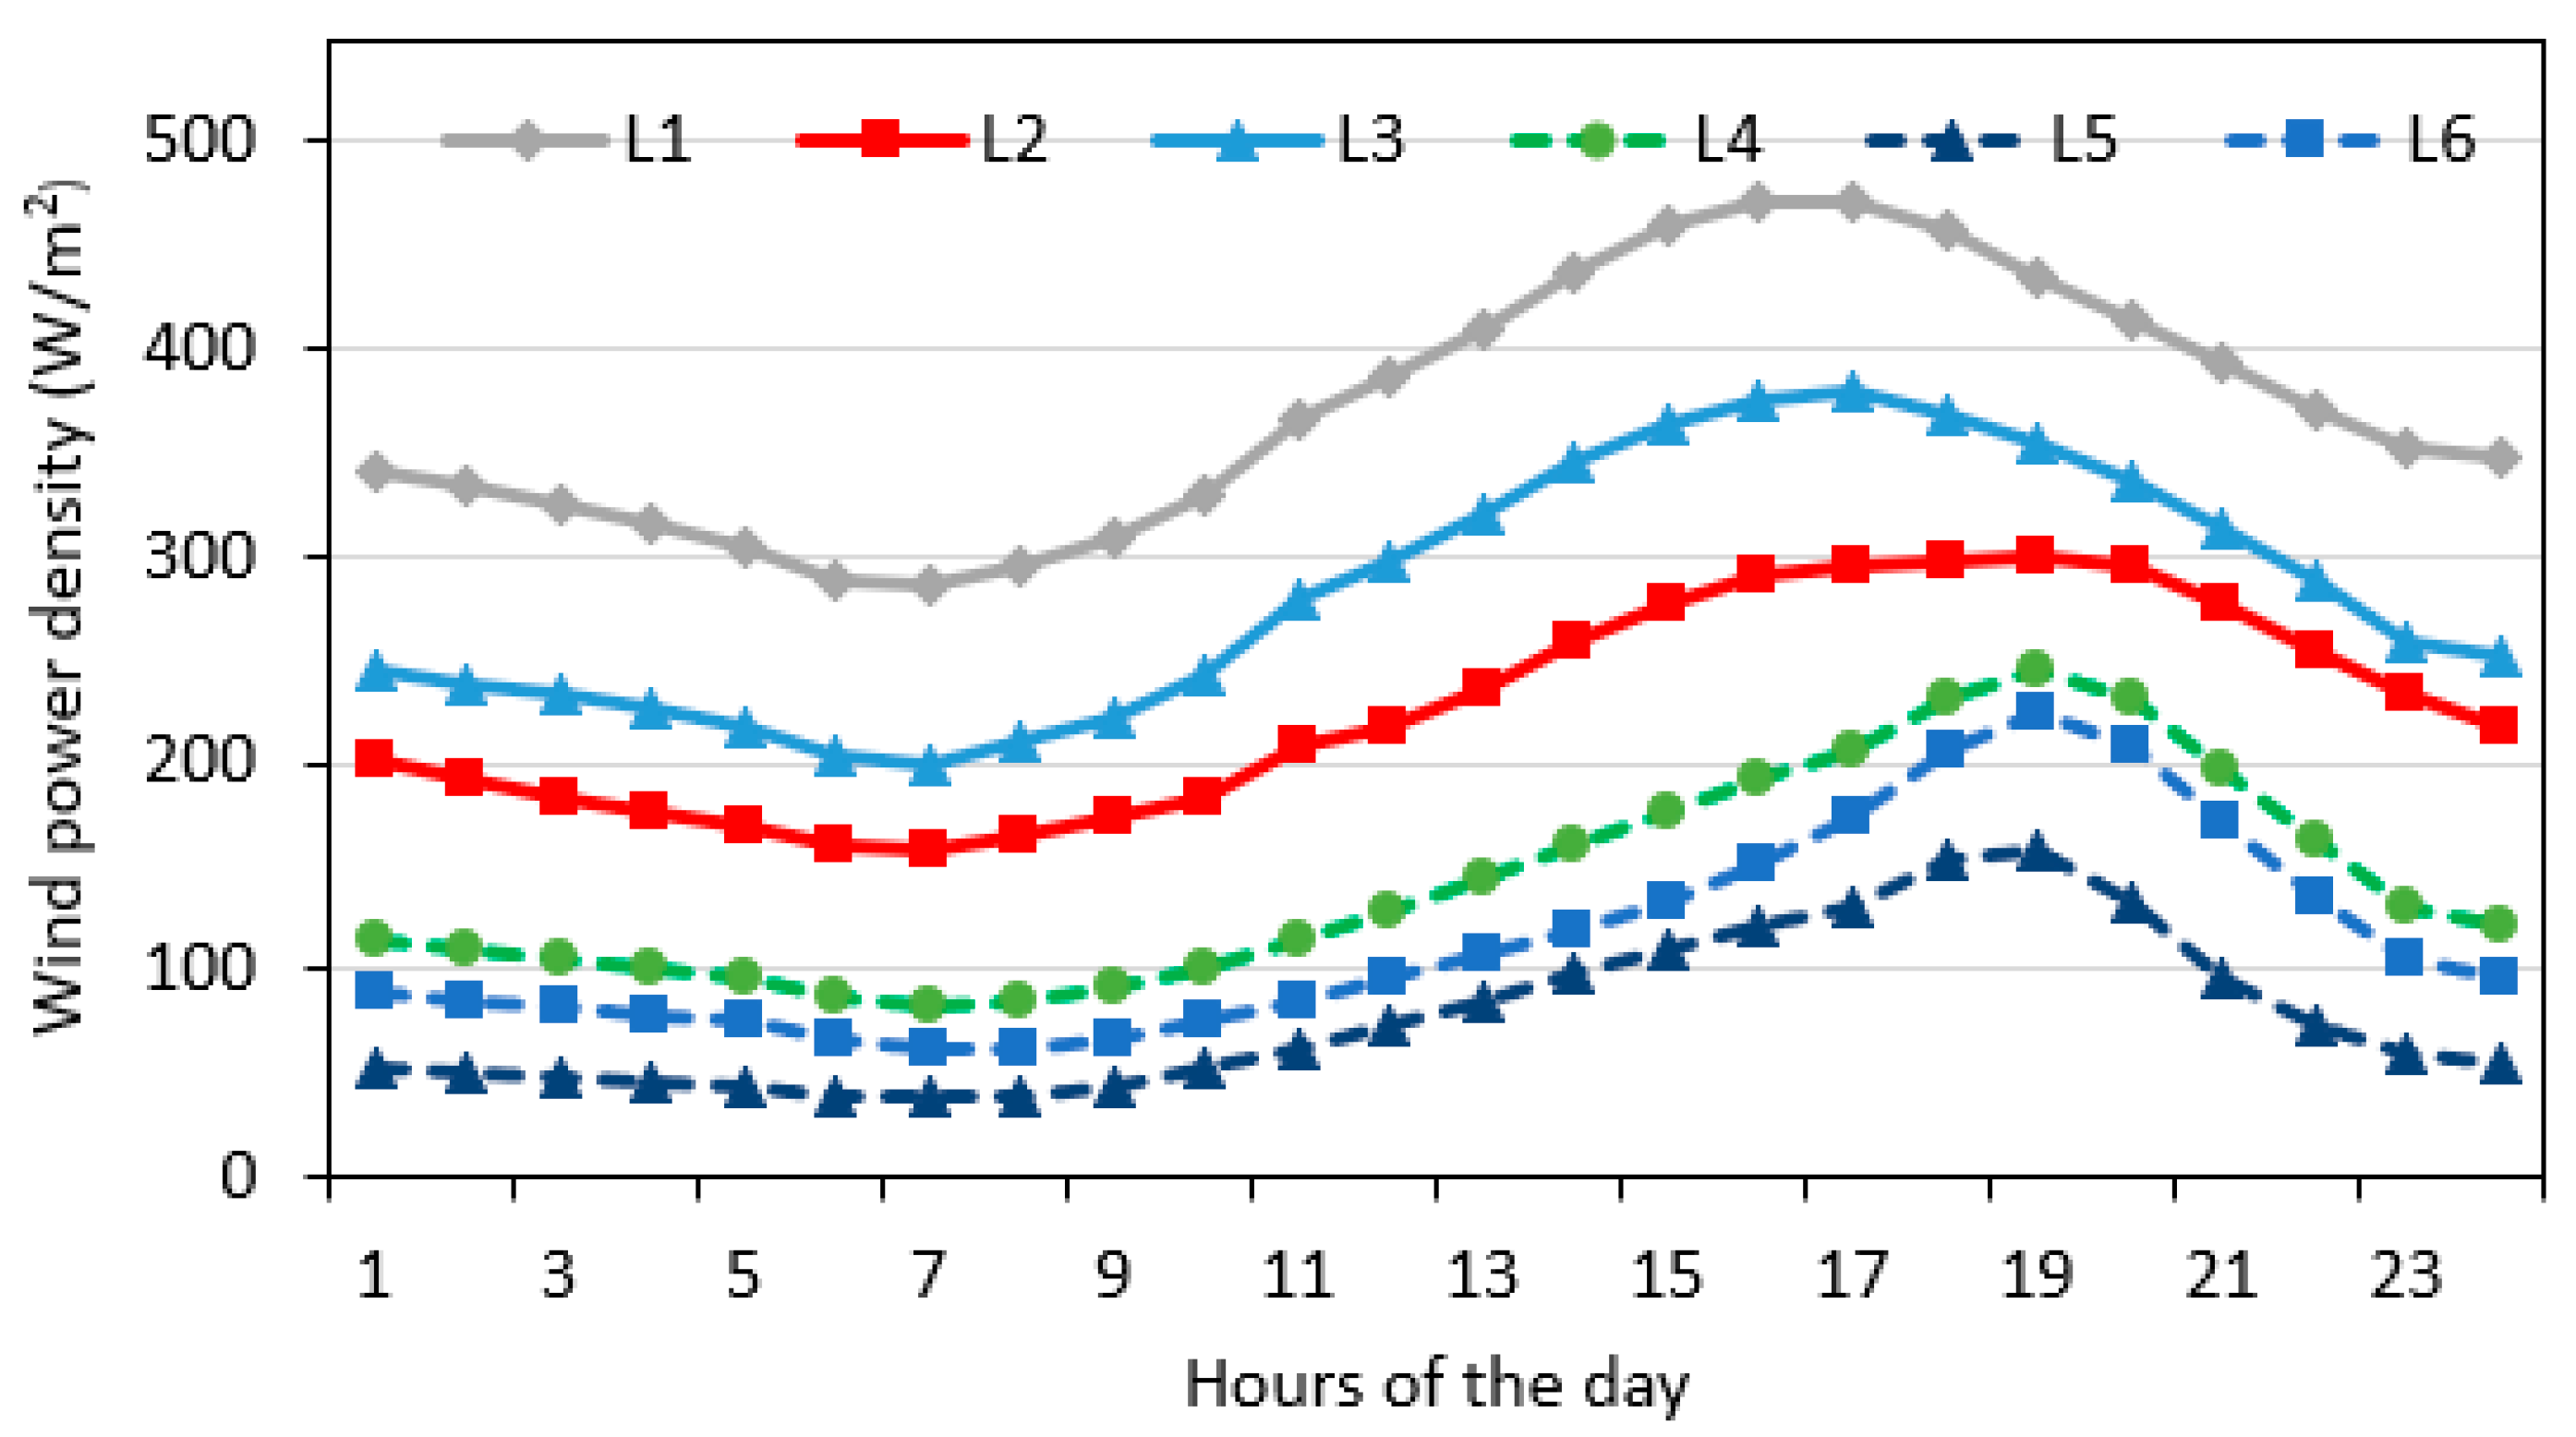
Figure 9.
Prevailing wind directions at the offshore sites under assessment.
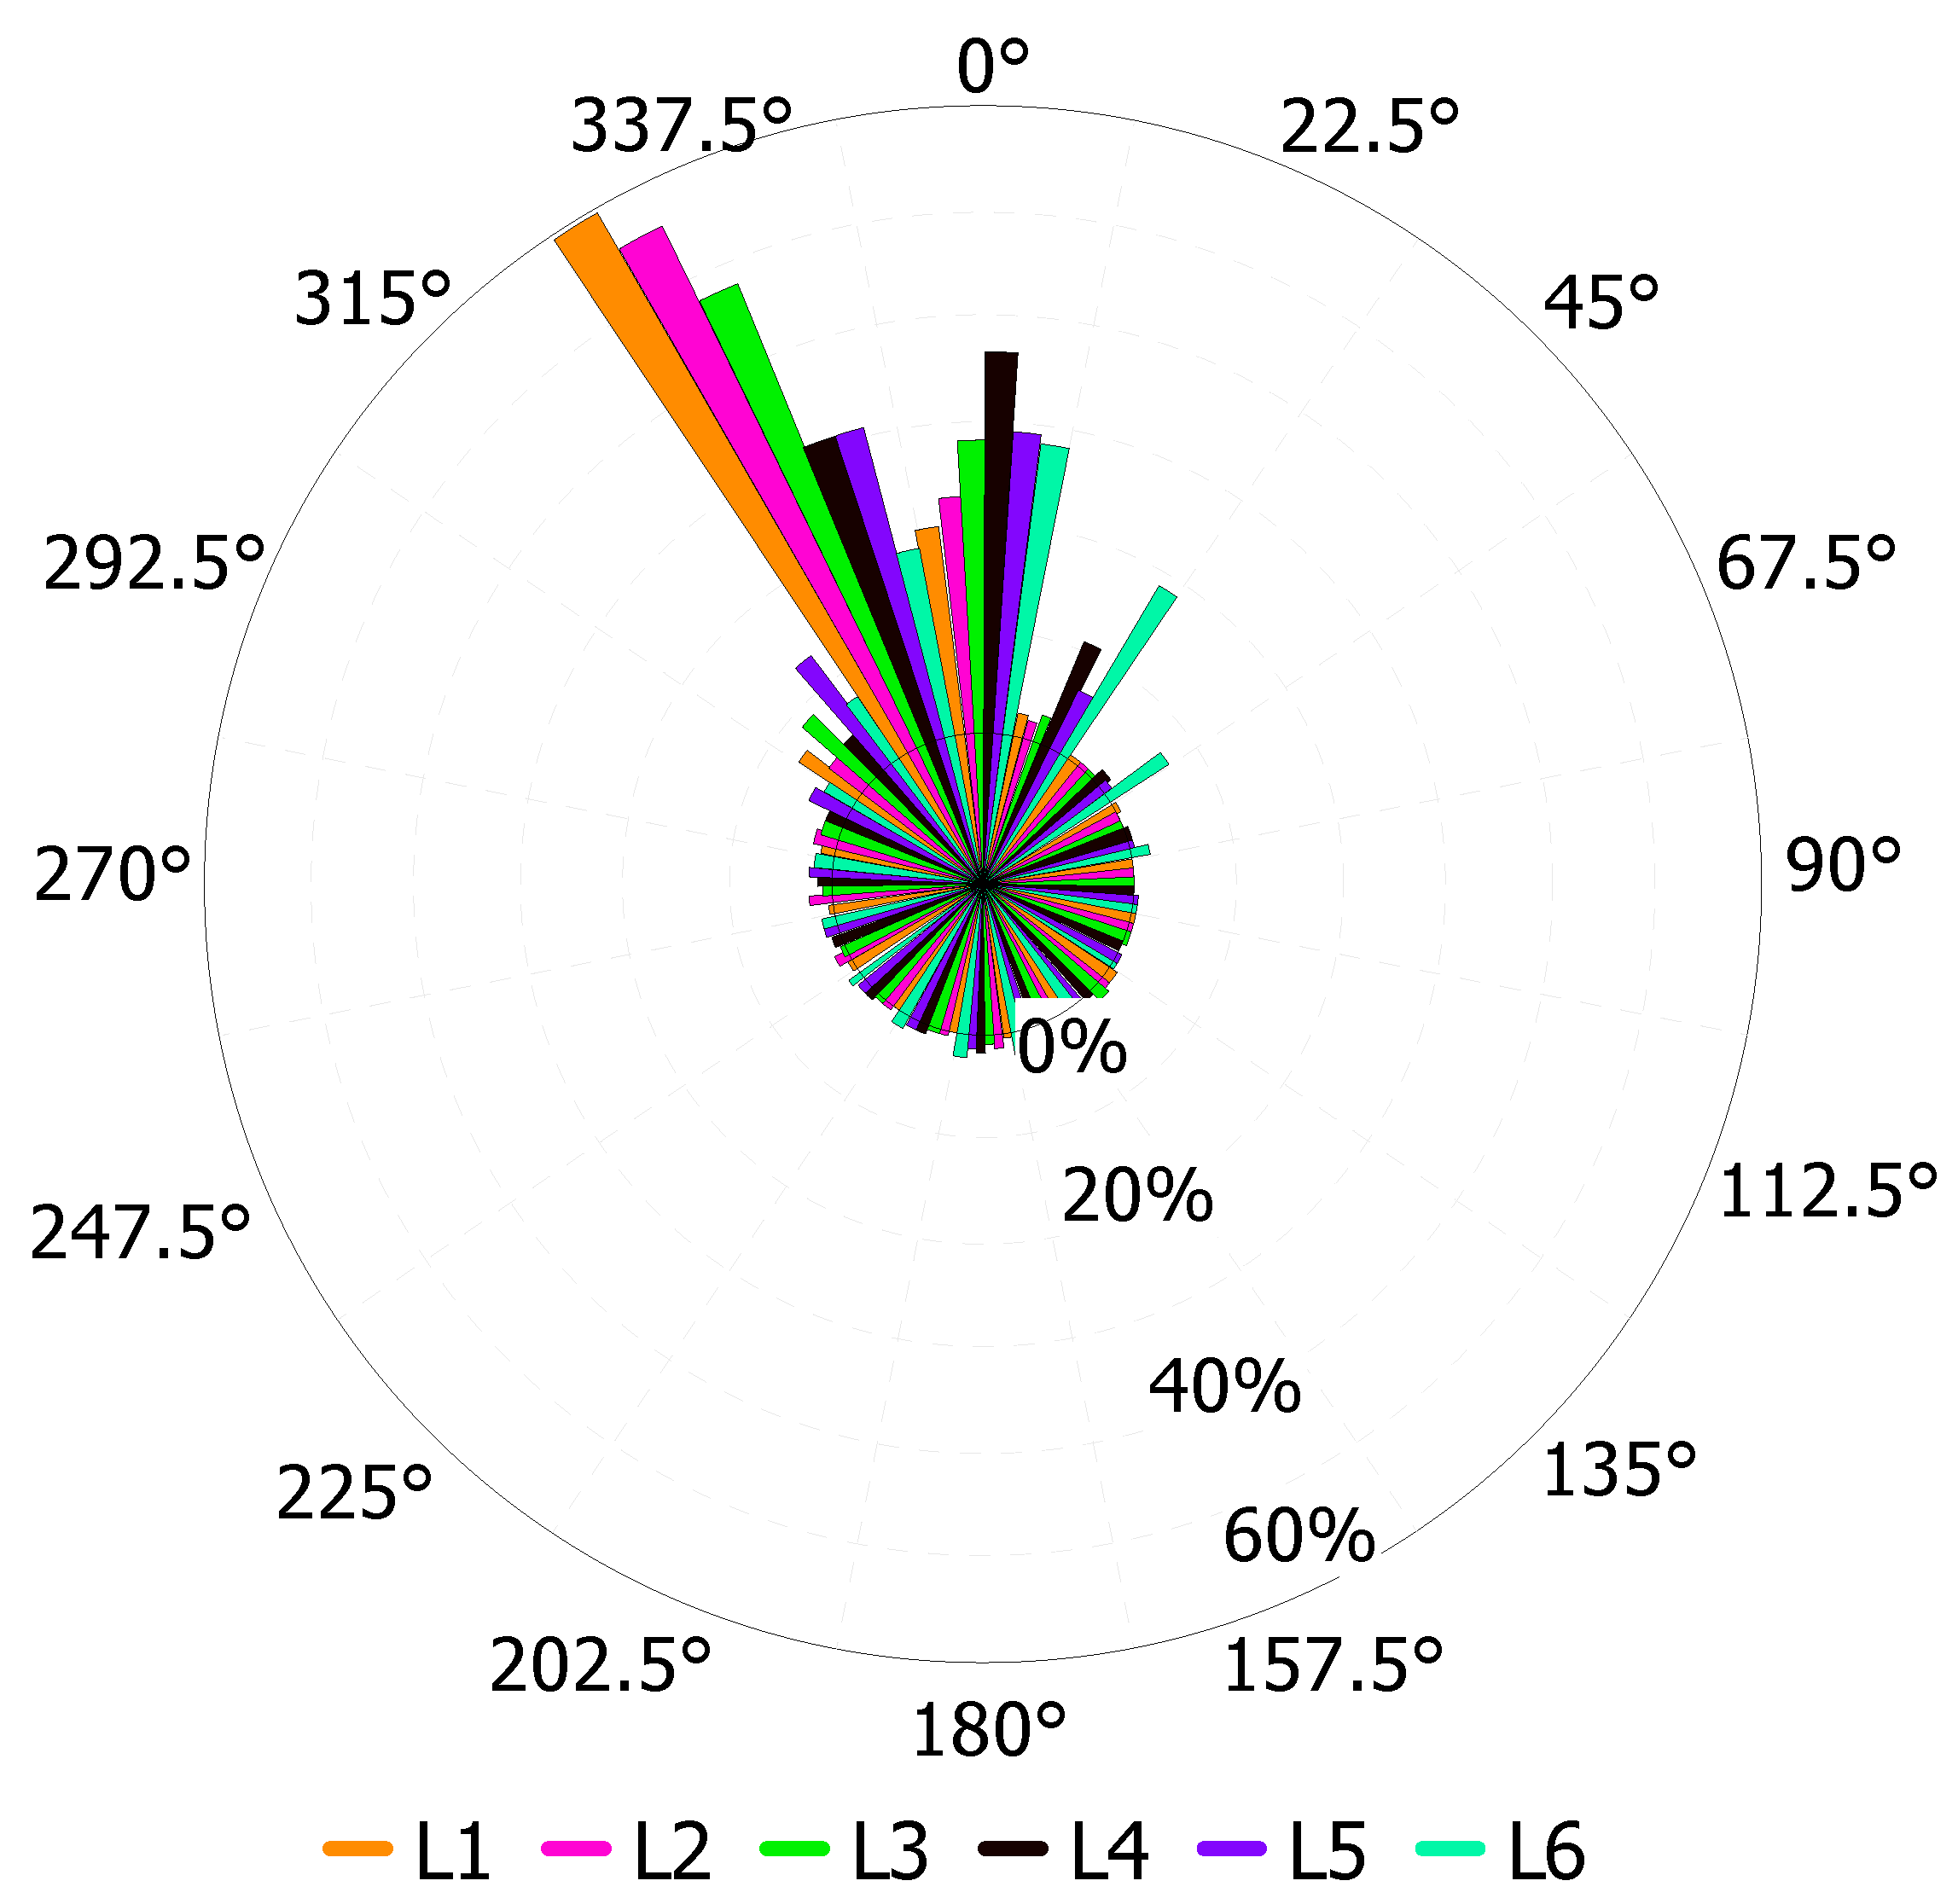
Figure 10.
Weibull fit distributions (a) the worst and (b) the best case.
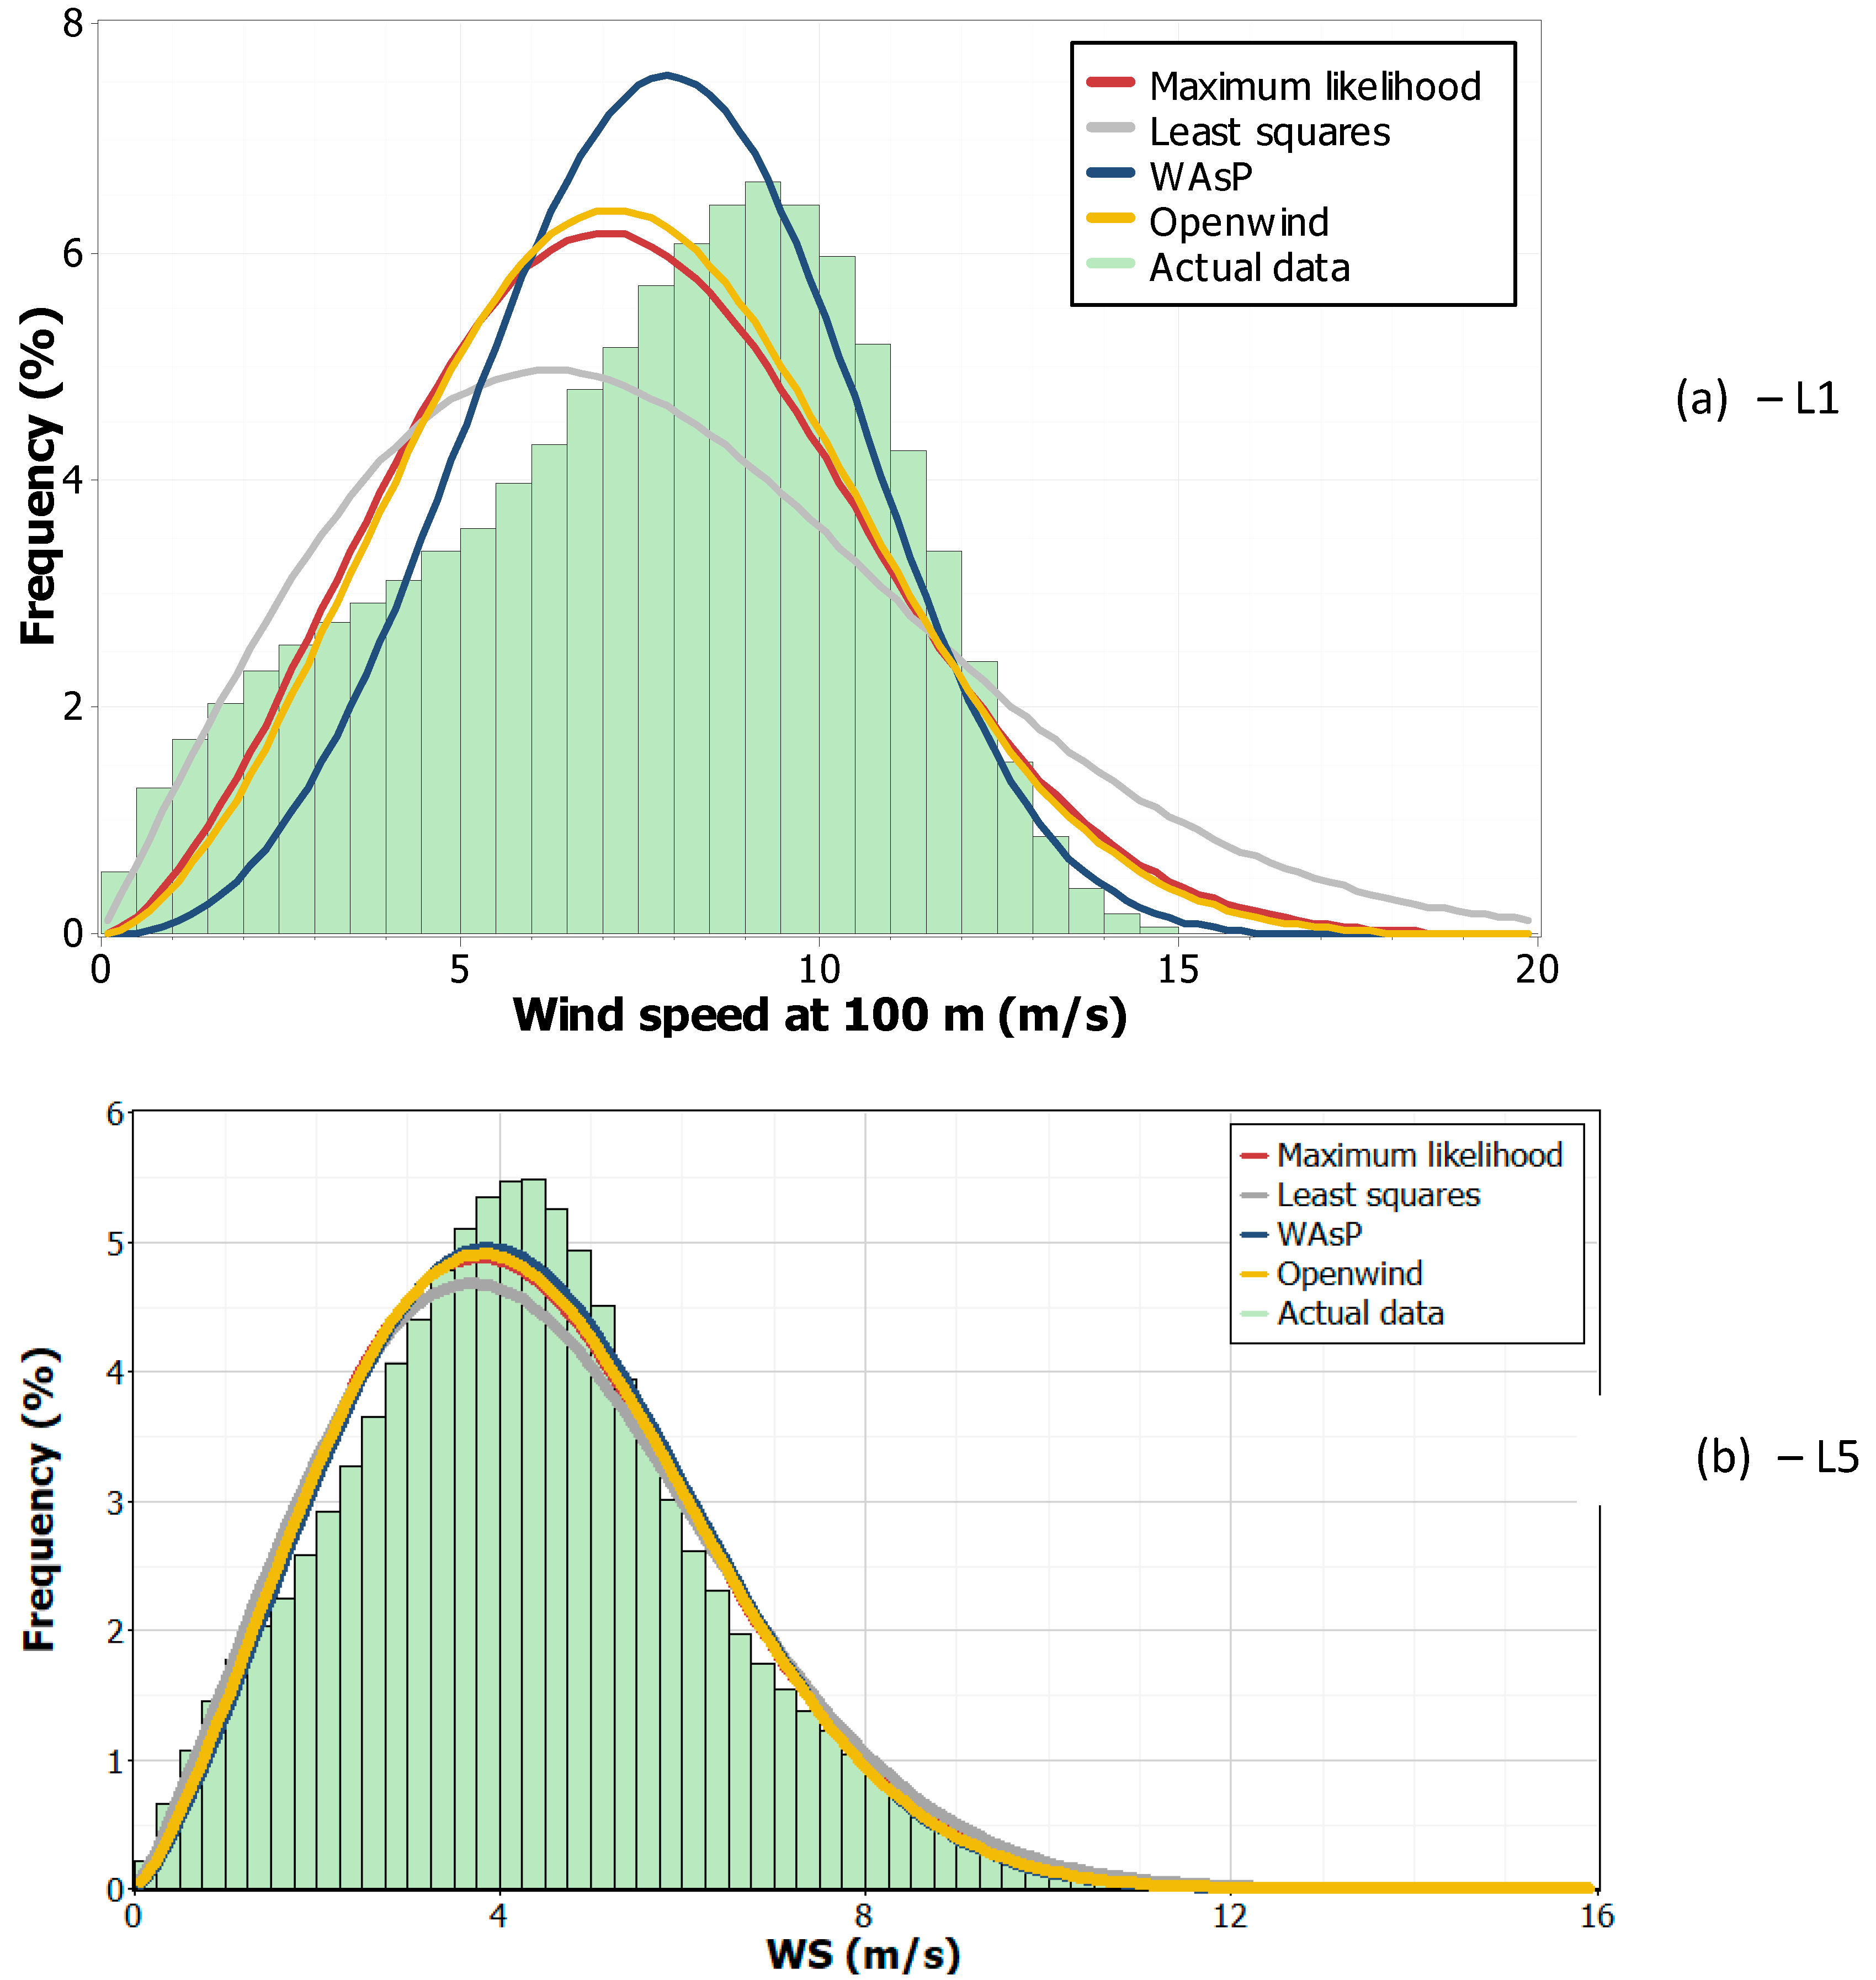
Figure 11.
Frequency distribution at the offshore locations under assessment.
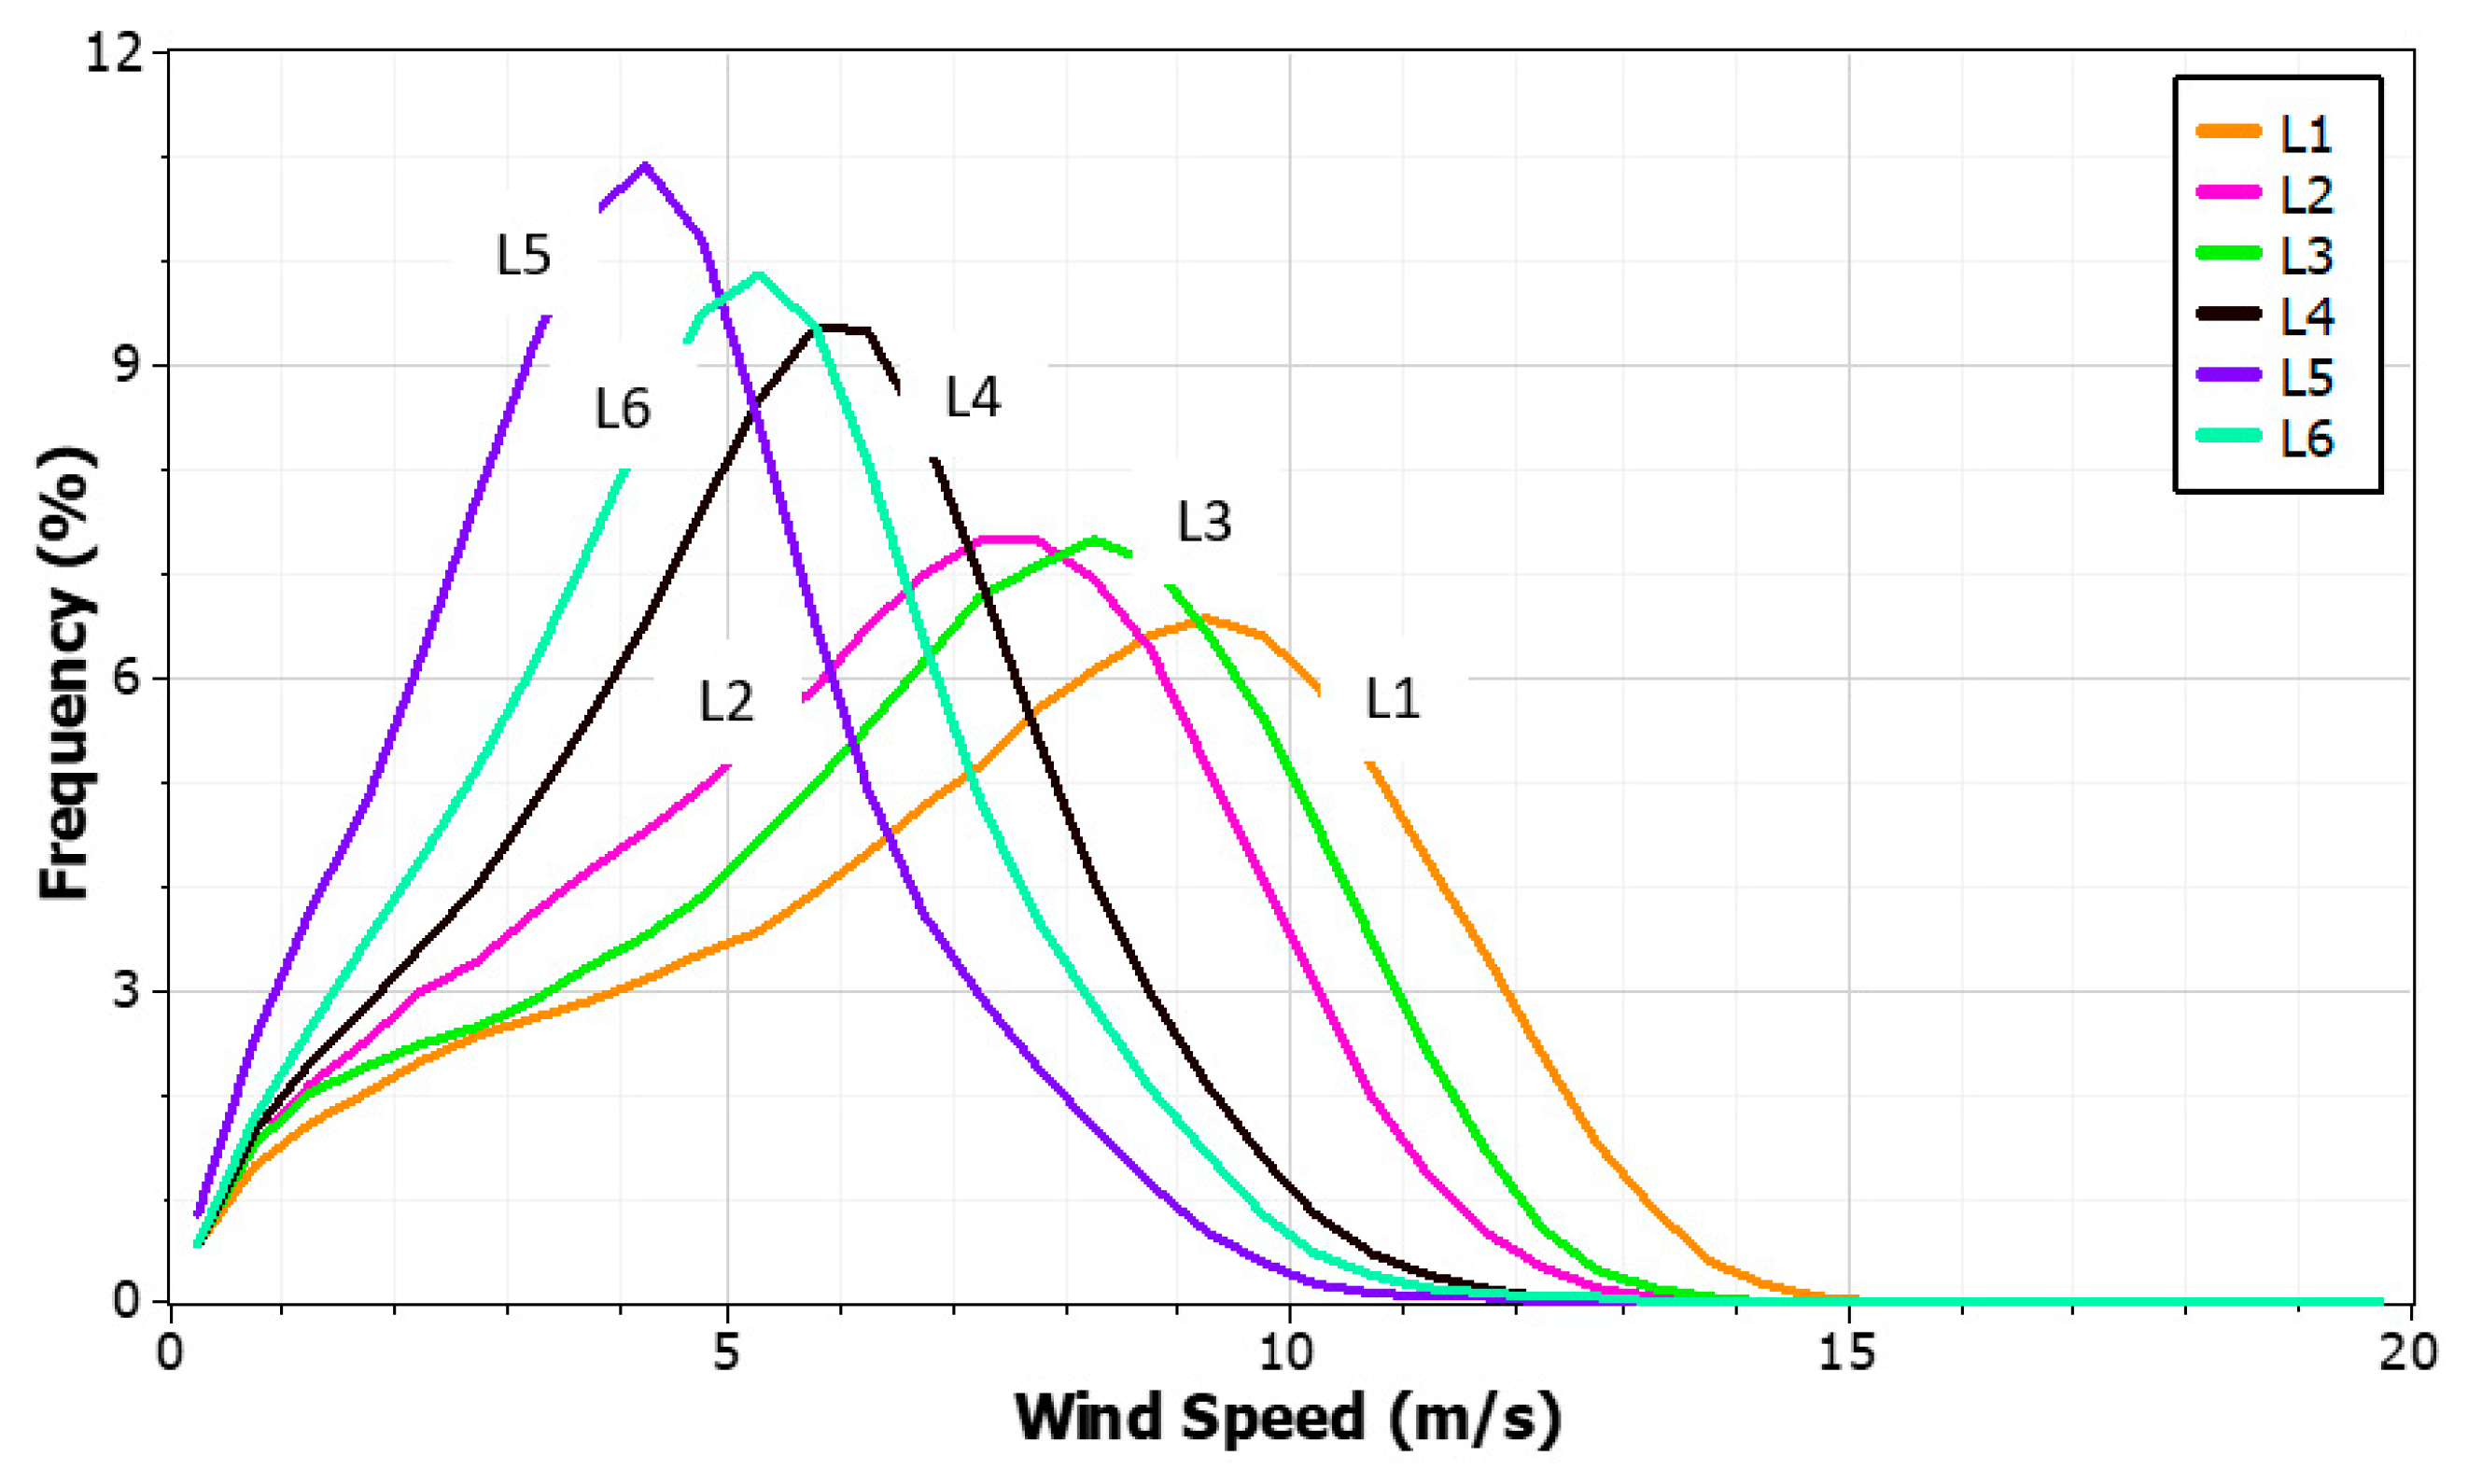
Figure 12.
Monthly (MWVI) and annual (AWVI) wind variability indices.
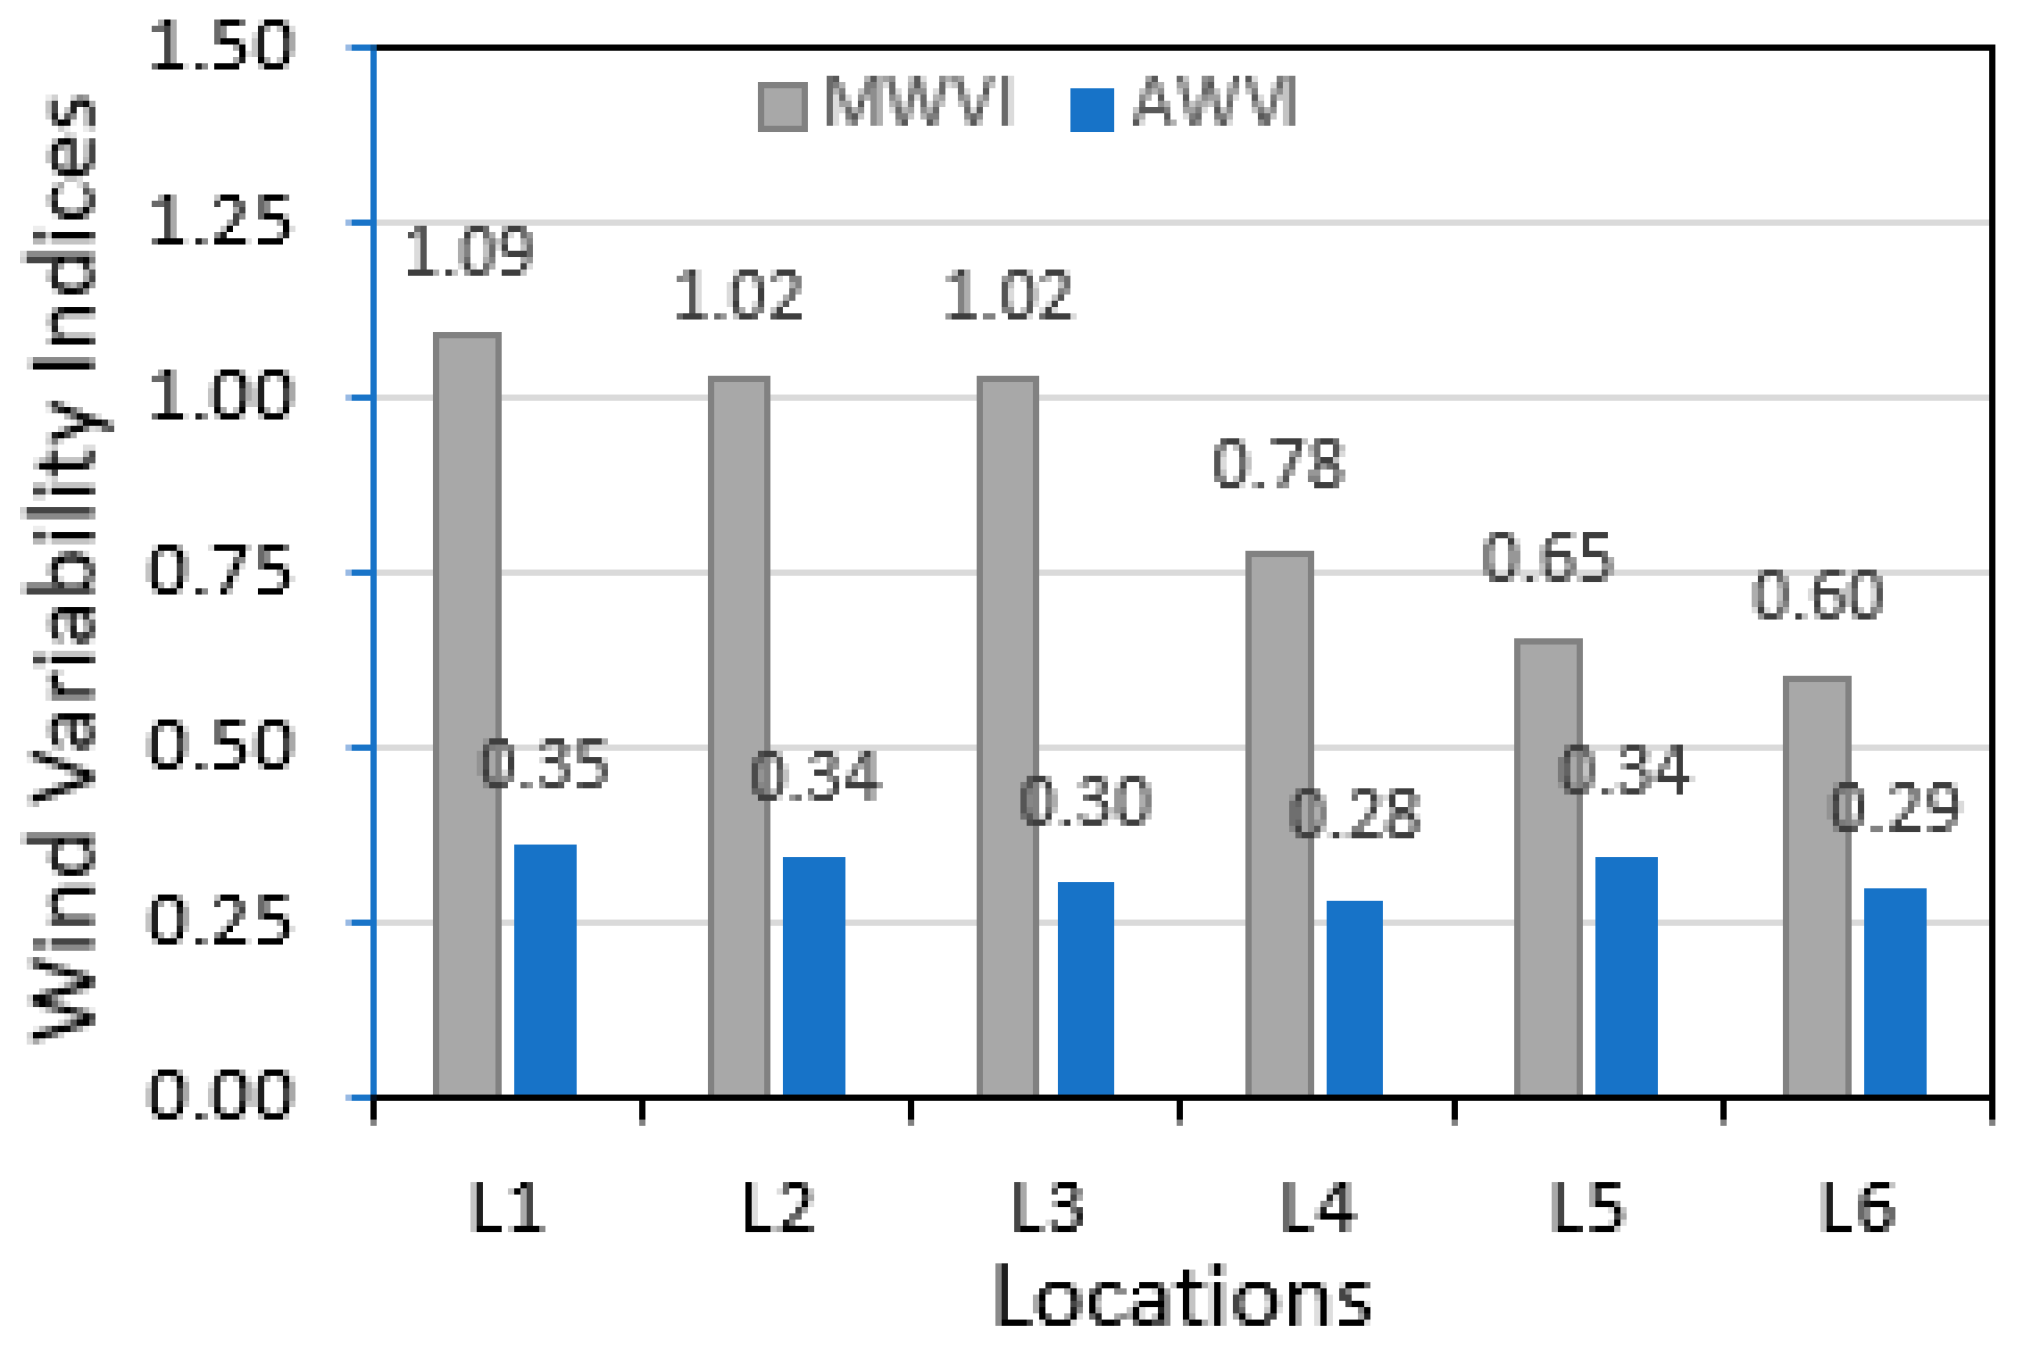
Figure 13.
Monthly (MWSI) and annual (AWSI) windy site identification indices.
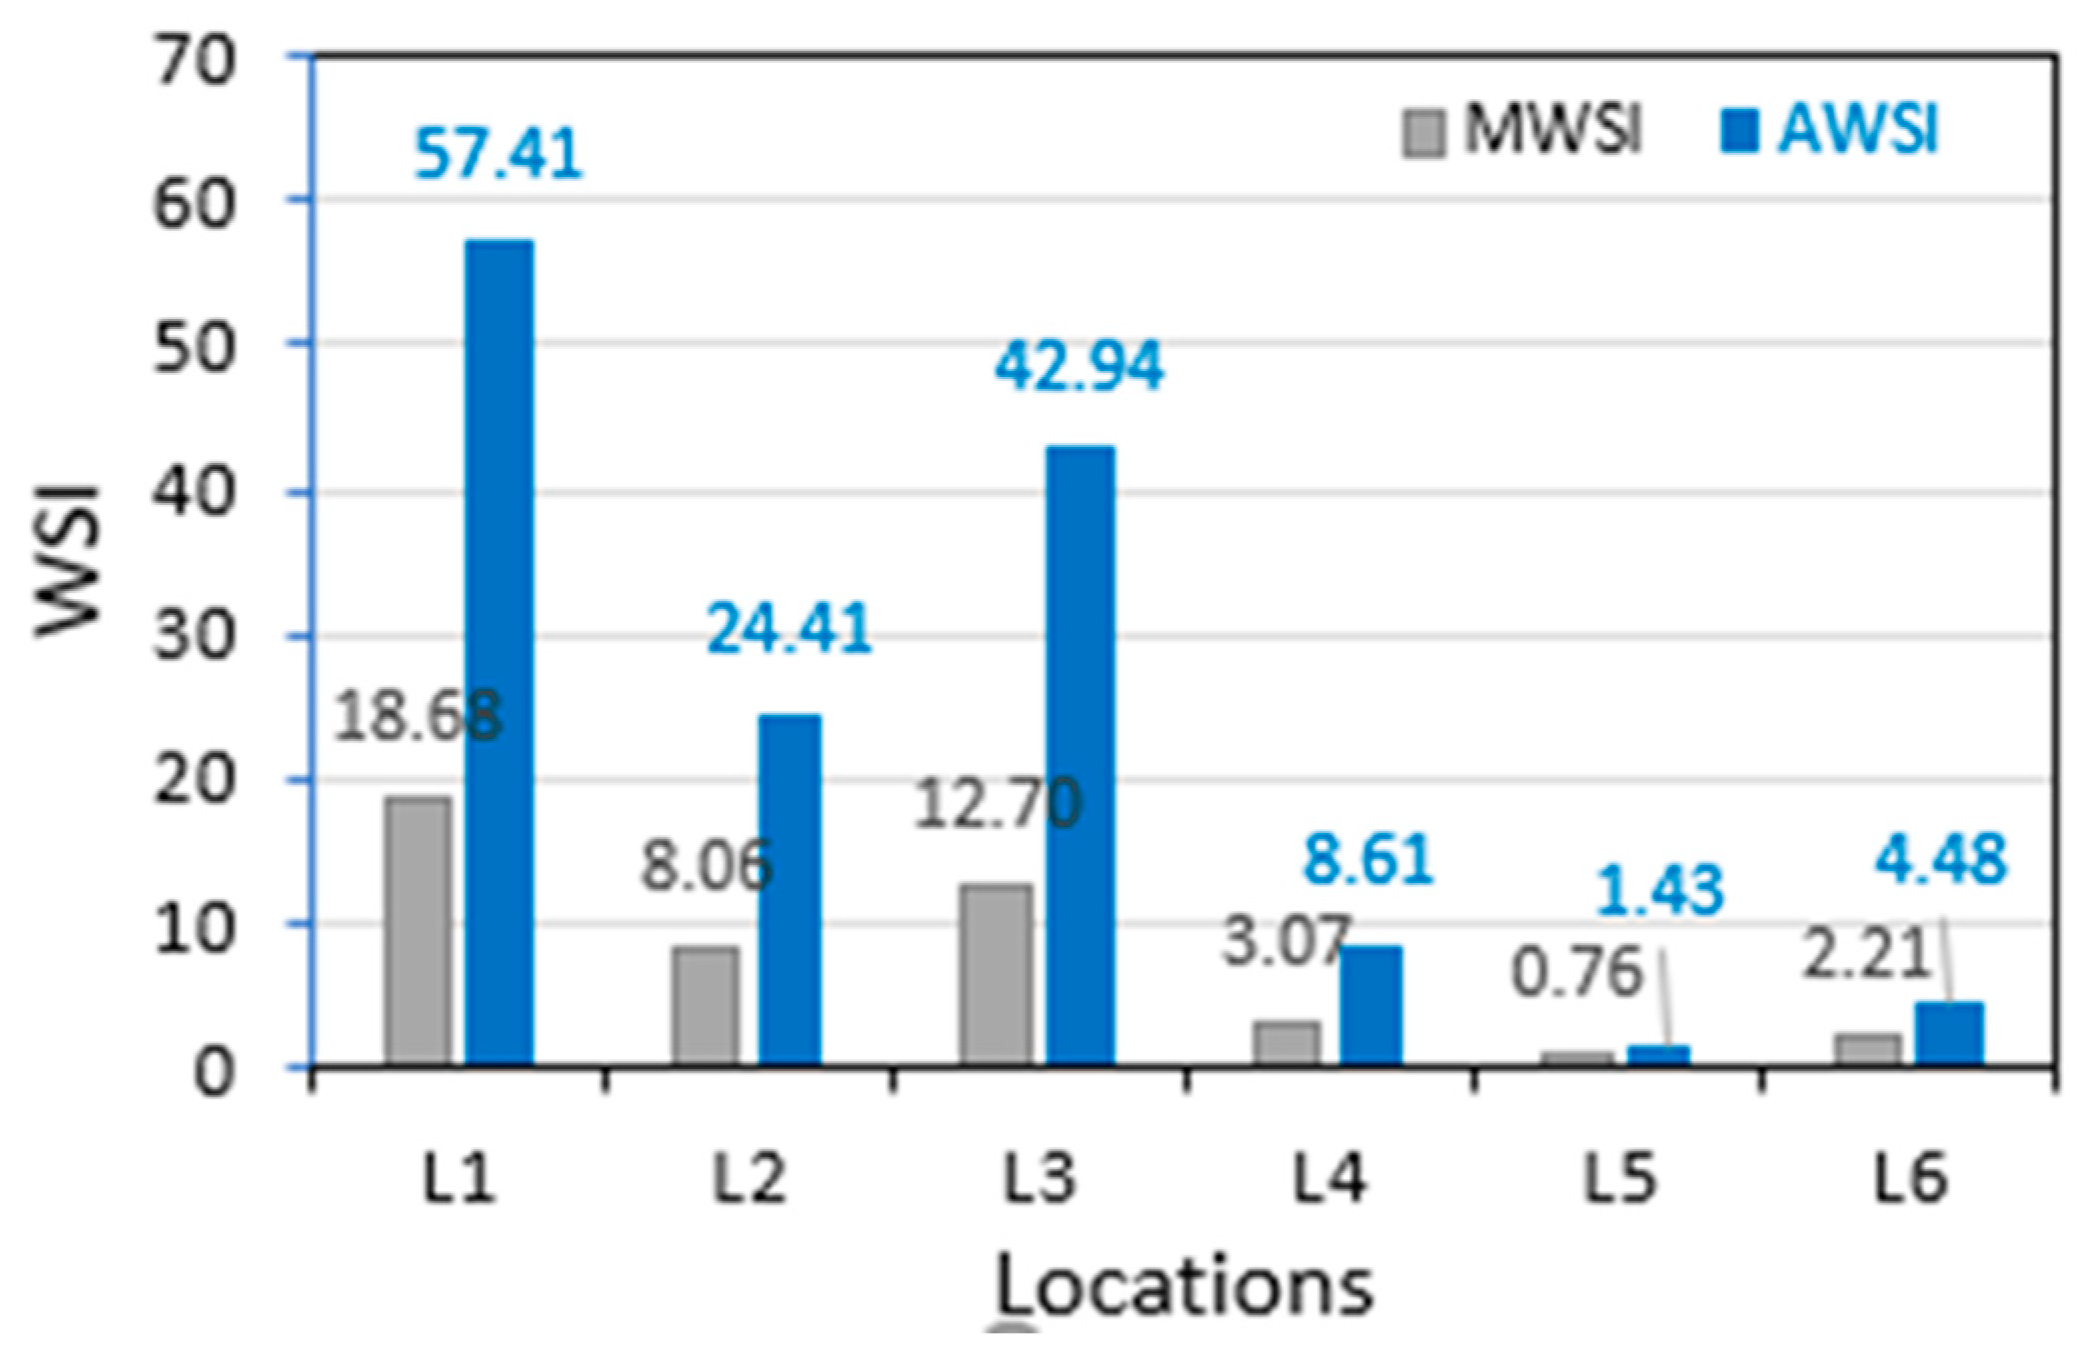
Figure 14.
Wind power curves of the chosen offshore wind turbines.
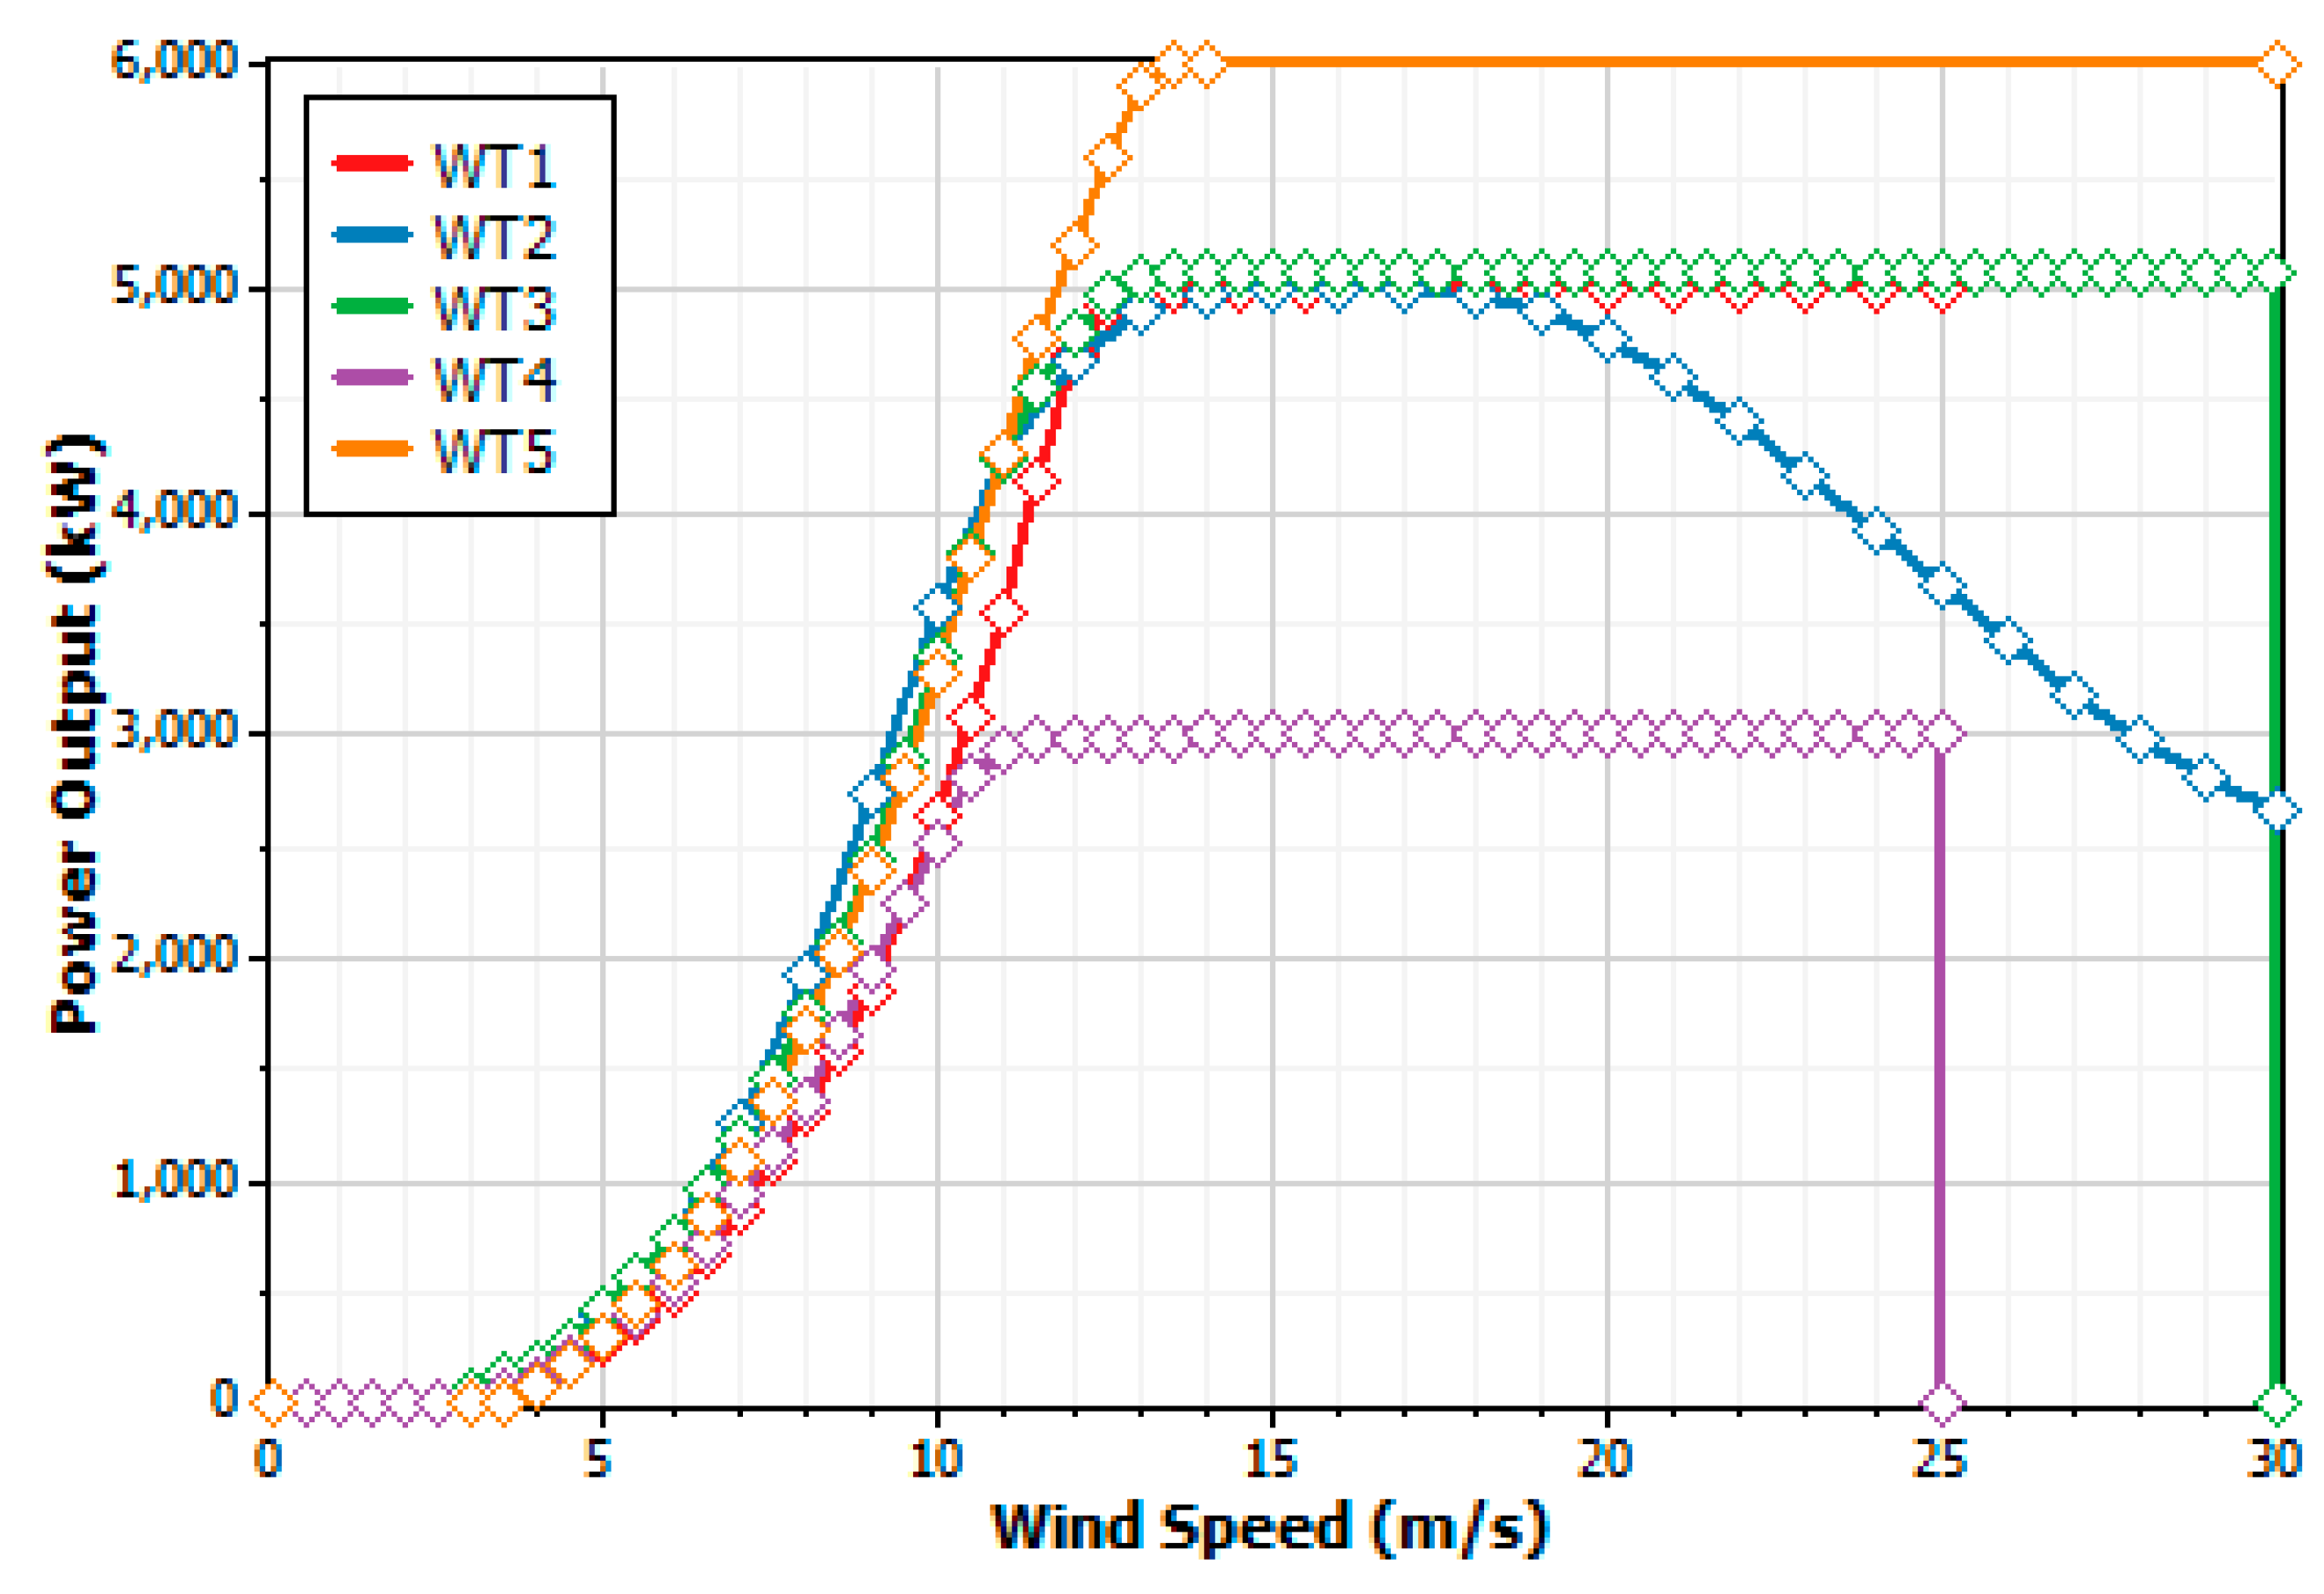
Figure 15.
Number of households served wind energy annually depending on the wind turbine type and the location.
Figure 15.
Number of households served wind energy annually depending on the wind turbine type and the location.
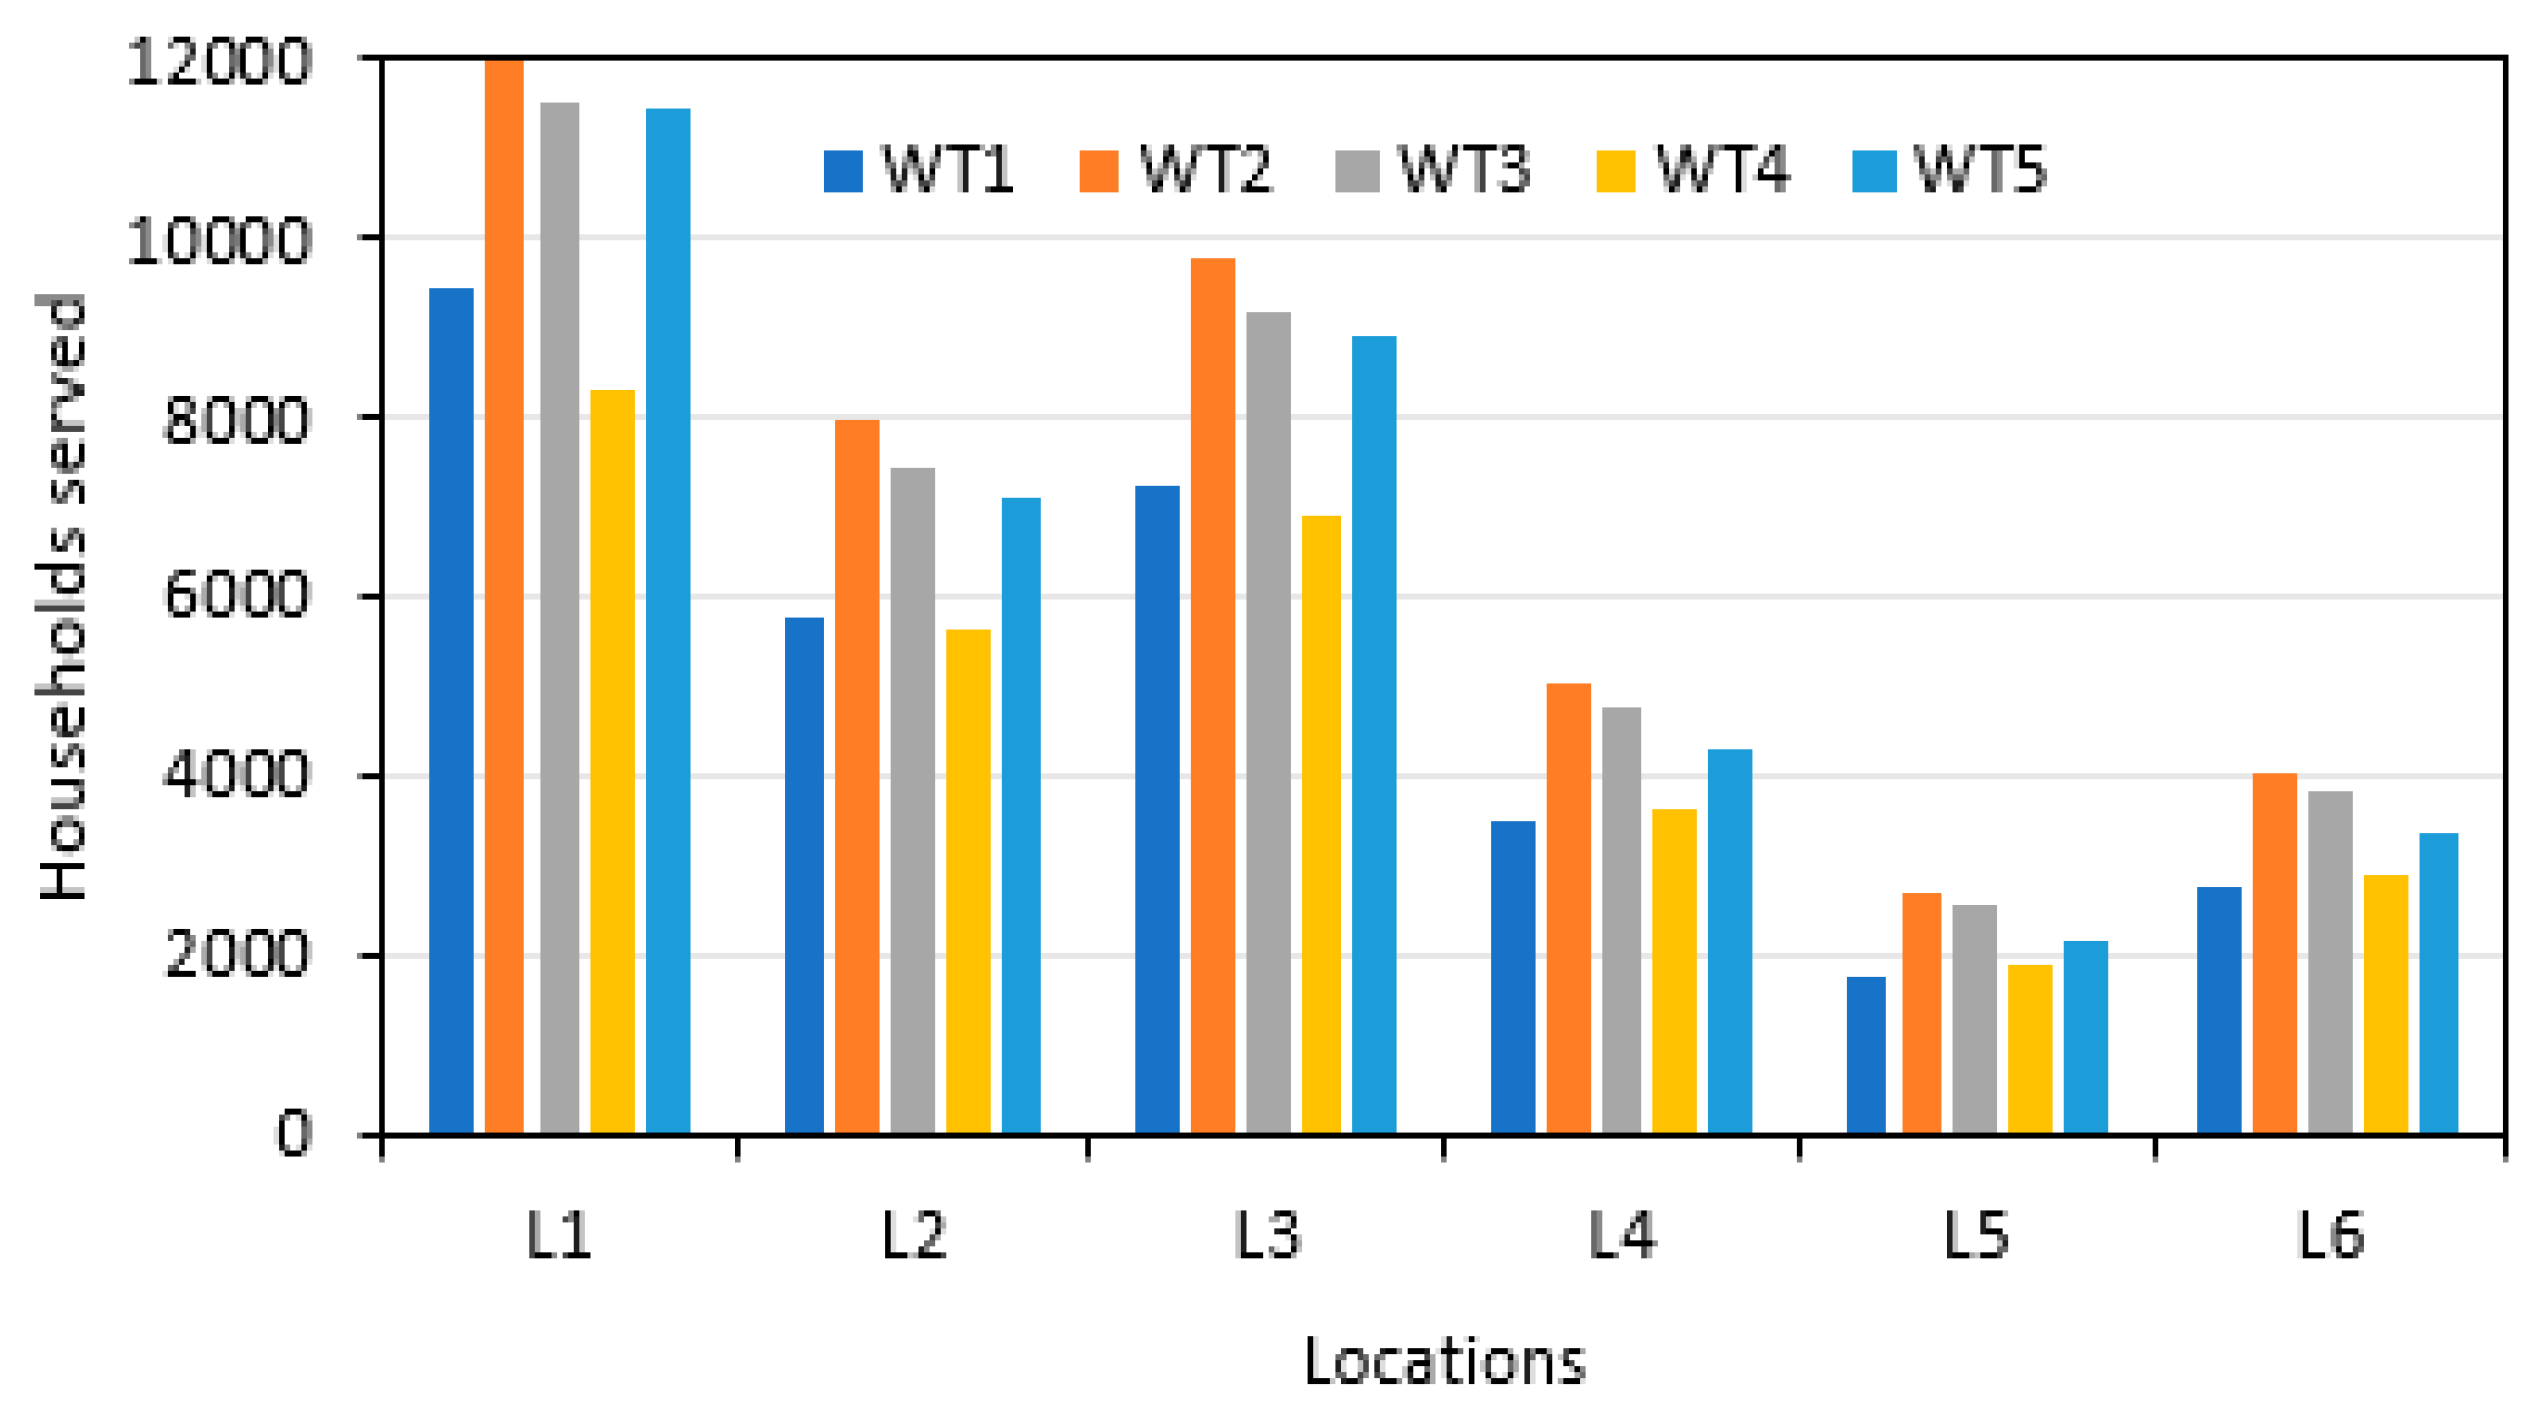
Figure 16.
Variation of annual power and PCFs with hub heights at L1 and L3 sites.
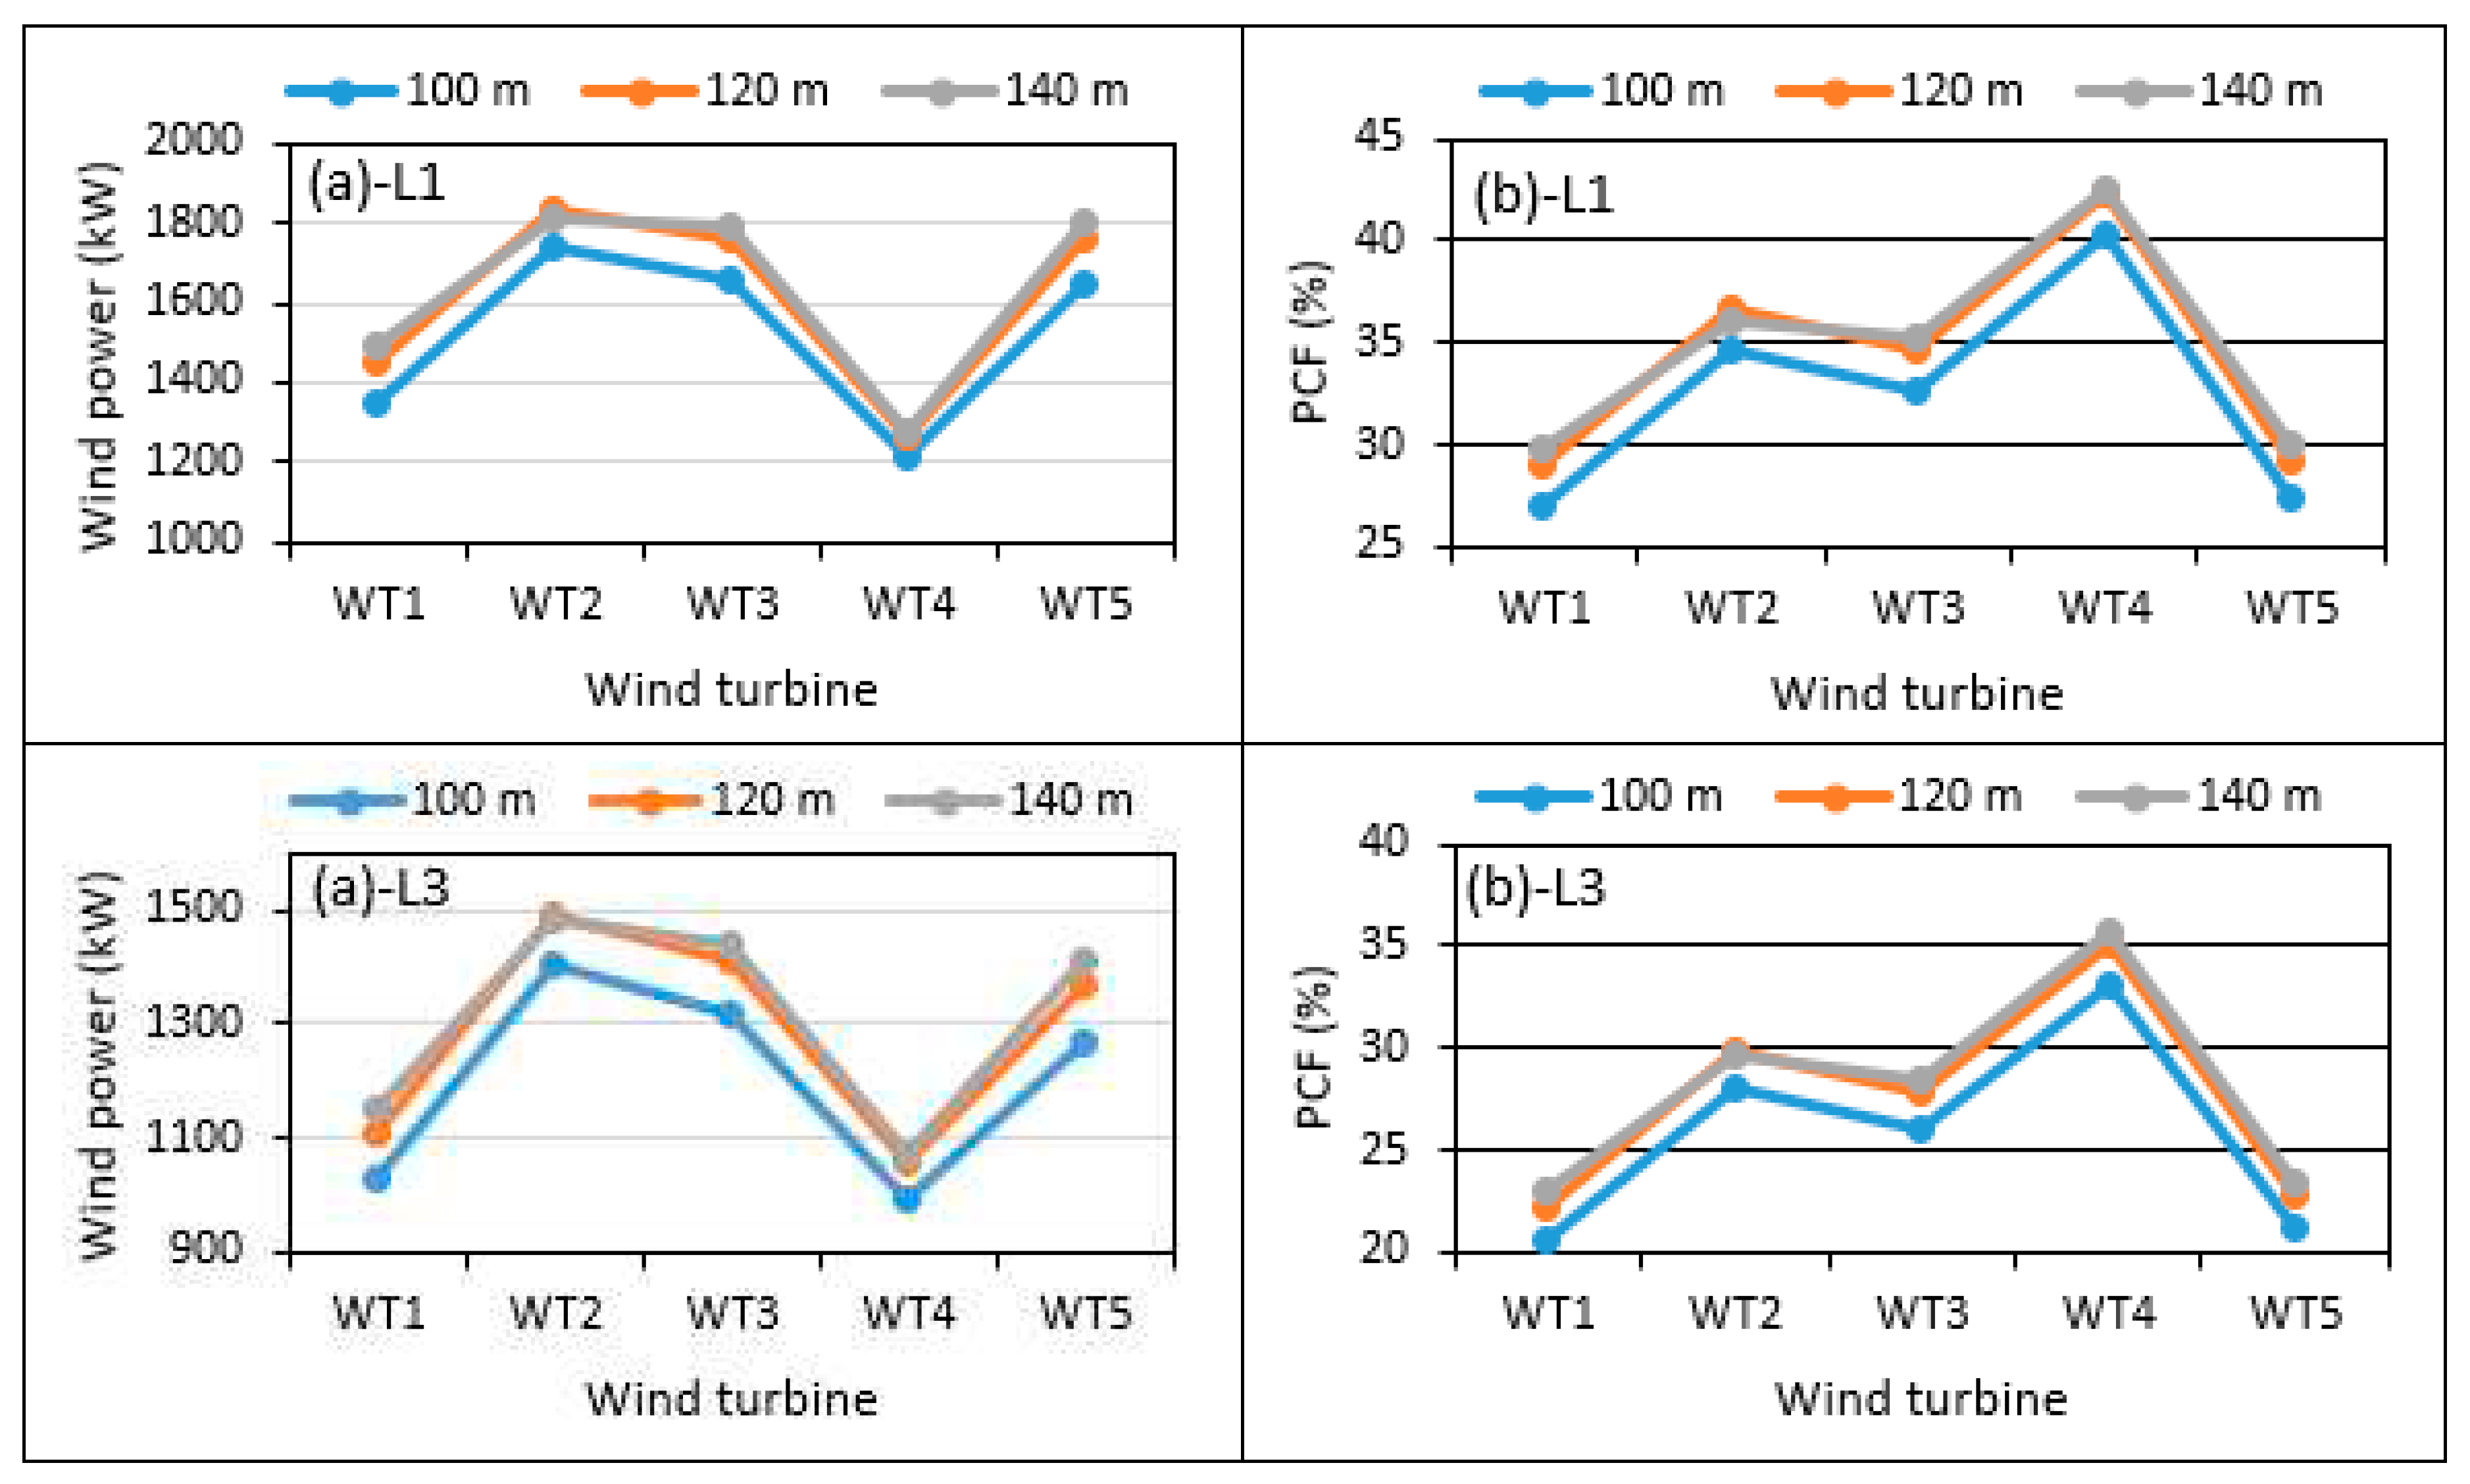
Figure 17.
Cost of wind energy at all the sites with respect to wind turbine.
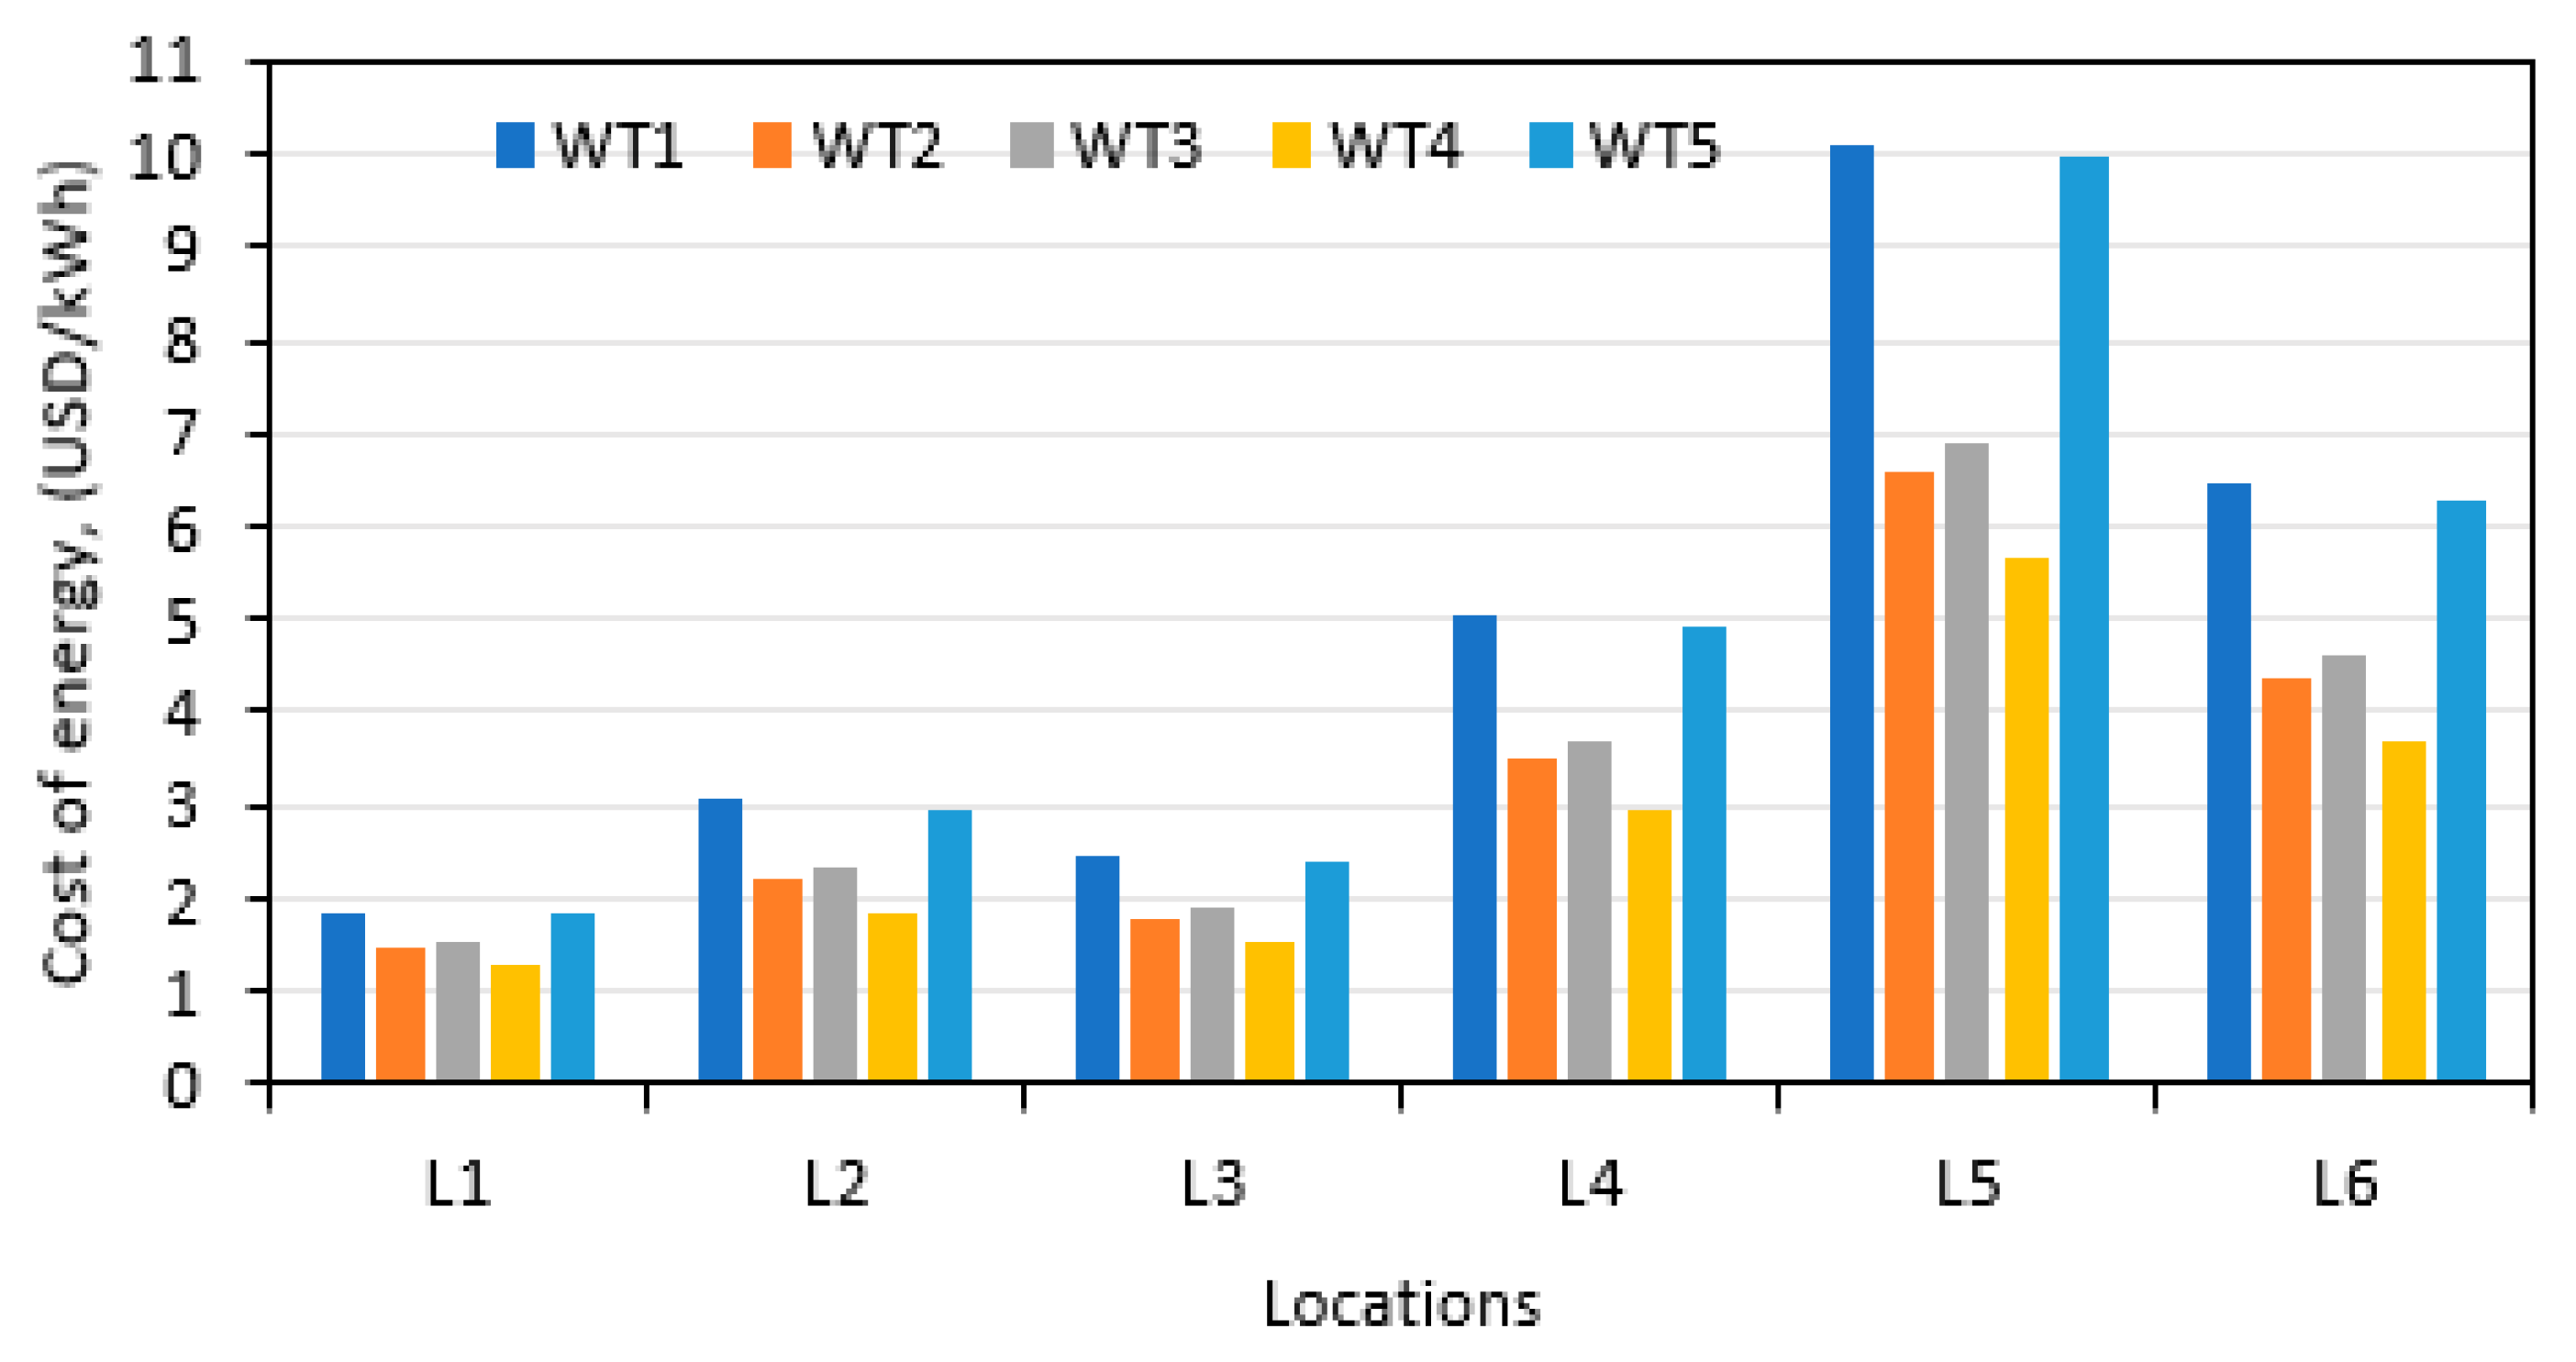

Table 1.
Geographical coordinates of the selected offshore sites.
| Location | Bathymetry | Distance from Coast | ||||
|---|---|---|---|---|---|---|
| Name | Lat, ⁰N | Lon, ⁰E | Lat, ⁰N | Lon, ⁰E | Depth, m | km |
| L1 | 28.80 | 33.00 | 28.804 | 33.0041 | 66 | 18.51 |
| L2 | 29.10 | 32.70 | 29.1041 | 32.7041 | 33 | 3.37 |
| L3 | 29.10 | 33.30 | 29.1041 | 33.0041 | 43 | 32.86 |
| L4 | 29.40 | 32.70 | 29.4041 | 32.7041 | 47 | 14.01 |
| L5 | 29.70 | 32.40 | 29.7041 | 32.4041 | 30 | 2.34 |
| L6 | 29.70 | 32.70 | 29.7041 | 32.6875 | 2 | 0.681 |
Table 2.
Long-term (1979-2021), site-specific summary of WS, WPD, etc.
| Variable | L1 | L2 | L3 | L4 | L5 | L6 |
| Latitude (N) | 28.80 | 29.10 | 29.10 | 29.40 | 29.70 | 29.70 |
| Longitude (E) | 33.00 | 32.70 | 33.00 | 32.70 | 32.40 | 32.70 |
| Mean wind speed (m/s) | 7.547 | 6.371 | 6.905 | 5.483 | 4.304 | 5.030 |
| Max wind speed (m/s) | 17.560 | 17.840 | 18.030 | 17.690 | 15.250 | 18.620 |
| CRMC wind speed (m/s) | 8.616 | 7.303 | 7.863 | 6.267 | 5.104 | 5.835 |
| Mean Wind Direction (°) | 341.1 | 340.4 | 342.7 | 350.4 | 341.3 | 357.0 |
| Weibull k | 2.604 | 2.582 | 2.643 | 2.643 | 2.305 | 2.497 |
| Weibull A (m/s) | 8.453 | 7.147 | 7.730 | 6.150 | 4.849 | 5.655 |
| Mean WPD (W/m²) | 370 | 225 | 281 | 142 | 77 | 115 |
| Mean energy content (kWh/m²/yr) | 3,240 | 1,972 | 2,465 | 1,241 | 677 | 1,003 |
| Energy pattern factor | 1.488 | 1.507 | 1.476 | 1.493 | 1.668 | 1.561 |
| Frequency of calms (%) | 10.58 | 13.07 | 11.66 | 14.89 | 26.1 | 18.01 |
| WPD at 50m (W/m²) | 276 | 168 | 210 | 106 | 58 | 86 |
| Wind power class | 2(Marginal) | 1 (Poor) | 2(Marginal) | 1 (Poor) | 1 (Poor) | 1 (Poor) |
| Mean Temperature (°C) | 21.92 | 21.54 | 22.14 | 21.09 | 21.36 | 20.97 |
| Mean Pressure (kPa) | 100.6 | 100.4 | 100.9 | 99.8 | 100.8 | 99.9 |
| Mean Air Density (kg/m³) | 1.165 | 1.164 | 1.167 | 1.160 | 1.170 | 1.161 |
| WPD frequency occurrences above 250 W/m2 | 183,713 | 207,343 | 137,826 | 174,391 | 63,458 | 23,875 |
Table 3.
Long-term linear trends of wind speed.
| Location | Linear equation | R2 |
|---|---|---|
| L1 | Y = -0.0062*WS + 7.6828 | 0.0664 |
| L2 | Y = -0.0046*WS + 6.4718 | 0.0561 |
| L3 | Y = -0.0054*WS + 7.0251 | 0.0703 |
| L4 | Y = -0.0032*WS + 5.5540 | 0.0569 |
| L5 | Y = -0.0021*WS + 4.3492 | 0.0450 |
| L6 | Y = -0.0019*WS + 5.0711 | 0.0286 |
Table 4.
Technical specifications of chosen offshore wind turbines.
| Wind Turbine | Rated capacity (MW) | Rotor diameter (m) | Cut-in-speed (m/s) | Rated speed (m/s) | Cut-out speed (m/s) |
|---|---|---|---|---|---|
| WT1 | 5.00 | 116 | 4.0 | 13.0 | 25.0 |
| WT2 | 5.00 | 132 | 3.0 | 15.0 | 30.0 |
| WT3 | 5.75 | 126 | 3.0 | 13.0 | 30.0 |
| WT4 | 3.00 | 112 | 3.0 | 14.0 | 25.0 |
| WT5 | 6.00 | 128 | 3.5 | 12.0 | 30.0 |
Table 5.
Assumed losses used for net power and PCF estimations.
| Loss item | Loss (%) |
|---|---|
| Availability | 3 |
| Wake effect | 5 |
| Turbine performance | 4 |
| Electrical | 2 |
| Environmental | 0 |
| Curtailment | 0 |
| Other | 0 |
| Overall | 13.3053 |
Table 6.
Net wind power, AEY and PCF at 120 m hub height for all the sites.
| HH=120m | Hub Height | L1 | L2 | L3 | L4 | L5 | L6 |
| WS (m/s) | 7.75 | 6.54 | 7.09 | 5.63 | 4.42 | 5.16 | |
| WT1 | Net Wind Power (MW) | 1.451 | 0.879 | 1.110 | 0.533 | 0.266 | 0.418 |
| WT2 | 1.831 | 1.219 | 1.492 | 0.774 | 0.410 | 0.615 | |
| WT3 | 1.760 | 1.143 | 1.408 | 0.729 | 0.390 | 0.582 | |
| WT4 | 1.269 | 0.866 | 1.054 | 0.553 | 0.287 | 0.437 | |
| WT5 | 1.758 | 1.088 | 1.366 | 0.659 | 0.325 | 0.513 | |
| WT1 | Net AEY (GWh) | 12.710 | 7.699 | 9.719 | 4.669 | 2.332 | 3.661 |
| WT2 | 16.039 | 10.677 | 13.073 | 6.784 | 3.589 | 5.385 | |
| WT3 | 15.413 | 10.013 | 12.338 | 6.384 | 3.412 | 5.100 | |
| WT4 | 11.112 | 7.583 | 9.230 | 4.848 | 2.513 | 3.825 | |
| WT5 | 15.396 | 9.528 | 11.962 | 5.773 | 2.845 | 4.498 | |
| WT1 | Net PCF (%) | 29.02 | 17.58 | 22.19 | 10.66 | 5.32 | 8.36 |
| WT2 | 36.62 | 24.38 | 29.85 | 15.49 | 8.19 | 12.3 | |
| WT3 | 34.67 | 22.52 | 27.75 | 14.36 | 7.67 | 11.47 | |
| WT4 | 42.28 | 28.85 | 35.12 | 18.45 | 9.56 | 14.55 | |
| WT5 | 29.29 | 18.13 | 22.76 | 10.98 | 5.41 | 8.56 | |
| WT1 | Percentage of time at Zero Power | 13.04 | 16.44 | 14.25 | 19.25 | 34.48 | 23.66 |
| WT2 | 5.55 | 6.66 | 6.39 | 7.35 | 11.86 | 8.42 | |
| WT3 | 10.33 | 12.77 | 11.4 | 14.57 | 25.38 | 17.58 | |
| WT4 | 10.27 | 12.71 | 11.33 | 14.48 | 25.21 | 17.47 | |
| WT5 | 10.43 | 12.91 | 11.5 | 14.73 | 25.71 | 17.8 | |
| WT1 | Percentage of time at Rated Power | 1.66 | 0.13 | 0.29 | 0.07 | 0.04 | 0.13 |
| WT2 | 0.04 | 0.00 | 0.03 | 0.01 | 0.00 | 0.02 | |
| WT3 | 0.78 | 0.06 | 0.14 | 0.05 | 0.02 | 0.09 | |
| WT4 | 0.32 | 0.02 | 0.07 | 0.04 | 0.01 | 0.06 | |
| WT5 | 0.74 | 0.06 | 0.14 | 0.05 | 0.02 | 0.09 |
Table 7.
GHG emission reduction at proposed offshore sites.
| WTs | Location | L1 | L2 | L3 | L4 | L5 | L6 |
| WT1 | Annual GHG emissions (tons) | 2482.3 | 1503.6 | 1898.2 | 911.9 | 455.5 | 714.9 |
| WT2 | 3132.5 | 2085.3 | 2553.2 | 1324.9 | 700.9 | 1051.7 | |
| WT3 | 3010.1 | 1955.6 | 2409.5 | 1246.8 | 666.3 | 996.1 | |
| WT4 | 2170.3 | 1480.9 | 1802.6 | 946.8 | 490.9 | 746.9 | |
| WT5 | 3006.7 | 1860.9 | 2336.1 | 1127.4 | 555.7 | 878.4 | |
| WT1 | Households served power |
9463 | 5732 | 7236 | 3476 | 1736 | 2725 |
| WT2 | 11941 | 7949 | 9733 | 5051 | 2672 | 4009 | |
| WT3 | 11475 | 7455 | 9185 | 4753 | 2540 | 3797 | |
| WT4 | 8273 | 5645 | 6872 | 3609 | 1871 | 2847 | |
| WT5 | 11462 | 7094 | 8905 | 4298 | 2118 | 3348 | |
| WT1 | Cars and light trucks not used | 455 | 275 | 348 | 167 | 83 | 131 |
| WT2 | 574 | 382 | 468 | 243 | 128 | 193 | |
| WT3 | 551 | 358 | 441 | 228 | 122 | 182 | |
| WT4 | 397 | 271 | 330 | 173 | 90 | 137 | |
| WT5 | 551 | 341 | 428 | 206 | 102 | 161 |
Disclaimer/Publisher’s Note: The statements, opinions and data contained in all publications are solely those of the individual author(s) and contributor(s) and not of MDPI and/or the editor(s). MDPI and/or the editor(s) disclaim responsibility for any injury to people or property resulting from any ideas, methods, instructions or products referred to in the content. |
© 2023 by the authors. Licensee MDPI, Basel, Switzerland. This article is an open access article distributed under the terms and conditions of the Creative Commons Attribution (CC BY) license (http://creativecommons.org/licenses/by/4.0/).
Copyright: This open access article is published under a Creative Commons CC BY 4.0 license, which permit the free download, distribution, and reuse, provided that the author and preprint are cited in any reuse.


