
Submitted:
12 September 2023
Posted:
14 September 2023
You are already at the latest version
Abstract
In the context of freshwater ecosystems, turbidity and suspended solids play crucial roles, with their levels significantly influenced by anthropogenic activities. This study focuses on assessing and monitoring these parameters in Albufera de Valencia using Sentinel-2 imagery. The primary aim is to establish reliable estimation algorithms that can contribute to effective ecosystem management. The study calibrated and validated algorithms for estimating turbidity and suspended solids. The R783×R705/R490 model proved to have the best performance for estimating turbidity and total solids in the Albufera. However, R783/R490 obtained a higher coefficient of de-termination for the organic part, while the R705 band was selected for the inorganic part. However, to achieve better estimates of turbidity and inorganic matter, more research is needed in the future. The implications of excessive suspended solids are underscored, including the depletion of dissolved oxygen, and reduced primary productivity due to limited light penetration and habitat availability. Collaboration between disciplines such as limnology, optics and water chemistry are crucial to advance water quality estimation models in lakes and lagoons such as Albufera. By integrating expertise and approaches from these diverse fields, new knowledge can be gained and the basis for more effective management and conservation strategies can be laid.
Keywords:
water quality
; remote sensing
; suspended solids
; freshwater ecosystems
; environmental moni-toring
1. Introduction
Both turbidity and suspended solids are a natural part of freshwater environments, but human activities have increased suspended solids levels in many habitats [1]. This is due to factors such as agriculture, urbanization, removal of riparian vegetation, introduction of sediment-churning species, and altered hydrodynamic regimes [2]. The effects of such suspended matter depend on the nature of the suspended matter; in the case of organic matter, decomposition may occur and the concentration of dissolved oxygen in the water may be reduced to a critical shortage [3]. Excessive sedimentation can have negative effects on primary productivity and aquatic life by reducing incoming light and habitat availability, as well as interfering with reproduction and feeding of aquatic animals [1].
For these reasons, turbidity [4] and suspended solids [5] are two of the most employed variables for environmental monitoring of epicontinental aquatic ecosystems. Turbidity is a variable directly related to light scattering by suspended particles and has an inverse relationship with clarity [4]. Total suspended solids (TSS or TSM) are the total mass of suspended particles per volume of water [6]. The latter constitute a mixture of living particulate organic matter (POM), such as phytoplankton, and inert, such as detritus, and inorganic matter (PIM) such as clay, silt, and other suspended minerals [7,8]. In this context, water quality monitoring is increasingly necessary, not only for human, agronomic and industrial consumption needs, but also for the proper functioning of natural ecosystems [9].
From this perspective, one of the tools that has proven to be very useful in monitoring these variables is remote sensing [10], considering the difficulty of obtaining economic resources for in situ monitoring of all water bodies. At this juncture, the ESA Sentinel-2 mission, consisting of two satellites, S2A and S2B, was launched in 2015. Both satellites are equipped with the MSI (Multispectral Instrument), a sensor that captures the radiation reflected by the Earth in 13 spectral bands. This makes it possible to generate images with improved spectral resolution (up to 10 m) and a shorter revisit interval (5 days) compared to their predecessors [11].
In this context, the Ecological Status of AQuatic Systems with Sentinel Satellites (ESAQS) project was initiated in 2016, whose main objective was to develop and validate algorithms to estimate ecological indicators of quality in inland water bodies using S2 imagery. This includes chlorophyl-a ([Chl-a]), transparency, colored dissolved organic matter (CDOM) and [TSS] in various lakes and reservoirs of the Jucar basin [12]. Within this framework, Delegido et al. [9] obtained an algorithm to estimate turbidity values in nephelometric turbidity units (NTU) from S2 images in reservoirs of the Jucar basin. Subsequently, Alvado et al. [13] developed algorithms to estimate [TSS], differentiating particulate inorganic matter (PIM) from organic matter (POM), for different reservoirs in the Ebro and Jucar basins, including points of the marsh surrounding the Albufera, but not the lagoon. That study obtained a preliminary equation that we revised now with more data for Albufera lagoon, an hypertrophic shallow lake.
Following this line of research, the aim of the present study is to calibrate and validate specific algorithms to estimate turbidity and [TSS], differentiating [POM] and [PIM], only for the Albufera of Valencia lagoon using data from 2018-23, the last five years of field period. At the present, the estimation of suspended solids in the Albufera lagoon using Sentinel-2 images was outstanding to be performed, separating the organic from the inorganic part. The development of these algorithms has powerful applications in a more efficient management of water quality by the Natural Park managers The selection of this lagoon as a study area is supported by the challenges it faces due to the eutrophication it has experienced since the 1970s, a claim supported by numerous previous studies [14]. This study contributes directly to the United Nations' Sustainable Development Goals (SDGs), particularly the 6th SDG, focused on clean water and responsible consumption.
2. Materials and Methods
2.1. Study area
The Albufera de Valencia is a Mediterranean coastal lagoon ubicated at 39.335°N, -0.335°W that is characterized by being oligohaline (with a salinity of 1-2 ‰) and having shallow depth (1.2 m) [14,15]. This ecosystem hosts a remarkable biodiversity and has a great historical, cultural and landscape value that deserves to be preserved. This is why it became the first Natural Park declared in the Valencian Community in 1986. In addition, it is part of the Natura 2000 Network as a "Site of Community Importance" (SCI) since 2006 and has been considered a "Special Protection Area for Birds" (SPA) since 1990.
The lagoon is in a watershed whose hydrological cycle is controlled by rainfall and by the management carried out by the Albufera Drainage Board, which is adjusted to the needs of the rice cultivation surrounding the lagoon [15].
However, since the 1970s nutrient inputs through the canals caused eutrophication, increasing phytoplankton biomass, and reducing water transparency, leading to the loss of macrophyte meadows [16-18]. According to Onandia et al. [19], at present, the lagoon presents average [Chl-a] values of 167 μg/L (with a range of 4 to 322 μg/L), an average Secchi disk depth (ZDS) of 0.34 m (with a range of 0.18 to 1.0 m), total phosphorus concentrations of 155 μg/L (with a range of 41 to 247 μg/L) and total nitrogen of 3.9 mg/L (with a range of 1.8 to 6.6 mg/L).
This has brought the Albufera to the brink of ecological collapse [20]. In fact, the lagoon has entered a turbid phase within the conceptual framework of alternative states proposed by Scheffer et al. [21] (cited by Romo et al. [22]). Eutrophication, caused by nutrient inputs through irrigation canals, is the factor that best explains this change [17]. Because of these activities, the wetland has suffered significant degradation [22].
2.2. Sampling and laboratory methods
During July and August 2018, July 2021, November 2021, in the period between March and December 2022 and between February and May 2023, weekly samplings were carried out in the Albufera de Valencia lagoon. These samplings were carried out on days with favorable weather conditions, through boat navigations aimed at obtaining samples at four specific points of the lake: "North", "Center", "South" and "Quay" (see Figure 1). Occasionally, samples were also taken at other points, such as "P1" and "P2", according to the particular interests of each sampling. It should be noted that "P1" and "P2" were chosen at different locations within the lagoon. For this reason, "P1" and "P2" are not shown in Figure 1.
The planning of these samplings was carried out so that they coincided on dates close to the acquisition of images by the S2A satellite, with a temporal difference of no more than three days, following the method proposed by Kutser [23]. During field sampling, measurements of water transparency, temperature and conductivity were carried out, and samples were collected to subsequently calculate Chl-a concentration in the laboratory.
Water transparency was assessed using the Secchi disk visibility depth, calculating an average between the depth at which the disk is no longer visible from the surface and the depth at which it becomes visible again [24]. Water temperature and conductivity were measured using a Hanna Tester EC/TDS/Temperature.
Water samples collected in the field were filtered using 0.47 mm Whatman GF/F glass fiber filters. For Chl-a extraction, a solvent solution prepared with a mixture of dimethyl sulfoxide and 90% acetone was used [25]. The amount of pigment extracted was measured using a Beckman DU 640 spectrophotometer, and the calculation methodology proposed by Jeffrey and Humphrey [26] was applied to determine the Chl-a concentration.
Following the same method of filtering the samples, the [TSS] of the samples was calculated following the gravimetric method described by the American Public Health Association [27]. A Whatman 934-AH glass fiber filter of known porosity is used to filter a given volume of problem water. Prior to filtration, the weight of the filter discs previously dried at 105°C and kept in a desiccator to avoid the influence of moisture is recorded. After filtration, the discs are dried again at the same temperature, weighed again on a precision balance and the difference in weight is recorded, with which we can calculate the [TSS]. This procedure is complemented by incineration at 460°C, and we weigh again. The value obtained corresponds to the particulate inorganic matter (PIM), and by difference with the previously obtained value (TSS), the particulate organic matter (POM) is calculated. The combustion of the particulate organic matter (POM) represents a weight loss that we generally refer to as loss on ignition (LOI).
2.3. Remote sensing imagery
The images used in this study were obtained from the European Space Agency (ESA) S2 mission database. This mission is carried out by two satellites, known as S2A and S2B, equipped with a sensor called MSI (Multispectral Instrument). The MSI sensor captures the radiation reflected by the Earth in 13 spectral bands (Table 1), ranging from the visible spectrum to the near infrared and shortwave infrared. These bands have spatial resolutions of 10, 20, and 60 meters [11]. Although the mission was originally designed to study vegetation, urbanism and terrestrial ecosystems, the new bands at the red edge, the radiometric quality, and the high spatial resolution of the MSI sensor have been found to be very useful for the study of inland waters [28].
We used images corresponding to the years 2018, 2021, 2022 and 2023, which were downloaded from the ESA Copernicus Open Access Hub portal and selected those without the presence of clouds and that matched the field data of the lagoon. The images were obtained with the Sen2Cor atmospheric correction (level 2A), with which optimal reflectivity results are obtained in eutrophic waters such as the Albufera de Valencia [28,29]. A total of 21 images were suitable for further processing: 5 from 2018, 3 from 2021, 9 from 2022 and 4 from 2023.
The processing of the 21 selected images was carried out using SNAP software (Brockmann Consult, Hamburg, Germany). Because the algorithms used in the subsequent stages required bands with different resolutions, it was necessary to resample the images to a resolution of 10 meters using SNAP's built-in interpolation tool. Reflectivity was then calculated for each sampling point using a 3x3 pixel grid [23] in the first seven bands of S2 (B1 to B7).
2.4. Algorithm retrieval
The effect of turbidity on the irradiance of water masses is detected in all parts of the spectrum, because of absorption by optically active substances, such as Chl-a, colored dissolved organic matter (CDOM) and other substances. Therefore, to estimate turbidity due to suspended matter we must resort to the bands where the reflectivity of the other substances is minimal [30].
As Maciel et al. [31] highlight, suspended particles show a strong correlation with reflectivity in the green, red, and near-infrared bands. However, at concentrations above 100 mg/L of TSS, the effectiveness of the green and red bands decreases, while that of the near-infrared increases. We have based our choice of models employing red-edge bands for the Albufera on this finding, as well as on the range of field data available to us. In addition, the same study indicates that inorganic particles have a higher refractive index than organic particles, due to the predominance of small diameter mineral particles. This fact supports the separation of both variables in the present study. Also, as mentioned in Zhan et al. [32], the 783 nm band is sensitive to high concentrations of suspended particles and can overcome the strong absorption of water in this spectral region.
After performing a review of previous studies, a series of optical models have been selected for calibration, which are presented in Table 2.
After completing the image processing and obtaining the average values for each sampling point in each spectral band, these values were used in combination with the Excel spreadsheet (Microsoft Corporation, Redmond WA, USA) and the previously selected model to perform the necessary operations.
The outliers were then removed and 70% of the values were randomly separated for calibration, while the remaining 30% were reserved for validation.
During model calibration, a correlation analysis was performed between the model and the turbidity and [TSS] values obtained in the field. Pearson's coefficient of determination or R2 was calculated, and the equation of the regression line was determined, which represents the calibrated algorithm and will be used for subsequent validation.
2.5. Data analysis
Once the algorithm with the highest R2 was selected, its validity in the estimates was evaluated by means of a new linear regression between the values estimated by the algorithms for turbidity and [TSS] and the values obtained in the field. It was plotted on a 1:1 graph and the p-value, root-mean-square error (RMSE), normalized root-mean-square error (NRMSE), mean absolute error (MAE) and normalized mean absolute error (NMAE) were calculated.
3. Results
3.1. Field and laboratory data
The descriptive statistics of the results obtained for the variables measured in the field and in the laboratory are presented in Table 3.
The maximum temperature was recorded on 11 July 2022 at the "Quay" point. Turbidity minimum data was 4.3 NTU at the "Quay" point on 2 May 2022, and maximum to 71.5 NTU on 16 May 2023, at the "Center" point. Conductivity ranged from 1031.0 µS/cm on 10 May 2022, at "P1" to 3040.0 µS/cm at the "North" point on 15 July 2018. The ZDS varied between 0.15 m on 5 May 2023, at the "Quay" point and on 16 May 2023, at "North", "Quay" and "P2", and 0.55 m on 15 July 2018, at "P1". The [TSS] minimum of 22.6 mg/L was obtained at the "South" point on 29 August 2018, to 250.8 mg/L obtained at the "Center" point on 16 May 2023. The [POM] presented a range between 7.6 mg/L, recorded on 20 April 2023, and 94.5 mg/L at "Center" on 16 May 2023. The [PIM] varied from 2.9 mg/L at "Center" on 29 August 2018, to 156.3 mg/L at the same point on 16 May 2023.
It is worth mentioning that the [TSS] values obtained in the Albufera during 2023 have been abnormally high compared to those of previous years. In this sense, most of the [TSS] are made up of suspended organic matter, with the inorganic portion being normally lower. However, during 2023, especially in the month of May, abnormally high values of mineral matter were detected, in some cases higher than the organic fraction.
The [Chl-a] presented an average value of 164.3 mg/m3, with a range that varied between 21.0 mg/m3 detected on April 20, 2022, at the "South" point, and 376.0 mg/m3 detected on 6 June 2022, at the "Center" point. The standard deviation was 88.5 mg/m3, showing a high spatiotemporal variability.
3.2. Algorithm retrieval and validation
Table 4 shows the equations derived during the calibration of the selected models for each variable. It is important to highlight that those equations chosen due to their higher correlation coefficient are highlighted in bold.
The selected algorithms (in bold in Table 4) obtained in all cases a p-value < 0.001. It is noteworthy that, for both total solids and turbidity, the best algorithms used a linear combination of the R705 and R783 bands, but for the organic and inorganic fractions, the R783 and R705 bands, respectively, gained greater individual prominence.
However, it is relevant to mention that the algorithms tested to estimate [TSS] and [POM] have obtained significantly higher determination coefficients, in all cases higher between 0.85 and 0.92, than those tested for turbidity and [PIM], always between 0.75 and 0.80.
The figures from 2 to 5 show the calibration and validation graphs for the algorithms tested for each variable, but only those that obtained a higher coefficient of determination.
In the specific case of turbidity estimation, the R783 × R705/R490 model was used, which obtained an R2 of 0.7749 in the calibration (Figure 2A) and 0.81 in the validation (Figure 2B).
Therefore, the algorithm selected for the estimation of turbidity in the Albufera is as follows:
Turbidity (NTU) = 185.1 × R783 × R705 / R490
This equation performs estimations with a RMSE of 13.15 NTU and a NRMSE of 19.68%. In addition, it obtains a MAE of 10.45 NTU and an NMAE of 15.64%.
The results for the [TSS] are shown below, where the R783 × R705 / R490 model was again selected, with an R2 of 0.9137 in the calibration (Figure 3A) and 0.9108 in the validation (Figure 3B).
Thus, the algorithm selected for the estimation of [TSS] in the Albufera is as follows:
[TSS] (mg/L) = 705.98 × R783 × R705 / R490
This equation makes estimates with a RMSE of 26.64 mg/L and a percentage error of 11.67%. In addition, it obtains a MAE of 19.99 mg/L and an absolute percentage error (NMAE) of 8.76%.
The following figures show the individual analyses for the two components of the [TSS]: the [POM] and the [PIM]. For the estimation of the [POM], the R783 / R490 model was selected this time, with an R2 of 0.9132 in the calibration (Figure 4A) and 0.9359 in the validation (Figure 4B).
Thus, the algorithm selected to estimate [POM] in the Albufera was as follows:
[POM] (mg/L) = 40.478 × R783 / R490
This algorithm obtained a RMSE of 14.42 mg/L and an error percentage of 16.60%. It also obtained a MAE of 10.34 mg/L and an absolute percentage error (NMAE) of 11.9%.
In the case of [PIM], the R705 band was selected, with an R2 of 0.7903 in calibration (Figure 5A) and 0.8922 in validation (Figure 5B).
Therefore, the algorithm selected for the estimation of inorganic particulate matter in the Albufera was as follows:
[PIM] (mg/L) = 259.4 × R705
This equation obtained a RMSE of 25.83 mg/L and a percentage error (NRMSE) of 16.85%. It also obtained a MAE of 13.96 mg/L, with an error percentage (NMAE) of 9.10%.
4. Discussion
Regarding the selected algorithms, the R783 × R705/R490 model proved to have the best performance for estimating turbidity and total solids in the Albufera. However, R783/R490 obtained a higher coefficient of determination for the organic part, while the R705 band was selected for the inorganic part. These results agree with what Zhan et al. [32] emphasize in their study, that suspended particles have a great influence on the red-edge and near-infrared (NIR) bands. In this sense, as Maciel et al. [31] comment, in areas where the suspended solids load exceeds 100 mg/L, as sometimes occurs in the Albufera lagoon, the red band will begin to saturate in favor of the NIR bands. This effect can be seen in our study where algorithms with the R783 band (the red edge band closer to the NIR and receiving the influence of backscattering from suspended particles in that region [32]) have been more effective than the single R705 band in the estimation of total solids and organics.
In this context, our experimental results do not agree with those of Zhan et al. [32] in the estimation of turbidity in the Mar Menor lagoon, since in that study the R705 × R705/R490 model obtained the best coefficient of determination (R2 = 0.73) However, in our study, that model not only obtains a lower result (R2 = 0.7189), but is surpassed by the R783 × R705/R490 model (R2 = 0.7749), which was also evaluated in the Mar Menor, but with worse results (R2 = 0.701). These differences are because the Mar Menor has a lower Chl-a and solids load than the Albufera, as mentioned in the study by Soria et al. [35]. Therefore, in the Mar Menor the R705 band is more effective than R783, contrary to our case study, because of a greater influence of scattering in the NIR and the saturation of the visible bands due to the high load of suspended particles [32].
The results obtained by Kallio et al. [33] presented that the band equivalent to our R705 was the best model for estimating both total solids and turbidity. However, in our study, except for the inorganic fraction ([PIM]), the models with the R783 band in the numerator obtained superior results overall. These differences are because the study site of Kallio et al. [33], which were Finnish lakes, varied in their suspended solids loading and trophic state. Some lakes were oligotrophic, while others were mesotrophic, eutrophic, or humic. Chlorophyll-a concentration, an indicator of eutrophication, varied from low to high depending on the lake. However, in Albufera lagoon, the trophic state remains always hypertrophic, with a high prominence of suspended matter, which explains that again the R783 band performs better than R705 for total solids and turbidity.
However, as highlighted by Alvado et al. [13], based on previous research [36-37], inorganic mineral particles, which have a higher refractive index than organic ones [31], would scatter light more in the NIR, contrary to particulate organic carbon (POC), which would be better estimated with algorithms that include visible bands. In this sense, the explanation that in our case study the organic particles have obtained such high determination coefficients for the algorithms with the R783 band, so close to the NIR, is also due to the high load of particulate matter present in the Albufera, which produces the saturation of the visible bands, in favor of the red-edge and NIR bands.
On the other hand, to address the quality of the data set, it is critical to recognize that the availability of specific data, especially during days with higher inorganic matter concentrations (PIM), was limited, and no [POC] data were used in the analysis. This may have influenced the results and accuracy of the estimates. Unfortunately, detailed measurements of wind speed and direction were not available at the time of remote sensing data acquisition, which would have been valuable to better understand the resuspension dynamics of solids in water, as highlighted in the study by Soria et al. [38]. The availability of homogeneous and detailed data on environmental conditions and acquisition protocols would have allowed a more rigorous and accurate analysis.
In terms of future steps, apart from collaboration with other researchers, consideration could be given to implementing further research to collect more detailed data on wind speed and direction, as well as direct measurements of inorganic and organic solids, including [POC], in the water under different weather conditions. This would help to improve understanding of resuspension and sedimentation processes and the effect of meteorology on the Albufera lagoon. In addition, it could be beneficial to explore algorithms that include the NIR bands present in Sentinel-2 (842, 865 and 945 nm) to analyze if they are more effective in estimating total and inorganic solids in the Albufera lagoon. This could help to discern differences in the optical properties of organic and inorganic particles, considering the results of this study and previous research.
These observations underline the complexity and importance of understanding the specific characteristics of the studied water bodies, as well as the optical properties of the different components present in the water, when developing algorithms for estimating water quality parameters. Multidisciplinary collaboration between limnology, optics and water chemistry can be fundamental to achieve significant advances in improving the models and algorithms used in the estimation of turbidity and suspended solids concentration in lakes and lagoons such as the Albufera.
5. Conclusions
To sum up, our study has identified that the R783 × R705/R490 model demonstrated better performance in the estimation of turbidity and TSS in the Albufera lagoon. However, the R783/R490 model obtained a higher coefficient of determination for the organic fraction, while the R705 band was selected for the inorganic fraction.
Our results are supported by previous research highlighting the influence of suspended particles in the near-infrared and red-edge bands of the spectrum. In areas with suspended solids loading above 100 mg/L, as occasionally in the Albufera lagoon, better performance of the red-edge bands closer to the NIR is observed, which was reflected in our study.
It is important to note that the limited availability of specific data and the absence of detailed measurements of environmental conditions and acquisition protocols could have influenced the precision of our estimates. For future research, we suggest collecting more detailed data on wind speed and direction, as well as direct measurements of inorganic and organic solids, including POC. In addition, exploring algorithms using Sentinel-2 NIR bands could provide valuable information on solids estimation in the Albufera lagoon.
Author Contributions
Conceptualization and methodology design, J.V.M. and J.M.S.; Field and laboratory work, all authors; Data curation, J.V.M. and J.M.S.; writing—original draft preparation, J.V.M.; writing—review and editing, all authors. All authors have read and agreed to the published version of the manuscript.
Funding
This research received no external funding.
Institutional Review Board Statement
Not applicable.
Informed Consent Statement
Not applicable.
Data Availability Statement
Images are available at ESA Copernicus Hub and the data presented are available on request from the corresponding author.
Conflicts of Interest
The authors declare no conflict of interest.
References
- Dodds, W.K.; Whiles, M.R. Freshwater Ecology: Concepts and Environmental Applications of Limnology. Third edition. Elsevier. 2020. 981 pp.
- Forman, R.T.; Alexander, L.E. Roads and their major ecological effects. Annu. Rev. Ecol. Syst. 1998, 29(1), 207-231. [CrossRef]
- Ryan, P.A. Environmental effects of sediment on New Zealand streams: a review. NZ J. Mar. Freshw. Res. 1991, 25(2), 207-221. [CrossRef]
- Matthews, M.W. A current review of empirical procedures of remote sensing in inland and near coastal transitional waters. Int. J. Remote. Sens. 2011, 32(21), 6855-6899. [CrossRef]
- Noori, R.; Sabahi, M.S.; Karbassi, A.R.; Baghvand, A.; Zadeh, H.T. Multivariate statistical analysis of surface water quality based on correlations and variations in the data set. Desalination 2010, 260(1-3), 129-136. [CrossRef]
- Dekker, A.G.; Vos, R.J.; Peters, S.W.M. Analytical algorithms for lake water TSM estimation for retrospective analyses of TM and SPOT sensor data. Int. J. Remote Sens. 2002, 23(1), 15-35. [CrossRef]
- Miller, R.L.; McKee, B.A. Using MODIS Terra 250 m imagery to map concentrations of total suspended matter in coastal waters. Remote Sens. Environ. 2004, 93(1-2), 259-266. [CrossRef]
- Balasubramanian, S.V., Pahlevan, N., Smith, B., Binding, C., Schalles, J., Loisel, H., ... & Boss, E. Robust algorithm for estimating total suspended solids (TSS) in inland and nearshore coastal waters. Remote Sens Environ. 2020, 246, 111768. [CrossRef]
- Sebastiá-Frasquet, M.-T.; Aguilar-Maldonado, J.A.; Santamaría-Del-Ángel, E.; Estornell, J. Sentinel 2 Analysis of Turbidity Patterns in a Coastal Lagoon. Remote Sens. 2019, 11, 2926. [CrossRef]
- Lindell, T.; Pierson, D.; Premazzi, G. Manual for Monitoring European Lakes Using Remote Sensing Techniques. Office for Official Publications of the European Communities, Luxembourg, 1999, 164 pp.
- European Spacial Agency (ESA). Sentinel-2: ESA’s Optical High-Resolution Mission for GMES Operational Services. K. Fletcher (ed.). ESA Communications, Noordwijk. The Netherlands, 2012, 77 pp.
- Pereira-Sandoval, M.; Urrego, E.P.; Ruiz-Verdu, A.; Tenjo, C.; Delegido, J.; Soria-Perpinya, X.; Vicente, E.; Soria, J.M.; Moreno, J. Calibration and validation of algorithms for the estimation of chlorophyll-a concentration and Secchi depth in inland waters with Sentinel-2. Limnetica 2019, 38(1), 471-487. [CrossRef]
- Alvado, B.; Sòria-Perpinyà, X.; Vicente, E.; Delegido, J.; Urrego, P.; Ruíz-Verdú, A.; Soria, J.M.; Moreno, J. Estimating Organic and Inorganic Part of Suspended Solids from Sentinel 2 in Different Inland Waters. Water 2021, 13, 2453. [CrossRef]
- Romo, S.; Miracle, R. Long-term phytoplankton changes in a shallow hypertrophic lake, Albufera of Valencia (Spain). Hydrobiologia 1994, 275, 153-164.
- Estrela-Segrelles, C.; Gómez-Martinez, G.; Pérez-Martín, M.Á. Risk assessment of climate change impacts on Mediterranean coastal wetlands. Application in Júcar River Basin District (Spain). Sci. Total Environ. 2021, 790, 148032. [CrossRef]
- Romo, S.; Villena, M.-J.; Sahuquillo, M.; Soria, J.M.; Giménez, M.; Alfonso, T.; Vicente, E.; Miracle, M.R. Response of a Shallow Mediterranean Lake to Nutrient Diversion: Does It Follow Similar Patterns as in Northern Shallow Lakes? Freshw. Biol. 2005, 50, 1706–1717.
- Soria, J. M.; Miracle, M. R.; Vicente, E. Relations between physico–chemical and biological variables in aquatic ecosystems of the Albufera Natural Park (Valencia, Spain). SIL Proc. 2002, 28(2), 564-568. [CrossRef]
- Soria, J.; Vera-Herrera, L.; Calvo, S.; Romo, S.; Vicente, E.; Sahuquillo, M.; Sòria-Perpinyà, X. Residence Time Analysis in the Albufera of Valencia, a Mediterranean Coastal Lagoon, Spain. Hydrology 2021, 8, 37. [CrossRef]
- Onandia, G.; Gudimov, A.; Miracle, M.R.; Arhonditsis, G. Towards the development of a biogeochemical model for addressing the eutrophication problems in the shallow hypertrophic lagoon of Albufera de Valencia, Spain. Ecol. Inf. 2015, 26, 70-89. [CrossRef]
- Martín, M.; Hernández-Crespo, C.; Andrés-Doménech, I.; Benedito-Durá, V. Fifty years of eutrophication in the Albufera lake (Valencia, Spain): Causes, evolution and remediation strategies. Ecological Engineering 2020, 155, 105932. [CrossRef]
- Scheffer, M.; Hosper, S.H.; Meijer, M.L.; Moss, B.; Jeppesen, E. Alternative equilibria in shallow lakes. Trends in Ecology & Evolution 1993, 8(8), 275-279. [CrossRef]
- Romo, S.; García-Murcia, A.; Villena, M.J.; Sanchez, V.; Ballester, A. Phytoplankton trends in the lake of Albufera de Valencia and implications for its ecology, management, and recovery. Limnetica 2008, 27, 11–28.
- Kutser, T. The possibility of using the Landsat image archive for monitoring long time trends in coloured dissolved organic matter concentration in lake waters. Remote Sens. Environ. 2012, 123, 334-338. [CrossRef]
- Wetzel, R.G.; G.E. Likens. Limnological Analyses. (3rd edition). Springer, New York, 2000, 429 pp.
- Shoaf, W. T.; Lium, B. W. Improved extraction of chlorophyll a and b from algae using dimethyl sulfoxide. Limnol. Oceanogr. 1976, 21(6), 926-928. [CrossRef]
- Jeffrey, S. T.; Humphrey, G. F. New spectrophotometric equations for determining chlorophylls a, b, c1 and c2 in higher plants, algae and natural phytoplankton. Biochem. Physiol. Pflanz. 1975, 167(2), 191-194. [CrossRef]
- APHA. Standard Methods for the Examination of Water and Wastewater. (18th edition). American Public Health Association. Washington D.C. 1992, 558 pp.
- Saberioon, M.; Brom, J.; Nedbal, V.; Souc̆ek, P.; Císar̆, P. Chlorophyll-a and total suspended solids retrieval and mapping using Sentinel-2A and machine learning for inland waters. Ecological Indicators 2020, 113, 106236. [CrossRef]
- Pereira-Sandoval, M.; Ruescas, A.; Urrego, P.; Ruiz-Verdú, A.; Delegido, J.; Tenjo, C.; Soria-Perpinyà, X.; Vicente, E.; Soria, J.; Moreno, J. Evaluation of Atmospheric Correction Algorithms over Spanish Inland Waters for Sentinel-2 Multi Spectral Imagery Data. Remote Sens. 2019, 11, 1469. [CrossRef]
- Koponen, S.; Pulliainen, J.; Kallio, K.; Hallikainen, M. Lake water quality classification with airborne hyperspectral spectrometer and simulated MERIS data. Remote Sens. Environ. 2002, 79(1), 51-59. [CrossRef]
- Maciel, D.; Novo, E.; Sander de Carvalho, L.; Babosa, C.; Flores Júnior, R.; Lobo, F.L. Retrieving total and inorganic suspended sediments in Amazon floodplain lakes: A multisensory approach. Remote Sens. 2019, 11, 1744. [CrossRef]
- Zhan, Y.; Delegido, J.; Erena, M.; Soria, J.M.; Ruiz-Verdú, A.; Urrego, P.; Sòria-Perpinyà, X.; Vicente, E.; Moreno, J. Mar Menor lagoon (SE Spain) chlorophyll-a and turbidity estimation with Sentinel-2. Limnetica 2022, 41(2), 1-19.
- Kallio, K.; Kutser, T.; Hannonen, T.; Koponen, S.; Pulliainen, J.; Vepslinen, J.; Puhlahti, T. Retrieval of water quality from airborne imaging spectrometry of various lake types in different seasons. Sci. Total Environ. 2001, 268, 5977. [CrossRef]
- Yuan, L.; Yulong, G.; Chunmei, C.; Yibo, Z.; Yaoduo, H.; Zhong, X.; Shun, B. Remote estimation of total suspended matter concentration in the Hangzhou Bay based on OLCI and its water color product applicability analysis. Haiyang Xuebao 2019, 41(9), 156-169.
- Soria, J.; Pérez, R.; Sòria-Pepinyà, X. Mediterranean Coastal Lagoons Review: Sites to Visit before Disappearance. J. Marine Sci. Eng. 2022, 10, 347. [CrossRef]
- Doxaran, D.; Babin, M.; Leymarie, E. Near-infrared light scattering by particles in coastal waters. Opt. Express 2007, 15, 12834–12849. [CrossRef]
- Jiang, G.; Ma, R.; Loiselle, S.; Duan, H.; Su, W.; Cai, W.; Huang, C.; Yang, J.; Yu, W. Remote sensing of particulate organic carbon dynamics in a eutrophic lake (Taihu Lake, China). Sci. Total Environ. 2015, 532, 245–254. [CrossRef]
- Soria, J.M.; Jover, M.; Domínguez-Gómez, J.A. Influence of wind on suspended matter in the water of the Albufera of Valencia (Spain). J. Marine Sci. Eng. 2021, 9(3), 343. [CrossRef]
Figure 1.
Location of field sampling points in the Albufera lagoon. Date of image from Sentinel-2: 2022-06-24. Processed using SNAP 8.0 and QGIS 3.22.
Figure 1.
Location of field sampling points in the Albufera lagoon. Date of image from Sentinel-2: 2022-06-24. Processed using SNAP 8.0 and QGIS 3.22.
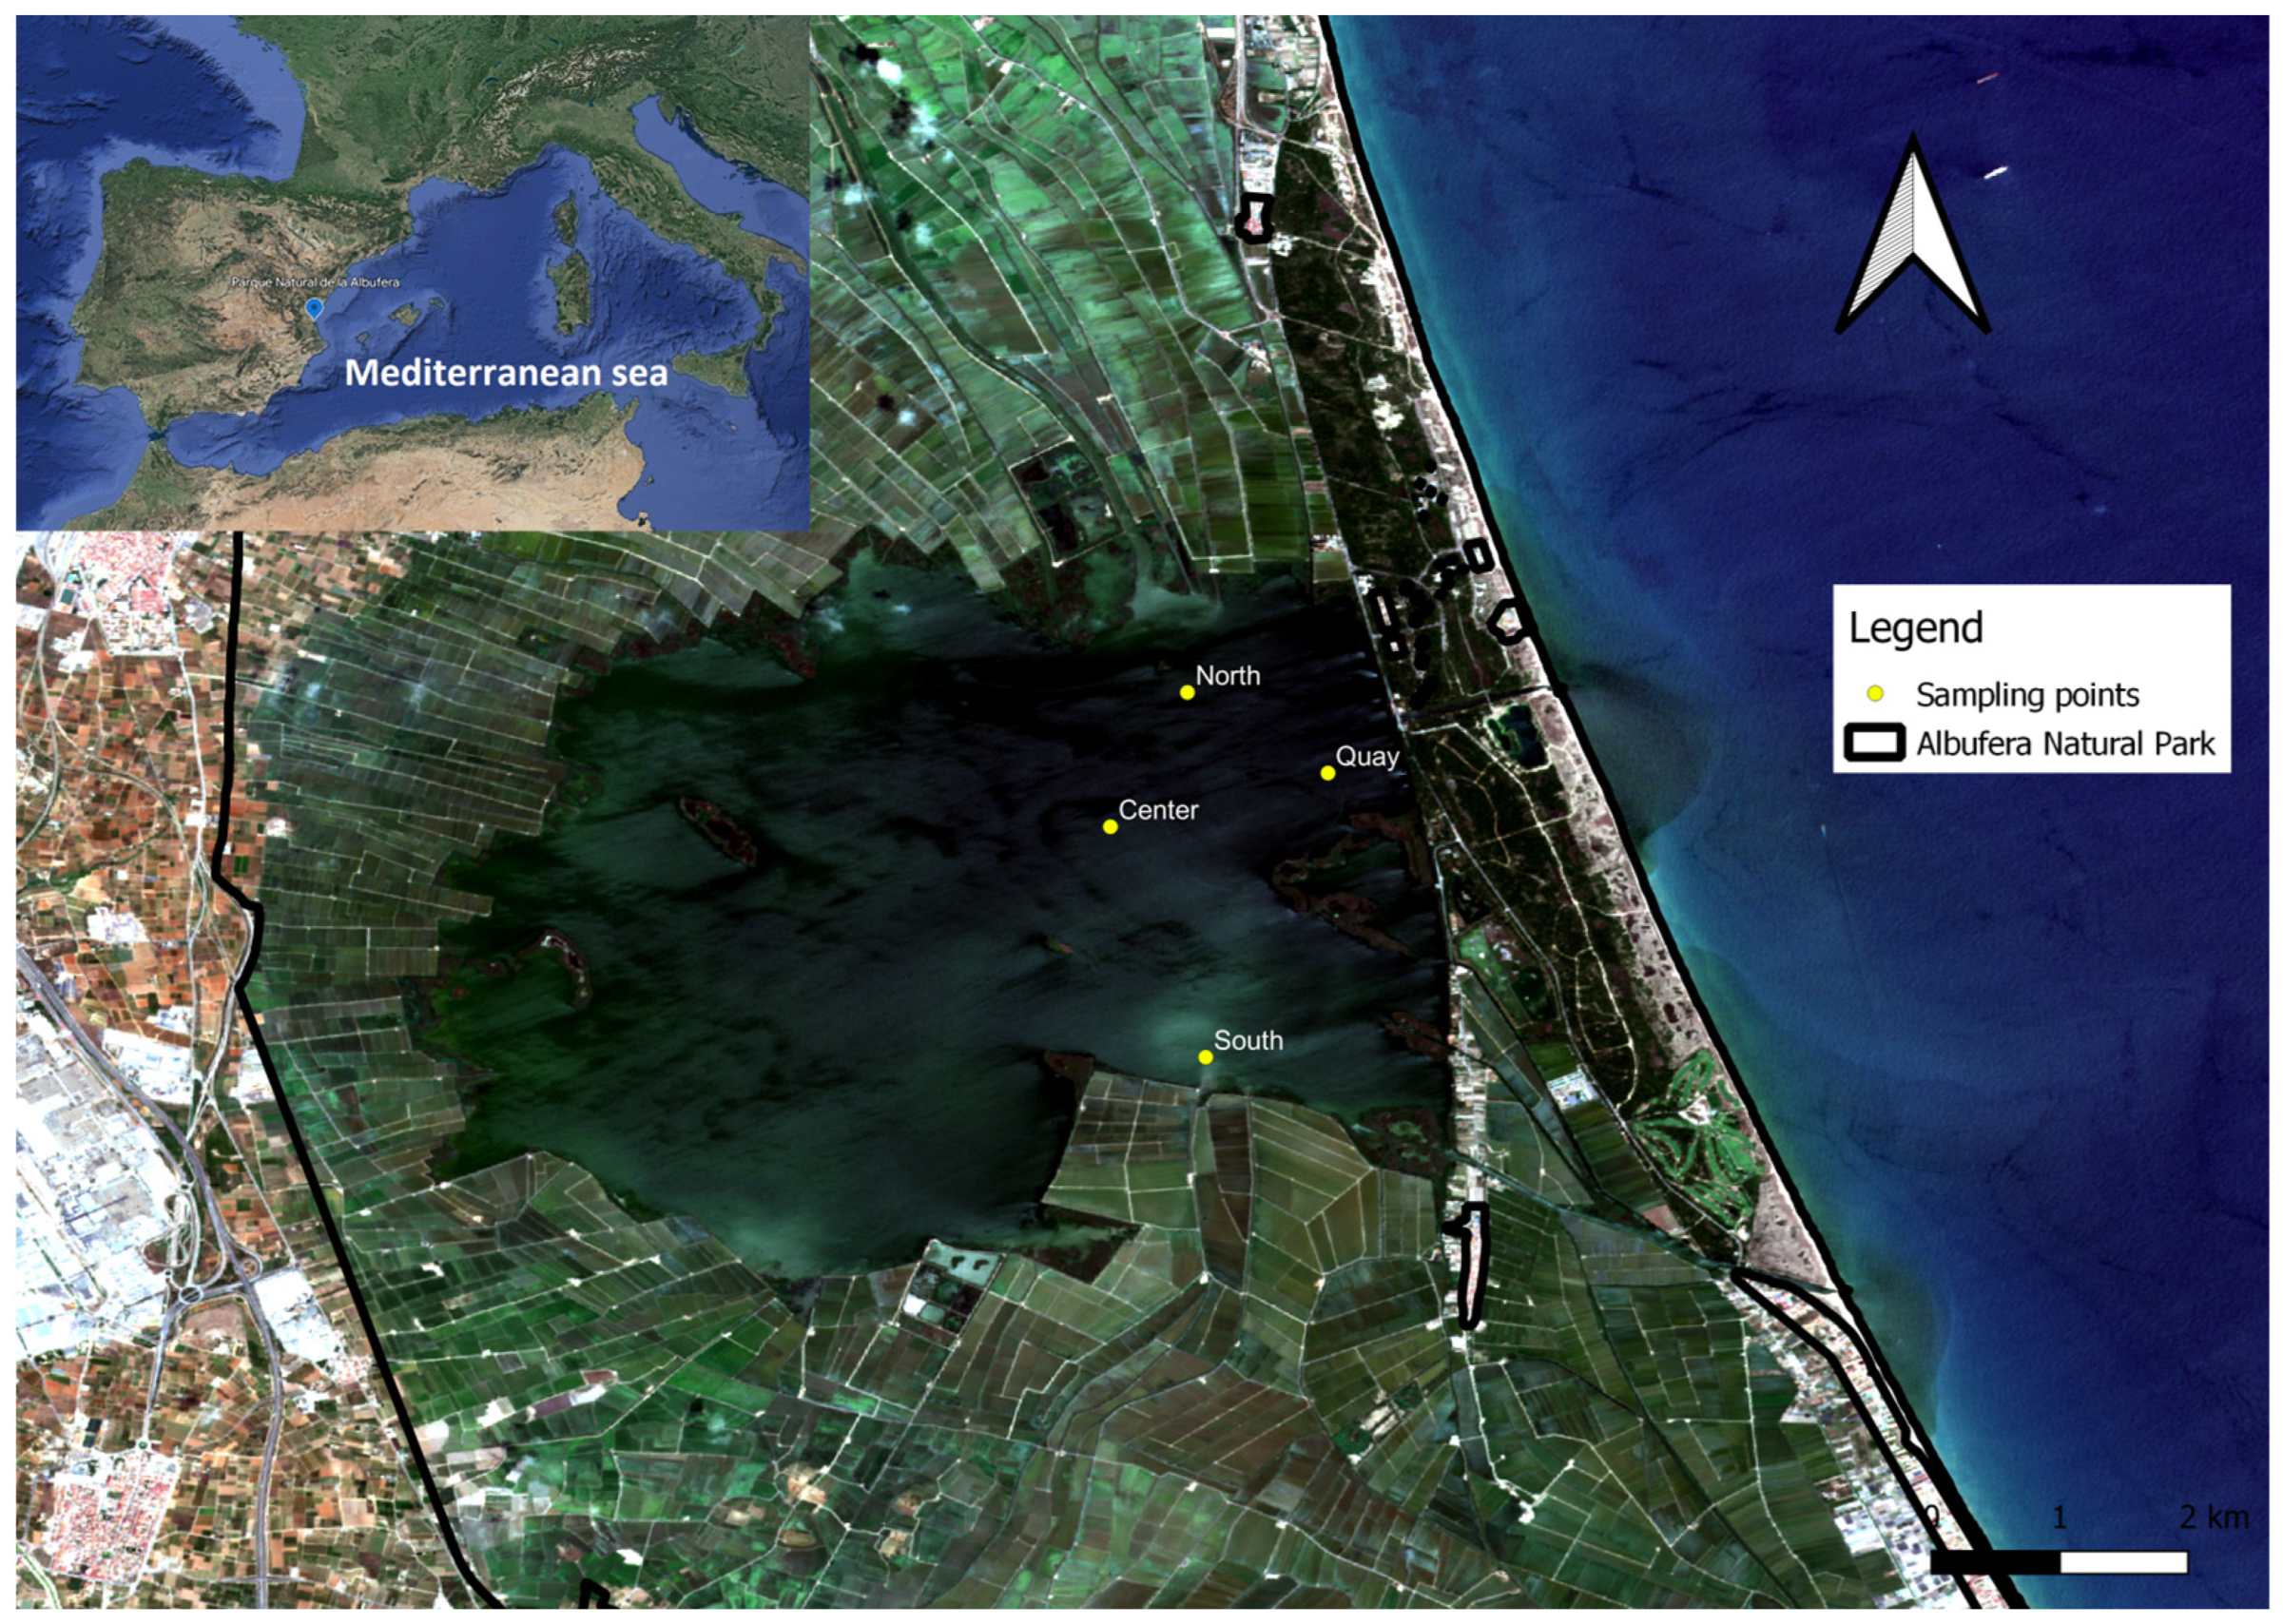
Figure 2.
(a) Calibration of the R783×R705/R490 band to estimate turbidity in the Albufera; (b) Validation of the selected algorithm to estimate turbidity in the Albufera.
Figure 2.
(a) Calibration of the R783×R705/R490 band to estimate turbidity in the Albufera; (b) Validation of the selected algorithm to estimate turbidity in the Albufera.
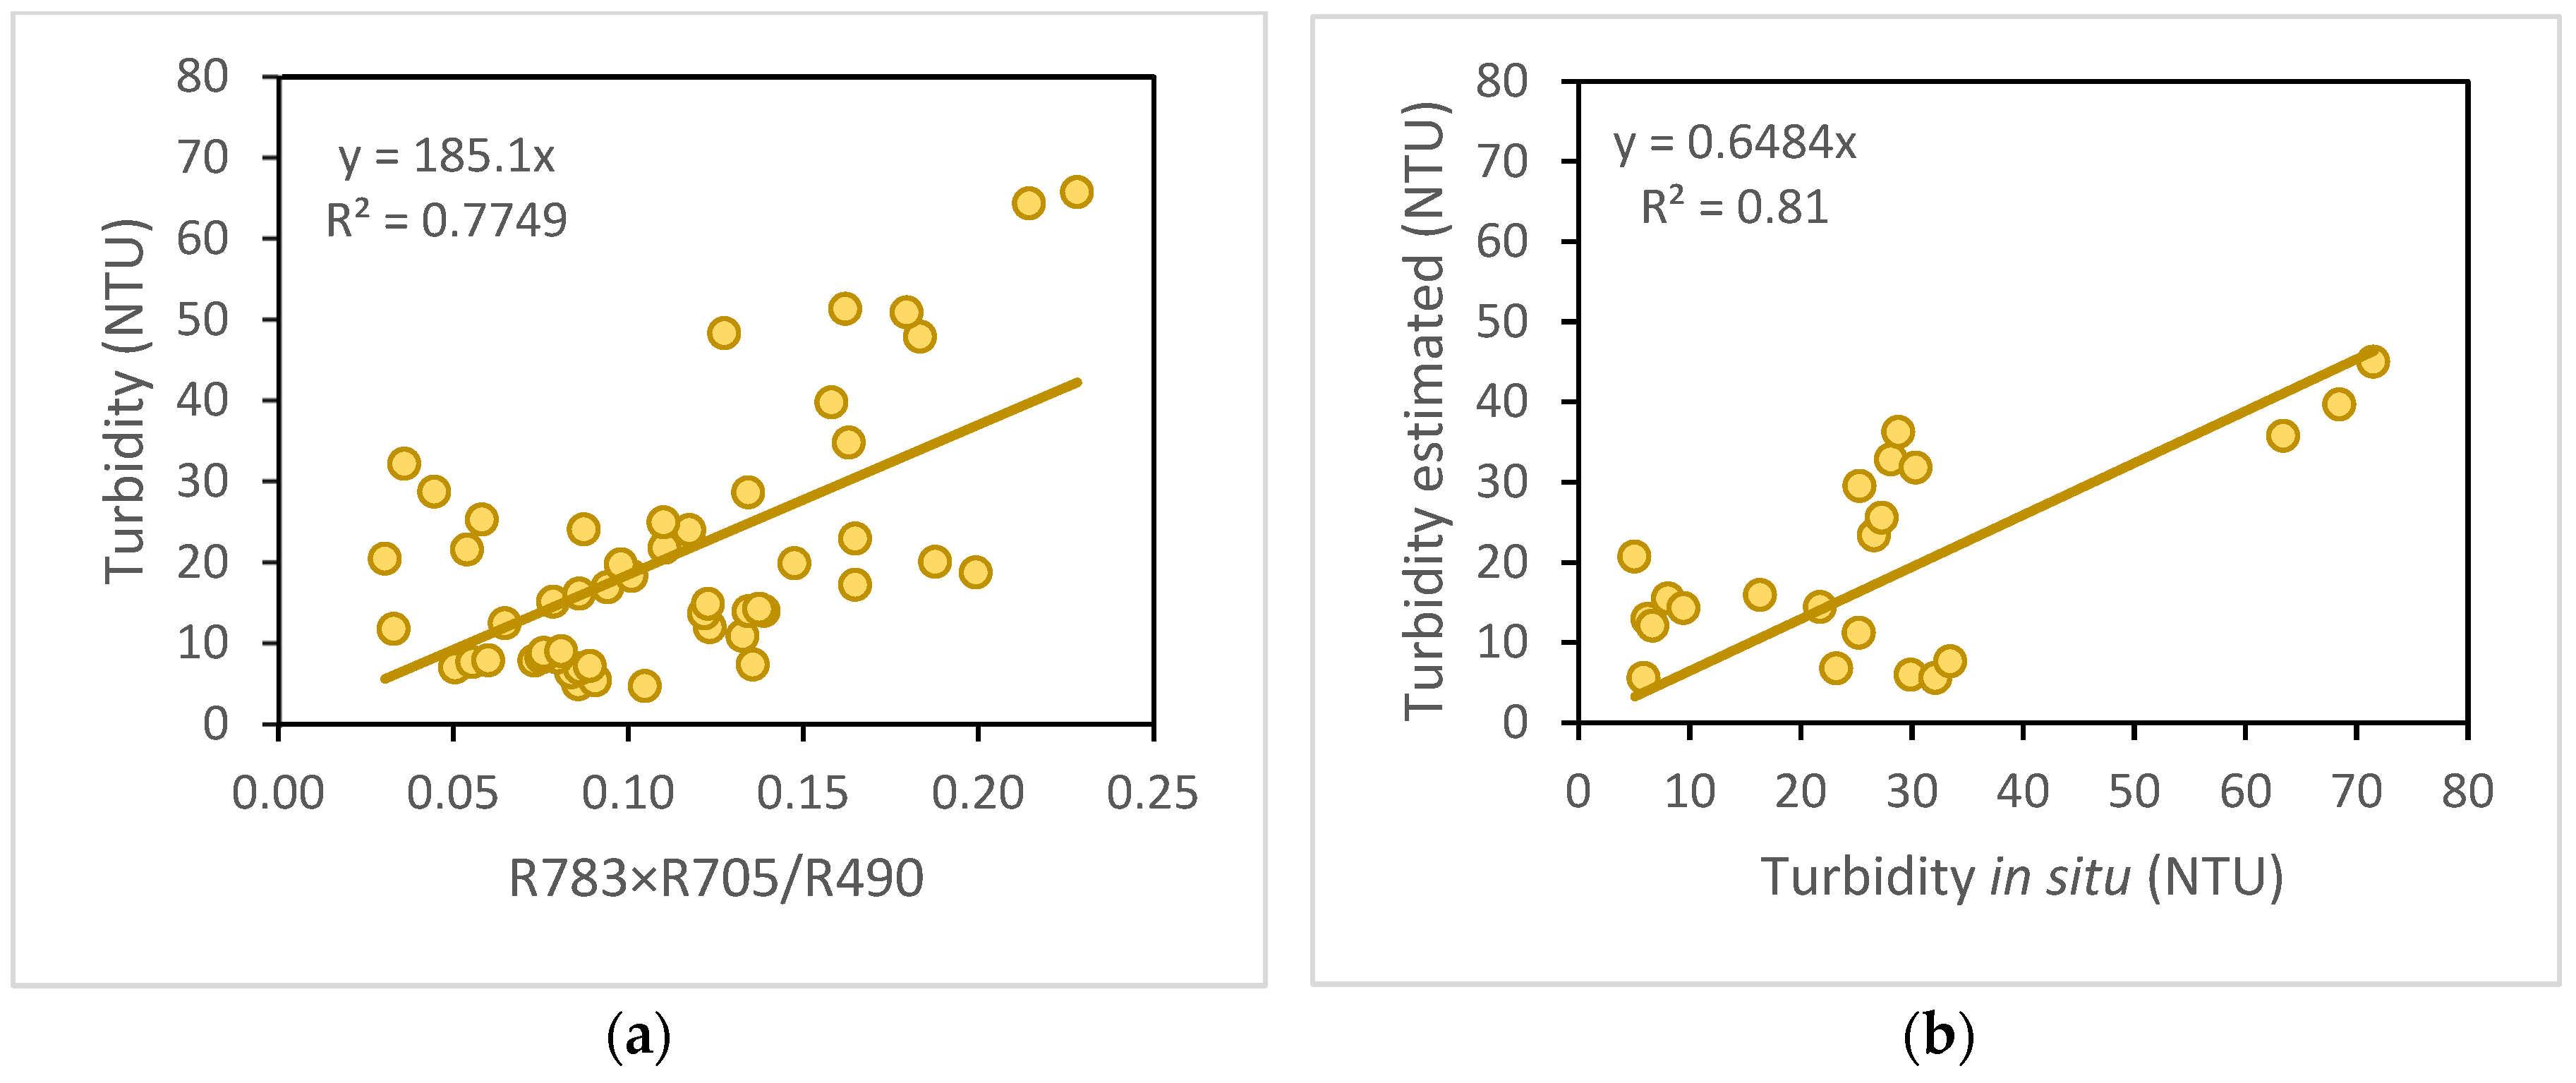
Figure 3.
(a) Calibration of the R783 × R705/R490 model to estimate the concentration of suspended matter in the Albufera; (b) Validation of the algorithm obtained with the calibration of the R783 × R705 / R490 model to estimate the concentration of suspended matter in the Albufera.
Figure 3.
(a) Calibration of the R783 × R705/R490 model to estimate the concentration of suspended matter in the Albufera; (b) Validation of the algorithm obtained with the calibration of the R783 × R705 / R490 model to estimate the concentration of suspended matter in the Albufera.
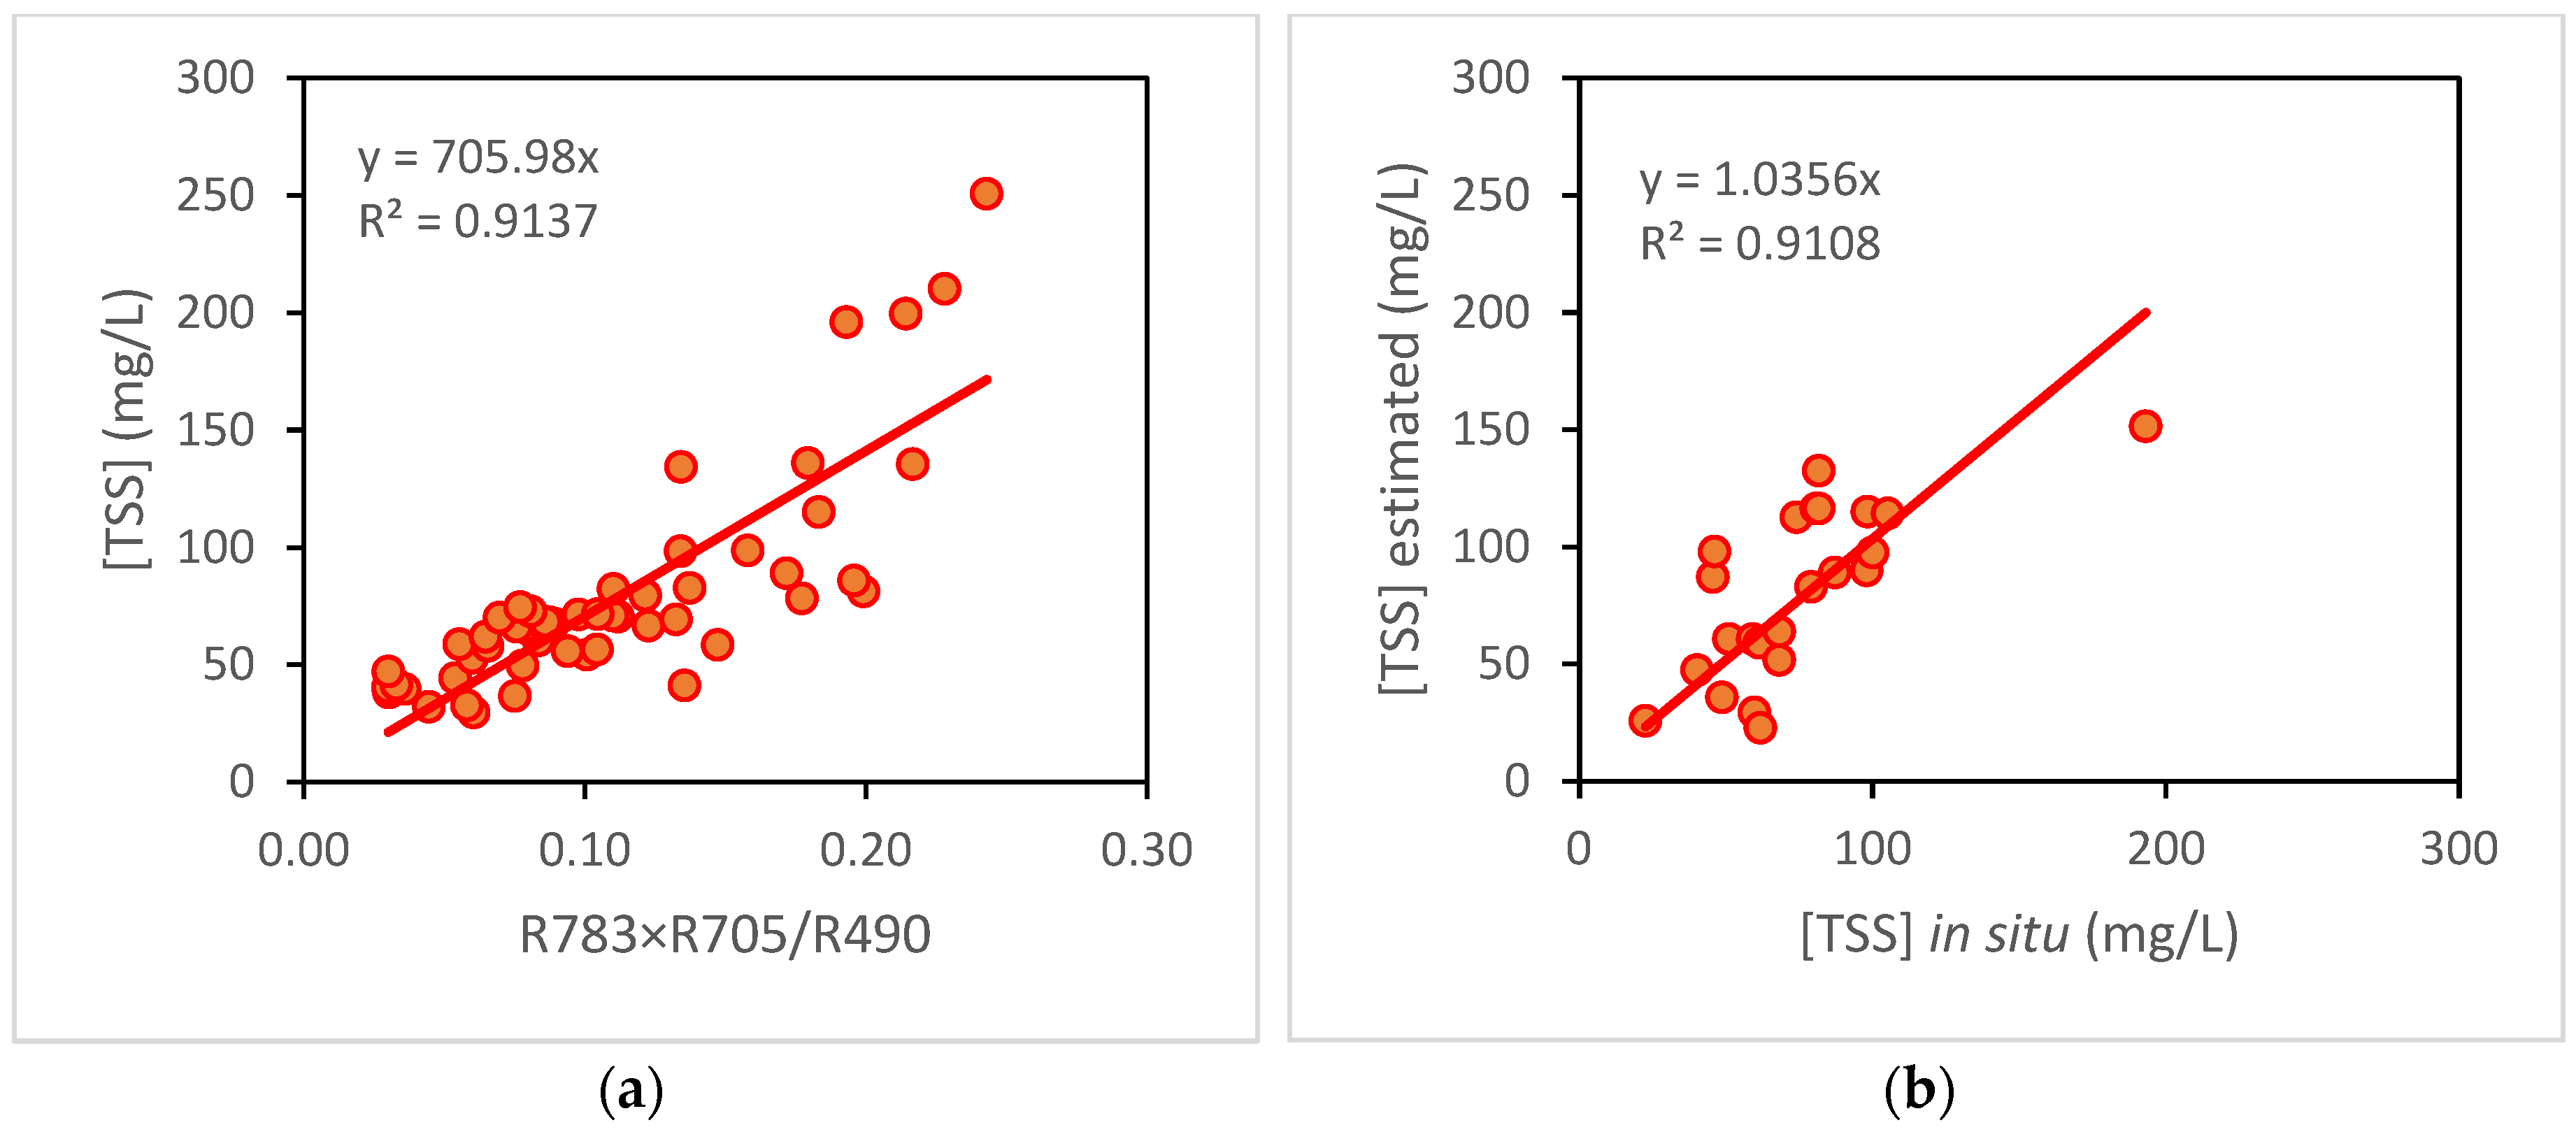
Figure 4.
(a) Calibration of the R783 / R490 model to estimate the concentration of particulate organic matter in the Albufera; (b) Validation of the algorithm obtained with the calibration of the R783 / R490 model to estimate the concentration of particulate organic matter in the Albufera.
Figure 4.
(a) Calibration of the R783 / R490 model to estimate the concentration of particulate organic matter in the Albufera; (b) Validation of the algorithm obtained with the calibration of the R783 / R490 model to estimate the concentration of particulate organic matter in the Albufera.
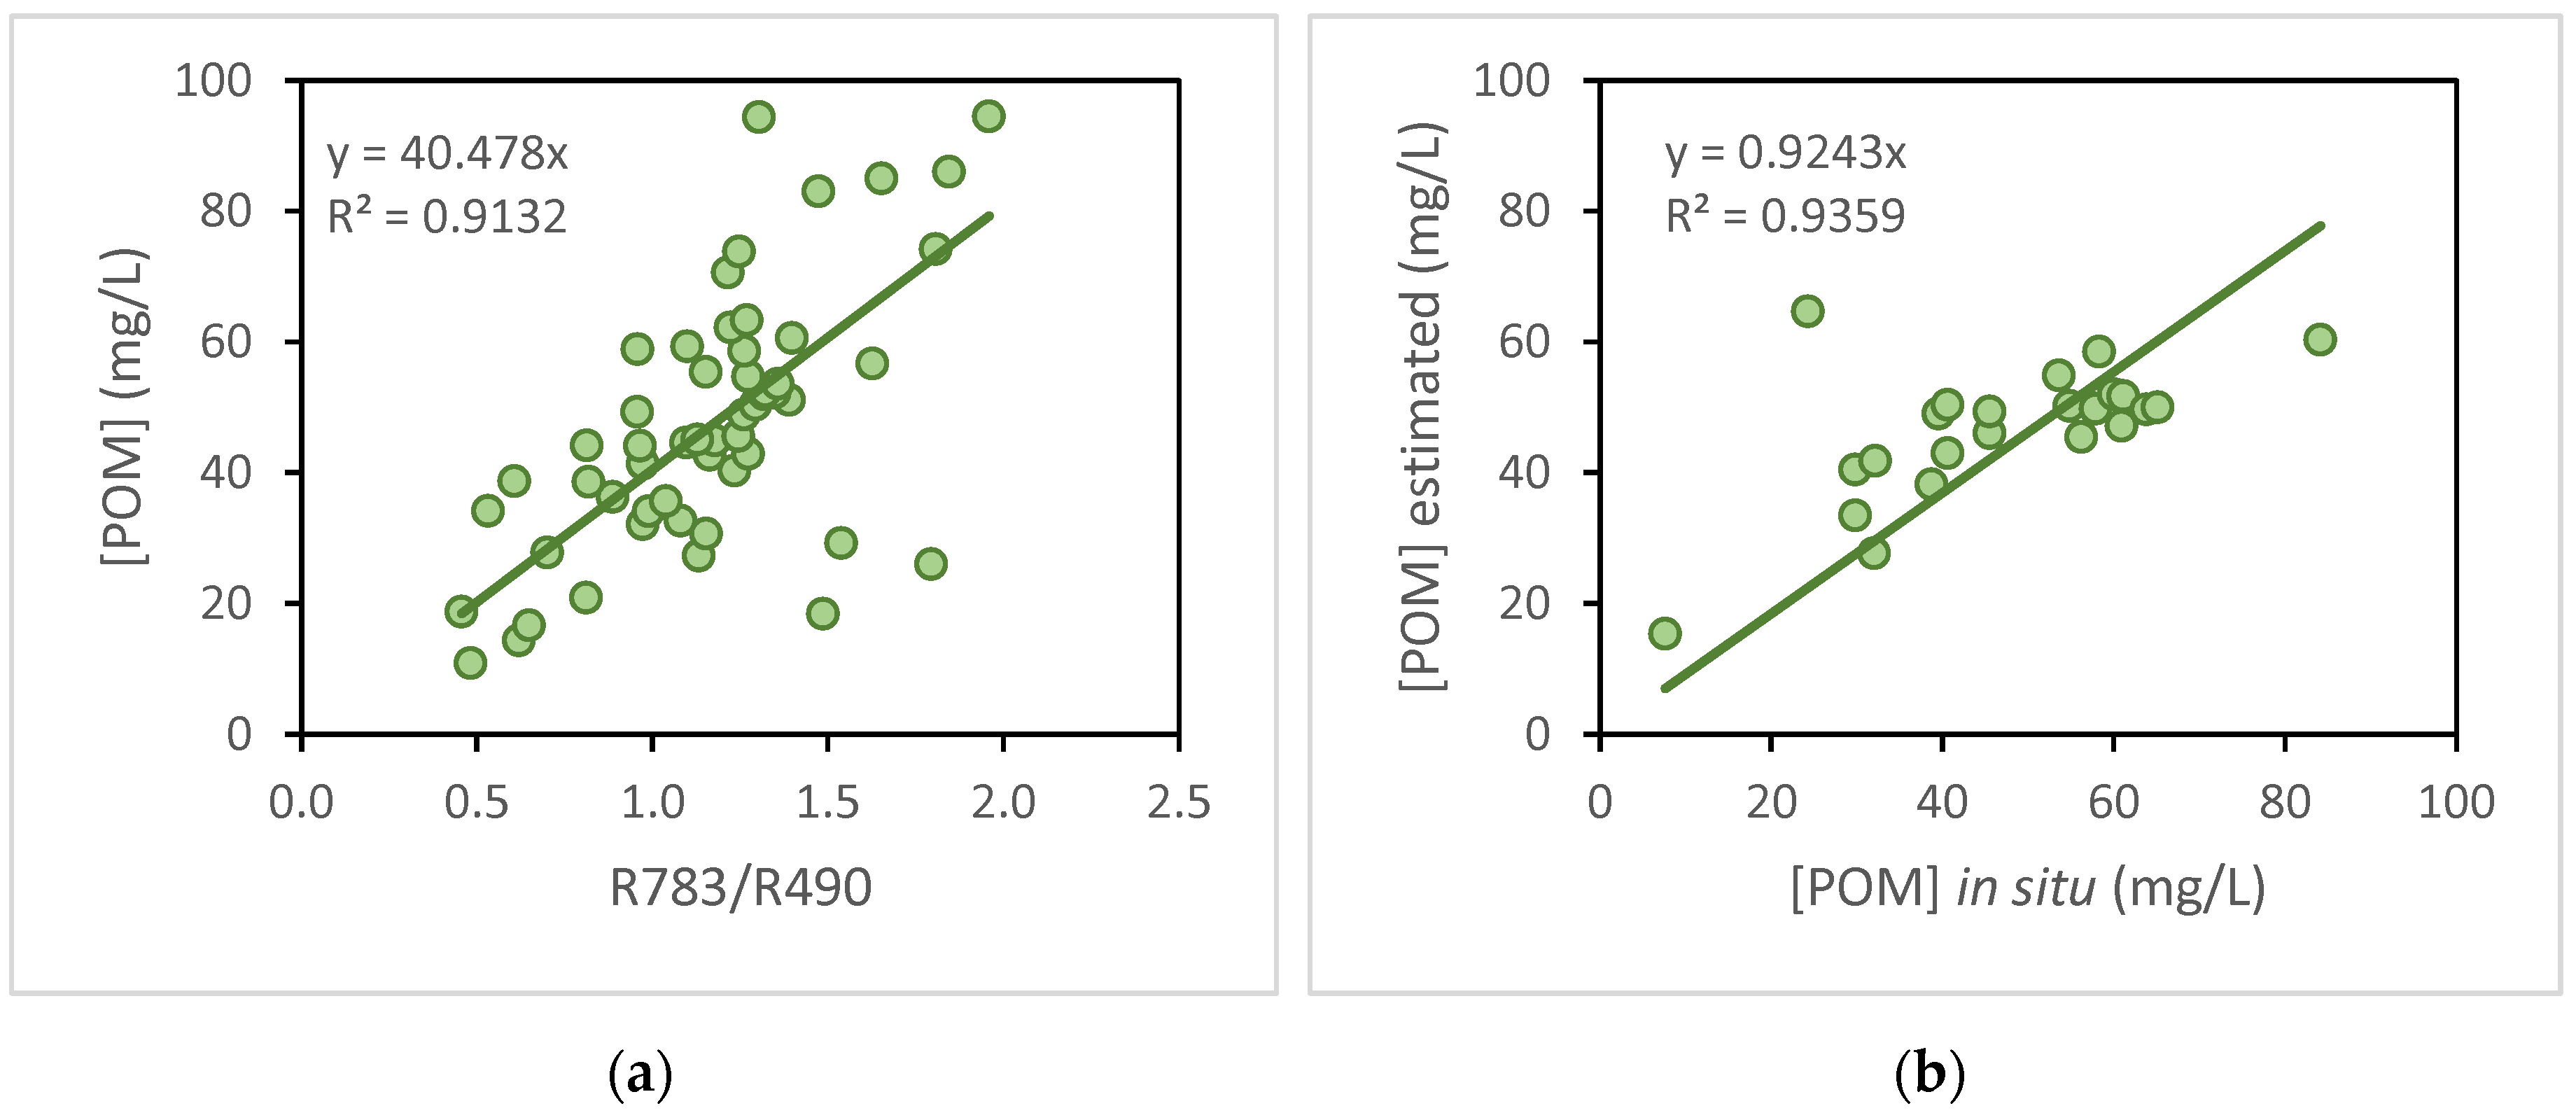
Figure 5.
(a) Calibration of the R705 model to estimate the concentration of inorganic particulate matter in the Albufera; (b) Validation of the algorithm obtained with the calibration of the R705 model to estimate the concentration of inorganic particulate matter in the Albufera.
Figure 5.
(a) Calibration of the R705 model to estimate the concentration of inorganic particulate matter in the Albufera; (b) Validation of the algorithm obtained with the calibration of the R705 model to estimate the concentration of inorganic particulate matter in the Albufera.
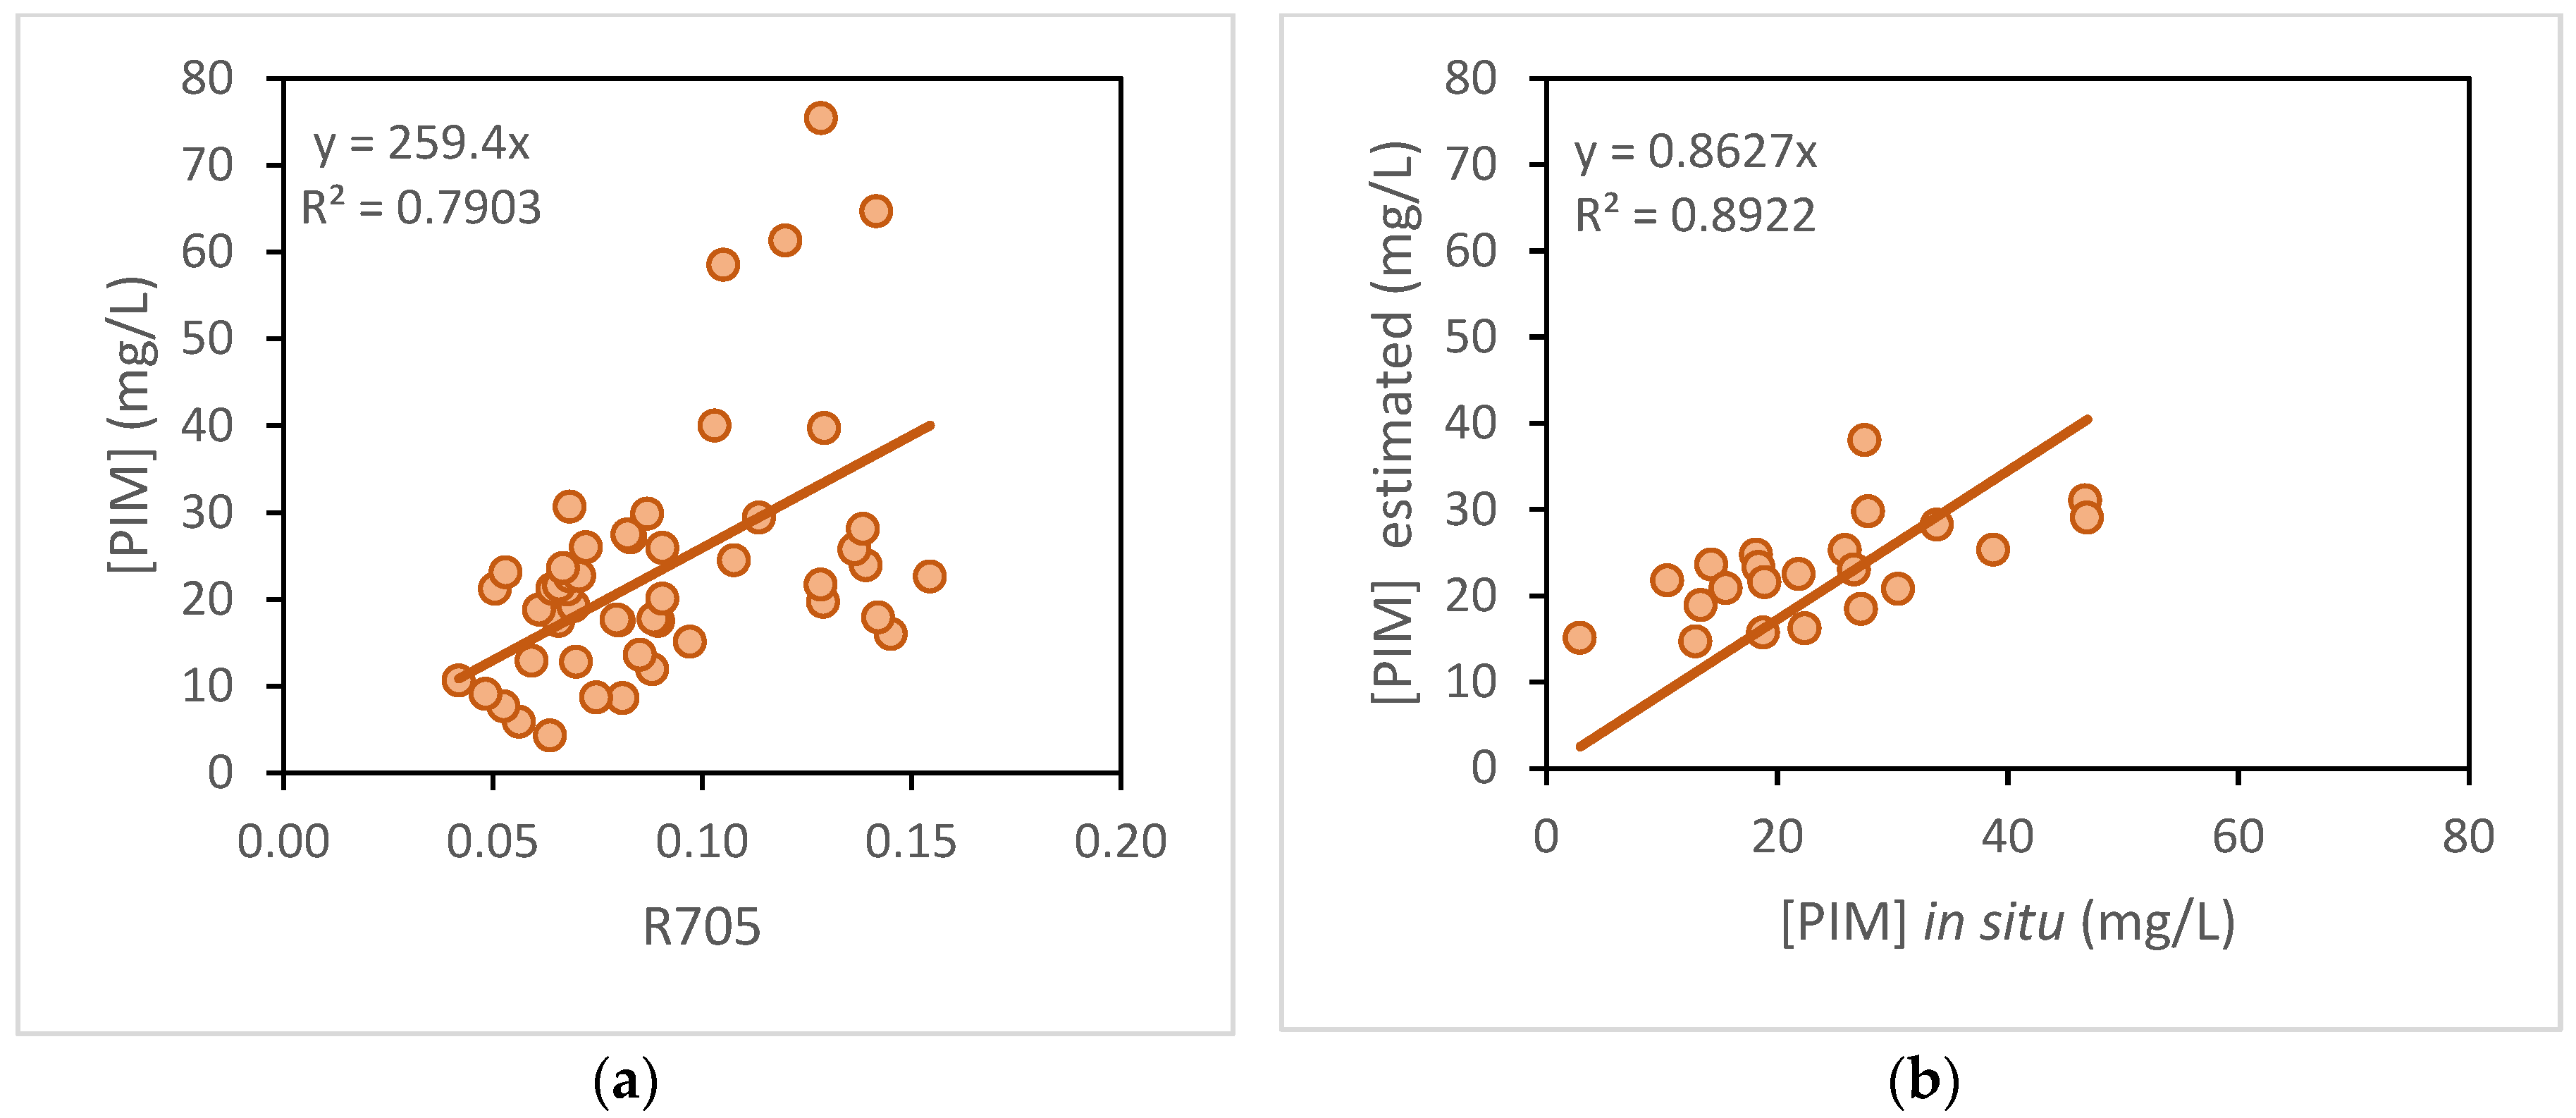

Table 1.
Sentinel-2A spectral bands. Source: adapted from ESA [11].
Table 1.
Sentinel-2A spectral bands. Source: adapted from ESA [11].
| Band | Objective | Wavelength (nm) | Spatial resolution (m) | ||
|---|---|---|---|---|---|
| Central | Wide | ||||
| B1 | Visible | Deep blue | 443 | 60 | 60 |
| B2 | Blue | 490 | 10 | 10 | |
| B3 | Green | 560 | 10 | 10 | |
| B4 | Red | 665 | 10 | 10 | |
| B5 | Red edge | 705 | 20 | 20 | |
| B6 | 740 | 20 | 20 | ||
| B7 | 783 | 20 | 20 | ||
| B8 | Near infrared (NIR) | 842 | 115 | 10 | |
| B8a | 865 | 20 | 20 | ||
| B9 | 945 | 20 | 60 | ||
| B10 | Short wavelength infrared (SWIR) | 1380 | 20 | 60 | |
| B11 | 1610 | 90 | 20 | ||
| B12 | 2190 | 180 | 20 | ||
Table 2.
Review of proposed models for estimating turbidity and suspended solids.
| Model | Reference |
|---|---|
| R705 | Kallio et al. [33] |
| R705 × R705/R490 | Zhan et al. [32] |
| R783 × R705/R490 | |
| R783/R490 | Yuan et al. [34] |
Table 3.
Descriptive statistics of the variables measured in the study.
| Variable | Average | Maximum | Minimum | Std. Dev. |
|---|---|---|---|---|
| Temperature (°C) | 23.3 | 30.3 | 11.5 | 5.8 |
| Conductivity (µS/cm) | 1870.4 | 3040.0 | 1031.0 | 574.6 |
| Turbidity (NTU) | 20.9 | 71.5 | 4.3 | 16.2 |
| Secchi disk depth (m) | 0.31 | 0.55 | 0.15 | 0.09 |
| Total suspended solids (mg/L) | 75.1 | 250.8 | 22.6 | 41.0 |
| Particulate organic matter (mg/L) | 45.4 | 94.5 | 7.6 | 19.0 |
| Particulate inorganic matter (mg/L) | 29.8 | 156.3 | 2.9 | 27.2 |
Table 4.
Results of the calibration of the algorithms for the estimation of turbidity and suspended solids in the Albufera. The models are ordered from highest to lowest R2 for each variable, showing in bold those selected with a higher coefficient of determination. In the equations, "y" corresponds to the variable and "x" to the model tested in each case.
| Variables | Model | Algorithm | R2 |
|---|---|---|---|
| Turbidity | R783 × R705/R490 | y = 185.10 x | 0.7749 |
| R705 | y = 233.13 x | 0.7622 | |
| R705 × R705/R490 | y = 100.51 x | 0.7189 | |
| R783/R490 | y = 16.95 x | 0.6690 | |
| [TSS] | R783 × R705/R490 | y = 705.98 x | 0.9137 |
| R705 × R705/R490 | y = 384.16 x | 0.8964 | |
| R783/R490 | y = 69.70 x | 0.8554 | |
| R705 | y = 872.37 x | 0.8428 | |
| [POM] | R783/R490 | y = 40.48 x | 0.9132 |
| R783 × R705/R490 | y = 395.80 x | 0.9116 | |
| R705 × R705/R490 | y = 219.29 x | 0.9078 | |
| R705 | y = 509.69 x | 0.9035 | |
| [PIM] | R705 | y = 259.40 x | 0.7903 |
| R783 × R705/R490 | y = 214.42 x | 0.7891 | |
| R705 × R705/R490 | y = 113.80 x | 0.7665 | |
| R783/R490 | y = 20.66 x | 0.7422 |
Disclaimer/Publisher’s Note: The statements, opinions and data contained in all publications are solely those of the individual author(s) and contributor(s) and not of MDPI and/or the editor(s). MDPI and/or the editor(s) disclaim responsibility for any injury to people or property resulting from any ideas, methods, instructions or products referred to in the content. |
© 2023 by the authors. Licensee MDPI, Basel, Switzerland. This article is an open access article distributed under the terms and conditions of the Creative Commons Attribution (CC BY) license (http://creativecommons.org/licenses/by/4.0/).
Copyright: This open access article is published under a Creative Commons CC BY 4.0 license, which permit the free download, distribution, and reuse, provided that the author and preprint are cited in any reuse.


